lower stillaguamish pic phase 2 quality assurance project plan
TRANSCRIPT
Lower Stillaguamish Pollution Identification and Correction Phase 2
Quality Assurance Project Plan
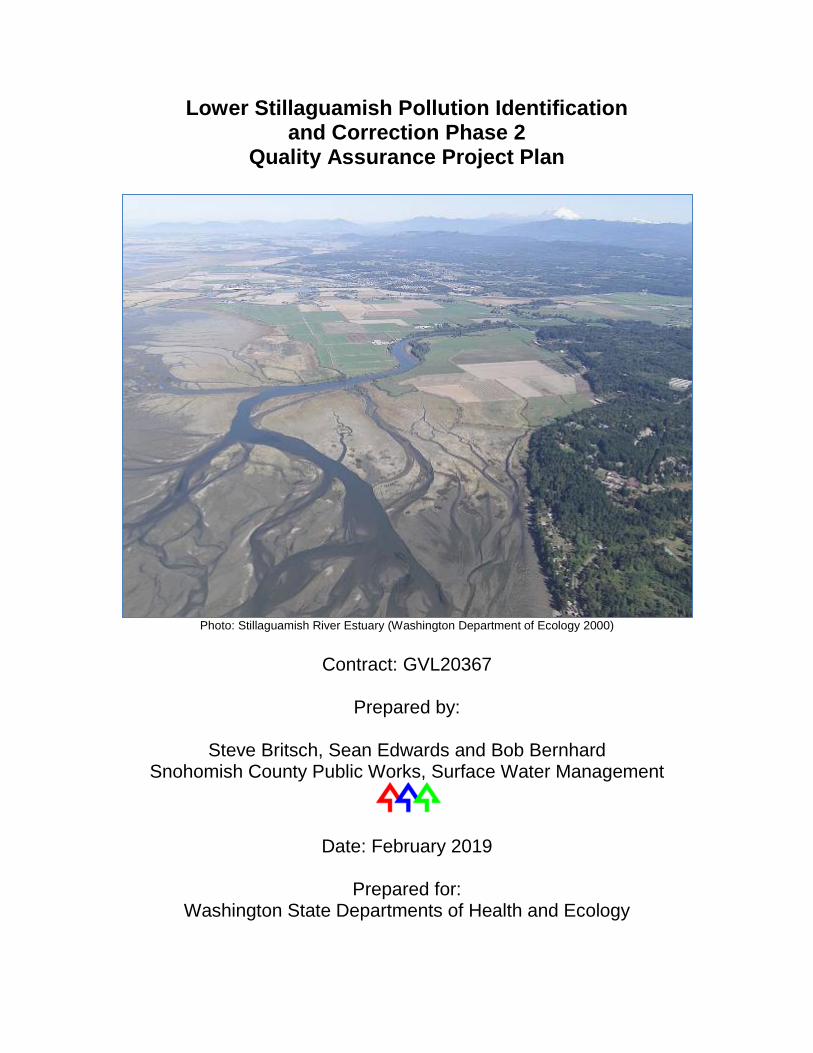
Photo: Stillaguamish River Estuary (Washington Department of Ecology 2000)
Contract: GVL20367
Prepared by:
Steve Britsch, Sean Edwards and Bob Bernhard
Snohomish County Public Works, Surface Water Management
Date: February 2019
Prepared for: Washington State Departments of Health and Ecology

Page left blank for printing
Snohomish County – Lower Stillaguamish Pollution Identification and Correction Phase 2 QAPP Page 1 of 65
Publication Information The monitoring activities described in this Quality Assurance Project Plan (QAPP) are funded by a grant from the United States Environmental Protection Agency (EPA) through its National Estuary Program. The grant contract is being administered by the Washington State Department of Health (DOH). The contents of this document do not necessarily reflect the views and policies of the EPA, DOH or the Washington State Department of Ecology (WDOE), nor does mention of trade names or commercial products constitute endorsement or recommendation for use. This project has been funded wholly or in part by the United States Environmental Protection Agency under assistance agreement PC-01J18001 to Washington State Department of Health. The contents of this document do not necessarily reflect the views and policies of the Environmental Protection Agency, nor does mention of trade names or commercial products constitute endorsement or recommendation for use. The plan describes the objectives of the monitoring activities and the procedures to be followed to achieve those objectives. After completing the monitoring, Snohomish County Surface Water Management (SWM) will submit a final report to the Washington State Department of Health. Data for this project will be uploaded to WDOE’s Environmental Information Management (EIM) database at www.ecy.wa.gov/eim/index.htm. Search on Study ID GVL23067. Author and Contact Information Steve Britsch, Sean Edwards, and Bob Bernhard Snohomish County Public Works, Surface Water Management 3000 Rockefeller Ave, M/S 607 Everett, WA 98201 Snohomish County Surface Water Management http://snohomishcountywa.gov/208/Surface-Water Accommodation Requests (Title VI/ADA): Interpreter and translation services for non-English speakers and accommodations for persons with disabilities are available upon request. Please make arrangements in advance by calling 425-388-3464. For questions regarding Public Works’ Title VI Program, contact out Title VI Coordinator via email at [email protected], or phone 425-388-6660. Hearing/speech impaired call 711.
Snohomish County – Lower Stillaguamish Pollution Identification and Correction Phase 2 QAPP Page 3 of 65
1.0 Table of Contents 2.0 Abstract ......................................................................................................6
3.0 Background ................................................................................................6 3.1 Introduction and problem statement ................................................6 3.2 Study area and surroundings ...........................................................7
3.2.1 History of study area ............................................................9 3.2.2 Summary of previous studies and existing data ................ 12 3.2.3 Parameters of interest and potential sources ..................... 16 3.2.4 Regulatory criteria or standards ......................................... 17
4.0 Project Description ................................................................................... 18 4.1 Project goals .................................................................................. 18 4.2 Project objectives ........................................................................... 21 4.3 Information needed and sources ................................................... 21 4.4 Tasks required ............................................................................... 23 4.5 Systematic planning process used ................................................ 23
5.0 Organization and Schedule ...................................................................... 24 5.1 Key individuals and their responsibilities........................................ 24 5.2 Special training and certifications .................................................. 24 5.3 Organization chart ......................................................................... 24 5.4 Proposed project schedule ............................................................ 24 5.5 Budget and funding ........................................................................ 26
6.0 Quality Objectives ..................................................................................... 27 6.1 Data quality objectives ................................................................... 27 6.2 Measurement quality objectives ..................................................... 27
6.2.1 Targets for precision, bias, and sensitivity .......................... 28 6.2.2 Targets for comparability, representativeness, and completeness ................................................................................. 30
6.3 Acceptance criteria for quality of existing data ............................... 31 6.4 Model quality objectives ................................................................. 32
7.0 Study Design ............................................................................................ 33 7.1 Study boundaries ........................................................................... 33 7.2 Field data collection ....................................................................... 33
7.2.1 Sampling locations and frequency ...................................... 33 7.2.2 Field parameters and laboratory analytes to be measured . 34
7.3 Modeling and analysis design ........................................................ 34 7.4 Assumptions in relation to objectives and study area .................... 34 7.5 Possible challenges and contingencies ......................................... 34
7.5.1 Logistical problems ............................................................. 34 7.5.2 Practical constraints ........................................................... 35 7.5.3 Schedule limitations ............................................................ 35
8.0 Field Procedures ...................................................................................... 36 8.1 Invasive species evaluation ........................................................... 36 8.2 Measurement and sampling procedures ........................................ 36 8.3 Containers, preservation methods, holding times .......................... 36
Snohomish County – Lower Stillaguamish Pollution Identification and Correction Phase 2 QAPP Page 4 of 65
8.4 Equipment decontamination .......................................................... 37 8.5 Sample ID ...................................................................................... 37 8.6 Chain-of-custody ............................................................................ 38 8.7 Field log requirements ................................................................... 38 8.8 Other activities ............................................................................... 38
9.0 Laboratory Procedures ............................................................................. 40 9.1 Lab procedures table ..................................................................... 40 9.2 Sample preparation method(s) ...................................................... 40 9.3 Special method requirements ........................................................ 40 9.4 Laboratories accredited for methods ............................................. 40
10.0 Quality Control Procedures...................................................................... 41 10.1 Table of field and laboratory quality control ................................... 42 10.2 Corrective action processes ........................................................... 42
11.0 Data Management Procedures ................................................................. 43 11.1 Data recording and reporting requirements ................................... 43 11.2 Laboratory data package requirements ......................................... 43 11.3 Electronic transfer requirements .................................................... 43 11.4 EIM/STORET data upload procedures .......................................... 43 11.5 Model information management .................................................... 44
12.0 Audits and Reports ................................................................................... 44 12.1 Field, laboratory, and other audits ................................................. 44 12.2 Responsible personnel .................................................................. 44 12.3 Frequency and distribution of reports............................................. 44 12.4 Responsibility for reports ............................................................... 44
13.0 Data Verification ....................................................................................... 45 13.1 Field data verification, requirements, and responsibilities .............. 45 13.2 Laboratory data verification ............................................................ 45 13.3 Validation requirements, if necessary ............................................ 45 13.4 Model quality assessment .............................................................. 45
14.0 Data Quality (Usability) Assessment ........................................................ 46 14.1 Process for determining project objectives were met ..................... 46 14.2 Treatment of non-detects ............................................................... 46 14.3 Data analysis and presentation methods ....................................... 46 14.4 Sampling design evaluation ........................................................... 46 14.5 Documentation of assessment ....................................................... 47
15.0 References ............................................................................................... 47
16.0 Appendices ............................................................................................... 50 Appendix A. Data Qualifiers...................................................................... 50 Appendix B. Washington State Department of Ecology Standard Operating Procedure EAP030, Version 2.1 .............................................. 54 Appendix C. Chain of Custody.................................................................. 55 Appendix D. Field Data Form ................................................................... 56 Appendix E. AmTest Accreditation ........................................................... 57 Appendix F. Glossary, Acronyms and Abbreviations ................................ 58
Snohomish County – Lower Stillaguamish Pollution Identification and Correction Phase 2 QAPP Page 5 of 65
List of Figures and Tables Figures Figure 1. Lower Stillaguamish Pollution Identification and Correction (PIC)
Phase 2 Project Area ..............................................................................8
Figure 2. Stillaguamish River Clean Water District (1993 – 2017 ) ..................... 10
Figure 3. Microbial water quality assessment ranking in the Stillaguamish River basin (2005 - 2015) ...................................................................... 15
Figure 4. East Fork Glade Bekken target sub-basin ............................................ 19
Figure 5. Greenwood Creek target sub-basin ..................................................... 20
Figure 6. Fecal coliform field duplicate evaluation (Mathieu 2006) ...................... 29 Tables Table 1. Fecal coliform freshwater quality standards for the Lower
Stillaguamish basin ............................................................................... 17
Table 2. Monitoring information needed and sources.......................................... 22
Table 3. Organization of project staff and responsibilities ................................... 24
Table 4. Proposed schedule for completing field and laboratory work, data entry into EIM, and reports .................................................................... 25
Table 5. Lab and field measurement budget ....................................................... 26
Table 6. Fecal coliform and E.coli field duplicate MQO's and qualifiers .............. 28
Table 7. Programmatic fecal coliform and E.coli field duplicate MQO's and decisions ............................................................................................... 28
Table 8. Storm event sample sites ...................................................................... 33
Table 9. Laboratory measurement methods ........................................................ 40
Table 10. Quality control samples, types, and frequency for storm event monitoring ............................................................................................. 42
Table 11. Schedule for project management and reporting ................................. 44
Snohomish County – Lower Stillaguamish Pollution Identification and Correction Phase 2 QAPP Page 6 of 65
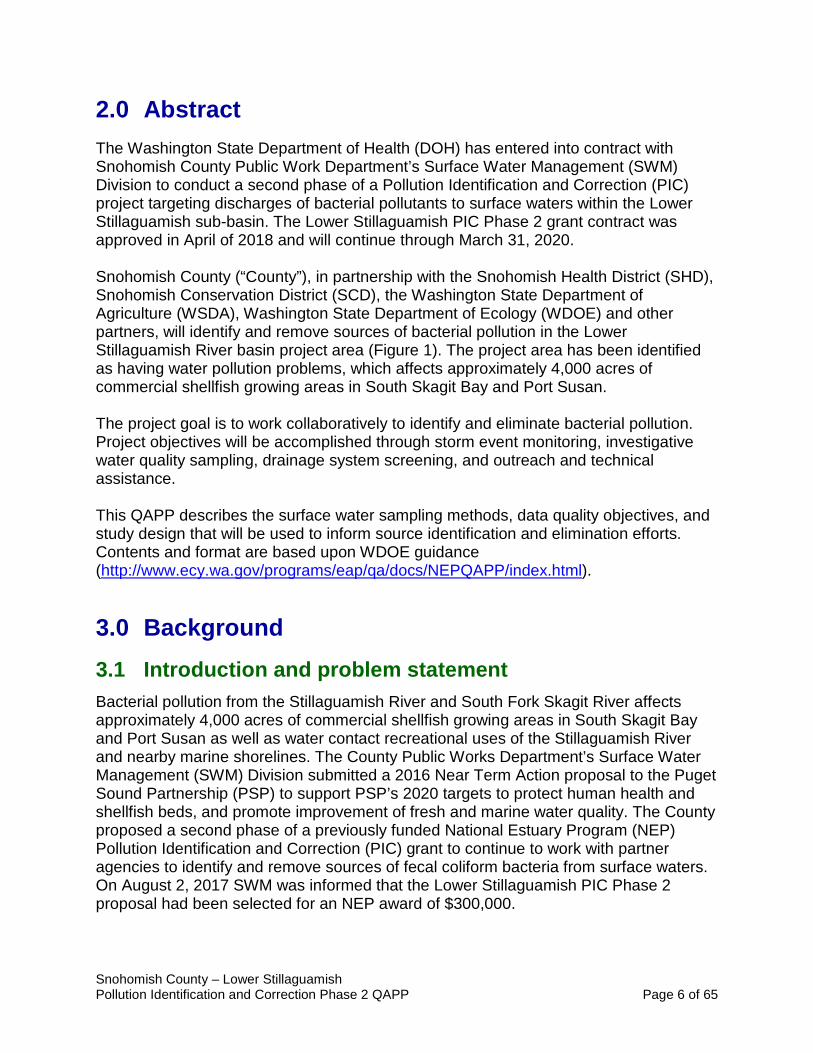
2.0 Abstract The Washington State Department of Health (DOH) has entered into contract with Snohomish County Public Work Department’s Surface Water Management (SWM) Division to conduct a second phase of a Pollution Identification and Correction (PIC) project targeting discharges of bacterial pollutants to surface waters within the Lower Stillaguamish sub-basin. The Lower Stillaguamish PIC Phase 2 grant contract was approved in April of 2018 and will continue through March 31, 2020. Snohomish County (“County”), in partnership with the Snohomish Health District (SHD), Snohomish Conservation District (SCD), the Washington State Department of Agriculture (WSDA), Washington State Department of Ecology (WDOE) and other partners, will identify and remove sources of bacterial pollution in the Lower Stillaguamish River basin project area (Figure 1). The project area has been identified as having water pollution problems, which affects approximately 4,000 acres of commercial shellfish growing areas in South Skagit Bay and Port Susan. The project goal is to work collaboratively to identify and eliminate bacterial pollution. Project objectives will be accomplished through storm event monitoring, investigative water quality sampling, drainage system screening, and outreach and technical assistance. This QAPP describes the surface water sampling methods, data quality objectives, and study design that will be used to inform source identification and elimination efforts. Contents and format are based upon WDOE guidance (http://www.ecy.wa.gov/programs/eap/qa/docs/NEPQAPP/index.html).
3.0 Background 3.1 Introduction and problem statement Bacterial pollution from the Stillaguamish River and South Fork Skagit River affects approximately 4,000 acres of commercial shellfish growing areas in South Skagit Bay and Port Susan as well as water contact recreational uses of the Stillaguamish River and nearby marine shorelines. The County Public Works Department’s Surface Water Management (SWM) Division submitted a 2016 Near Term Action proposal to the Puget Sound Partnership (PSP) to support PSP’s 2020 targets to protect human health and shellfish beds, and promote improvement of fresh and marine water quality. The County proposed a second phase of a previously funded National Estuary Program (NEP) Pollution Identification and Correction (PIC) grant to continue to work with partner agencies to identify and remove sources of fecal coliform bacteria from surface waters. On August 2, 2017 SWM was informed that the Lower Stillaguamish PIC Phase 2 proposal had been selected for an NEP award of $300,000.

Snohomish County – Lower Stillaguamish Pollution Identification and Correction Phase 2 QAPP Page 7 of 65
3.2 Study area and surroundings The Stillaguamish River is the fifth largest watershed in the Puget Sound region and influences marine water quality in both Port Susan and South Skagit Bay. Approximately 80% of the Stillaguamish River flows through Hatt Slough and discharges to Port Susan (Figure 1). The remaining 20% of the flows through the Old Stillaguamish Channel and discharges primarily to Port Susan through South Pass and secondarily to South Skagit Bay through West Pass. The PIC Phase 2 project area covers the Lower Stillaguamish River sub-basin west of Interstate Highway 5 including the Skagit Flats area north of Stanwood and Warm Beach south of Stanwood. The total project area is 49 square miles which equates to approximately two-thirds of the Stillaguamish River main stem floodplain and includes adjacent uplands drained by various small tributary streams, including Douglas Creek, Sunday Lake Creek (a.k.a., Jackson Gulch), and Glade Bekken (a.k.a., Tributary 30). The floodplain portion of the project area also includes the Old Stillaguamish Channel and its tributary streams and drainage ditches. There are 6,805 parcels within the project area. Commercial agriculture is the primary land use within the floodplain portion of the project area, including nine dairies and several crop farming and grass-fed beef operations. The urbanized western portion of Stanwood, including the historic downtown, is also within the project area. The adjacent upland areas that drain to the floodplain primarily include rural residential land uses as well as some small farms and equestrian facilities. Land cover throughout the floodplain portion of the project area is limited to grass or other seasonal crops with very limited riparian vegetation along the Stillaguamish River main stem. Land cover in the adjacent uplands includes a patchwork of second growth forest and open fields. Local jurisdictions within the project area include the Stillaguamish River Flood Control District (SFCD), Drainage District #12 (DD12), Drainage and Diking District #7 (DD7), and about half of the City of Stanwood. The SFCD portion of the project area is 10 square miles, which includes 502 parcels. The City of Stanwood portion is 1.7 square miles including 1,720 parcels. The rural community of Silvana is also in the project area. Snohomish County has water pollution regulatory jurisdiction for most of the project area, except for the incorporated area within Stanwood. Snohomish County also administers a county-wide Surface Water Management Utility District that covers unincorporated areas of the county. There are two wastewater treatment plants (WWTPs) within the project area that are operated respectively by the City of Stanwood and the Warm Beach Christian Camp and Conference Center. The locations of these two WWTPs are shown in Figure 1. Both WWTPs are regulated by WDOE under National Pollutant Discharge and Elimination System (NPDES) wastewater discharge permits.

Snohomish County – Lower Stillaguamish Pollution Identification and Correction Phase 2 QAPP Page 8 of 65
Figure 1. Lower Stillaguamish Pollution Identification and Correction (PIC) Phase 2 Project Area
Snohomish County – Lower Stillaguamish Pollution Identification and Correction Phase 2 QAPP Page 9 of 65
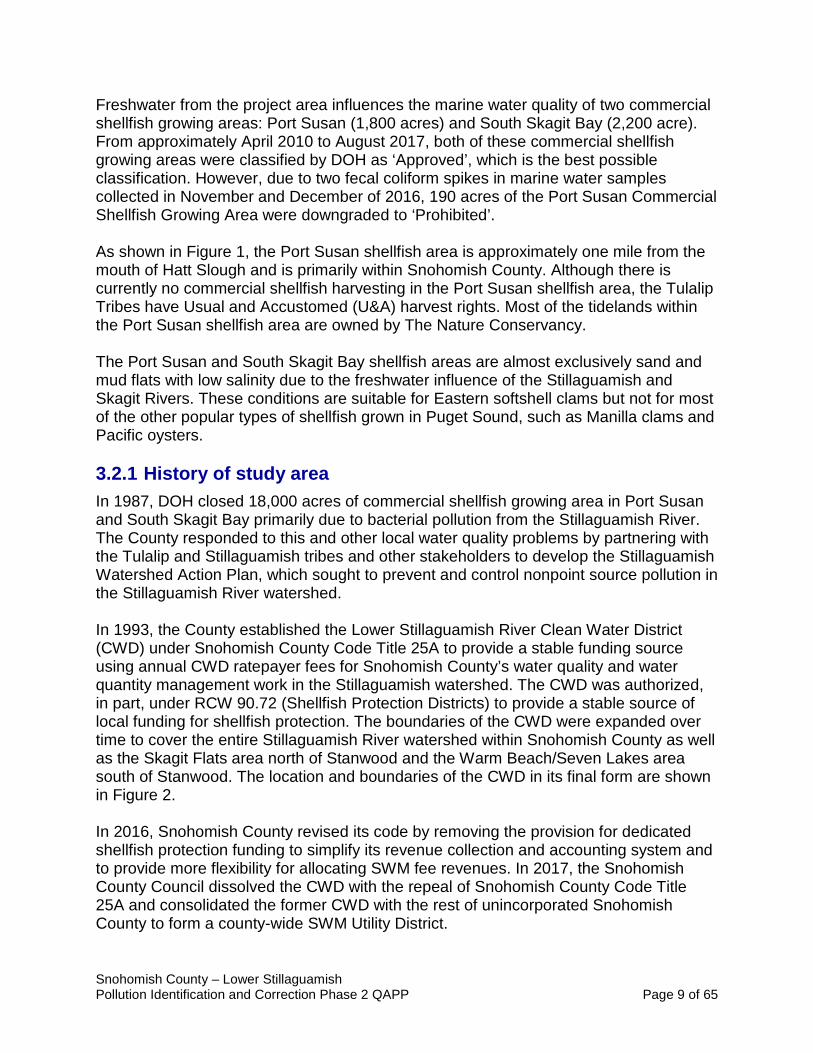
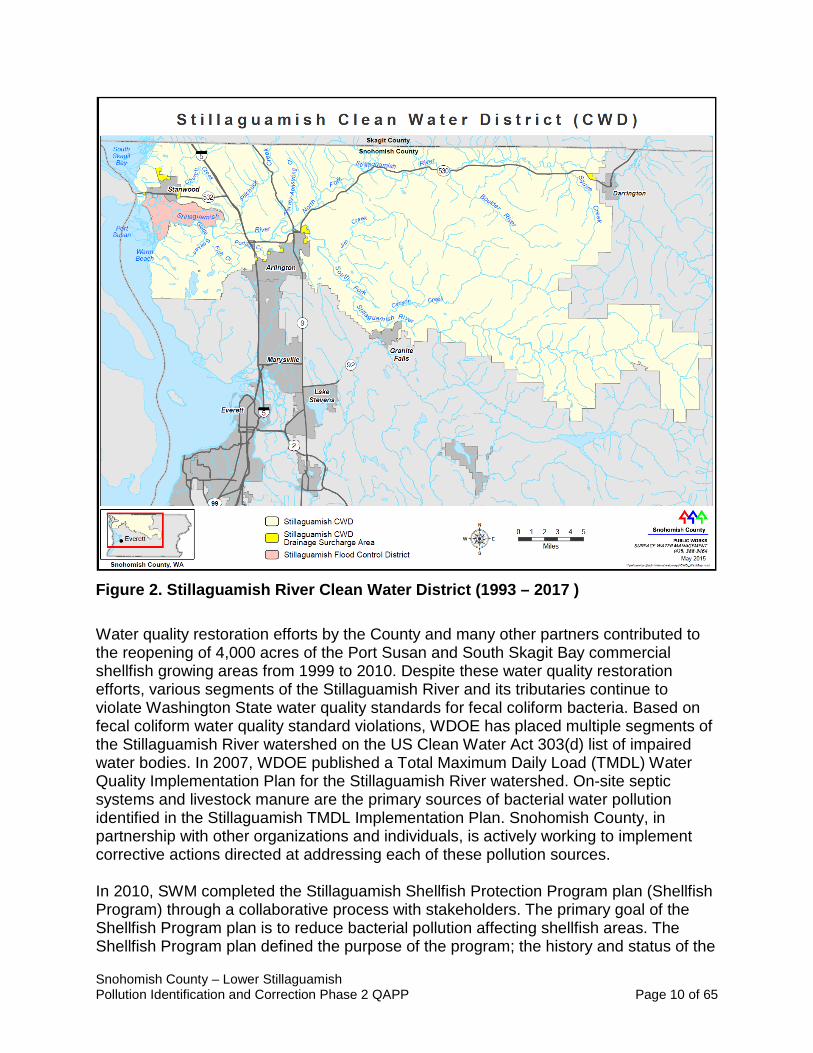
Freshwater from the project area influences the marine water quality of two commercial shellfish growing areas: Port Susan (1,800 acres) and South Skagit Bay (2,200 acre). From approximately April 2010 to August 2017, both of these commercial shellfish growing areas were classified by DOH as ‘Approved’, which is the best possible classification. However, due to two fecal coliform spikes in marine water samples collected in November and December of 2016, 190 acres of the Port Susan Commercial Shellfish Growing Area were downgraded to ‘Prohibited’. As shown in Figure 1, the Port Susan shellfish area is approximately one mile from the mouth of Hatt Slough and is primarily within Snohomish County. Although there is currently no commercial shellfish harvesting in the Port Susan shellfish area, the Tulalip Tribes have Usual and Accustomed (U&A) harvest rights. Most of the tidelands within the Port Susan shellfish area are owned by The Nature Conservancy. The Port Susan and South Skagit Bay shellfish areas are almost exclusively sand and mud flats with low salinity due to the freshwater influence of the Stillaguamish and Skagit Rivers. These conditions are suitable for Eastern softshell clams but not for most of the other popular types of shellfish grown in Puget Sound, such as Manilla clams and Pacific oysters. 3.2.1 History of study area In 1987, DOH closed 18,000 acres of commercial shellfish growing area in Port Susan and South Skagit Bay primarily due to bacterial pollution from the Stillaguamish River. The County responded to this and other local water quality problems by partnering with the Tulalip and Stillaguamish tribes and other stakeholders to develop the Stillaguamish Watershed Action Plan, which sought to prevent and control nonpoint source pollution in the Stillaguamish River watershed. In 1993, the County established the Lower Stillaguamish River Clean Water District (CWD) under Snohomish County Code Title 25A to provide a stable funding source using annual CWD ratepayer fees for Snohomish County’s water quality and water quantity management work in the Stillaguamish watershed. The CWD was authorized, in part, under RCW 90.72 (Shellfish Protection Districts) to provide a stable source of local funding for shellfish protection. The boundaries of the CWD were expanded over time to cover the entire Stillaguamish River watershed within Snohomish County as well as the Skagit Flats area north of Stanwood and the Warm Beach/Seven Lakes area south of Stanwood. The location and boundaries of the CWD in its final form are shown in Figure 2. In 2016, Snohomish County revised its code by removing the provision for dedicated shellfish protection funding to simplify its revenue collection and accounting system and to provide more flexibility for allocating SWM fee revenues. In 2017, the Snohomish County Council dissolved the CWD with the repeal of Snohomish County Code Title 25A and consolidated the former CWD with the rest of unincorporated Snohomish County to form a county-wide SWM Utility District.
Snohomish County – Lower Stillaguamish Pollution Identification and Correction Phase 2 QAPP Page 10 of 65
Figure 2. Stillaguamish River Clean Water District (1993 – 2017 ) Water quality restoration efforts by the County and many other partners contributed to the reopening of 4,000 acres of the Port Susan and South Skagit Bay commercial shellfish growing areas from 1999 to 2010. Despite these water quality restoration efforts, various segments of the Stillaguamish River and its tributaries continue to violate Washington State water quality standards for fecal coliform bacteria. Based on fecal coliform water quality standard violations, WDOE has placed multiple segments of the Stillaguamish River watershed on the US Clean Water Act 303(d) list of impaired water bodies. In 2007, WDOE published a Total Maximum Daily Load (TMDL) Water Quality Implementation Plan for the Stillaguamish River watershed. On-site septic systems and livestock manure are the primary sources of bacterial water pollution identified in the Stillaguamish TMDL Implementation Plan. Snohomish County, in partnership with other organizations and individuals, is actively working to implement corrective actions directed at addressing each of these pollution sources. In 2010, SWM completed the Stillaguamish Shellfish Protection Program plan (Shellfish Program) through a collaborative process with stakeholders. The primary goal of the Shellfish Program plan is to reduce bacterial pollution affecting shellfish areas. The Shellfish Program plan defined the purpose of the program; the history and status of the
Snohomish County – Lower Stillaguamish Pollution Identification and Correction Phase 2 QAPP Page 11 of 65
South Skagit Bay and Port Susan commercial shellfish growing areas; the water quality problems affecting classification of these two shellfish areas; and the shellfish protection goals, objectives, and actions of Snohomish County and its partners to reduce fecal coliform pollution. In support of both the County’s Phase 1 NPDES municipal stormwater permit requirements and fecal coliform TMDL plans (including the Stillaguamish River TMDL), the County developed the Microbial Water Quality Assessment (MWQA) program in 2010. The MWQA QAPP describes the County’s water quality sampling, data analysis, prioritization, and follow-up actions used to identify and correct sources of fecal coliform contamination (Britsch 2015). The QAPP was reviewed and supported by WDOE in 2010 and updated in 2015. In 2011, as a first step in MWQA program implementation and to address the primary goal of the Shellfish Program, the County, partner organizations, and local residents assessed fecal coliform bacteria data collected in the Stillaguamish River watershed and assigned priority rankings to sub-basins based on degree of fecal coliform contamination. The Lower Stillaguamish River, Church Creek, and Portage Creek sub-basins received the highest rankings. From these three top-ranked sub-basins, Portage Creek was selected as the first sub-basin for targeted bacterial pollution source identification and correction primarily due to its manageable size and the willingness of partner agencies to work in the area. In partnership with the City of Arlington, SHD, SCD, and WDOE, SWM began implementing bacterial pollution source identification and correction work in the Portage Creek sub-basin. On a parallel track, SWM, SFCD, and other local partners began discussing ways to conduct similar work in the Lower Stillaguamish River sub-basin, which had the worst conditions based on fecal coliform water quality data. This effort resulted in SWM applying for a PIC grant from DOH in late 2011 in partnership with the SFCD, SHD, and SCD. In January 2012, DOH notified SWM that the PIC grant application ranked 11th out of 15 and would not be funded. SWM evaluated the 2011 grant application ranking notes, and upon discussion with DOH and partner agencies, decided to reapply for a second round of PIC grant funding. In February 2013, DOH followed up with a direct award offer of approximately $500,000 for SWM to implement a PIC project with the following requirements:
• Focus PIC work on restoration/protection of shellfish growing areas/marine recovery areas/shellfish protection districts.
• Develop an approved QAPP before initiating water quality monitoring work that included in situ measurements as well as collecting water samples for analysis of fecal coliform bacteria and various nutrients.
• Exercise Snohomish County’s regulatory authority or agree to use WDOE as a regulatory backstop.
• Ensure responsible follow-up for pollution referrals to partner agencies. • Report on problems identified and corrected, including all enforcement
actions.

Snohomish County – Lower Stillaguamish Pollution Identification and Correction Phase 2 QAPP Page 12 of 65
• Include tribal involvement in PIC projects whenever possible. In November 2013, DOH and SWM finalized a $570,000 grant contract for implementation of the Lower Stillaguamish PIC project. Negotiation of the final scope of work included consultation with the SCD, SHD, City of Stanwood, SFCD, and the Stillaguamish Tribe. The Lower Stillaguamish PIC project refined the actions conducted under the County’s MWQA approach and expanded them into the Lower Stillaguamish River sub-basin west of I-5, including the SFCD and adjacent uplands. The total project area was 31 square miles, which included 4,082 parcels. Water quality sampling and other field data collection was used to identify potential locations of fecal coliform pollution. Based on that information, SWM and project partners focused pollution prevention and correction efforts on failing on-site septic systems and agricultural pollutants. A significant portion of the grant funding was used for the repair of failing septic systems and implementation of agricultural best management practices (BMPs) that directly reduced fecal coliform pollution. The project resulted in reductions of fecal coliform from existing sources in the project area, which supports opportunities for shellfish harvesting and reduces human health risks for primary contact water recreation in the Lower Stillaguamish River sub-basin. This is increasingly important as the City of Stanwood is working to improve public access to the Old Stillaguamish River Channel as part of its local community and economic development strategy. 3.2.2 Summary of previous studies and existing data Non-point pollution in the Stillaguamish River watershed and its downstream impacts on marine water quality in Port Susan and South Skagit Bay are well documented. While issues still remain, recent data show reductions in fecal coliform pollution in the area. A water quality study conducted by the State of Washington in 1987 led to a downgrade from Approved to Prohibited of approximately 12,000 acres of commercial shellfish growing area in Port Susan (Lukes 1987). Partly in response to that commercial shellfish downgrade, the Stillaguamish and Tulalip tribes nominated the Stillaguamish watershed for early action watershed planning pursuant to the Puget Sound Water Quality Management Plan. This was one of five watersheds selected by WDOE for early action watershed planning in the Puget Sound region. The County’s Public Works Department was the lead for this early action watershed planning with funding from WDOE’s Centennial Clean Water Fund. In 1989, SWM completed a watershed characterization study (Snohomish County 1989), which provided the technical basis for the Stillaguamish Watershed Action Plan. In January 1990, WDOE approved the final Action Plan. The Action Plan documented the following key findings related to nonpoint pollution in the Stillaguamish watershed (Snohomish County 1990):
Snohomish County – Lower Stillaguamish Pollution Identification and Correction Phase 2 QAPP Page 13 of 65
• Nonpoint pollution was the responsibility of everyone to correct. Therefore, for the Action plan to be successful, public involvement in the watershed action planning process was essential.
• Bacterial pollution and sediment were the two most prevalent pollutants in the watershed.
• The four main land use activities that contributed bacterial pollution were agricultural practices, onsite sewage disposal practices, development and urban runoff, and forest practices.
• The major source of bacterial contamination in the Stillaguamish River was from agricultural practices.
• Onsite sewage disposal systems were the primary source of bacterial pollution in the Warm Beach Community area.
• Major sources of sediment were, in order of priority, forest practices, agricultural practices, and development and urban runoff.
• Public knowledge of nonpoint pollution and the impact of land and water-based activities on water quality was inadequate and needed to be improved.
• Existing water quality data on the Stillaguamish watershed was limited and the extent of pollution could not be determined.
• Coordination and communication among and between agencies and interest groups regarding natural resource management needed improvement.
The Tulalip Tribes, Stillaguamish Tribe, and the County were identified as co-lead agencies for oversight and implementation of the Stillaguamish Watershed Action Plan. The Stillaguamish Implementation Review Committee (SIRC) was established as a forum to support plan implementation and to resolve issues. The Action Plan identified twenty-one implementing agencies, including Snohomish County Public Works, SCD, SHD, Tulalip and Stillaguamish tribes, Washington Department of Fisheries, and WDOE. In 1991, SHD completed a sanitary survey of the Warm Beach area with grant support from WDOE’s Centennial Clean Water Fund to address the longstanding problem of inadequate on-site sewage systems (Plemel 1991). This study evaluated on-site sewage systems at 194 residential properties and found a 55% failure rate. The SHD conducted a follow-up sanitary survey for the Warm Beach area in 2009 (McCormick 2009), which only found one failed system. The SHD also conducted a sanitary survey in the Skagit Flats area north of Stanwood and the Leque Road area just south of Stanwood in 2012 (Hutchison 2014). Several septic system failures were identified and subsequently repaired or replaced. The Tulalip Tribes monitored water quality in the Lower Stillaguamish River from 1991 to 1994, including dry and wet season sampling of Fish Creek, Church Creek, Miller Creek and Glade Bekken for the following parameters: dissolved oxygen, fecal coliform, turbidity, nitrate-nitrite, and ortho-phosphate (O’Neal et al. 2001). This study found that all four streams exceeded water quality standards for fecal coliform bacteria. Improved livestock management was recommended for all four streams.
Snohomish County – Lower Stillaguamish Pollution Identification and Correction Phase 2 QAPP Page 14 of 65
Based on the data collected from 1991 to 1994, in 1994, the Tulalip Tribes produced an issue paper on the mitigation of impacts on water quality and aquatic habitat from commercial and non-commercial agriculture in the Stillaguamish watershed (Currie 1994). This paper identified Fish Creek, Glade Bekken (previously known as Tributary 30), Church Creek, and Miller Creek as sub-basins of greatest concern due to consistently high levels of fecal coliform bacteria, nitrate-nitrite, and turbidity. These water quality conditions were associated with livestock operations and in some cases, lack of adequate flushing flows from tide gates. In 1995, under contract with SWM, SCD conducted an inventory of livestock operations in the Lower Stillaguamish CWD and evaluated their potential for non-point pollution (Steinbarger 1995). The final report included a series of recommendations related to agricultural pollution control policies and best management practices. In collaboration with the SCD, SWM implemented a multi-year watershed restoration and monitoring project in the Glade Bekken sub-basin with grant support from WDOE’s Centennial Clean Water Fund (Thornburgh 2001). Water quality monitoring was conducted from 1997 to 1999 for the following parameters: fecal coliform bacteria, nitrate-nitrite, total phosphorous, total suspended solids, turbidity, and conductivity. Technical and cost share assistance was also provided to landowners within this sub-basin for implementation of various BMPs related to livestock management. Bacteria loading rates decreased over the three years of the project, but that may have been due to decreased rainfall during the project implementation period. Beginning around 2000, WDOE began scoping a multi-parameter Total Maximum Daily Load (TMDL) study for the Stillaguamish River (Joy and Glenn 2000). The study, which addressed fecal coliform bacteria, dissolved oxygen, pH, arsenic, and mercury, was completed in 2005 with a report to the U.S. Environmental Protection Agency (Lawrence and Joy 2005). This study identified fecal coliform load reductions for 34 locations within the watershed. Many of these locations were within the Lower Stillaguamish area. A water quality clean-up plan (a.k.a., TMDL implementation plan) was subsequently developed to help guide implementation of activities by state and local governmental agencies, non-profit organizations, and private landowners (Svrjcek and Lawrence 2007). Following completion of the Stillaguamish Shellfish Protection Program plan in 2010, which defined bacterial pollution source identification and correction as the top priority for shellfish protection, SWM compiled and analyzed existing fecal coliform data collected over the previous 10 years within the Stillaguamish River watershed (Britsch et al. 2011). Data were ranked according to the County’s MWQA process. This effort resulted in identifying the Lower Stillaguamish as one of the top three priority areas for proactive bacterial pollution source identification and correction work. Within the Lower Stillaguamish sub-basin, Miller Creek and the Old Stillaguamish channel exhibited the worst fecal coliform conditions.
Snohomish County – Lower Stillaguamish Pollution Identification and Correction Phase 2 QAPP Page 15 of 65
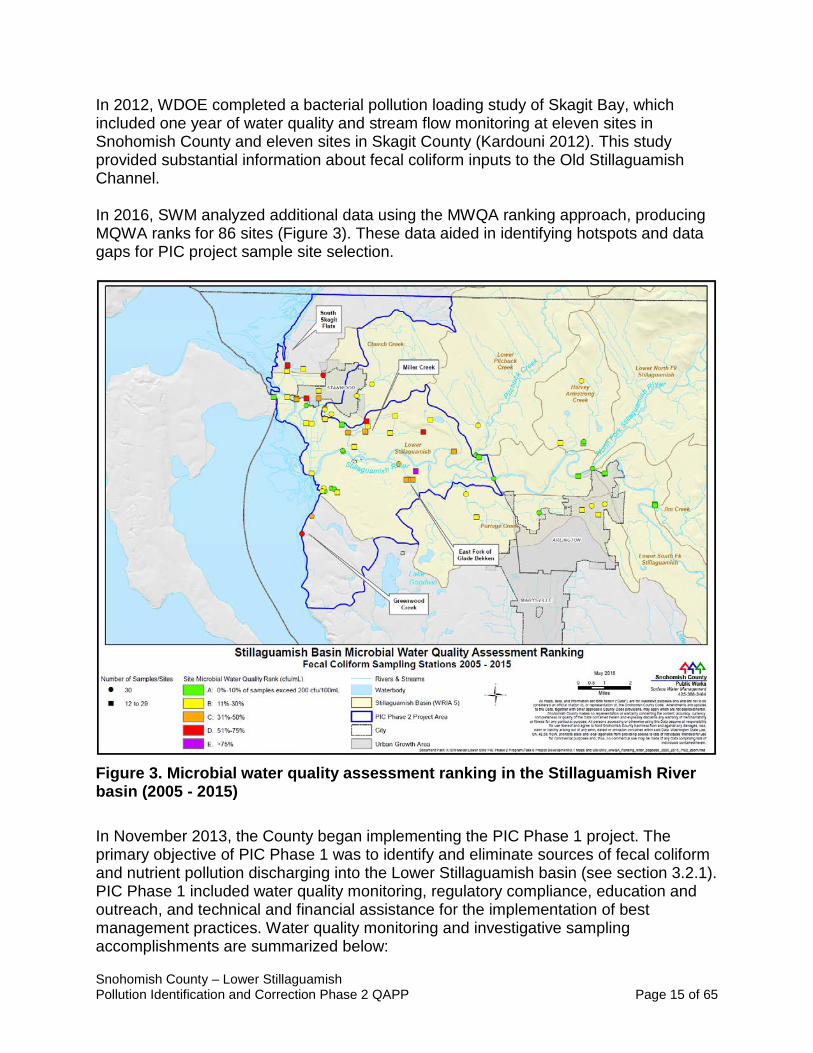
In 2012, WDOE completed a bacterial pollution loading study of Skagit Bay, which included one year of water quality and stream flow monitoring at eleven sites in Snohomish County and eleven sites in Skagit County (Kardouni 2012). This study provided substantial information about fecal coliform inputs to the Old Stillaguamish Channel. In 2016, SWM analyzed additional data using the MWQA ranking approach, producing MQWA ranks for 86 sites (Figure 3). These data aided in identifying hotspots and data gaps for PIC project sample site selection.
Figure 3. Microbial water quality assessment ranking in the Stillaguamish River basin (2005 - 2015) In November 2013, the County began implementing the PIC Phase 1 project. The primary objective of PIC Phase 1 was to identify and eliminate sources of fecal coliform and nutrient pollution discharging into the Lower Stillaguamish basin (see section 3.2.1). PIC Phase 1 included water quality monitoring, regulatory compliance, education and outreach, and technical and financial assistance for the implementation of best management practices. Water quality monitoring and investigative sampling accomplishments are summarized below:
Snohomish County – Lower Stillaguamish Pollution Identification and Correction Phase 2 QAPP Page 16 of 65
• Collected water quality samples at nine monitoring sites in the Lower Stillaguamish PIC area with a focus on adjacent uplands that drain to the Lower Stillaguamish River floodplain;
• Coordinated with Washington State Department of Agriculture (WSDA) Dairy Nutrient Management Program’s NEP-funded water quality monitoring to identify bacterial pollution from commercial dairies in the Lower Stillaguamish River floodplain;
• Coordinated storm event sampling with WDOE to characterize and isolate sources of bacterial pollution;
• Conducted bracketed water quality monitoring at six sites to support contaminant source survey work in the Sunday Lake drainage basin;
• Conducted dry season contaminate source survey fieldwork in the Sunday Lake drainage basin, which was prioritized based on SWM’s PIC water quality monitoring results;
• Coordinated with WDOE, SCD, and City of Stanwood on pollution source investigation of high fecal coliform and conductivity associated with unnatural non-rain event spikes in stream flow of Douglas Creek;
• Coordinated with WSDA and SHD on pollution source investigation upstream of WSDA’s Stil-6 water quality monitoring site in the Miller Creek sub-basin near the intersection of Pioneer Highway and Stubbs Road (a.k.a., 28th Ave. NW); and
• Coordinated with WDOE and SCD on pollution follow-up cases related to the R.O. Lervick Arabians horse stall waste pile and neighboring properties.
The Stillaguamish Tribe conducted water quality monitoring in the Stillaguamish River watershed from 1993 to 2013 at more than 200 sites and analyzed statistical trends for 65 sites that had at least 50 samples within 17 sub-basins (Brown and Taylor 2018). Eleven of the 17 sub-basins indicated improving water quality for fecal coliform bacteria. As mentioned previously, the driver of the downgrade of the 190 acres of commercial shellfish beds at Port Susan Bay were two spikes in fecal coliform results at the end of 2016. Since then, there have been three spikes of fecal coliform in Port Susan. These spikes occurred in November and December of 2017 and in September of 2018. 3.2.3 Parameters of interest and potential sources This QAPP supports the Lower Stillaguamish PIC Phase 2 grant which focuses on identifying and eliminating sources of fecal coliform bacteria. Fecal coliform is an indicator of the sanitary quality of water because it is associated with pathogens found in feces. A pathogen is a microbe, virus or other organism that is known to cause disease. Examples of bacterial pathogens frequently found in storm water runoff or surface waters include Shigellis and Salmonella. In August 2017, WDOE announced rule-making to remove fecal coliform as the recreational freshwater water quality indicator and replace it with E.coli, as studies have shown it is a better indicator of fecal waste from warm-blooded animals and more
Snohomish County – Lower Stillaguamish Pollution Identification and Correction Phase 2 QAPP Page 17 of 65
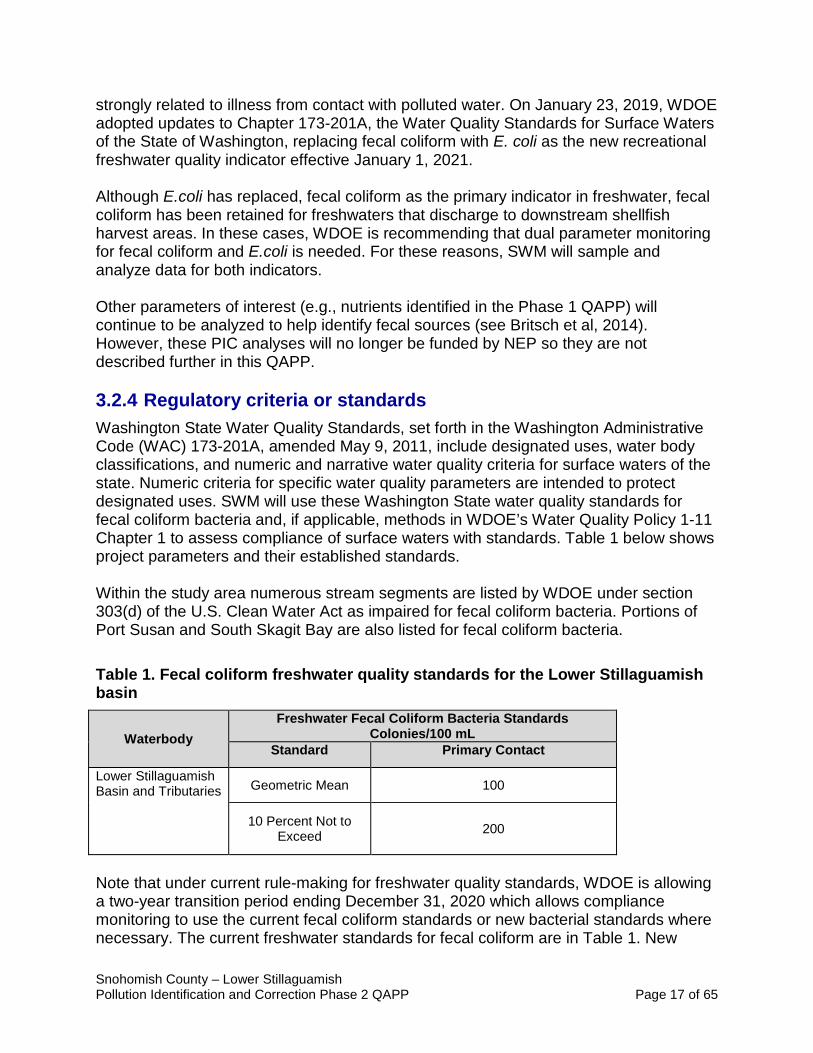
strongly related to illness from contact with polluted water. On January 23, 2019, WDOE adopted updates to Chapter 173-201A, the Water Quality Standards for Surface Waters of the State of Washington, replacing fecal coliform with E. coli as the new recreational freshwater quality indicator effective January 1, 2021. Although E.coli has replaced, fecal coliform as the primary indicator in freshwater, fecal coliform has been retained for freshwaters that discharge to downstream shellfish harvest areas. In these cases, WDOE is recommending that dual parameter monitoring for fecal coliform and E.coli is needed. For these reasons, SWM will sample and analyze data for both indicators. Other parameters of interest (e.g., nutrients identified in the Phase 1 QAPP) will continue to be analyzed to help identify fecal sources (see Britsch et al, 2014). However, these PIC analyses will no longer be funded by NEP so they are not described further in this QAPP. 3.2.4 Regulatory criteria or standards Washington State Water Quality Standards, set forth in the Washington Administrative Code (WAC) 173-201A, amended May 9, 2011, include designated uses, water body classifications, and numeric and narrative water quality criteria for surface waters of the state. Numeric criteria for specific water quality parameters are intended to protect designated uses. SWM will use these Washington State water quality standards for fecal coliform bacteria and, if applicable, methods in WDOE’s Water Quality Policy 1-11 Chapter 1 to assess compliance of surface waters with standards. Table 1 below shows project parameters and their established standards. Within the study area numerous stream segments are listed by WDOE under section 303(d) of the U.S. Clean Water Act as impaired for fecal coliform bacteria. Portions of Port Susan and South Skagit Bay are also listed for fecal coliform bacteria. Table 1. Fecal coliform freshwater quality standards for the Lower Stillaguamish basin
Waterbody Freshwater Fecal Coliform Bacteria Standards
Colonies/100 mL Standard Primary Contact
Lower Stillaguamish Basin and Tributaries Geometric Mean 100
10 Percent Not to Exceed 200
Note that under current rule-making for freshwater quality standards, WDOE is allowing a two-year transition period ending December 31, 2020 which allows compliance monitoring to use the current fecal coliform standards or new bacterial standards where necessary. The current freshwater standards for fecal coliform are in Table 1. New
Snohomish County – Lower Stillaguamish Pollution Identification and Correction Phase 2 QAPP Page 18 of 65
standards for E.coli in freshwater may become available for use during the project period.
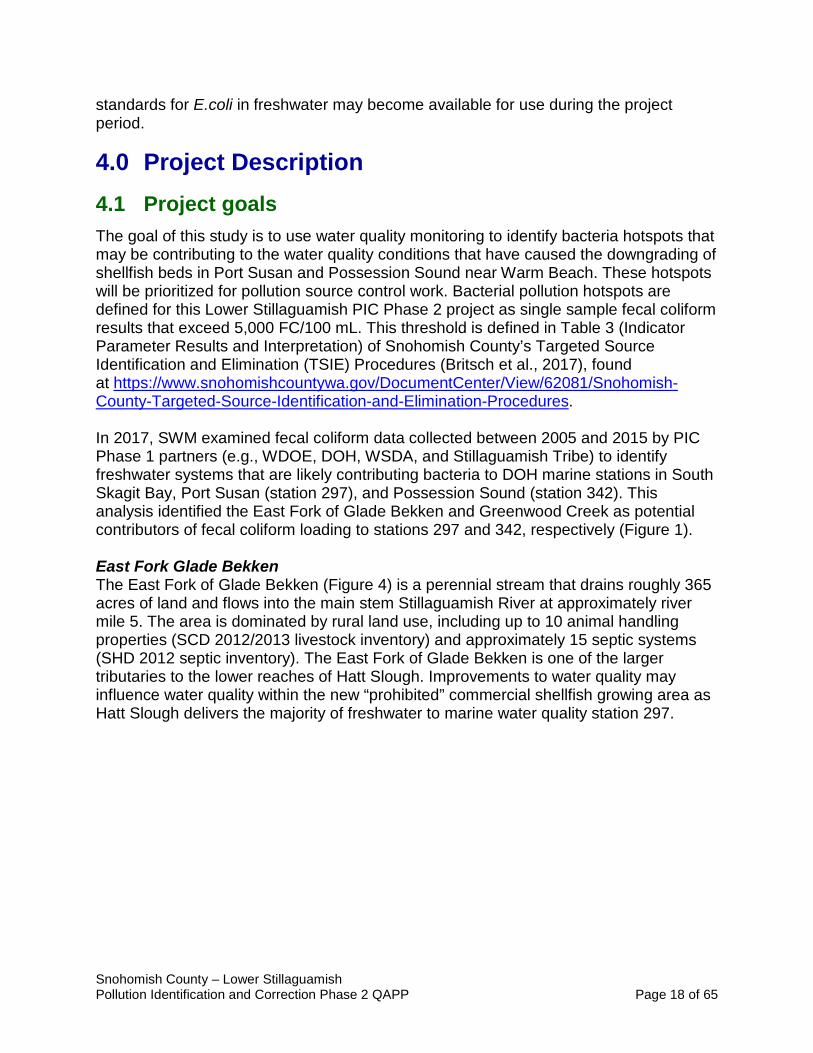
4.0 Project Description 4.1 Project goals The goal of this study is to use water quality monitoring to identify bacteria hotspots that may be contributing to the water quality conditions that have caused the downgrading of shellfish beds in Port Susan and Possession Sound near Warm Beach. These hotspots will be prioritized for pollution source control work. Bacterial pollution hotspots are defined for this Lower Stillaguamish PIC Phase 2 project as single sample fecal coliform results that exceed 5,000 FC/100 mL. This threshold is defined in Table 3 (Indicator Parameter Results and Interpretation) of Snohomish County’s Targeted Source Identification and Elimination (TSIE) Procedures (Britsch et al., 2017), found at https://www.snohomishcountywa.gov/DocumentCenter/View/62081/Snohomish-County-Targeted-Source-Identification-and-Elimination-Procedures. In 2017, SWM examined fecal coliform data collected between 2005 and 2015 by PIC Phase 1 partners (e.g., WDOE, DOH, WSDA, and Stillaguamish Tribe) to identify freshwater systems that are likely contributing bacteria to DOH marine stations in South Skagit Bay, Port Susan (station 297), and Possession Sound (station 342). This analysis identified the East Fork of Glade Bekken and Greenwood Creek as potential contributors of fecal coliform loading to stations 297 and 342, respectively (Figure 1). East Fork Glade Bekken The East Fork of Glade Bekken (Figure 4) is a perennial stream that drains roughly 365 acres of land and flows into the main stem Stillaguamish River at approximately river mile 5. The area is dominated by rural land use, including up to 10 animal handling properties (SCD 2012/2013 livestock inventory) and approximately 15 septic systems (SHD 2012 septic inventory). The East Fork of Glade Bekken is one of the larger tributaries to the lower reaches of Hatt Slough. Improvements to water quality may influence water quality within the new “prohibited” commercial shellfish growing area as Hatt Slough delivers the majority of freshwater to marine water quality station 297.
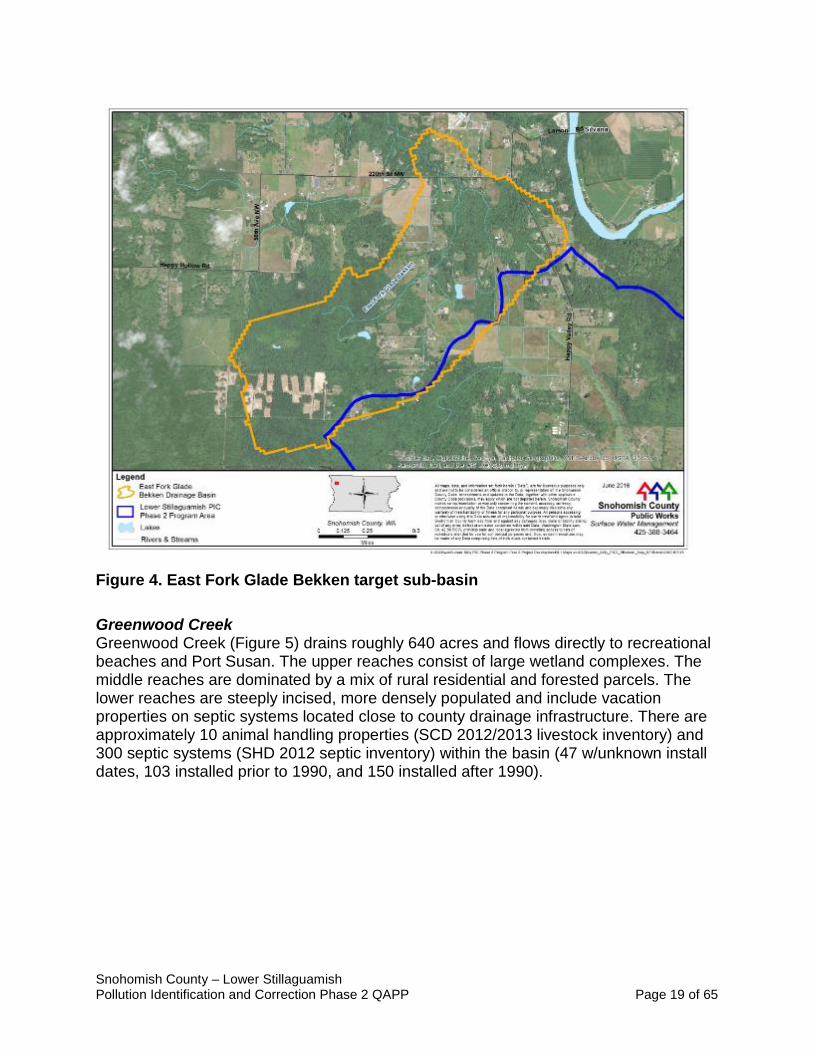
Snohomish County – Lower Stillaguamish Pollution Identification and Correction Phase 2 QAPP Page 19 of 65
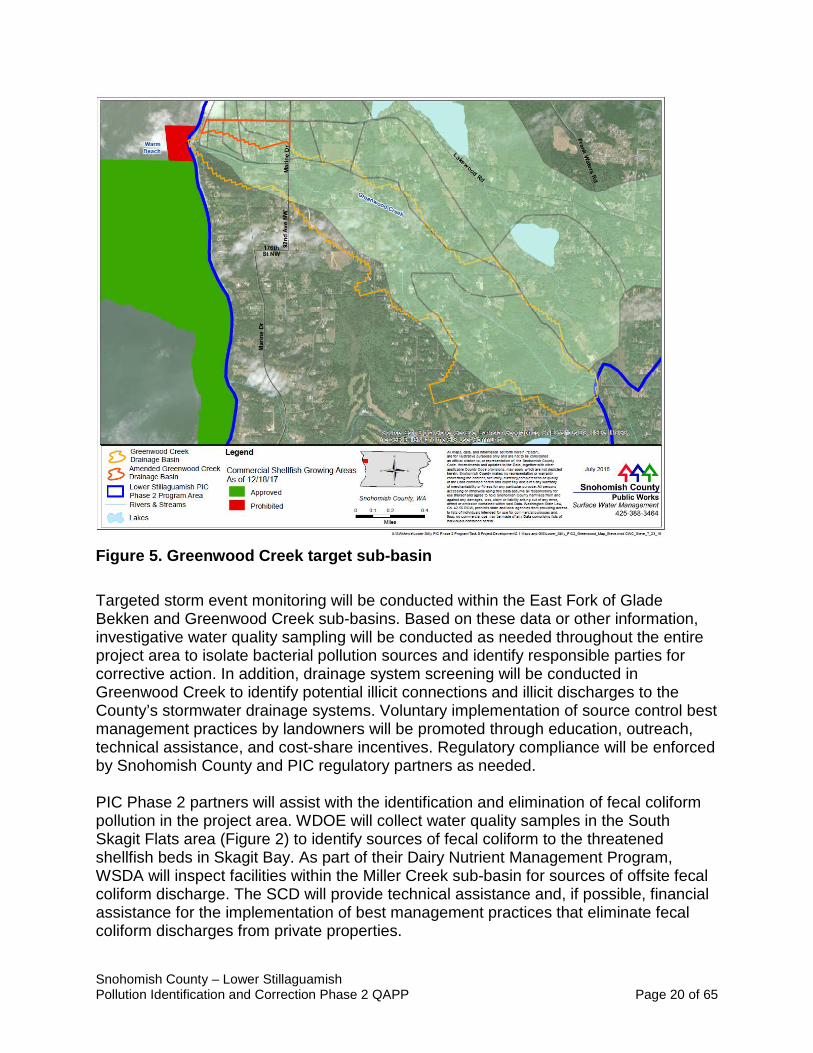
Figure 4. East Fork Glade Bekken target sub-basin Greenwood Creek Greenwood Creek (Figure 5) drains roughly 640 acres and flows directly to recreational beaches and Port Susan. The upper reaches consist of large wetland complexes. The middle reaches are dominated by a mix of rural residential and forested parcels. The lower reaches are steeply incised, more densely populated and include vacation properties on septic systems located close to county drainage infrastructure. There are approximately 10 animal handling properties (SCD 2012/2013 livestock inventory) and 300 septic systems (SHD 2012 septic inventory) within the basin (47 w/unknown install dates, 103 installed prior to 1990, and 150 installed after 1990).
Snohomish County – Lower Stillaguamish Pollution Identification and Correction Phase 2 QAPP Page 20 of 65
Figure 5. Greenwood Creek target sub-basin Targeted storm event monitoring will be conducted within the East Fork of Glade Bekken and Greenwood Creek sub-basins. Based on these data or other information, investigative water quality sampling will be conducted as needed throughout the entire project area to isolate bacterial pollution sources and identify responsible parties for corrective action. In addition, drainage system screening will be conducted in Greenwood Creek to identify potential illicit connections and illicit discharges to the County’s stormwater drainage systems. Voluntary implementation of source control best management practices by landowners will be promoted through education, outreach, technical assistance, and cost-share incentives. Regulatory compliance will be enforced by Snohomish County and PIC regulatory partners as needed. PIC Phase 2 partners will assist with the identification and elimination of fecal coliform pollution in the project area. WDOE will collect water quality samples in the South Skagit Flats area (Figure 2) to identify sources of fecal coliform to the threatened shellfish beds in Skagit Bay. As part of their Dairy Nutrient Management Program, WSDA will inspect facilities within the Miller Creek sub-basin for sources of offsite fecal coliform discharge. The SCD will provide technical assistance and, if possible, financial assistance for the implementation of best management practices that eliminate fecal coliform discharges from private properties.

Snohomish County – Lower Stillaguamish Pollution Identification and Correction Phase 2 QAPP Page 21 of 65
4.2 Project objectives Project objectives include: • Identifying sources of bacterial pollution through targeted storm event monitoring,
investigative water quality sampling, and drainage system screening. o Storm event monitoring will include up to 10 FC and E. coli (bacteria)
samples per site (East Fork of Glade Bekken = 3 sites, Greenwood Creek = 3 sites) and will target spring, summer and fall storms (April – November) producing >0.2 inches of rain over a period of time not to exceed 48 hours, where the event was preceded by 72 hours with little to no rain.
o Investigative water quality sampling will include up to 300 bacteria samples for the entire Lower Stillaguamish PIC Phase 2 project area to isolate sources of pollution contributing to hot spots identified by the County and/or PIC project partners.
o The County’s drainage system will be screened in the Greenwood Creek basin to identify illicit connection and illicit discharges. If discharges are found, samples may be taken to identify likely sources.
• The total number of samples collected is dependent upon the number of qualifying storms, staff availability, presence of flow, and other factors. Currently, objectives of the Phase 2 PIC program include collecting up to 300 investigative samples and up to 96 storm event samples for analysis of fecal coliform and E coli bacteria.
• Storm event monitoring and investigative sampling activities and results will be summarized in quarterly progress reports that will be shared with PIC partner agencies and submitted to DOH.
• Water quality monitoring results will be used to focus targeted education, outreach, technical assistance, cost-share incentives, and regulatory compliance activities.
• Provide agricultural BMP technical assistance to 10 target property owners
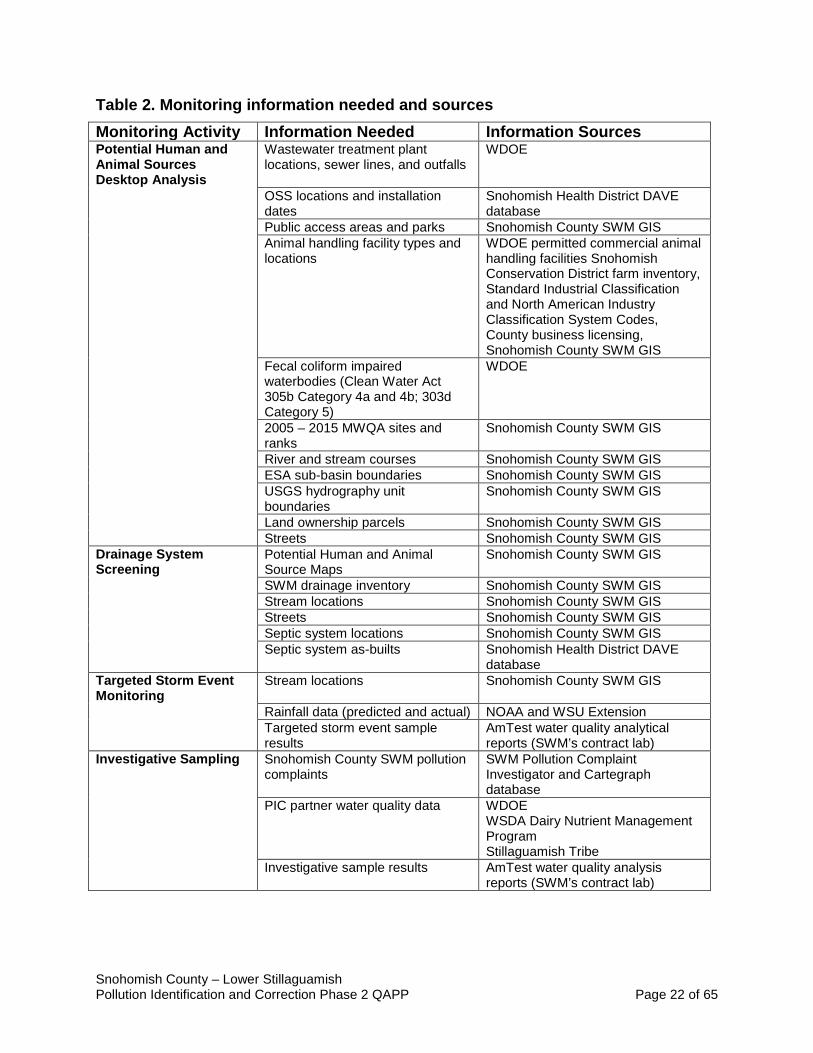
4.3 Information needed and sources Geospatial information such as septic system locations and status, animal handling facilities, farm survey data, streams, and built drainage systems will be utilized to characterize the study area and potential sources when conducting drainage system screening, storm event monitoring, and investigative sampling. This information will be essential to identify potential sources of fecal coliform pollution. The types and sources of existing data to be assembled and all new data to be collected are summarized in Table 2.
Snohomish County – Lower Stillaguamish Pollution Identification and Correction Phase 2 QAPP Page 22 of 65
Table 2. Monitoring information needed and sources Monitoring Activity Information Needed Information Sources Potential Human and Animal Sources Desktop Analysis
Wastewater treatment plant locations, sewer lines, and outfalls
WDOE
OSS locations and installation dates
Snohomish Health District DAVE database
Public access areas and parks Snohomish County SWM GIS Animal handling facility types and
locations WDOE permitted commercial animal handling facilities Snohomish Conservation District farm inventory, Standard Industrial Classification and North American Industry Classification System Codes, County business licensing, Snohomish County SWM GIS
Fecal coliform impaired waterbodies (Clean Water Act 305b Category 4a and 4b; 303d Category 5)
WDOE
2005 – 2015 MWQA sites and ranks
Snohomish County SWM GIS
River and stream courses Snohomish County SWM GIS ESA sub-basin boundaries Snohomish County SWM GIS USGS hydrography unit
boundaries Snohomish County SWM GIS
Land ownership parcels Snohomish County SWM GIS Streets Snohomish County SWM GIS Drainage System Screening
Potential Human and Animal Source Maps
Snohomish County SWM GIS
SWM drainage inventory Snohomish County SWM GIS Stream locations Snohomish County SWM GIS Streets Snohomish County SWM GIS Septic system locations Snohomish County SWM GIS Septic system as-builts Snohomish Health District DAVE
database Targeted Storm Event Monitoring
Stream locations Snohomish County SWM GIS
Rainfall data (predicted and actual) NOAA and WSU Extension Targeted storm event sample
results AmTest water quality analytical reports (SWM’s contract lab)
Investigative Sampling Snohomish County SWM pollution complaints
SWM Pollution Complaint Investigator and Cartegraph database
PIC partner water quality data WDOE WSDA Dairy Nutrient Management Program Stillaguamish Tribe
Investigative sample results AmTest water quality analysis reports (SWM’s contract lab)
Snohomish County – Lower Stillaguamish Pollution Identification and Correction Phase 2 QAPP Page 23 of 65
4.4 Tasks required Storm Event Monitoring The sample design is based upon a review of existing studies and expert knowledge to achieve the goal of identifying and eliminating polluted discharges. To determine sampling locations, bacteria data were evaluated through a GIS exercise. The evaluation also considered proximity to shellfish beds and known potential sources. Proposed sample locations were ranked, discussed, and evaluated through field reconnaissance for sampling feasibility. SWM will purchase needed supplies, provide training where appropriate, and begin obtaining samples to fulfill design and data quality objectives. Data will be verified and reviewed frequently to identify bacterial hot spots for investigative sampling. Drainage System Screening Field screening experts will review the current status of drainage system mapping in the Greenwood Creek study area to identify critical locations to screen for the presence of polluted discharges. Based on those results, drainage systems will be screened following Snohomish County’s TSIE procedures (Britsch et al., 2017). Investigative Sampling When monitoring data, drainage system screening, or partner information identify a hotspot for bacterial pollution, investigative sampling may be conducted to identify the likely source. Investigative sampling may include testing water samples for additional analytes to help identify specific source types. But, as stated in Section 3.2.3, these additional analyses are not supported by NEP funds so they are not a subject of this QAPP.
4.5 Systematic planning process used Preparation and approval of this QAPP completes this plan element.
Snohomish County – Lower Stillaguamish Pollution Identification and Correction Phase 2 QAPP Page 24 of 65
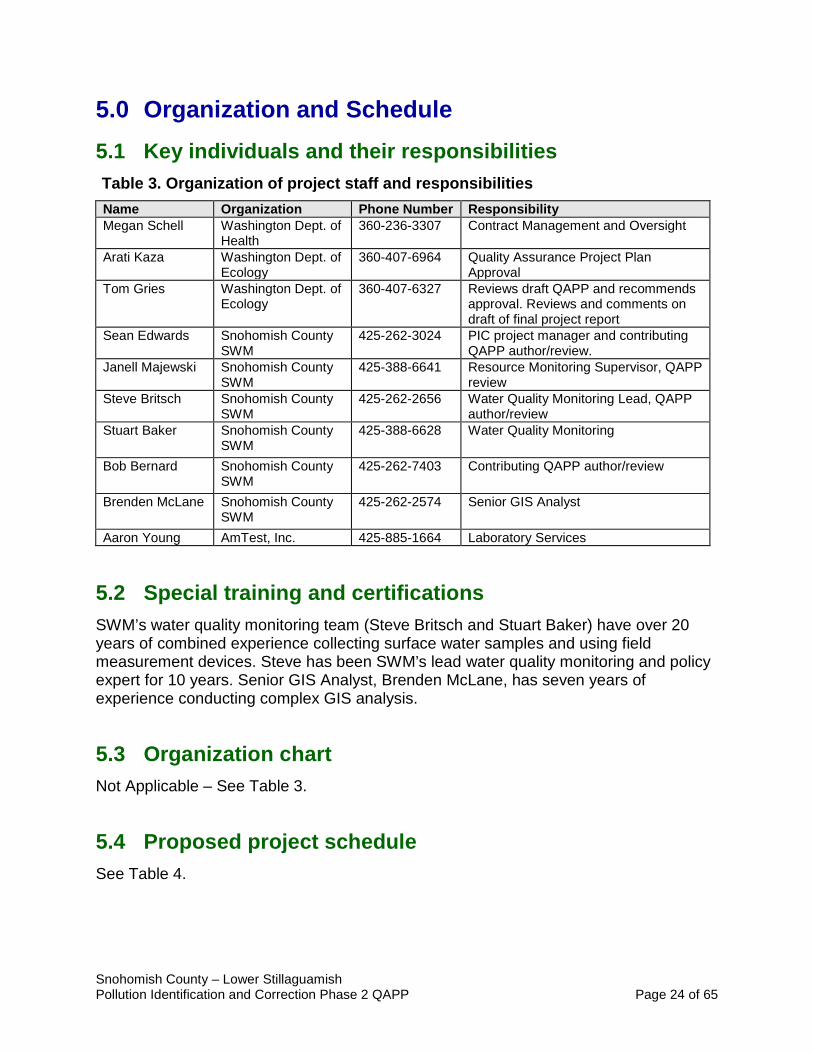
5.0 Organization and Schedule 5.1 Key individuals and their responsibilities Table 3. Organization of project staff and responsibilities Name Organization Phone Number Responsibility Megan Schell Washington Dept. of
Health 360-236-3307 Contract Management and Oversight
Arati Kaza Washington Dept. of Ecology
360-407-6964 Quality Assurance Project Plan Approval
Tom Gries Washington Dept. of Ecology
360-407-6327 Reviews draft QAPP and recommends approval. Reviews and comments on draft of final project report
Sean Edwards Snohomish County SWM
425-262-3024 PIC project manager and contributing QAPP author/review.
Janell Majewski Snohomish County SWM
425-388-6641 Resource Monitoring Supervisor, QAPP review
Steve Britsch Snohomish County SWM
425-262-2656 Water Quality Monitoring Lead, QAPP author/review
Stuart Baker Snohomish County SWM
425-388-6628 Water Quality Monitoring
Bob Bernard Snohomish County SWM
425-262-7403 Contributing QAPP author/review
Brenden McLane Snohomish County SWM
425-262-2574 Senior GIS Analyst
Aaron Young AmTest, Inc. 425-885-1664 Laboratory Services
5.2 Special training and certifications SWM’s water quality monitoring team (Steve Britsch and Stuart Baker) have over 20 years of combined experience collecting surface water samples and using field measurement devices. Steve has been SWM’s lead water quality monitoring and policy expert for 10 years. Senior GIS Analyst, Brenden McLane, has seven years of experience conducting complex GIS analysis.
5.3 Organization chart Not Applicable – See Table 3.
5.4 Proposed project schedule See Table 4.
Snohomish County – Lower Stillaguamish Pollution Identification and Correction Phase 2 QAPP Page 25 of 65
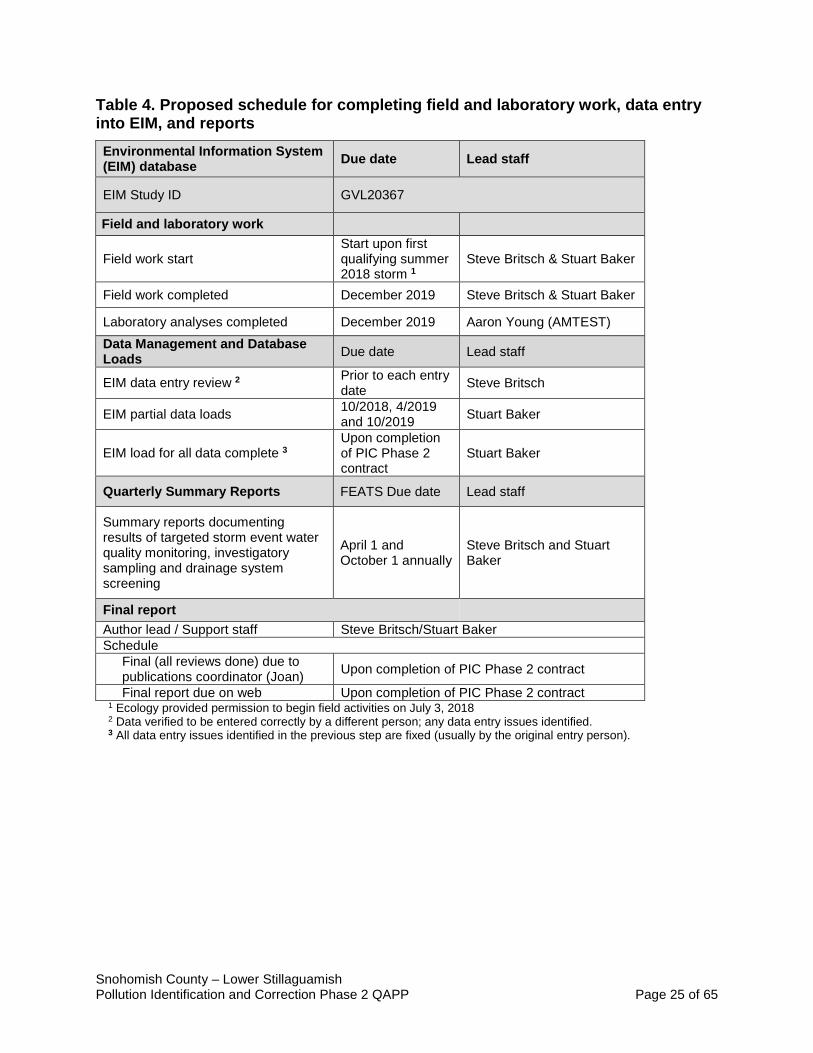
Table 4. Proposed schedule for completing field and laboratory work, data entry into EIM, and reports Environmental Information System (EIM) database Due date Lead staff
EIM Study ID GVL20367
Field and laboratory work
Field work start Start upon first qualifying summer 2018 storm 1
Steve Britsch & Stuart Baker
Field work completed December 2019 Steve Britsch & Stuart Baker
Laboratory analyses completed December 2019 Aaron Young (AMTEST) Data Management and Database Loads Due date Lead staff
EIM data entry review 2 Prior to each entry date Steve Britsch
EIM partial data loads 10/2018, 4/2019 and 10/2019 Stuart Baker
EIM load for all data complete 3 Upon completion of PIC Phase 2 contract
Stuart Baker
Quarterly Summary Reports FEATS Due date Lead staff
Summary reports documenting results of targeted storm event water quality monitoring, investigatory sampling and drainage system screening
April 1 and October 1 annually
Steve Britsch and Stuart Baker
Final report Author lead / Support staff Steve Britsch/Stuart Baker Schedule
Final (all reviews done) due to publications coordinator (Joan) Upon completion of PIC Phase 2 contract
Final report due on web Upon completion of PIC Phase 2 contract 1 Ecology provided permission to begin field activities on July 3, 2018 2 Data verified to be entered correctly by a different person; any data entry issues identified. 3 All data entry issues identified in the previous step are fixed (usually by the original entry person).
Snohomish County – Lower Stillaguamish Pollution Identification and Correction Phase 2 QAPP Page 26 of 65
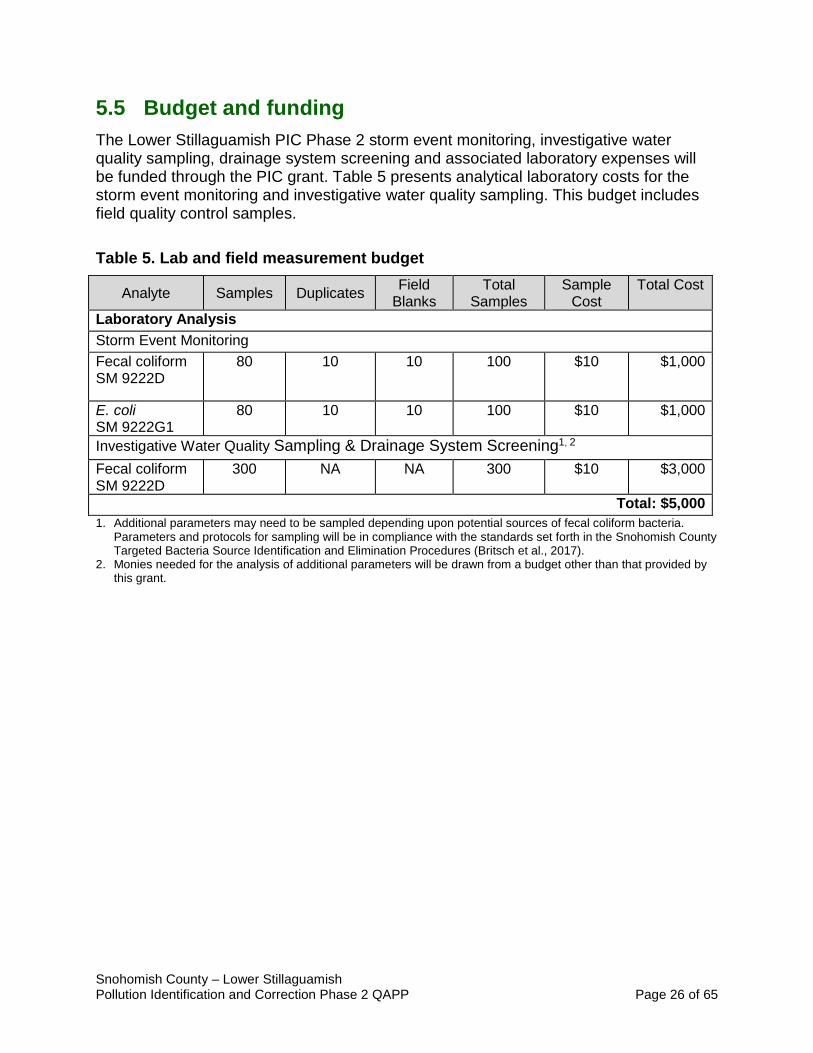
5.5 Budget and funding The Lower Stillaguamish PIC Phase 2 storm event monitoring, investigative water quality sampling, drainage system screening and associated laboratory expenses will be funded through the PIC grant. Table 5 presents analytical laboratory costs for the storm event monitoring and investigative water quality sampling. This budget includes field quality control samples. Table 5. Lab and field measurement budget
Analyte Samples Duplicates Field Blanks
Total Samples
Sample Cost
Total Cost
Laboratory Analysis Storm Event Monitoring Fecal coliform SM 9222D
80 10 10 100 $10 $1,000
E. coli SM 9222G1
80 10 10 100 $10 $1,000
Investigative Water Quality Sampling & Drainage System Screening1, 2
Fecal coliform SM 9222D
300 NA NA 300 $10 $3,000
Total: $5,000 1. Additional parameters may need to be sampled depending upon potential sources of fecal coliform bacteria.
Parameters and protocols for sampling will be in compliance with the standards set forth in the Snohomish County Targeted Bacteria Source Identification and Elimination Procedures (Britsch et al., 2017).
2. Monies needed for the analysis of additional parameters will be drawn from a budget other than that provided by this grant.
Snohomish County – Lower Stillaguamish Pollution Identification and Correction Phase 2 QAPP Page 27 of 65
6.0 Quality Objectives 6.1 Data quality objectives The main data quality objective for this project is to collect storm samples and have them analyzed to identify sources of bacterial pollution. The analysis will use standard methods to obtain total fecal coliform and E.coli concentrations. Where measurements are used to support a decision or study question, quality objectives are expressed as measurement quality objectives (described below).
6.2 Measurement quality objectives To ensure that the project objectives are met, the quality of field and laboratory results will be evaluated at each stage of data collection and analysis with measurement quality objectives (MQOs), which are performance requirements or data quality indicators (i.e., precision, bias, sensitivity, representativeness, comparability and completeness). SWM has established internal data verification processes, associated data quality objectives and qualifiers consistent with EPA and WDOE guidance while maintaining consistency of data management with EIM database needs. In addition to assessing laboratory data quality measures of accuracy, bias, and precision, SWM also evaluates the following information where applicable:
• Hold times and temperatures • Completeness and accuracy of chain of custodies • Standard reference material recoveries (used to assess bias) • Lab method blank results • Field duplicate relative standard deviations • Field blank results
A complete set of data quality control measures and associated qualifiers for estimating or rejecting data are found in Appendix A. Accuracy Accuracy of lab analysis is determined through the difference or the degree of agreement between a measurement result and a true value and is represented as the percent recovery of a spike or matrix spike duplicate. Per standard methods 9222D and 9222G1, spikes are not conducted for fecal coliform or E.coli samples.
Snohomish County – Lower Stillaguamish Pollution Identification and Correction Phase 2 QAPP Page 28 of 65
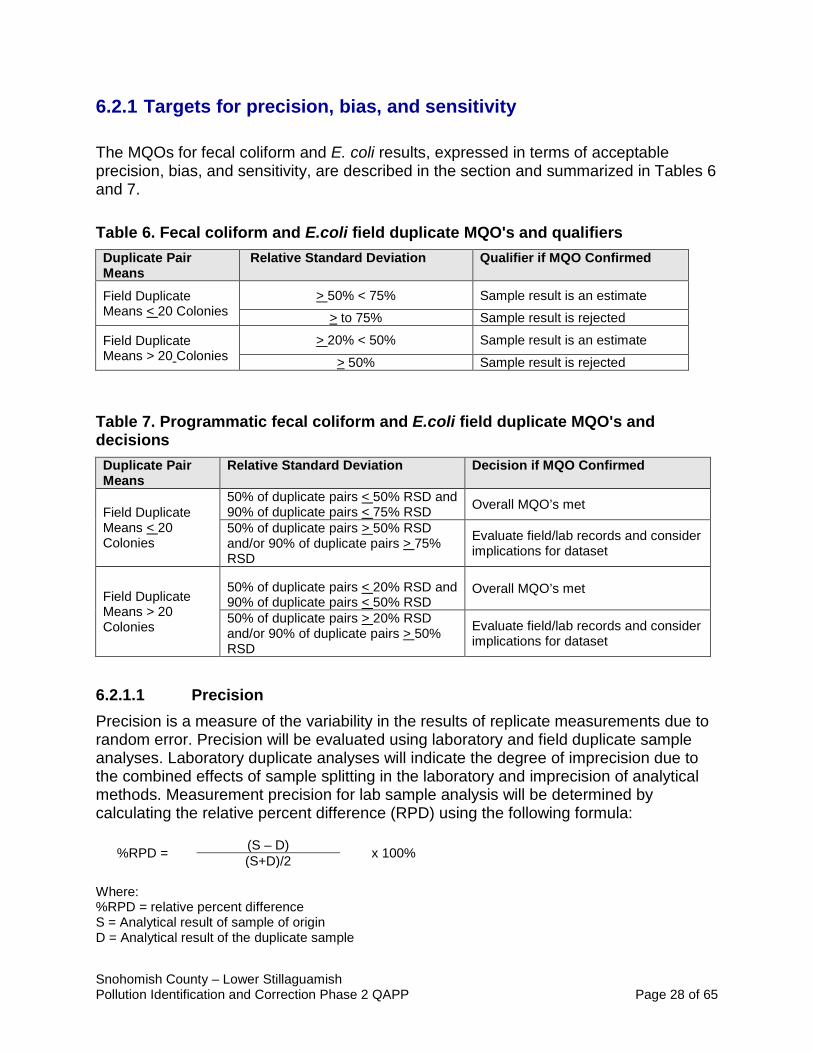
6.2.1 Targets for precision, bias, and sensitivity The MQOs for fecal coliform and E. coli results, expressed in terms of acceptable precision, bias, and sensitivity, are described in the section and summarized in Tables 6 and 7.
Table 6. Fecal coliform and E.coli field duplicate MQO's and qualifiers Duplicate Pair Means
Relative Standard Deviation Qualifier if MQO Confirmed
Field Duplicate Means < 20 Colonies
> 50% < 75% Sample result is an estimate > to 75% Sample result is rejected
Field Duplicate Means > 20 Colonies
> 20% < 50% Sample result is an estimate > 50% Sample result is rejected
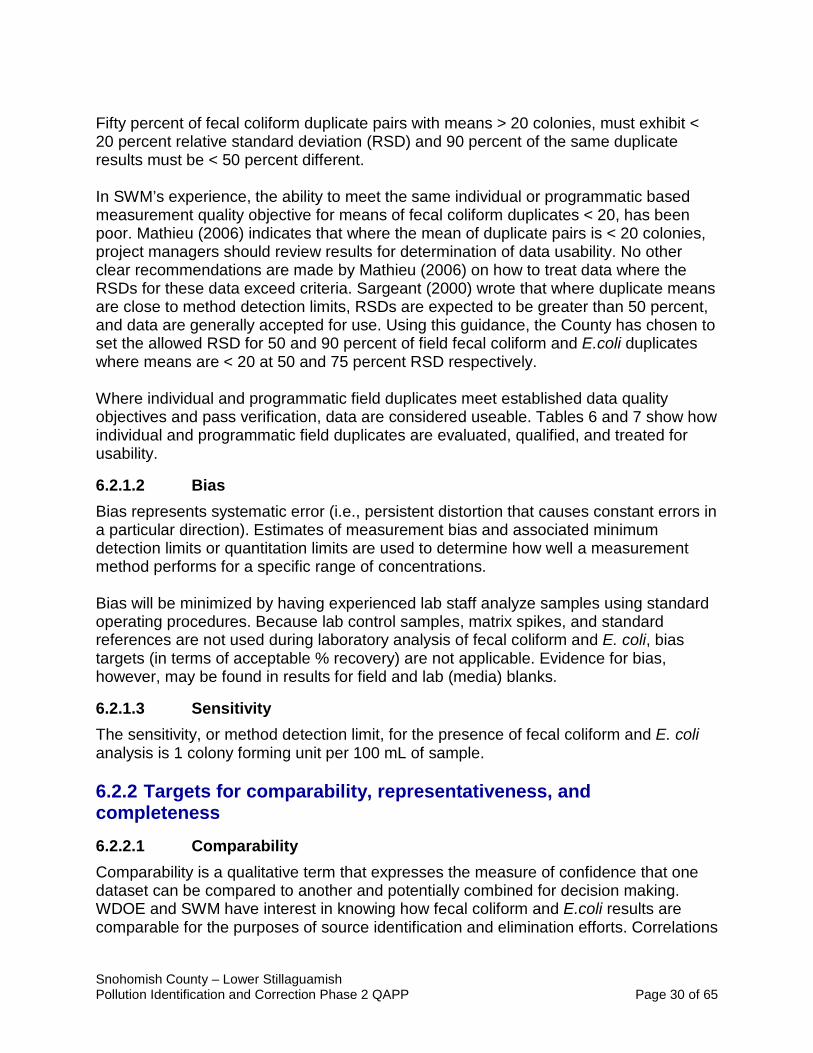
Table 7. Programmatic fecal coliform and E.coli field duplicate MQO's and decisions Duplicate Pair Means
Relative Standard Deviation Decision if MQO Confirmed
Field Duplicate Means < 20 Colonies
50% of duplicate pairs < 50% RSD and 90% of duplicate pairs < 75% RSD Overall MQO’s met
50% of duplicate pairs > 50% RSD and/or 90% of duplicate pairs > 75% RSD
Evaluate field/lab records and consider implications for dataset
Field Duplicate Means > 20 Colonies
50% of duplicate pairs < 20% RSD and 90% of duplicate pairs < 50% RSD
Overall MQO’s met
50% of duplicate pairs > 20% RSD and/or 90% of duplicate pairs > 50% RSD
Evaluate field/lab records and consider implications for dataset
6.2.1.1 Precision Precision is a measure of the variability in the results of replicate measurements due to random error. Precision will be evaluated using laboratory and field duplicate sample analyses. Laboratory duplicate analyses will indicate the degree of imprecision due to the combined effects of sample splitting in the laboratory and imprecision of analytical methods. Measurement precision for lab sample analysis will be determined by calculating the relative percent difference (RPD) using the following formula:
%RPD = (S – D) x 100% (S+D)/2 Where: %RPD = relative percent difference S = Analytical result of sample of origin D = Analytical result of the duplicate sample

Snohomish County – Lower Stillaguamish Pollution Identification and Correction Phase 2 QAPP Page 29 of 65
Results that do not meet the lab’s internal RPDs will be qualified as estimates, consistent with SWM’s procedures and EIM requirements. The lab’s maximum allowed RPD for fecal coliform and E.coli lab duplicates is 50 percent. Field Data Precision Field duplicate analyses, on an individual sample and programmatic basis, will indicate the degree of imprecision due to the combined effects of heterogeneity of the stream, variation in sample collection methods, and imprecision of analytical methods. Field duplicate samples will be collected for ten percent of the total, or up to 30 field duplicate pairs for each parameter (Table 5). Field duplicate information is evaluated on an ongoing basis and if precision is not met, field methods are assessed to determine if they are the cause of the problem. This also enables project managers to more quickly identify and correct errors. Precision of field sampling will be assessed by calculating the relative standard deviation (RSD) between field duplicate samples using the following formula:
SWM has chosen to evaluate both individual and programmatic fecal coliform and E.coli field duplicates as recommended by Mathieu (2006) where evaluation is split between duplicate pairs with means of > 20 or < 20. The process for evaluating fecal coliform and E.coli field duplicate samples is illustrated in Figure 6.
Figure 6. Fecal coliform field duplicate evaluation (Mathieu 2006)
Snohomish County – Lower Stillaguamish Pollution Identification and Correction Phase 2 QAPP Page 30 of 65
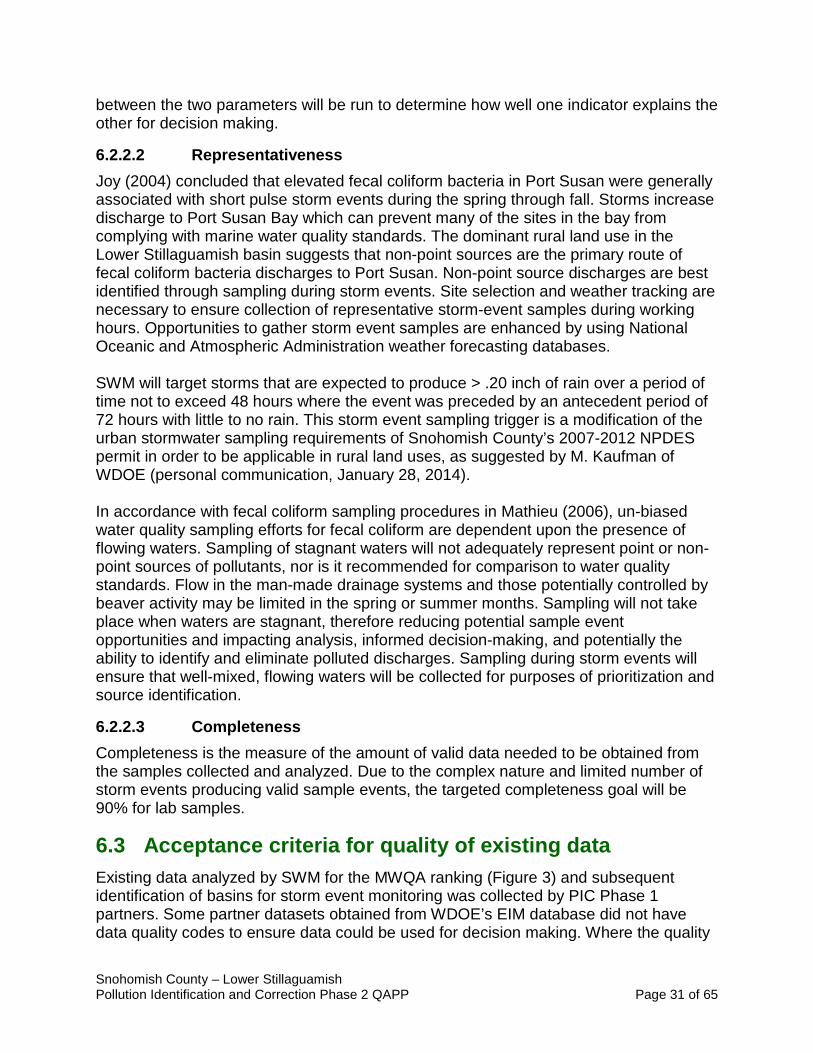
Fifty percent of fecal coliform duplicate pairs with means > 20 colonies, must exhibit < 20 percent relative standard deviation (RSD) and 90 percent of the same duplicate results must be < 50 percent different. In SWM’s experience, the ability to meet the same individual or programmatic based measurement quality objective for means of fecal coliform duplicates < 20, has been poor. Mathieu (2006) indicates that where the mean of duplicate pairs is < 20 colonies, project managers should review results for determination of data usability. No other clear recommendations are made by Mathieu (2006) on how to treat data where the RSDs for these data exceed criteria. Sargeant (2000) wrote that where duplicate means are close to method detection limits, RSDs are expected to be greater than 50 percent, and data are generally accepted for use. Using this guidance, the County has chosen to set the allowed RSD for 50 and 90 percent of field fecal coliform and E.coli duplicates where means are < 20 at 50 and 75 percent RSD respectively. Where individual and programmatic field duplicates meet established data quality objectives and pass verification, data are considered useable. Tables 6 and 7 show how individual and programmatic field duplicates are evaluated, qualified, and treated for usability.
6.2.1.2 Bias Bias represents systematic error (i.e., persistent distortion that causes constant errors in a particular direction). Estimates of measurement bias and associated minimum detection limits or quantitation limits are used to determine how well a measurement method performs for a specific range of concentrations. Bias will be minimized by having experienced lab staff analyze samples using standard operating procedures. Because lab control samples, matrix spikes, and standard references are not used during laboratory analysis of fecal coliform and E. coli, bias targets (in terms of acceptable % recovery) are not applicable. Evidence for bias, however, may be found in results for field and lab (media) blanks.
6.2.1.3 Sensitivity The sensitivity, or method detection limit, for the presence of fecal coliform and E. coli analysis is 1 colony forming unit per 100 mL of sample. 6.2.2 Targets for comparability, representativeness, and completeness 6.2.2.1 Comparability Comparability is a qualitative term that expresses the measure of confidence that one dataset can be compared to another and potentially combined for decision making. WDOE and SWM have interest in knowing how fecal coliform and E.coli results are comparable for the purposes of source identification and elimination efforts. Correlations
Snohomish County – Lower Stillaguamish Pollution Identification and Correction Phase 2 QAPP Page 31 of 65
between the two parameters will be run to determine how well one indicator explains the other for decision making.
6.2.2.2 Representativeness Joy (2004) concluded that elevated fecal coliform bacteria in Port Susan were generally associated with short pulse storm events during the spring through fall. Storms increase discharge to Port Susan Bay which can prevent many of the sites in the bay from complying with marine water quality standards. The dominant rural land use in the Lower Stillaguamish basin suggests that non-point sources are the primary route of fecal coliform bacteria discharges to Port Susan. Non-point source discharges are best identified through sampling during storm events. Site selection and weather tracking are necessary to ensure collection of representative storm-event samples during working hours. Opportunities to gather storm event samples are enhanced by using National Oceanic and Atmospheric Administration weather forecasting databases. SWM will target storms that are expected to produce > .20 inch of rain over a period of time not to exceed 48 hours where the event was preceded by an antecedent period of 72 hours with little to no rain. This storm event sampling trigger is a modification of the urban stormwater sampling requirements of Snohomish County’s 2007-2012 NPDES permit in order to be applicable in rural land uses, as suggested by M. Kaufman of WDOE (personal communication, January 28, 2014). In accordance with fecal coliform sampling procedures in Mathieu (2006), un-biased water quality sampling efforts for fecal coliform are dependent upon the presence of flowing waters. Sampling of stagnant waters will not adequately represent point or non-point sources of pollutants, nor is it recommended for comparison to water quality standards. Flow in the man-made drainage systems and those potentially controlled by beaver activity may be limited in the spring or summer months. Sampling will not take place when waters are stagnant, therefore reducing potential sample event opportunities and impacting analysis, informed decision-making, and potentially the ability to identify and eliminate polluted discharges. Sampling during storm events will ensure that well-mixed, flowing waters will be collected for purposes of prioritization and source identification.
6.2.2.3 Completeness Completeness is the measure of the amount of valid data needed to be obtained from the samples collected and analyzed. Due to the complex nature and limited number of storm events producing valid sample events, the targeted completeness goal will be 90% for lab samples.
6.3 Acceptance criteria for quality of existing data Existing data analyzed by SWM for the MWQA ranking (Figure 3) and subsequent identification of basins for storm event monitoring was collected by PIC Phase 1 partners. Some partner datasets obtained from WDOE’s EIM database did not have data quality codes to ensure data could be used for decision making. Where the quality
Snohomish County – Lower Stillaguamish Pollution Identification and Correction Phase 2 QAPP Page 32 of 65
of PIC partner data was unknown, it was still considered appropriate for identification of the Greenwood Creek and East Fork Glade Bekken priority areas. Bacteria data collected during targeted storm events under the PIC Phase 2 project will be verified and qualified for usability through established data verification processes and uploaded to EIM. GIS data comes from a variety of sources – such as SWM, WDOE, DOH, and WSDA. The data has and will be used to identify ideal storm event monitoring locations and potential locations or sources to be sampled during investigative sampling or drainage system screening. The only known data gap for this project is the status of on-site septic systems, which is information maintained by the SHD. SWM will work with the SHD to try to improve the quality of available information on on-site septic systems.
6.4 Model quality objectives Not applicable
Snohomish County – Lower Stillaguamish Pollution Identification and Correction Phase 2 QAPP Page 33 of 65
7.0 Study Design 7.1 Study boundaries Storm event monitoring will be conducted in the East Fork of Glade Bekken (Figure 4) and Greenwood Creek (Figure 5) watersheds. The location of the watersheds within the PIC Phase 2 boundaries can be seen in Figure 1. The selection of sampling locations is described in Section 4.4. PIC partners will be conducting additional activities throughout the PIC area – such as on-site sewer system surveys, dairy nutrient management plan inspections and animal handling business inspections. As a result of such activities, investigative water quality sampling may be conducted throughout the entire extent of the PIC Phase 2 area (Figure 1).
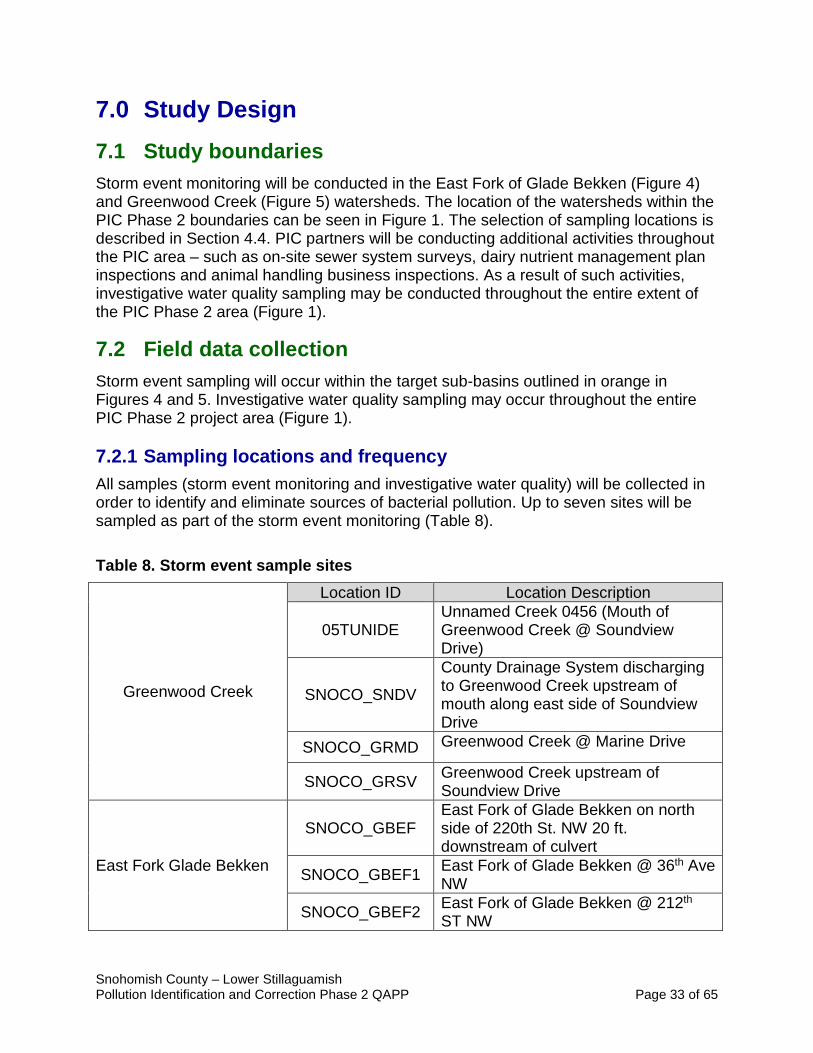
7.2 Field data collection Storm event sampling will occur within the target sub-basins outlined in orange in Figures 4 and 5. Investigative water quality sampling may occur throughout the entire PIC Phase 2 project area (Figure 1). 7.2.1 Sampling locations and frequency All samples (storm event monitoring and investigative water quality) will be collected in order to identify and eliminate sources of bacterial pollution. Up to seven sites will be sampled as part of the storm event monitoring (Table 8). Table 8. Storm event sample sites
Greenwood Creek
Location ID Location Description
05TUNIDE Unnamed Creek 0456 (Mouth of Greenwood Creek @ Soundview Drive)
SNOCO_SNDV
County Drainage System discharging to Greenwood Creek upstream of mouth along east side of Soundview Drive
SNOCO_GRMD Greenwood Creek @ Marine Drive
SNOCO_GRSV Greenwood Creek upstream of Soundview Drive
East Fork Glade Bekken
SNOCO_GBEF East Fork of Glade Bekken on north side of 220th St. NW 20 ft. downstream of culvert
SNOCO_GBEF1 East Fork of Glade Bekken @ 36th Ave NW
SNOCO_GBEF2 East Fork of Glade Bekken @ 212th ST NW
Snohomish County – Lower Stillaguamish Pollution Identification and Correction Phase 2 QAPP Page 34 of 65
When adequate flow is present, samples will be collected within 48 hours of a >0.2 inch rain event, occurring over a period not to exceed 48 hours, where the event was preceded by an antecedent period of 72 hours with little to no rain. Samples will be collected from up to 10 storm events per site. The total number of samples collected is dependent upon the number of qualifying storms, staff availability, and the presence of flow. The location of investigative water quality sampling locations will depend on employee safety, access, and intent of sampling. Up to 300 samples may be collected for investigative purposes. Sample collection for source identification may or may not be dependent on rain. 7.2.2 Field parameters and laboratory analytes to be measured Fecal coliform and Escherichia coli (E. coli).
7.3 Modeling and analysis design Not applicable
7.4 Assumptions in relation to objectives and study area It is assumed that qualifying storm events preceded by dry periods will occur at a frequency during work hours which will produce successful sample events. It is also assumed that the samples will help identify and isolate residential and agricultural sources of pollutants.
7.5 Possible challenges and contingencies 7.5.1 Logistical problems Storm event sampling is difficult to manage due to unpredictable weather and long travel times from Everett to the study area. It is difficult to predict when storm events will occur and it is not feasible for county personnel to mobilize for storm event sampling after normal work hours. Automated storm event sampling is also not feasible due to the complexity and cost of such technology. One-way travel time from the Snohomish County campus in Everett to Stanwood is about 40 minutes without traffic delays. To increase the probability of sampling storm events, samples can be collected up to 48 hours after a storm event of >0.2 inches of rain. Investigative water quality sampling is difficult because almost all of the land is privately owned. This may require county personnel to seek written permission from landowners to access private properties for water quality sampling. Only in extreme cases where public safety and health are at risk will Snohomish County exercise its authority to access private property without permission of the landowner. Natural and man-made drainage networks are complex. While Snohomish County maintains a county-wide drainage network dataset and a GIS-based hydrography data
Snohomish County – Lower Stillaguamish Pollution Identification and Correction Phase 2 QAPP Page 35 of 65
set, the accuracy and completeness of these data are not certain. As such, at times, it is difficult to understand the direction and interconnectivity of surface water flows through the existing drainage networks into the primary receiving waters of the Stillaguamish River basin. This is particularly true for the floodplain areas where agricultural drainage systems, which are not considered part of the County’s drainage network, convey surface waters to the Old Stillaguamish Channel and marine receiving waters. 7.5.2 Practical constraints While there is an adequate budget for storm event sampling, the budget of $3,000 for investigative water quality sampling may be limiting. If only fecal coliform and E. coli are analyzed for investigative purposes, the budget will allow for approximately 300 samples. The availability of SWM staff to conduct water quality monitoring, drainage system screening and investigatory sampling may be limited due to the fact that storm sampling cannot be planned and that staff must prioritize regulatory requirements. Due to the current state of SWM financial resources, other staffing implications may become evident over the life of this QAPP. 7.5.3 Schedule limitations Because the PIC Phase 2 contract was not completed until the end of April 2018, SWM missed the opportunity to sample the 2018 spring storm events. Storm event sampling will most likely begin summer of 2018 and continue throughout 2019. Samples will not be collected during the months of December through March given that previous study suggests a lower likelihood of elevated bacteria and because the likelihood of an antecedent period of 72 hours with little to no rain between storm events is low.
Snohomish County – Lower Stillaguamish Pollution Identification and Correction Phase 2 QAPP Page 36 of 65
8.0 Field Procedures 8.1 Invasive species evaluation Sampling methods will minimize the need to wade in-stream and reduce boot and wader contact with sediment. However, to reduce the possibility of spreading invasive species due to the water quality sampling efforts, SWM will apply the procedures found in Policy 5310, Washington Department of Fish and Wildlife “Invasive Species Management Protocols” Version 2, 2012 (http://wdfw.wa.gov/publications/01490/wdfw01490.pdf). A review of WDOE invasive species GIS layers and WDFW’s recommended USGS invasive species database (http://nas.er.usgs.gov/Default.aspx) shows no areas of extreme concern for invasive species within the study area. Specifically, there are no known infestations of New Zealand mud snails or other aquatic invertebrates within the Strait of Georgia Hydraulic Unit containing the study area. When the absence of conclusive evidence exists, WDFW recommends Level 1 decontamination (A. Pleus, personal communication, January 2014). This includes cleaning off any attached sediment, organisms, or debris from clothing and tools that were in contact with the water.
8.2 Measurement and sampling procedures Water quality sampling will be carried out in accordance with this quality assurance plan. Sampling methods are designed to support water quality monitoring programs while ensuring sample results are of high integrity. SWM will follow Standard Operating Procedures (SOPs) for field sampling and field analyses found in Appendix B. Field sampling gear may differ slightly from what is shown in Appendix B.
8.3 Containers, preservation methods, holding times Sampling for fecal coliform bacteria and E. coli will be performed according to WDOE’s Environmental Assessment program Standard Operating Procedure for Sampling Bacteria in Water, Version 2.1 (Ward and Mathieu, 2011, revised 2017). A copy of this procedure is found in Appendix B. Sample bottles and corresponding fields on the COC for each sample will be labeled as follows:
• Client: SnoCo SWM • Sample/Client ID: Sample Station • Date: MM/DD/YY • Time: time of sampling • Analysis: Fecal coliform SM9222D and E.coli SM9222G1 • Preservative: EDTA/ Na2S2O3/ Ice
Snohomish County – Lower Stillaguamish Pollution Identification and Correction Phase 2 QAPP Page 37 of 65
Preservation of fecal coliform and E. coli sample bottles is recommended by APHA (1998) using sodium thiosulfate (Na2S2O3) to reduce chlorine expected in samples. This preservative is commonly used when sampling for bacteria from waste water plant discharges. Given that investigatory sampling may take place downstream of wastewater treatment facilities or other locations where chlorine may be introduced, samples will be preserved with Na2S2O3. Similarly, preservation of fecal coliform and E. coli sample bottles with disodium salt of ethylenediaminetetraacetic acid (EDTA) is used when sampling wastewater with metals concentrations including copper and zinc > 1.0 mg/l (APHA 1998). Dairies commonly use copper sulfate in foot baths for cattle to control lesions associated with digital dermatitis (Epperson and Midla 2007). Used copper sulfate solutions is typically mixed with manure slurry and disposed by land application. This disposal method may introduce copper to surface waters being sampled. Therefore, 250 mL sterile sample fecal coliform and E. coli sample bottles will be preserved with EDTA. WDOE’s SOP for bacteria sampling written by Ward and Mathieu (2011) indicates that fecal coliform and E. coli samples should be preserved in a cooler and held at or below 4°C. APHA (1998) indicates that non-potable water for either compliance or non-compliance based purposes should be held below 10°C during a maximum transport time of 6 hours for compliance based samples and 24 hours for non-compliance based samples. While it is not the intent of monitoring under this QAPP to gather samples for enforcement purposes, results obtained for those samples that meet the 6-hour hold time requirement may be used to indicate whether a potential violation of Snohomish County Code (SCC 7.53) and Washington State Administrative Code (WAC 173-201A) has occurred. SWM will adhere to the APHA (1998) 9060B preservation requirements for fecal coliform and E. coli samples. Sample temperatures that exceed 10°C upon lab receipt will be qualified as estimates, as has been the practice at Snohomish County SWM for many years.
8.4 Equipment decontamination Decontamination of personal protective gear such as hip waders, boots, reusable gloves, and sampling pole will follow the decontamination procedures outlined in the invasive species evaluation section 8.1. All sample bottles/containers will be provided by and certified as clean by the laboratory.
8.5 Sample ID SWM will follow site location naming formats required for submission to EIM to establish sample ID naming conventions. Each monitoring location will have three identifiers, stored in the following EIM fields: Location ID, Location Name, and Study-Specific Location ID.
Snohomish County – Lower Stillaguamish Pollution Identification and Correction Phase 2 QAPP Page 38 of 65
SWM has searched the EIM database, and other available sources of previously obtained water quality data, to ensure that sample site and water quality sample identification will be compatible with water quality sample ID nomenclature existing within EIM. No new sample station identifications will be created when one already exists in EIM.
8.6 Chain-of-custody Preservation of samples will be conducted as identified in Table 1060:1 of APHA (1998). Following each sampling event, staff will prepare samples and store them in a cooler, on ice, under direct observation or in a locked vehicle for transport to Snohomish County’s secure sample drop off/pick up box. Field staff use a chain–of-custody (COC) form to inventory samples submitted for analysis. A standard 10-day turnaround time for analysis will be requested except when source tracking results must be received more quickly. In accordance with Standard Method 9020 for bacterial examination, lab duplicate analysis must be performed on at least 10% of all samples. To ensure that the lab performs duplicate analysis, the check box on the far right hand side of the COC for QA/QC must be checked where and when the randomized process has already identified a station for field duplicates and blanks. For analysis of fecal coliform and E. coli, the contract laboratory can receive samples from Monday through Friday morning. A COC will be maintained on all samples transported to the office or laboratory using a form supplied by the laboratory (Appendix D). The principal investigator will maintain a file of COC forms in a binder with field data sheets and lab reports.
8.7 Field log requirements Water quality data obtained during storm event sampling and investigative water quality sampling are recorded on standardized field data sheets. Investigative efforts may also be documented through use of electronic field forms. Photographs of the sample site will be taken at long term stations and as necessary to record any visual indicators that would suggest the presence of an illicit discharge. A copy of a blank water quality data form is presented in Appendix E. Electronic forms generally used for investigatory efforts are found in Snohomish County’s TSIE Procedures (Britsch et al., 2017).
8.8 Other activities Persons involved with water quality monitoring could potentially be subjected to unsafe environments. Hazards include, but are not limited to, roadside traffic, slips, trips, falls, drowning, heat and cold stress, and exposure to chemicals and biological pathogens. Snohomish County personnel and anyone else helping with sampling under this QAPP, are encouraged to receive vaccinations for Hepatitis A and B and receive hazard communication and training in the following areas:

Snohomish County – Lower Stillaguamish Pollution Identification and Correction Phase 2 QAPP Page 39 of 65
• Proper sign in/out procedure • General Field Safety • Roadway Safety • Chemical Hygiene • Biological Hazards • Defensive driving • River safety • Heat and Cold stress • Hazard Communications through 24 hour Hazardous Materials Training Field staff members are encouraged to identify potential deficiencies in personal protective equipment (PPE) or unsafe work conditions and report them to the project manager, supervisor or safety office so needs may be addressed. General guidelines that water quality monitoring team members should follow include:
• Sign out and sign in according to SWM procedure. • Carry a cell phone with you at all times. • Check to ensure your PPE (boots, high visibility clothing, eye safety, ear protection,
personal floatation device, gloves etc.) are adequate. • Be aware of rising water levels due to heavy rain. • Always wear high visibility coats or vests when working near the roadway. • Watch out for slippery surfaces, especially while accessing or leaving sample sites. • Wear a personal floatation device while sampling from waters which present a
drowning hazard. • Never enter a confined space, period. • Do not work in the railroad right of way, unless trained and certified to do so and
proper notifications have been made. • Do not touch your hands or sampling equipment to the face or mouth during the
course of the day, and immediately wash your hands after sampling is finished. • Always ask lead staff or a supervisor if there are questions about field or laboratory
safety. In case of an emergency, field personal should call 911 or have injuries treated at the nearest hospital. Two clinics have been identified for the Stillaguamish Watershed in which work will be conducted.
1. Everett Clinic at Stanwood, 7205 265th St NW, Stanwood, WA, 360-629-1500 2. Skagit Regional Clinics-Stanwood, 9631 269th Street NW, Stanwood, WA, 360-
629-1600
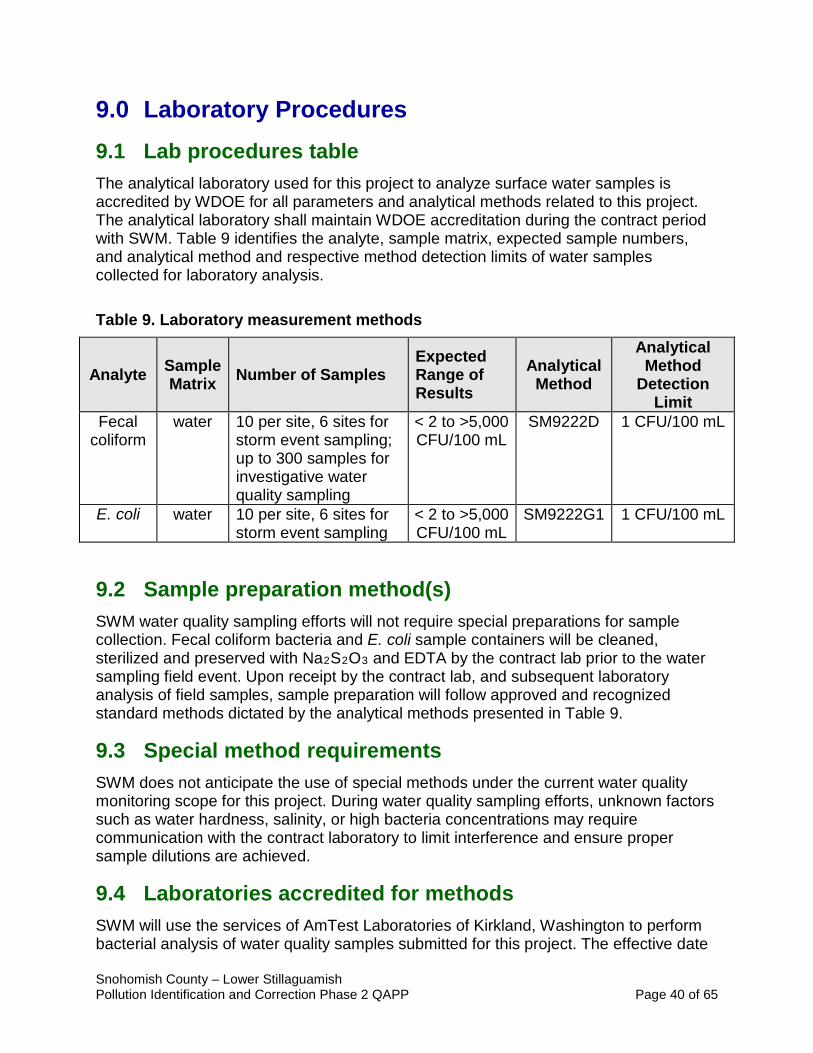
Snohomish County – Lower Stillaguamish Pollution Identification and Correction Phase 2 QAPP Page 40 of 65
9.0 Laboratory Procedures 9.1 Lab procedures table The analytical laboratory used for this project to analyze surface water samples is accredited by WDOE for all parameters and analytical methods related to this project. The analytical laboratory shall maintain WDOE accreditation during the contract period with SWM. Table 9 identifies the analyte, sample matrix, expected sample numbers, and analytical method and respective method detection limits of water samples collected for laboratory analysis. Table 9. Laboratory measurement methods
Analyte Sample Matrix Number of Samples
Expected Range of Results
Analytical Method
Analytical Method
Detection Limit
Fecal coliform
water 10 per site, 6 sites for storm event sampling; up to 300 samples for investigative water quality sampling
< 2 to >5,000 CFU/100 mL
SM9222D 1 CFU/100 mL
E. coli water 10 per site, 6 sites for storm event sampling
< 2 to >5,000 CFU/100 mL
SM9222G1 1 CFU/100 mL
9.2 Sample preparation method(s) SWM water quality sampling efforts will not require special preparations for sample collection. Fecal coliform bacteria and E. coli sample containers will be cleaned, sterilized and preserved with Na2S2O3 and EDTA by the contract lab prior to the water sampling field event. Upon receipt by the contract lab, and subsequent laboratory analysis of field samples, sample preparation will follow approved and recognized standard methods dictated by the analytical methods presented in Table 9.
9.3 Special method requirements SWM does not anticipate the use of special methods under the current water quality monitoring scope for this project. During water quality sampling efforts, unknown factors such as water hardness, salinity, or high bacteria concentrations may require communication with the contract laboratory to limit interference and ensure proper sample dilutions are achieved.
9.4 Laboratories accredited for methods SWM will use the services of AmTest Laboratories of Kirkland, Washington to perform bacterial analysis of water quality samples submitted for this project. The effective date
Snohomish County – Lower Stillaguamish Pollution Identification and Correction Phase 2 QAPP Page 41 of 65
of AmTest scope of accreditation is 7/26/2018 with the scope of accreditation expiring on 7/25/2019. A current copy of the AmTest scope of accreditation is presented in Appendix F.
10.0 Quality Control Procedures Quality assurance/quality control (QA/QC) measures are those activities taken to demonstrate the accuracy (how close to the real result you are) and precision (how reproducible results are) of your monitoring. Quality Control (QC) consists of the steps taken to determine the validity of specific sampling and analytical procedures. Table 10 summarizes lab and field quality control samples. Field Duplicates Field duplicate samples are obtained for 10 percent of collected samples to determine whether the measurement quality objectives of bias, precision, accuracy, and ultimately relative standard deviations are met. Results are analyzed to question homogeneity, precision of sampling procedures or illustrate issues with field technique, equipment contamination or other issues. Stations are chosen randomly for collection of field duplicates. This assures that over time, each station has an equal chance of having duplicate samples obtained. Field duplicates for fecal coliform and E. coli will be taken using side-by-side sampling techniques such that duplicates are gathered at the same time and place. Field duplicates for fecal coliform and E. coli are labeled to ensure each is unique and blind to the laboratory. To partially achieve this, time of sampling is recorded on field sheets, but not on the sample bottle or chain of custody. Field Blanks Field blank samples are used to determine whether lab or field measurements may have been cross-contaminated through sample handling methods. Stations for field blanks are chosen randomly through the same process as that for field duplicates. Samples are produced by transporting ultra-clean de-ionized lab water to the field. Ultra clean water is transferred from a sterile, lab provided container into the appropriate sample container for 10 percent of samples collected. Field blank samples are uniquely labeled. Time of sampling is noted on samples bottles for analysis of fecal coliform and E. coli. Fecal coliform and E.coli Lab Quality Control The contact laboratory for analysis of fecal coliform and E.coli employs quality assurance and quality control guidelines according to APHA (1998) section 9020. Specific analytical quality control procedures for analysis of bacteria samples include the following:
1. Comparison of plate counts – For routine performance evaluation, repeat counts on one or more positive samples are conducted at least monthly and compared
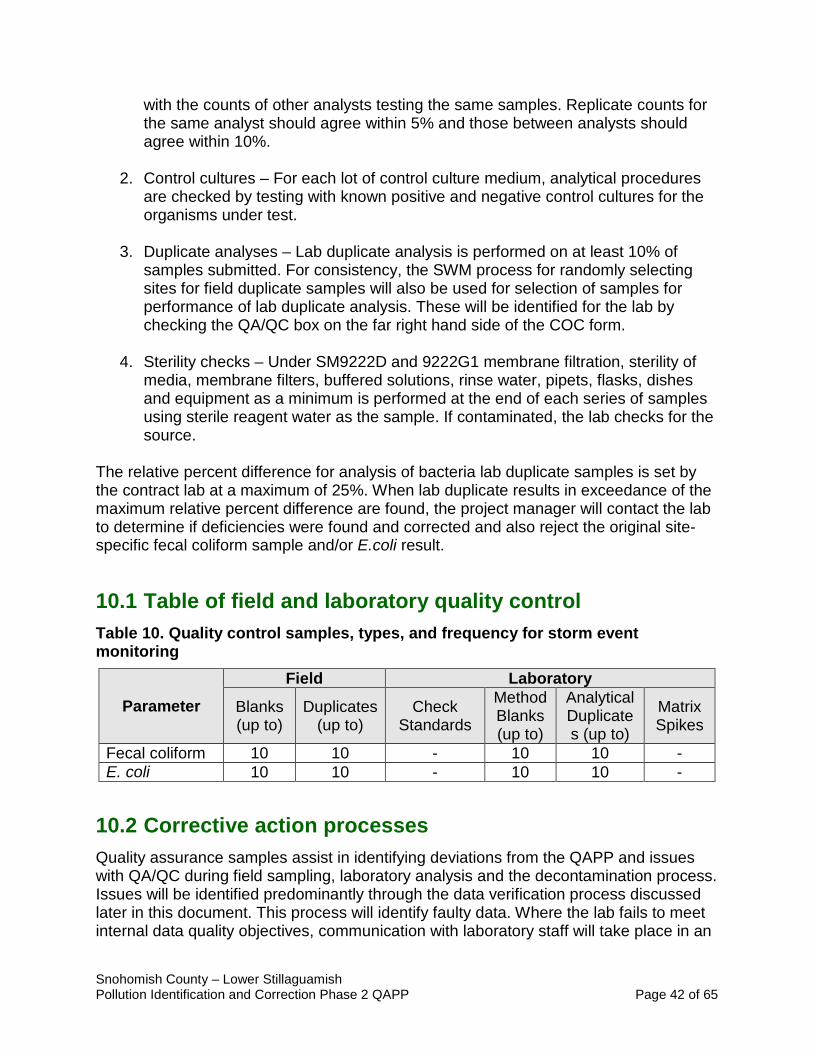
Snohomish County – Lower Stillaguamish Pollution Identification and Correction Phase 2 QAPP Page 42 of 65
with the counts of other analysts testing the same samples. Replicate counts for the same analyst should agree within 5% and those between analysts should agree within 10%.
2. Control cultures – For each lot of control culture medium, analytical procedures
are checked by testing with known positive and negative control cultures for the organisms under test.
3. Duplicate analyses – Lab duplicate analysis is performed on at least 10% of
samples submitted. For consistency, the SWM process for randomly selecting sites for field duplicate samples will also be used for selection of samples for performance of lab duplicate analysis. These will be identified for the lab by checking the QA/QC box on the far right hand side of the COC form.
4. Sterility checks – Under SM9222D and 9222G1 membrane filtration, sterility of
media, membrane filters, buffered solutions, rinse water, pipets, flasks, dishes and equipment as a minimum is performed at the end of each series of samples using sterile reagent water as the sample. If contaminated, the lab checks for the source.
The relative percent difference for analysis of bacteria lab duplicate samples is set by the contract lab at a maximum of 25%. When lab duplicate results in exceedance of the maximum relative percent difference are found, the project manager will contact the lab to determine if deficiencies were found and corrected and also reject the original site-specific fecal coliform sample and/or E.coli result.
10.1 Table of field and laboratory quality control Table 10. Quality control samples, types, and frequency for storm event monitoring
Parameter Field Laboratory
Blanks (up to)
Duplicates (up to)
Check Standards
Method Blanks (up to)
Analytical Duplicates (up to)
Matrix Spikes
Fecal coliform 10 10 - 10 10 - E. coli 10 10 - 10 10 -
10.2 Corrective action processes Quality assurance samples assist in identifying deviations from the QAPP and issues with QA/QC during field sampling, laboratory analysis and the decontamination process. Issues will be identified predominantly through the data verification process discussed later in this document. This process will identify faulty data. Where the lab fails to meet internal data quality objectives, communication with laboratory staff will take place in an
Snohomish County – Lower Stillaguamish Pollution Identification and Correction Phase 2 QAPP Page 43 of 65
attempt to isolate and correct any issues. Should field duplicate or blanks indicate a lack of precision or cleanliness, the field technical lead will conduct an audit of field technique.
11.0 Data Management Procedures 11.1 Data recording and reporting requirements Field observations will be recorded on pre-designed field data sheets and kept in a project folder for reference and archiving. Data will be transferred to data verification spreadsheets for review and correction of errors. Verified laboratory data from targeted storm event sampling will be transposed to EIM spreadsheets for upload, as appropriate. Laboratory data packages are received electronically and in hardcopy format. Hardcopy data packets are reviewed for completeness and payment by the technical lead. Potential errors or omissions will be reported to the responsible lab personnel. Amended or corrected analytical reports will be attached to the original report to ensure continuity of information. Acceptable lab reports will be stored with field data in a project folder for reference and archiving.
11.2 Laboratory data package requirements The contract laboratory and SWM have worked in partnership for over ten years to refine and improve delivery and quality of lab data packets. The project technical lead will evaluate all laboratory data packets for conformance with specific contract requirements. These include, but are not limited to, meeting report turnaround times, signing each COC, noting sample temperatures, and identifying deficiencies in documentation. Many of these checks are also part of the data verification process.
11.3 Electronic transfer requirements Electronic records are copied to data verification spreadsheets for review and correction of errors. Verified lab data is transposed to EIM spreadsheets for upload.
11.4 EIM/STORET data upload procedures SWM has experience in producing datasets for compatibility and upload to EIM. Sample site selection, field datasheet development, data organization, and management are partially dictated by EIM location and result attribute requirements. SWM will begin by populating EIM with study details. Verified laboratory data will be uploaded to EIM on a semi-annual basis by April 1st and October 1st of each year, using the WDOE procedures.
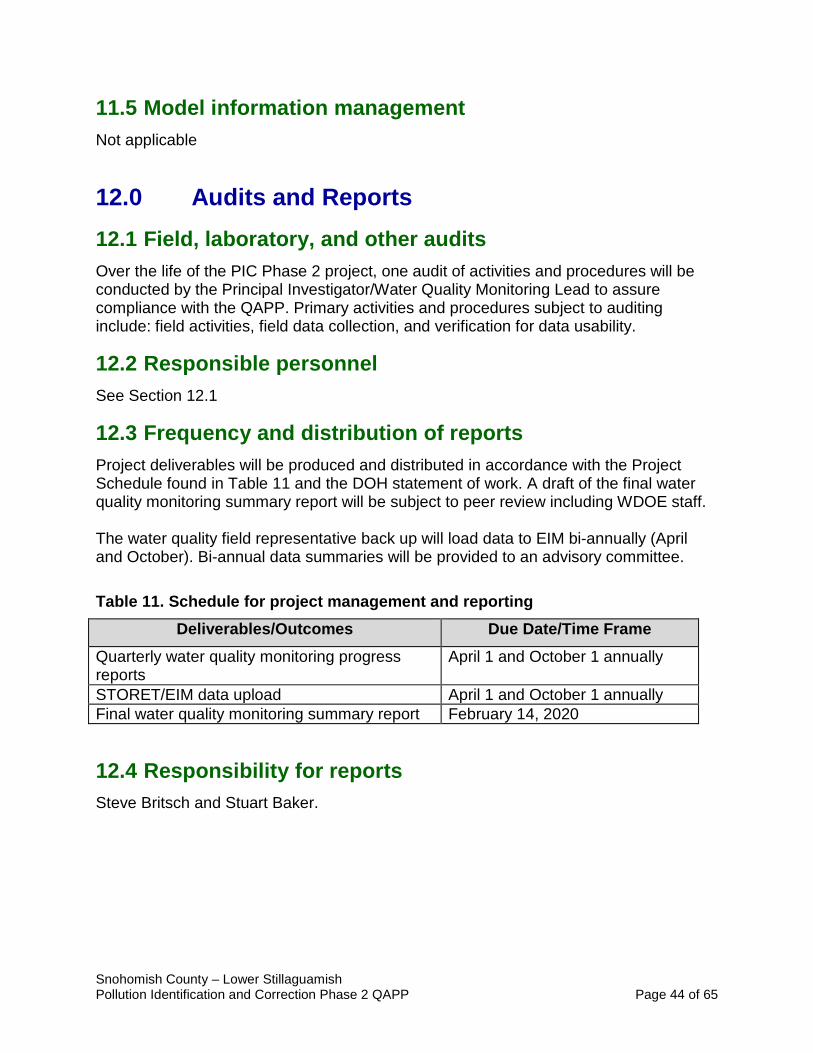
Snohomish County – Lower Stillaguamish Pollution Identification and Correction Phase 2 QAPP Page 44 of 65
11.5 Model information management Not applicable
12.0 Audits and Reports 12.1 Field, laboratory, and other audits Over the life of the PIC Phase 2 project, one audit of activities and procedures will be conducted by the Principal Investigator/Water Quality Monitoring Lead to assure compliance with the QAPP. Primary activities and procedures subject to auditing include: field activities, field data collection, and verification for data usability.
12.2 Responsible personnel See Section 12.1
12.3 Frequency and distribution of reports Project deliverables will be produced and distributed in accordance with the Project Schedule found in Table 11 and the DOH statement of work. A draft of the final water quality monitoring summary report will be subject to peer review including WDOE staff. The water quality field representative back up will load data to EIM bi-annually (April and October). Bi-annual data summaries will be provided to an advisory committee. Table 11. Schedule for project management and reporting
Deliverables/Outcomes Due Date/Time Frame Quarterly water quality monitoring progress reports
April 1 and October 1 annually
STORET/EIM data upload April 1 and October 1 annually Final water quality monitoring summary report February 14, 2020
12.4 Responsibility for reports Steve Britsch and Stuart Baker.
Snohomish County – Lower Stillaguamish Pollution Identification and Correction Phase 2 QAPP Page 45 of 65
13.0 Data Verification Data verification is defined as a detailed examination of results, to ensure that quality assurance criteria have been met. It is the process of evaluating the completeness, correctness, and conformance or compliance of a specific data set against the method, procedural, or contractual requirement.
13.1 Field data verification, requirements, and responsibilities Trained support staff are responsible for data management and verification. The water quality monitoring lead reviews entry of data and verification conducted by support staff. The following steps are taken to verify field sample data for each sample event. A spreadsheet is used to record the verification process and identify non-conformance with established measurement quality objectives. • Duplicate field sample results within acceptable % RSD? • Blank field sample results non-detect? • Hold temperatures met? Verification of field samples will result in qualifying data for usability in accordance with SWM procedures and conformance with EIM requirements. Appendix A contains data qualifiers.
13.2 Laboratory data verification There will be no independent verification of laboratory results. The QA/QC officer at the laboratory will be responsible for verifying laboratory data. However, laboratory quality control results identified below are reviewed and transferred to results and data management sheets. • Sample analyzed in accordance with method identified on Chain of Custody? • Analytical hold times met? • Lab duplicate % RPD met? • Lab method blanks resulted in non-detects?
13.3 Validation requirements, if necessary There will be no independent validation of laboratory results. The QA/QC officer at the laboratory will be responsible for validation laboratory data.
13.4 Model quality assessment Not applicable
Snohomish County – Lower Stillaguamish Pollution Identification and Correction Phase 2 QAPP Page 46 of 65
14.0 Data Quality (Usability) Assessment 14.1 Process for determining project objectives were met On a programmatic level, data quality objectives relative to completeness, adherence to study design, and relative standard deviations are evaluated to determine whether adequate volumes and quality of data have been collected to support objectives. On a sample by sample basis, the process for determining whether measurement quality objectives have been met takes place during data verification and qualification for usability. Targeted storm event sampling data are accepted, estimated or rejected from use. Verification for usability is determined and reviewed by the principal investigator to support analysis, follow-up investigation and upload to EIM.
14.2 Treatment of non-detects Given the parameters to be analyzed – fecal coliform and E. coli – non-detects are highly unlikely. Per WDOE guidance, if non-detects are generated the data will be reported as the method detection limit (1 cfu/100mL) and will receive a data qualifier.
14.3 Data analysis and presentation methods Fecal coliform and E.coli data, verified as usable, will be analyzed throughout the project to determine the percentage of samples which exceed the freshwater quality standard for primary contact recreation. Each site will receive a corresponding MWQA rank for prioritization of investigatory sampling. Additionally, if sufficient volumes of bacteria samples are gathered by season or water year, results will be analyzed per requirements of WAC 173-201A and WDOE Water Quality Policy 1-11 for comparison to freshwater quality standards for primary contact recreation. Presentation of results will be conducted in graphical and map formats.
14.4 Sampling design evaluation The sample design for this study is intended to help identify and eliminate point and non-point sources of bacteria discharging to receiving waters in a rural setting. Targeted stormwater and investigative water quality sampling for bacteria are intended to identify and characterize these discharge types. The design utilizes data gathered during storm-event sampling and drainage system screening to inform follow-up investigations. This framework produces data driven decisions. Often times, the spatial and temporal resolution of sample designs limit the ability to isolate sources. An evaluation of design will be provided in the final report. This includes evaluating whether the qualifying storm event trigger produced an adequate number of samples for decision making and whether access to streams limited the ability to isolate sources.
Snohomish County – Lower Stillaguamish Pollution Identification and Correction Phase 2 QAPP Page 47 of 65
14.5 Documentation of assessment The data usability assessment will be documented in the final report.
15.0 References APHA, 1998. Standard Methods for the Analysis of Water and Wastewater. 20th Edition. American Public Health Assn., Washington, D.C. Britsch, S., S. Baker, and K. Westlund. 2017. Snohomish County Targeted Source Identification and Elimination Procedures. Snohomish County Public Works, Surface Water Management. Everett, WA. https://www.snohomishcountywa.gov/DocumentCenter/View/62081/Snohomish-County-Targeted-Source-Identification-and-Elimination-Procedures Britsch, S. 2015. Snohomish County Quality Assurance Project Plan (QAPP) Snohomish River Tributaries, Stillaguamish River, North, Swamp, and Little Bear Creeks. Snohomish County Public Works, Surface Water Management. Everett, WA. Britsch, S., S. Edwards, S. Hagen, and M. Purser. 2011. Stillaguamish Basin Microbial Water Quality Assessment. Revised. Fecal coliform Data Summary Report. Snohomish County Public Works, Surface Water Management. Everett, WA. Brown, J. and M. Taylor. 2018. Stillaguamish Water Quality Trend Report: The State of the Stillaguamish from 1993 – 2013. Stillaguamish Tribe of Indians. Arlington, WA. Currie, J. 1994. Issue Paper: Mitigating the Effects of Farm Activities on Fish Habitat with References to the Stillaguamish River Basin. Tulalip Tribes. Marysville, WA. EPA. 2006. Data Quality Assessment: A Reviewers Guide. EPA/240/B-06/002. Washington, DC. http://www.epa.gov/quality/qs-docs/g9r-final.pdf Epperson, B. and L. Midla. 2007. Copper Sulfate for Footbaths – Issues and Alternatives. Department of Veterinary Preventative Medicine. Ohio State University. Columbus, OH. Hutchison, J. 2014. Personal communication with Sean Edwards by phone on January 30, 2014. Snohomish Health District, Environmental Health Division, Water and Wastewater Section. Everett, WA. Joy, J. and N. Glenn. 2000. Stillaguamish River Basin Pre-TMDL Assessment. Washington Department of Ecology. Olympia, WA. Joy, J., 2004. Stillaguamish River Watershed Fecal coliform, Dissolved Oxygen, pH, Mercury and Arsenic Total Maximum Daily Load. Washington State Department of

Snohomish County – Lower Stillaguamish Pollution Identification and Correction Phase 2 QAPP Page 48 of 65
Ecology, Bellevue, WA. Publication No. 04-03-017. http://www.ecy.wa.gov/pubs/0403017.pdf Kardouni, J. 2012. Skagit Bay Fecal coliform Bacteria Loading Assessment. Washington State Department of Ecology, Bellevue, WA. Publication No. 12-03-035. https://fortress.wa.gov/ecy/publications/publications/1203035.pdf Lawrence, S. and J. Joy. 2005. Stillaguamish River Watershed Fecal coliform, Dissolved Oxygen, pH, Mercury, and Arsenic Total Maximum Daily Load (Water Cleanup Plan) Submittal Report. Washington Department of Ecology, Water Quality Program. Bellevue, WA. Publication No. 05-10-044. Lombard, S. and C. Kirchmer. 2004 (updated 2016). Guidelines for Preparing Quality Assurance Project Plans for Environmental Studies. Washington State Department of Ecology. Olympia WA. Publication No. 04-03-030. https://fortress.wa.gov/ecy/publications/publications/0403030.pdf Lukes, J. 1987. Water Quality Study of Port Susan October 1986 – March 1987. Washington Department of Social and Health Services, Office of Environmental Health Programs, Shellfish Protection Section. Olympia, WA. Mathieu, N. 2006. Replicate Precision for 12 TMDL Studies and Recommendation for Precision Measurement Quality Objectives for Water Quality Parameters. Washington State Department of Ecology, Bellevue, WA. Publication No 06-03-044. https://fortress.wa.gov/ecy/publications/publications/0603044.pdf McCormick, B. 2009. Warm Beach On-site Sewage System Sanitary Survey. Snohomish Health District, Environmental Health Division, Water and Wastewater Section. Everett, WA. Plemel, K. 1991. Warm Beach Sanitary Survey Report. Centennial Clean Water Grant Final Report to Washington Department of Ecology. Snohomish Health District, Environmental Health Division., Everett, WA. Sargeant, D. 2000. Quality Assurance Project Plan for Dungeness River/Matriotti Creek Fecal coliform Bacteria Total Maximum Daily Load Study. Washington State Department of Ecology, Bellevue, WA. Snohomish County. 1989. Stillaguamish Watershed Action Plan Technical Supplement. Public Works Department, Surface Water Management Division. Everett, WA. Snohomish County. 1990. Stillaguamish Watershed Action Plan. Public Works Department, Surface Water Management Division. Everett, WA.
Snohomish County – Lower Stillaguamish Pollution Identification and Correction Phase 2 QAPP Page 49 of 65
Stienbarger, D. 1995. Inventory and Evaluation of Livestock Operations and the Potential for Non-Point Pollution in the Stillaguamish Clean Water District. Snohomish Conservation District. Svrjcek, R. and S. Lawrence. 2007. Stillaguamish River Fecal coliform, Dissolved Oxygen pH, Mercury, and Temperature Total Maximum Daily Load Water Quality Implementation Plan. Washington Department of Ecology. Olympia, WA. Publication No. 07-10-033. Thornburgh, K. 2001. Glade Bekken Watershed Restoration and Monitoring Project Report Snohomish County. Centennial Clean Water Fund Grant No. G9600292. Everett, WA. Ward, W. and N. Mathieu. 2011 (revised 2017). Standard Operating Procedure for the Collection of Fecal Coliform Bacteria Samples in Surface Water. Washington State Department of Ecology. Olympia, WA. Publication EAP030 Version 2.1.
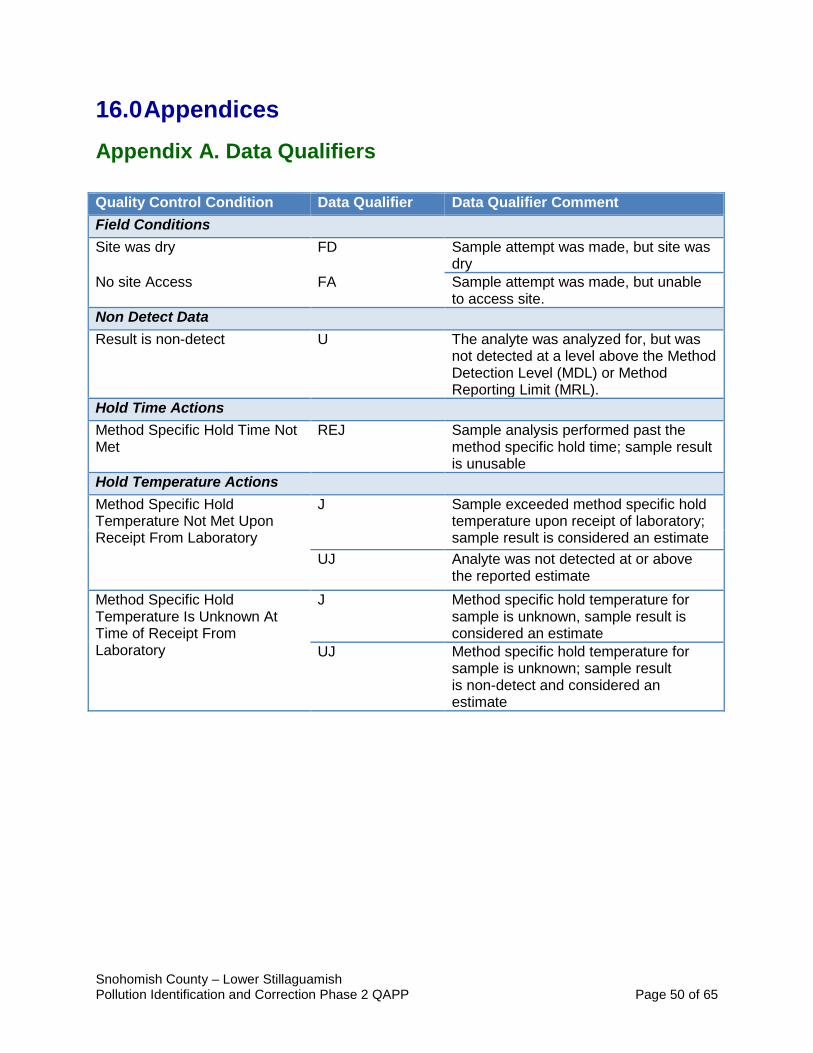
Snohomish County – Lower Stillaguamish Pollution Identification and Correction Phase 2 QAPP Page 50 of 65
16.0 Appendices Appendix A. Data Qualifiers Quality Control Condition Data Qualifier Data Qualifier Comment Field Conditions Site was dry FD Sample attempt was made, but site was
dry No site Access FA Sample attempt was made, but unable
to access site. Non Detect Data Result is non-detect U The analyte was analyzed for, but was
not detected at a level above the Method Detection Level (MDL) or Method Reporting Limit (MRL).
Hold Time Actions Method Specific Hold Time Not Met
REJ Sample analysis performed past the method specific hold time; sample result is unusable
Hold Temperature Actions Method Specific Hold Temperature Not Met Upon Receipt From Laboratory
J Sample exceeded method specific hold temperature upon receipt of laboratory; sample result is considered an estimate
UJ Analyte was not detected at or above the reported estimate
Method Specific Hold Temperature Is Unknown At Time of Receipt From Laboratory
J Method specific hold temperature for sample is unknown, sample result is considered an estimate
UJ Method specific hold temperature for sample is unknown; sample result is non-detect and considered an estimate
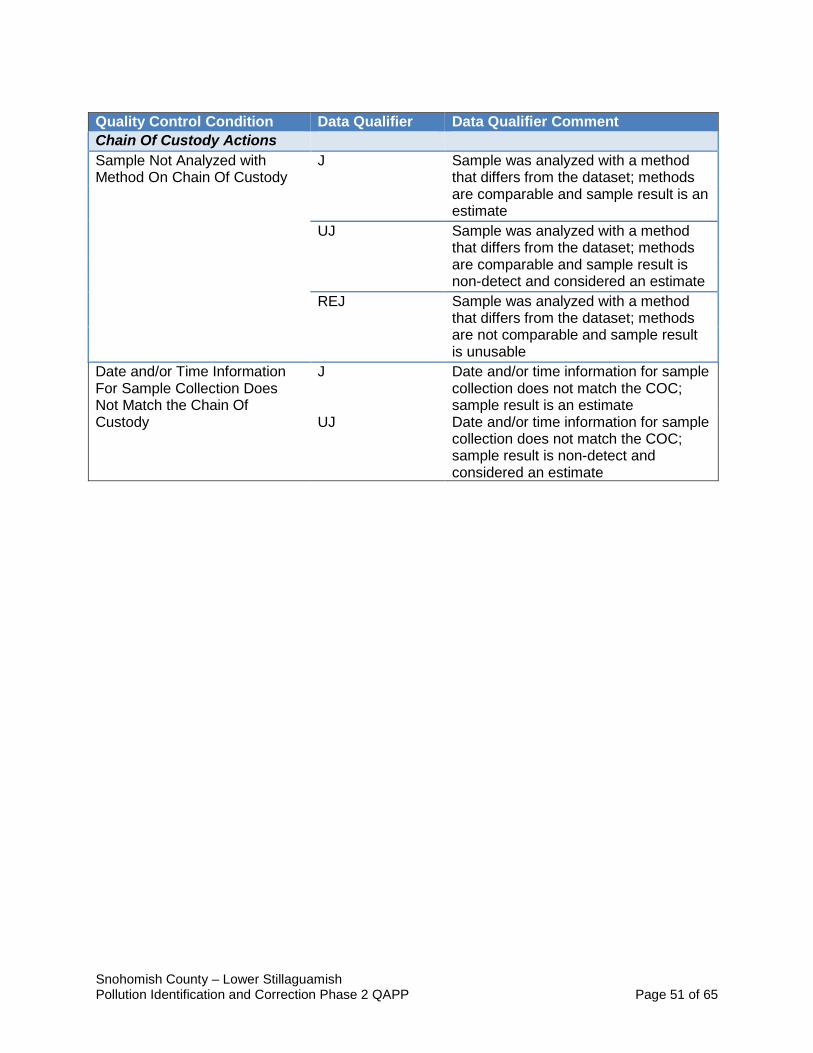
Snohomish County – Lower Stillaguamish Pollution Identification and Correction Phase 2 QAPP Page 51 of 65
Quality Control Condition Data Qualifier Data Qualifier Comment Chain Of Custody Actions Sample Not Analyzed with Method On Chain Of Custody
J Sample was analyzed with a method that differs from the dataset; methods are comparable and sample result is an estimate
UJ Sample was analyzed with a method that differs from the dataset; methods are comparable and sample result is non-detect and considered an estimate
REJ Sample was analyzed with a method that differs from the dataset; methods are not comparable and sample result is unusable
Date and/or Time Information For Sample Collection Does Not Match the Chain Of Custody
J Date and/or time information for sample collection does not match the COC; sample result is an estimate
UJ Date and/or time information for sample collection does not match the COC; sample result is non-detect and considered an estimate
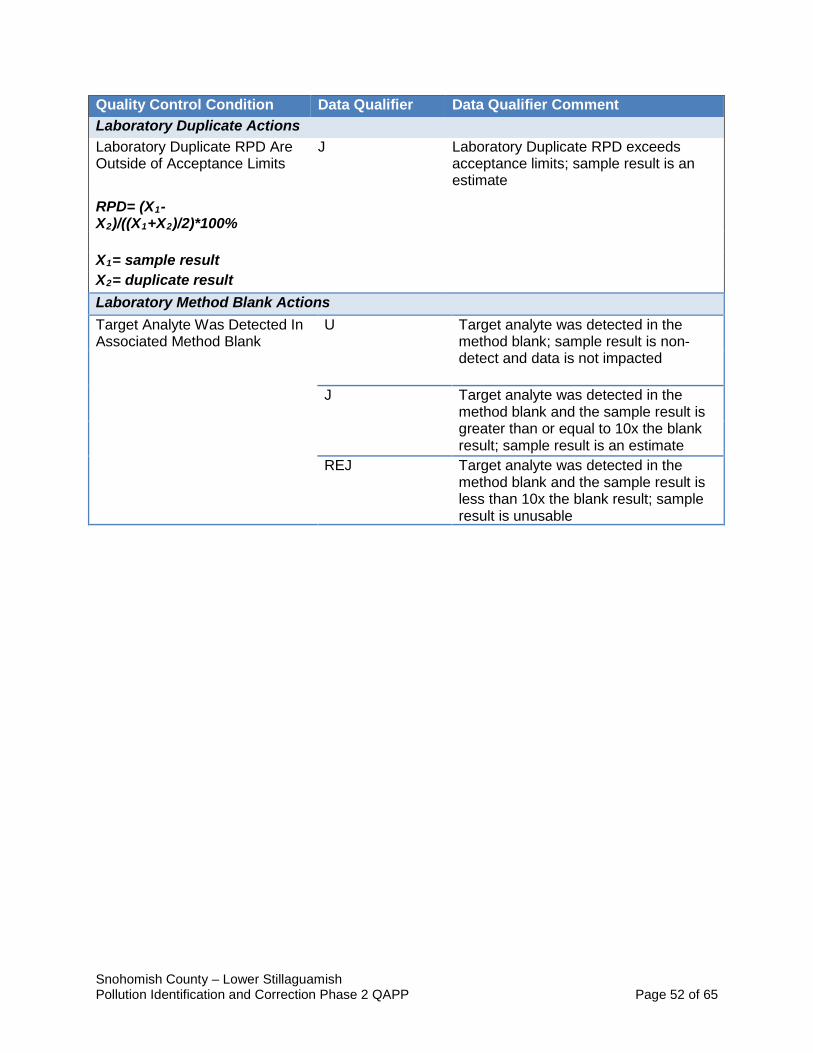
Snohomish County – Lower Stillaguamish Pollution Identification and Correction Phase 2 QAPP Page 52 of 65
Quality Control Condition Data Qualifier Data Qualifier Comment Laboratory Duplicate Actions Laboratory Duplicate RPD Are Outside of Acceptance Limits
J Laboratory Duplicate RPD exceeds acceptance limits; sample result is an estimate
RPD= (X1-X2)/((X1+X2)/2)*100% X1= sample result X2= duplicate result Laboratory Method Blank Actions Target Analyte Was Detected In Associated Method Blank
U Target analyte was detected in the method blank; sample result is non-detect and data is not impacted
J Target analyte was detected in the method blank and the sample result is greater than or equal to 10x the blank result; sample result is an estimate
REJ Target analyte was detected in the method blank and the sample result is less than 10x the blank result; sample result is unusable
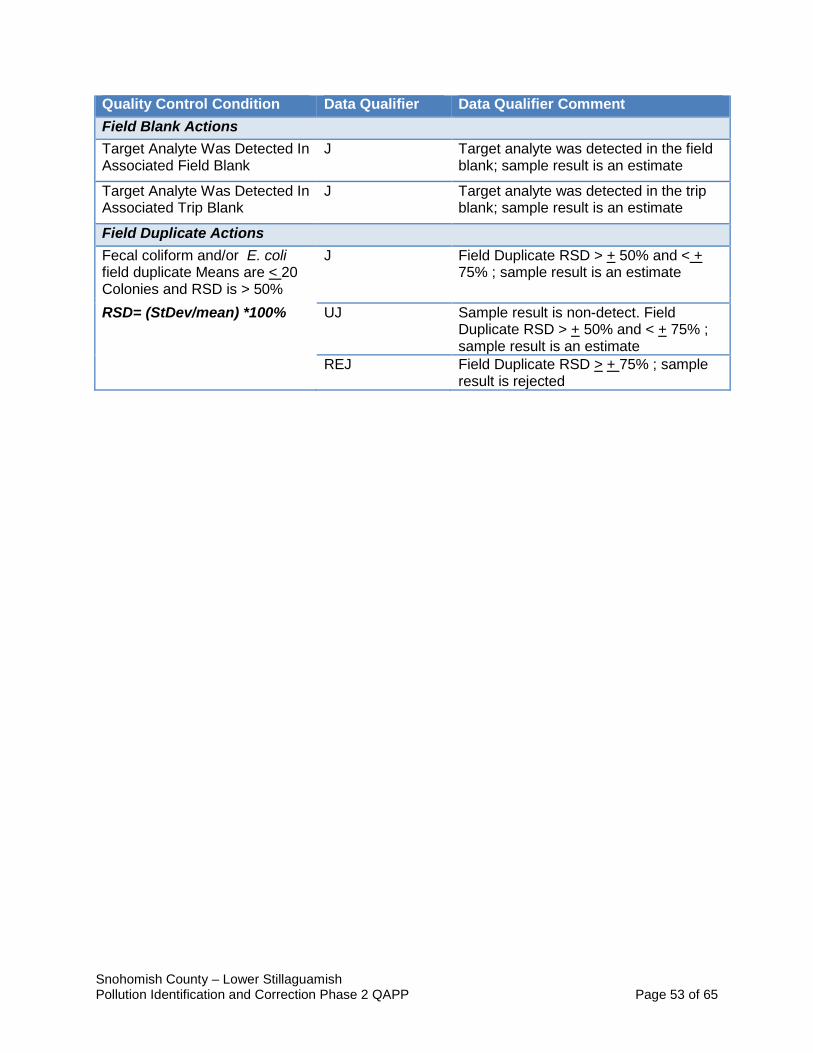
Snohomish County – Lower Stillaguamish Pollution Identification and Correction Phase 2 QAPP Page 53 of 65
Quality Control Condition Data Qualifier Data Qualifier Comment Field Blank Actions Target Analyte Was Detected In Associated Field Blank
J Target analyte was detected in the field blank; sample result is an estimate
Target Analyte Was Detected In Associated Trip Blank
J Target analyte was detected in the trip blank; sample result is an estimate
Field Duplicate Actions Fecal coliform and/or E. coli field duplicate Means are < 20 Colonies and RSD is > 50%
J Field Duplicate RSD > + 50% and < + 75% ; sample result is an estimate
RSD= (StDev/mean) *100% UJ Sample result is non-detect. Field Duplicate RSD > + 50% and < + 75% ; sample result is an estimate
REJ Field Duplicate RSD > + 75% ; sample result is rejected
Snohomish County – Lower Stillaguamish Pollution Identification and Correction Phase 2 QAPP Page 54 of 65
Appendix B. Washington State Department of Ecology Standard Operating Procedure EAP030, Version 2.1 Collection of Fecal Coliform Bacteria Samples in Surface Water https://fortress.wa.gov/ecy/publications/documents/1703204.pdf
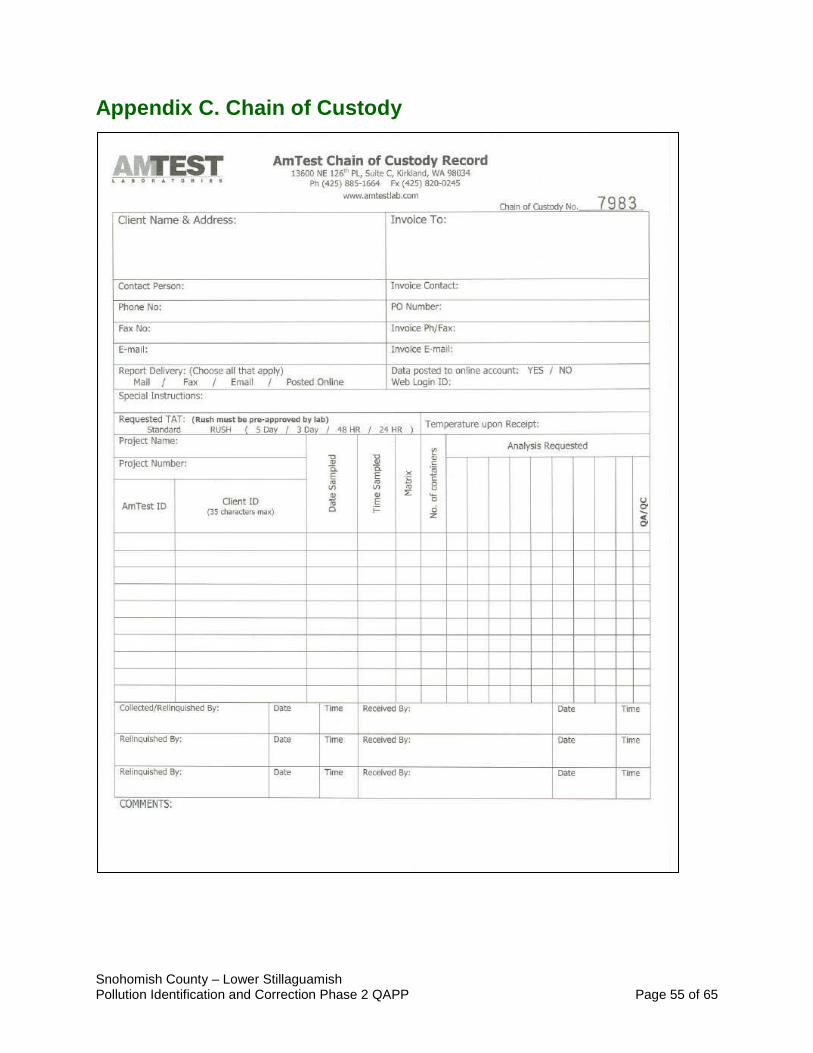
Snohomish County – Lower Stillaguamish Pollution Identification and Correction Phase 2 QAPP Page 55 of 65
Appendix C. Chain of Custody
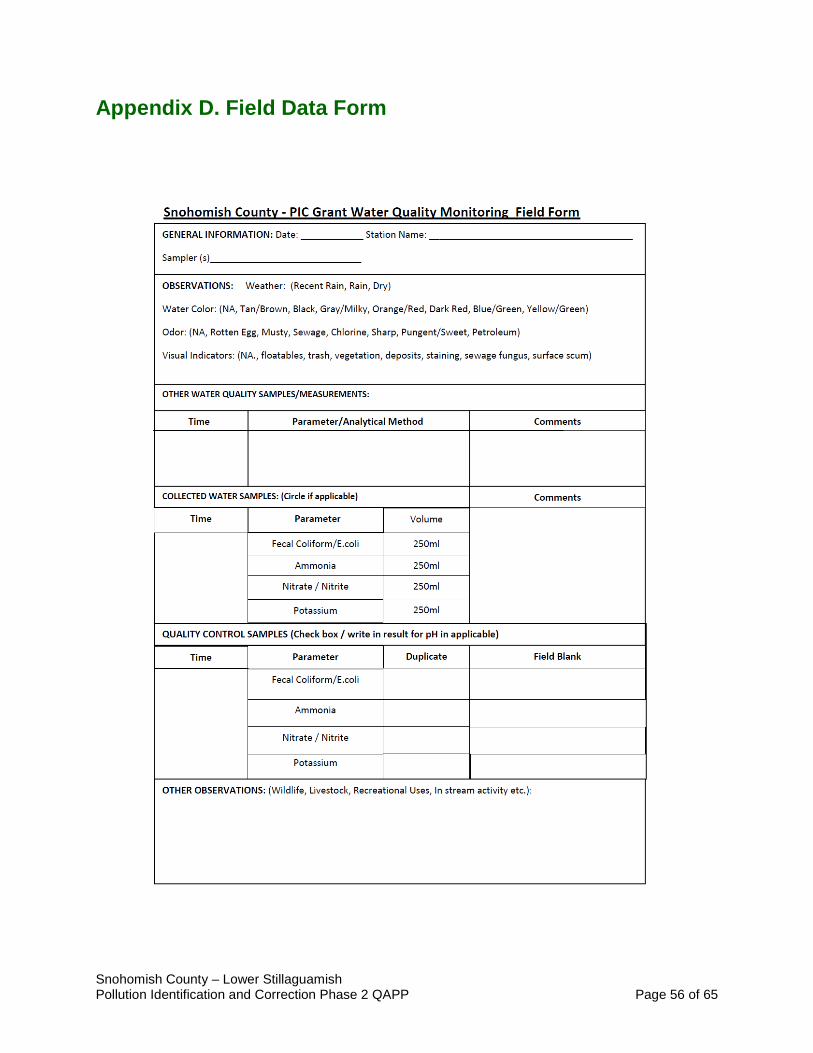
Snohomish County – Lower Stillaguamish Pollution Identification and Correction Phase 2 QAPP Page 56 of 65
Appendix D. Field Data Form
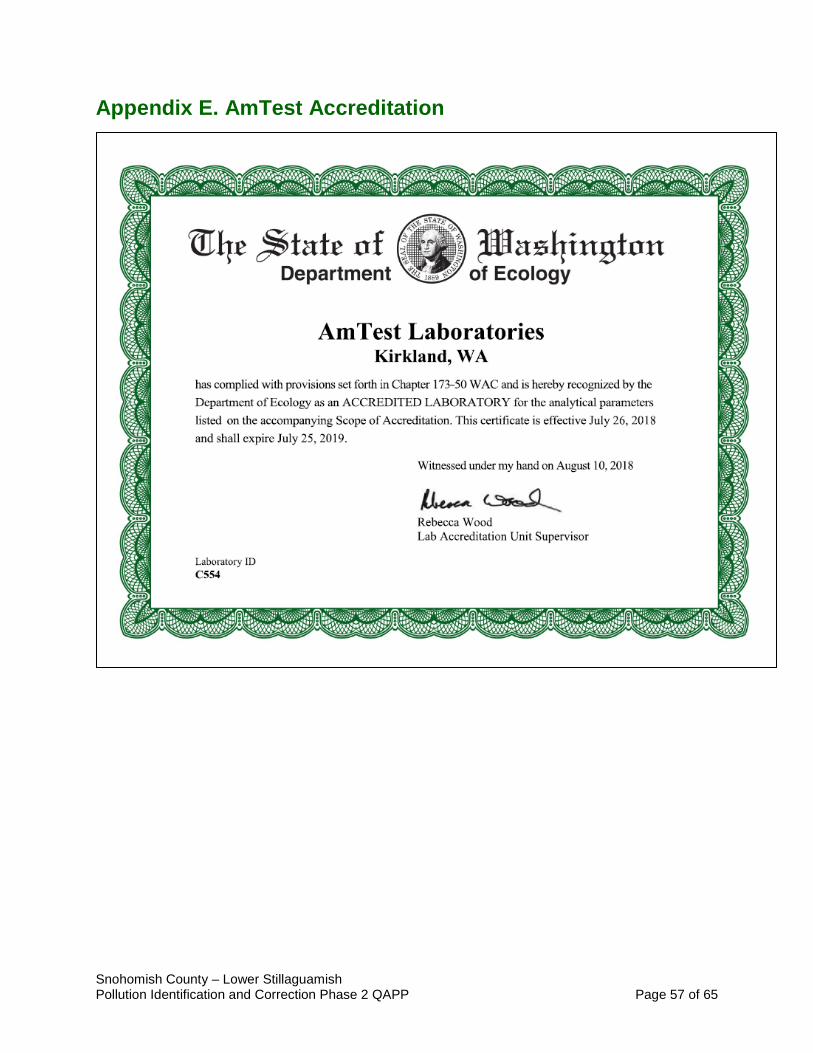
Snohomish County – Lower Stillaguamish Pollution Identification and Correction Phase 2 QAPP Page 57 of 65
Appendix E. AmTest Accreditation
Snohomish County – Lower Stillaguamish Pollution Identification and Correction Phase 2 QAPP Page 58 of 65
Appendix F. Glossary, Acronyms and Abbreviations Quality Assurance Glossary Accreditation: A certification process for laboratories, designed to evaluate and document a lab’s ability to perform analytical methods and produce acceptable data. For Ecology, it is “Formal recognition by [Ecology]…that an environmental laboratory is capable of producing accurate analytical data.” [WAC 173-50-040] (Kammin, 2010) Accuracy: The degree to which a measured value agrees with the true value of the measured property. USEPA recommends that this term not be used, and that the terms precision and bias be used to convey the information associated with the term accuracy. (USGS, 1998) Analyte: An element, ion, compound, or chemical moiety (pH, alkalinity) which is to be determined. The definition can be expanded to include organisms, e. g. fecal coliform, Klebsiella, etc. (Kammin, 2010) Bias: The difference between the population mean and the true value. Bias usually describes a systematic difference reproducible over time, and is characteristic of both the measurement system, and the analyte(s) being measured. Bias is a commonly used data quality indicator (DQI). (Kammin, 2010; Ecology, 2004) Blank: A synthetic sample, free of the analyte(s) of interest. For example, in water analysis, pure water is used for the blank. In chemical analysis, a blank is used to estimate the analytical response to all factors other than the analyte in the sample. In general, blanks are used to assess possible contamination or inadvertent introduction of analyte during various stages of the sampling and analytical process. (USGS, 1998) Comparability: The degree to which different methods, data sets and/or decisions agree or can be represented as similar; a data quality indicator. (USEPA, 1997) Completeness: The amount of valid data obtained from a data collection project compared to the planned amount. Completeness is usually expressed as a percentage. A data quality indicator. (USEPA, 1997) Data Quality Objectives (DQO): Data Quality Objectives are qualitative and quantitative statements derived from systematic planning processes that clarify study objectives, define the appropriate type of data, and specify tolerable levels of potential decision errors that will be used as the basis for establishing the quality and quantity of data needed to support decisions.(USEPA, 2006) Dataset: A grouping of samples, usually organized by date, time and/or analyte. (Kammin, 2010) Data validation: An analyte-specific and sample-specific process that extends the evaluation of data beyond data verification to determine the usability of a specific data
Snohomish County – Lower Stillaguamish Pollution Identification and Correction Phase 2 QAPP Page 59 of 65
set. It involves a detailed examination of the data package, using both professional judgment, and objective criteria, to determine whether the MQOs for precision, bias, and sensitivity have been met. It may also include an assessment of completeness, representativeness, comparability and integrity, as these criteria relate to the usability of the dataset. Ecology considers four key criteria to determine if data validation has actually occurred. These are:
• Use of raw or instrument data for evaluation • Use of third-party assessors • Dataset is complex • Use of EPA Functional Guidelines or equivalent for review
The end result of a formal validation process is a determination of usability that assigns qualifiers to indicate usability status for every measurement result. These qualifiers include:
• No qualifier, data is usable for intended purposes • J (or a J variant), data is estimated, may be usable, may be biased high or low • REJ, data is rejected, cannot be used for intended purposes (Kammin, 2010;
Ecology, 2004) Data verification: Examination of a dataset for errors or omissions, and assessment of the Data Quality Indicators related to that dataset for compliance with acceptance criteria (MQO’s). Verification is a detailed quality review of a dataset. (Ecology, 2004) Decision Quality Objectives: Decision Quality Objectives (DQO’s) at the decision level are used to specify the tolerable limits of making decision errors. Detection limit: The concentration or amount of an analyte which can be determined to a specified level of certainty to be greater than zero. (Ecology, 2004) Duplicate samples: two samples taken from and representative of the same population, and carried through and steps of the sampling and analytical procedures in an identical manner. Duplicate samples are used to assess variability of all method activities including sampling and analysis. (USEPA, 1997) Field blank: A blank used to obtain information on contamination introduced during sample collection, storage, and transport. (Ecology, 2004) Matrix spike: A QC sample prepared by adding a known amount of the target analyte(s) to an aliquot of a sample to check for bias due to interference or matrix effects. (Ecology, 2004) Measurement Quality Objectives(MQOs): Performance or acceptance criteria for individual data quality indicators, usually including precision, bias, sensitivity, completeness, comparability, and representativeness. (USEPA, 2006) Measurement result: A value obtained by performing the procedure described in a method. (Ecology, 2004)
Snohomish County – Lower Stillaguamish Pollution Identification and Correction Phase 2 QAPP Page 60 of 65
Method: A formalized group of procedures and techniques for performing an activity (e.g., sampling, chemical analysis, data analysis), systematically presented in the order in which they are to be executed. (EPA, 1997) Method blank: A blank prepared to represent the sample matrix, prepared and analyzed with a batch of samples. A method blank will contain all reagents used in the preparation of a sample, and the same preparation process is used for the method blank and samples. (Ecology, 2004; Kammin, 2010) Method Detection Limit (MDL): This definition for detection was first formally advanced in 40CFR 136, October 26, 1984 edition. MDL is defined there as the minimum concentration of an analyte that, in a given matrix and with a specific method, has a 99% probability of being identified, and reported to be greater than zero. (Federal Register, October 26, 1984) Percent Relative Standard Deviation (%RSD): A statistic used to evaluate precision in environmental analysis. It is determined in the following manner: Percent relative standard deviation, %RSD = (100 * s)/x where s = sample standard deviation, and x = sample mean (Kammin, 2010) Parameter: A specified characteristic of a population or sample. Also, an analyte or grouping of analytes. Benzene, nitrate+nitrite, and anions are all “parameters”. (Kammin, 2010; Ecology, 2004) Population: The hypothetical set of all possible observations of the type being investigated. (Ecology, 2004) Precision: The extent of random variability among replicate measurements of the same property; a data quality indicator. (USGS, 1998) Quality Assurance (QA): A set of activities designed to establish and document the reliability and usability of measurement data. (Kammin, 2010) Quality Assurance Project Plan (QAPP): A document that describes the objectives of a project, and the processes and activities necessary to develop data that will support those objectives. (Kammin, 2010; Ecology, 2004) Quality Control (QC): The routine application of measurement and statistical procedures to assess the accuracy of measurement data. (Ecology, 2004) Relative Percent Difference (RPD): RPD is commonly used to evaluate precision. The following formula is used: Abs(a-b)/((a+b)/2) * 100 Where a and b are 2 sample results, and abs() indicates absolute value RPD can be used only with 2 values. More values, use %RSD.

Snohomish County – Lower Stillaguamish Pollution Identification and Correction Phase 2 QAPP Page 61 of 65
(Ecology, 2004) Replicate samples: Two or more samples taken from the environment at the same time and place, using the same protocols. Replicates are used to estimate the random variability of the material sampled. (USGS, 1998) Representativeness: The degree to which a sample reflects the population from which it is taken; a data quality indicator. (USGS, 1998) Sample (field): A portion of a population (environmental entity) that is measured and assumed to represent the entire population. (USGS, 1998) Sample (statistical): A finite part or subset of a statistical population. (USEPA, 1997) Sensitivity: In general, denotes the rate at which the analytical response (e.g., absorbance, volume, meter reading) varies with the concentration of the parameter being determined. In a specialized sense, it has the same meaning as the detection limit. (Ecology, 2004) Spiked blank: A specified amount of reagent blank fortified with a known mass of the target analyte(s); usually used to assess the recovery efficiency of the method. (USEPA, 1997) Standard Operating Procedure (SOP): A document which describes in detail a reproducible and repeatable organized activity. (Kammin, 2010)
Snohomish County – Lower Stillaguamish Pollution Identification and Correction Phase 2 QAPP Page 62 of 65
Glossary – General Terms 303(d) list: Section 303(d) of the federal Clean Water Act requires Washington State to periodically prepare a list of all surface waters in the state for which beneficial uses of the water – such as for drinking, recreation, aquatic habitat, and industrial use – are impaired by pollutants. These are water quality-limited estuaries, lakes, and streams that fall short of state surface water quality standard, and are not expected to improve within the next two years.
Ambient: Background or away from point sources of contamination.
Bracket Sample: A sample design used to isolate potential sources through targeted sampling up and downstream of a suspected source.
Clean Water Act: A federal act passed in 1972 that contains provisions to restore and maintain the quality of the nation’s waters. Section 303(d) of the Clean Water Act establishes the TMDL program.
Escherichia coli (E. coli): A large and diverse group of bacteria. Most E. coli are harmless and are integral for a healthy intestinal tract. However, some E. coli may cause illness (e.g., diarrhea, urinary tract infections, and respiratory illness). Similar to fecal coliform (see below), E. coli can be used as an ‘indicator’ in water quality samples to indicate the presence of contaminates (e.g., human and animal waste). Concentrations are measured in colony forming units per 100 milliliters of water (CFU/100 mL).
Eutrophic: Nutrient rich and high in productivity resulting from human activities such as fertilizer runoff and leaky septic systems.
Fecal coliform: That portion of the coliform group of bacteria which is present in intestinal tracts and feces of warm-blooded animals as detected by the product of acid or gas from lactose in a suitable culture medium within 24 hours at 44.5 plus or minus 0.2 degrees Celsius. Fecal coliform are “indicator” organisms that suggest the possible presence of disease-causing organisms. Concentrations are measured in colony forming units per 100 milliliters of water (CFU/100 mL).
Geometric mean: A mathematical expression of the central tendency (an average) of multiple sample values. A geometric mean, unlike an arithmetic mean, tends to dampen the effect of very high or low values, which might bias the mean if a straight average (arithmetic mean) were calculated. This is helpful when analyzing bacteria concentrations, because levels may vary anywhere from 10 to 10,000 fold over a given period. The calculation is performed by either: (1) taking the nth root of a product of n factors, or (2) taking the antilogarithm of the arithmetic mean of the logarithms of the individual values.
National Pollutant Discharge Elimination System (NPDES): National program for issuing, modifying, revoking and reissuing, terminating, monitoring, and enforcing permits, and imposing and enforcing pretreatment requirements under the Clean Water
Snohomish County – Lower Stillaguamish Pollution Identification and Correction Phase 2 QAPP Page 63 of 65
Act. The NPDES program regulates discharges from wastewater treatment plants, large factories, and other facilities that use, process, and discharge water back into lakes, streams, rivers, bays, and oceans.
Nonpoint source: Pollution that enters any waters of the state from any dispersed land-based or water-based activities. This includes, but is not limited to, atmospheric deposition, surface-water runoff from agricultural lands, urban areas, or forest lands, subsurface or underground sources, or discharges from boats or marine vessels not otherwise regulated under the NPDES program. Generally, any unconfined and diffuse source of contamination is considered a nonpoint source. Legally, any source of water pollution that does not meet the legal definition of “point source” in section 502(14) of the Clean Water Act is a nonpoint source.
Nutrient: Substance such as carbon, nitrogen, and phosphorus used by organisms to live and grow. Too many nutrients in the water can promote algal blooms and rob the water of oxygen vital to aquatic organisms.
Parameter: A physical chemical or biological property whose values determine environmental characteristics or behavior.
Pathogen: Disease-causing microorganisms such as bacteria, protozoa, viruses.
Point source: Sources of pollution that discharge at a specific location from pipes, outfalls, and conveyance channels to a surface water. Examples of point source discharges include municipal wastewater treatment plants, municipal stormwater systems, industrial waste treatment facilities, and construction sites that clear more than 5 acres of land.
Pollution: Such contamination, or other alteration of the physical, chemical, or biological properties, of any waters of the state. This includes change in temperature, taste, color, turbidity, or odor of the waters. It also includes discharge of any liquid, gaseous, solid, radioactive, or other substance into any waters of the state. This definition assumes that these changes will, or are likely to, create a nuisance or render such waters harmful, detrimental, or injurious to: (1) public health, safety, or welfare, or (2) domestic, commercial, industrial, agricultural, recreational, or other legitimate beneficial uses, or (3) livestock, wild animals, birds, fish, or other aquatic life.
Reach: A specific portion or segment of a stream.
Riparian: Relating to the banks along a natural course of water.
Salmonid: Any fish that belong to the family Salmonidae. Any species of salmon, trout, or char is considered a salmonid http://www.fws.gov/le/ImpExp/FactSheetSalmonids.htm.
Stormwater: The portion of precipitation that does not naturally percolate into the ground or evaporate but instead runs off roads, pavement, and roofs during rainfall or

Snohomish County – Lower Stillaguamish Pollution Identification and Correction Phase 2 QAPP Page 64 of 65
snow melt. Stormwater can also come from hard or saturated grass surfaces such as lawns, pastures, playfields, and from gravel roads and parking lots.
Streamflow: Discharge of water in a surface stream (river or creek).
Sub-basin: A geological basin formed within or as part of another drainage basin or watershed.
Surface waters of the state: Lakes, rivers, ponds, streams, inland waters, salt waters, wetlands and all other surface waters and water courses within the jurisdiction of Washington State.
Total Maximum Daily Load (TMDL): A distribution of a substance in a waterbody designed to protect it from not meeting (exceeding) water quality standards. A TMDL is equal to the sum of all of the following: (1) individual wasteload allocations for point sources, (2) the load allocations for nonpoint sources, (3) the contribution of natural sources, and (4) a margin of safety to allow for uncertainty in the wasteload determination. A reserve for future growth is also generally provided.
Watershed: A drainage area or basin in which all land and water areas drain or flow toward a central collector such as a stream, river, or lake at a lower elevation.
Snohomish County – Lower Stillaguamish Pollution Identification and Correction Phase 2 QAPP Page 65 of 65
Acronyms and Abbreviations Following are acronyms and abbreviations used frequently in this report. BMP Best management practice EIM Environmental Information Management database EPA U.S. Environmental Protection Agency ERTS Environmental Reporting and Tracking System GIS Geographic Information System software GPS Global Positioning System MQO Measurement quality objective NPDES National Pollution Discharge Elimination System PPE Personal protective equipment PIC Pollution identification and correction QA Quality assurance QC Quality control RPD Relative percent difference RSD Relative standard deviation SCD Snohomish Conservation District SFCD Stillaguamish Flood Control District SHD Snohomish Health District SOP Standard operating procedures SWM Snohomish County Public Works, Surface Water Management TMDL Total Maximum Daily Load WAC Washington Administrative Code WDOE Washington State Department of Ecology DOH Washington State Department of Health WRIA Water Resources Inventory Area WSDA Washington State Department of Agriculture Units of Measurement CFU/100 mL Colony-forming units per 100 milliliters mg/L milligrams per liter (parts per million) mL milliliter