lrac good ppt gp
TRANSCRIPT

Professor & Lawyer. Puttu Guru Prasad ,
M.Com. M.B.A., L.L.B., M.Phil. PGDFTM, APSET. ICFAI TMF, (PhD) at JNTU K,
Long-Run Average Cost Curves (LAC) Long-run- all factors are become variable. Long-run cost curve is a planning curve because it is a
guide to the entrepreneur to plan his output. Long-run average cost is derived from short-run cost
curves. LAC curve is the locus of points denoting the least cost of
producing the corresponding output. It is a planning curve because on the basis of this curve the
firm decides what plant to set up in order to produce optimally.

• In the long-run, the firm can choose among different possible sizes of plant as determined by short run average cost curves such as SAC1, SAC 2 and SAC3.
• The LAC-curve is U-shaped and it is often called the ‘envelope curve’ because it ‘envelopes’ the SRC curve
• LAC curve is also called ‘envelope curve’.• Each point on LAC curve represents the least unit
cost for producing the corresponding level of output.

The long-run marginal cost (LRMC) is derived from the short-rum marginal cost (SRMC) curves.
LRMC is formed from points of intersection of the SRMC curves with vertical lines drawn from the points of tangency of the corresponding SAC-curves and the LRA cost curve.
The LMC must be equal to the SMC for the output at which the corresponding SAC is tangent to the LAC.

Cost-profit -volume Cost theory has implications for managerial decisions
regarding output (volume) and prices. It helps for profit contribution analysis or break even analysis The difference between price and average variable cost (P-
AVC) is defined as profit contribution. Revenue on the sale of a unit of output after variable costs
are covered represents profit. At low rates of output, the firm may be losing money because
fixed costs have not yet been covered by the profit contribution ----Thus at low rates of output, profit contribution is used to cover fixed costs
After fixed costs are covered, the firm will be earning a profit

Let us Assume: A manager want to know the output rate necessary to cover all
fixed costs and to earn a “required” profit of π R . Assume that both price and variable cost per unit of output (AVC)
are constant. Then, profit (π R) is equal to total revenue (P.Q) less the sum of
total variable costs (Q.AVC) and fixed costs.i.e., π R = PQ – [(Q.AVC) + FC]
Solving this equation for Q yields a relation that can be used to determine the rate of output necessary to generate a specified rate of profit.
i.e., Q = FC + π R P – AVC
Example: Suppose that FC = Rs.10, 000, P = Rs. 20, AVC = Rs.15, and the firm has set a required profit target of Rs.20, 000. To generate this profit, an output rate of 6,000 units is required, that is,
QR = Rs. 10, 000+ Rs. 20, 000 = 6, 000 20 – 15
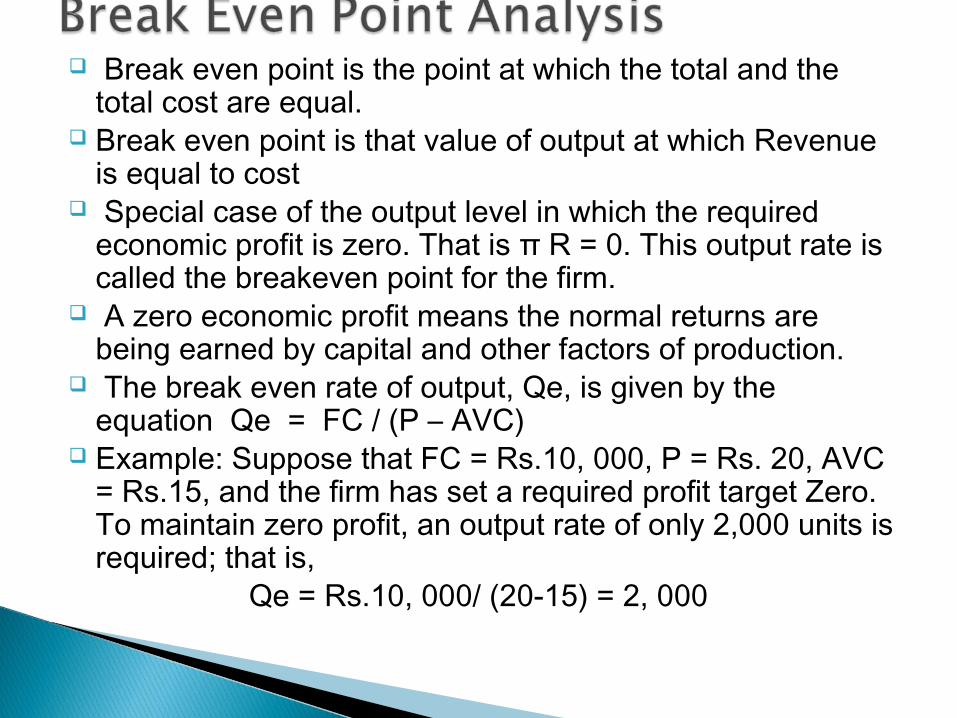
Break even point is the point at which the total and the total cost are equal.
Break even point is that value of output at which Revenue is equal to cost
Special case of the output level in which the required economic profit is zero. That is π R = 0. This output rate is called the breakeven point for the firm.
A zero economic profit means the normal returns are being earned by capital and other factors of production.
The break even rate of output, Qe, is given by the equation Qe = FC / (P – AVC)
Example: Suppose that FC = Rs.10, 000, P = Rs. 20, AVC = Rs.15, and the firm has set a required profit target Zero. To maintain zero profit, an output rate of only 2,000 units is required; that is,
Qe = Rs.10, 000/ (20-15) = 2, 000
Economies of scale are said to exist when in the long run (all factors of production are variable) costs fall as output increases.
This is due to firms expanding in size and output, which causes the long run average costs to fall.
These economies of scale are experienced as the business expands until a point is reached where average costs are constant as output increases.
After this point if the business expands anymore, it is likely to experience diseconomies of scale and decreasing returns to scale will set in.

Financial Economies: A larger firm is likely to borrow money at low rate of interest and this may result in the lower cost of production.
Technical economies: The advantages accrued from a sophisticated technology.
Managerial economies: The management is unlikely expand in proportion to the increase in output. Therefore, the average managerial cost of production of output declines with increase in total output.
Marketing economies: The marketing personnel of the firm and other arrangement of marketing are likely to become more efficient with the increase in the scale of marketing and it may result in the lower cost of marketing per unit of output.
Lower Input Prices: When the firm increases its scale of operation, the demand for inputs also rises. Then the firm may enter in to a contract with supplier and this may result in the lower cost of inputs.
If the business expands anymore, even after the average cost starts increasing, it is likely to experience diseconomies if scale and decreasing returns to scale will set in.
The rising part of the long run average cost curve is attributed to the diseconomies of scale.
When a point is reached where the abilities of the fixed and indivisible entrepreneur are best utilised, further increases in the scale of operations cause increases in the cost per unit of output.
Diseconomies of scale are the disadvantages generated by a firm after a particular period of operation due to increasing average cost.
If a firm has excess capacity, that can be used to produce other products with little or no increase in its capital costs.
Eg: a firm reconfigured its passenger planes each night by removing seats in order to haul packages and freight.
Firms taking advantage of their unique skills or comparative advantage in marketing to develop products that are complementary with the firm’s existing products or that would simply be logical items for the firm’s sales staff to sell on their regular calls on retail stores.
Eg: Proctor and Gamble, a large household-products firm, sells all kinds of cleaning products, not just one or two. Some times these products are complements (eg., laundry detergent, bleach and fabric softeners), where as other products are specialised substitues.

Suppose a firm can produce both stationary and notebook paper. i.e, QA and QB
The cost is: Rs.50,000 per 1,000 reams of stationary paperRs.30,000 per 1,000 reams of note book paper However, 1,000 reams of each type of paper can be
produced for a total of Rs. 70,000 if both are produced together.
Economies of scope=TC(QA)+TC(QB)-TC(QA,QB)/TC(QA,QB) From the data S = (50,000+30,000 - 70,000)/ 70,000 = 0.14
There is 14 per cent reduction in total costs associated with producing both products instead of just one.