lse research onlineeprints.lse.ac.uk/188/1/private_investment.pdf · recent research has...
TRANSCRIPT

LSE Research Online Article (refereed)
David Stasavage
Private investment and political institutions
Originally published in Economics and politics, 14 (1). pp. 41-63 © 2002 Blackwell Publishing. You may cite this version as: Stasavage, David (2002). Private investment and political institutions [online]. London: LSE Research Online. Available at: http://eprints.lse.ac.uk/archive/00000188 Available online: March 2005 LSE has developed LSE Research Online so that users may access research output of the School. Copyright © and Moral Rights for the papers on this site are retained by the individual authors and/or other copyright owners. Users may download and/or print one copy of any article(s) in LSE Research Online to facilitate their private study or for non-commercial research. You may not engage in further distribution of the material or use it for any profit-making activities or any commercial gain. You may freely distribute the URL (http://eprints.lse.ac.uk) of the LSE Research Online website. This document is the author’s final manuscript version of the journal article, incorporating any revisions agreed during the peer review process. Some differences between this version and the publisher’s version remain. You are advised to consult the publisher’s version if you wish to cite from it.
http://eprints.lse.ac.uk Contact LSE Research Online at: [email protected]

Private Investment and Political Institutions
forthcoming: Economics and Politics, March 2002
David Stasavage*
London School of Economics
Recent research has demonstrated a negative link between macroeconomic and
political uncertainty and levels of private investment across countries. This raises the
question whether certain types of government institutions might help reduce this
uncertainty. North and Weingast (1989) propose that political institutions characterized
by checks and balances can have beneficial effects on investment by allowing
governments to credibly commit not to engage in ex post opportunism with respect to
investors. In this paper I develop and test a modified version of their hypothesis,
suggesting that checks and balances, on average, improve possibilities for commitment,
but that they are not a necessary condition for doing so. Results of heteroskedastic
regression and quantile regression estimates strongly support this proposition.
* [email protected], London School of Economics, Houghton St., London WC2A 2AE, UK. I would like to thank Chris Adam, Dino Falaschetti, Witold Henisz, Phil Keefer, Ken Scheve, seminar participants at Oxford and the LSE, and two anonymous referees for useful comments on this paper. The research for this paper was funded by the Department for International Development (UK).

1
1. Introduction
There has been increasing recognition in recent years that the irreversibility of
many forms of private investment creates a credibility problem for governments. If a
firm fears that a government will have an incentive to make ex post changes in taxes or
regulations, it may prefer to delay or cancel a proposed project. Both sides would be
better off if a government could somehow commit not to acting opportunistically. This
finding has major implications for developing countries, where investors may be
particularly wary of the potential for radical swings in economic policy. One possibility
proposed in a seminal article by North and Weingast (1989) is that political institutions
characterized by checks and balances can allow governments to credibly commit.
In this paper I argue in favor of a modified version of the North and Weingast
hypothesis. While increasing the level of checks and balances in a country can increase
policy stability, existing theory also shows how governments without checks and balances
may establish credibility through a more simple mechanism; if investors are convinced
that there is little danger of opportunism, because a policy maker's own political
supporters would suffer a loss from actions such as surprise increases in capital taxes.
This suggests that governments in political systems with high checks and balances will,
on average, find it easier to credibly commit, but we should also expect to see greater
variability in levels of private investment within the set of observations where checks and
balances are low. Ultimately, this prediction of greater variability in countries with few
checks and balances reflects our absence of full information about the variation in
preferences of policy makers across countries and over time. To illustrate why this
should be the case, I draw on a simple political model of capital taxation developed by
Persson and Tabellini (1994).

2
A further innovation of this paper is its use of new data which is specifically
designed to measure the extent of checks and balances in a country's political system
(collected by Beck et al., 1999 and Henisz, 2000). In contrast with measures of
democracy, such as the Gastil index, these two indicators are constructed according to a
pre-specified and publicly available methodology. The other advantage of this new data
is that it allows testing a more refined set of hypotheses. Rather than referring to the
overall level of "democracy", the indicator I use is designed to measure something more
specific: the extent to which a country's political institutions are characterized by checks
and balances in government. This new data also allows more exact testing of political
hypotheses than does data provided by risk assessment services such as BERI, ICRG, or
the Economist Intelligence Unit. These latter measures have been useful for establishing
links between poor protection of property rights and poor economic performance, but
because they measure policy outcomes, they give us less sense of what real world political
institutions are associated with better protection of property rights.
My findings are consistent with the above propositions. Using a data set on
private investment in 74 developing countries and an index of political checks and
balances developed by Beck et al. (1999), I estimate that the average long-run effect of
moving from an authoritarian system to a political system where executive and legislature
are controlled by separate parties would be an increase of 16% in private investment.
Heteroskedastic regression estimates also suggest that within the group of countries with
the latter set political institutions, the conditional variance of private investment is 9%
lower than in the purely authoritarian systems. Using an index of political checks and
balances developed by Henisz (2000) I estimate that a similar change in political
institutions would also result in an 16% increase in average private investment, and that
the conditional variance is 17% lower within the group of countries with checks and
balances. Quantile regression results are also consistent with these findings. The pattern

3
identified supports the proposition that checks and balances can improve credibility, but
that they are not a necessary condition for doing so.
The remainder of this paper is organized as follows. Section 2 reviews the
theoretical link between political institutions, uncertainty, and private investment.
Section 3 presents the data. Sections 4 and 5 then conduct tests to examine the
relationship between political checks and balances, levels of private investment and the
variance of private investment within different groups of countries. Section 6 discusses
robustness issues, and section 7 concludes.
2. Political institutions and private investment
Investment and uncertainty
Before considering how political checks and balances might reduce uncertainty,
with knock-on effects of private investment, it is first worth reviewing the economic
literature on investment and uncertainty. This shows that predictions about the sign of
the uncertainty-investment link depend heavily on what assumptions go into one's model.
If one assumes perfect competition, costless adjustment of factors other than capital, and
constant returns to scale, then uncertainty actually raises the expected profitability of
capital and therefore should lead to higher investment. More recent work shows that
when one assumes that investments are irreversible, firms can be prompted to delay or
forego investments out of the fear that the economic environment might change for the
worse. Irreversibility implies that downward adjustments in capital stock are more
difficult to make than are upward adjustments.1
The cross-country empirical literature on determinants of private investment
provides support for the claim that higher macroeconomic uncertainty is associated with

4
lower levels of private investment. While most of these studies are limited by the fact
that they use only cross-sectional data, Serven and Solimano (1993) and Serven (1998,
1997) have estimated investment equations using panel data, finding significant support
for the claim that there is a negative investment-uncertainty link. Serven (1998) is the
most complete of these studies, using a data set covering a large group of developing
countries over 26 years (1970-1995).
Political institutions and policy credibility
While existing work demonstrates that private investment is influenced by
macroeconomic uncertainty, it would also be useful to consider how political conditions
might affect perceived risks of opportunism for investors. As mentioned, irreversible
investments may be subject to a credibility problem whereby a government has an
incentive to change taxes or regulations ex post with the knowledge that investors cannot
easily withdraw. One way of illustrating this is with the well known time-consistency
problem in capital taxation. Given that capital investment decisions often involve a high
degree of irreversibility, governments can face incentives to raise capital taxes ex post. To
the extent that owners of capital anticipate this possibility, they will refrain from investing
and in equilibrium both the government and investor will be worse off.
One proposed solution to the above problem is to adopt political institutions
characterized by multiple veto points, raising the hurdles to policy change (North and
Weingast, 1989). A veto point can be defined as a political institution, the holder of
which has the power to block a proposed change in policy. A veto player, then, is the
policymaker who controls a veto point. Multiple veto points can be created by
constitutional provisions which specify, for example, that both an executive and a
legislature must agree to any policy changes, or that multiple chambers of a legislature
1 See Dixit and Pindyck (1993). In order to demonstrate a negative link between uncertainty and investment one needs to assume not only irreversibility but also either risk aversion, imperfect

5
must approve any changes in laws. Multiple veto points can also exist as a consequence
of electoral rules such as proportional representation, which favor the development of
coalition governments. In coalition governments any one member of the coalition may
be able to veto a policy proposal by threatening to withdraw from the government if its
demands are not satisfied.2
While increasing the number of veto points in a political system may help to
increase policy stability (and thus in this case the credibility of tax policies), making a firm
prediction about their actual effect requires knowledge of policy maker preferences. To
illustrate this, consider a simple two-period complete information model of capital
taxation based on Persson and Tabellini (1994). Individuals derive a variable proportion
of their income from land and from capital, as illustrated in equations (1) and (2) below
where k1 and l represent average per capita income from each factor, k1i and li represent
land and capital income for the i th individual, and e is an exogenous parameter with
mean zero.3 So individuals with e<0 derive more income from capital than does the
median member of society.
k1i = k1
- e (1)
li = l + e (2)
In the first period, owners of capital decide whether to consume or to save their
capital, earning utility U1= (k1i - k2
i) where k2i represents capital saved which earns a
return of r.4 In the second period a policy maker drawn from a political party p whose
members each have an exogenous endowment ep chooses the tax rates on land and capital
competition, or decreasing returns to scale. 2 For a survey of political and electoral institutions, veto points, and their effect on policy making see Tsebelis (1995). 3 The subscript refers to the period of the game. 4 I assume for simplicity that the stock of land is fixed and landowners do not earn first period income.

6
income, and respectively, subject to a budget constraint g = k2 + l (expressed
here in per capita terms). Individuals receive utility U in the second period.
U2=(1- )k2i + (1- )l i . (3)
Owners of capital can have an incentive to save, but whether they do so will
depend upon the anticipated tax rate on capital income e. The incentives for policy
makers with regard to tax policy depend in a very straightforward fashion on whether the
members of their party own mostly land or mostly capital. This can be shown by
substituting (1) and (2) into (3).
U2=(1- )k2 + (1- )l + ei( - ) (4)
Any policy maker with ep >0 (from a landowning party) who maximizes (4)
subject to the budget constraint will choose a capital tax rate of g/k2. Capital owners will
anticipate this incentive of a landowner government to satisfy the budget constraint
exclusively with capital taxation, and thus they will consume all of their capital in the first
period as long as (1- g/k2)<1/(1+r). The end result is that in equilibrium everyone will
be worse off, and the budget constraint will need to be satisfied exclusively with taxes on
land income. In contrast, if the policy maker is from a party of capitalists (ep<0), no
credibility problem will exist with respect to capital taxation.
How would the above scenario be altered if taxes had to be agreed to by multiple
policy makers, each of which had an effective veto over any policy change? A general
prediction would require full knowledge of how party preferences are distributed in
different countries and what status quo tax policies exist. Given our lack of full
information about this issue, one possibility is to consider what predictions emerge if one
assumes that each veto point in a country is controlled by a party with an exogenous
endowment of land and capital e randomly drawn from the uniform distribution [-c,c],
7
while the status quo capital tax rate s is also randomly drawn from a uniform
distribution [0,1] with e and s i.i.d.5
Under the above assumptions, credible commitment is achieved as long as the
status quo capital tax rate s satisfies the inequality (1- s)>1/(1+r), and as long as one
veto point is controlled by a party with ep<0. This holds regardless of which player has
agenda setting power, given the previous definition of a veto player as someone whose
agreement must be obtained in order to change policy. This leads to a first prediction
that the greater the number of veto points in a country, the greater the likelihood of
credible commitment, because the likelihood of a policy maker with e<0 controlling at
least one veto point is increasing in the total number of veto points. On average, then,
levels of capital investment should be higher in countries with multiple veto points.
We can also derive a second significant prediction from this exercise; the variance
of levels of capital investment should be higher within the group of countries without
multiple veto points. This is because the smaller the number of veto points in the
system, the greater the likelihood of obtaining one of the two following outcomes: either
all veto players have ep>0 and will set the capital tax rate at g/k2 , or all veto players will
have ep<0 and will prefer to collect all revenue from taxes on land.
While the assumptions about veto player preferences and status quo policies here
are made here for illustrative purposes, the two above predictions are also likely to hold
under much less restrictive assumptions. This has significant implications for cross-
country tests of the relationship between private investment and political institutions.
Say the level of private investment Y is estimated as a function of a vector of economic
controls X and a vector of variables measuring the number of veto points in a political
system Z One should then expect to observe a particular form of heteroskedasticity in
5 The status quo here being the rate which prevails if veto players are unable to agree on a change in policy.
8
the regression Y = + 1 X + 2 Z + . The variance of the error term Var[ ] should
be negatively correlated with Z, reflecting the greater variability in levels of investment in
countries without checks and balances.6
Relationship of this argument to broader debates on politics and growth
The issue of checks and balances and their impact on private investment is
closely related to the broader debate on democratic institutions and economic
performance. In terms of theory, if many researchers have emphasized that democratic
rights might help promote economic growth, others have emphasized how broadened
political participation might lead to a deterioration in economic performance.7 Empirical
studies have generally failed to provide robust evidence in favor of either a positive or
negative association of democracy with growth.8 One possible reason for this is that
democracy influences growth through numerous different channels, and these effects
may have opposite signs. For example, to the extent that democratic systems tend to
have more veto points than authoritarian systems, then democracy may reduce
uncertainty and raise private investment. However, it also might generate increased
pressures for redistribution, thus lowering allocative efficiency.9
Alesina and Perotti (1994) suggest another important reason for these
inconclusive findings; dictatorships are a very heterogeneous group. Some authoritarian
governments, like that of Singapore, have pursued policies that promoted fast growth.
Others, like Mobutu's Zaïre, have tended towards kleptocracy. Still others, like Suharto's
Indonesia, have at first been seen as models of stability, and subsequently, as prime
examples of authoritarian misrule. The argument presented in this paper suggests why
6 This holds as long as higher levels of Z correspond to higher numbers of veto points. One way to deal with this heteroskedasticity might be to include some direct measure of the taxation preferences of different political parties or interest groups in different countries, but no suitable cross-country data set currently exists for this purpose. 7 See for example Huntington (1968). 8 See Barro (1994), Alesina and Perotti (1994), and Leblang (1997)

9
authoritarian regimes may be more heterogeneous in terms of performance; they can be
characterized as political systems with a single veto point, and the preferences of the
groups on whose authority authoritarian rulers depend for support are likely to vary
across countries and over time.
In contrast to empirical studies on growth, there is a more statistically significant
link between levels of private investment and overall levels of democracy. Serven (1997)
finds that the Gastil index of civil liberties is significantly correlated with private
investment in a panel data estimation which controls for other investment determinants.
One reason for this result may be that focusing on private investment as dependent
variable excludes some of the negative effects which democracy might have on economic
performance via increased demands for redistribution.10 As Serven himself notes,
however, it is unclear exactly what phenomenon the Gastil indices are capturing.11 This
suggests a need for improved measures of political institutions. Second, even if civil
liberties and private investment are significantly correlated in Serven's study, it remains
possible that the effect of civil liberties varies substantially from country to country
within his sample. Ideally, one would want to know if this heterogeneity reflects
heterogeneity among dictatorships.
In addition to the finding that measures of democracy are correlated with levels
of private investment, several cross-sectional studies have identified a link between
private investment and the measures of institutional uncertainty developed by risk
9 Another avenue of inquiry is to investigate the relationship between political checks and balances and economic growth, as in Henisz (2000). See also Durham (1999). 10 Focusing on private investment rather than overall investment is also preferable when considering the effect of uncertainty, because Aizenman and Marion (1996) have shown that in cases where high uncertainty leads to a decline in private investment, public investment often increases in compensation. 11 In terms of measurement, since the Gastil index is subjective, and no methodology is publicly provided for its assessment, the index may actually be measuring the overall institutional environment in a country, rather than just political or civil rights. There may also be an endogeneity bias if assessors are influenced by recent economic performance in deciding to what extent political and civil liberties have been present. The Polity III database's measure of democracy is also significantly correlated with levels of private
10
assessment agencies. Brunetti and Weder (1999) and Poirson (1998) both find that
indices of the rule of law, bureaucratic quality, and corruption are significantly correlated
with levels of private investment, controlling for other determinants. These findings
have made a significant contribution to the literature, but they have two shortcomings.
First, indices such as the "rule of law" do not give any indication of which actual
government institutions are associated with better provision of the rule of law. Second,
like the Polity III and Gastil indices, measures of institutional quality may be subject to
an endogeneity bias whereby their designers are influenced by overall economic
performance in judging to what extent the rule of law, for example, is present. The
political measures in this paper capture differences in actual political institutions while
avoiding endogeneity bias by using objective formulae.
3. Data issues
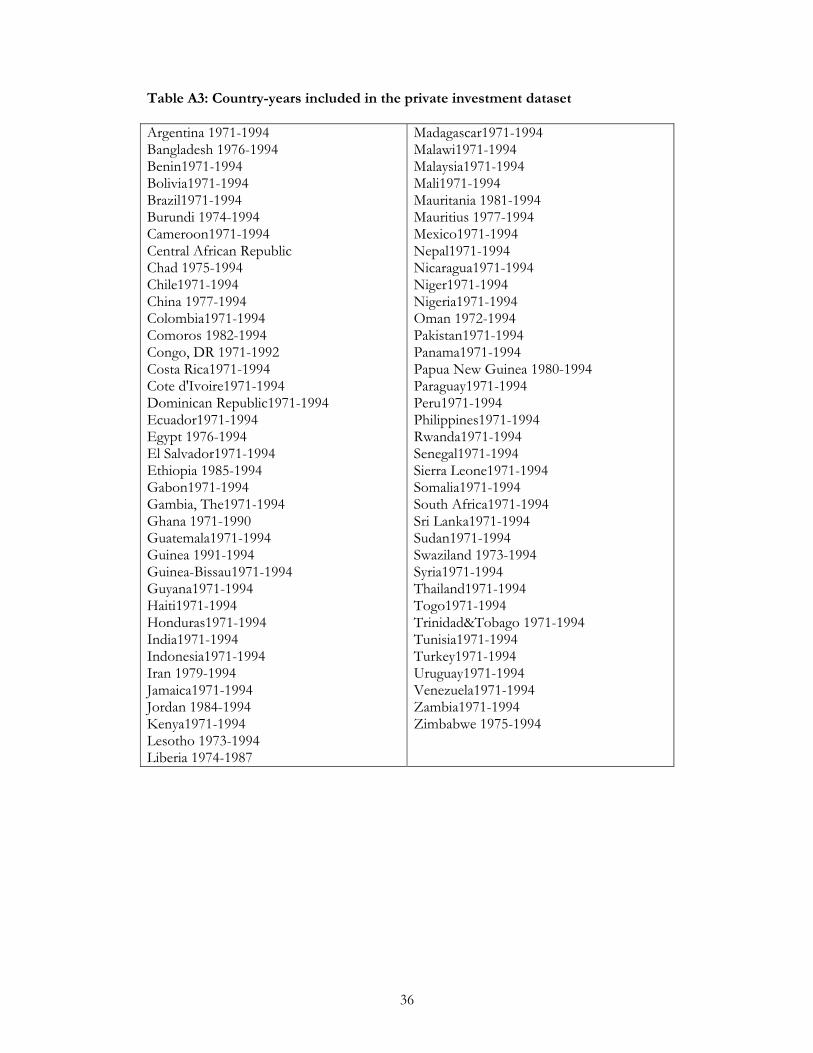
The private investment dataset I use is an updated version of that used in Serven
(1998) which calculates annual levels of new private investment in 74 developing
countries. While the number of countries included is large, the dataset is unbalanced,
with private investment figures for several countries only being available from the late
1980s (see annex table A3). The summary statistics in Table 1, below, present
information on constant-price private investment as a ratio of GDP.
In order to control for determinants of private investment which are not related
to political uncertainty, I follow existing studies by including several macroeconomic
variables.12 The annual growth rate of real GDP is included to capture the conventional
accelerator effect of growth on investment. The standard deviation of the inflation rate
is included, because variability of inflation creates uncertainty about the profitability of
investment. While, unlike the Gastil indices, the methodology for calculating the Polity III democracy index is made public, it remains subjective in its construction.
11
investment projects.13 The level of private sector credit (as a share of GDP) should also
be a determinant of private investment, and probably a more important one than the real
interest rate in this sample, since many of the countries in the sample utilized direct
instruments of monetary policy during the period considered. A measure which captures
the income effects of terms of trade shocks is also included in the regressions to control
for the possibility that these shocks will have a significant effect on investment
decisions.14 Finally, a variable which measures fuel & mineral exports as a share of total
exports is included, based on the logic that other things being equal, countries with
significant natural resource rents may receive higher levels of private investment.15
The principal goal of this paper is to examine the link between political
institutions and private investment, and to do so I make use of two newly developed
measures of political checks and balances: the “political constraints index” developed by
Henisz (2000) and an index of checks and balances in the political system developed by
Beck et al. (1999).
Henisz (2000) develops a method for measuring the extent of “political
constraints” placed on a government’s decision makers by drawing inferences from a
spatial model of political choice. He incorporates information covering (1) the number
of formal constitutional veto points in a political system (executive, number of houses of
the legislature, federal sub-units, and judiciary), (2) whether these veto points are
12 When not otherwise specified, the source for all data is the World Bank's World Development Indicators. 13 This is measured as the standard deviation of a country’s inflation rate over the previous seven years. Similar results were obtained when using alternative periods for calculating inflation variability. 14 The variable terms of trade shock measures the income effect as a percent of GDP of the change in a country’s terms of trade in a given year. 15 Other variables, such as the relative price of capital goods and the overall fiscal balance (after grants) should also logically be included as economic determinants of investment, but due to data limitations, inclusion of these two variables would have significantly reduced overall sample size. This would introduce a bias to the extent that the process for excluding observations was not a random one. As an alternative approach, I have chosen to use a procedure to impute missing values of these two variables. Results of investment regressions using these partially imputed variables were consistent with the results of regressions reported here. Similar problems with missing data arose with variables for real exchange rate instability and the level of public investment.

12
controlled by different parties, and (3) the cohesiveness of the majority which controls
each veto point. The justification for this last criterion is the claim that an executive
facing a legislature controlled by a coalition of opposition parties will be less constrained
than one who faces a legislature where a single opposition party is in control.16 As a
proxy for the cohesiveness of legislative majorities, Henisz adjusts his index according to
levels of party fractionalization. The Henisz data are available for the entire period of the
private investment sample (1971-1994). I have used the version of Henisz's index (called
political constraints here) which excludes data regarding federal sub-units (which may not
have veto power over the policy decisions which matter to investors) and the judiciary.17
The second measure of checks and balances I use is the one developed by Beck et
al. (1999) which is available beginning with the year 1975. Their key innovation is to
provide direct evidence on the number of parties within legislative majorities, rather than
inferring this from fractionalization data, as in Henisz (2000). Their index, referred to in
this paper as checks, is a count of the number of veto players, based on whether the
executive and legislative chamber(s) are controlled by different parties in presidential
systems, and on the number of parties in government for parliamentary systems.
Counting all of the parties in government in parliamentary systems derives from the idea
that each party which is a member of a coalition government will have effective veto
power over policy proposals. This is an assumption also discussed by Tsebelis (1995),
but which may for some cases exaggerate the veto power enjoyed by smaller parties. The
16 In contrast, if a legislative majority is politically aligned with the executive, then the executive will be more constrained in his/her actions when this majority is a coalition of several different parties as opposed to a single party. 17 This is the index called POLCONIII in the Henisz dataset. I have excluded the judiciary, because no accurate cross-country data is available to determine when and where the judiciary acts as a veto player with respect to policies which matter for investors. In constructing an alternative index which includes the judiciary as a potential veto player, Henisz (2000) uses data from risk assessment agencies to judge whether the judiciary is an independent veto player, but as noted above, risk assessment agency data has several significant shortcomings. For a full description of the formula used to calculate Henisz's index see Henisz (2000).
13
index is then modified to take account of the fact that certain electoral rules will affect
the cohesiveness of governing coalitions.18
One potential uncertainty with this index is whether it should be entered into an
investment regression in linear form, or whether it should instead be transformed to
reflect the fact that the effect of adding an additional veto point is likely to be non-linear
(moving from 1 to 2 veto players will result in a greater change than moving from 4 to 5,
for example).19 Since this seems quite plausible, I have used a log version of the Beck et
al. index in the regressions in sections 4 and 5.
A final group of regression variables is designed to capture the effect of political
instability on investment. Non-constitutional transfers of executive power (coups) are
particularly likely to increase uncertainty.20 One reason for this is that, as Londregan and
Poole (1990) have shown, experiencing one coup tends to increase the probability that a
country will suffer subsequent coups. When it is feared that an extra-constitutional
transfer of power might take place, the number of formal veto points in a political system
becomes increasingly irrelevant.
While constitutional transfers of political power are likely to generate less turmoil
than will coups d’état, they still may be associated with increased uncertainty about the
future course of government policies to the extent that election winners are not known
beforehand and to the extent that the preferences of future election winners are not well
18 This is based on the assumption that greater internal party cohesion in closed list systems will be synonymous with a lower level of checks and balances. The index is also adjusted downwards for countries where there are significant restrictions on electoral competition. When political competition is heavily restricted it seems less likely that veto players with heterogeneous preferences will hold office. For presidential systems, checks is the sum of 1 for the president and 1 for each legislative chamber. The value is modified upwards by 1 if an electoral competition index developed by Ferree, Singh, and Bates is greater than 4 (out of a possible 7). Also, in closed list systems where the president's party is the 1st government party, then the relevant legislative chambers are not counted. For parliamentary systems, checks is the sum of 1 for the prime minister and 1 for each party in the governing coalition. If elections are based on a closed list system and the prime minister's party is the 1st government party, then this sum is reduced by one. As for presidential systems, the value of check is modified upwards by 1 if value of the Ferree, Singh, and Bates index for electoral competition is greater than 4. 19 This problem does not arise with the Henisz (2000) index.
14
known. I have included two separate variables to capture this effect, both of which are
based on data collected by Henisz (2000). Constitutional changes in the executive are
measured by the zero-one dummy: executive turnover. Constitutional changes in the
legislature are measured by the variable legislative turnover, a continuous variable that
measure the extent of legislature turnover in a given year.21
4. Pooled investment regressions
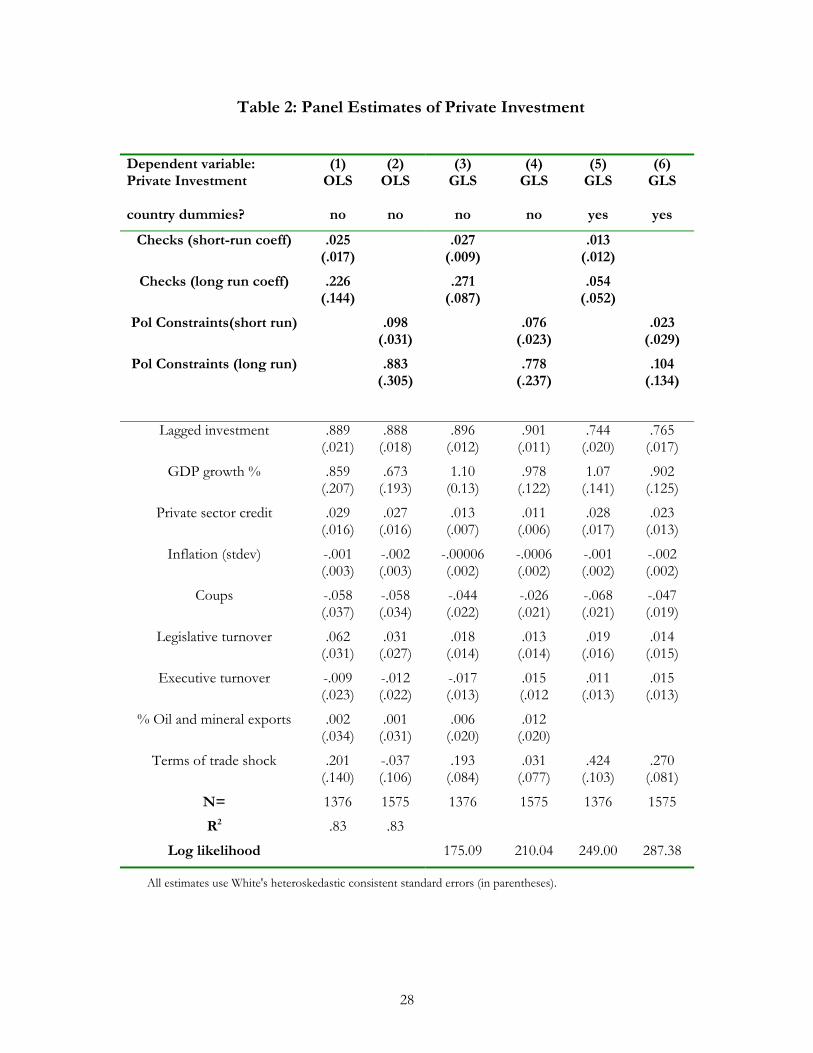
Table 2, below, presents results of several pooled investment regressions with
checks and political constraints used as alternative measures of checks and balances.
Regressions 1 and 2 were estimated using pooled OLS without controlling for
unobserved country-specific effects. The coefficients on checks and political constraints are
positive and significant in the case of the latter variable. 22 It would be unwise to draw
inferences from these estimates, though. First, standard likelihood ratio tests suggest that
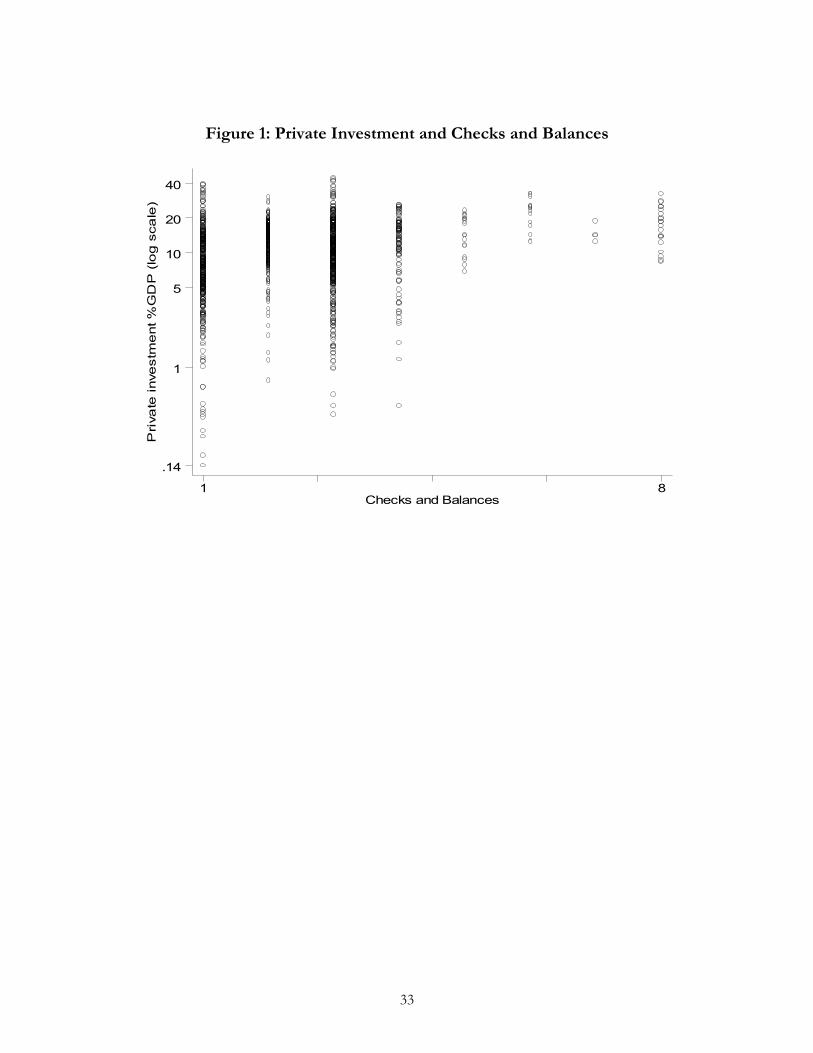
groupwise heteroskedasticity is present.23 Second, the theory reviewed in section 2
suggests that the variance of the residuals should also not be constant across different
levels of checks and balances. Visual examination of the bivariate relationship between
investment and checks suggests that this may in fact be the case (Figure I), and Breusch-
Pagan tests for heteroskedasticity support the view that the conditional variance of
private investment is negatively correlated with both political constraints and checks. This
suggests that more efficient estimates could be obtained with a GLS model of the
following form where, rather than assuming homoskedasticity of the residuals, the
20 This variable is based on the Polity III data set. 21 The formula for calculating this variable is ( |S2-S1|)/2 where S1 is a party's share of seats in the legislature in the previous year and S2 is a party's share of seats in the legislature during the current year. 22 Since I have used a dynamic panel specification here by including lagged private investment as a right-hand side variable, the distinction between the short-run and long-run effect of a change in checks and political constraints is relevant. The long-run coefficient for these variables is simply Bchecks/(1-Blagged investment ). 23 In both cases the null of homoscedasticity across groups was rejected at the p<.001 level. The test used was that presented in Greene (2000) p.511. While the use of heteroskedastic consistent standard errors can
15
variance of the residuals is estimated as a function of a set of country dummies and
alternatively, checks or political constraints. The first equation below, then, is the
specification for estimating the conditional mean and the second equation is the
specification for estimating the conditional variance of private investment.
Private investment = i + 1 invt-1+ 2 growth + 3 credit + 4 sdinflation+ 5 coup + 6 leg. turn. + 7 exec turn. + 8 res. exports + 9 terms of trade + 10 checks + (5) Var[ ]= i+ 1 checks (6)
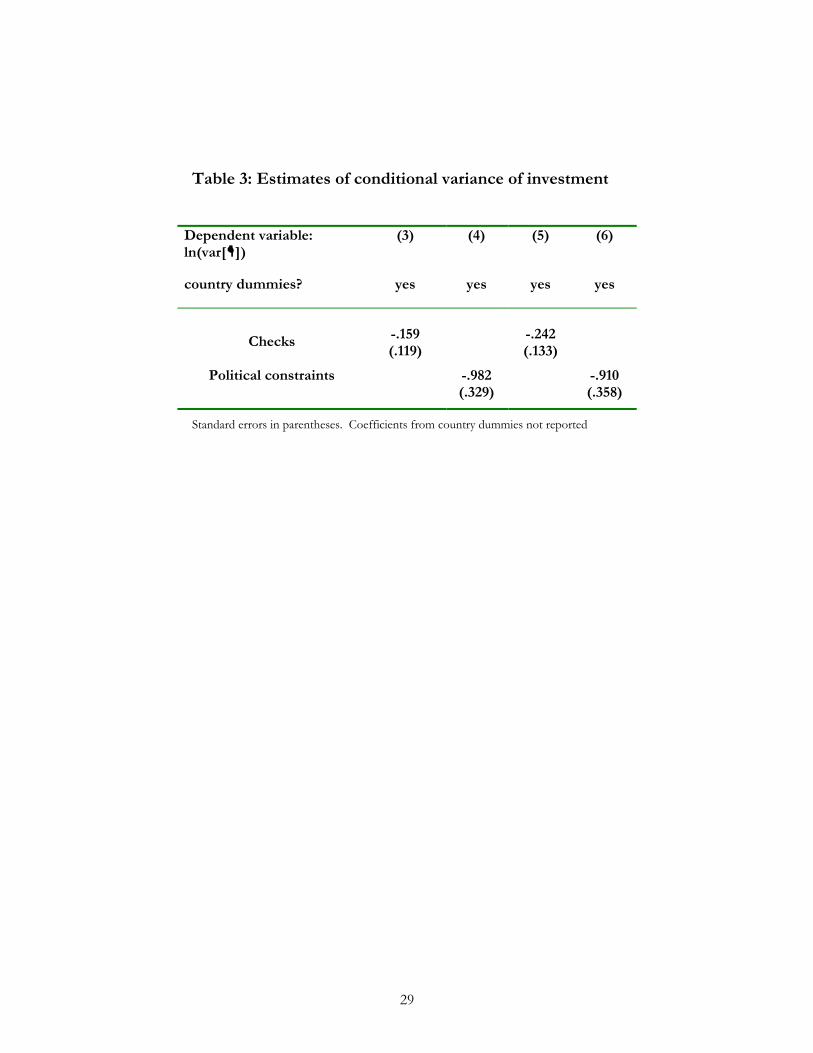
Regressions 3 and 4 present the results of the GLS maximum likelihood
estimates.24 When estimating the conditional mean (equation 5) I have constrained
individual country intercepts to be equal, but have allowed individual country intercepts
in the conditional variance estimates (equation 6), given that groupwise heteroskedasticity
is present. Both short and long-run coefficients of checks and political constraints are now
highly significant when estimating the conditional mean. In addition, both checks and
political constraints are negatively correlated with the conditional variance of private
investment (Table 1II), supporting the theoretical propositions from section 2, although
in the case of checks the coefficient is not significant at conventional levels.
Results for regressions 3 and 4 also show that coefficients on the economic
determinants of investment such as GDP growth, private sector credit, and terms of
trade have the expected signs and the coefficients on GDP growth are highly significant.
Results with regard to the political instability variables are less conclusive. While the
coefficient for extra-constitutional changes in government (coup) has the expected
negative sign, and it is statistically significant in regression 3, the coefficients for
constitutional changes and parliamentary turnover are not significant in either regression.
provide consistent standard error estimates, OLS may still be inefficient in the presence of groupwise heteroskedasticity. 24 Results of two-step estimates of this procedure were nearly identical to the ML estimates. The method used was that first proposed by Harvey and presented in detail in Greene 2000, pp.514-522.
16
While the results of regressions (3) and (4) suggest that high checks and balances
are, on average, associated with high levels of private investment, they may be biased by
the failure to control for unobserved country effects. Standard F-tests show that when
added to either regression 3 or regression 4 which estimate the conditional mean, a set of
country dummies was jointly significant.25 A major problem here, however, is that the
fact that checks and political constraints are relatively time-invariant can make it difficult to
establish firm inferences when allowing for unobserved country effects.26 While the
institutional measure, checks, does vary over time, there are thirteen countries in the
sample for which the variable remains constant. In each case these are purely
authoritarian systems where checks=1, making checks perfectly collinear with the country
dummy in these cases. Likewise, there are 19 countries where the level of political
constraints remains constant at 0. Even in those countries where levels of checks and
political constraints have varied over time, changes have generally occurred with low
frequency.
Regressions 5 and 6 repeat the GLS estimation procedure while allowing
individual country intercepts in both the estimation of the conditional mean and the
estimation of the conditional variance. In the estimates of the conditional mean, the
coefficients for checks and political constraints remain positive, but neither the short-run nor
the long-run coefficient are significant at conventional levels. This result should be taken
less as a sign that checks and balances do not matter than as an indication of the
difficulty in establishing to what extent they matter relative to unobserved country
effects. The discussion of robustness issues in section 6 considers to what extent checks
and political constraints remain significant after controlling for other slow-changing features
of countries, such as levels of democracy and levels of GDP per capita. The coefficients
25 P-values for the test that all country dummies were equal were P<0.01 in both cases. 26 The same problem also applies to the conditional variance estimates.

17
are also considerably smaller in magnitude. However, it is interesting to note that in
these regressions the conditional variance of private investment remains negatively
correlated with the level of checks and balances, and the coefficients are significant in
both cases.
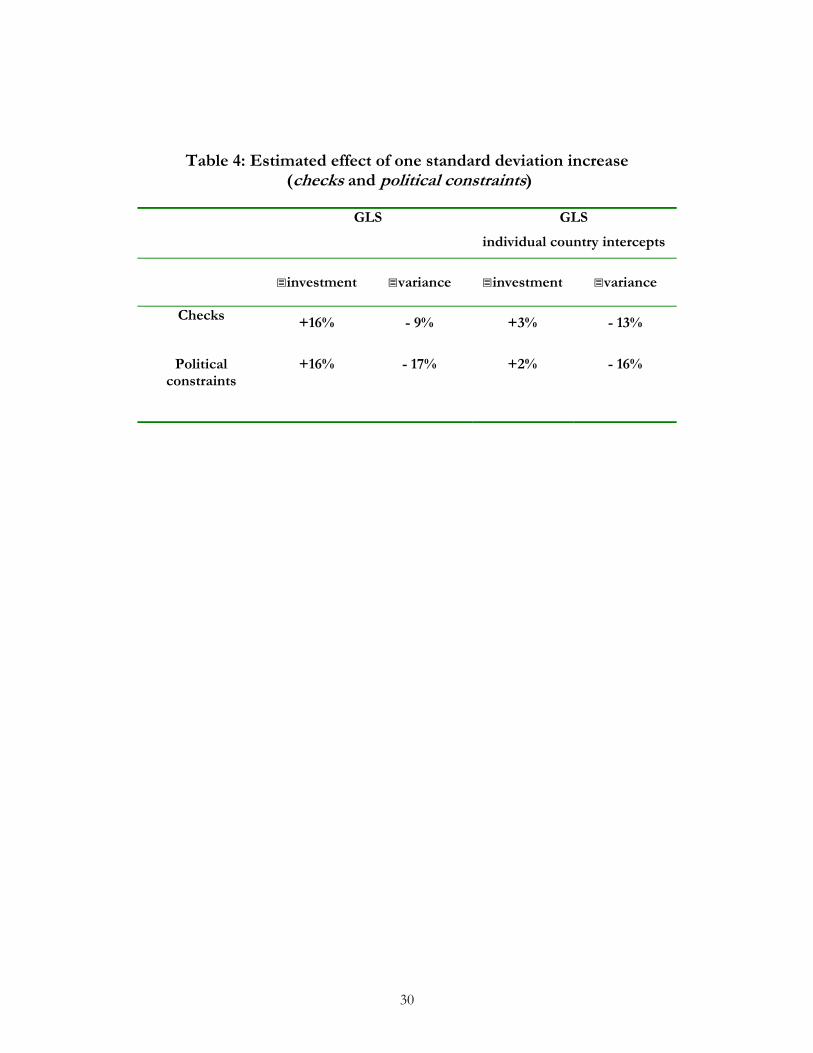
The results of regressions 3-6 should also be interpreted in substantive terms.
Table 4 shows in terms of percentages the estimated effect of a one standard deviation
increase in log checks and political constraints on the level of private investment and on the
conditional variance of private investment. For log checks a one standard deviation
increase (+0.56) is roughly equivalent to a move from a system with only one veto point
(log checks =0) to one with two veto points where each veto point is controlled by a
separate party (log checks =0.69). For political constraints a one standard deviation increase
(+0.19) would be equivalent to a move from a system with one veto point (political
constraints=0) to one with two veto points: an executive and a legislature controlled by a
different party from the executive and with a fractionalization index of 0.72.27
5. Quantile regression estimates
So far I have used GLS methods to reduce the effect of groupwise
heteroskedasticity on my estimates and to simultaneously test the prediction that greater
checks and balances imply both higher investment on average and a lower conditional
variance of investment across countries and over time. This section examines the
27 As an additional note, while the results from GLS estimates allow one to test propositions about both the conditional mean and the conditional variance of private investment, they may be biased to the extent they ignore parameter heterogeneity. Results of a Wald test suggest that the null hypothesis that the parameters for political institutions are constant across countries is in fact massively rejected. This is consistent with the theoretical discussion in section 2. In a dynamic panel data context, Robertson and Symons (1992) and Pesaran and Smith (1995) have shown that falsely assuming parameter homogeneity can bias estimates due to correlation of the error term with other right hand side variables. They propose when there is parameter heterogeneity across countries, consistent estimates of parameter averages can be estimated by taking mean values from individual country regressions. While this may generate consistent estimates, since there are relatively few observations per country in the panel used here (24 maximum), there is likely to be a massive loss of efficiency in performing country by country estimates, so dealing with this issue effectively may have to await the collection of longer time-series for private investment.
18
robustness of these results by using an alternative technique which does not impose a
specific functional form on the variance of the error term.
Quantile regression as developed by Koenker and Bassett (1978) employs a least
absolute deviation estimator which is often used to estimate a median regression line for
the conditional distribution (rather than the mean line estimated by OLS). This
estimation method can also be used to estimate percentiles of the conditional distribution
other than the 50th. A test of the null hypothesis that slope parameters at different
quantiles are equal can be used as a test for the presence of heteroskedasticity. Quantile
regression can also be used to test specific propositions about the shape of the
conditional distribution.
Most applications of quantile regression have been in microeconomics. In one
example, Deaton (1996) has used quantile regression to show that while richer
households in developing countries, on average, spend a smaller share of their income on
food, it is also true that there is higher variance in the proportion of income spent on
food among richer households. In other words, some rich households still spend
significant shares of their income on food while others spend very little.28
The argument I have made about the effect of checks and balances can be tested
in an analogous manner. If the variance of the conditional distribution of investment
(conditional on checks and balances) is greater in countries with few checks and balances,
then one should observe a pattern where, as the quantile one is estimating rises, the slope
coefficients on checks and on political constraints should become less positive. This can be
tested by estimating the same specification as used in the regressions in section 4, but at
28 Deaton demonstrates this by showing that when income share spent on food (YS) is regressed on overall income (Y), while the coefficient on overall income (Y) is negative in a regression at the 10th percentile, in a regression at the 90th percentile it is actually positive. The fact that the estimated coefficient on Y is more positive at higher quantiles shows that there is greater variation in the conditional distribution (YS conditional on Y) at higher levels of overall income.
19
several different quantiles (such as the 25th, 50th, and 75th). Different coefficients are
observed for each quantile and tested against the null that they are equal.
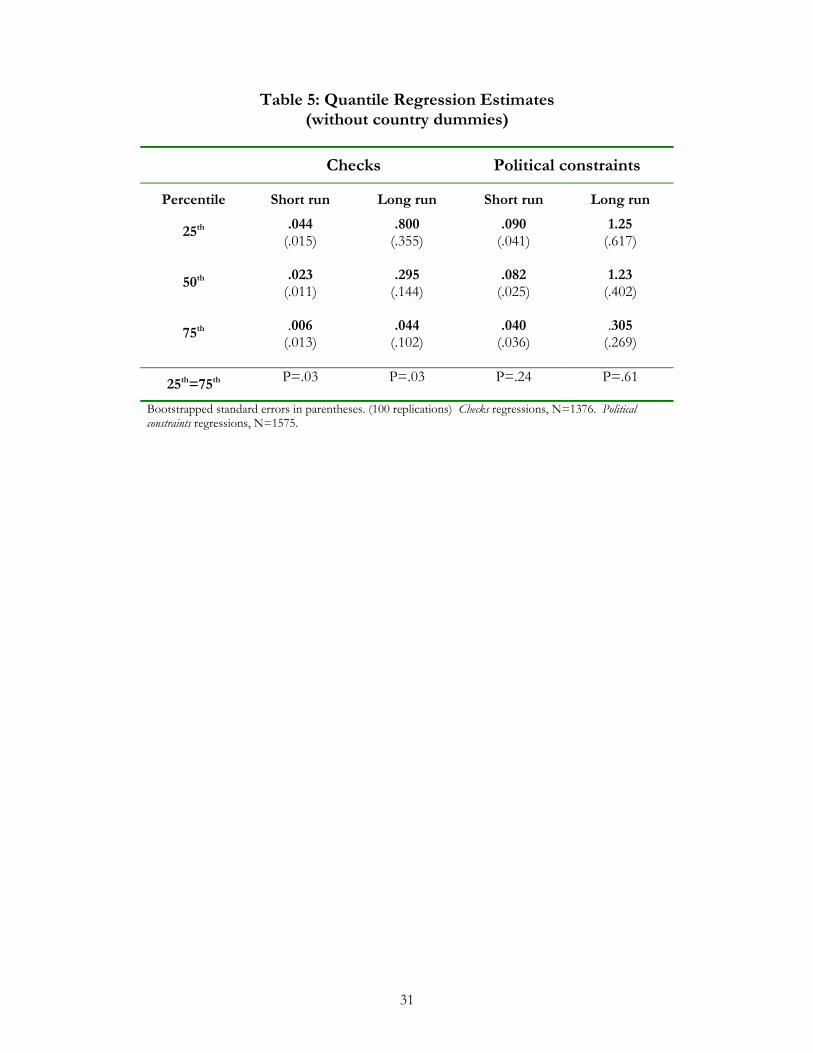
Table 5, below, reports results for coefficients on checks and political constraints
from quantile regression estimates (complete results for these regressions are found in
annex tables A1 and A2). As can be seen, both the short and long-run coefficients are
more positive and more significant at lower quantiles. 29 Results of Wald tests provide
further evidence against the null that the coefficients are equal in the case of checks
although the null cannot be rejected in the case of political constraints
Table 6 repeats the exercise while including a set of dummies to control for
unobserved country effects. Not surprisingly, given the correlation of the checks and
balances measures with these country dummies, the magnitude of coefficients for checks
and political constraints is considerably reduced, and they are no longer statistically
significant at conventional levels. However, one still observes a pattern whereby the
coefficients are less positive the higher the quantile estimated. Again in the case of checks,
Wald tests favor rejecting the hypothesis that the coefficient at the 75th percentile is equal
to the coefficient at the 25th percentile.
6. Robustness of the results
This final empirical section examines whether the above results may be
influenced by (1) checks and political constraints proxying for more general features of
29 Following other studies using quantile regression, I have used bootstrapped standard errors. This is necessitated by the fact that the density function for purposes of estimating the variance-covariance matrix is unknown. A common random number seed was used in all regressions in order to allow replication of the results. The procedure used for bootstrapping followed the standard approach of sampling from the joint distribution of observations. Buchinsky (1998) suggests that alternative methods of estimating bootstrapped standard errors are likely to be biased in this context.
20
countries such as the level of democracy or levels of income, (2) by the presence of
outliers, and (3) by the endogeneity of the political system to levels of investment.30
With regard to the first of the above questions, checks and balances are not
synonymous with democracy (witness countries like the UK which are democratic but
have political institutions with few veto points). But checks and balances in general are
likely to be highly correlated with other components of democracy, such as protection of
human rights, which may themselves have a positive effect on levels of private
investment. It is difficult to control for these other characteristics in my regressions,
because panel data measures of other sub-components of democracy are not generally
available.
Given this limitation, an alternative route is to include a more general measure of
democracy, such as the Polity III democracy index (democracy), as a control in the Table 1I
regressions (Gurr, Jaggers, and Moore 1998) When regressions 3 and 4 were re-
estimated including this variable, the checks and balances measures remained significant
while the indicator for democracy was not significant.31 This result may be influenced by
multicollinearity between the checks and balances measures and democracy, however, so I
also conducted a non-nested test comparing the explanatory power of a model including
checks and balances (but not democracy) and a model including democracy (but not
checks).32 This followed the J-test methodology for non-nested tests proposed by
30 Another potential robustness issue involves autocorrelation. While autocorrelation is a common problem in panel data, use of a specification that includes a lagged dependent variable generally provides a means of reducing any serial correlation of error terms. Results of Lagrange multiplier tests adapted for panel data show that the null hypothesis of no serial correlation cannot be rejected in any of the results of the pooled regressions in Table 2. These tests were based on a variant of the Breusch-Godfrey test for serial correlation. In all cases p-values for the tests against the null of no serial correlation were P>0.99. 31 Coefficients and standard errors for checks and political constraints were .025 (.009) and .061 (.029), respectively. Coefficients and standard errors for democracy were .002 (.0015) and .0001 (.001). 32 The simple correlation between democracy and political constraints is 0.78. The simple correlation between democracy and checks is 0.45.

21
Davidson and MacKinnon (1981). These test results were consistent with the earlier
regressions in favoring the checks and balances specification.33
The two variables checks and political constraints might also be proxying for overall
levels of income, raising the question whether establishing checks and balances is likely to
have as much of an impact on private investment in a poor country as in a rich country.
While it is true as a general statement that countries with checks and balances in their
political system tend to be wealthier than those without, this same conclusion does not
apply as strongly in the data set which I have used for this study, because it is restricted
to developing countries. In my developing country data set the correlation of checks and
political constraints with real GDP per capita is positive but not extremely high (0.13 and
0.30 respectively). When I regressed each political variable on GDP per capita, and then
used the residual from this auxiliary regression in specifications 3 and 4 from Table 1I
(instead of checks and political constraints), the results remained robust.
A second robustness issue involves the possibility that the results reported above
are influenced by outlying observations. To examine this possibility I re-estimated
regressions 3 and 4 from Table 1I after excluding observations which might have a
particularly large effect on the coefficients for checks and political constraints based on the
dfbeta criterion. The results of these new estimates were similar to those in the original
regressions.34 Outliers should be less of a concern for the quantile regression results in
33 These tests involved estimating the two alternative specifications and then re-estimating each specification while including the fitted values from the alternative model as a parameter. The t-statistic on the fitted values can be interpreted as a test of the null that the alternative specification would not add explanatory power to the existing model. In the case of the regression using checks and the regression using political constraints the null could not be rejected. In both alternative specifications using democracy the null was rejected. 34 The dfbeta statistic measures the relative influence of each observation on the estimated coefficient of a particular variable, making it the most relevant test of outliers for the inferences in this paper. Following standard practice, observations with an absolute dfbeta value>2/sqrt(N) were dropped, where N is the number of observations. Coefficients and standard errors for checks and political constraints were 0.022 (0.0088) and 0.047 (0.021) respectively.

22
Tables 3 and 4, because these derive from a least absolute deviation (rather than least
squares) estimator which should logically be less influenced by outliers.
A third robustness issue involve the possibility of joint endogeneity between
levels of private investment and checks and balances. To the extent that levels of checks
and balances derive from features of a country’s political system which change only very
infrequently (such as electoral rules), there may be less reason to believe they are
endogenous to investment. On the other hand, one might observe a phenomenon
whereby increased growth and investment prompt rulers to relax restrictions on political
competition. This change would, in some countries, lead to the emergence of multiple
political parties in government, and thus joint endogeneity would be a concern.
I considered the potential endogeneity of the checks and balances variables in
my sample by first running Granger causality tests. An initial variant involved
regressing each checks and balances variable on lagged values of itself and on lagged
private investment. Individual regressions were estimated for each country. In only two
countries for checks and three countries for political constraints was the coefficient on lagged
investment significant at conventional levels. A second variant of these tests involved
regressing each checks and balances variable on its own lag and on a variable measuring
the net change in the level of private investment over the previous four years. This
produced similar results. While the number of observations in each of these individual
country regressions was not large, this is nonetheless fairly convincing evidence that, on
average, neither checks nor political constraints is Granger-caused by investment.
As a further test of the potential endogeneity of checks and balances, I
considered whether there might be a simultaneity bias to the extent that checks and
balances and private investment might be jointly influenced by certain political and
economic shocks. One way to deal with this issue is to repeat regressions 3 and 4 from

23
Table 1I while instrumenting for checks and political constraints with their respective lags. A
Hausman specification test was then used to compare the OLS and IV estimates and so
test for the consistency of the OLS estimates. In both the case of political constraints and
checks the null of the consistency of the OLS estimates could not be rejected.35 In sum,
while there is no doubting the fact that political and economic variables are often jointly
endogenous, in the case of political checks and balances, it appears feasible to consider
them as being exogenous to levels of private investment.
8. Conclusion
There are a number of mechanisms which might aid governments in committing
not to make opportunistic changes in taxes and regulations once private firms have made
irreversible investments. This paper has investigated the extent to which checks and
balances in government might facilitate credible commitment. I have argued that on
average, checks and balances should be higher levels of private investment, but because
they are not a necessary condition for credible commitment, we should also observe
greater variability in levels of investment within the group of country-years where checks
and balances are absent. Results from heteroskedastic regression and quantile regression
estimates support both of these propositions.
35 P-values in each case were P>0.99.

24
References
Aizenman, J. and N. Marion, 1996, Volatility and the Investment Response, NBER
Working Paper 5841.
Alesina, A. and R. Perotti, 1994, The Political Economy of Growth: A Critical Survey of
Recent Literature, World Bank Economic Review 8, 351-371.
Barro, R., 1994, Democracy and Growth, NBER Working Paper 4909.
Beck, T., G. Clarke, A. Groff, P. Keefer, and P. Walsh, 1999, New Tools and New Tests
in Comparative Political Economy: the Database of Political Institutions, mimeo, World
Bank, Washington.
Brunetti, A. and B. Weder, 1999, Investment and Institutional Uncertainty, mimeo,
International Finance Corporation, Washington.
Buchinsky, M., 1998, Recent Advances in Quantile Regression Models, Journal of Human
Resources 33, 88-126.
Davidson, R. and J. MacKinnon, 1981, Several Tests for Model Specification in the
Presence of Alternative Hypotheses, Econometrica 49, 781-793.
Deaton, A., 1996, Analysis of Household Surveys: A Microeconometric Approach to Development
Policy (World Bank, Johns Hopkins University Press).
Dixit, A. and R. Pindyck, 1993, Investment under Uncertainty (Princeton University Press).
Durham, J. B., 1999, Economic Growth and Political Regimes, Journal of Economic Growth
4, 81-111.
Falaschetti, Dino, 2001, Credible Commitments and Investment: Does checking the
Ability or Incentive for Opportunism Matter?, mimeo, University of California Berkeley.

25
Greene, W. H., 2000, Econometric Analysis (Prentice-Hall, New Jersey).
Gurr, T. R., K. Jaggers and W. H. Moore, 1998, Polity III Codebook, mimeo, Center for
Comparative Politics, Department of Political Science, University of Colorado, Boulder.
Henisz, W. J., 2000, The Institutional Environment for Economic Growth, Economics and
Politics 12, 1-31.
Huntington, S., 1968, Political Order in Changing Societies (Yale University Press, New
Haven).
Koenker, R. and G. Bassett, 1978, Regression Quantiles, Econometrica 46, 107-112.
Leblang, D., 1997, Political Democracy and Economic Growth: Pooled Cross-Sectional
and Time-Series Evidence, British Journal of Political Science 27, 453-472.
Londregan, J. and K. Poole, 1990, Poverty, the Coup Trap, and the Seizure of Executive
Power, World Politics 42, 151-183.
North, D. and B. Weingast, 1989, Constitutions and Commitment: the Evolution of
Institutions Governing Public Choice in Seventeenth Century England, Journal of Economic
History 49, 803-832.
Persson, T. and G. Tabellini, 1994, Representative Democracy and Capital Taxation,
Journal of Public Economics 55, 53-70.
Pesaran, M. H. and R. Smith, 1995, Estimating Long-Run Relationships from Dynamic
Heterogeneous Panels, Journal of Econometrics 68, 79-113.
Poirson, H., 1998, Economic Security, Private Investment, and Growth in Developing
Countries, International Monetary Fund Working Paper, 98/4.
26
Robertson, D. and J. Symons, 1992, Some Strange Properties of Panel Data Estimators,
Journal of Applied Econometrics 7, 175-189.
Serven, L., 1998, Macroeconomc Uncertainty and Private Investment in LDCs: an
Empirical Investigation, mimeo, World Bank, Washington.
Serven, L., 1997, "Irreversibility, Uncertainty and Private Investment: Analytical Issues
and Some Lessons for Africa", Journal of African Economies, vol.6, no.3, supplement,
pp.229-268.
Serven, L. and A. Solimano, 1993, Debt Crisis, Adjustment Policies and Capital
Formation in Developing Countries: Where do We Stand?, World Development 21, 127-
140.
Tsebelis, G., 1995, Decision Making in Political Systems, British Journal of Political Science
25, 289-325.

27
Table 1: Summary Statistics
Mean Std. Dev. Min. Max.
Private investment%GDP 11.6 6.7 0.14 44.9
Lagged investment %GDP 11.6 6.7 0.14 44.0
GDP growth % 0.01 0.06 -0.48 0.27
Private sector credit %GDP 24.9 17.8 0.11 128.4
Inflation (stdev) 0.70 4.54 0.001 53.4
% oil & mineral exports 0.23 0.29 0 0.96
Coups 0.07 0.26 0 1
terms of trade shock -0.02 0.09 -0.40 1.19
Legislative turnover 0.04 0.16 0 2.24
Executive turnover 0.11 0.31 0 1
Checks 2.43 1.43 1 16
Checks (log) 0.70 0.56 0 2.20
Political constraints 0.12 0.19 0 0.74
28
Table 2: Panel Estimates of Private Investment
Dependent variable: Private Investment country dummies?
(1) OLS
no
(2) OLS
no
(3) GLS
no
(4) GLS
no
(5) GLS
yes
(6) GLS
yes
Checks (short-run coeff) .025 (.017)
.027 (.009)
.013 (.012)
Checks (long run coeff) .226 (.144)
.271 (.087)
.054 (.052)
Pol Constraints(short run) .098 (.031)
.076 (.023)
.023 (.029)
Pol Constraints (long run) .883 (.305)
.778 (.237)
.104 (.134)
Lagged investment .889 (.021)
.888 (.018)
.896 (.012)
.901 (.011)
.744 (.020)
.765 (.017)
GDP growth % .859 (.207)
.673 (.193)
1.10 (0.13)
.978 (.122)
1.07 (.141)
.902 (.125)
Private sector credit .029 (.016)
.027 (.016)
.013 (.007)
.011 (.006)
.028 (.017)
.023 (.013)
Inflation (stdev) -.001 (.003)
-.002 (.003)
-.00006 (.002)
-.0006 (.002)
-.001 (.002)
-.002 (.002)
Coups -.058 (.037)
-.058 (.034)
-.044 (.022)
-.026 (.021)
-.068 (.021)
-.047 (.019)
Legislative turnover .062 (.031)
.031 (.027)
.018 (.014)
.013 (.014)
.019 (.016)
.014 (.015)
Executive turnover -.009 (.023)
-.012 (.022)
-.017 (.013)
.015 (.012
.011 (.013)
.015 (.013)
% Oil and mineral exports .002 (.034)
.001 (.031)
.006 (.020)
.012 (.020)
Terms of trade shock .201 (.140)
-.037 (.106)
.193 (.084)
.031 (.077)
.424 (.103)
.270 (.081)
N= 1376 1575 1376 1575 1376 1575
R2 .83 .83
Log likelihood 175.09 210.04 249.00 287.38
All estimates use White's heteroskedastic consistent standard errors (in parentheses).
29
Table 3: Estimates of conditional variance of investment
Dependent variable: ln(var[ ])
country dummies?
(3)
yes
(4)
yes
(5)
yes
(6)
yes
Checks
-.159 (.119)
-.242 (.133)
Political constraints -.982 (.329)
-.910 (.358)
Standard errors in parentheses. Coefficients from country dummies not reported
30
Table 4: Estimated effect of one standard deviation increase
(checks and political constraints)
GLS GLS
individual country intercepts
investment variance investment variance
Checks
+16% - 9% +3% - 13%
Political constraints
+16% - 17% +2% - 16%
31
Table 5: Quantile Regression Estimates (without country dummies)
Checks Political constraints
Percentile Short run Long run Short run Long run
25th .044 (.015)
.800 (.355)
.090 (.041)
1.25 (.617)
50th .023 (.011)
.295 (.144)
.082 (.025)
1.23 (.402)
75th .006 (.013)
.044 (.102)
.040 (.036)
.305 (.269)
25th=75th P=.03 P=.03 P=.24 P=.61
Bootstrapped standard errors in parentheses. (100 replications) Checks regressions, N=1376. Political constraints regressions, N=1575.

32
Table 6: Quantile Regression Estimates (with country dummies)
Checks Political constraints
Percentile Short run Long run Short run Long run
25th .037 (.023)
.144 (.087)
.086 (.051)
.445 (.290)
50th .020 (.019)
.082 (.079)
.067 (.048)
.279 (.208)
75th -.016 (.019)
-.052 (.062)
-.004 (.047)
.015 (.179)
25th=75th P=.02 P=.03 P=.14 P=.13
Bootstrapped standard errors in parentheses. (100 replications) Checks regressions, N=1376. Political constraints regressions, N=1575.
33
Figure 1: Private Investment and Checks and Balances
Pri
vate
inve
stm
ent
%G
DP
(lo
g s
cale
)
Checks and Balances1 8
.14
1
5
10
20
40

34
Table A1: Full results of quantile regressions (specification using checks)
Percentile estimated
25th 50th 75th
Checks .044 (.015)
.024 (.011)
.006 (.014)
Lagged investment .945 (.020)
.919 (.016)
.863 (.020)
GDP growth % 1.15 (0.22)
.882 (.193)
.750 (.173)
Private sector credit .048 (.016)
.008 (.008)
.003 (.011)
Inflation (stdev) -.008 (.004)
-.00007 (.005)
.003 (.004)
Coups -.071 (.046)
-.030 (.024)
-.041 (.025)
Legislative turnover .020 (.027)
.024 (.031)
.017 (.030)
Executive turnover .024 (.024)
.014 (.013)
.007 (.015)
% Oil and mineral exports -.090 (.030)
-.035 (.024)
.042 (.033)
Terms of trade shock .057 (.143)
.178 (.123)
.273 (.119)
Bootstrapped standard errors in parentheses. (100 replications) N=1376.

35
Table A2: Full results of quantile regressions (specification using political constraints)
Specification using Political constraints
Percentile estimated
25th 50th 75th
Political constraints .090 (.041)
.082 (.025)
.040 (.036)
Lagged investment .929 (.017)
.934 (.015)
.869 (.022)
GDP growth % .922 (.168)
.658 (.185)
.587 (.151)
Private sector credit .048 (.016)
.007 (.009)
.003 (.011)
Inflation (stdev) -.008 (.004)
-.0007 (.004)
.003 (.003)
Coups -.052 (.034)
-.019 (.022)
-.038 (.023)
Legislative turnover .036 (.026)
.013 (.024)
-.010 (.031)
Executive turnover .030 (.025)
.011 (.013)
.003 (.017)
% Oil and mineral exports -.098 (.030)
-.022 (.022)
.044 (.032)
Terms of trade shock -.069 (.102)
-.119 (.123)
.147 (.134)
Bootstrapped standard errors in parentheses. (100 replications) N=1575
36
Table A3: Country-years included in the private investment dataset Argentina 1971-1994 Bangladesh 1976-1994 Benin1971-1994 Bolivia1971-1994 Brazil1971-1994 Burundi 1974-1994 Cameroon1971-1994 Central African Republic Chad 1975-1994 Chile1971-1994 China 1977-1994 Colombia1971-1994 Comoros 1982-1994 Congo, DR 1971-1992 Costa Rica1971-1994 Cote d'Ivoire1971-1994 Dominican Republic1971-1994 Ecuador1971-1994 Egypt 1976-1994 El Salvador1971-1994 Ethiopia 1985-1994 Gabon1971-1994 Gambia, The1971-1994 Ghana 1971-1990 Guatemala1971-1994 Guinea 1991-1994 Guinea-Bissau1971-1994 Guyana1971-1994 Haiti1971-1994 Honduras1971-1994 India1971-1994 Indonesia1971-1994 Iran 1979-1994 Jamaica1971-1994 Jordan 1984-1994 Kenya1971-1994 Lesotho 1973-1994 Liberia 1974-1987
Madagascar1971-1994 Malawi1971-1994 Malaysia1971-1994 Mali1971-1994 Mauritania 1981-1994 Mauritius 1977-1994 Mexico1971-1994 Nepal1971-1994 Nicaragua1971-1994 Niger1971-1994 Nigeria1971-1994 Oman 1972-1994 Pakistan1971-1994 Panama1971-1994 Papua New Guinea 1980-1994 Paraguay1971-1994 Peru1971-1994 Philippines1971-1994 Rwanda1971-1994 Senegal1971-1994 Sierra Leone1971-1994 Somalia1971-1994 South Africa1971-1994 Sri Lanka1971-1994 Sudan1971-1994 Swaziland 1973-1994 Syria1971-1994 Thailand1971-1994 Togo1971-1994 Trinidad&Tobago 1971-1994 Tunisia1971-1994 Turkey1971-1994 Uruguay1971-1994 Venezuela1971-1994 Zambia1971-1994 Zimbabwe 1975-1994