lwr ex 12 17
DESCRIPTION
http://www.sjostadsverket.se/download/18.348801b413ce8a7ccc512f/1361257819616/LWR_EX_12_17.pdfTRANSCRIPT

TRITA-LWR Degree Project 12:17 ISSN 1651-064X LWR-EX-12-17
ENHANCED BIOGAS PRODUCTION BY INCREASING ORGANIC LOAD RATE IN MESOPHILIC ANAEROBIC DIGESTION
WITH SLUDGE RECIRCULATION
Zhanzhao Huang
April 2012
Zhanzhao Huang TRITA-LWR Degree Project 12:17
ii
© Zhanzhao Huang 2012 Degree project for the master program in Water System Technology Department of Land and Water Resources Engineering Royal Institute of Technology (KTH) SE-100 44 STOCKHOLM, Sweden Reference should be written as: Zhanzhao H (2012) “Enhanced biogas production by increasing organic load rate in mesophilic anaerobic digestion with sludge recirculation” TRITA-LWR Degree Project 12:17

Enhanced Biogas Production by Increasing OLR in Mesophilic AD with Sludge Recirculation
iii
SUMMARY IN SWEDISH För att förbättra den anaeroba slamrötningen och öka biogasutvinningen, genomfördes försök med en ökning av den organiska belastningen (OLR) från 1,0 till 3,0 kg VS/(m3 • dag) i en rötningsprocess. Processen består av en traditionell mesofil anaerob rötkammare som kombinerats en centrifug med slamavvattning och slamrecirkulation för att upprätthålla ett relativt högt fast innehåll i rötkammaren. Hypotesen var att en kontinuerligt ökning av OLR från 1,0 till 3,0 kg VS/(m3 • dag) i en rötkammare i pilotskala med återcirkulerat slam inte skulle påverka rötkammarestabiliteten, varvid biogasproduktionen skulle förbättras. För att testa hypotesen utfördes en kontinuerlig 73-dagars studie. På grund av brist på slam kunde OLR höjas efter införande av externt slam. Mätning av innehållet totala fast material (TS) och flyktigt material (VS) i både tillfört slam och utgående slam från rötkammare gjordes för att beräkna OLR dess variationer. För att bedöma förhållandet mellan biogasproduktion och OLR, var mätning av gasutbyte och metanhalt nödvändigt, vilket utförs med en flödesmätare och en metanhaltmätare MSA EX-METER II (P). Dessutom registrerades temperatur, pH-värde, flyktiga fettsyror (VFA) och alkalinitet. Resultaten visar att rötkammaren klarade av en ökning av OLR till 3,15 kgVS/(m3 • dag). Dessutom har en ökning på biogasproduktion och metanhalt observerats efter att OLR ökades genom att tillföra externt slam. Biogasproduktionsmätningen i denna studie visade att biogasutbytet ökade med 73%, med en maximal produktion av 14.5 m3/dag när OLR ökades från 2,05 till 3,15 kg VS/(m3 • dag). Emellertid ökade metanhalten bara med 10,5%, till det högsta värdet 63%, vid samma ökning i OLR. Specifik gasproduktion (STP), som är ett annat sätt att utvärdera förhållandet mellan biogasproduktion och OLR, var in genomsnitt 0,65 Nm3/kg VS.

Zhanzhao Huang TRITA-LWR Degree Project 12:17
iv

Enhanced Biogas Production by Increasing OLR in Mesophilic AD with Sludge Recirculation
v
ACKNOWLEDGEMENTS I would like to express my deep appreciation to my academic supervisor, Erik Levlin, for his suggestions to improve this thesis; my advisor, Lars Bengtsson, and Christian Baresel, for all their support and advice in every aspect of my graduate studies experience; and my examiner, Elzbieta Plaza, for her intellectual nourishment and friendship I wish to thank all those who helped me in one way or another during the proceeding of my degree project: Jingjing Yang and Mila Harding for their time and patience while teaching me how to perform laboratory analyses. I would like to thank Swedish Environmental Research Institute (IVL) and the Department of Land and Water Resources Engineering for making possible this experience. Thanks also to my family and friends, for supporting me with my academic career and life.

Zhanzhao Huang TRITA-LWR Degree Project 12:17
vi

Enhanced Biogas Production by Increasing OLR in Mesophilic AD with Sludge Recirculation
vii
TABLE OF CONTENT Summary in Swedish .............................................................................................................. iii Acknowledgements ................................................................................................................. v Table of content .................................................................................................................... vii Acronyms and abbreviations .................................................................................................. ix Abstract ................................................................................................................................... 1 1 Introduction .................................................................................................................. 1
1.1 Background of the study .......................................................................................... 1 1.2 Introduction of the working environment ............................................................... 2 1.3 Aim of the study ....................................................................................................... 2
2 Basic principles and theories ........................................................................................ 2 2.1 Anaerobic digestion process .................................................................................... 2
2.1.1 Hydrolysis ............................................................................................................................... 3 2.1.2 Acidogenesis .......................................................................................................................... 3
2.1.3 Acetogenesis .......................................................................................................................... 3
2.1.4 Methanogenesis ..................................................................................................................... 4
2.2 Affecting parameters of anaerobic digestion ........................................................... 4 2.2.1 Temperature ........................................................................................................................... 4 2.2.2 pH, volatile fatty acid and alkalinity ................................................................................... 5
2.2.3 Total solid, volatile solid and hydraulic retention time ................................................... 5
3 Material and methodology ............................................................................................ 6 3.1 Description of the operating anaerobic digestion system ....................................... 6
3.1.1 Anaerobic digester ................................................................................................................ 6 3.1.2 Two tanks for sludge storage .............................................................................................. 7
3.1.3 Other components of the system ....................................................................................... 7
3.2 Analytical procedures for monitoring the anaerobic digestion system ................... 8 3.2.1 Sample taking ......................................................................................................................... 8 3.2.2 Monitoring and sample analysis .......................................................................................... 9
3.2.3 Increase of sludge input ..................................................................................................... 11
3.3 Troubleshooting during the experiment period ..................................................... 11 3.3.1 Clogging problem resulting from dry recycled sludge .................................................. 11
3.3.2 Dive in quantity of incoming sludge due to technical problem on the primary pump......................................................................................................................................................11
4 Results and discussion ................................................................................................. 11 4.1 General monitoring of the digester ......................................................................... 11
4.1.1 Monitoring of temperature ................................................................................................ 11
4.1.2 Monitoring of pH ............................................................................................................... 11
4.1.3 Monitoring of VFA and alkalinity .................................................................................... 12
4.1.4 Monitoring of TS and VS contents .................................................................................. 12

Zhanzhao Huang TRITA-LWR Degree Project 12:17
viii
4.1.5 Calculation of OLR ............................................................................................................ 13
4.2 Results regarding biogas production ......................................................................16 4.2.1 Biogas production rate and methane content ................................................................ 16 4.2.2 Specific gas production ...................................................................................................... 16
5 Conclusion....................................................................................................................19 6 Reference ..................................................................................................................... 20 Appendix I-The data of TS and VS contents in incoming sludge during the study period (from April 20th to July 1st) ..................................................................................................... I Appendix II-Data of VFA concentration and alkalinity via “5-pH-point titration method” and Cuvette test from April 20th to July 1st .......................................................................... IV Appendix III-Data of biogas production and methane content measured from April 20th to July 1st ................................................................................................................................... VI

Enhanced Biogas Production by Increasing OLR in Mesophilic AD with Sludge Recirculation
ix
ACRONYMS AND ABBREVIATIONS AD Anaerobic Digestion HRT Hydraulic Retention Time OLR Organic Load Rate SGP Specific Gas Production TS Total Solid UASB Upflow Anaerobic Sludge Blanket VA/Alk Volatile Acids to Alkalinity Ratio VFA Volatile Fatty Acid VS Volatile Solid WWWTP Wastewater Treatment Plant

Zhanzhao Huang TRITA-LWR Degree Project 12:17
x

Enhanced Biogas Production by Increasing OLR in Mesophilic AD with Sludge Recirculation
1
ABSTRACT For enhancing anaerobic sludge digestion and biogas recovery, an increase in organic load rate (OLR) from 1.0 to 3.0kgVS/(m3·day) was imposed upon a new anaerobic digestion process combined with a sludge recirculation. The new setup requires a traditional mesophilic anaerobic digester coupled with a centrifuge for maintaining relatively high solid content within the digester. The hypothesis of this study was that increasing continuously OLR from 1.0 to 3.0kgVS/(m3·day) in a pilot-scale anaerobic digester with recycled sludge would not badly influence the digester stability, based on which biogas production would be enhanced. To test this hypothesis, a continuous 73-day study with laboratory experiment was conducted. Due to scarcity of original feeding sludge and its deteriorating quality, OLR had to be increased relied on introduction of extra sludge followed by measurement of total solid (TS) and volatile solid (VS) contents in both feeding sludge and digester sludge, for calculating OLR and examining its variations. To assess the relationship between biogas production and OLR, a measurement of gas yield and methane content was a necessity, performed by applying a biogas flow meter and MSA AUER EX-METER II (P). Moreover, temperature, pH value, volatile fatty acid (VFA) and alkalinity must be tested frequently, for the purpose of preventing system failure. The results demonstrate that the digester succeeded in withstanding an OLR up to 3.15kgVS/(m3·day). Furthermore, an enhancement in biogas yield and methane content were observed after increasing the OLR by introducing extra sludge. Biogas production measurement performed during this study indicated that biogas yield was enhanced by 73%, with a maximum production of 14.5m3/day, when OLR was increased from 2.05 to 3.15kgVS/(m3·day). However, methane content was merely promoted by 10.5%, to the highest value of 63%, with the same increase in OLR. Specific gas production (SGP), as another means of evaluating the relationship between biogas production and OLR, was observed to be 0.65Nm3/kg VSin averagely.
Key words: biogas, methane, anaerobic digestion, mesophilic condition, organic load rate, specific gas production, total solid and volatile solid.
1 INTRODUCTION 1.1 Background of the study Awareness is growing that the handling of sludge which is produced along with the purification of municipal wastewater in an appropriate way allows no negligence. According to the data from EUROSTAT, the European annual sewage sludge production in 2010 is about 11.578 million tons (Consortium ESWI, 2011). However, the associated sludge has to undergo some treatment process before being disposed of, to meet the disposal acceptance regulation. The most common purpose of sludge treatment is to minimize the volume of sludge, and to stabilize or inertize the highly putrescible organic matter in sludge. These processes could take up to about half of the operating costs of a wastewater treatment plant (WWTP). In spite of the high cost and irritation of sludge treatment, benefit can be brought in, in terms of biogas produced from sludge anaerobic digestion. Biogas, is normally referred to as a mixture of methane gas (CH4) and carbon dioxide (CO2), can
be biologically synthesized by methanobacterium in the oxygen-free condition, namely anaerobic digestion (AD). (Harris, 2008) As is a mixture gas, the biogas generated from anaerobic digester is composed of approximately 55-65vol% of CH4, other components including 30-40vol% of CO2, fractions of water vapor, traces of hydrogen sulfide, ammonia and hydrogen gas, and probably other contaminants such as siloxanes (Appels, et al., 2008), depending on the operation and type of digester. However, different constitution in biogas can alter its energy potential. According to the EU directive on the promotion of renewable energy, objective has arised that 20% of all energy used in Europe has to come from renewable energy by 2020, including biogas, biomass and bioliquids. Being one form of renewable energy source listed on the EU directive, biogas is a desirable energy for a wide range of applications, such as vehicle fuel, electricity, heat and steam (Appels, et al., 2008). For this reason, it is worth to try to elevate the biogas production from anaerobic digestion process, to meet the energy-saving perspective of European Commission.

Zhanzhao Huang TRITA-LWR Degree Project 12:17
2
To achieve this prospective, enhancement of biogas production in AD system is necessary, by, in this study, increasing the organic load rate (OLR). Many studies have reported how the OLR affects on common monitoring parameters in either pilot- or full-scale AD systems treating a wide variety of substrates; however, there is little information available for how the AD system with high solid content reacts if a large OLR is put. The hypothesis of this study was that increasing continuously the OLR from 1.0 to 3.0kgVS/(m3 · day) in a pilot-scale anaerobic digester with recycled sludge would not badly influence the biochemical or molecular properties related to the stability and performance in case complete system failure is caused. To test this hypothesis, this study was divided into two phases: 1) stabilized phase, from April 20th to June 20th (62 days); and 2) evaluating phase, from June 21st to July 1st (11 days). The first phase was to assure that the AD system performance was stable enough to undertake a lager OLR, while the second phase was to evaluate the effects of progressive OLR on biogas production without causing system failure.
1.2 Introduction of the working environment
In this study, the enhancement of biogas production was performed in a pilot scaled anaerobic digester at Hammarby Sjöstadsverket which is a research site located at Henriksdal wastewater treatment plant. Inside the plant are there three mainly so-called “lines” which are: line 1, aerobic treatment with activated sludge and biological nitrogen and phosphorous removal; line 2, aerobic treatment with membrane bioreactor and reversed osmosis; and, line 3, anaerobic treatment with UASB and biological nitrogen reduction. All of the lines were supplying this study with different components of sludge. Thereinto, line 1 generated approximately 80-90% primary sludge and 10-20% activated sludge. Sludge coming out of drum filter in line 2 and Upflow Anaerobic Sludge Blanket (UASB) reactors in line 3 were also utilized in this study. The mixed sludge made up the incoming sludge to the system of this study and its main properties is shown in Table 1. Table 1 Main parameters for this study of the incoming sludge. Parameters pH TS (%) VS (%)
Values
6.51
1.38-4.62 (average: 3.00)
74.89-86.29 (average: 80.59)
1.3 Aim of the study The main objective of this study was to investigate whether biogas generated in this AD system responded to the OLR, and try to evaluate the coordination between enhancement of biogas production and the increase of OLR. Specific gas production was introduced as a means of evaluation. But before that, it was essential to maintain a comfortable experimental condition under which the AD system could to be operated with a TS content above 5%, and a hydraulic retention time (HRT), i.e. volume of the digester divided by incoming flow that entering the system, around 15 days, at a temperature of 30-38℃ (in optimum range of mesophilic condition) and a safe pH range of 6.2-7.2 (Wijekoon, et al., 2010). To maintain the assumed TS content of sludge in the digester, a centrifuge component was applied as a dewatering method. The resulting sludge with a TS content varying from 17.47-19.74% was recycled and pumped to the digester for the next AD process. However, clogging problems in the piping system could easily be caused due to high solid content in sludge stream. To avoid it, wet sludge from two storage tanks was pumped to mix with the dewatered or dry sludge every two point four minutes during running of the centrifuge. The proceeding way to increase OLR to 3.0kgVS/(m3·day) was by continuously adding extra sludge from Henriksdal wastewater treatment plant as well as the original incoming sludge. During this phase, pH value and VFA concentration must be monitored at all times to be in the range of 6.2-7.2, and below 500mg/L, respectively (United States Environmental Protection Agency, 1976).
2 BASIC PRINCIPLES AND THEORIES
2.1 Anaerobic digestion process Anaerobic digestion (AD), serving a versatile technology platform for industry and society, is defined as a succession of processes in which microbes decompose biodegradable matters without the presence of oxygen. When this process occurs at WWTP to degrade or digest sludge, bacteria involved in AD biologically convert the majority of VS in sludge into biogas and other innocuous digested solids. This conversion is generally considered as a three-stage process (Gómez, 2010): 1) hydrolysis of both insoluble organic material and high molecular weight compounds;

Enhanced Biogas Production by Increasing OLR in Mesophilic AD with Sludge Recirculation
3
2) acetogenesis of soluble organic compounds; 3) acetogenesis of volatile fatty acids; and 4) methanogenesis of acetate, carbon dioxide and hydrogen gas (H2). Figure 1 gives a schematic and general idea of AD process.
2.1.1 Hydrolysis The first step of AD process is known to be hydrolysis. In chemistry, hydrolysis is a concept that lysis or splitting of a compound with water (hydro). In AD process, such lysis also occurs that either particulate or colloidal organic compounds with high molecular weight, such as cellulose and proteins, can be hydrolyzed by facultative anaerobes and anaerobes. These hydrolytic bacteria are capable of secreting corresponding enzymes that catalyze the breakage of chemical bonds in high molecular compounds, resulting in the formation of hydrolytic products, simple soluble monomers, such as monosaccharides (Equation 1) and amino acids (Equation 2). Equation 1: Cellulose+H2O Monosaccharides Equation 2: Proteins+H2O Amino acids Hydrolysis is thought to be one of the most important stages of AD process, because biogas potential is to a large extent depended on the biodegradability and hydrolyzed degree of the complex organic compounds. The process is extremely time-consuming and proved to be the slowest step in AD when complex organic matters (especially lignin-rich matters) appear in the degradation (Myint, et al., 2007). In other words, hydrolysis is therefore the rate limiting stage of AD.
2.1.2 Acidogenesis The second stage is referred to as acidogenesis, or fermentation. It is commonly considered as the quickest step in AD. During this stage, the monomers or products from the previous stage undergo endocellularly biochemical degradation, resulting in the production of acetate acids (CH3COOH) (Equation 3), hydrogen gas and carbon dioxide, and volatile fatty acid (VFA), such as propionate (CH3CH2COOH) (Equation 4, 5) and butyrate (CH3CH2CH2COOH) (Equation 6), which are recognized as the most important intermediates in AD process. Equation 3: C6H12 O6+2H2O 2 CH3COOH+2 CO2+4 H2
Equation 4: C6H12 O6+2H2O 2 CH3CH2COOH +2 H2O Equation 5: 3C6H12 O6 4 CH3CH2COOH +2 CH3COOH+ 2 CO2+2 H2O Equation 6: C6H12 O6 CH3CH2CH2COOH +2 CO2+2 H2
2.1.3 Acetogenesis Acetogenesis is the third step of AD process. It provides an environment in which propionate, butyrate and a mass of other VFA are assimilated by acetogenic autotrophs, and convert into acetic acids, hydrogen gas and carbon dioxide (Equation 7, 8). The extent of this conversion, however, is largely restrained by the partial hydrogen pressure in the digester. If too much hydrogen gas is accumulated resulting in significant partial pressure, hindrance will be in the activity of acetate-forming bacteria and acetate production will be lost. This hindrance must be minimized with respect to enhancement of methane gas (CH4) production in the final stage. On one hand, the methyl group of acetate can be converted into methane gas. On the other hand, H2 can also be used by methane-forming bacteria for the
acidogenesis
hydrolysis
acetogenesis
lipids proteins poly-saccharide
nucleic acids
fatty acid
amino acids
mono-saccharide
purines, pyrimidines
H2, CO2
VFA
CH4, CO2
acetic acid
microorganisms
hydrolysis
microorganisms
hydrolysis
methanogenesis
Figure 1. Illustration of compounds decomposition and substances produced in AD process.

Zhanzhao Huang TRITA-LWR Degree Project 12:17
4
synthesis of methane gas. The mechanism will be further introduced in the following section. Equation 7: CH3CH2COOH+2 H2O CH3COOH+ CO2+2H2 Equation 8: CH3CH2CH2COOH +2 H2O 2CH3COOH+2H2
2.1.4 Methanogenesis In methogenesis, the final stage of AD process, methanogens or methane-forming bacteria serve as a “producer” to generate CH4 by utilizing the substrates converted in former stages (mainly acetate, hydrogen gas and carbon dioxide). In general, there are three main categories of methanogens achieving the formation of methane gas: 1) Hydrogenotrophic methanogens The Hydrogenotrophic methanogens use hydrogen gas as nutrient to reduce carbon dioxide to methane gas (Equation 9). Since hydrogen is consumed in this conversion, a low partial hydrogen pressure in AD process can be maintained. Equation 9: CO2+4H2 CH4+2 H2O 2) Acetotrophic methanogens Acetate is broken down by the Acetotrophic methanogens into methyl group (-CH3) and carboxyl group (-COOH). The methyl group is further converted to methane gas while the carboxyl group is transformed to carbon dioxide (Equation 10). And then the carbon dioxide can be involved in the Equation 9, converting to methane gas. Equation 10: CH3COOH CH4+ CO2 3) Methylotrophic methanogens Unlike the Hydrogenotrophic methanogens and Acetotrophic methanogens, the Methylotrophic methanogens can produce methane directly from methyl groups but not hydrogen and carbon dioxide. Equation 11 is an example of how methanol (CH3OH) is transformed to methane Table 2 Respective range and optimal temperature of three conditions in AD process. Conditions Range Optimum Psychrophilic 10-30℃ <20℃ Mesophilic 20-45℃ 30-38℃ Thermophilic 35-75℃ 49-57℃
gas with the help of the Methylotrophic methanogens. Equation 11: CH3OH+2H CH4+ H2O These three categories of methanogens obtain different quantity of energy while producing methane gas because of different substrates as their nutrient source. Basically the Hydrogenotrophic methanogens can gain more energy from hydrogen than that the Acetotrophic methanogens get from acetate. However, in AD, only 30% methane gas is produced from the usage of hydrogen due to the limited supply of hydrogen in an anaerobic reactor. In other words, about 70% of methane gas production is derived from acetate (Gerardi, 2003).
2.2 Affecting parameters of anaerobic digestion
Now that a sequence of reactions in AD process is extremely depended on the bacterial activities which are very sensitive to conditions in a digester, optimal conditions ought to be maintained to obtain the maximum biogas production.
2.2.1 Temperature Temperature has a significant influence on methane yield in AD process, because temperature affects not only gas-transfer rates and sedimentation properties of substrates involved in each reaction, but also the metabolic activities and structure of microbial community. According to the temperature range in which distinct activated mathenogens are dominant in AD process, three AD system can be categorized (Tab. 2). Studies showed that compared with mesophilic condition, AD under thermophilic condition (at a higher temperature) has a better performance on biochemical reactions, efficiency in organic matter degradation, methane production rate, (Zabranska, et al., 1999) and reduction of pathogen and parasite concentrations (Oropeza, et al., 2000). And hydraulic retention time (HRT) can also be
Figure 2. Changes of hydraulic retention time (HRT) along with different operating.temperature.

Enhanced Biogas Production by Increasing OLR in Mesophilic AD with Sludge Recirculation
5
efficiently shortened along with the increase of temperature. Figure 2 shows the relationship between operating temperature and HRT. Although thermophilic temperature contributes to high performance of AD process in many ways, its shortages still needs to be taken into consideration while choosing a running range of temperature for a digester. For example, themo-philic AD system has a bigger chance to cause thermal shock than mesophilic system. The reason is because temperature above roughly 45℃ causes a change in dominant mathenogens (United States Environmental Protection Agency, 1976), whereas thermophilic mathenogens has a higher sensitive to temperature variation. Impact due to temperature variation on the stability of thermophilic AD system is therefore larger. Other examples are higher energy requirements of thermophilic AD for maintaining a higher temperature, impact on pH value resulting from a higher VFA content in thermophilic AD process, etc.
2.2.2 pH, volatile fatty acid and alkalinity AD is such a biochemical process involving massive enzymatic activities, e.g. metabolism and propagation, that pH over below 6.2 can bring a strong inhibition to methanogens. For most methanogens, the optimal pH range is found to be roughly 6.8-7.2, and 4.0-8.5 for fermentative bacteria (Hwang, et al., 2004). Sometimes variation in pH value is inevitable. One of the reasons can be because of over organic load rate to the system that results in acid (VFA) accumulation. The VFA produced by, e.g. acetate-formers, is not able to be used out by mathenogens at the same speed as its production. In other words, the kinetic uncoupling between acid-formers and consumers (Harper and Pohland, 1986) breaks the pH stability in the system. Another reason is the length of hydraulic retention time (HRT). Mathenogens start to grow and consume VFA at a HRT of more than five days. If HRT is too short, VFA will be accumulated and pH increases. The third reason is the carbon dioxide content of the biogas. As is well known, carbon dioxide is an acidic gas. Its acidity and solubility to water can place pH variation on the digesting environment. In general AD process, the highest tolerable VFA concentration for methanogens is 500mg/L. In spite of the sensitivity to working conditions, pH value in digester still has some buffer to avoid a rapid change, as long as sufficient alkalinity is contained in the system. Alkalinity is the result of many different reasons. One of them is e.g. large
quantities of proteinaceous wastes introducing to the digester. Release of amino groups (-NH2) from proteinaceous wastes and production of ammonia (HN3) (Equation 12) can help balance the acid formed by bacteria so that the pH value remains at a relatively constant level. Equation 12: NH3+H+ NH4+ Even though alkalinity is essential as being buffer in digester, overload of alkaline substrates introduced to the digester should be prevented. Otherwise, pH balance will likewise be broken. The volatile acids to alkalinity ratio (VA/Alk) is therefore used as an indicator to test if the digester is performing well. For safety reason, VA/Alk should be kept as less than 0.25 as possible (United States Environmental Protection Agency, 1976).
2.2.3 Total solid, volatile solid and hydraulic retention time
During the operating procedure of an anaerobic digester, loading is one of the most vital factors on enhancement of methane yield that must be considered, including solid loading and hydraulic loading (hydraulic retention time). Solid loading or total solid (TS) of input, incoming sludge in this study, has a content of about 3-5% in primary sludge, and only 1% in activated sludge. The rest composition is water which is widely thought to be helpless for the AD process, but increases the reactor volume and raises the operation investment. If water content in sludge drops down from 97.5% to 95%, the sludge volume will become half of it was. For this reason, it is a necessity that thickening and dewatering instrument such as thickener and centrifuge is involved in the AD system. Volatile solid (VS) is usually expressed as a percentage of total solid. As is food for microorganisms, volatile solid or organic substrate is of more importance compared with ash or inorganic substrate, the other constitution in total solid. Hydraulic retention time (HRT) is the time how long the water is kept inside the reactor. It cannot be too long or too short because, if HRT is too long, operation efficiency will drop, benefit will be cut, larger reactor will be needed, and investment fund will be increased as well; if HRT is too short, mathenogens will be washed out, and VFA concentration in reactor will be relatively high. Based on the generation time for mathenogens which is the time required for a bacterial

Zhanzhao Huang TRITA-LWR Degree Project 12:17
6
population to double in size, typical HRT is more than 10 days.
3 MATERIAL AND METHODOLOGY
In this chapter, the AD system or pilot unit used in this study will be described. The methods followed to operate this unit, to take and analyze samples will be introduced. On top of these, troubles occurred during the whole operation period of this pilot unit will be presented. And solutions to the troubles or improvement for the situations will also be given in this chapter.
3.1 Description of the operating anaerobic digestion system
Figure 3 is the flow diagram of the operating AD system in this study. The system can basically be divided into three sections: 1) Pre-treatment: Since sludge with relatively high water content was introduced from the three lines, thickener was built up before the anaerobic reactor as a pre-treatment. 2) Digestion and recirculation; This section mainly includes the principal reactor whose anaerobic chamber supplied the AD process with an appropriate reaction environment; and two sludge tanks, recirculation pump and centrifuge, all of which were serving the sludge recirculation procedure that was supposed to retain as much of solid content in the whole AD system as possible. 3) Disposal. In recirculation procedure, sludge tended to be re-digested was needed to be dewatered in the centrifuge before going back to the reactor again.
centrifuge before going back to the reactor again. Water that was separated from recirculation sludge is called rejected water-is intended to be removed from the system as liquid disposal. On top of that, sludge having been digested in a long period becomes solid residual which should be disposed as well. The whole period of time form when sludge enters the reactor to it is disposed is called sludge retention time (SRT). In this study, SRT is about a half year.
3.1.1 Anaerobic digester Anaerobic digester tank is the principal opponent in the studying system and cardinal place where AD process reactions occur. This stainless-steel-made tank which sites right beyond the plant wall is cylinder-shaped, with a radius of 1m. Its full volume is 12m3; however, for safety reason, the effective volume is only 9m3, which means the exceeded sludge will overflow out of the digester through a spill hole. Raw sludge from thickener enters the digester via an inlet on the upper half of the tank. Not much lower is another inlet for recirculation sludge. After a few days’ stay in the digester, sludge will leave the tank through the outlet located almost at the tank bottom, and be further pumped to two storage tanks. The digester chamber is completely isolated from oxygen outside, with an internal moving mixer of propeller. Its power is supplied by a motor fixed on top of the digester, beside the biogas outlet.
Figure 3. The process configuration of the AD system.
Figure 4. Anaerobic digester tank.

Enhanced Biogas Production by Increasing OLR in Mesophilic AD with Sludge Recirculation
7
Due to the continuous agitation of propeller during the whole study period of time, sludge inside the digester tank was supposed to be completely mixed. To keep the inner temperature of the digester with the range of mesophlic digestion, an external heat exchanger was coupled with the digester tank by two hoses. In this case, sludge is circulated from the digester through the exchanger, warmed up and then back to the digester. Moreover the heat exchanger was under control of a computer system, temperature inside the digester was automatically stabilized at 37.2℃±1.6℃. Figure 5 shows the appearance and location of the heat exchanger. . 5 show the appearance and location of the heat exchanger.
3.1.2 Two tanks for sludge storage Two cylinder steel tanks are the starting point of the whole sludge recirculation process. They both have a diameter of approximately 1.3m and a height of 1.8m. During this study, the two storage tanks were supposed to be correlated to each other and collaborating together. The goal of installing sludge storage tanks was to temporarily arrange the digested sludge coming from the digester, which is a preparation for the following procedure of dewatering. Because the incoming sludge volume was not big enough to enable the dewatering procedure to be continuously conducted, digested sludge had to be stored somewhere waiting for one or two days. While being arranged here, the digested sludge could be exposed to the air due to the non-strictly sealed structure of these two tanks.
3.1.3 Other components of the system Thickener: As in Figure 7, the cylinder-shaped thickener, with a conical part at its bottom has a height of 1.7m. The diameter of its cylindrical part is 0.75m. Here is entrance of the studying system. Once incoming sludge was pumped in from the three cad
Storage tank No.1
Storage tank No.2
To heat exchanger
To digester
Heat exchanger Sampling spot
Figure 5. External heat exchanger with two hoses connecting the digester tank (located in the other side of the wall).
Figure 6. Two storage tanks for digested sludge.
Figure 7. Thickener as pre-treatment unit before the digester.

Zhanzhao Huang TRITA-LWR Degree Project 12:17
8
lines, it firstly went to a thickener where the water-rich sludge was supposed to be thickened and lose some water content. However the thicken was not working quite well during this study for some functional reason. Therefore, while sludge left the thickener, its water content did not obviously drop. Centrifuge: In this study, a centrifuge was set up with a purpose of reducing as much water content in digested sludge as possible. This is also the reason why the anaerobic digester was coupled with a sludge recirculation in this study. Figure 8 gives what the centrifuge used is looked like. When enough sludge was accumulated in the storage tanks, the centrifuge for dewatering was started up. When digested sludge was pumped from storage tanks into the bowl of a running centrifuge, the solid phase with a relatively small density gained more effect from the centrifugal force, and thus was “thrown off” the rotating bowl, discharged from the outlet, and pumped back to the digester again. Nevertheless the relatively heavier water phase stayed in the rotating bowl and flowed out from the liquid outlet. In this study, the dewatering process taking effect on water content reduction increased sludge TS content from approximately 5.27% which was sampled from the digester, to around 18.50% which was sampled after the centrifuge. Such an improvement in sludge solid content also benefit from the addition of high molecular polymer. In this study, polymer addition was along with every single run of the centrifuge. Firstly the floury white polymer was compounded with water to form solution with a volumetric concentration of 0.1%. Then the solution was pumped up to the centrifuge, where polymer could be in contact with the sludge to be dewatered. Once contacting sludge, this flocculating agent, polymer was trying
to trap sludge particles and floc was finally formed. The floc was of larger mass and firm enough to survive from high-speed rotary shear force exerted by the centrifuge bowl. This could contribute to a better separation between solid and water phase. Recirculation pump: Every time when dewatering procedure was conducted, a pump that assisted a smoother sludge recirculation proceeding had to be turned on as well, with an running interval of 2.4 minutes and running time of 40 seconds. The pump received wet sludge from the two storage tanks and delivered it to the centrifuge solid outlet. Built-up of the recirculation pump was an essential and effective method to avoid clogging problem in the post-centrifuge host, rather than introducing extra water to the system. Organic waste tank: The organic waste tank is a 3.5-meter high cylindrical tank with a diameter of 1.75m. When stabilized phase of this study ended on June 20th, the OLR began to be enhanced by inputting extra sludge from Henriksdal wastewater treatment plant. During the second phase from June 21st, nearly 6.5m3 of extra sludge was introduced to the system. But before that, the extra sludge was reserved in the organic waste tank.
3.2 Analytical procedures for monitoring the anaerobic digestion system
To observe the relationship between OLR and biogas production, samples should be taken every one or two days through the study time for TS and VS content measurement. VFA and alkalinity test were needed to be conducted because system failure must be avoided. The amount of biogas produced should be recorded every weekday; however, some were still missing for unexpected reasons.
3.2.1 Sample taking According to different testing purpose, Samples were taken from four spots in the system: 1) Right after the thickener for incoming sludge sample. Incoming sludge was drawn to a plastic barrel by a sampler which was running for 0.7 second each time with a delay of 4 seconds. 2) On the heat exchanger taking sludge sample out of the digester at its bottom. The sample from this spot was called outcoming sludge. 3) On the liquid outlet and 4) on the solid outlet of the centrifuge. Sample from spot No.3 was called rejected water while No.4 recycled sludge. Samples from spots No.2 to No.4 were taken in small plastic bottles
Figure 8. Centrifuge for dewatering of digested sludge.

Enhanced Biogas Production by Increasing OLR in Mesophilic AD with Sludge Recirculation
9
and stored temporarily before analysis. Taken samples, however, should be analyzed as soon as possible, in case sample properties have been changed.
3.2.2 Monitoring and sample analysis TS and VS contents: Total solid (TS) and volatile solid (VS) contents were measured every other day on incoming and extra sludge for monitoring OLR variations, on outcoming sludge for examining digestion circumstances and determining solid residual disposal, on rejected water and recycled sludge for calculating the dewatering rate of the centrifuge. According to its definition, TS is referred to as the remaining solid after a wastewater sample has been evaporated and dried at a specified temperature of 103-105℃ (Metcalf and Eddy, 1999). In this study, all samples were placed in small aluminum plates and left in a convenient oven with a temperature of 105℃ for 24 hours. TS content, expressed in percentage, is calculated as:
md—total mass of dry sample and plate, g; 5 show the appearance and location of the heat exchanger.
mp—mass of plate, g;
mw—total mass of wet sample and plate before drying, g. Volatile solid (VS) is defined as solids that can be volatilized and burned off when the TS are ignited at 500±50℃ (Metcalf and Eddy, 1999). Based on the definition, VS content, also expressed in percentage, is calculated as:
mi—total mass of incombustible fraction and plate after burning, g. The data of TS and VS contents in incoming sludge during the study period (from April 20th to July 1st) was documented (Appendix I). The goal was to calculate OLR and increase OLR to 3.0kgVS/(m3·day) in the second phase. OLR, expressed in kgVS / (m3·day) is calculated as:
Qin—incoming sludge flow, L/day; V—volume of the digester, 9 m3. pH measurement: pH measurement was applied on outcoming sludge samples by either the detecting probe sited in the digester, or a pH meter WTW pH 330i. Before each single use, the pH meter was calibrated with buffer solutions from Merck, pH 7.00 and pH 4.00 at ambient temperature. Since results from outcoming sludge were mostly supposed be below 7.00, it was reasonable to use buffer solutions with such pH values.
VFA and alkalinity: A VFA and alkalinity test is absolutely of the essence to prevent system failure. This is very important because the system will be entirely ruined if failure occurs. All the previous efforts will be wasted. As previously mentioned, it should be noticed that VFA concentration must never exceed 500mg/L and VFA to alkalinity ratio (VFA/Alk) should be kept as less than 0.25 as possible. As to maintain stability of the system, especially the digester, certainly VFA and alkalinity test was applied on outcoming sludge sample, by means of “5-pH-point titration method” (Moosbrugger, et al., 1993.) and complementary Cuvette test
Figure 9. Sampler and plastic barrel for incoming sludge.

Zhanzhao Huang TRITA-LWR Degree Project 12:17
10
(LCK 365 for VFA and LCK 362 for alkalinity). In this study, the “5-pH-point titration method” is more reliable for its precise result of VFA concentration of below 50mg/L which is the lowest detectable concentration for the Cuvette test. Thus the Cuvette test can only be performed as a complementary method. The setup of “5-pH-point titration method” is illuminated in Figure 11. VFA concentration and alkalinity results can simultaneously be obtained via this method. But before testing, firstly sample has to be filtrated and in succession the filtrate is introduced in the setup for titration with 0.05mol/L of hydrochloric acid solution (HCl).The data of VFA concentration and alkalinity from April 20th to July 1st was documented (Appendix II). Biogas production and methane content: Biogas production was measured in the total biogas flow, expressed in cubic meter per day, by a gas meter connected with the gas outlet of the digester. Methane content, expressed in percentage, was tested with an EX-METER II from MSA AUER. It is a hand-held device for measuring combustible gas-air or vapor-air. Since biogas production and methane content are key variables to this study, both of them have to be measured and monitored every weekday. Data fact
5 shows the appearance and location of the heat exchanger.
Stirring machine
pH meter
Beaker filled with filtrate
Burette filled with HCl
Figure 10. Portable pH-meter, model: WTW pH 330i.
Figure 11. The setup of “5-pH-point titration method”.
Figure 12. The gas meter for total flow of biogas production.

Enhanced Biogas Production by Increasing OLR in Mesophilic AD with Sludge Recirculation
11
from April 20th to July 1st was documented in Appendix III.
3.2.3 Increase of sludge input From June 21st on, the second phase began. OLR was increased by pumping extra sludge, together with the ordinary incoming sludge, into the system. Around 6.5m3 of extra sludge was infused in eight days until June 28th, at an inflow rate of 768L/day with one exception of 960L/day on June 22nd. Meanwhile the ordinary incoming sludge flow was reduced to 192L/day in case over-range of OLR was reached and system failure occurred. Compared with the ordinary incoming sludge, the extra sludge was analyzed to be of homogeneous quality and higher solid fraction. TS and VS contents were measured as well (Appendix I).
3.3 Troubleshooting during the experiment period
3.3.1 Clogging problem resulting from dry recycled sludge
Dry sludge has to be supplied with enough humidity to guarantee achievement of smooth delivery of sludge. However, extra water from outside is undesirable otherwise the allocation of centrifuge is in vain. From this point of view, using intrasystem wet sludge to increase humidity and avoid clogging problem in tubes is a preference.
However, during the study period, clogging problem occurred several times because the assisting pumps stopped unexpectedly, or too much sludge was fed to the centrifuge and thus a over amount of dry sludge was produced, stuck in the tube. When clogging happened, the recirculation process had to cease and tap water was introduced to flush the clogging tube, which hindered dewatering process and postponed the study proceeding.
3.3.2 Dive in quantity of incoming sludge due to technical problem on the primary pump
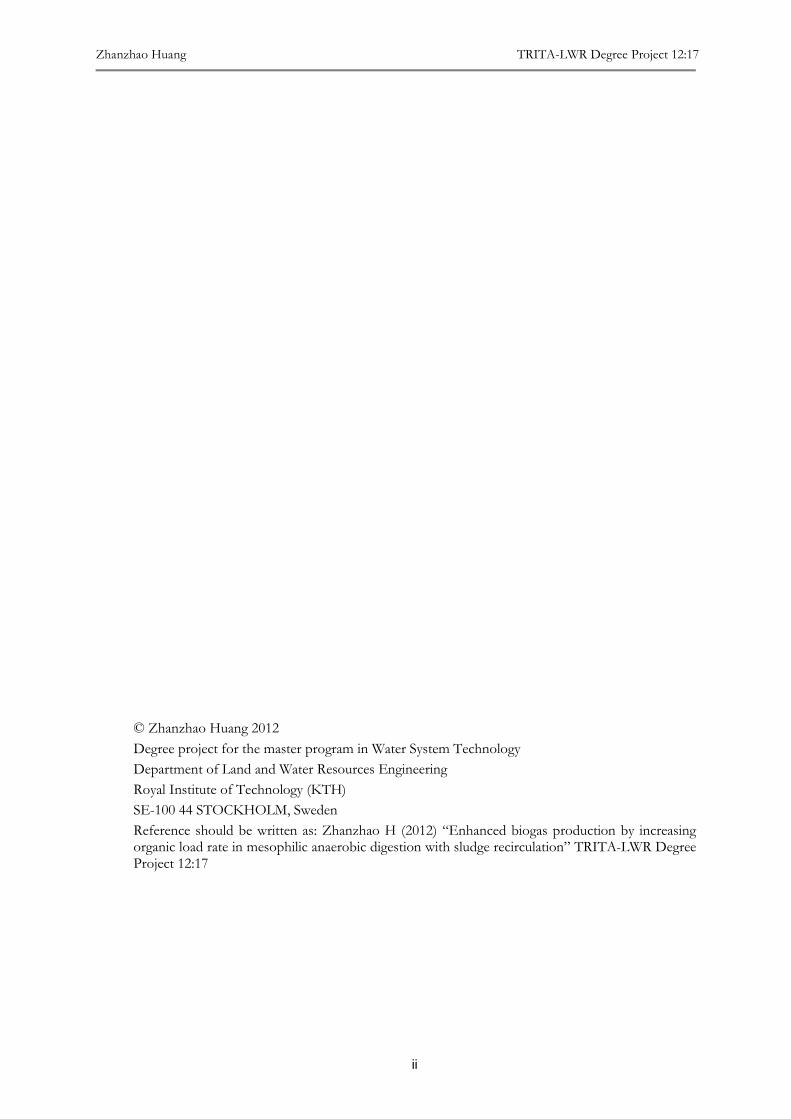
For some technical reason, the primary pump supplying the three lines with raw sludge was shut down on June 15th. This led to a direct sudden dive in quantity of incoming sludge to the AD system, from 960L/day to 555L/day (Figure 14). It was harsh time for the methanogens without sufficient organic supply, but consuming recycled sludge from recirculation process. This situation was not effectively improved until June 21st when extra sludge was introduced.
4 RESULTS AND DISCUSSION 4.1 General monitoring of the digester 4.1.1 Monitoring of temperature Temperature has a significant effect on either methanogens metabolisms or biochemical reaction rates. Although these two aspects are proved to be contributed by relatively high temperature, stability of high temperature (e.g. thermophilic condition) is not easily maintained. Moreover, too high temperature can produce irreversible damage on biological structure of methanogens. Thus the goal of temperature measurement was to assure that the digester temperature during operation had to be within mesophilic range (optimum of 30-38℃ is preference). (Figure 15) Over the study time, temperature is mostly kept between 35-38℃, with only some exceptions. For example, the temperature was 41.1℃, 40.9℃and 41.0℃ on day 2 (April 21st), 17 (May 6th) and 73 (July 1st). These unanticipated high temperature values appeared on account of some technical problem on the heat exchanger. Fortunately, relevant correction was performed once the temperature turned out to be out of range, letting mesophilic digestion back on the right track.
4.1.2 Monitoring of pH As mentioned above, AD process is extremely vulnerable to pH value. Inhibition on methanogens occurs on condition that pH drops
Figure 13. MSA AUER EX-METER II (P).

Zhanzhao Huang TRITA-LWR Degree Project 12:17
12
below 6.2 or exceeds 7.2. Therefore a pH monitoring was performed on weekdays in this study in order to guarantee that methanogens metabolize in an appropriate acidity. Besides the pH value in the digester, pH value of the filtrate from outcoming sludge sample was also on the checking list, as one of variables for calculating VFA concentration in “5-pH-point titration method”. Data was recorded in Figure 16. The results indicate that pH values for digester sludge over the study time are within the range of 6.2-6.8. This is a safe range for operating the anaerobic digester, even though it is lower than optimum ranging from 6.8-7.2. From day 1 (April 20th) to day 24 (May 13rd), pH in the digester remains rather stable, within 6.25-6.35. The digester has a satisfying performance in terms of the high biogas production and methane content. On day 27 (May 16th), incoming sludge was stopped adding in respect that redundant water content was intended to remove from the digester. From the next day until day 47 (June 5th) the incoming flow returned to be 380L per day. The associated pH increases above 6.4 in this period as less VFA is generated from incoming sludge. In the second phase (day 62-73), pH in the digester climbs a step further to over 6.6 on account of the introduce of extra sludge with a pH 6.24. This is very interesting that though more VFA is supposed to be produced from the extra sludge, pH level does not go down, but up. One reason can be because the extra sludge probably contains rich alkaline substrates, such as proteinaceous wastes (see Section 2.2.2). Another explanation is that alkaline flocculant could be dosed to form the extra sludge. Unfortunately any further analysis on chemical compositions of the extra sludge has not been performed in this study.
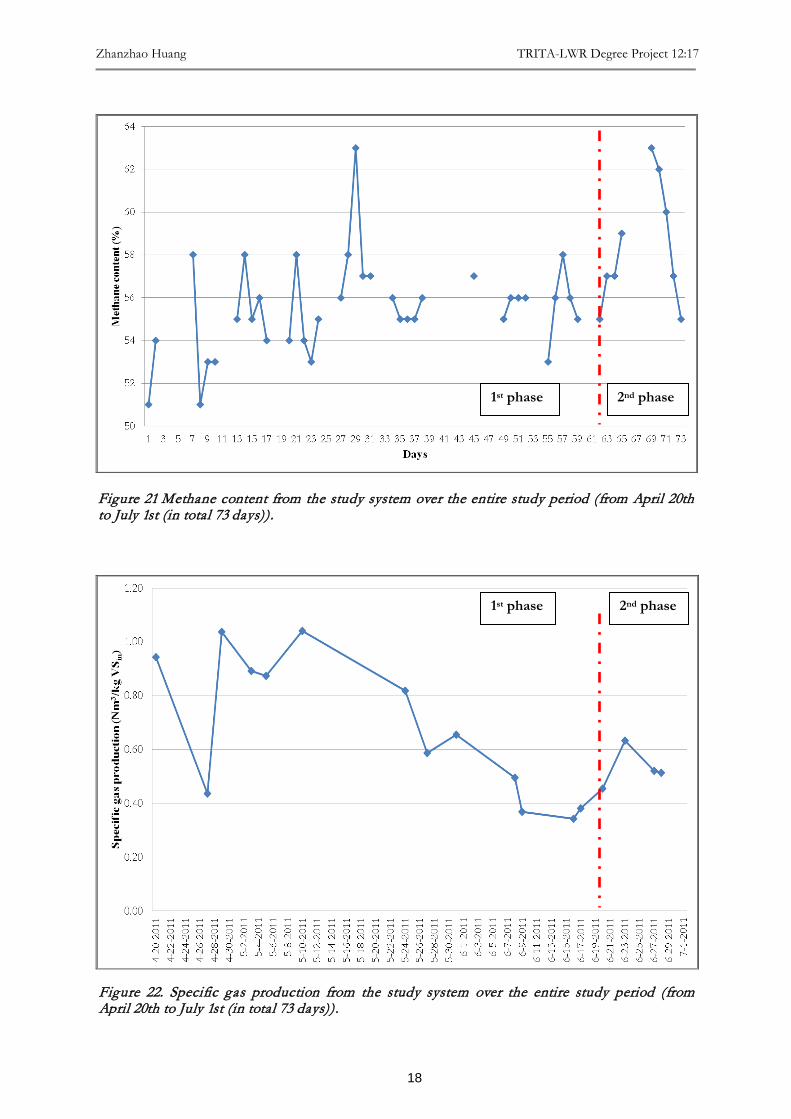
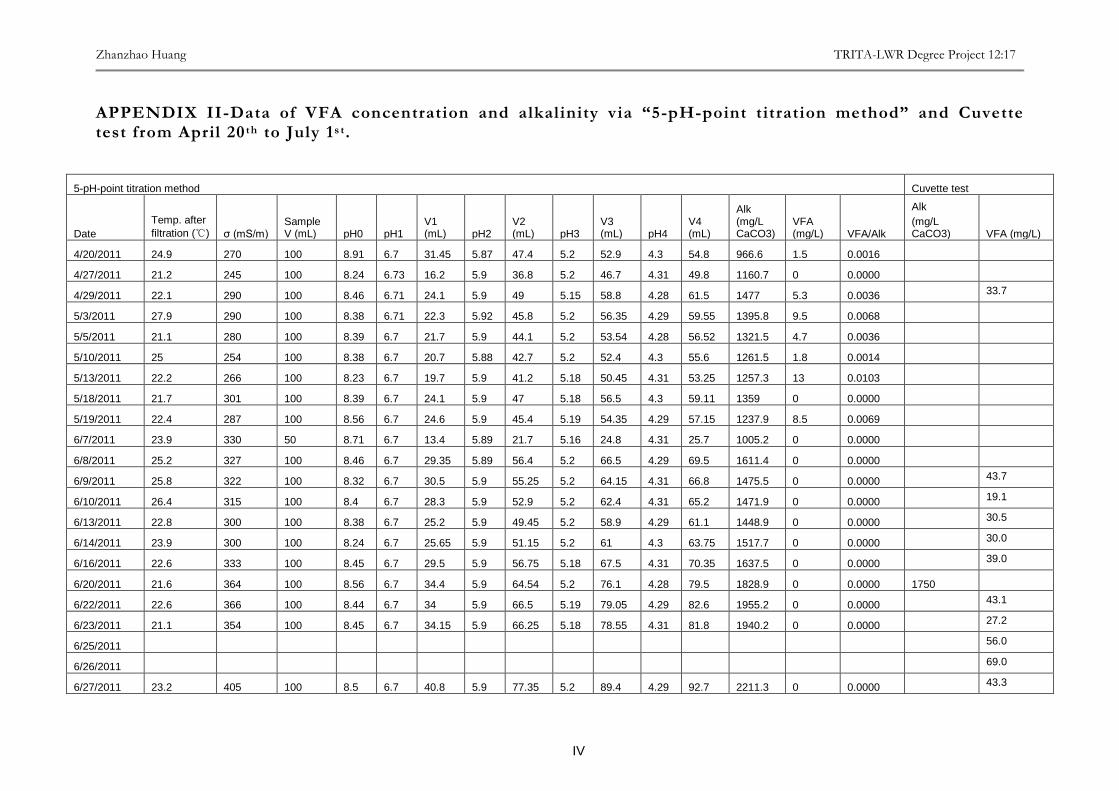
4.1.3 Monitoring of VFA and alkalinity The measurement of VFA and alkalinity, parameters for AD process, is an effective way to examine whether production of volatile fatty acids in the digester is balanced with its consumption. If VFA concentration is tested to be above 500mg/L, it will be noticed that system failure is nearby. In this study, VFA and alkalinity measurement was applied on outcoming sludge sample every other weekday except a cease from day 31 to 48 (May 20th to June 6th). The results from both “5-pH-point titration method” (hereinafter referred to as5-point) and Cuvette test (hereinafter referred to as Cu) are shown in Figure 17. The results state that VFA concentration from both methods varies from 0 to 69 mg/L whereas alkalinity from 966.6 to 2385 mg/L CaCO3. Despite of some difference
between the two methods, either VFA concentration or alkalinity is within the safe range that was expected. In the first 30-day period, both VFA concentration and alkalinity (5-point) are rather low: 0-13 mg/L and 966.6-1477 mg/L CaCO3 respectively. From day 49 (June 7th) to day 61 (June 20th), VFA (Cu) starts increasing, to 19.1-43.7 mg/L; alkalinity (5-point) increases also, to 1005.2-1828.9 mg/L CaCO3. The increase in either parameter can be explained by the fact that a greater incoming flow, from 576 L/day on June 7th to remain 960 L/day on June 9th, was introduced. More substrates were degraded in this time, stimulating a larger amount of VFA and alkaline matters produced. However, VFA (5-point) results remain zero due to failure in the probe of the pH-meter. Titration procedure thus could not be performed without a hitch. In the second phase, figures increase further in alkalinity (5-point and Cu) as well as VFA (Cu), due to VFA and alkaline matters coming from the extra sludge. After the extra sludge was added on day 62, VFA concentration dropped rapidly in one day from 43.1mg/L (day 63) to 27.2 mg/L (day 64) then soared to a peak of 69 mg/L. This inconsistency is due to the delay that organic matters turn into VFA through the processes of hydrolysis and acetogenesis. Likewise, alkalinity decreases somewhat from 1955.2 to 1940.2 mg/L CaCO3 (5-point). After that, it rises sharply till the peak of 2385 mg/L CaCO3 (Cu). Although it appears some controversy between two different methods on the figure, the results of VFA concentration and alkalinity are still satisfying and coordinated with pH trend (Figure 16). The results are not of too high accuracy; however, the goal that preventing system failure has been fulfilled.
4.1.4 Monitoring of TS and VS contents The purpose of measuring TS and VS contents in incoming and extra sludge was to increase OLR up to 3.0 kgVS / (m3·day), referring to the study aim. The measurement on incoming sludge was performed at least two or three times a week and every day (day 62-70) on extra sludge (Figure 18). Results of the first phase indicate that TS value fluctuates largely from 1.38% (day 14) to 4.62% (day 59); however, it changes between 1.50% and 2.50% most of the time. VS content numbers have a peak of 85.17% on day 50 (June 8th) though, the whole trend is descending, from the maximum value of 86.29% on day 8 (April 27th). The descending trend does not cease until the very
Enhanced Biogas Production by Increasing OLR in Mesophilic AD with Sludge Recirculation
13
. end of the second phase, which reveals that incoming sludge quality had been deteriorating as the study was proceeding. This is one of the reasons why OLR had to be increased up to the expected level by introducing extra sludge. Speaking of the extra sludge, its TS and VS contents are around 3.30% and 72% respectively, providing the digester with a stable input and relatively large organic rate for a high performance.
4.1.5 Calculation of OLR What has been introduced above is that organic load rate (OLR) to the study system can be calculated from the results of TS and VS contents in incoming and extra sludge (see Section 3.2.2). The purpose of such calculation was to try to increase the OLR up to 3.0 kgVS / (m3·day), and finally enhance biogas output. As an example in the first phase, for day 8 (April 27th), TS content for incoming sludge was 4.19% and VS content was 86.29%. The incoming flow on the same day was 768L/day. Thus the OLR on day 8 is given by:
kgVS / (m3·day)
That is to say, the organic load rate on day 8 was approximately 3.09 kgVS / (m3·day). Due to import of extra sludge in the second phase, another example in this phase should be presented. On day 64 (June 22nd), two days after the extra sludge with TS content of 3.43% and VS content of 70.81% was added, the flow was measured to be 960L/day. For incoming sludge, TS and VS contents were 3.46% and 76.11% respectively while the flow was 192L/day. Therefore, the OLR on day 64 is given by:
Where,
Then the organic load rate on day 64 (June 22nd) was approximately 3.15 kgVS / (m3·day). Thus, by considering all the measurement data of TS and VS contents in incoming and extra sludge (Appendix I), Figure 19 can be presented. The results state that high value that approaches
Figure 14. Incoming flow from the three lines over the entire study period (from April 20th to July 1st (in total 73 days)).
1st phase 2nd phase

Zhanzhao Huang TRITA-LWR Degree Project 12:17
14
1st phase 2nd phase
1st phase 2nd phase
Figure 15. Temperature at which the anaerobic digester was operating over the entire study period (from April 20th to July 1st (in total 73 days)).
Figure 16. pH value in the digester and outcoming sludge after filtration over the entire study period (from April 20th to July 1st (in total 73 days)).

Enhanced Biogas Production by Increasing OLR in Mesophilic AD with Sludge Recirculation
15
1st phase 2nd phase
1st phase 2nd phase
Figure 18 TS and VS contents in incoming sludge and extra sludge sample over the entire study period (from April 20th to July 1st (in total 73 days)).
Figure 17. VFA concentration and alkalinity from “5-pH-point titration method” and Cuvette test over the entire study period (from April 20th to July 1st (in total 73 days)).

Zhanzhao Huang TRITA-LWR Degree Project 12:17
16
to 3.0 kgVS / (m3·day) appears either in the beginning or near the end of the study period. On day 8 (April 27th), the OLR even exceeds the expected value to 3.09 kgVS / (m3·day) on account of both high TS and VS contents on the same day. After this peak, numbers remain rather low until day 50 (June 8th) when incoming flow was increased. Despite a dive in amount of incoming flow on day 57 (June 15th), OLR did not drop immediately because of the high TS and VS contents supporting a relatively large OLR value of above 2.0 kgVS / (m3·day). In the second phase, two days after the extra sludge was added (on day 64 (June 22nd), the OLR reaches 3.15 kgVS / (m3·day), which exceeds the expected value.
4.2 Results regarding biogas production
4.2.1 Biogas production rate and methane content
As output of the system, biogas production and the methane content inside are the most important parameters to judge the performance of a digester. Referring to the aim of this study, it was to evaluate the enhancement of biogas production, with respect to the increase of OLR. As for the importance, therefore, the gas production and methane content were measured every weekday and results were recorded. The results of gas production rate indicate that three high values appear in the first half of the first phase, i.e. 13.85Nm3/day on day 9 (April 28th), 13.68Nm3/day on day 17 (May 6th) and 13.42 Nm3/day on day 24 (May 13th). On day 29 (May 18th) the lowest production rate 2.437Nm3/day was obtained. In the second phase, the number rises sharply from 8.39Nm3/day (day 63) to the highest level of 14.51Nm3/day, and then drops rapidly when the study is over) It has been mentioned that biogas is yielded through a very complicated AD process; herein, the production amount can be influenced by a great many of factors or parameters. However, the principal focus in this study is on the effectthat OLR increase has on biogas production rate and methane content. By comparing the production rate with OLR, one can be noticed from the results that the trends of two curves are basically coordinated with each other. A high level of production rate appears after a peak of OLR is obtained, with one day delay. This phenomenon has been
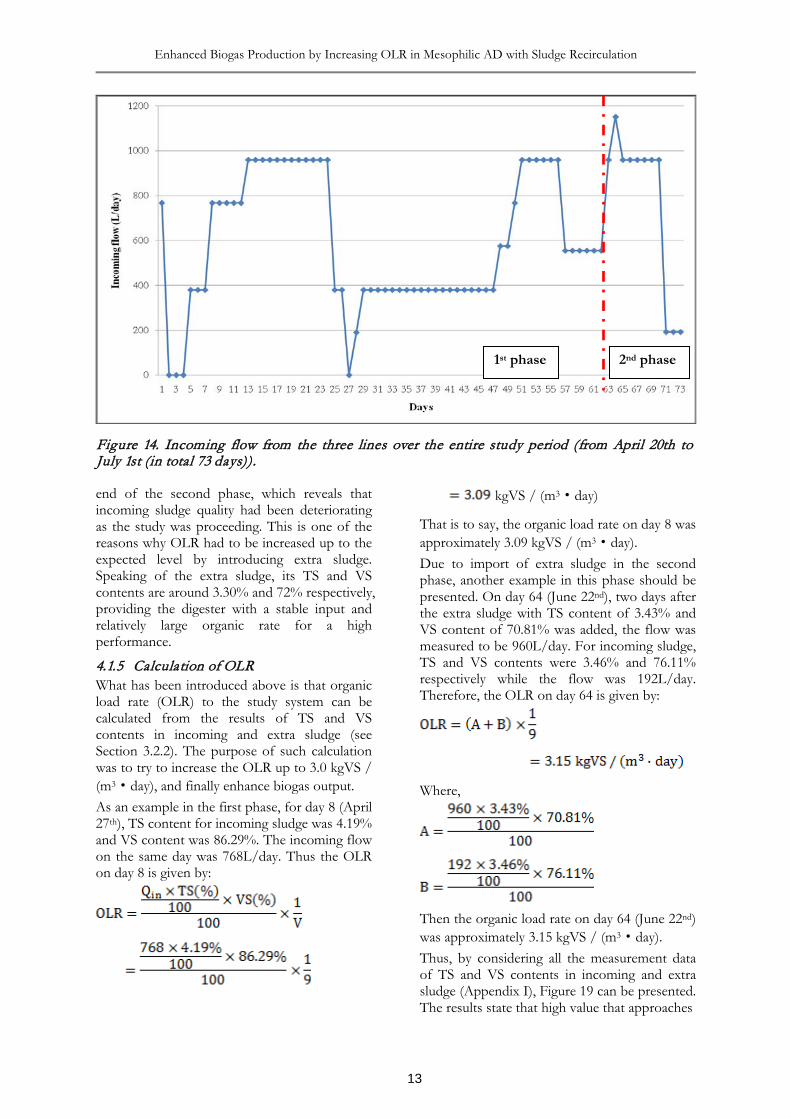
observed twice in this study on day 8 and day 64. Moreover, the lowest value of either production rate or OLR was almost simultaneously measured (Figure 20). As to the methane content during the study period, the figure shows that most of the time the results are plotted between 52-58%. A great interest can be found that a maximum methane content of 63% was measured on day 29 (May 18th) when the lowest gas production rate was obtained. Once the extra sludge was added in the second phase, the methane content started increasing until the addition finished on day 70 (June 28th), with a maximum of 63% on day 69 (June 27th) (Figure 21).
4.2.2 Specific gas production Specific gas production (SGP), expressed in Nm3/kg VS in, is referred to as the amount of gas production per day from unit mass of VS introduced to the digester. SGP can be a means of evaluating how much biogas is converted from the VS imposed. It is calculated as:
—biogas production rate, Nm3/day,
VSin(mass)—mass of introduced to the digester, kg. Day 65 (June 23rd) when the largest biogas production rate was obtained can be taken as a specific example. Production rate on that day was 14.51 Nm3/day. Flow for incoming sludge was 192L/day and for extra sludge was 768L/day. TS, VS contents for incoming sludge were 3.59%, 75.86% respectively and for extra sludge were 3.17%, 72.74% respectively. Thus SGP is given by:
Nm3/kg VSin
Where,
By taking all related data over the study period into account, the curve of SGP can be drawn. One can be observe that the curve is declined in the first phase, with a maximum of 1.04Nm3/kg VS i n on bo th day 10 (Apr i l 29 t h ) and

Enhanced Biogas Production by Increasing OLR in Mesophilic AD with Sludge Recirculation
17
1st phase 2nd phase
1st phase 2nd phase
Figure 19 Organic load rate (OLR) imposed upon the system over the entire study period (from April 20th to July 1st (in total 73 days)).
Figure 20 Biogas production rate from the study system over the entire study period (from April 20th to July 1st (in total 73 days)).
Zhanzhao Huang TRITA-LWR Degree Project 12:17
18
1st phase 2nd phase
1st phase 2nd phase
Figure 21 Methane content from the study system over the entire study period (from April 20th to July 1st (in total 73 days)).
Figure 22. Specific gas production from the study system over the entire study period (from April 20th to July 1st (in total 73 days)).

Enhanced Biogas Production by Increasing OLR in Mesophilic AD with Sludge Recirculation
19
day 21 (May 10th), and a minimum of 0.34Nm3/kg VSin on day 58 (June 16th). The average value over the whole time is approximately 0.65 Nm3/kg VSin (SGPs at Henriksdal during the years 2000-2005 were: 0.53 Nm3/kg VSin from primary sludge, 0.30Nm3/kg VSin from excess biological sludge (Hellstedt, et al., 2010.). According to its definition, SGP is determined by two parameters, namely VS introduced and gas production rate. If the SGP and OLR curve are overlaid, an interest will be observed that SGP decreases exactly at the same time when OLR increases. It seems that the new introduced VS is not able to produce as much gas as the previous VS, in other words, less gas produced per unit mass of VS. In fact, methanogens need time to digest, releasing biogas in the next moment. This phenomenon can be called delay of input and output. The combination of SGP and OLR curves show that the delay continues until day 62 (June 20th). This is exactly the day when extra sludge was added. Blur of the delay reveals that VS in extra sludge is able to be rapidly converted into biogas by bacteria. That is to say, the extra sludge is more suitable to the system.
5 CONCLUSION This study depicts the impact of increase in OLR on biogas production from a mesophilic anaerobic digester with recycled sludge treating a mixture of primary and activated sewage sludge. Stability of the digester was successfully maintained in both phases of the study, possibly on account of high buffering capacity of the digester, and chemical compositions of the extra
sludge. Hypothesis of this study was observed to be tenable because the digester succeeded in withstanding an OLR up to 3.15kgVS/(m3 · day). Furthermore, an enhancement in biogas yield and methane content were observed after increasing the OLR by introducing extra sludge. Biogas production measurement performed during this study indicated that gas amount was enhanced by 73% when OLR was increased from 2.05 to 3.15kgVS/(m3 · day). However, methane content was merely promoted by 10.5% with the same increase in OLR. Quick response to the extra sludge addition was made by the digester, probable because chemical compositions of the extra sludge were able to be adjusted by AD bacteria. VFA was promptly consumed by acetate-formers instead of being largely accumulated in the digester. SGP curve also shows that extra sludge is more suitable to the system. However, chemical positions of the extra sludge need a further experiment to analyze. The setup of centrifuge and addition of polymer flocculant were investigated to be ontributed to maintaining TS and VS contents within the digester as 5.28% and 66.06 averagely. Consequently, water content was efficiently removed from the digester and digester volume could be reduced. The technical problems encountered in this study were basically related to a low feeding and a temporarily interruption to the sludge recirculation. Consequences of these problems did not badly affect the results, but prolong the study proceeding and let the operation in a discontinuous way.

Zhanzhao Huang TRITA-LWR Degree Project 12:17
20
6 REFERENCES Appels, L., Baeyens, J., Degre`ve, J., Dewil, R., 2008. Principles and potential of the anaerobic digestion
of waste-activated sludge. Progress in Energy and Combustion Science, 34: 755–781. Consortium ESWI, 2011. Study on waste related issues of newly listed POPs and candidate POPs: Final
report. Report number: ENV.G.4/FRA/2007/0066. Available at: http://ec.europa.eu/environment/waste/studies/pdf/POP_Waste_2011.pdf.
Gerardi, M.H., 2003. The Microbiology of Anaerobic Digesters. A John Wiley & Sons, Inc., Publication Press, United States of America.
Gómez, E.F., 2010. Effects of organic loading rate on reactor performance and archaeal community structure in mesophilic anaerobic digesters treating municipal sewage sludge. The Ohio State University.
Harper, S.R., Pohland, F.G., 1986. Recent developments in hydrogen management during anaerobic biological wastewater treatment. Biotechnology and bioengineering, 28: 585-602.
Harris, P., 2008. Biogas notes. The University of Adelaide and IOBB. Available at: http://biogas.wikispaces.com/file/view/Biogas+Notes.pdf
Hellstedt, C., Starberg, K., Olsson, L.-E., Hellström, D., Jonsson, L., Mossakowska, A., 2010. Increased biogas production at the Henriksdal Wastewater Treatment Plant (WWTP). BIOGASMAX Integrated project No 019795.
Hwang, M.H., Jang, N.J., Hyun, S.H., Kim, I.S., 2004. Anaerobic bio-hydrogen production from ethanol fermentation: the role of pH. Journal of Biotechnology, 111: 297-309.
Metcalf, X. & Eddy, X. 1999. Advanced wastewater treatment: in wastewater engineering, treatment, disposal and re-use, 3rd edition. McGraw-Hill New York.
Moosbrugger, R. E., Wentzel, M. C., Ekama, G. A. and Marais, G. v. R., 1993. A 5 pH point titration method for determining the carbonate and SCFA weak acid/bases in anaerobic systems. Wal. Sci. Tech., 28(2): 237-245.
Myint, M., Nirmalakhandan, N., Speece, R.E., 2007. Anaerobic fermentation of cattle manure: Modeling of hydrolysis and acidogenesis. Water Research, 41: 323-332.
Oropeza, M.R., Cabirol, N., Ortega, S., Ortiz, L.P.C., Noyola, A., 2000. Removal of fecal indicator organisms and parasites (fecal coliforms and helminth eggs) from municipal biologic sludge by anaerobic mesophilic and thermophilic digestion. Trans. P. Univ Fed, C.B.A.I.I.M.C.D.F.M. Univ Nacl Autonoma Mexico 6th Latin American Workshop and Seminar on Anaerobic Digestion. I W a Publishing, Recife, Brazil, 97-101.
United States Environmental Protection Agency, 1976. Anaerobic sludge digestion operations manual. Report number: EPA 430/9-76-001.
Wijekoon, K.C., Visvanathan, C., Abeynayaka, A., 2010. Effect of organic loading rate on VFA production, organic matter removal and microbial activity of a two-stage thermophilic anaerobic membrane bioreactor. Bioresource Technology 102: 5353–5360.
Zabranska, J., Stepova, J., Wachtl, R., Jenicek, P., Dohanyos, M., 1999. The activity of anaerobic biomass in thermophilic and mesophilic digesters at different loading rates. Trans. D.W.T. Inst Chem Technol, C.Z.P.C.R. Environm Engn International Specialised Conference on Disposal and Utillsation of Sewage Sludge. I W a Publishing, Athens, Greece, 49-56.

Enhanced Biogas Production by Increasing OLR in Mesophilic AD with Sludge Recirculation
I
APPENDIX I-The data of TS and VS contents in incoming sludge during the study period (from April 20th to July 1s t). md: total mass of dry sample and plate, g; mp: mass of plate, g; mw: total mass of wet sample and plate before drying, g; mi: total mass of incombustible fraction and plate after burning, g. Sampling point is corresponding to the spots where samples were taken. “Extra” stands for extra sludge added to the system after June 21st.
Date Sampling point
mp (g)
mw (g)
md (g)
mi (g)
TS (%)
VS (%)
4/20/2011 1 2.8828 49.4462 3.5975 3.0007 1.53 83.50
1 2.8800 52.5475 3.6088 3.0025 1.47 83.19
2 2.8777 29.4291 4.1091 3.2937 4.64 66.22
2 2.8795 35.6756 4.4003 3.3912 4.64 66.35
3 2.8116 59.2704 2.8677 2.8458 0.10 39.04
3 2.8201 64.7160 2.8820 2.8573 0.10 39.90
4 2.8455 22.8939 6.6627 4.0924 19.04 67.33
4 2.8457 27.3121 7.3856 4.3325 18.56 67.25
4/27/2011 1 2.8703 25.2307 3.8080 2.9989 4.19 86.29
1 2.8652 32.0111 4.1053 3.0353 4.25 86.28
2 2.8609 20.7105 3.5453 3.0953 3.83 65.75
2 2.8660 17.0204 3.4280 3.0513 3.97 67.03
3 2.8614 24.2285 2.8848 2.8760 0.11 37.61
3 2.8665 23.3871 2.8908 2.8803 0.12 43.21
4 2.8703 19.6602 6.1738 3.9483 19.68 67.37
4 2.8616 13.9383 5.0152 3.5646 19.44 67.36
4/29/2011 1 2.8065 20.3674 3.0868 2.8553 1.60 82.59
1 2.8119 17.5624 3.0524 2.8540 1.63 82.49
2 2.8623 21.7110 3.8220 3.1833 5.09 66.55
2 2.8791 20.1560 3.7604 3.1738 5.10 66.56
3 2.8629 18.3148 2.8837 2.8755 0.13 39.42
3 2.8561 14.6371 2.8710 2.8668 0.13 28.19
4 2.8772 15.4613 5.3609 3.6990 19.74 66.91
4 2.8703 15.4181 5.2595 3.6637 19.04 66.79
5/3/2011 1 2.8672 16.1314 3.0499 2.9020 1.38 80.95
1 2.8725 15.8327 3.0573 2.9058 1.43 81.98
2 2.8679 13.1733 3.4644 3.0691 5.79 66.27
2 2.8658 14.3252 3.5317 3.0904 5.81 66.27
5/5/2011 1 2.8637 12.6713 3.0282 2.8944 1.68 81.34
1 2.8656 14.6286 3.0666 2.9024 1.71 81.69
2 2.8738 16.2717 3.6536 3.1412 5.82 65.71
2 2.8471 17.3204 3.6879 3.1375 5.81 65.46
5/10/2011 1 2.8553 14.5257 3.0310 2.8847 1.51 83.27
1 2.8542 12.2351 2.9938 2.8770 1.49 83.67
Date Sampling point
mp (g)
mw (g)
md (g)
mi (g)
TS (%)
VS (%)
2 2.8560 14.7761 3.5531 3.0889 5.85 66.59

Zhanzhao Huang TRITA-LWR Degree Project 12:17
II
2 2.8626 19.2923 3.8214 3.1845 5.84 66.43
5/13/2011 2 2.8479 20.8546 3.5350 3.0754 3.82 66.89
3 2.8383 17.7262 2.8554 2.8509 0.11 26.32
4 2.8629 16.5811 5.4155 3.7061 18.61 66.97
5/19/2011 2 2.5408 37.2627 3.8180 2.9704 3.68 66.36
3 2.5553 35.4604 2.5862 2.5738 0.09 40.13
4 2.5701 21.2540 5.9026 3.6602 17.84 67.29
5/24/2011 1 2.6337 65.9293 3.8145 2.8566 1.87 81.12
2 2.6111 58.1700 4.7663 3.3327 3.88 66.52
3 2.6005 41.2450 2.6456 2.6205 0.12 55.65
4 2.6054 47.1310 10.4148 5.1800 17.54 67.03
5/27/2011 1 2.6017 63.4583 4.6425 3.0201 3.35 79.50
2 2.6014 47.2310 4.5471 3.2431 4.36 67.02
3 2.6187 52.4370 2.6654 2.6457 0.09 42.18
4 2.6062 48.1648 10.7668 5.3049 17.91 66.93
5/31/2011 1 2.5321 43.1074 3.4457 2.7178 2.25 79.67
2 2.5401 41.3800 4.1882 3.0929 4.24 66.46
3 2.5371 48.1600 2.5821 2.5575 0.10 54.67
4 2.5220 52.3400 11.6442 5.5438 18.31 66.87
6/7/2011 2 2.5956 22.7190 3.4790 2.8893 4.39 66.75
3 2.5671 27.8730 2.6016 2.5787 0.14 66.38
3 2.5789 23.4716 2.6090 2.5899 0.14 63.46
4 2.5936 19.1205 5.5078 3.5790 17.63 66.19
6/8/2011 1 2.5599 23.6650 2.8964 2.6098 1.59 85.17
2 2.5588 22.9892 3.5709 2.8956 4.95 66.72
6/9/2011 1 2.5941 29.6747 3.1021 2.6884 1.88 81.44
2 2.5675 42.6838 4.4810 3.2023 4.77 66.83
3 2.6074 21.1817 2.6272 2.6161 0.11 56.06
3 2.5856 31.4886 2.6171 2.6016 0.11 49.21
4 2.5697 43.5260 9.7526 4.9456 17.54 66.92
6/13/2011 2 2.5467 35.6251 3.9849 3.0109 4.35 67.72
3 2.5483 38.8833 2.5779 2.5682 0.08 32.77
3 2.5550 53.8847 2.5966 2.5849 0.08 28.12
4 2.5502 31.8946 8.0244 4.2994 18.66 68.05
6/16/2011 1 2.5529 31.0528 3.8173 2.8354 4.44 77.66
2 2.5514 41.0095 4.6359 3.2442 5.42 66.76
3 2.5554 45.9615 2.6082 2.5802 0.12 53.03
3 2.5674 26.0126 2.5937 2.5784 0.11 58.17
4 2.5680 33.4029 8.3912 4.4959 18.89 66.89
Date Sampling point
mp (g)
mw (g)
md (g)
mi (g)
TS (%)
VS (%)
6/17/2011 1 2.5602 44.2218 4.4862 2.9813 4.62 78.14
2 2.5655 36.3789 4.4851 3.2074 5.68 66.56
6/20/2011 1 2.5624 31.7571 3.8300 2.8613 4.34 76.42
2 2.5734 37.7959 4.4814 3.2095 5.42 66.66

Enhanced Biogas Production by Increasing OLR in Mesophilic AD with Sludge Recirculation
III
3 2.5640 20.1855 2.5835 2.5731 0.11 53.33
3 2.5555 38.4602 2.5954 2.5742 0.11 53.13
4 2.5550 33.9197 8.3534 4.4862 18.49 66.69
6/21/2011 Extra 2.5427 46.8414 4.0655 2.9537 3.44 73.01
Extra 2.5619 31.0953 3.5389 2.8233 3.42 73.24
2 2.5494 26.7371 4.0270 3.0503 6.11 66.10
6/22/2011 2 2.5777 29.6026 4.1523 3.1131 5.83 66.00
3 2.5615 60.1102 2.6294 2.5939 0.12 52.28
3 2.5452 31.5422 2.5799 2.5618 0.12 52.16
4 2.5405 37.4233 8.9248 4.6675 18.30 66.68
Extra 2.5693 60.4187 4.5530 3.1483 3.43 70.81
6/23/2011 1 2.5392 39.0582 3.8492 2.8554 3.59 75.86
2 2.5504 34.6909 4.6463 3.2755 6.52 65.40
Extra 2.5695 27.5722 3.3621 2.7856 3.17 72.74
6/26/2011 1 2.5619 37.1770 3.2048 2.7128 1.86 76.53
6/27/2011 1 2.5385 39.1817 3.1267 2.6862 1.61 74.89
2 2.5504 50.6581 5.4584 3.5768 6.04 64.70
3 2.5641 46.2546 2.6735 2.5951 0.25 71.66
3 2.5680 38.4919 2.6586 2.5946 0.25 70.64
4 2.5502 37.3479 8.6305 4.7285 17.47 64.17
Extra 2.5390 40.8545 3.7752 2.9010 3.23 70.72
6/28/2011 1 2.5691 59.7463 3.5352 2.8070 1.69 75.38
2 2.5664 36.9911 4.8243 3.3530 6.56 65.16
Extra 2.5440 45.9065 3.9333 2.9188 3.20 73.02
6/29/2011 1 2.5406 34.2615 3.0144 2.6523 1.49 76.42
2 2.5616 36.5489 4.9623 3.4250 7.06 64.04
3 2.5731 29.2882 2.6166 2.5904 0.16 60.23
3 2.5608 76.5252 2.6843 2.6093 0.17 60.73
4 2.5391 35.7973 8.6733 4.7366 18.44 64.18
6/30/2011 1 2.5455 83.6375 3.7910 2.8296 1.54 77.19
2 2.5627 48.7395 5.7541 3.7246 6.91 63.59
7/1/2011 1 2.5419 41.5987 3.1316 2.6728 1.51 77.80
2 2.5314 57.0706 6.2015 3.8890 6.73 63.01
Zhanzhao Huang TRITA-LWR Degree Project 12:17
IV
APPENDIX II-Data of VFA concentration and alkalinity via “5-pH-point titration method” and Cuvette test from April 20th to July 1s t.
5-pH-point titration method Cuvette test
Date Temp. after filtration (℃) σ (mS/m)
Sample V (mL) pH0 pH1
V1 (mL) pH2
V2 (mL) pH3
V3 (mL) pH4
V4 (mL)
Alk (mg/L CaCO3)
VFA (mg/L) VFA/Alk
Alk (mg/L CaCO3)
VFA (mg/L)
4/20/2011 24.9 270 100 8.91 6.7 31.45 5.87 47.4 5.2 52.9 4.3 54.8 966.6 1.5 0.0016
4/27/2011 21.2 245 100 8.24 6.73 16.2 5.9 36.8 5.2 46.7 4.31 49.8 1160.7 0 0.0000
4/29/2011 22.1 290 100 8.46 6.71 24.1 5.9 49 5.15 58.8 4.28 61.5 1477 5.3 0.0036 33.7
5/3/2011 27.9 290 100 8.38 6.71 22.3 5.92 45.8 5.2 56.35 4.29 59.55 1395.8 9.5 0.0068
5/5/2011 21.1 280 100 8.39 6.7 21.7 5.9 44.1 5.2 53.54 4.28 56.52 1321.5 4.7 0.0036
5/10/2011 25 254 100 8.38 6.7 20.7 5.88 42.7 5.2 52.4 4.3 55.6 1261.5 1.8 0.0014
5/13/2011 22.2 266 100 8.23 6.7 19.7 5.9 41.2 5.18 50.45 4.31 53.25 1257.3 13 0.0103
5/18/2011 21.7 301 100 8.39 6.7 24.1 5.9 47 5.18 56.5 4.3 59.11 1359 0 0.0000
5/19/2011 22.4 287 100 8.56 6.7 24.6 5.9 45.4 5.19 54.35 4.29 57.15 1237.9 8.5 0.0069
6/7/2011 23.9 330 50 8.71 6.7 13.4 5.89 21.7 5.16 24.8 4.31 25.7 1005.2 0 0.0000
6/8/2011 25.2 327 100 8.46 6.7 29.35 5.89 56.4 5.2 66.5 4.29 69.5 1611.4 0 0.0000
6/9/2011 25.8 322 100 8.32 6.7 30.5 5.9 55.25 5.2 64.15 4.31 66.8 1475.5 0 0.0000 43.7
6/10/2011 26.4 315 100 8.4 6.7 28.3 5.9 52.9 5.2 62.4 4.31 65.2 1471.9 0 0.0000 19.1
6/13/2011 22.8 300 100 8.38 6.7 25.2 5.9 49.45 5.2 58.9 4.29 61.1 1448.9 0 0.0000 30.5
6/14/2011 23.9 300 100 8.24 6.7 25.65 5.9 51.15 5.2 61 4.3 63.75 1517.7 0 0.0000 30.0
6/16/2011 22.6 333 100 8.45 6.7 29.5 5.9 56.75 5.18 67.5 4.31 70.35 1637.5 0 0.0000 39.0
6/20/2011 21.6 364 100 8.56 6.7 34.4 5.9 64.54 5.2 76.1 4.28 79.5 1828.9 0 0.0000 1750
6/22/2011 22.6 366 100 8.44 6.7 34 5.9 66.5 5.19 79.05 4.29 82.6 1955.2 0 0.0000 43.1
6/23/2011 21.1 354 100 8.45 6.7 34.15 5.9 66.25 5.18 78.55 4.31 81.8 1940.2 0 0.0000 27.2
6/25/2011 56.0
6/26/2011 69.0
6/27/2011 23.2 405 100 8.5 6.7 40.8 5.9 77.35 5.2 89.4 4.29 92.7 2211.3 0 0.0000 43.3
Enhanced Biogas Production by Increasing OLR in Mesophilic AD with Sludge Recirculation
V
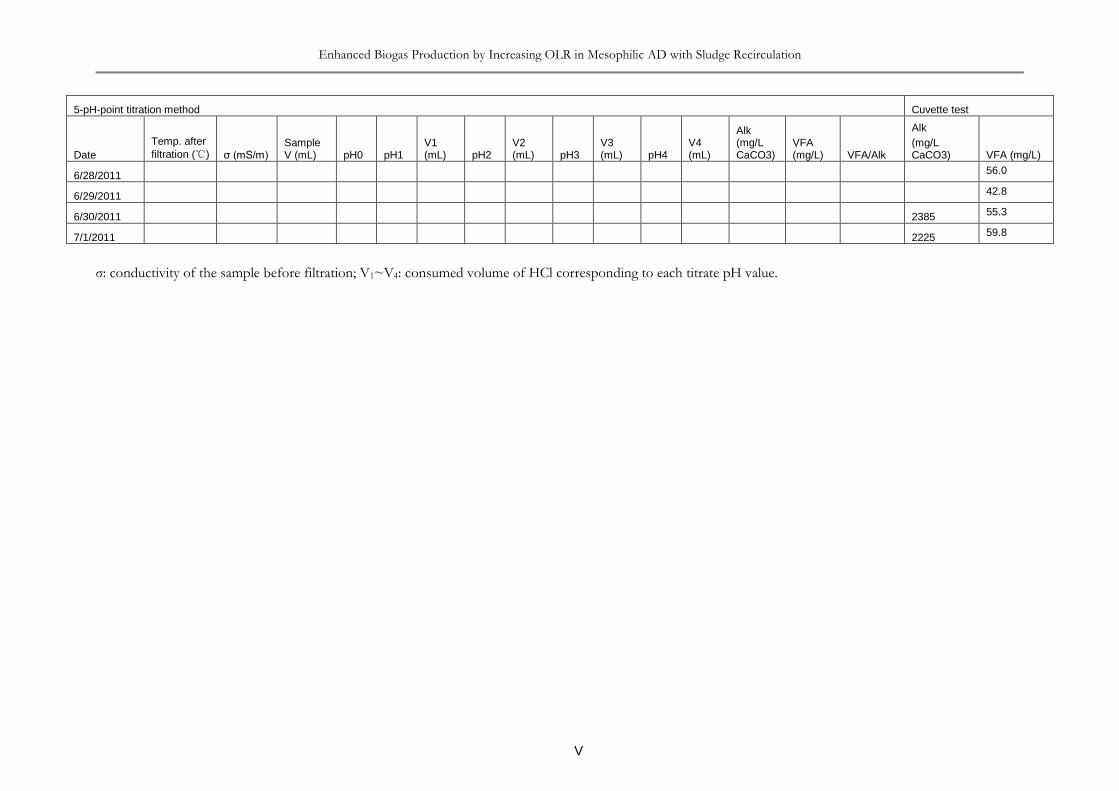
σ: conductivity of the sample before filtration; V1~V4: consumed volume of HCl corresponding to each titrate pH value.
5-pH-point titration method Cuvette test
Date Temp. after filtration (℃) σ (mS/m)
Sample V (mL) pH0 pH1
V1 (mL) pH2
V2 (mL) pH3
V3 (mL) pH4
V4 (mL)
Alk (mg/L CaCO3)
VFA (mg/L) VFA/Alk
Alk (mg/L CaCO3)
VFA (mg/L)
6/28/2011 56.0
6/29/2011 42.8
6/30/2011 2385 55.3
7/1/2011 2225 59.8

Zhanzhao Huang TRITA-LWR Degree Project 12:17 T
VI
APPENDIX III-Data of biogas production and methane content measured from April 20th to July 1st .
Date
Time interval (min)
Biogas accumulated production (m3)
Biogas production (m3)
Biogas production rate (m3/day)
Specific biogas production (m3/kg VS)
CH4 content (%)
CH4 production rate (m3/day)
4/20/2011 1421 2343.32 9.16 9.282 0.94 51 4.73
4/21/2011 1334 2350.37 7.05 7.610 54 4.11
4/25/2011 6155 2367.45 17.08 3.996
4/26/2011 1110 2372.27 4.82 6.253 58 3.63
4/27/2011 1525 2385.13 12.86 12.143 0.44 51 6.19
4/28/2011 1385 2398.45 13.32 13.849 53 7.34
4/29/2011 1260 2407.64 9.19 10.503 1.04 53 5.57
5/2/2011 4290 2435.68 28.04 9.412 55 5.18
5/3/2011 1460 2445.36 9.68 9.547 0.89 58 5.54
5/4/2011 1340 2454.36 9.00 9.672 55 5.32
5/5/2011 1715 2467.98 13.62 11.436 0.87 56 6.40
5/6/2011 1200 2479.38 11.40 13.680 54 7.39
5/9/2011 4245 2514.94 35.56 12.063 54 6.51
5/10/2011 1580 2528.68 13.74 12.523 1.04 58 7.26
5/11/2011 1440 2540 11.32 11.320 54 6.11
5/12/2011 1865 2555.67 15.67 12.099 53 6.41
5/13/2011 1294 2567.73 12.06 13.421 55 7.38
5/16/2011 4087 2590.06 22.33 7.868 56 4.41
5/17/2011 1514 2594.85 4.79 4.556 58 2.64
5/18/2011 1294 2597.04 2.19 2.437 63 1.54
5/19/2011 1569 2602.13 5.09 4.672 57 2.66
5/20/2011 1662 2608.24 6.11 5.294 57 3.02
5/23/2011 3905 2621.52 13.28 4.897 56 2.74
5/24/2011 1680 2627.01 5.49 4.706 0.82 55 2.59
5/25/2011 1160 2630.4 3.39 4.208 55 2.31
5/26/2011 1620 2635.98 5.58 4.960 55 2.73
5/27/2011 1352 2641.57 5.59 5.954 0.59 56 3.33
5/30/2011 4370 2657.99 16.42 5.411
5/31/2011 1440 2662.45 4.46 4.460 0.65
6/3/2011 4260 2676.19 13.74 4.645 57 2.65
6/7/2011 5700 2693.61 17.42 4.401 55 2.42
6/8/2011 1668 2699.6 5.99 5.171 0.50 56 2.90
6/9/2011 1569 2705.49 5.89 5.406 0.37 56 3.03
6/10/2011 1527 2712.64 7.15 6.743 56 3.78
6/13/2011 4111 2739.1 26.46 9.268 53 4.91
6/14/2011 1646 2748.41 9.31 8.145 56 4.56
6/15/2011 1224 2754.23 5.82 6.847 58 3.97
6/16/2011 1625 2761.62 7.39 6.549 0.34 56 3.67
Date Time interval
Biogas accumulated
Biogas production
Biogas production rate
Specific biogas
CH4 content
CH4 production

Enhanced Biogas Production by Increasing OLR in Mesophilic AD with Sludge Recirculation
VII
(min) production (m3) (m3) (m3/day) production (m3/kg VS)
(%) rate (m3/day)
6/17/2011 1380 2768.94 7.32 7.638 0.38 55 4.20
6/20/2011 4305 2793.96 25.02 8.369 0.45 55 4.60
6/21/2011 1380 2802 8.04 8.390 57 4.78
6/22/2011 1417 2812.17 10.17 10.335 57 5.89
6/23/2011 1668 2828.98 16.81 14.512 0.63 59 8.56
6/25/2011 2710 2852.55 23.57 12.524
6/26/2011 1550 2864.07 11.52 10.702
6/27/2011 1140 2872.26 8.19 10.345 0.52 63 6.52
6/28/2011 1588 2883.82 11.56 10.483 0.51 62 6.50
6/29/2011 1407 2893.83 10.01 10.245 60 6.15
6/30/2011 1644 2902.06 8.23 7.209 57 4.11
7/1/2011 1268 2907.02 4.96 5.633 55 3.10