maana – taking software tools for decision makers to a new
TRANSCRIPT

Maana – taking software tools for decision makers to a new level
Using software to manage well planning
Automation driven analytics
SAP’s tools for people in operational roles
Flat panel satellite antennas for offshore coming soon
June - July 2017 Issue 67
Official publication of Finding Petroleum

digital energy journal - November 2016
Find out more and reserve your place at
www.d-e-j.comwww.findingpetroleum.com
Events 2017
Transforming Offshore Operations - with a New Digital Approach Aberdeen, June 20 2017
Decommissioning - the D word! London, June 23 2017
Data management, quality and analytics Kuala Lumpur, Oct 3, 2017
Workforce of the future: Improving data analytics and knowledge management Kuala Lumpur, Oct 4, 2017
Solving E&P problems with Machine Learning & Analytics London, Nov 13 2017
Transforming Offshore Operations with Digital Technology Stavanger, 29 Nov 2017
June - July 2017 - digital energy journal
Leaders
3
US company Maana provides software which oil and gas domain experts (such as drilling engineers) can use to build digital knowledge to help them make better and faster oper-ational decisions – and they can demonstrate business value 3 to 10 times faster than with purely AI or analytic based systems, like IBM Watson and Palantir, the company says.
The company is able to do this by math-ematically modelling the expertise of em-ployees and the most relevant data for optimizing a particular decision flow or oper-ations. Maana’s secret sauce is its ‘patented knowledge graph’, which is basically a net-work of models that show how the relevant data and business processes fit together.
Perhaps most importantly, the models can be constructed by the oil companies’ domain ex-perts themselves, once they have been shown how to do it. Also, far fewer consultants and data scientists are required.
The models can be put together to answer specific questions, or sub-questions which will enable the expert to optimize a specific decisions flow or operations. These models often show the interdependencies between various organizations within a company, which then identify more optimization oppor-tunities.
And because the different processes or equip-ment in a company are related, models made for one department or decision flow can often be used in another, or many of them can be used together.
Maana is backed by Chevron Technology Ventures, Frost Data Capital, GE Ventures, Intel Capital, Saudi Aramco Energy Ventures, and Shell Technology Ventures. All of the oil companies which have invested are also using the software.
As a typical example, one oil major customer started with one or two projects, then “the speed with which we were able to deliver and demonstrate business value led to them wanting to do entire digital transformation of the top 400 decision flows and assets across
the company,” says chief marketing officer Azita Martin.
Maana only sells software, that requires very little consulting services. So the relevant ex-perts in the oil company are the ones using the software to build the models and deliver the operational optimizations.
This means that companies do not need to be concerned about outside compan-ies seeing their confidential data. “We want to en-able companies
to solve their own problems,” says Jeff Dal-gliesh, specialist oil and gas solutions with Maana.
The other main component of the technology is a range of tools which can crawl and index whatever data is available, to get as much from it as possible, including semantic search, AI algorithms, natural language processing tools and predictive and prescriptive analytics to work out which data streams seem to be most relevant to the problem being solved.
Altogether, the technology is very similar to the knowledge graph you see in an internet search engine, which will crawl all types of data and fit it together and shows the most important elements of what a user is search-ing for in a way which is useful for making decisions.
For example, if you search for an airline route and date in a search engine (Google or Bing), it won’t just return the most relevant pages, it will also tell you which airlines fly on that route, their prices and dates, so you can make a decision of which to book with.
Donald Thompson, co-founder and CTO of Maana, was formerly at Microsoft as direc-tor of engineering, architect, and develop-ment manager within multiple divisions. He founded Bing’s Knowledge and Reasoning Team.
Maana – “3-10x faster than Watson”
Issue 67 June 2017
Subscriptions: £250 for personal subscription, £795 for corporate subscription. E-mail: [email protected]
Digital Energy JournalUnited House, North Road, London, N7 9DP, UK www.d-e-j.com Tel +44 (0)208 150 5292 Fax +44 (0)207 251 9179
Editor Karl Jeffery [email protected] +44 208 150 5292
Advertising and sponsorship salesRichard McIntyre [email protected] Tel +44 (0) 208 150 5296
ProductionVery Vermilion Ltd. www.veryvermilion.co.uk
Printed by - RABARBAR sc, U1. Polna 44, 41-710 Ruda Śląska, Poland
Cover image: A Maana software tool for doing a job safety analysis. The software brings up reports of previous accidents which are strongly or weakly related to the task which is about to be performed, putting the company in a much better position to be able to make assessments
US company Maana provides software which oil and gas domain experts can use to create digital knowledge to help them make better decisions – and it can be implemented to demonstrate business value 3 to 10 times faster than with IBM’s Watson, the company says.
Jeff Dalgliesh
digital energy journal - June - July 2017 4
LeadersMaana’s vision is that ultimately it should be possible for an oil company to search and query its internal technical data as easily as searching for a flight on Google.
Challenges tackled by Maana in the oil and gas industry include helping decision makers to optimise use of oil tankers, allocate investment funds, forecast gas demand and pricing, assess well risk, optimise logistics and contingency management, improve drilling performance, reduce corrosion risk, predict pump failures, improve accounts receivables (debts), assess safety risk and build a better system for remov-ing phishing e-mails. Some further information about these projects are at the end of this article.
About Maana
Maana focuses on all sectors of the oil and gas industry, and other industrial sectors, where it looks at field service and maintenance, sales, logistics, finance and risk management.
It is based in Palo Alto, California (Silicon Valley) with offices in Bellevue (near Seattle), Houston, London, The Hague (Netherlands) and Dhahran (Saudi Arabia).
Founder and CEO Babur Ozden was founder and CEO of Superonline, the largest internet services provider in Turkey, and was previously president of DataCert, which claims to be the largest Software as a Service billing and pay-ment provider in the world.
Jeff Dalgliesh, specialist oil and gas solutions with Maana, was formerly global drilling and completions information services team lead with Chevron.
Currently all of Maana’s clients are very large – the smallest is Maersk, ranked 240 in the “Global Fortune 500” list of the largest com-panies in the world, and its other investors (also customers) are ranked from 51 Intel to Shell (5), with Chevron and GE in between. When Saudi Aramco joins the list as a publicly traded com-pany it will be number 1. The website is https://www.maana.io
Knowledge graph
To explain Maana’s “knowledge graph” – you can see it as a way for domain experts (such as drilling engineers) to use the Maana software to build models that identify patterns in the data. It sounds like a complex concept, but it is some-thing you are probably already familiar with, if you ever searched for a movie on the internet.
If you enter the name of a movie in the search bar, on the first results screen you can see pic-tures, a synopsis, basic facts, reviews, watch the trailer, names of relevant people (and links to find out more about them), a link to purchase the movie download, songs, and top news stories. If it is a recent film you can see where it is showing near you.
Click on a movie star and you can see links to their personal websites, Wikipedia pages, Twitter and Facebook pages, movies they have been in, cinemas showing those movies, news mentions, romantic partners, perhaps songs or awards.
The search engine did not work out for itself that all of these factors were relevant and related – it was programmed to do it. But the search engine may have worked out some of the relationships. This can be called a ‘model’, or ‘pattern’. Maana calls it a ‘knowledge graph’.
Similarly, in the energy domain, much of the in-formation is related – although there are many more types of information, and different scenar-ios, than the movie example above.
But the same technique applies – and a ‘know-ledge graph’ can be put together with people who know the domain, working with people who know the data, and people who know Maana’s software.
Further – experts in the oil and gas industry (or any industry) will often have specific questions they want to answer before making a decision – and these questions can be programmed into the knowledge graph.
The models are usually interconnected, because the same data is used in different parts of the organisation. So a model for exploration could be used in production and then in trading.
The starting point for working with Maana is to identify a specific decision which company staff regularly need to make, which might be an-swered in a model. Or maybe the decision needs to be broken down into sub questions, which might be improved by making a model.
LNG markets
Here is a detailed illustration of how Maana has been used in the energy industry, to help an LNG trading company, active in 10 LNG markets, to make better decisions.The customer had an employee who had been working in the LNG market for 35 years, and had a very good understanding of how the
market worked. But the person was struggling to make decisions with the increasing speed of data, and was also planning to leave the com-pany, says Jeff Dalgliesh, specialist oil and gas solutions with Maana.
For example, this expert has experience of how electricity (and so LNG) demand will change due to a hurricane in some part of the world, or a coal power station outage. The expert under-stands how consumption will change due to tem-peratures being a few degrees warmer or cooler than the average.
Previously the company analysts were gathering data from 10 different sources by subscription, putting it together in complex spreadsheets, a process which was very time consuming and did not use all data available.
So the company used Maana to build computer models of what was happening in LNG markets, covering both supply and demand, which could be used to make the decision making process easier, and encapsulate some of this expert’s way of thinking.
To use as part of operational work, a digital inter-face was built which shows changing demand and inventory levels, relevant news, prices, all shown on a regional level.
Safety
One oil and gas company’s health and safety group wanted to find better ways to prioritise attention on its various health and safety hazards. The company wanted to aggregate, index and analyse all of its organisational risk knowledge and make it more accessible.
It wanted to analyse the data beyond basic sta-tistics / probabilities, and provide the right data to employees, and have a system which would continuously learn.
The group had enormous amounts of knowledge acquired over the years about safety risks, and how it had aimed to mitigate those risks. The knowledge was fragmented around different projects, groups and worksites, so it was hard for anyone to be aware of the full risks workers faced at any time.
The data was both structured and unstructured, and included external data, and stored in dif-ferent formats and silos. It included looked at ‘learning from incidents’ pdfs, and hazard stud-ies.A system was built which all workers can use, at any competency level and at any worksite, to

June - July 2017 - digital energy journal 5
Leadersenter a description of the task they must com-plete, and then receive vital risk related infor-mation.
The software is now being used as a building block for further tools, looking at corrosion, analysis of seismic activity, and finding better ways to report incidents.
Job site supervisors can see all incidents which have occurred in the past related to what they are currently planning.
Note - the screenshot on the cover of this maga-zine illustrates software like this.
Cybersecurity
One oil company wanted to improve its detec-tion and filtering of phishing e-mails.
It wanted a tool for its cyber security analysts to be able to try out different hypothesises. For ex-ample, one analyst suspected that phishing mails were typically sent from throw-away e-mail ad-dresses and targeted at small groups of employ-ees, with different subject lines on each e-mail to try to avoid spam detection.
The company was already logging basic meta-data for every e-mail through the corporate net-work, but this data was unstructured, with up to 40 events logged per e-mail message and stored without any order, making it difficult to analyse.
By applying Maana to this log data, it was pos-sible to put a more useful database together, showing whether a certain e-mail should be considered a phishing attempt and then gather basic data about the phishing e-mails.
Well offset analysis
A company wanted to improve well planning by giving drilling engineers a comprehensive view of data about neighbouring wells.
It meant collecting data from different locations and analysing it simultaneously. The company was seeing many problems with bad data quality and differences in well naming.
Maana could also go through all the well sensor data to discover special events such as kicks and lost circulation.
Maana crawled Peloton WellView Databases, rig sensor files, downhole log files, technical documents, and well problem databases.
Well performance
One company wanted to work out how to get better at predicting the performance of a well, with many wells failing in their first year.
With Maana, the company combined historical drilling data (for example from Peloton’s Well-View) with different production data, including from Energy Components and about well pro-duction failure data, looking on a regional and global basis. This data was analysed together with well failure data. As a result, decision makers could see factors which were common to many failures.
Corrosion
A company operating refineries wanted to get better at understanding how corrosion is af-fected by having different types of crude oil.
The corrosion engineers often carried the know-ledge in their heads about how different types of crude respond to different environments, and how to treat it to avoid corrosion.
Maana crawled and indexed different data sources including refinery incident reports, in-formation about physical properties of crude, and incident data.
A system was built which onsite engineers can use, to work out how to handle the current type of crude oil effectively, including bringing up lessons learned last time that sort of oil was in the refinery.
Downhole Pump failure
One company wanted to analyse its downhole pump failure information. A failed pump means an expensive maintenance task and a stoppage to oil production.
A system was built using Maana software. The source data included pump failure reports, pump sensor data, and reports generated on demand. The system also analysed employee’s written notes from the field.
As a result of the analysis, maintenance employ-ees could get better at choosing the right pump for each site, they could anticipate failures better and implement a better predictive maintenance strategy. The system could be used by staff to validate different hypotheses related to failures and causes.
Tankers
One oil and gas company wanted to increase the utilisation of its tankers by 20 per cent and opti-mise its scheduling for its own cargoes.
Maana was used to make a system which would automatically answer 30 questions which trad-ers often ask. The answers are developed using models and 7 different data sources, including internal trading systems, oil trading portals, e-mails, ship documents, weather information and port calls.
The system could analyse this data to answer questions which computers normally need to be told the answers to, such as which cargoes can a specific vessel carry, what priority is a certain delivery, what is the best that can be done with an empty return voyage.
Optimum investment
The chief economist of a large industrial com-pany used Maana to help work out an optimum investment strategy to allocate funds across its multibillion dollar divisions, with investments in over 200 countries, in divisions of aviation, oil and gas, healthcare, locomotive and power generation equipment.
The work previously took two months for two economists to complete, with very complicated analysis work.
Maana’s software was used to work out which countries were best suited for each investment division, and which division investments were most suitable for each country.
Maana used data from the World Bank, Inter-national Monetary Fund and other world eco-nomic data, looking at factors such as indicators of a growing middle class, existing transport infrastructure, access to electricity and internet, and also the amount of foreign direct investment and the GDP growth.
People in each business division were able to specify specific criteria they were more inter-ested in, and allocate weights to different fac-tors.
The system also looked at good areas to invest in order to achieve growth in its aviation, gas, healthcare, locomotive and power generation equipment markets.
digital energy journal - June - July 2017 6
LeadersCollecting debts
One company wanted to find better ways to re-duce the number of outstanding invoices, which totalled $800m.
The finance team used Maana to go through over a million invoices, covering 5 years, looking for hidden patterns and correlations, with factors like disputed invoices, service issues, customer loyalty information, customer credit ratings, the price of oil and interest rates.
As a result, the company was able to predict the likelihood of late payments before the invoices were issued.
It could also spot root causes of late payments, including invoices with due dates on the week-end (which were paid the following week), first time customers being late, service issues not being addressed.
As a result of efforts, the collections were im-proved by 65 per cent, increasing working cap-ital by $520m, and special effort was made on
four different groups of customers – first time customers, customers with service issues, insti-tutional customers and customers with regularly late invoices.
The system recommended that all new custom-ers receive a phone call 10 days before their invoice due date, to check they understand the invoice and understand any questions. The sys-tem can ensure that companies with unresolved customer service issues are not called about out-standing invoices.
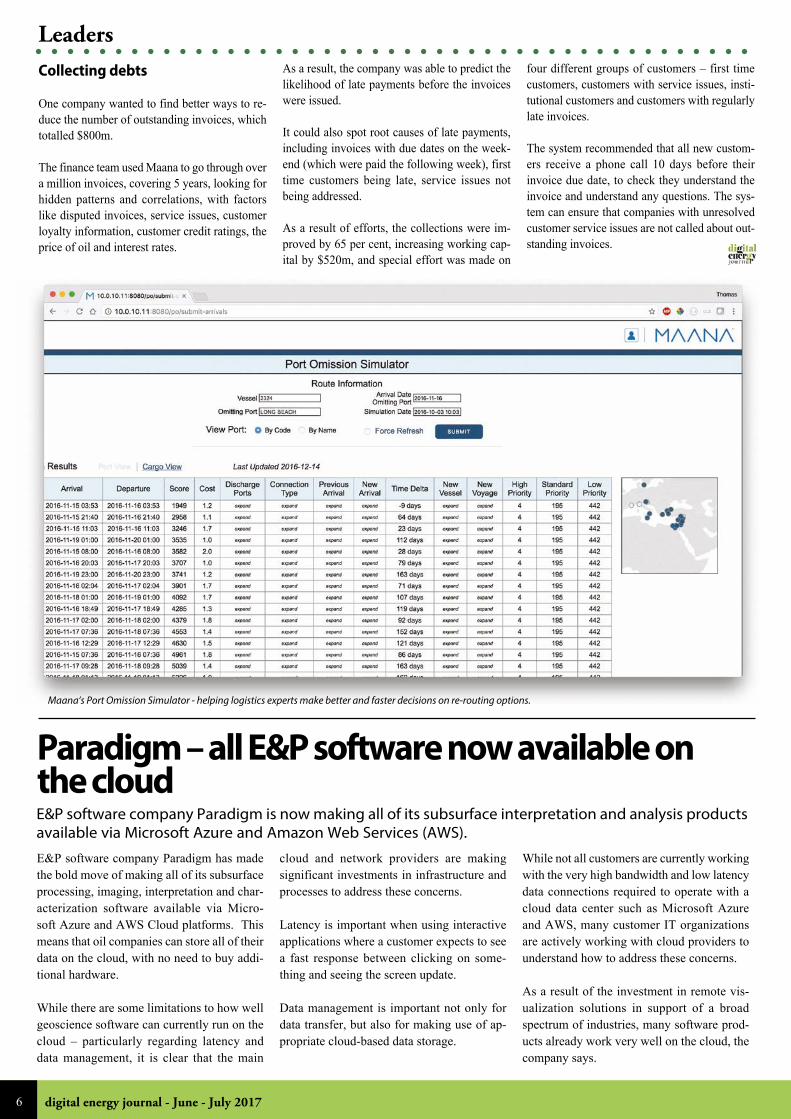
Maana’s Port Omission Simulator - helping logistics experts make better and faster decisions on re-routing options.
Paradigm – all E&P software now available on the cloudE&P software company Paradigm is now making all of its subsurface interpretation and analysis products available via Microsoft Azure and Amazon Web Services (AWS).
E&P software company Paradigm has made the bold move of making all of its subsurface processing, imaging, interpretation and char-acterization software available via Micro-soft Azure and AWS Cloud platforms. This means that oil companies can store all of their data on the cloud, with no need to buy addi-tional hardware.
While there are some limitations to how well geoscience software can currently run on the cloud – particularly regarding latency and data management, it is clear that the main
cloud and network providers are making significant investments in infrastructure and processes to address these concerns.
Latency is important when using interactive applications where a customer expects to see a fast response between clicking on some-thing and seeing the screen update.
Data management is important not only for data transfer, but also for making use of ap-propriate cloud-based data storage.
While not all customers are currently working with the very high bandwidth and low latency data connections required to operate with a cloud data center such as Microsoft Azure and AWS, many customer IT organizations are actively working with cloud providers to understand how to address these concerns.
As a result of the investment in remote vis-ualization solutions in support of a broad spectrum of industries, many software prod-ucts already work very well on the cloud, the company says.
A Clearer Image | www.pgs.com/WEI
Minimize the Effects of Complex Salt BodiesPGS Wave Equation Refl ectivity lnversion (WEl) has been specifi cally developed to correct wavefi eld distortions arising during acquisition and propagation. PGS WEI improves the amplitude fi delity and resolution of depth migrated images by correcting for illumination artifacts caused by salt or other complex subsurface structures.
Visit our website to read more about PGS WEI.

digital energy journal - June - July 2017 8
Exploration“Companies have two options in the Para-digm cloud offering: They can run the software on their preferred cloud compute platform, such as Microsoft Azure or Ama-zon AWS, and either have their IT manage the software installation , or have Paradigm manage it.
Most companies will probably adopt a ‘hy-brid mode’, with some of their applications in the cloud, at least for the time being,” says Indy Chakrabarti, senior vice president of Product Management and Strategy at Para-digm.
“Paradigm wants customers to have the same experience using their software, whether it is running locally, on the cloud, or in a hybrid setting. If Paradigm is managing the service, it can bring its competence in managing dif-ferent data types and data storage systems, in order to find the right computational hard-ware for the job. A number of companies are already utilizing cloud-based resources for their non-E&P applications, and we think 2017 is the ‘year of the cloud’ for E&P soft-ware.” Mr. Chakrabarti says.
“With the recent advances in remote visualiz-ation, customers don’t see any difference vis-ually between running software on the cloud
and on their company servers. The customer sees the exact same application and output,” he says.
Paradigm has agreement from 2 large cus-tomers to roll out the cloud configuration.
One common concern for oil and gas com-panies running cloud software is, of course, security. The cloud providers’ support secur-ity certification for a large number of differ-ent industries, including healthcare providers and government organizations.
The major cloud providers are also fully aware of the specific security concerns of the oil and gas industry, where oil and gas resource information, like other national data, may be subject to national laws. Cloud pro-vider investments in a worldwide network of data centers reflect this awareness of national data security concerns.
Benefits
Moving to cloud-based software aligns with oil companies’ drive to find more cost-ef-fective ways to operate. The IT industry continues to evolve the way they take ad-vantage of shared infrastructure, with recent
trends leveraging virtualization and adopting optimized cloud deployment tools such as Docker.
Today’s shared cloud data centers can be thought of as an evolution of colocation data centers.
The adoption of cloud-based data manage-ment can also help improve productivity by making subsurface data more easily avail-able. The process of integrating your E&P data into a common, managed environment can alleviate historic data management issues tied to systems distributed around the organ-ization, enabling staff to more easily find relevant subsurface data for the problem at hand.
Another benefit of cloud-based software is that it enables the more rapid adoption of new functionality, such as Machine Learning or real-time Analytics, into the application soft-ware portfolio. Paradigm plans to introduce such “cloud native” capabilities with its up-coming software releases.
An additional benefit of cloud-based software is that it can deliver a more agile software development and deployment methodology. In a managed environment where the soft-
2D data, like in the Geolog Correlator application, is easily accessible on the cloud. In Paradigm 17 VoxelGeo, RGB volume fusion is visualized in GPU mode after formation sculpting

June - July 2017 - digital energy journal 9
Exploration
Well planning, the process of defining how a well is going to be constructed, is an area where digital technology could add a great deal of value, perhaps helping reduce the costs of con-
structing a well by 50 per cent, reck-ons Magnus Tvedt, CEO of Pro Well Plan of Bergen, Norway.
By “well plan-ning”, the com-
pany is mainly talking about well design – decisions about (for example) which casing sizes you will use, what equipment, what well shape, in order to
reach total depth. It also includes making a plan for the actual operation (how the work will be done).
A good well plan should support high drilling performance, as simple as possible completion strings, and minimised risks of a collapsing hole, among other parameters.
Mr Tvedt, who worked in drilling at Statoil for 10 years, says that much of today’s detailed well planning is done ‘on the fly’ while the drilling takes place – the well plan (made in advance) is actually quite coarse (i.e. not granular) with instructions like “drill to x depth with x diam-eter hole.”
Probably well designs are kept coarse because there are so many unknown factors which might happen during drilling that a more detailed plan is of limited use.
But if computer software was used to get better at developing a reliable, detailed plan, spotting problems which may occur and adjusting the plan to reduce the risk of them occurring, then maybe it would be possible to create a more de-tailed and robust plan at the start.
This would in turn provide more opportunities for people to get involved in optimising the plan, and incorporating learning from previous drilling activities in the software.
Could well planning digitech help halve well construction costs?Better well planning tools could help work out ways to reduce well construction costs by as much as a half, says Magnus Tvedt, CEO of Pro Well Plan of Bergen, who spent 10 years working in drilling at Statoil
Magnus Tvedt
ware provider is continuously updating its applications, the customers’ IT organization no longer has to plan and schedule software updates and patches. This enables faster de-ployment and adoption of new technologies.
Can it work?
Geoscience software usually involves much bigger data files, more complex data process-ing and higher-resolution visualization than standard business software, while still requir-ing fast software response times, all of which can make it harder to run software in the cloud. Paradigm has been doing extensive re-search into which of its software applications can run well in the cloud, and how much data bandwidth and processing power they need.
“You can’t make a blanket statement, ‘put any software on the cloud and you’re fine,’” Mr. Chakrabarti says. “But testing has shown that much of Paradigm’s software, on stan-dard business internet connections, in fact runs efficiently today. Some of Paradigm’s software, such as the Geolog formation evalu-ation solution, only visualizes in 2D, for ex-ample. “You don’t need to worry about it too much on the cloud, it will be fine,” he says.
But if you are doing prestack processing of petabytes of data, “that’s a much bigger de-cision,” according to Mr. Chakrabarti. Com-
panies will typically start with the software they are most confident will work in the cloud, such as Geolog, he says.
With the advances in remote visualization, software which leverages 3D graphical views of the subsurface can also run “pretty well”, but the latency might provide a different experience than if you are working on data hosted on your own company servers. Here the main issue could be the distance between you and the data center. You may need to have an Amazon or Microsoft data center “near” your office“.
To enable a cloud application environment, where the end-users share E&P data within a company or a business unit, it is important to have an underlying data management sys-tem such as our Epos data management sys-tem which shares and synchronizes complex, structured E&P subsurface data between mul-tiple users. We are continuing to evolve our Epos infrastructure to take advantage of new cloud-based functionality, deployment and archiving capabilities,” he says.
“We’re doing evaluations, customer by cus-tomer, region by region, application by appli-cation,” he adds.
“We can safely say – most of our software is going to run comfortably.”
Subsequent roll-outs of Paradigm software
can be adjusted to work better over the cloud. “By 2018 we’ll be 100 per cent there,” he says.
Hardware Refresh Drivers
E&P geoscience software typically uses high-end computer configurations for ef-fective performance. Many companies have postponed updating their hardware during the downturn, but are now at the point where they want to buy new machines. So this is a good time to consider whether to invest in new ma-chines or to choose to run in the cloud, Mr. Chakrabarti says.
Rather than invest CAPEX in new equip-ment in a proprietary data center, or shared infrastructure data center, some companies are choosing to invest in long-term dedi-cated equipment at a cloud data center under an OPEX model. This has the advantage of putting the data close to additional cloud pro-vider resources, which can help customers take advantage of scalable elastic cloud com-pute when required.
Paradigm uses GPU resources in many of its applications, not only for 3D graphics, but also for accelerating compute speed. The recent addition of VM instances with GPU capabilities at major cloud providers is one of the key enablers for cloud-based E&P soft-ware.

digital energy journal - June - July 2017 10
DrillingIf the plan is made using a computer platform, the decision making process can also be more transparent – everybody can see all the data, why certain decisions have been made, or why the computer system is making a certain sug-gestion.
To use management jargon, drilling would be more proactive, less reactive.
Mr Tvedt also believes a more granular / de-tailed well plan can also make it more feasible to used advanced drilling methods, like man-aged pressure drilling, or advanced automation equipment.
In this way, the software can help reduce the overall costs of constructing a well, if it supports putting together a plan which is more robust, more detailed, has more risks thought through in advance, with well planners more engaged in optimising and special challenges rather than routing work, and more of the learning from previous drilling activities incorporated into the plan.
Mr Tvedt spent 10 years in Statoil, working on drilling and wells, including on deepwater drilling projects in Houston, also in field de-velopment in Norway and the Gulf of Mexico, working in the operations and research depart-ments.
The company has a team of 3 staff and an ex-perienced management board, including one of the founders of SPT, the company which made the ‘OLGA’ software.
So far, Pro Well Plan has been engaged by one major drilling company to help it work out a ‘digitisation’ strategy.
Ultimately it would like to be able to agree “turnkey” contracts with rig owners, to manage the planning of an entire well, Mr Tvedt says.
Multiple parameters
Drilling projects involve multiple parameters which interplay. For example, if you decide to case a well you have drilled so far and continue drilling with a narrower diameter well, you won’t have contingency to go down one casing size later. You also need to ensure that every piece of equipment you need to put in the well can fit through the narrowest diameter tube in the well.
The usual way of avoiding problems from inter-playing factors is by having a group of experts with different expertise in a room discussing the plan, Mr Tvedt says.
But computer software can perhaps do a better job of spotting factors which interplay and may cause problems.
A new drilling market
Mr Tvedt anticipates that software like this could support a new league of drilling compan-ies who want to sell their product on the basis of higher performance, and stand out in the market.
Today’s drilling market could still be considered immature, with companies selling their services by the day, rather than by their overall product and performance, he says.
In future, success should go to the companies which have the best algorithms and strongest data, he said.
How it works
The software can start by designing a ‘default well’ – based on information about the geology, where the reservoir is. This takes about 2 min-utes.
The engineers and planners can then take this ‘default well’ and work with it to improve it. As they do this, the software can automatically highlight potential risks.
The model is refined with more detailed infor-mation, such as about fluids, casing strings and specific risks to avoid.
The software would not be used for the core en-gineering calculations, such as fluid flow chan-ges with temperature and pressure, or pipeline engineering. The software can take some of the engineering calculations directly out of engin-eering software.
The output of the software can either be in docu-ments for rig crews to read and follow, or as a data stream.
If anything changes during the actual drilling, the software’s “risk analyser” can run again.
You can incorporate a learning from a past event into the algorithms. Oil companies can choose whether they want to keep their own algorithms just for their company use, or share them with other companies. Drilling companies in Norway are generally happy to share expertise so long as the sharing is reciprocated, Mr Tvedt says.
For example you could write an algorithm showing the maximum distance a certain section should be drilled in a certain geology.
The oil and gas industry is seeing big advances in automation driven analytics – with the data from automation systems being used in new ways, for example to try to prevent equipment breakdowns and plan maintenance.
We are also seeing analytics driving investment in more automation equipment – particularly
investment in a multitude more sensors, all gath-ering new types of data.
We asked Paul Bonner, who runs the consult-ing and data analytics group within Honeywell Connected plant (serving oil and gas, pulp and paper, metals and mining, and power) what the trends are.
Self-serve analytics
One interesting trend is the development of “self-serve analytics” tools, which can be used by the domain experts themselves (such as production engineers and maintenance engineers) to try to get a better understanding of what is going on
“Many customers are looking at ‘self-serve ana-
Automation driven analytics (and the reverse) The oil and gas industry is seeing big advances in automation driven analytics (analysing data from automation systems). We are also seeing analytics driving automation – encouraging the installation of many more sensors. We asked Honeywell’s Paul Bonner what is going on

June - July 2017 - digital energy journal 11
Operationslytics’ for the first look at the data type scenar-ios,” Mr Bonner says.
“It is all about cycle time. If you see a problem, you can identify it yourself and fix it in a short while, rather than have to go outside and hire a consultant. If you can solve a problem immedi-ately – rather than leave it for a few days – it is better.”
For many years, production engineers have had ‘trending’ packages available to make simple analytics, taking data from historians and auto-mation / control systems.
But now the capability to do analytics yourself is much bigger. “Someone who is not a domain scientists but who is a domain expert – can get quite a long way to analysing the data or the situ-ation using self – service tools, before you get to the stage of using bigger and more powerful data science tools,” he says.
More sophisticated analytics
The analytics tools available are becoming far more sophisticated, Mr Bonner says.
Open source software tools (available free over the internet) have seen increased popularity over the years. These tools require skilled program-mers and analysts to build data analytics solu-tions. “Now there’s a lot more commercial tools on the market which have a lot more information in them,” he says.
“There are literally thousands of different ana-lytics tools out there, it’s a matter of selecting the right tool for the right application, picking the tools that are most effective.”
This means that the expertise and models of data scientists can be embedded in the tools – there is less need to have data scientists working just for you.
“It makes the ability to do analytics much more efficient than it used to be,” he says.
The software user interfaces are also getting much more sophisticated, with a range of ana-lytics and visualisations immediately available.
Choosing the tools
This leads to another problem – how a company, or individual engineer, should choose which tools to use.
“For any given industry you’re going to pick a
rational set of tools,” Mr Bonner says. “It is not about having hundreds of tools, it is about people being very effective at using the tools they have. People select the things that are appropriate to their skill level.”
There still needs to be some centralised control on which tools are used, in order to ensure the computer networks cannot be hacked and the data quality is maintained.
“Somebody has to be responsible for these on a corporate level. That is the IT department’s pri-mary role, managing the infrastructure and data. The data and its security is still the responsibility of the centralised IT function,” Mr Bonner says.
Predictive maintenance
The biggest and most mature use of analytics in the oil and gas industry is probably in predict-ive maintenance (predicting the best time when maintenance should be done), he says. “That’s the most prevalent use of the technology.”
“We are providing tools that allow you to pro-actively replace equipment before it is reducing the operating effectiveness,” he said. “It takes on a number of different forms, it’s a mixture of tools and platforms.”
In a Honeywell customer survey, unscheduled downtime (due to equipment breakdowns, or a sudden need for maintenance) was ranked as the top threat to maximizing revenue, so there is a big interest in using analytics to find ways to identify problems before they cause a breakdown.
Many companies also admitted to running equip-ment harder than recommended – and analytics can help them work out how hard the equipment can typically be run based on past experience.
Data scientists
The question of what role data scientists should play, and will play in the longer term future, continues to be a complex one. Data scientists probably have more competence than engineers in raw data analysis – but how useful is this if they don’t understand what the data is saying?
“I somewhat subscribe to the idea that good ana-lytics tools and technology has to be coupled with good domain expertise,” Mr Bonner says.
If a data scientist is involved looking for correla-tions, but without understanding the domain, they will probably just find a correlation which the domain expert already knows about. And auto-
mation data usually is very correlated.
Bringing in remote experts
With more analytics data hosted on cloud systems, it gets eas-ier to bring remote domain experts to look at it, such as people from the original equipment manufacturer, who
has the best know-ledge about how their equipment operates.
“We do see a lot of value in having the equipment experts involved, and being able to provide that service to the end customer,” Mr Bonner says.
More sensor data
A parallel but related trend is that more and more sensors are being installed on equipment, measuring parameters such as temperature, and recording changing parameters such as vibration. This could be considered analytics driving the automation systems.
The costs of sensors are dropping, partly driven by research and development into new sensors as part of the ‘industrial internet of things’.
Honeywell is interested in the idea of ‘edge com-puting’, doing computing where the sensors ac-tually are, so they only send important data, not continuous streams of data.”
Running the platform
For some customers, Honeywell offers a service to run the entire data platform, including install-ing sensors, doing analytics and hosting the data, and maintaining the system.
It builds automated tools, which take in all the streaming data, and identify if it is normal oper-ations or abnormal, and what an expert might need to look at, so experts can focus on problem solving.
For other customers, Honeywell just provides the tools and technology, and helps integrate it with other technologies the customers have, he says.
Honeywell is also developing its own cloud infrastructure, which its customers can use to store data.
Paul Bonner

digital energy journal - June - July 2017 12
Operations
Canadian software company Aclaro Softworks Inc is helping company business units (such as a country headquarters of an international oil company) get a better understanding of the overall resource data – which can help them make better decisions in terms of the overall corporate objectives
Aclaro Softworks Inc of Calgary, Canada, is making software tools which enable busi-ness units of oil and gas companies, such as a country headquarters, access to the same data about oil and gas resources as a corporate head office has, but with data only about their country business unit.
The purpose is to help business unit man-agers make decisions which help the com-pany achieve its overall corporate objectives, including promises made to shareholders and lenders.
For example, oil and gas companies are val-ued mainly on their subsurface resources. The company will have a strategy, or promises made to its investors or lenders, to achieve a certain valuation, and will want to make de-cisions which enable it to come good on its promises. And different investors and lenders calculate the value of resources in different ways.
Meanwhile individual business units usually have a detailed understanding of their profit and loss, their spending, their cash flow and whether the wells are producing or not, but not about other decisions that might affect corporate priorities.
With better data, they can make strategic deci-sions such as whether it makes sense to do en-hanced oil recovery (and increase the amount of accessible resources), or do workovers to a well to increase production.
Or, a company can use the data to help choose between a high capital, high risk, high reward deepwater project, or a lower capital, lower reward, lower risk onshore fraccing or stimu-lation project. They can also avoid surprises at the end of the year, when everybody discovers that the different business units have been making decisions which did not lead to the company achieving its overall financial objectives.
A ‘business unit’ here is a business division which makes operational decisions for a field or a country. For example – a US company with activities in Malaysia, a company has
an Eagleford business unit, some companies have ‘international ‘business units.
The difficult economic environment also means that difficult decisions need to be made more often – so data needs to be reviewed more frequently. Many companies are re-viewing their results against their plans on a weekly or monthly basis, rather than annually as they did before.
Business units can put together a 20 year plan, a 1 or 2 year operational plan, and compare the results to the actuals or see trends over the year(s).
Companies with an efficient process to com-pare results with their plans can manage their overall situation better, says Craig Burden, VP business development, based in Houston.
What the software does
The business unit can use Aclaro software to look at data in different dimensions, see an overall story, or understand what is happening at the well, field or business unit level.
They can set up dashboards, looking at for example the reserves replacement ratio (rela-tionship of the reserves added to the amount of production).
They can use Aclaro to interrogate data, an-swer questions and find trends and anomalies.
You can see if the company is making the right decision to grow its resource base. You can see the business’ objectives and make day to day decisions which align with that.
You can look at all of the projects or wells within the business unit, and see (for ex-ample) what is creating the most value in the organisation with the least amount of risk.
It can be linked to assets of any size – such as a lease, a well, a completion within a well. The data can be “rolled up” to different levels, to support different decisions people need to make.
The resource base can be calculated in dif-ferent ways by different organisations, and this is something companies might want to consider – for example if they need to get financing from the investment markets. The software can demonstrate what the company’s current position would look like to different banks and investors, based on their calcula-tion methods.
The software is web based, with a browser type interface. It can be configured for each client, so it fits the data that they have and allows people to work with it.
About Aclaro
Aclaro Softworks was founded in April 2000, with an initial focus on rolling up data from the various economic produc-tion history tools, so people at corporate level could see a big-ger picture.
Over time, the company developed a focus on reserves, planning, and capital allocation.
Aclaro Softworks is headquartered in Cal-gary, and all of the software is done in-house there. The company is privately funded. It has 7 staff in the Houston Office, and an office in The Hague.
The company’s “petroLook” software can be used for reserves management and report-ing, corporate planning, ‘lookback analysis’, operational budgeting, capital allocation and budget management.
It can gather data from systems like econom-ics software, accounting, ERP, technical apps, corporate data, spreadsheets and field data.
It can show production history, forecasts, when PUDs (proven undeveloped) reserves are coming online, Reserves Life Index and Reserves Replacement Ratio (RRR).
Aclaro Softworks – helping business units work with corporate resource data
Craig Burden

June - July 2017 - digital energy journal 13
Operations
SAP – in production and operationsEnterprise software company SAP is developing its product and service offering for people in production and operations management roles, in addition to the Enterprise Resource Planning (ERP) software which it is better known fo
Enterprise software company SAP is develop-ing its product and service offering for people in production and operations management roles, particularly offering analytics based tools. SAP is best known for its Enterprise Resource Planning (ERP) software, which is basically for managing financials, maintenance, purchasing, materials management, and inventory, where it has an enormous market share in the oil and gas industry. These are basically transaction management and data management systems. Most oil and gas companies are trying hard to give their decision makers a much more in-depth understanding of what they are actually doing in operations, says Stephane Lauzon, director for SAP Oil and Gas, responsible for the company’s overall upstream strategy and solutions. For example, they would like to work out better ways to tie their costs / spending to where the production revenue is coming from. One “large independent oil major” has integrated 20 differ-ent data sources to get a better overall under-standing of their upstream portfolio. One oil company has a small team, including a data scientist, to try to find ‘short term type wins’. Another “large integrated major’ is try-ing to get a better view of fleet equipment which may be from multiple vendors, in different mod-els. Another is trying to better prioritise how work is done. And, one oilfield service customer has developed a better field ticket system, which can be accessed both online and offline.
Software ecosystem SAP is trying to encourage the development of an ecosystem of software providers, developing tools or “apps” which can run using SAP tech-nology and data. The apps can be developed by equipment manufacturers and automation vend-ors, as well as SAP itself. “There’s a very healthy ecosystem of small soft-ware companies that build around our platform,” Mr Lauzon says. “It is an open platform that allows that kind of development to take place. “Those applications tend to be highly specialised or niche or isolated.”
“The upstream space has always been rich in these vendors,” he says. Companies can get their solutions certi-fied by SAP, show-ing that they can (for example) work with plant maintenance or
help with production operations on SAP’s latest technology platform. This is also a way for SAP to indirectly get in-volved in new markets, or new aspects of pro-duction and operations. Analytics systems To help run the analytics, SAP produces the “HANA” real-time data repository, which runs in a computer’s memory, so it can process large amounts of data very quickly. In this sense, it can be both an analytics system and a platform. It can run on cloud computers, or on an oil company’s own in-house computers.
SAP is helping oil and gas companies develop an ‘asset information network”, an automated system which can take data from the different data sources and sensors, and present a view of the whole asset. It can help decision makers work out how ser-ious different events are to the business in dif-ferent ways – production, cost, profitability, helping people to prioritise, with much more granular performance data. The same data can also be provided to people in the field, in a format which they can use. Also, personal observations from field staff can be in-corporated into the system. All of this ultimately helps companies get a better sense of their production, not stricktly in volume terms, both now and in the future, Mr Lauzon says.
Operations SAP is developing tools for asset management, health and safety, risk analysis, environmental stewardship, performance analytics, workforce planning, process safety, workforce mobility. The company sees this as integrating “informa-tion technology” with “operational technology”, says Mark Pyatt, senior director of operational integrity, global oil and gas, with SAP. Customers are very keen to rationalize data and systems to create ‘one version of the truth,’ based on their various data sources, and to get there by reducing and automating manual pro-cesses as much as possible, Mr Pyatt says.
Trying to create and maintain one system of re-cord, or integrate fewer systems of record (that speak to each other) is a huge issue for most companies,” he says. “They want to integrate, but have difficulty prioritizing, migrating and using the data productivity. This results in a lot of frustration for everyone involved.
For operational staff working in hazardous pro-jects, it can be a challenge working out how to transition from their current working environ-ment to one based around analytics. “That’s what our customers struggle with most, where do you start, how do you move quickly, how do you sustain the journey, while showing wins along the way,” he says. “Those are things we run into all the time, in conversations with customers.”
The company is building “aggregation” tools, which gather together different types of data, such as work orders, structured and unstrctured content, to help staff make better decisions. “We have a way to aggregate the data sources together that we didn’t have before,” he says. “It allows our customers greater flexibility,” Digital twin
A particular area of interest for oil and gas oper-ations staff is having a “digital twin” – a digital version of a physical asset, with the data usually stored on the cloud.
Stephane Lauzon

digital energy journal - June - July 2017 14
OperationsThe digital twin can be developed using information from equipment manu-facturers, when the asset is first put into service. When the asset needs mainten-
ance, the infor-mation about required parts (the ‘equipment and material master’) and the work order
(describing what needs to be done) can be downloaded out of the ‘digital twin’. If there is any update to the digital information, it is populated in the ‘digital twin’ for the asset.
So when the field worker opens his work order, he can view the update from the manufacturer, and optimize his repair process. The network updates to all on-premise sites simultaneously, so the worker is always viewing the latest infor-mation from the manufacturer about the asset he is working on. The ‘digital twin’ on site stores the data until it is changed with another update
from the manufacturer, or through repair. This means that all work orders, equipment and material masters will automatically be updated in future. This also means that the oil and gas companies can encourage the equipment manufacturers to take more responsibility for the data quality and performance of the asset, Mr Pyatt says.
Flat panel satellite antennas expected on the market in the near futureHigh bandwidth flat panel satellite antennas could be available for offshore use in the near future months
The oil and gas industry can expect to see flat panel antennas for high bandwidth off-shore satellite communications soon, says Rolf Berge, director of products with satellite communications company Speedcast.
These can replace the “mushrooms” or large, white radomes – the antennas which need to be always pointing directly at a satellite, and so need a complex system of gyroscopes, accelerometers, motors and belts to keep it locked on the satellite as the ship rocks or turns, moving the satellite in 3 axes, and protecting the antenna inside a large, white radome.
Flat panel antennas become possible due to a number of different technologies and needs – the launch of high bandwidth low orbiting satellites, the demand for satellite communi-cations in aviation (where stabilised antennas cannot be used due to wind resistance) and the technology which enables the antenna to be electronically pointed at the satellite.
Low earth orbiting satellites
The first communications satellites to be launched (around 1976) were geostationary, which meant they stayed above the same position on the earth. Because of the laws of physics, a geostationary satellite needs to be 36,000 km above the earth’s equator, so that it rotates around the planet once in 24 hours.
Technology has been gradually improving for
low earth orbiting satellites (LEOs), which orbit the earth at 800 to 1400 km. These move around the planet much faster. But with a big enough web of LEOs, you can provide con-tinuous coverage. Early examples of these were Orbcomm, which carried text message chunks of data in the mid-1990s, and Iridium, carrying phone and 2.4 kbps data from 1998.
Meanwhile, the bandwidth from geostation-ary satellites has been steadily increasing, from around 9.8 kbps in the early days to typically 5 mbps to 15 mbps to some off-shore drilling rigs with some receiving up to 50 mbps.
But in early 2018, we can expect to see a new constellation of 650 LEO satellites launched by a company called OneWeb (formally WorldVu). Each satellite will be able to carry 6 gbps throughput total for each satellite, ex-pected to work out to be 15 mbps for an indi-vidual user (1/400th of the throughput of one satellite, or 1/260,000th of the throughput of the whole constellation).
New satellites are able to carry higher band-widths basically because they are designed to aim the satellite beams to where they are needed, so they use their available energy more efficiently. The first communications satellites would point at half of the earth’s surface at once. Today’s satellites send indi-vidual beams to a small space on the earth’s surface (say a circle of 500 km diameter). So the same power could be pointed either at half of the earth or via hundreds of smaller beams.
If the satellite antenna on earth is mobile (for example on a ship), then it will need to switch from one beam to another.
There are also advances in energy manage-ment on the satellites and solar panel tech-nology.
This is not the only constellation of high-bandwidth LEOs currently being planned. Besides OneWeb, we are monitor-ing progress with LeoSat, Telesat and other similar LEO initiatives.
Also, there is no problem using LEOs when you are close to the North or South Pole, as there is with geostationary satellites. (They are above the equator, so a ship close to the North Pole eventually loses the line of sight with the satellite, and otherwise will need to send data nearly horizontally through the atmosphere, and the air can attenuate radio signals).
With 650 satellites orbiting, any point on the earth will have line of sight to anywhere from five to 10 satellites at any time.
The communication also has a lower latency (time for data to go to the satellite and back) because the satellite is closer. This is a major factor when running data networks over sat-ellite because the latency can interrupt the working of the software (which was usually designed to run over terrestrial networks with hardly any latency at all).
Mark Pyatt

June - July 2017 - digital energy journal 15
Operations
Geostationary satellites will typically see a latency of 500 ms, but with a LEO it is re-duced to 20 ms to 30 ms, something similar to if you were using fibre optic terrestrial com-munications.
Also, companies could have much more com-munication capacity available to them. Many floating production storage and offloading vessels (FPSOs) “could consume 100 mbps if it was available,” he says.
Mr. Berge emphasises that there has been a great deal of industry discussion about the new generation of LEOs, but all of the pro-posed projects are still in planning stages. “We don’t yet see a fully functioning LEO new generation satellite constellation in place,” he says.
Antennas
The flat panel antennas are also being de-signed for the aviation industry, because it needs antennas which do not protrude from the aeroplane and cause wind resistance.However, there is a big advance to using them in shipping and offshore – because they have no moving parts, they are much easier to install and operate.
For high bandwidths, shipping companies and offshore operators will probably still want an antenna with equivalent area to the 2.4 m diameter “C-band” antenna normally used with geostationary satellites.
If it can be flat, it can be stuck onto a roof or any small, flat surface. You can even split the antenna up if you don’t have one space large enough.
Offshore shipping companies probably won’t mind seeing the back of the traditional 2.4 m C-band antennas. It typically takes two tech-nicians a whole week to install one antenna, and many companies have two, to make sure they can always see the satellite, so installa-tion can take two weeks.
The components are shipped to the installa-tion site separately, the antenna is built by technicians on land (a two- to three-day job), and then lifted onto the vessel by crane (the weight is 900 kg to 1000 kg), a task with many safety concerns. The work also needs to be planned around when a vessel will be in dock for other repairs or maintenance.
There also needs to be bed space available on the vessel for the technicians, particularly if maintenance work needs to be done while the vessel is sailing.
Most offshore platforms have a 2.4 m diam-eter antenna, inside a larger radome.
The whole thing is very heavy, expensive and because of many moving parts, risk of failure is higher compared with flat panel.
“We’re very excited about flat panels. We be-lieve there will be strong interest in the new flat panel antennas, and very much look for-ward to their commercial availability. We are testing early versions already,” he said.
Difficulties with big antennas
A common problem is that designers of off-shore vessels often do not include a suitable position for a 2.4 m antenna, Mr. Berge says.
Drill ships and large rigs usually need more than one antenna, because if the vessel is orientated so that the tall drilling derrick sits between one satellite antenna and the satel-lite, it will need to switch to the other antenna.
Interestingly, designers have got used to adding many other features, such as sickness rooms and kitchens, but somehow not an-tenna space, he says.
But it will be much easier to find a home for a flat panel antenna, if it can be placed on any flat space. It is only a few inches thick.
Phased array / electronic steering
The panel is actually not one antenna, but thousands of tiny ones. It is put together in blocks, where one block is about the size of a laptop, and can have 500 micro antennas in it. The technology used is called “phased array”.
The antenna needs an electronics system which can keep track of where the closest satellite is, and switch the antenna from one satellite to another immediately at the appro-priate time.
The flat panel antenna is electronically steered. This means that electronic methods keep the antenna pointing at the closest satel-lite, not physically moving the antenna.
Mr. Berge explains it like this. If you imagine dropping a pebble on a lake of calm water, it will create waves moving outwards. If you drop two pebbles in different places, they will create two sets of waves. Where these waves align, they will combine, so you get a double sized wave. If you do computer modelling, you can work out where and when in the lake to drop the pebbles, to get a wave going in any direction you want.
The electrically steerable antenna works like this. By controlling where the wave is cre-ated (equivalent to dropping the pebble in the lake), you can get a strong wave going in any direction you want, so generate a wave going towards the satellite, wherever the satellite is.
A further issue is that the advances of recent years in satellite technology have not been mirrored by advances in antenna technology.
What the flat panel antenna might look like (note - this version is curved for use on an aeroplane)

digital energy journal - June - July 2017 16
Operations“It is about time that users can get up-to-date, matching hardware – to make best use of the new satellites,” he says. “That’s what Speed-cast is preparing for.”
The company developing the flat panels is a partner company of Speedcast – Pha-sor. With major facilities in the UK and the United States they expect the product to be on the market in the near future.
Another challenge with traditional satellite communications is that companies often use C-band because it is the only available ser-vice when in deep water, but when they come within 200 km of shore, they often have to switch to Ku-band to meet local regulations, a change which can require a technician visit. “That’s something that seismic vessels have been suffering from,” he says.
Communications costs
The price of the communications themselves continues to drop.
Today, even very wealthy drilling companies can be constricted in the amount of data they can send or receive, due to satellite limits. Drill ships with 5mbps satellite communica-tions typically use it entirely all of the time, he says.
But with more and more satellites being launched and more capacity becoming avail-able, this cost will go down.
Companies are using more and more software applications which run over the satellite, in-cluding enterprise resource planning (ERP) software and real-time monitoring, and there can be a number of different companies in-volved.
The communication protocols including TCP-IP often struggle to work with the high latency of a geostationary satellite communi-cation, sometimes resending data because the system thinks it did not arrive.
“There are certain versions of ERP appli-cations that perform very poorly on high latency networks,” he says.
The oil and gas industry can expect to see flat panel antennas for high bandwidth offshore satellite communications soon, says Rolf Berge, director of products with satellite communications company Speedcast.
These can replace the “mushrooms” or large, white radomes – the antennas which need to be always pointing directly at a satellite, and so need a complex system of gyroscopes, accelerometers, motors and belts to keep it locked on the satellite as the ship rocks or turns, moving the satellite in 3 axes, and protecting the antenna inside a large, white radome.
Flat panel antennas become possible due to a number of different technologies and needs – the launch of high bandwidth low orbiting satellites, the demand for satellite communi-cations in aviation (where stabilised antennas cannot be used due to wind resistance) and the technology which enables the antenna to be electronically pointed at the satellite.

June - July 2017 - digital energy journal 17
Operations
Energistics – developments with PRODMLOil and gas standards organisation Energistics is continually improving PRODML, the data exchange standard for production data. CTO Jay Hollingsworth presented the latest developments at our Aberdeen conference in March
Energistics, a data standards body based in Houston, has a re-leased a new version of its PRODML stan-dard for exchanging many different types of production-related
data.
The new version includes a standard for shar-ing fibre optic distributed temperature sensing (DTS) and distributed acoustic sensing (DAS) data from oil wells.
This standard was requested by a number of PRODML users including Shell, who could see many of the DTS vendors developing their own proprietary communication protocols, and wanted the industry to develop a standard system before the proprietary ones become too embed-ded.
Energistics is also making the associated docu-mentation easier to work with by software de-velopers, and similar to documentation that software developers usually work with.
There was a common problem that oil compan-ies were asking an IT manager to look at how hard it would be to implement the standard, and the IT manager would just see pages of complex documentation, and pluck a figure out of the air, like $1m and one man year. This would kill the project.
Version 2.0 includes a standard for exchange of Pressure Volume and Temperature (PVT) data for gas, for example between a measure-ment company and an oil company. This was requested by ExxonMobil and Chevron. Previ-ously, the data would be provided as a pdf, and oil companies would need to re-type it into the system.
Energistics has also developed a simplified ver-sion of PRODML. This is suitable for when oil company joint venture partners, and govern-ments, just want a simple monthly production figure.
Energistics has also made it possible to use data from its different standards together – such as well bore data from its WITSML drilling data
standard, and reservoir data from its RESQML reservoir data standard together with production volumes from PRODML.
Energistics recently developed a new way to transport data, called Energistics Transport Protocol.
Previously, data was exchanged via constant polling – the receiving computer would ask the sending computer several times a second if there is any new data. Now the data can be streamed.
The transport protocol has been purpose built for the upstream oil and gas industry, and is simpler than many other protocols developed for vari-ous ‘internet of things’ purposes. But it also has functionality which the other ones don’t have, which is useful for oil and gas.
Background to PRODML
PRODML was designed as a standard way to move production data from one application to another, for example, from an offshore meter to a cloud based database, or software tool. It has been around since 2005.
Many oil and gas companies have developed some kind of ‘digital oilfield’ system. It basic-ally means having real time surveillance of production, taking data from the oil field to the analytics systems. The production engineers can use the data to optimise how the field is operat-ing, and use that to change operation parameters.
Making everything fit together, from the auto-mation systems to the analytical systems, really needs data standards, Mr Hollingsworth said.
He was speaking at the Digital Energy Journal conference in Aberdeen on March 14, “Improv-ing production rates through new approaches to digital technology”.
Really high frequency data, such as real time process control, can be handled better using a real time data standard, typically managed by the OPC Foundation. PRODML is more for where data is gathered on a delay, monthly or yearly basis, which happens in applications which pro-duction engineers typically use for field optimis-ation.
Energistics also has two other major standards, WITSML for drilling and RESQML for earth modelling. But PRODML and production data is quite different to these, Mr Hollingsworth said. Drilling data covers a “pretty limited set of information”. The earth model has a “lot of stuff in it but it’s kind of cohesive.”
But the world of production is very different, in-cluding everything from operational information (who is at the well, when did the helicopter last come), the results of well tests and lab analysis, “There’s lots and lots of data that’s fundamen-tally diverse that all gets lumped together in the world of production,” he said.
PRODML can also be used for production re-porting to governments. Governments and in-dividual states often develop their own systems for how operators are going to report monthly production volumes and well tests. If every-body used one format, it would make it much easier for oil companies, and also make it more viable to build and sell software to handle it automatically.
There have been a number of pilot projects. One of the first was led by Chevron, in 2006, to post joint venture production data in the cloud.
Another pilot project was with oil company Pioneer Natural Resources, which wanted to do production analytics and visualisation with Spotfire, bringing data in to Spotfire in a stan-dard format, rather than having many different ways to bring the data in.
There was a pilot project for distributed temper-ature sensing data, where a fibre optic cable is used to record temperatures, linking this data with data from their PI Historian.
BP had a project to try to keep track of the pipe-line network flow model, so people could see how the pipe is connected together in a standard way, including showing which valves are closed, or which pipelines are damaged and shut off.
Conoco Phillips wanted a standard for produc-tion reporting and updating their network flow model. Statoil wanted a way to optimise their downhole control valves. BP wanted a way to set safety points for gas lift optimisation.
Jay Hollingsworth
digital energy journal - June - July 2017 18
OperationsThe pilots were also aiming to show if data could be stored in a cloud server, and computing down on the cloud. For example a cloud based system could compute the optimum set points for a gas lift optimisation, which can then be fed back into the control system.
Saudi Aramco forces all of its drilling vendors to use WITSML, to make it easier, and now it is doing the same with PRODML.
Norway
In Norway, the government wanted a production report which could be read by both humans and computers.
So they use PRODML for data reporting. Some-times the complex version of PRODML is needed – if there is a complex system of plat-forms connected by pipes and oil discharged to tankers in different places.
The Norwegian Petroleum Directorate didn’t want to check operator submissions themselves, so it asked the industry to find a way to guaran-tee that the data is correct before it arrives. So the industry created an organisation called EPIM, which receives the transmissions and runs a ser-
ies of checks, to see if data is complete and self consistent, before submission to the government.
About Energistics
Energistics makes data exchange standards. Put simply, it is about locking together people from the oil majors and software companies and say-ing that they can’t leave until they have agreed on how they will exchange information.
“It is pretty much that simple. You get people who are using the data to decide how they are going to exchange it,” he said. The standards are developed by members not Energistics staff.
There are a number of groups developing oil and gas standards, and not much overlap between them. There is some space where no-one is mak-ing standards. Some standards are primarily for data storage, but Energistics is primarily focused on data exchange.
Some other standards groups include PPDM, developing a standard data model for storing data; SEG making a standard for transfer of seismic data; PIDX for e-business transactions;
PODS, Pipeline Open Data Standards; and the MIMOSA standard is used on maintenance in-formation.
Time looking for data
Jay Hollingsworth noted that the commonly heard phrase, that geoscientists spend 60 per cent of their time looking for data, is probably not true. It would mean they spent 3 days a week for their entire career looking for data which is a bit crazy.
But what is true is they spend 60 per cent of their time trying to reach the point where they have a trusted data set they can use to do analysis with – to start doing their job, basically.
For example, you find that wells are in the wrong place, because the positions were recorded using a different datum system.
“Reaching the point of trusted data is a really im-portant thing,” he said. “Geoscientists do spend a large amount of their time trying to get to that point. Petroleum engineers are struggling to get to the point where they have a piece of trusted data.”
Eigen – time for a better system to spreadsheetsWestern business saw enormous improvements in productivity, and share price growth, during the period of about 1980 to 1999, which were also the first two decades of the spreadsheet. But since then, productivity improvement and share price growth have stalled, which may be an indication that it is time to move on, said Eigen’s Murray Callander Today, we have much more widespread access to data than in we did a couple of decades ago - but people don’t all come to the same conclu-sion in their analysis of it.
So perhaps we are moving now to a new way of working, geared more to flexibility and au-tonomous working structures, rather than one where we expected to find all the right answers from looking at a spreadsheet, said Murray Cal-lander, CTO of Eigen.
He was speaking at the Digital Energy Journal conference in Aberdeen on March 14, “Improving production rates through new ap-proaches to digital technology”.
This should lead to a different way of working – which is far more iterative and agile, where you can see how something turns out and then change it.
“I think we’re on a 30 year journey,” Mr Cal-lander said. “I believe spreadsheets are holding
us back. We need to change the way we think about stuff.”
Work on spread-sheets could be traced to 1969, when Rene Pardo wrote the ‘LAN-
PAR’ language for programming arrays at ran-dom, gaining a patent in 1982. In 1979 Apple’s “VisiCalc” was launched. Microsoft Excel was launched in 1985, becoming the market leader in the 1990s due to the growth in Microsoft Windows. And it has been used to run oil and gas operations ever since.
The FTSE share price index rose steadily over this period, from 1981 to 1999, and compan-ies got much better at planning and analysis, perhaps largely with the help of spreadsheets, which could be used to help understand better what has been going on. It was also an era of ‘command and control,’ where a leader aims to
understand a situation (probably with the help of spreadsheets) and make decisions.However, if you look at the FTSE share price from 2000 to 2016, there is no steady growth, just ups and downs, a totally different picture. “So perhaps this indicates that the value pos-sible from the spreadsheet, and the ‘command and control’ thinking it led to, was fully realised by about 2000.”
About Eigen
Eigen’s background is as a consultancy devel-oping data management services, but it started developing a standard data ‘platform’ for the oil and gas industry in 2007 when it realised it had met the limits of Excel.
“I had a dream of a data model and a way you could link stuff. We started building that,” he said. We have technology platform with a new data model at the core. You can collect all the data together and view it from any angle and
Murray Callander

June - July 2017 - digital energy journal 19
Operations
then do work. It can include live and static data linked together. “
It avoids the need for people to build their own spreadsheets, which then get e-mailed around, so you have massively duplicated fragmented information. 1 physical pump can be repre-sented in thousands of different digital files. “We want one physical version, 1 digital ver-sion,” he said.
Interesting trends
Interesting technology trends happening at the moment are additive manufacturing, cyber physical, AI and digitisation, he said.
Additive manufacturing, or 3D printing, might transform oil and gas logistics, if a certain part can be manufactured offshore rather than wait for a delivery. “Rather than transfer the thing you transfer information about the thing. All you need to transfer is some powder to the lo-cation,” he said. Companies including GE and
Weir Pumps are already printing components of jet engines and pumps.
It is also enabling more people to get involved in product design, including some interesting competitions. For example, GE ran a competi-tion to see if someone could design an aviation engine mounting block which was lighter than the 2kg one it is currently using, basically made by drilling holes in a block of iron. The com-pany calculated that the fuel costs of flying it around the world are £400,000 a year.
The winner of the competition designed a mounting block which had the same or better strength but 84 per cent less weight.
This can be seen as the “we don’t know best – anyone got better ideas?” approach winning over traditional command and control, he said.
Another big trend is ‘cyber physical’, with much more sensors, leading to better decision making, and shorter gaps between the sensing and the doing.
Another trend is Artificial Intelligence. This has been in discussion since 1920, and is slowly be-coming a reality.
There is no need to be concerned about AI taking jobs away – a humorous example is the story of Microsoft’s “Tay” automated Twit-ter bot, which was programmed by people to speak obscene nonsense. This could be seen as an illustration of the limits of AI, Mr Callander said.
However AI may be able to perform better than humans in many areas, for example work-ing out that a learning made in one part of the company’s operations could be applicable in another.
A fourth trend is digitisation, which could be described as having “information about a thing” separate to the thing itself.
You can download a video and slides of the talk at www.d-e-j.com/video/1858.aspx
R-CADE - a real time drilling data packageThe R-CADE Consortium brings together a small group of companies in Norway and the UK to provide a complete ‘real time drilling data package’ - covering everything from sensors to decision makingThe R-CADE Consortium is a group of com-panies in the UK and Norway, which together aims to provide a complete Real Time Drilling Data package (for drilling), covering all of the steps between sensors and decision making. So it aims to provide a service which encom-passes people, process and technology - not just the technology.
R-CADE stands for “real time collaboration, application and data environment”.
In particular, R-CADE wants to tackle the enormous amounts of non-productive time in drilling - it is estimated that a drilling rig is (on average) only drilling half the time it is in operations.
One of the companies involved is eDrilling, a provider of drilling simulation technology based in Sandnes, Norway. The company has developed a ‘virtual wellbore’ system, which can provide a visualisation of a well. It can be used for planning wells, understanding dynamic well behaviour, training, simulating real time data (so you can see better what is actually happening), understanding the forma-tion around the well, downhole visualisation, and managing bottom hole pressure.
In oil companies, staff are usually in agree-ment on the ultimate goals - to work safer, faster and cheaper, says Morten Svendsen. Product Manager with eDrilling. And one of the best ways to achieve that is for staff to make the right decisions at the right time.
Software like this can help support decision making, and help people develop their com-petency.
Some people are searching for an ultimate goal of an “autonomous system to do every-thing for you,” but until that is invented, there will be a big need for people to do the jobs, he said.
And all of the decisions are made using data, so the data needs to be high quality.
Ultimately, it is not possible to replace com-petent people - and the digital tools serve to support the competent people who are already there, and help them to be more productive, he said. “We need to learn that technology is the enabler and not the end game - that’s what we are talking about all the time.”
It is important to look at technology as an enabler, not an end in itself, said Murray Callander of Eigen, a “smart technology” company also involved in the consortium.
“People think they can buy something and suddenly [the problem] is fixed,” Mr Cal-lander said. “That’s not going to be the case. There’s a lot which needs to be done.”
“We might have identified something that could be extremely beneficial, but there’s a long road to getting it adopted, and it also needs organisational change.”
Companies may also have a procurement strategy which inhibits the implementation of digital technology, Mr Callander said. For example if it strongly pushes buyers to reduce costs, or avoid adopting technology which is not fully proven.
If companies would never buy something which hasn’t been built yet, then they would never have contracted Leonardo da Vinci to paint the Mona Lisa, he said.

digital energy journal - June - July 2017 20
Operations
Get the most from your investments in people and data. Timely, trusted, granular and integrated data on an open platform transforms the way oil and gas operators manage their resources.
What would you do if you knew?™
Discover more oil & gas industry solutions
Explore – More of Your Data. Drill – Deeper Into Your Data. Produce – Value From Your Data
teradata.com/oilandgas