mab quantitation: protein a hplc vs. protein a bio-layer ... · mab purification 3 mab process...
TRANSCRIPT
This presentation is the confidential and copyright work product of Pall Corporation, and no portion of this presentation may be copied, published, performed, or redistributed without the express written authority of a Pall corporate officer.© 2013 Pall Corporation
Better Lives. Better Planet.SM
MAb Quantitation: Protein A HPLC vs. Protein A Bio-layer Interferometry
Alexander MartinoMark SchofieldRene Gantier
March 27 2014
2
Agenda
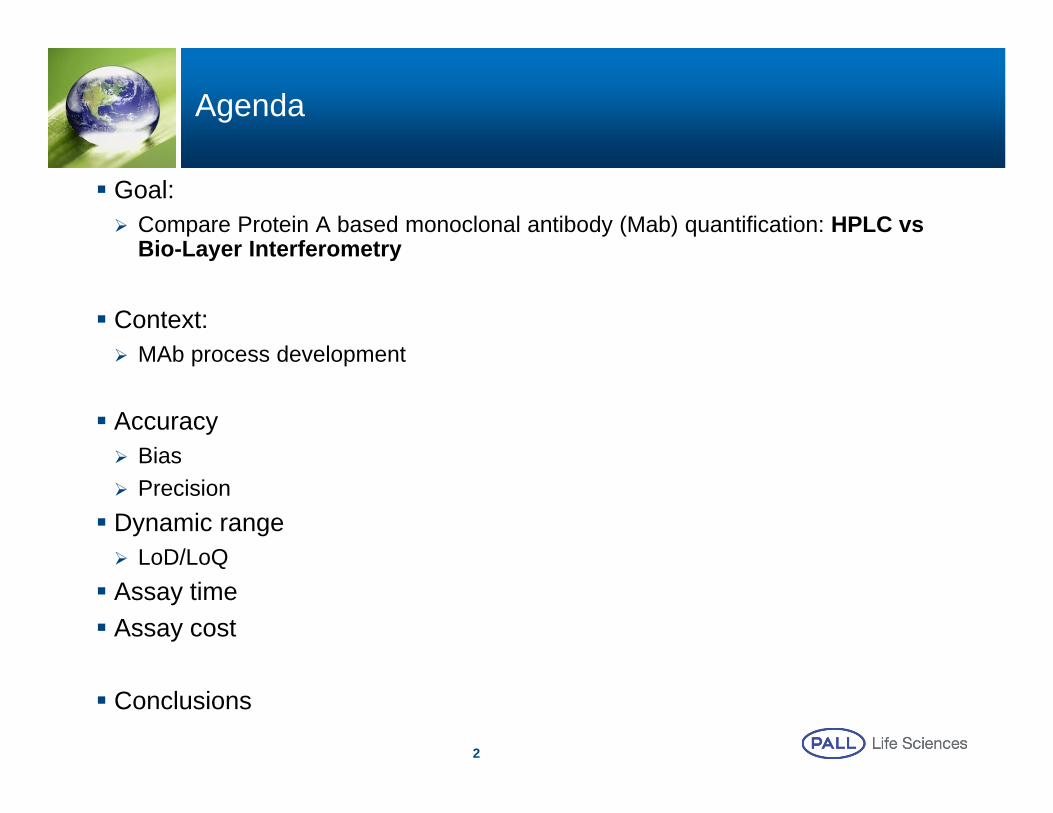
Goal: Compare Protein A based monoclonal antibody (Mab) quantification: HPLC vs
Bio-Layer Interferometry
Context: MAb process development
Accuracy Bias Precision Dynamic range LoD/LoQ Assay time Assay cost
Conclusions
MAb purification
3
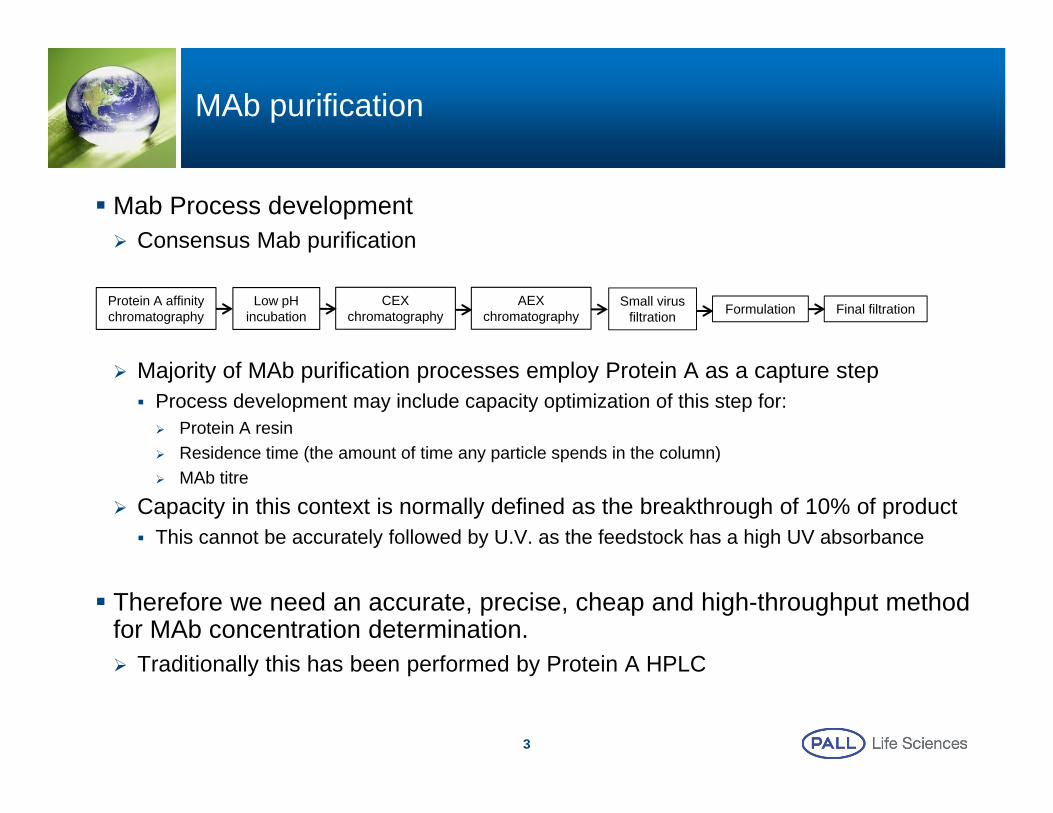
Mab Process development Consensus Mab purification
Majority of MAb purification processes employ Protein A as a capture step Process development may include capacity optimization of this step for: Protein A resin Residence time (the amount of time any particle spends in the column) MAb titre
Capacity in this context is normally defined as the breakthrough of 10% of product This cannot be accurately followed by U.V. as the feedstock has a high UV absorbance
Therefore we need an accurate, precise, cheap and high-throughput method for MAb concentration determination. Traditionally this has been performed by Protein A HPLC
Protein A affinity chromatography
Low pHincubation
CEXchromatography
AEX chromatography
Small virusfiltration Formulation Final filtration
4
Data quality
Data quality
5
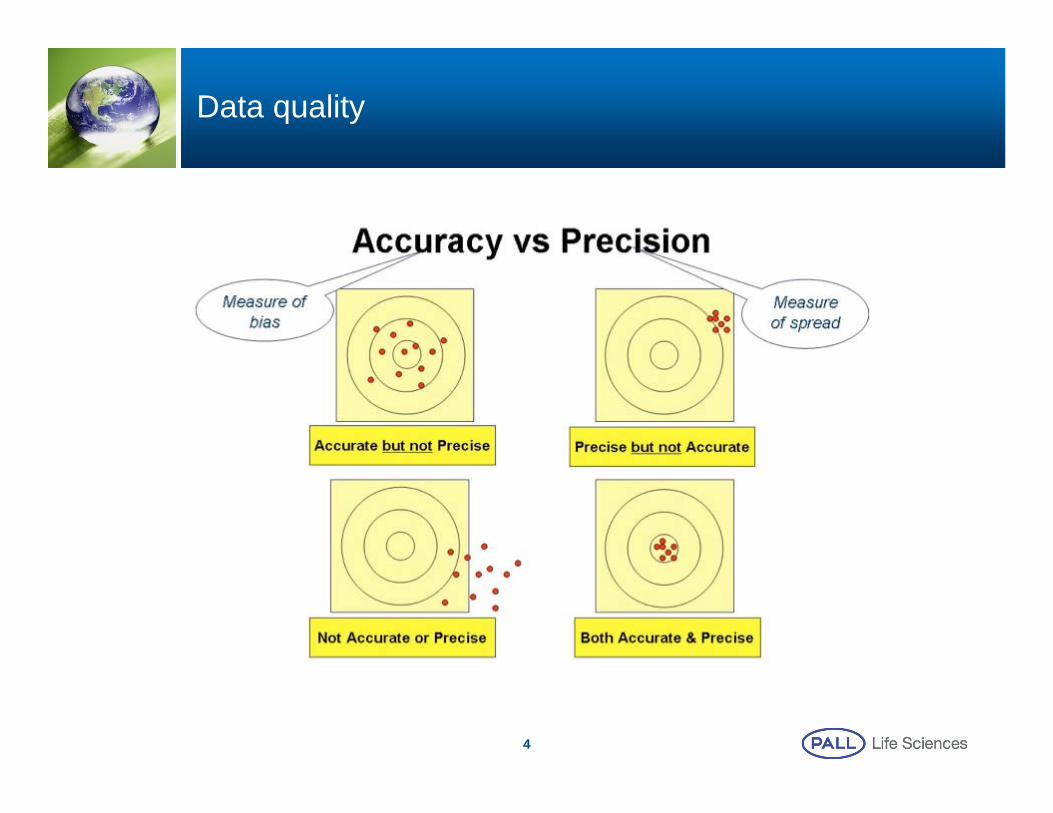
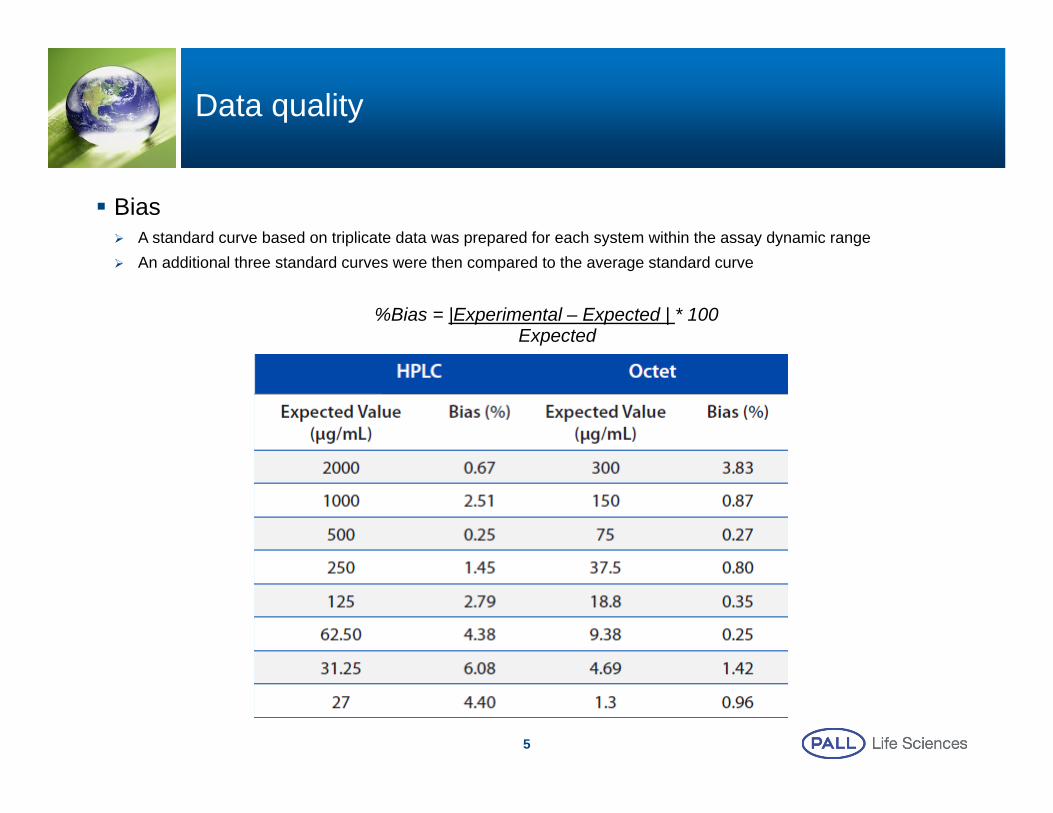
Bias A standard curve based on triplicate data was prepared for each system within the assay dynamic range An additional three standard curves were then compared to the average standard curve
%Bias = |Experimental – Expected | * 100Expected
Data quality
6
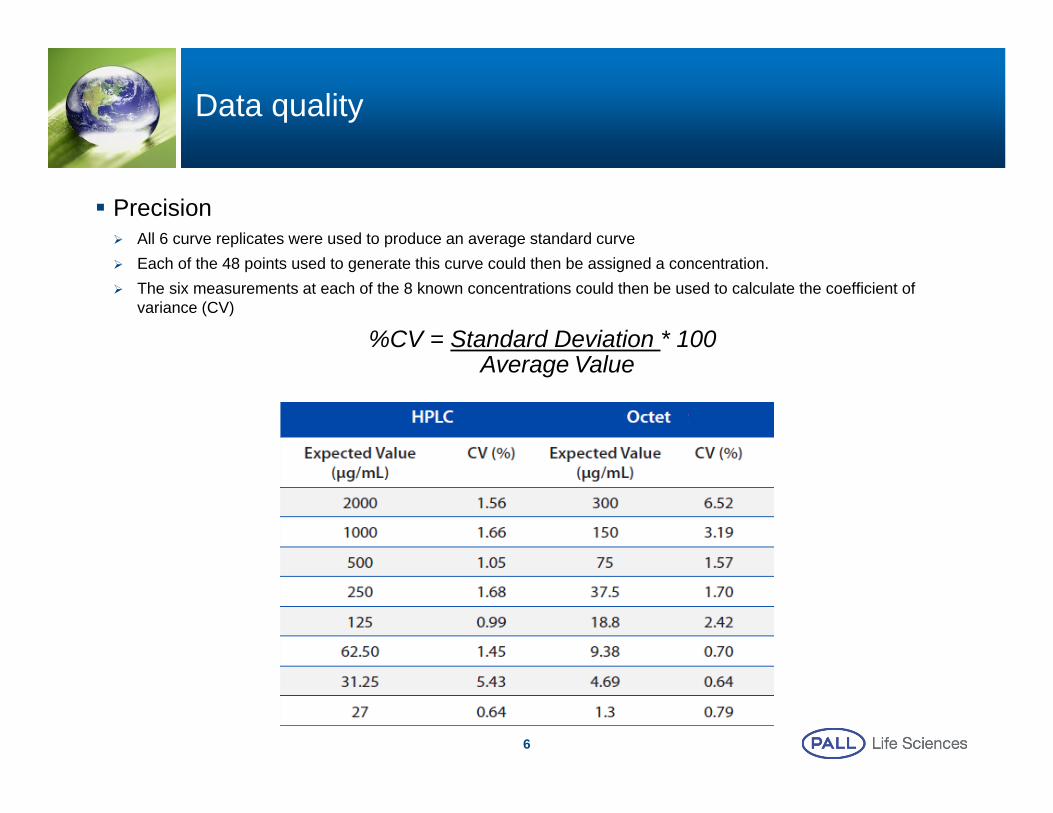
Precision All 6 curve replicates were used to produce an average standard curve Each of the 48 points used to generate this curve could then be assigned a concentration. The six measurements at each of the 8 known concentrations could then be used to calculate the coefficient of
variance (CV)
%CV = Standard Deviation * 100Average Value
LoQ and LoD
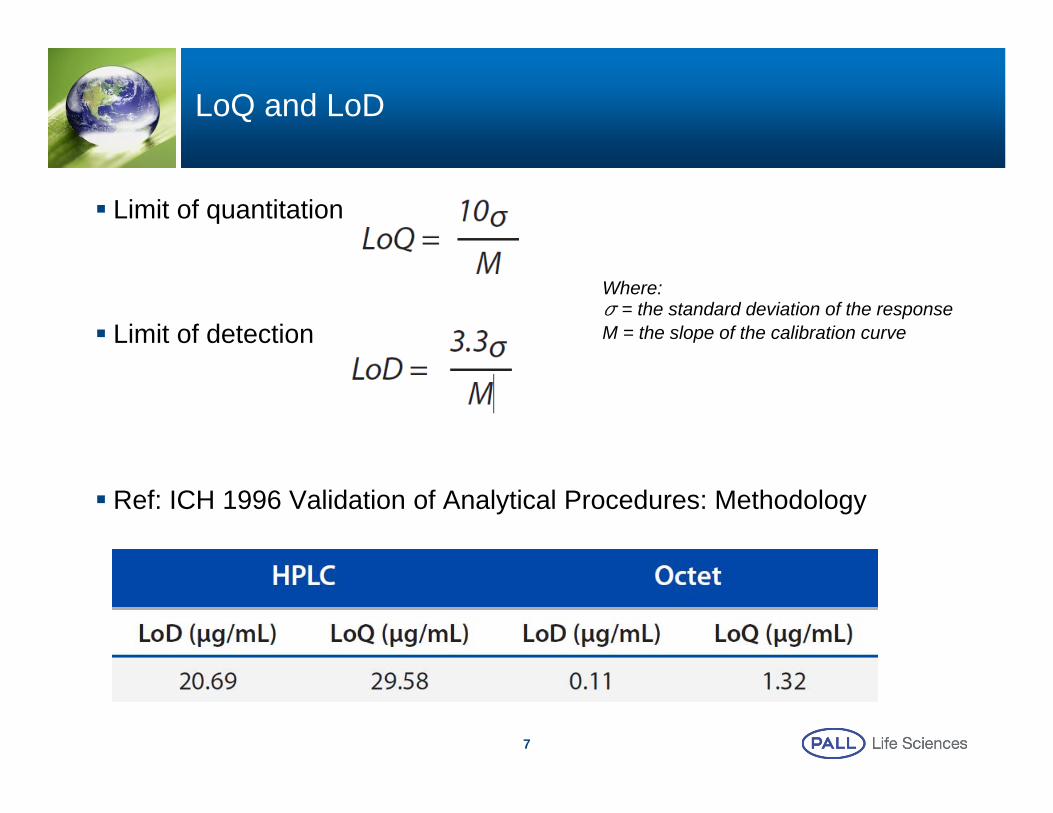
Limit of quantitation
Limit of detection
Ref: ICH 1996 Validation of Analytical Procedures: Methodology
7
Where:s = the standard deviation of the responseM = the slope of the calibration curve
Verifying theoretical LoD and LoQ
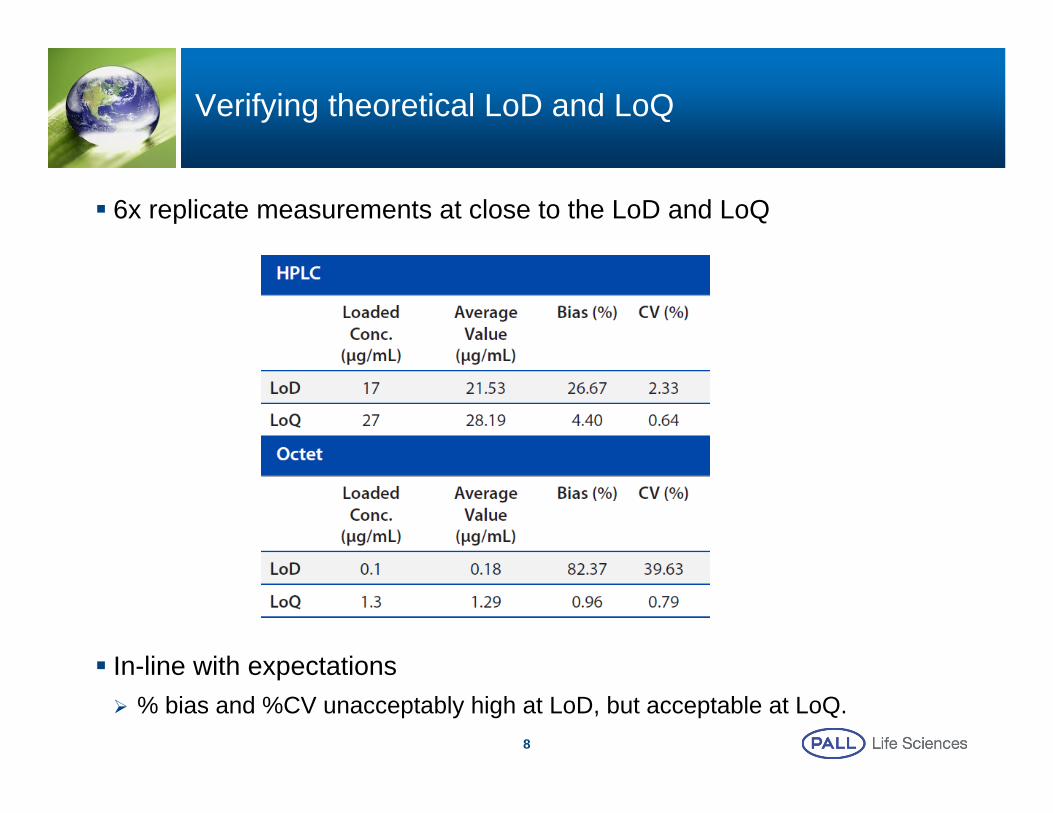
6x replicate measurements at close to the LoD and LoQ
In-line with expectations % bias and %CV unacceptably high at LoD, but acceptable at LoQ.
8
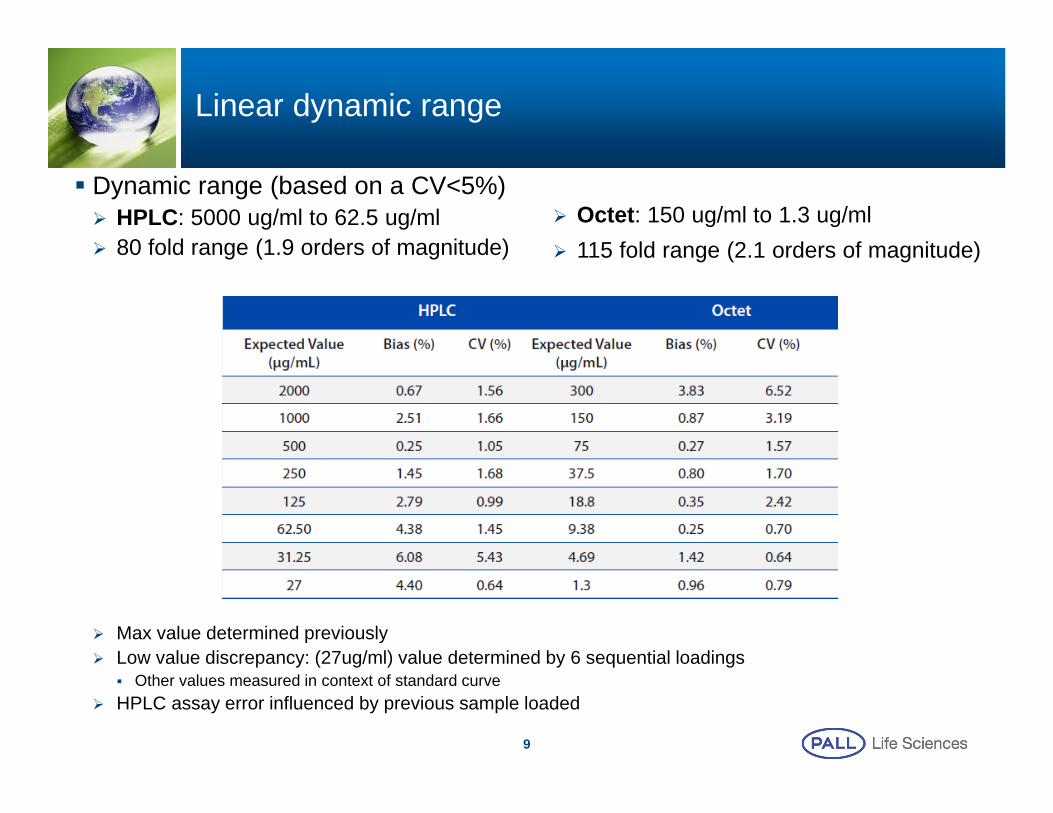
Linear dynamic range
Dynamic range (based on a CV<5%) HPLC: 5000 ug/ml to 62.5 ug/ml 80 fold range (1.9 orders of magnitude)
Max value determined previously Low value discrepancy: (27ug/ml) value determined by 6 sequential loadings
Other values measured in context of standard curve HPLC assay error influenced by previous sample loaded
9
Octet: 150 ug/ml to 1.3 ug/ml 115 fold range (2.1 orders of magnitude)
Summary of accuracy and precision
HPLC and Octet Have similar dynamic ranges 1.9 vs 2.1 orders of magnitude
Have similar % bias and %CV over the range of the assay measured Bias HPLC 0.3-4.4% Bias Octet 0.3-3.3% CV HPLC 1-1.7% CV Octet 0.7-3.2%
10
Experiment details
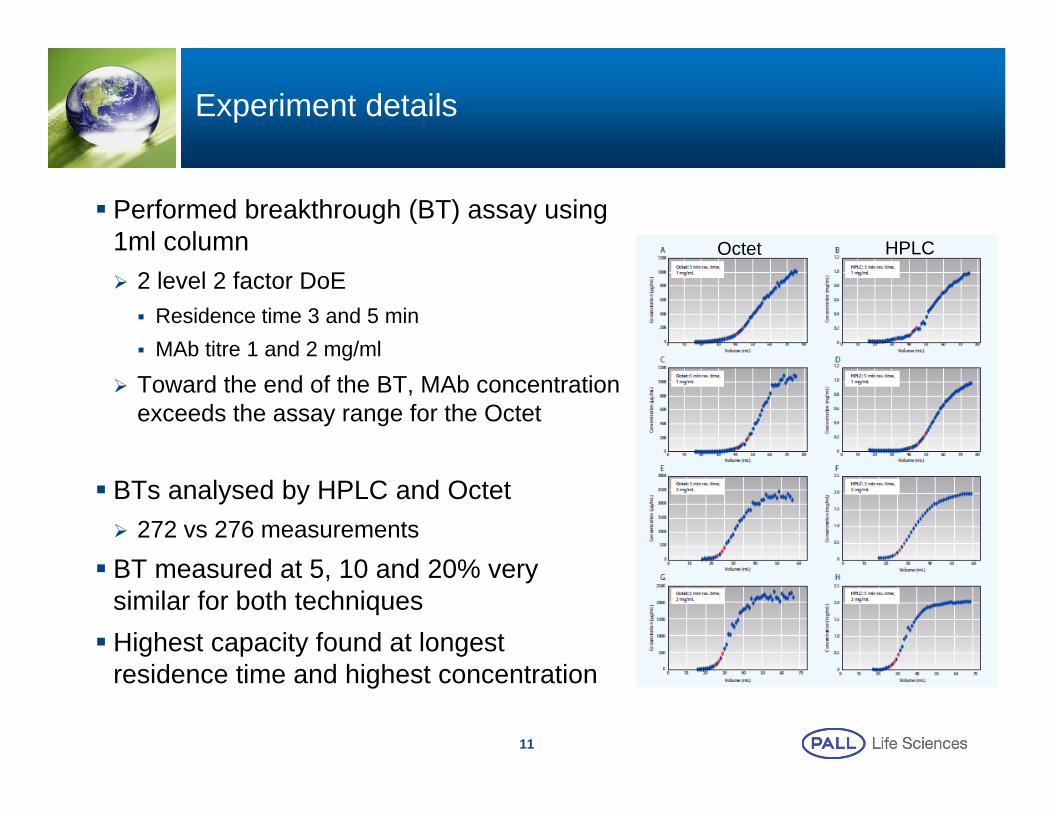
Performed breakthrough (BT) assay using 1ml column 2 level 2 factor DoE Residence time 3 and 5 min MAb titre 1 and 2 mg/ml
Toward the end of the BT, MAb concentration exceeds the assay range for the Octet
BTs analysed by HPLC and Octet 272 vs 276 measurements
BT measured at 5, 10 and 20% very similar for both techniques Highest capacity found at longest
residence time and highest concentration
11
Octet HPLC
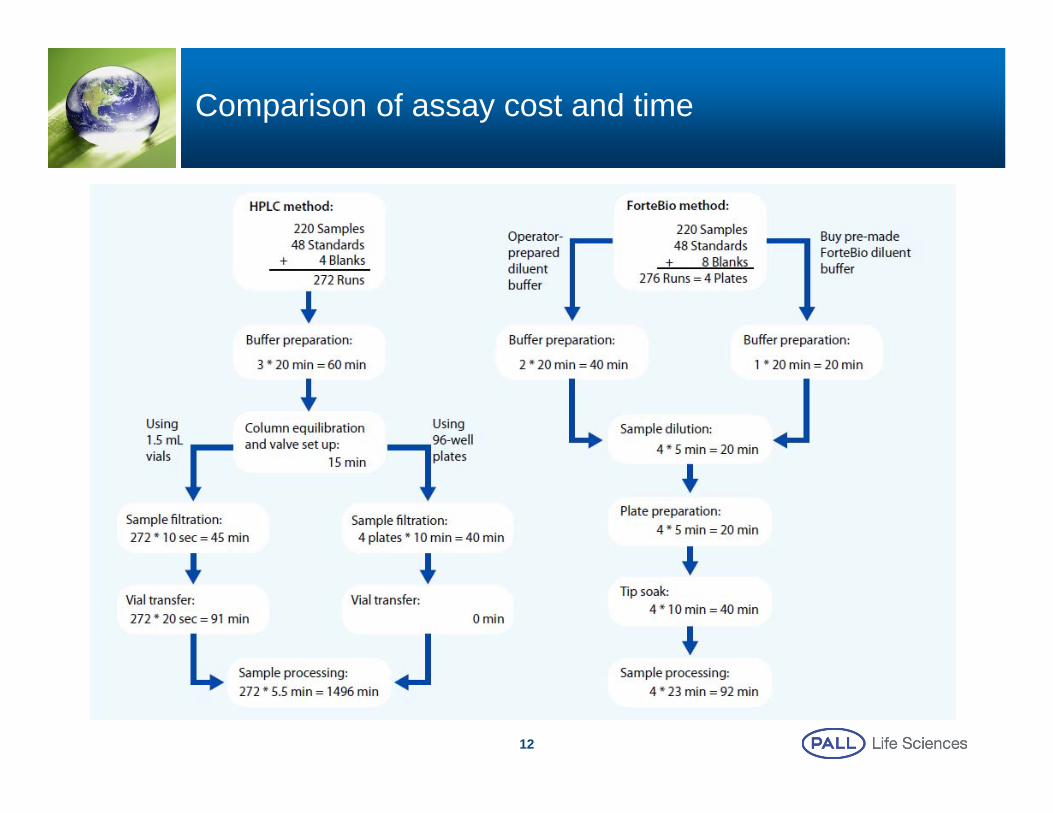
Comparison of assay cost and time
12
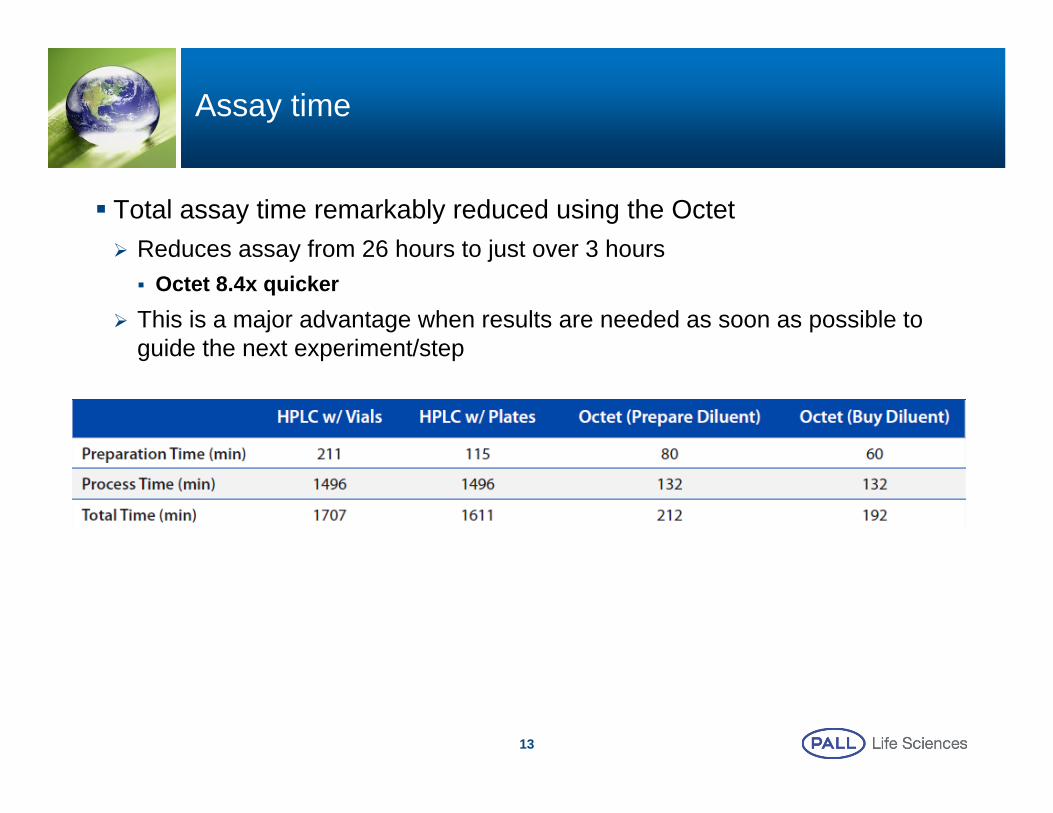
Assay time
Total assay time remarkably reduced using the Octet Reduces assay from 26 hours to just over 3 hours Octet 8.4x quicker
This is a major advantage when results are needed as soon as possible to guide the next experiment/step
13
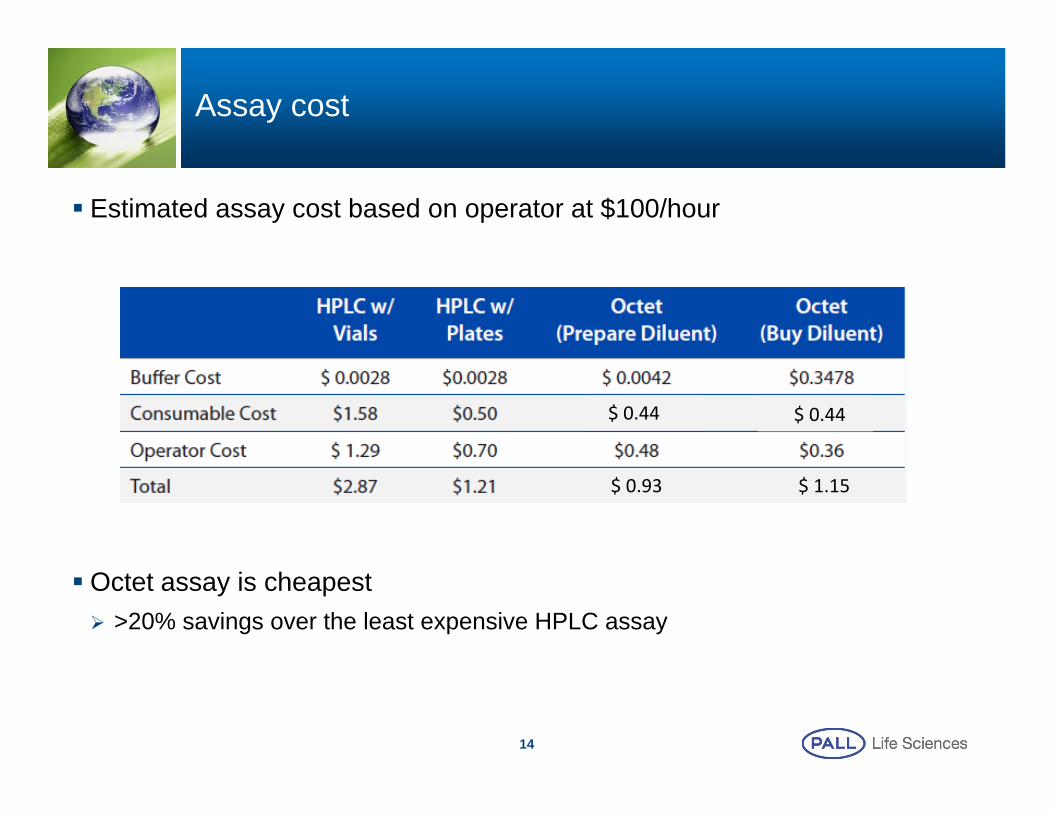
Assay cost
Estimated assay cost based on operator at $100/hour
Octet assay is cheapest >20% savings over the least expensive HPLC assay
14
$ 0.44 $ 0.44
$ 0.93 $ 1.15
Conclusions
Forte Bio Octet provides a fast, accurate, cost effective and high-throughput method for Mab quantification
Octet can compete with HPLC in all metrics Assays are >20% cheaper Assays can be performed considerably quicker with the Octet Each HPLC run takes 5.5 minutes Octet can read a whole plate in 23 minutes
15