macroeconomic consequences of the demographic...
TRANSCRIPT

Data from
Some Macroeconomic Consequences of the
Demographic TransitionRonald LeeUC BerkeleyJuly 9, 2008
Talk prepared for Rand Summer InstituteResearch supported by NIA R37 AG025247
Thanks to Andy mason and NTA country teams

Data from
Main points
1. Demographic transition first raises support ratio, then with population aging reduces it.
2. Per capita consumption is proportionate to Support ratios, other things equal. “First dividend”, pop aging.
3. Longer life, lower fertility, slower pop growth and older population all raise capital/labor ratio, raising labor productivity. “Second dividend”.
4. This depends on importance of assets vs transfers.
5. Lower fertility goes with greater investment in human capital per child, raising labor productivity.

Data from
Latin American NTA team leaders
• Brazil: Cassio M. Turra and Bernardo Lanza Queiroz
• Chile: Dirk Jaspers and Jorge Bravo; (Tim Miller, Mauricio Holz)
• Uruguay: Marisa Bucheli• Mexico: Iván Mejía Guevara
and Juan Enrique García• Cost Rica: Luis Rosero Bixby

Data from
I. The Demographic Transition
• A classic illustration: The transition in India, 1890-2100.
• Mixture of historical estimates, UN projections, and simulation based on fitted variations with time.

Data from

Data from
Pre fertility decline; child dependency ratio rises
During fertility decline, child dependency ratio declines
Population aging: old age depratio rises

Data from
The total dep ratio rises, falls, then rises again, ending up where it started.The changes in the total dependency ratio are transitory.

Data from
But there is a big permanentchange: At start, many children and few elderly.At end, few children and Many elderly.

Data from
Comments on simulation
• Assumed TFR stabilized at 2.1; but often has declined below replacement.
• Assumed e0 stopped rising at 80, but many countries already above this.
• Some countries experienced important baby booms and busts which distort this classic shape.
• Many countries now have declining populations and declining working age pops.

Data from
II. The economic life cycle:
• Age profiles of consumption and labor income
• Use estimates from the National Transfer Accounts project, or NTA.
• Consumption patterns are quite similar for Third World countries in Asia and Latin America.
• Consumption in Industrial populations looks different.

Data from An-Chi Tung
A Typical Asian Economic Lifecycle: National Transfer Accounts estimates for Taiwan, 1998
0
100
200
300
400
500
600
0 20 40 60 80
Age
Per C
apita
Con
sum
ptio
n an
d La
borI
ncom
e
Consumption
Labor Income
Includes both private expends and in-kind public transfers (health, education, long term care)
Includes self employment, wages,unpaid family labor, & fringe benefits.
Averages 0’s and both male and female.

Data from An-Chi Tung
A Typical Asian Economic Lifecycle: National Transfer Accounts estimates for Taiwan, 1998
0
100
200
300
400
500
600
0 20 40 60 80
Age
Per C
apita
Con
sum
ptio
n an
d La
borI
ncom
e
Consumption
Labor Income
Flat cons age profile in adult years reflects extended family sharing.
Quite different than most industrial nations.

Data from An-Chi Tung
A Typical Asian Economic Lifecycle: National Transfer Accounts estimates for Taiwan, 1998
0
100
200
300
400
500
600
0 20 40 60 80
Age
Per C
apita
Con
sum
ptio
n an
d La
borI
ncom
e
Consumption
Labor Income
Large deficits at young and old ages.

Data from An-Chi Tung
A Typical Asian Economic Lifecycle: National Transfer Accounts estimates for Taiwan, 1998
0
100
200
300
400
500
600
0 20 40 60 80
Age
Per C
apita
Con
sum
ptio
n an
d La
bor
Inco
me Consumption
Labor Income
Reallocations from surplus to deficitages required.

Data from An-Chi Tung
A Typical Asian Economic Lifecycle: National Transfer Accounts estimates for Taiwan, 1998
0
100
200
300
400
500
600
0 20 40 60 80
Age
Per C
apita
Con
sum
ptio
n an
d La
bor
Inco
me Consumption
Labor Income
Other income comes from assets, foreign loans, and remittances from abroad—it’s not all labor income.

Data from An-Chi Tung
A Typical Asian Economic Lifecycle: National Transfer Accounts estimates for Taiwan, 1998
0
100
200
300
400
500
600
0 20 40 60 80
Age
Per C
apita
Con
sum
ptio
n an
d La
borI
ncom
e
Consumption
Labor IncomeAsset income is partic
Impt for old age

Data from
Age Profiles of Labor Income and Consumption: averaged for Four Rich and Four Poor Countries (Relative to average labor income)
0
0.2
0.4
0.6
0.8
1
1.2
1.4
1 4 7 10 13 16 19 22 25 28 31 34 37 40 43 46 49 52 55 58 61 64 67 70 73 76 79 82 85 88 91
Age (+1)
Rat
ioto
avyl
(30-
49)
Rich: US, Japan, Sweden, FinlandPoor: India, Indonesia, Philippines, Kenya
Rich
poor
National Transfer Accounts data

Data from
Components of US Consumption, 2003
Public Other
Private Other
Private DurablesPrivate Health
Private Edu
Public Edu
Public Health
0
20000
40000
0 10 20 30 40 50 60 70 80 90
Age
Dol
lars
(US,
2000
)
Later I will measure HK investmentAs sum of pub and priv spendingon hlth and educ as shown here.
Unlike Taiwan and other Third World, in US cons rises strongly with age. True in other industrial too.
Many policy possibilities to change the age profiles
• Change the age profile of labor income– Later retirement– Earlier entry into labor force– Higher female labor force participation– Reform seniority system
• Change the age profile of consumption– In many industrial nations, the elderly
consume much more than younger adults.
– Makes population aging more costly– Role of public transfer policy:
pensions, health care, long term care• Change the demographic trends:
immig, fert

• Levels of age profiles change fast with economic development.
• Shapes of age profiles change slowly,
• Are broadly similar across countries at very different levels of development.

III. Dependency and Support
• Concern about pop aging is mostly about old age dependency.
• Sharpest concerns for age-sensitive public sector programs– pensions– health care– Long term care
• But should place these in broader context– Full range of public programs– Private consumption
• Use shape of estimated profile I just showed.

Support Ratios
• Effective labor is weighted sum of pop using labor income age profile.
• Effective consumers is similar.• Ratio of effective labor to effective
consumers is the “Support Ratio”.• Other things equal, consumption
per effective consumer is proportional to the support ratio.
0
0
Effective WorkersatioEffective Consumers
Po
Po
ω
ω= = ∑∑

Support Ratio for China, 1950-2100, Based on UN population projections and average LDC age profiles from NTA
0.5
0.6
0.7
0.8
0.9
1
1950 1970 1990 2010 2030 2050 2070 2090
Year
Effe
ctiv
ePr
oduc
ers
PerC
onsu
mer
200
Population aging
First Dividend
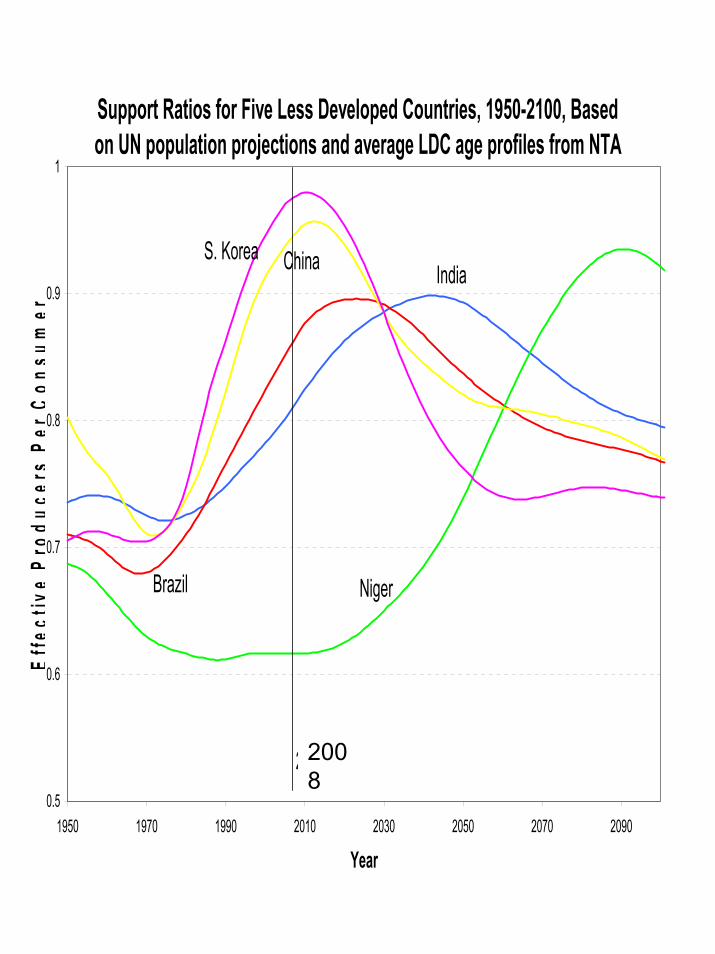
Support Ratios for Five Less Developed Countries, 1950-2100, Based on UN population projections and average LDC age profiles from NTA
India
Brazil Niger
ChinaS. Korea
0.5
0.6
0.7
0.8
0.9
1
1950 1970 1990 2010 2030 2050 2070 2090
Year
Effe
ctiv
ePr
oduc
ers
PerC
onsu
mer
2002008

Support Ratios for Five Less Developed Countries, 1950-2100, Based on UN population projections and average LDC age profiles from NTA
India
Brazil Niger
ChinaS. Korea
0.5
0.6
0.7
0.8
0.9
1
1950 1970 1990 2010 2030 2050 2070 2090
Year
Effe
ctiv
ePr
oduc
ers
PerC
onsu
mer
200
Niger S. Korea China India Brazil2050/08 1.20 0.78 0.86 1.09 0.96
Rate %/yr 0.43 -0.59 -0.35 0.22 -0.09
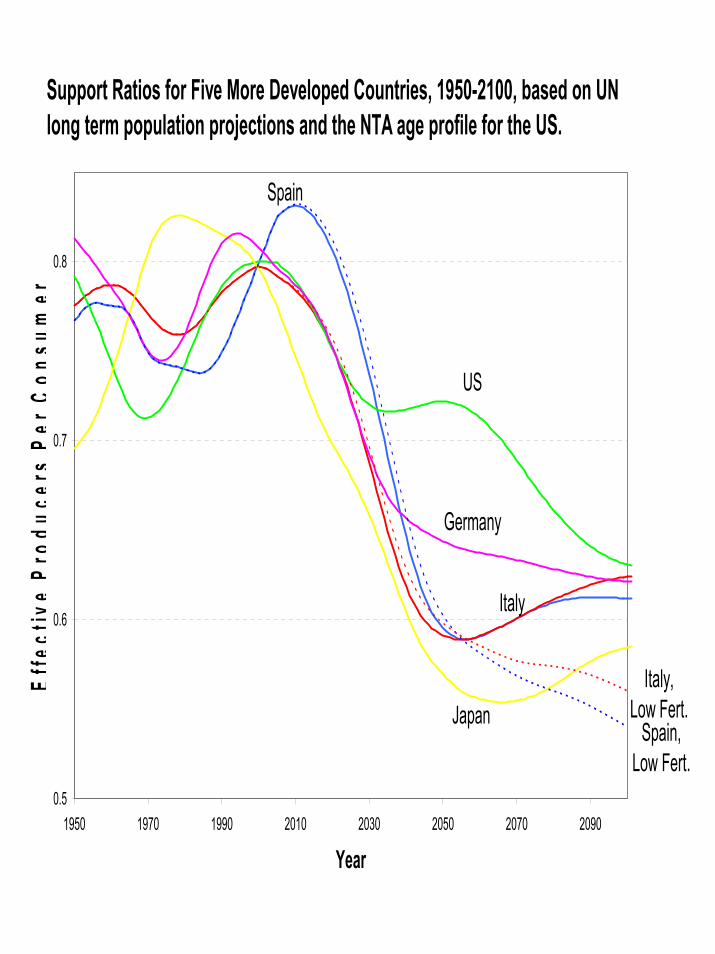
Spain
Italy
US
Japan
Germany
Spain, Low Fert.
Italy, Low Fert.
0.5
0.6
0.7
0.8
1950 1970 1990 2010 2030 2050 2070 2090
Year
Effe
ctiv
ePr
oduc
ers
PerC
onsu
mer
Support Ratios for Five More Developed Countries, 1950-2100, based on UN long term population projections and the NTA age profile for the US.
US Spain Italy Japan Germany2050/08 0.91 0.72 0.75 0.75 0.81
Rate %/yr -0.2 -0.8 -0.7 -0.7 -0.5

IV. Further on InterageFlows of Income
• Comparison of Japan and Indonesia

Data from Maliki (Indonesia) and H.
Ogawa (Japan)
Per capita consumption and labor income by age for
Indonesia and Japan
-200,000400,000600,000800,000
1,000,000
0 20 40 60 80 100
Age
Per c
apita
co
nsum
ptio
n or
labo
r in
com
e
-
100,000
200,000
300,000
400,000
500,000
0 20 40 60 80 100
Age
Per c
apita
con
sum
ptio
n or
labo
rinc
ome
inYe
n
Indonesia, 2002
Japan, 2004
• Differences in consumption– Education in
Japan– Rising
consumption in old age in Japan
Data from Maliki (Indonesia) and H.
Ogawa (Japan)
Here are the aggregate flows: population by age times per
capita age profiles
Aggregate Life Cycle Deficit for Indonesia (2005) in Rupiah
(30,000)
(20,000)
(10,000)
-
10,000
20,000
30,000
40,000
0 20 40 60 80 100
Age
Agg
rega
ted
Con
sum
ptio
n -
Labo
r Inc
ome
Aggregate Life Cycle Deficit for Japan (2004) in Yen
(5,000)
(4,000)
(3,000)
(2,000)
(1,000)
-
1,000
2,000
3,000
4,000
5,000
0 20 40 60 80 100
Age
Agg
rega
ted
Con
sum
ptio
n - L
abor
In
com
e

Data from Maliki (Indonesia) and H.
Ogawa (Japan)
Aggregate flows
Aggregate Life Cycle Deficit for Indonesia (2005) in Rupiah
(30,000)
(20,000)
(10,000)
-
10,000
20,000
30,000
40,000
0 20 40 60 80 100
Age
Agg
rega
ted
Con
sum
ptio
n -
Labo
r Inc
ome
Aggregate Life Cycle Deficit for Japan (2004) in Yen
(5,000)
(4,000)
(3,000)
(2,000)
(1,000)
-
1,000
2,000
3,000
4,000
5,000
0 20 40 60 80 100
Age
Agg
rega
ted
Con
sum
ptio
n - L
abor
In
com
e
• Green arrows show transfers from surplus of prime working years.
• Red arrows show asset income consumed by elderly out of earlier savings.

Data from Maliki (Indonesia) and H.
Ogawa (Japan)
Aggregate flows
Aggregate Life Cycle Deficit for Indonesia (2005) in Rupiah
(30,000)
(20,000)
(10,000)
-
10,000
20,000
30,000
40,000
0 20 40 60 80 100
Age
Agg
rega
ted
Con
sum
ptio
n -
Labo
r Inc
ome
Aggregate Life Cycle Deficit for Japan (2004) in Yen
(5,000)
(4,000)
(3,000)
(2,000)
(1,000)
-
1,000
2,000
3,000
4,000
5,000
0 20 40 60 80 100
Age
Agg
rega
ted
Con
sum
ptio
n - L
abor
In
com
e
• Suppose the same proportion of old age consumption is funded by assets.
• Then assets per capita will be much higher in Japan
• If held in domestic investment, then capital labor ratio will be higher too.

Data from Maliki (Indonesia) and H.
Ogawa (Japan)
-200,000400,000600,000800,000
1,000,000
0 20 40 60 80 100
Age
Per c
apita
co
nsum
ptio
n or
labo
r in
com
e
-
100,000
200,000
300,000
400,000
500,000
0 20 40 60 80 100
Age
Per c
apita
con
sum
ptio
n or
labo
rinc
ome
inYe
n
Indonesia, 2002
Japan, 2004
• In Indonesia, average unit of income is earned at 39 and consumed at 30
• Travels 9 years down the age scale.
• In Japan, it is earned and consumed at nearly the same age.
Ac=30 Ayl=39
Ac=45 Ayl=45
( ) ( )( ) ( )
100
0100
0
c
xPop x c xA
Pop x c x= ∑∑
Population weighted average age

Data from NTA Country Teams
Average Consumption-Earning Gap by Average Age of Population
Austria, 2000
Chile, 1997
Costa Rica, 2004
France, 2001
India, 1999Indonesia, 1999
Japan, 2004
Philippines, 1999
US, 2003Uruguay, 1994
Sweden, 2003
Thailand, 2004
Slovenia, 2004
Taiwan, 2003S. Korea, 2000
-12
-10
-8
-6
-4
-2
0
2
4
20 25 30 35 40 45Ave Age of Population
Av
Age
Gap 13
yrs

Data from NTA Country Teams
How much of the difference in age gaps is due to the shapes of the
age profiles?

Data from NTA Country Teams
Average Age of Labor Income and Consumption
with Population Held Constant (stationary, e0=75)
S. Korea, 2000Taiwan, 2003
Slovenia, 2004
Thailand, 2004
Sweden, 2003
Uruguay, 1994
US, 2003Philippines, 1999Japan, 2004
Indonesia, 1999
India, 1999
France, 2001 Costa Rica, 2004
Chile, 1997
Austria, 2000
38
39
40
41
42
43
44
45
46
38 39 40 41 42 43 44 45
Average Age of Consumption
Ave
rage
Age
ofLa
borI
ncom
e
Ac = Ayl
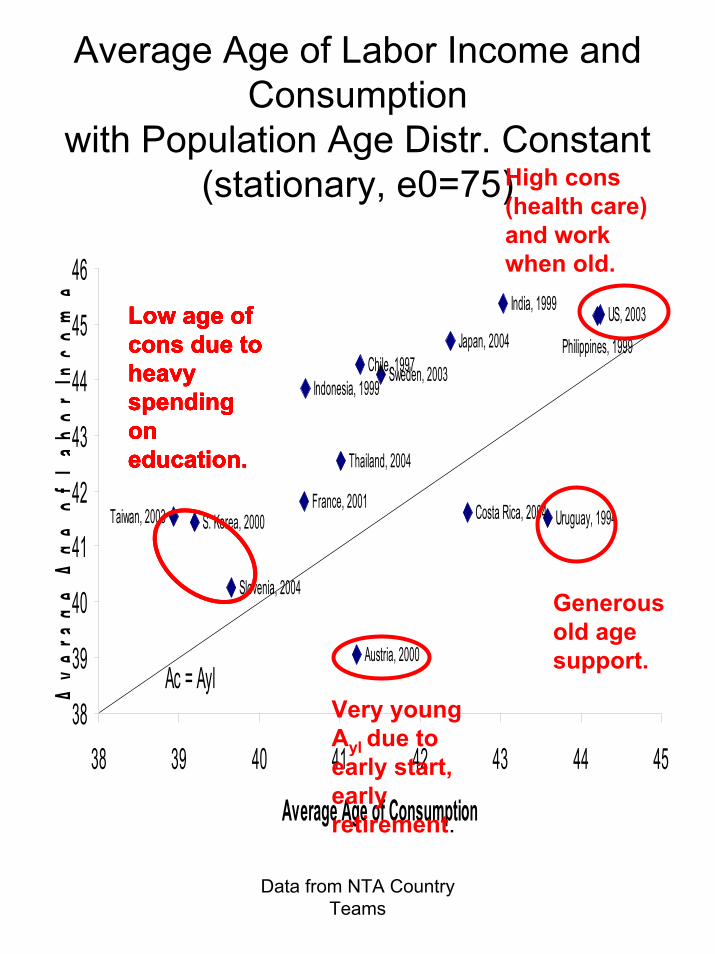
Data from NTA Country Teams
Average Age of Labor Income and Consumption
with Population Age Distr. Constant (stationary, e0=75)
S. Korea, 2000Taiwan, 2003
Slovenia, 2004
Thailand, 2004
Sweden, 2003
Uruguay, 1994
US, 2003Philippines, 1999Japan, 2004
Indonesia, 1999
India, 1999
France, 2001 Costa Rica, 2004
Chile, 1997
Austria, 2000
38
39
40
41
42
43
44
45
46
38 39 40 41 42 43 44 45
Average Age of Consumption
Ave
rage
Age
ofLa
borI
ncom
e
Ac = Ayl
Low age of cons due to heavy spending on education.
High cons (health care) and work when old.
Generous old age support.
Very young Ayl due to early start, early retirement.
Low age of cons due to heavy spending on education.
Low age of cons due to heavy spending on education.
Low age of cons due to heavy spending on education.
Low age of cons due to heavy spending on education.
Low age of cons due to heavy spending on education.

The demand for wealth rises over the
demographic transition.• Why?
– Older people hold more wealth; in old population, there are more of them.
• Also:– Longer life means workers need
to accumulate more wealth for longer old age.
– Lower fertility means adults consume more and need to save more to maintain in old age.

VI. The role of intergenerational transfers
• We just considered the wealth needed to achieve consumption targets.
• Wealth can be held in two forms: – Transfer wealth (expected future
transfers received minus expected future transfers made)
– Assets or Capital

NTA data on shares of old age support from different
sources• Asset income (land, equities,
interest, etc.)• Family transfers (not including
bequests at death)• Public transfers (Pay As You
Go pensions, health care, and long term care)
• Triangle graph shows shares, not levels, so must add to 100%.
• Bequests not included; just old age cons.

Diagram from Andy Mason
Old-age Reallocation System, Selected Countries.
50
75
100
75
75
50
50
25
25
0
0
25
0
set-based
Public transfers (%)
Family Transfers (%)
US
Thailand
Costa Rica
JapanTaiw an
Korea
Familial transfers equally important in Thailand, Korea, and Taiwan (36-40%).
Net familial transfers near zero in US, CR, and J. Large
public transfers in CR
and J
Net public transfers to elderly are zero in Thailand; about 25% in Taiwan and Korea.
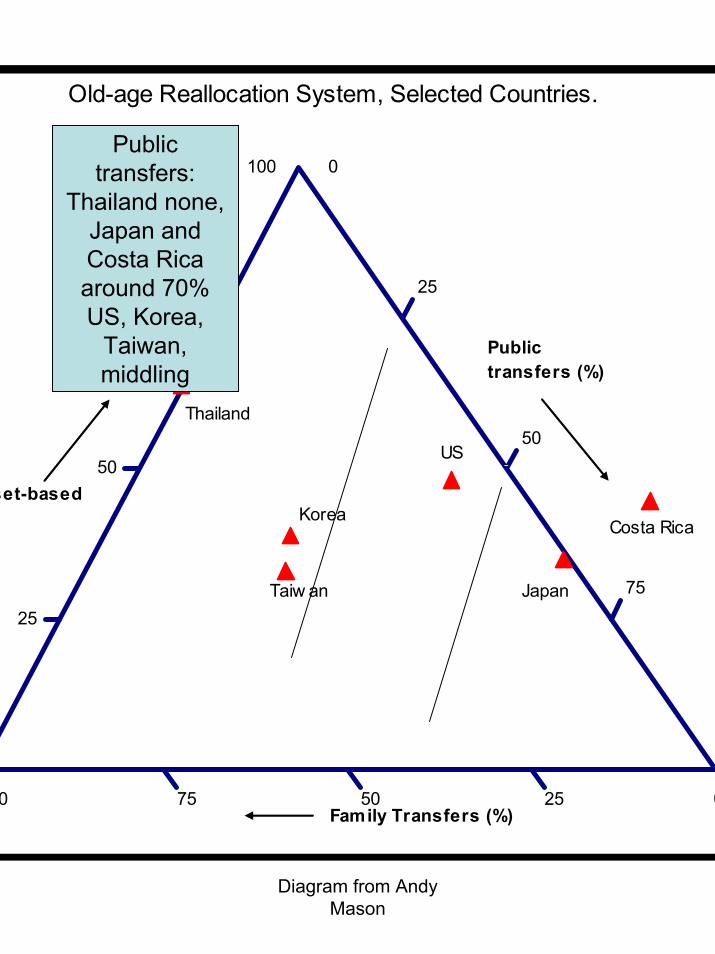
Diagram from Andy Mason
Old-age Reallocation System, Selected Countries.
50
75
100
75
75
50
50
25
25
0
0
25
0
set-based
Public transfers (%)
Family Transfers (%)
US
Thailand
Costa Rica
JapanTaiw an
Korea
Public transfers:
Thailand none, Japan and Costa Rica around 70%US, Korea,
Taiwan, middling

Diagram from Andy Mason
Old-age Reallocation System, Selected Countries.
50
75
100
75
75
50
50
25
25
0
0
25
0
set-based
Public transfers (%)
Family Transfers (%)
US
Thailand
Costa Rica
JapanTaiw an
Korea
Reliance on assets : Japan,
Taiwan, C.R. are low;
Thailand high; US middling

VII. Demographic Transition and Capital
Accumulation• Changing dependency gets
most attention for ec dev and pop aging.
• Changes in capital accumulation may be more important.

Calculating the demand for wealth and capital over the
demographic transition• Based on different theoretical
models, approaches.• Model with Social Planner
maximizing discounted social welfare function with full foresight.
• Model with individuals saving and consuming over their life cycles to maximize their life time utility.

Here take a different approach – no optimization--
emphasizes institutional setting
• Assume – share of old age consumption
supported by asset income stays constant over time.
– altruistic sharing maintains the shape of the cross sectional consumption age profile.
– Demography is known in advance.
• Can solve recursively for unique growth path and asset holdings.

Two scenarios: high level of transfers to elderly (65%); or
low level (35%)• Other assumptions
– Productivity growth raises income age profile by 2% per year.
– Open economy; rate of return on assets is 3%.
• Aggregate saving is calculated to maintain asset share of old age consumption support.
• Results will be shown relative to a 2% growth trajectory from prod gr.
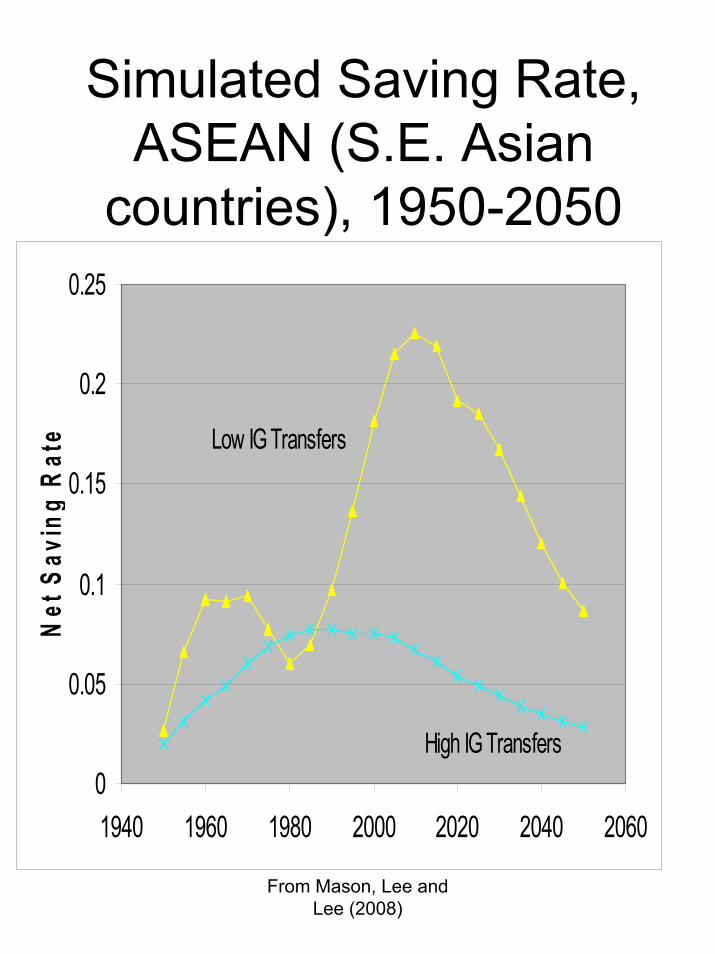
From Mason, Lee and Lee (2008)
0
0.05
0.1
0.15
0.2
0.25
1940 1960 1980 2000 2020 2040 2060
Net
Sav
ing
Rat
e
High IG Transfers
Low IG Transfers
Simulated Saving Rate, ASEAN (S.E. Asian
countries), 1950-2050

From Mason, Lee and Lee (2008)
Simulated Assets/Labor Income, ASEAN
0
2
4
6
8
1940 1960 1980 2000 2020 2040 2060
Ass
ets/
Labo
rInc
ome
Low IG Transfers
High IG Transfers
Ratio of assets to labor income rises greatly in any case, but 3 or 4 times as much with low IG transfers.

From Mason, Lee and Lee (2008)
Simulated Consumption, ASEAN
60
80
100
120
140
160
1940 1960 1980 2000 2020 2040 2060
Con
sum
ptio
nIn
dex
(195
0=10
0)
Low IG Transfers
High IG Transfers
With low IG transfers, saving is higher from 1990 to 2020, reducing consumption.
Thereafter, it is higher.

These sorts of results are qualitatively like those from
optimization approaches• Timing of swings differs• Level of savings rates differs• Capital/labor income ratios differ
Big picture is the same:1. The demographic transition leads to a
major increase in capital per worker.2. The greater the role of transfers to the
elderly, the smaller is the increase in capital intensity.
3. Eventually consumption rises with lower transfers, but initially it is lower.
4. Population aging leads to a decline in savings rates but an increase in capital intensity.
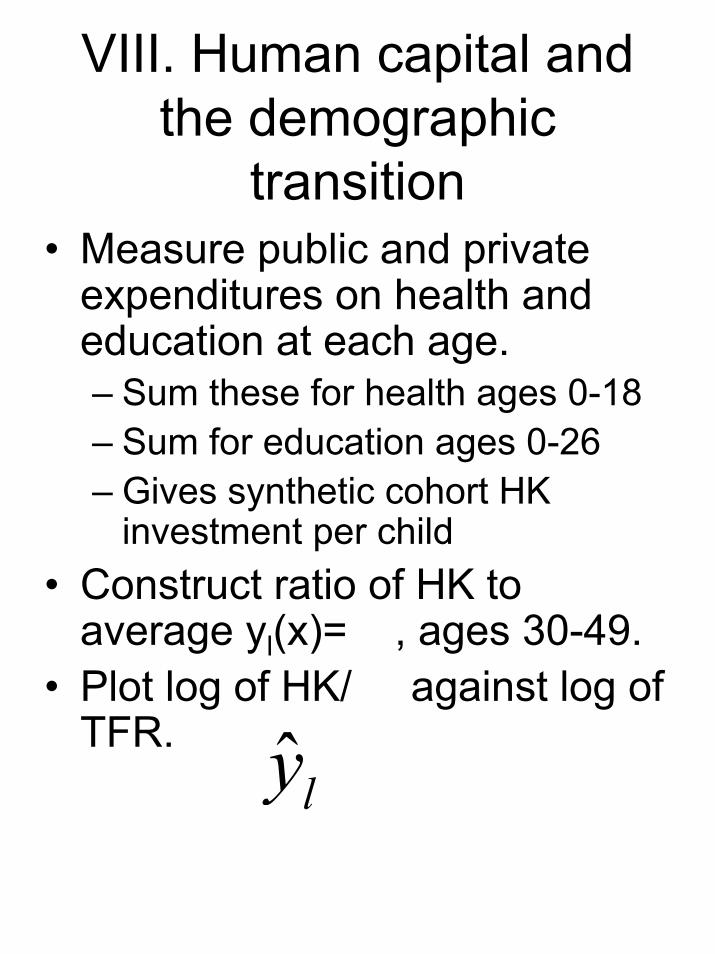
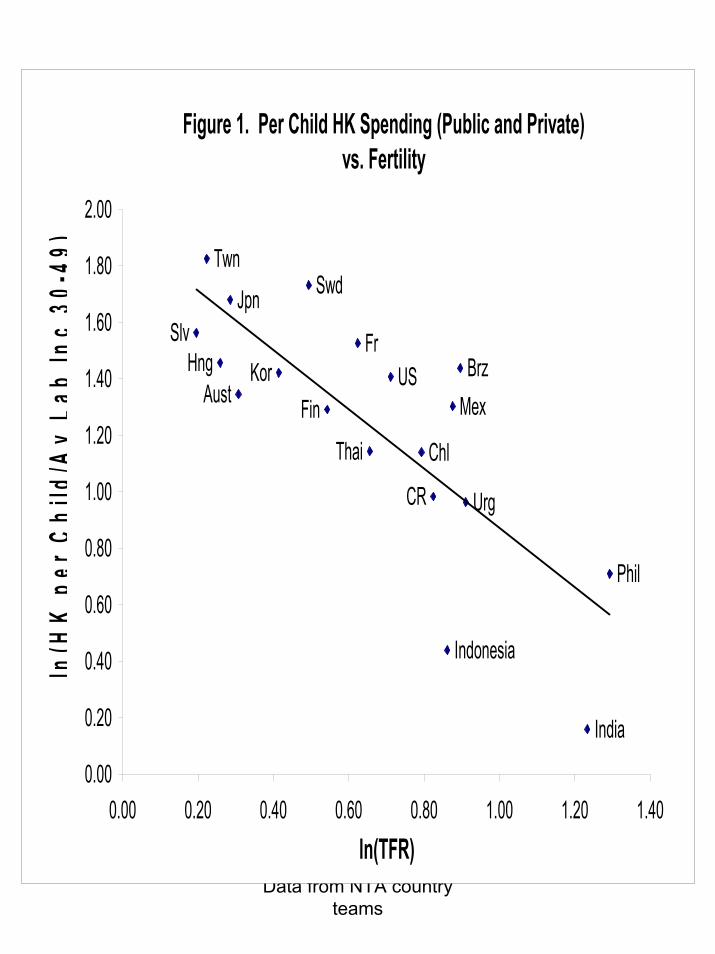
VIII. Human capital and the demographic
transition• Measure public and private
expenditures on health and education at each age.– Sum these for health ages 0-18– Sum for education ages 0-26– Gives synthetic cohort HK
investment per child• Construct ratio of HK to
average yl(x)= , ages 30-49. • Plot log of HK/ against log of
TFR. ˆly

Data from NTA country teams
Figure 1. Per Child HK Spending (Public and Private) vs. Fertility
0.00
0.20
0.40
0.60
0.80
1.00
1.20
1.40
1.60
1.80
2.00
0.00 0.20 0.40 0.60 0.80 1.00 1.20 1.40ln(TFR)
ln(H
Kpe
rChi
ld/A
vLa
bIn
c30
-49)
Data from NTA country teams
Figure 1. Per Child HK Spending (Public and Private) vs. Fertility
AustBrz
Chl
CR
Fin
FrHng
India
Indonesia
Jpn
Mex
Phil
SlvKor
SwdTwn
Thai
Urg
US
0.00
0.20
0.40
0.60
0.80
1.00
1.20
1.40
1.60
1.80
2.00
0.00 0.20 0.40 0.60 0.80 1.00 1.20 1.40ln(TFR)
ln(H
Kpe
rChi
ld/A
vLa
bIn
c30
-49)

Data from NTA country teams
Figure 1. Per Child HK Spending (Public and Private) vs. Fertility
0.00
0.20
0.40
0.60
0.80
1.00
1.20
1.40
1.60
1.80
2.00
0.00 0.20 0.40 0.60 0.80 1.00 1.20 1.40ln(TFR)
ln(H
Kpe
rChi
ld/A
vLa
bIn
c30
-49)
y = -1.05*x + 1.92R2 = 0.62

Now calculate total HK spending on all children
• Multiply TFR times HK per child, and plot its log against log(TFR).

Data from NTA country teams
Figure 5. Total Expenditures Per Woman for All Children's HK vs. Fertility
for 18 NTA countries (log scale)
0.00
0.50
1.00
1.50
2.00
2.50
0.00 0.20 0.40 0.60 0.80 1.00 1.20 1.40
ln(TFR)
ln(T
FR X
Per
Chi
ld H
K S
pend
ing/
A
vLa
bIn
c30
-49)
Roughly a horizontal cloud, perhaps slightly negative.
6.8 years of labor income are invested in total HK on average.
1/12 of lifetime labor income for a couple.

Association is non-causal
• We don’t know whether fertility decline causes rising HK investments per child.
• Desire to make bigger HK investments causes fertility decline.
• Some other factor like rising income causes both fertility and HK changes.
• Here is one theory about a causal path from income growth to other changes. In some models the HK growth causes income growth.

• So our scatter plot shows a common transformed budget constraint with different fertility-HK choices.
• Differing incomes is one possible cause.
• Many others.

Production and Human capital
• Human capital (HK)– Portion of wage,
W(t), workers invest in their children is inversely related to their fertility, F(t)
– Human capital of workers one period later is
– HK(t+1) = h(F(t)) W(t)
• Wage (W)– Wage is
increasing in human capital
– W(t) = g(HK(t))
( ) ( )( )1
12W t
HK tF t
+ =
( ) ( ).33W t HK tγ=
Baseline Specifications
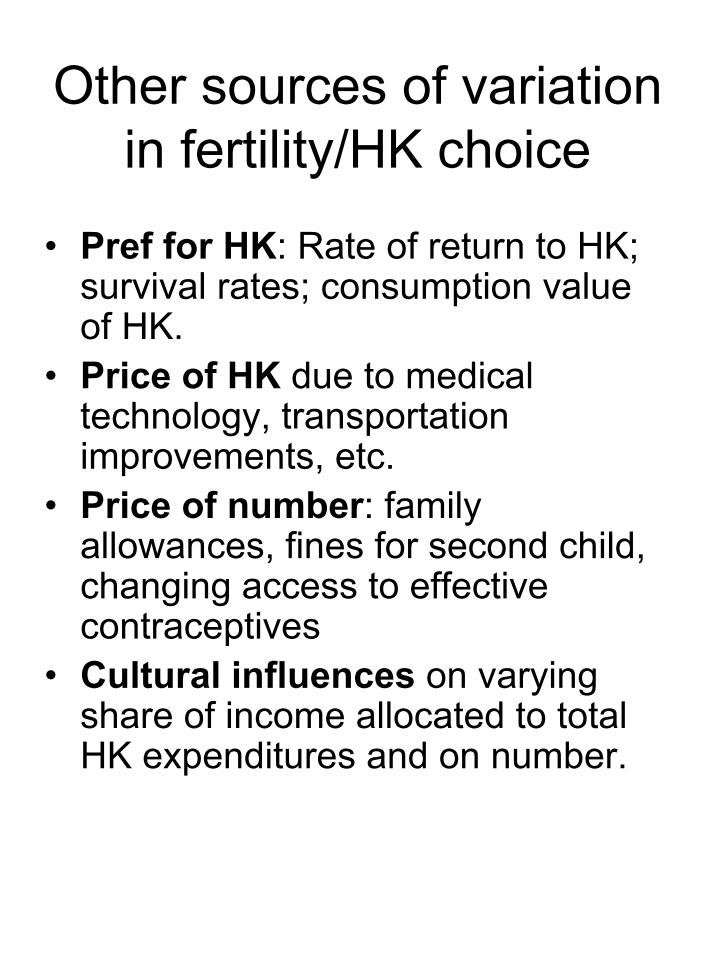
Other sources of variation in fertility/HK choice
• Pref for HK: Rate of return to HK; survival rates; consumption value of HK.
• Price of HK due to medical technology, transportation improvements, etc.
• Price of number: family allowances, fines for second child, changing access to effective contraceptives
• Cultural influences on varying share of income allocated to total HK expenditures and on number.

Model—basic structure
• Take fertility variations as given, trace out consequences for HK, wage, consumption.
• 3 generations: children, workers, retirees; usual accounting identities.
• No saving or physical capital.• HK drives wage growth; wage
growth drives HK growth. (Lee and Mason 2008)

From Lee and Mason (2008)
gure 6. Macro Indicators: Baseline Resu
0 1 2 3 4 5 6
Period
Boom (demorap
hicdividend)
Fertility bust, but
consumption remains
high
Fertility recovers:
modest effect on C/EA
Bottom line: Low fertility leads to higher consumption. Human capital investment has moderated
the impact of fertility swings on standards of living.
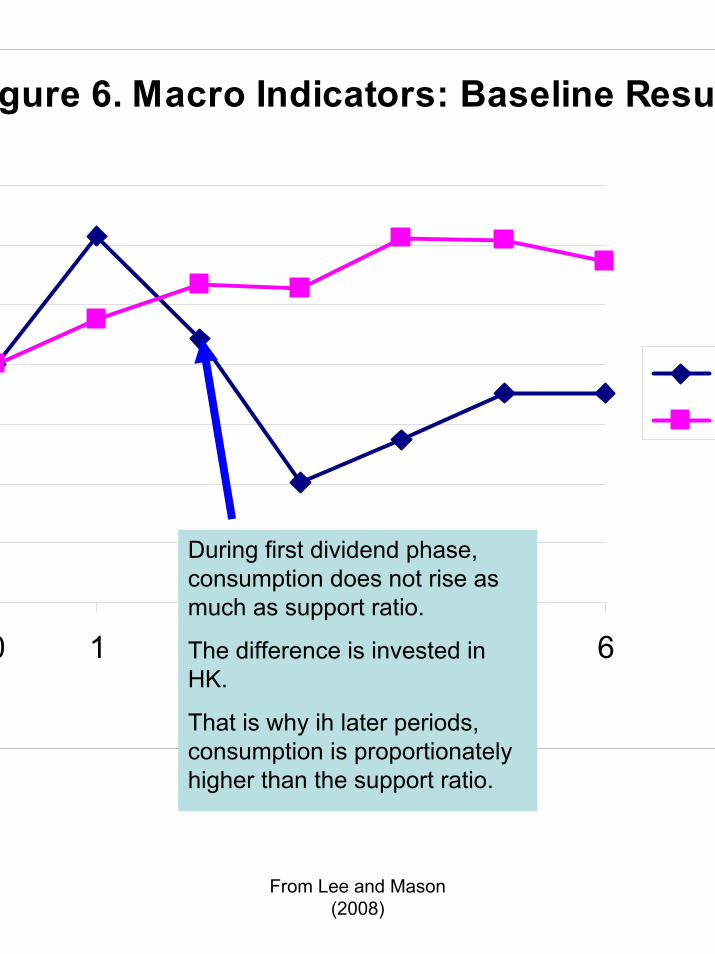
From Lee and Mason (2008)
gure 6. Macro Indicators: Baseline Resu
0 1 2 3 4 5 6
Period
During first dividend phase, consumption does not rise as much as support ratio.
The difference is invested in HK.
That is why ih later periods, consumption is proportionately higher than the support ratio.
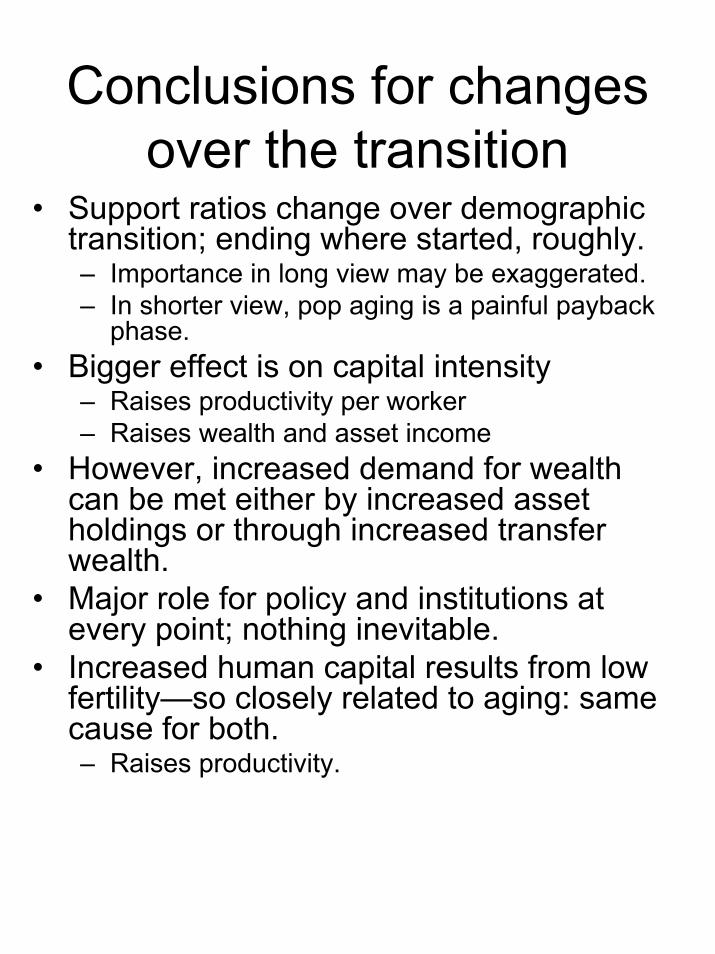
Conclusions for changes over the transition
• Support ratios change over demographic transition; ending where started, roughly. – Importance in long view may be exaggerated. – In shorter view, pop aging is a painful payback
phase. • Bigger effect is on capital intensity
– Raises productivity per worker– Raises wealth and asset income
• However, increased demand for wealth can be met either by increased asset holdings or through increased transfer wealth.
• Major role for policy and institutions at every point; nothing inevitable.
• Increased human capital results from low fertility—so closely related to aging: same cause for both.– Raises productivity.

Data from
END