mae 360 lab 2
DESCRIPTION
this sucks assTRANSCRIPT

Low Speed Lift and Drag for a NACA 0012 Wing Section
J. MurrayAerospace Engineering Student, Lab Section 1007, Tempe, AZ, 85287
The experiment was preformed to examine what effect a change in the Reynolds number would have on the lift and drag characteristics of the NACA 0012 wing section. The wing profile is common and well studied. It has well documented properties that provide precise data to compare with the experimental data. The results of this lab showed the lift and drag characteristics of the wing section. These results were a maximum coefficient of lift was about .8, and happened at 9 to 10 degrees. The drag and lift increase together until around 10 degrees where lift no longer increases but drag does. The lift and angle of attack are linearly related up to point of stall. The results also show that the drag on the wing section increases as the angle of attack increased. The wing section was tested at three data points. These were Reynolds numbers of 50000, 100000, and 150000. The Reynolds numbers were set by the velocity and air density inside the wind tunnel. The data produced a very small error for the results. Because of historical data it was known before the experiment that low Reynolds numbers produce erroneous data. This is caused by premature stall of the wing section. This result was present in our data, even with these results the experiment provided data that is accurate and expected.
NomenclatureA = area of the wing sectionAOA = angle of attackCd = coefficient of dragCl = coefficient of lifeCy = force coefficient in the y directionc = chordD = DragL = Liftl = chord lengthq = dynamic pressureRe = Reynolds numberUCd = uncertainty of the coefficient of dragUd = uncertainty of dragUq = uncertainty of total pressureURe = uncertainty of Reynolds numberv = velocity = atmospheric density = viscous forces
I. Introduction
The laboratory procedure was an exploration of the aerodynamic lift and drag forces experienced by a NACA
0012 wing section at low Reynolds numbers. The model experienced a low speed uniform free stream velocity. This
velocity was set by using specific Reynolds numbers. When low Reynolds numbers are used, the data for the
velocities will show the characteristics of the laminar-separation bubble on the top surface of the wing section. This
laminar-separation is caused by low velocities and is not representative of actual results found at Reynolds numbers
that the wing section would experience in normal operational conditions.
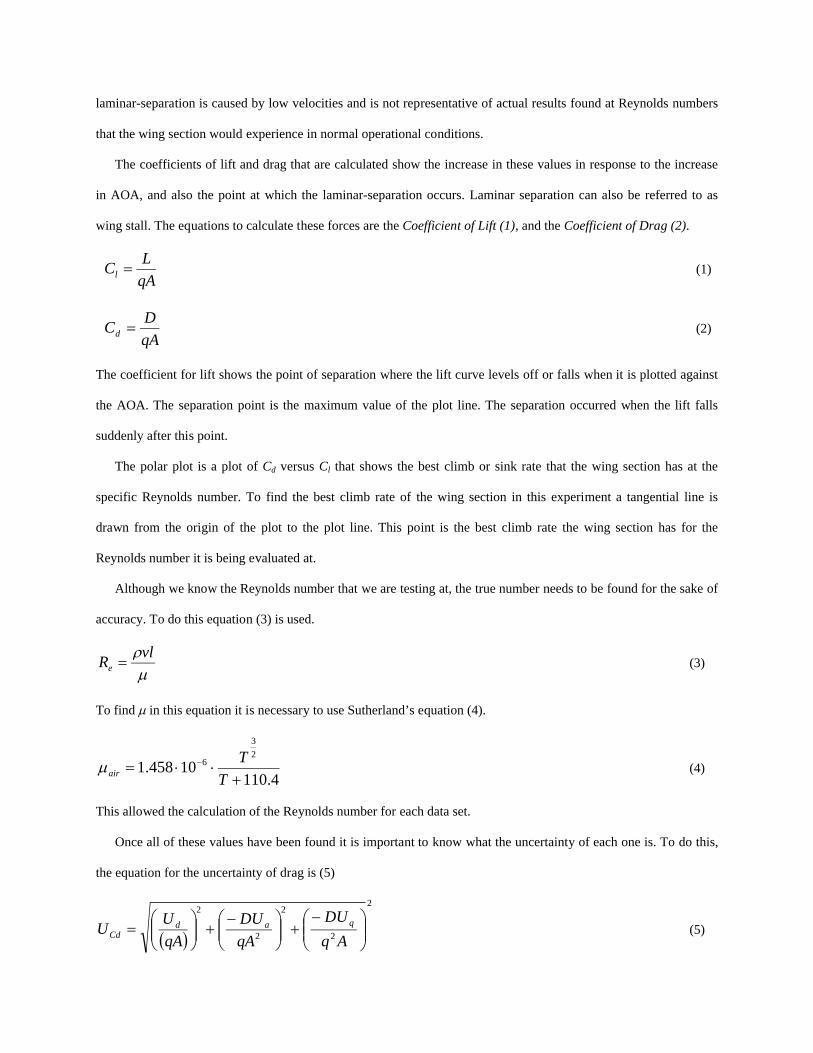
The coefficients of lift and drag that are calculated show the increase in these values in response to the increase
in AOA, and also the point at which the laminar-separation occurs. Laminar separation can also be referred to as
wing stall. The equations to calculate these forces are the Coefficient of Lift (1), and the Coefficient of Drag (2).
qA
LCl (1)
qA
DCd (2)
The coefficient for lift shows the point of separation where the lift curve levels off or falls when it is plotted against
the AOA. The separation point is the maximum value of the plot line. The separation occurred when the lift falls
suddenly after this point.
The polar plot is a plot of Cd versus Cl that shows the best climb or sink rate that the wing section has at the
specific Reynolds number. To find the best climb rate of the wing section in this experiment a tangential line is
drawn from the origin of the plot to the plot line. This point is the best climb rate the wing section has for the
Reynolds number it is being evaluated at.
Although we know the Reynolds number that we are testing at, the true number needs to be found for the sake of
accuracy. To do this equation (3) is used.
vl
Re (3)
To find in this equation it is necessary to use Sutherland’s equation (4).
4.11010458.1
2
3
6
T
Tair (4)
This allowed the calculation of the Reynolds number for each data set.
Once all of these values have been found it is important to know what the uncertainty of each one is. To do this,
the equation for the uncertainty of drag is (5)
2
2
2
2
2
Aq
DU
qA
DU
qA
UU qad
Cd (5)

To find the uncertainty of the coefficient of lift the equation used is (6)
2
2
2
2
2
Aq
LU
qA
LU
qA
UU qal
Cl (6)
Then the uncertainty of the Reynolds number was found using the equation (7)
2
Re
vl
(7)
These numbers make it possible to evaluate the lift and drag at the different Reynolds numbers and to see how they
change with the possible error as the number increase.
II. Procedure
The Equipment used to perform the lab:
NACA 0012 wing section
NACA 0012 wing pylon
Low speed wind tunnel
Computer with LABView program installed
Barometer
Thermometer
Pressure transducer
Load Cell
The experiment was conducted by first recording the ambient temperature and pressure. This was done using a
barometer and thermometer. These values were then entered into the computer which was running the program
LABView, with the experiment already programmed into it. The chord length and the span width of the wing
section were also recorded and entered into the program. The type of wing section at this time was also noted as
being a NACA 0012.
The wing section was then placed into the wind tunnel test section. The wing section was fastened onto a pylon
that had a cross section that was a NACA 0012. This pylon was attached to a pressure gauge that would measure the
force of lift created by the wing section. The pitch of the wing section was then adjusted so that the AOA was zero

degrees. The pitch angle was adjusted by a knob that was located underneath the pylon and outside of the wind
tunnel.
The next step was to calculate the ambient temperature and viscosity. To calculate this Bernoulli’s equation was
used for the pressures, and Sutherland’s equation was used to find the viscousity. The data was acquired with a pitot
tube in the test section and a thermometer. This data was used to determine the dynamic pressure in the wind tunnel
at each Reynolds number. The data was entered into LABView for automatic calculation of the required values.
These calculations used the equations (1), (2), (3), and (4).
The wind tunnel was then turned on and adjusted until LABView had a Reynolds number reading of 50000.
Once this value was reached and the value that the pressure gauge was recording settled the measurement was
written into LABView. This procedure was done for all angles from negative 10 to positive 15 with each step being
one degree. The data acquisition was carried out the same way for each Reynolds number that was evaluated. These
Reynolds numbers were 50000, 100000, and 150000. All the steps were repeated until the complete data sets were
acquired.
III. Results
The results of this experiment were very precise and matched what was expected very closely. The Reynolds
numbers were found using equation (3). The true value for each measurement was used to create an average value
for the setting. The calculated average value for 50000 was 50356 +/-690. For the setting of 100000 the calculated
average value was 100300 +/- 1374. And for the setting of 150000 the calculated average value was 149710 +/-
2050.5. These values are shown in table (10) in the appendix. The error for these values is close to one percent. This
is not a very significant error at the low Reynolds numbers but can become significant if the numbers get close to the
realistic values that the wing section would encounter.
The lift was plotted against the AOA for each Reynolds number. This provided a plot that shows what the lift on
the wing is at each AOA for the specific Reynolds number. This is shown in figure (1).

-15 -10 -5 0 5 10 15 20-0.8
-0.6
-0.4
-0.2
0
0.2
0.4
0.6
0.8
1
Angle of Attack
Cl
Coefficient of Lift versus Angle of Attack
50000 Reynolds number50000 Renolds number error bar
100000 Reynolds number
100000 Reynolds number error bar
150000 Reynolds number 150000 Reynolds number error bar
Figure 1: Coefficient of lift versus Angle of Attack
The plot clearly shows that as the angle of attack increases so does the lift of the wing section. The plot also shows
the laminar-separation at an AOA of 9 and 10 degrees. The plot also shows that laminar-separation is smaller as the
Reynolds number increases. This is because as the Reynolds number increases, the air becomes more viscous. The
viscosity in turn keeps the boundary layer attached to the wing surface. With the laminar flow being smoother over
the wing surface the lift is greater as the Reynolds number increases. This separation can be seen in figure (3).
Figure 3: Laminar-separation
The coefficient of drag was plotted against the coefficient of lift for figure (2). This plot shows that as the lift
increases so does drag.

-0.8 -0.6 -0.4 -0.2 0 0.2 0.4 0.6 0.8 10
0.05
0.1
0.15
0.2
0.25
0.3
0.35Cd versus Cl
Cl
Cd
50000 Reynolds number50000 Reynolds number error bar
100000 Reynolds number
100000 Reynolds number error bar
150000 Reynolds number150000 Reynolds number error bar
Figure 2: Coefficient of Drag versus Coefficient of Lift
Also in figure (2) the plot shows when laminar-separation occurs. This is between the coefficients of lift of .7 to .9.
At this value the NACA 0012 wing section no longer provides anymore lift but is creating a large amount of drag.
The plot shows that both drag and lift are related. The two coefficients are related by the equation (8).
ldod KCCC (8)
This equation describes that the drag coefficient increases as the parasite drag increases and the coefficient of lift is
added to this value.
IV. Conclusion
The experiment has shown that as the AOA increases so does lift until laminar-separation occurs. The
relation between lift and AOA is linear until laminar-separation starts to occur. The experiment data does not match
the data from the NACA 0012 data. This is because of the low Reynolds number. If the number was closer to normal
conditions the results would match very closely.
The lift and drag also increase together as the AOA of the wing section changes. This suddenly changes with
laminar-separation. At this point the wing section no longer produces more lift but it does increase the drag as more
frontal area of the wing section is exposed to the constant velocity.
The errors that happened in the experiment were very obvious in figure (2). The data point that causes a spike
does not belong in the set. It could possibly be from recording the data before the velocity stream settled or the
vibrations from the wing section settled. It is too far out to have been from a degree adjustment. Where the lift vs.

AOA plot has an increase in lift at -1 AOA could possibly be from a mistaken angle adjustment that was not
corrected, or it could have been from the adjustment knob not being used accurately. These errors did not prove to
be large enough to affect the required outcome of the experiment.
References
Anderson, J.D. A History of Aerodynamics and Its Impact on Flying Machines,Chapter 7 pp. 308.
http://images.google.com/imgres?imgurl=http://content.answers.com/main/content/wp/en/6/67/Flow_separation.jpg
&imgrefurl=http://www.answers.com/topic/flow-
separation&h=189&w=320&sz=12&hl=en&start=7&um=1&tbnid=doUK_kpUoFyVcM:&tbnh=70&tbnw=118&pr
ev=/images%3Fq%3Dlaminar%2Bflow%2Bseparation%2Bon%2Ba%2Bwing%2Bsurface%26svnum%3D10%26u
m%3D1%26hl%3Den
Appendix A
Table A.1: Data set from 50000 Reynolds number
Lift (N)Drag (N)
Temp (K)
DyPres (Pa)
Ambient Pres (Pa)
Angle of attack
Renumber
0.11 0.12 310.18 67.71 96500 0 50720.110.18 0.14 309.92 67.52 96500 1 50761.380.42 0.17 310.13 66.98 96500 2 50440.120.74 0.18 310.95 66.29 96500 3 50197.040.89 0.19 311.07 66.38 96500 4 50048.35
1 0.21 310.99 67.28 96500 5 50469.941.14 0.23 311.09 67.24 96500 6 50574.891.27 0.27 311.39 67.1 96500 7 50210.141.38 0.28 311.29 67.07 96500 8 50349.391.46 0.31 311.13 66.51 96500 9 50184.361.74 0.13 310.81 65.78 96500 10 49988.881.5 0.43 310.2 65.07 96500 11 49751.921.42 0.48 310.48 64.99 96500 12 49709.911.38 0.53 310.26 65.63 96500 13 49926.271.38 0.59 310.32 65.71 96500 14 50002.921.38 0.65 310.47 66.79 96500 15 50341.160.14 0.11 310.3 67.34 96500 -1 50657.430.04 0.1 310.39 67.61 96500 -2 50664.95-0.22 0.09 310.92 67.58 96500 -3 50699.85-0.47 0.08 310.55 67.49 96500 -4 50675.4-0.68 0.08 311.03 67.06 96500 -5 50389.84-0.78 0.07 310.93 66.4 96500 -6 50033.63

-0.89 0.07 311.13 66.95 96500 -7 50264.53-1 0.07 310.8 67.16 96500 -8 50456.63
-1.13 0.07 311.06 67.26 96500 -9 50459.38-1.21 0.07 311.11 67.63 96500 -10 50528.61
Table A.2: Data set from 50000 Reynolds number
Lift (N)Drag (N)
Temp (K)
Dy Pres (Pa)
Ambient Pres (Pa)
Angle of
attack
Re number
0.69 0.48 310.69 268.69 96500 0 100954.51.86 0.54 310.86 268.42 96500 1 100850.12.35 0.58 310.82 267.8 96500 2 100922.62.9 0.59 310.17 265.58 96500 3 100856.43.57 0.7 310.47 264.56 96500 4 100438.54.81 0.86 310.77 261.79 96500 5 99976.995.28 0.94 310.86 264 96500 6 99871.725.71 1.02 311.25 263.01 96500 7 99605.36.19 1.15 310.8 262.25 96500 8 99714.396.56 1.26 311.34 260.97 96500 9 994576.09 1.79 311.29 260.36 96500 10 99110.125.88 2.04 311.48 264.84 96500 11 99884.325.86 2.25 311.54 268.37 96500 12 100494.55.89 2.47 311.57 268.67 96500 13 1008315.79 2.6 311.95 267.3 96500 14 100122.75.86 2.83 312.21 266.97 96500 15 99965.750.09 0.42 311.68 268.23 96500 -1 100400.3-0.68 0.39 311.75 268.16 96500 -2 100388.1-1.42 0.35 311.64 267.87 96500 -3 100413-2.13 0.31 312.28 268.28 96500 -4 100083.5-2.8 0.31 312 268.18 96500 -5 100123.8-3.35 0.29 312.15 267.19 96500 -6 100205.8-3.85 0.3 312.26 266.36 96500 -7 99970.83-4.38 0.31 311.88 267.34 96500 -8 100173-4.72 0.32 312.14 265.63 96500 -9 100100.1-5.35 0.37 312.49 266.56 96500 -10 100010.5
Table A.3: Data Set for 150000 Reynolds number
Lift (N)Drag (N)
Temp (K)
Dy Pres (Pa)
Ambient Pres (Pa)
Angle of
attack
Re number
2.32 0.98 311.47 593.67 96500 0 149290.87.06 1.34 311.53 588.95 96500 1 1488008.14 1.46 311.14 588.8 96500 2 148837.39.31 1.59 311.33 585.16 96500 3 148777.1
10.48 1.74 310.97 585.22 96500 4 148862.511.55 1.9 310.78 584.64 96500 5 148882.212.47 2.04 310.95 582.95 96500 6 148659.813.55 2.23 310.85 582.78 96500 7 148565.914.49 2.4 311.17 579.47 96500 8 148200.8
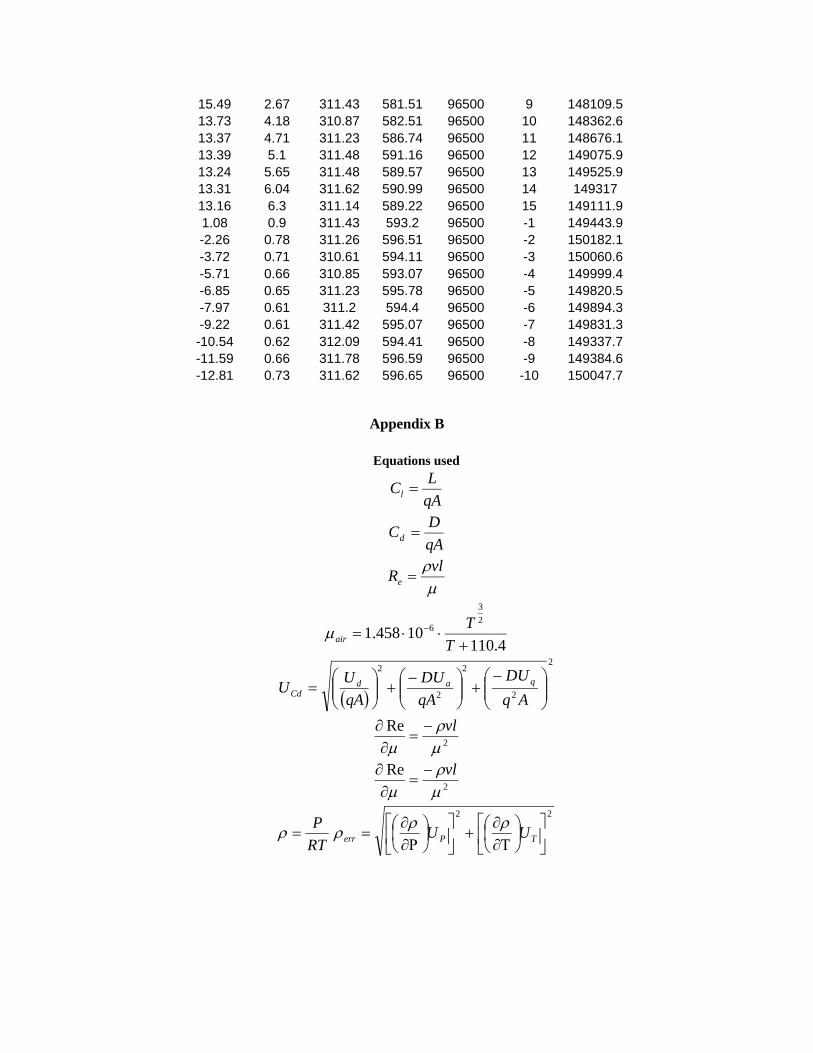
15.49 2.67 311.43 581.51 96500 9 148109.513.73 4.18 310.87 582.51 96500 10 148362.613.37 4.71 311.23 586.74 96500 11 148676.113.39 5.1 311.48 591.16 96500 12 149075.913.24 5.65 311.48 589.57 96500 13 149525.913.31 6.04 311.62 590.99 96500 14 14931713.16 6.3 311.14 589.22 96500 15 149111.91.08 0.9 311.43 593.2 96500 -1 149443.9-2.26 0.78 311.26 596.51 96500 -2 150182.1-3.72 0.71 310.61 594.11 96500 -3 150060.6-5.71 0.66 310.85 593.07 96500 -4 149999.4-6.85 0.65 311.23 595.78 96500 -5 149820.5-7.97 0.61 311.2 594.4 96500 -6 149894.3-9.22 0.61 311.42 595.07 96500 -7 149831.3-10.54 0.62 312.09 594.41 96500 -8 149337.7-11.59 0.66 311.78 596.59 96500 -9 149384.6-12.81 0.73 311.62 596.65 96500 -10 150047.7
Appendix B
Equations used
qA
LCl
qA
DCd
vl
Re
4.11010458.1
2
3
6
T
Tair
2
2
2
2
2
Aq
DU
qA
DU
qA
UU qad
Cd
2
Re
vl
2
Re
vl
RT
P
22
TPerr UU

Appendix C
Table C.1: Density and Density error
Density for
Re=50000
Density for Re=100000
Density for Re=150000
Density error for
Re=50000
Density error for
Re=100000
Density error for
Re=150000
1.0848 1.0852 1.0862 0.0037 0.0037 0.00371.0857 1.0846 1.0859 0.0037 0.0037 0.00371.0849 1.0848 1.0873 0.0037 0.0037 0.00371.0821 1.087 1.0866 0.0037 0.0037 0.00371.0816 1.086 1.0878 0.0037 0.0037 0.00371.0819 1.0849 1.0885 0.0037 0.0037 0.00371.0816 1.0846 1.0879 0.0037 0.0037 0.00371.0805 1.0832 1.0882 0.0037 0.0037 0.00371.0809 1.0848 1.087 0.0037 0.0037 0.00371.0814 1.0829 1.0862 0.0037 0.0037 0.00371.0825 1.0831 1.0881 0.0037 0.0037 0.00371.0847 1.0824 1.0869 0.0037 0.0037 0.00371.0837 1.0823 1.0861 0.0037 0.0037 0.00371.0845 1.0822 1.0861 0.0037 0.0037 0.00371.0843 1.0808 1.0856 0.0037 0.0037 0.00371.0837 1.0799 1.0873 0.0037 0.0037 0.00371.0843 1.0818 1.0863 0.0037 0.0037 0.00371.084 1.0815 1.0869 0.0037 0.0037 0.00371.0822 1.0819 1.0892 0.0037 0.0037 0.00371.0835 1.0797 1.0883 0.0037 0.0037 0.00371.0818 1.0807 1.087 0.0037 0.0037 0.00371.0821 1.0801 1.0871 0.0037 0.0037 0.00371.0814 1.0798 1.0863 0.0037 0.0037 0.00371.0826 1.0811 1.084 0.0037 0.0037 0.00371.0817 1.0802 1.0851 0.0037 0.0037 0.0037
Table C.2: Velocity and velocity error
Velocity for
Re=50000
Velocity for Re=100000
Velocity for Re=150000
Velocity error for
Re=50000
Velocity error for
Re=100000
Velocity error for
Re=150000
11.1731 22.2525 33.0629 0.131 0.0832 0.089511.1527 22.2474 32.9352 0.1312 0.0831 0.089211.1118 22.2203 32.9104 0.1317 0.0832 0.089511.0691 22.1051 32.8191 0.1324 0.0834 0.089211.0787 22.0734 32.8018 0.1324 0.0834 0.089411.1521 21.9685 32.7757 0.1315 0.0834 0.089511.1506 22.064 32.7375 0.1316 0.0833 0.089311.1444 22.0365 32.7275 0.1318 0.0832 0.089411.1401 21.9888 32.6518 0.1318 0.0834 0.089111.0907 21.9542 32.7225 0.1323 0.0833 0.08911.024 21.9269 32.721 0.1329 0.0833 0.089410.9536 22.121 32.8579 0.1335 0.0831 0.0893

10.9518 22.2696 32.9939 0.1336 0.083 0.089411.0017 22.2831 32.9498 0.1329 0.083 0.089311.0094 22.2399 32.9966 0.1329 0.0829 0.089311.1022 22.2355 32.9221 0.1319 0.0829 0.089511.1447 22.2688 33.0478 0.1314 0.083 0.089511.1686 22.2684 33.1302 0.1312 0.0829 0.089711.1757 22.2525 33.0294 0.1313 0.083 0.0911.1616 22.2923 33.0134 0.1313 0.0828 0.089811.1346 22.2782 33.1085 0.1318 0.0829 0.089711.0779 22.2425 33.0688 0.1323 0.0829 0.089711.1273 22.2119 33.099 0.1319 0.0829 0.089611.1388 22.2391 33.1163 0.1316 0.0829 0.089111.1517 22.1773 33.1601 0.1316 0.0829 0.089411.1832 22.2284 33.1533 0.1313 0.0828 0.0895
Table C.3: Calculated Reynolds numbers and calculated errors
Reynolds number
for 50000
Reynolds number
for 100000
Reynolds number
for 150000
reynolds number
error
reynolds number error for 100000
reynolds number error for 150000
50816 101120 150090 696.388 1385.5 2055.650798 101000 149450 696.1899 1383.8 2046.850551 100900 149670 692.7709 1382.4 205050123 100750 149090 686.7629 1380.5 204250132 100430 149310 686.8751 1376.1 2045.250488 99780 149350 691.7563 1367.1 2045.950452 100170 149030 691.2535 1372.3 2041.450338 99820 149070 689.6446 1367.4 204250348 99860 148450 689.7862 1368.1 2033.350169 99390 148560 687.3706 1361.6 2034.749958 99300 149030 684.5262 1360.3 2041.349811 100070 149350 682.61 1370.8 2045.649723 100710 149760 681.3677 1379.6 2051.150013 100760 149560 685.3655 1380.2 2048.450031 100350 149660 685.6061 1374.4 2049.650410 100180 149720 690.7743 1372 2050.750652 100630 150050 694.1224 1378.4 2055.150735 100590 150580 695.2438 1377.8 2062.450615 100580 150670 693.5063 1377.7 206450657 10040 150390 694.1478 1375 206050397 100490 150500 690.505 1376.4 2061.450169 100240 150350 687.3919 1373 2059.250335 100040 150300 689.6419 1370.2 2058.550482 100380 149810 691.7034 1374.9 2051.450466 99960 150270 691.4455 1369 2057.950594 99990 150380 693.197 1369.3 2059.4
Table C.4: Coefficient of lift and coefficient of lift error

Coefficient of lift
50000
Coefficient of lift
100000
Coefficient of lift
150000
Coefficient of lift error for 50000
Coefficient of lift error
for 100000
Coefficient of lift error
for 150000
-0.5632 -0.6318 -0.6758 0.0023 0.0006 0.0004-0.5289 -0.5593 -0.6115 0.0023 0.0008 0.001-0.4687 -0.5157 -0.5582 0.0024 0.0009 0.0011-0.4185 -0.455 -0.4877 0.0025 0.001 0.0013-0.3698 -0.3947 -0.4221 0.0026 0.0012 0.0014-0.3192 -0.3287 -0.3619 0.0026 0.0016 0.0016-0.2192 -0.2499 -0.3031 0.0027 0.0017 0.0017-0.1025 -0.1669 -0.1971 0.0028 0.0018 0.00180.0186 -0.0798 -0.1193 0.0029 0.002 0.0020.0654 0.0106 0.0573 0.0029 0.0021 0.00210.0511 0.0808 0.123 0.0032 0.0019 0.00190.0839 0.2181 0.3773 0.003 0.0018 0.00180.1974 0.2762 0.4352 0.003 0.0018 0.00180.3514 0.3437 0.5008 0.0029 0.0018 0.00180.422 0.4248 0.5637 0.0029 0.0018 0.00180.4679 0.5784 0.6219 0.0029 0.0018 0.00180.5337 0.6296 0.6734 0.0023 0.0006 0.00030.5958 0.6834 0.7319 0.0023 0.0006 0.00040.6477 0.743 0.7871 0.0023 0.0007 0.00060.691 0.7913 0.8385 0.0024 0.0009 0.00080.8327 0.7363 0.742 0.0025 0.001 0.00090.7256 0.6989 0.7173 0.0025 0.0011 0.00110.6878 0.6873 0.713 0.0026 0.0013 0.00120.6619 0.6901 0.7069 0.0026 0.0014 0.00140.6611 0.6819 0.7089 0.0027 0.0015 0.00160.6504 0.6909 0.7031 0.0027 0.0017 0.0017
Table C.5: Coefficient of drag and coefficient of drag error
Coefficient of drag
Coefficient of drag error
Coefficient of lift
Coefficient of drag error
50000
Coefficient of drag error
100000
Coefficient of drag error
150000
0.0326 0.0434 0.0387 0.0023 0.0006 0.29520.0326 0.0376 0.035 0.0023 0.0006 0.32170.0326 0.0364 0.0327 0.0024 0.0006 0.33090.0327 0.0352 0.0324 0.0024 0.0006 0.34360.033 0.0342 0.0326 0.0024 0.0006 0.35640.0383 0.0365 0.0346 0.0024 0.0007 0.37130.0384 0.0363 0.0352 0.0024 0.0007 0.38560.0436 0.0411 0.0378 0.0024 0.0007 0.40440.0484 0.0464 0.0418 0.0024 0.0007 0.42420.0526 0.0508 0.0486 0.0024 0.0007 0.45140.0558 0.0562 0.052 0.0024 0.0008 0.62590.0653 0.0633 0.0716 0.0025 0.0008 0.68620.0799 0.0682 0.0781 0.0025 0.0009 0.72910.0855 0.0699 0.0855 0.0025 0.0009 0.79980.0901 0.0833 0.0936 0.0025 0.001 0.847

0.0983 0.1034 0.1023 0.0025 0.001 0.88260.1077 0.1121 0.1102 0.0023 0.0006 0.29090.1267 0.1221 0.1205 0.0023 0.0006 0.28320.1314 0.138 0.1304 0.0023 0.0006 0.28110.1467 0.152 0.1445 0.0023 0.0006 0.27950.0622 0.2164 0.2259 0.0023 0.0006 0.27780.208 0.2425 0.2527 0.0024 0.0006 0.27680.2325 0.2639 0.2716 0.0024 0.0006 0.27650.2542 0.2894 0.3017 0.0023 0.0006 0.27720.2826 0.3062 0.3217 0.0023 0.0006 0.27780.3063 0.3337 0.3366 0.0023 0.0006 0.2808
Table C.6: Calculated Reynolds numbers
Reynolds number at 50000
Reynolds number
at 100000
Reynolds number
at 150000
50816 101120 15009050798 101000 14945050551 100900 14967050123 100750 14909050132 100430 14931050488 99780 14935050452 100170 14903050338 99820 14907050348 99860 14845050169 99390 14856049958 99300 14903049811 100070 14935049723 100710 14976050013 100760 14956050031 100350 14966050410 100180 14972050652 100630 15005050735 100590 15058050615 100580 15067050657 100400 15039050397 100490 15050050169 100240 15035050335 100040 15030050482 100380 14981050466 99960 15027050594 999900 150380
Average 50356 100300 1497100

The MATLab Code:
function lab2=lift()clc;clear;load lift1.txt;load lift2.txt;load lift3.txt;Chord=.0794;%mUcord=.001;%mSpan=.4001;%mUspan=.001;%mUlift=.001;%NUtemp=.1;%CUpress=.01;%1 percentA=Chord*Span;
% Calculate ReTemp=lift1(:,3);Temptwo=lift2(:,3);Tempthree=lift3(:,3);L=lift1(:,1);z=length(L);Ltwo=lift2(:,1);Lthree=lift3(:,1);D=lift1(:,2);Dtwo=lift2(:,2);Dthree=lift3(:,2);R=287;t=length(Temp);P_atm=lift1(:,5);P_atmtwo=lift2(:,5);P_atmthree=lift3(:,5);q=lift1(:,4);qtwo=lift2(:,4);qthree=lift3(:,4);P=P_atm + q;Ptwo=P_atmtwo + qtwo;Pthree=P_atmthree + qthree;rho=zeros(size(P));l=Chord;Vf=zeros(size(Temp));mu=1.458e-6;for i = 1:t Vf(i)=(mu*(Temp(i)^1.5))/(Temp(i)+110.4); Vftwo(i)=(mu*(Temptwo(i)^1.5))/(Temptwo(i)+110.4); Vfthree(i)=(mu*(Tempthree(i)^1.5))/(Tempthree(i)+110.4); rho(i)=P(i)/(R*Temp(i)); rhotwo(i)=Ptwo(i)/(R*Temptwo(i)); rhothree(i)=Pthree(i)/(R*Tempthree(i)); V(i)=sqrt((2*q(i))/rho(i)); Vtwo(i)=sqrt((2*qtwo(i))/rhotwo(i)); Vthree(i)=sqrt((2*qthree(i))/rhothree(i)); Re(i)=(rho(i)*V(i)*l)/Vf(i); Retwo(i)=(rhotwo(i)*Vtwo(i)*l)/Vftwo(i);
Rethree(i)=(rhothree(i)*Vthree(i)*l)/Vfthree(i); i=i+1;endReynolds_Number =sum(Re)/z;Reynolds_Number_two = sum(Retwo)/z;Reynolds_Number_three = sum(Rethree)/z;
%Calculate Re with error positive
Temp=lift1(:,3);Temptwo=lift2(:,3);Tempthree=lift3(:,3);R=287;

t=length(Temp);t=length(Temptwo);t=length(Tempthree);P_atm=lift1(:,5);P_atmtwo=lift2(:,5);P_atmthree=lift3(:,5);q=lift1(:,4);qtwo=lift2(:,4);qthree=lift3(:,4);P=P_atm + q;Ptwo=P_atmtwo + qtwo;Pthree=P_atmthree + qthree;rho=zeros(size(P));rhotwo=zeros(size(Ptwo));rhothree=zeros(size(Pthree));l=Chord;Vf=zeros(size(Temp));Vftwo=zeros(size(Temptwo));Vfthree=zeros(size(Tempthree));mu=1.458e-6;for i = 1:t Ua=sqrt((.0794*.001)^2+(.4001*.001^2)^2); Vf(i)=(mu*(Temp(i)^1.5))/(Temp(i)+110.4); Vftwo(i)=(mu*(Temptwo(i)^1.5))/(Temptwo(i)+110.4); Vfthree(i)=(mu*(Tempthree(i)^1.5))/(Tempthree(i)+110.4); rho(i)=P(i)/(R*Temp(i)); rhotwo(i)=Ptwo(i)/(R*Temptwo(i)); rhothree(i)=Pthree(i)/(R*Tempthree(i)); V(i)=sqrt((2*q(i))/rho(i)); Vtwo(i)=sqrt((2*qtwo(i))/rhotwo(i)); Vthree(i)=sqrt((2*qthree(i))/rhothree(i)); Upatm(i)=P_atm(i)*.01+P_atm(i); Upatmtwo(i)=P_atmtwo(i)*.01+P_atmtwo(i); Upatmthree(i)=P_atmthree(i)*.01+P_atmthree(i); Utemp(i)=Temp(i)+.1; Utemptwo(i)=Temptwo(i)+.1; Utempthree(i)=Tempthree(i)+.1; Uchord=Chord*.001+Chord; Uspan=Span*.001+Span; Ulift=.005; Udrag=.005; Uq(i)=.001*.001*q(i); Uqtwo(i)=.001*.001*qtwo(i); Uqthree(i)=.001*.001*qthree(i); Umu(i)=((.000002187*(Utemp(i))^.5)/(Utemp(i)+110.4)-(.000001458*Utemp(i)^1.5/(Utemp(i)+110.4)^2)*.1); Umutwo(i)=((.000002187*(Utemptwo(i))^.5)/(Utemptwo(i)+110.4)-(.000001458*Utemptwo(i)^1.5/(Utemptwo(i)+110.4)^2)*.1); Umuthree(i)=((.000002187*(Utempthree(i))^.5)/(Utempthree(i)+110.4)-(.000001458*Utempthree(i)^1.5/(Utempthree(i)+110.4)^2)*.1); Urho(i)=sqrt((-Upatm(i)/(R*(Temp(i))^2)*.1)^2+(1/(R*Utemp(i)))*1.1^2); Urhotwo(i)=sqrt((-Upatmtwo(i)/(R*(Temptwo(i))^2)*.1)^2+(1/(R*Utemptwo(i)))*1.1^2); Urhothree(i)=sqrt((-Upatmthree(i)/(R*(Tempthree(i))^2)*.1)^2+(1/(R*Utempthree(i)))*1.1^2); Uv(i)=sqrt(.5*(sqrt(2)/(sqrt(q(i)/rho(i))*rho(i))*1.1)^2+(-.5*(sqrt(2)*q(i)/(sqrt(q(i)/rho(i)))*(rho(i))^2)*Urho(i))^2); Uvtwo(i)=sqrt(.5*(sqrt(2)/(sqrt(qtwo(i)/rhotwo(i))*rhotwo(i))*1.1)^2+(-.5*(sqrt(2)*qtwo(i)/(sqrt(qtwo(i)/rhotwo(i)))*(rhotwo(i))^2)*Urhotwo(i))^2); Uvthree(i)=sqrt(.5*(sqrt(2)/(sqrt(qthree(i)/rhothree(i))*rhothree(i))*1.1)^2+(-.5*(sqrt(2)*qthree(i)/(sqrt(qthree(i)/rhothree(i)))*(rhothree(i))^2)*Urhothree(i))^2); UCl(i)=sqrt((Ulift/(q(i) * A))^2 + ((-L(i) * Ua)/(q(i) * A^2))^2 + ((-L(i) * Uq(i))/(A * q(i)^2))^2); UCltwo(i)=sqrt((Ulift/(qtwo(i) * A))^2 + ((-Ltwo(i) * Ua)/(qtwo(i) * A^2))^2 + ((-Ltwo(i) * Uqtwo(i))/(A * qtwo(i)^2))^2); UClthree(i)=sqrt((Ulift/(qthree(i) * A))^2 + ((-Lthree(i) * Ua)/(qthree(i) * A^2))^2 + ((-Lthree(i) * Uqthree(i))/(A * qthree(i)^2))^2); UCd(i)=sqrt((Udrag/(q(i) * A))^2 + ((-D(i) * Ua)/(q(i) * A^2))^2 + ((-D(i) * Uq(i))/(A * q(i)^2))^2); UCdtwo(i)=sqrt((Udrag/(qtwo(i) * A))^2 + ((-Dtwo(i) * Ua)/(qtwo(i) * A^2))^2 + ((-Dtwo(i) * Uqtwo(i))/(A * qtwo(i)^2))^2); UCdthree(i)=sqrt((Udrag/(qthree(i) * A))^2 + ((-Dthree(i) * Ua)/(qthree(i) * A^2))^2 + ((-Dthree(i) * Uqthree(i))/(A * qthree(i)^2))^2); Urerho(i)=(((V(i)*.0749)/Vf(i))*Urho(i))^2; Urerhotwo(i)=(((Vtwo(i)*.0749)/Vftwo(i))*Urhotwo(i))^2; Urerhothree(i)=(((Vthree(i)*.0749)/Vfthree(i))*Urhothree(i))^2; UreV(i)=(((Urho(i)*.0749)/Vf(i))*Uv(i))^2; UreVtwo(i)=(((Urhotwo(i)*.0749)/Vftwo(i))*Uvtwo(i))^2; UreVthree(i)=(((Urhothree(i)*.0749)/Vfthree(i))*Uvthree(i))^2; UreUl(i)=(((rho(i)*V(i))/Vf(i))*.001)^2; UreUltwo(i)=(((rhotwo(i)*Vtwo(i))/Vftwo(i))*.001)^2;

UreUlthree(i)=(((rhothree(i)*Vthree(i))/Vfthree(i))*.001)^2; UreUmu(i)=(((-rho(i)*V(i)*.0749)/(Vf(i)^2))*Umu(i))^2; UreUmutwo(i)=(((-rhotwo(i)*Vtwo(i)*.0749)/(Vftwo(i)^2))*Umutwo(i))^2; UreUmuthree(i)=(((-rhothree(i)*Vthree(i)*.0749)/(Vfthree(i)^2))*Umuthree(i))^2; Ure(i)=sqrt(Urerho(i)+UreV(i)+UreUl(i)+UreUmu(i)); Uretwo(i)=sqrt(Urerhotwo(i)+UreVtwo(i)+UreUltwo(i)+UreUmutwo(i)); Urethree(i)=sqrt(Urerhothree(i)+UreVthree(i)+UreUlthree(i)+UreUmuthree(i)); i=i+1;end
uncertainty_Reynolds_Number = sum(Ure)/zuncertainty_Reynolds_Number_two = sum(Uretwo)/zuncertainty_Reynolds_Number_three = sum(Urethree)/z
% Cl vs. Angle of AttackAOA=lift1(:,6);AOAtwo=lift2(:,6);AOAthree=lift3(:,6);AOApositive=zeros(size(16));Lpositive=zeros(size(16));AOAnegative=zeros(size(10));Lnegative=zeros(size(10));for i = 1:16 AOApositive(i)=AOA(i); AOApositivetwo(i)=AOAtwo(i); AOApositivethree(i)=AOAthree(i); Lpositive(i)=L(i); Lpositivetwo(i)=Ltwo(i); Lpositivethree(i)=Lthree(i); i=1+i;endfor i = 1:10 AOAnegative(i)=AOA(i+16); AOAnegativetwo(i)=AOAtwo(i+16); AOAnegativethree(i)=AOAthree(i+16); Lnegative(i)=L(i+16); Lnegativetwo(i)=Ltwo(i+16); Lnegativethree(i)=Lthree(i+16); i=1+1;end
%Coefficient of liftClpositive=zeros(size(16));for i = 1:16 Clpositive(i)=Lpositive(i)/(q(i)*A); Clpositivetwo(i)=Lpositivetwo(i)/(qtwo(i)*A); Clpositivethree(i)=Lpositivethree(i)/(qthree(i)*A); i=1+i;endClnegative=zeros(size(10));for i = 1:10 Clnegative(i)=Lnegative(i)/(q(i+16)*A); Clnegativetwo(i)=Lnegativetwo(i)/(qtwo(i+16)*A); Clnegativethree(i)=Lnegativethree(i)/(qthree(i+16)*A); i=i+1;endFCln=fliplr(Clnegative);FClntwo=fliplr(Clnegativetwo);FClnthree=fliplr(Clnegativethree);FAOAn=fliplr(AOAnegative);FAOAntwo=fliplr(AOAnegativetwo);FAOAnthree=fliplr(AOAnegativethree);Cltotal= [FCln Clpositive];Cltotaltwo= [FClntwo Clpositivetwo];Cltotalthree= [FClnthree Clpositivethree];AOAtotal=[FAOAn AOApositive];AOAtotaltwo=[FAOAntwo AOApositivetwo];AOAtotalthree=[FAOAnthree AOApositivethree];figure(1)hold on

plot(AOAtotal,Cltotal,'r');errorbar(AOAtotal,Cltotal,Ulift,'r');plot(AOAtotaltwo,Cltotaltwo,'g');errorbar(AOAtotaltwo,Cltotaltwo,Ulift,'g');plot(AOAtotalthree,Cltotalthree);errorbar(AOAtotalthree,Cltotalthree,Ulift);
% Coefficient of drag Vs. Coefficient of lift
Dpositive=zeros(size(16));Dnegative=zeros(size(10));for i = 1:16 Dpositive(i)=D(i); Dpositivetwo(i)=Dtwo(i); Dpositivethree(i)=Dthree(i); i=1+i;endfor i = 1:10 Dnegative(i)=D(i+16); Dnegativetwo(i)=Dtwo(i+16); Dnegativethree(i)=Dthree(i+16); i=1+1;end
%Coefficient of Drag
Cdpositive=zeros(size(16));for i = 1:16 Cdpositive(i)=Dpositive(i)/(q(i)*A); Cdpositivetwo(i)=Dpositivetwo(i)/(qtwo(i)*A); Cdpositivethree(i)=Dpositivethree(i)/(qthree(i)*A); i=1+i;endCdnegative=zeros(size(10));for i = 1:10 Cdnegative(i)=Dnegative(i)/(q(i+10)*A); Cdnegativetwo(i)=Dnegativetwo(i)/(qtwo(i+10)*A); Cdnegativethree(i)=Dnegativethree(i)/(qthree(i+10)*A); i=i+1;endFCdn=fliplr(Cdnegative);FCdntwo=fliplr(Cdnegativetwo);FCdnthree=fliplr(Cdnegativethree);Cdtotal= [FCdn Cdpositive];Cdtotaltwo= [FCdntwo Cdpositivetwo];Cdtotalthree= [FCdnthree Cdpositivethree];figure(3)Hold onplot(Cltotal,Cdtotal,'r');errorbar(Cltotal, Cdtotal, UCd,'r');plot(Cltotaltwo,Cdtotaltwo,'g');errorbar(Cltotaltwo, Cdtotaltwo, UCdtwo,'g');plot(Cltotalthree,Cdtotalthree);errorbar(Cltotalthree, Cdtotalthree, UCdthree);
end
Abstract
An abstract appears at the beginning of Full-Length Papers (Survey and Design Forum Papers, History of Key
Technologies Papers, invited lectures, and Technical/Engineering Notes do not include abstracts). The abstract is
one paragraph long (not an introduction) and complete in itself (no reference numbers). It should indicate subjects

dealt with in the paper and state the objectives of the investigation. Newly observed facts and conclusions of the
experiment or argument discussed in the paper must be stated in summary form; readers should not have to read the
paper to understand the abstract. Format the abstract bold, indented 3 picas (1/2”) on each side, and separated from
the rest of the document by two blank lines