maejo int. j. sci. technol 2015 9(02), 265-277; doi: 10
TRANSCRIPT

Maejo Int. J. Sci. Technol. 2015, 9(02), 265-277; doi: 10.14456/mijst.2015.19
Maejo International Journal of Science and Technology
ISSN 1905-7873
Available online at www.mijst.mju.ac.th Full Paper
Nutritional composition, in vitro starch digestibility and estimated glycemic index of three varieties of ‘Kluai Namwa’ banana (Musa sapientum L.) and its products Nednapis Vatanasuchart
1,*, Pisut Butsuwan 2 and Wassana Narasri
1 1 Department of Nutrition and Health, Institute of Food Research and Product Development, Kasetsart University, Bangkok 10900, Thailand 2 Department of Processing and Preservation, Institute of Food Research and Product Development, Kasetsart University, Bangkok 10900, Thailand * Corresponding author, e-mail: [email protected] Received: 10 February 2014 / Accepted: 24 August 2015 / Published: 31 August 2015
Abstract: The effects of ripening on nutritional composition, in vitro starch digestibility and estimated glycemic index (GI) of banana pulp obtained from three varieties of Kluai Namwa banana (Mali-ong, Khao-nuan and Laong-nam) were determined. The ripening stage has no significant effect on the energy and carbohydrate of the bananas. Laong-nam has the lowest energy: 390.03±0.16 kcal/100g at the ripe stage. Rapid conversion of starch into more soluble sugars, mainly glucose and fructose, with ripening was observed for all varieties. Ripe Laong-nam has the lowest total sugars of 41.61±0.05 g/100g. A reduction in total dietary fibre, mainly insoluble fibre, was found for the ripe bananas of all varieties, while soluble fibre increases with ripening; Laong-nam gives the highest of 2.84±0.23 g/100g. The GI of the bananas obtained at different ripening stages is less than 55; Laong-nam has the lowest of 46.4. Flour and extruded snack processed from green bananas show low GI, with Laong-nam having the lowest value. A slow rate of starch digestion of banana pulp, flour and snack was observed among the varieties and was associated with their GI values. This could be related to the composition of resistant starch in the bananas.
Keywords: bananas, nutritional composition, starch digestibility, glycemic index INTRODUCTION Bananas (Musa sp.) are one of the most important tropical fruits and are consumed worldwide by people of all age groups. In Thailand bananas are called ‘Kluai’; species of sapientum L. is commonly cultivated [1] such as Kluai Hom (AAA genome group), Kluai Khai (AA), Kluai Lebmuenang (AA) and Kluai Namwa (ABB), which are economically important for both domestic

Maejo Int. J. Sci. Technol. 2015, 9(02), 265-277; doi: 10.14456/mijst.2015.19
266
consumption and export [2]. In particular, Kluai Namwa is the most commercially important for fresh consumption and utilisation in several kinds of banana products. Both green and ripe Kluai Namwa provide good texture suitable for food applications due to a high flour content of 26.0% at the green stage and complexation of non-starch polysaccharides such as pectin, cellulose and hemicelluloses when ripe [3-5]. More importantly, bananas are known as a healthy food choice and consumer demand is increasing due to their nutritional composition and antioxidant properties [6]. Several researchers have reported that green banana has a high resistant starch content, which can help improve glucose regulation in diabetes and facilitate weight control for the obese through its slow rate of digestibility [7-10]. Starch is the most common carbohydrate in the human diet. The major sources of starch intake worldwide are cereals (rice, wheat and maize) and root vegetables (potatoes and cassava), which possess properties of rapid digestion and absorption. Starch digestibility is known to vary among different starchy foods depending on the nature of the starch, its physical form, protein and lipid interaction, and the presence of anti-nutrients as well as some extrinsic factors such as enzyme inhibitor and food processing method [9-11]. The rate of starch digestion and absorption is a determinant for blood glucose response to a starchy meal. There is evidence that slowly digested and absorbed carbohydrates are favourable for the dietary management in metabolic disorders such as diabetes and hyperlipidemia [9, 12]. Studies have been carried out to assess blood glucose response after intake of carbohydrates from different plant sources [13, 14]. Glycemic index (GI) is an important measure to characterise starch digestibility [12]. The GI concept of classifying foods on the basis of their postprandial blood glucose response was introduced by Jenkins et al. [12]. GI is usually obtained by dividing the incremental postprandial blood glucose response of a test food by the corresponding glucose production after ingestion of a reference food containing an equal amount of carbohydrate. Goñi et al. [15] developed a simple in vitro hydrolysis procedure using three enzymes, namely pepsin, -amylase and amyloglucosidase, for digesting starchy foods and the rate of starch digestibility was measured. This was used to estimate the metabolic glycemic response to a food. The estimated GI can be calculated using the equation: estimated GI = 39.71 + (0.549 × hydrolysis index (HI)). Several studies on starchy foods for healthy consumption, such as rice and bean sprouts, have adopted this measurement for evaluation of GI values, which could differentiate their starch digestibility [16-18]. Our previous study has shown that Kluai Namwa bananas contain the highest levels of resistant starch, 77.3-81.1 g /100g, as compared with other cultivars, i.e. Kluai Hom, Kluai Khai and Kluai Lebmuenang [4]. In Thailand Kluai Namwa is commonly grown in almost every province and planting areas are larger than for other bananas. There are several varieties of Kluai Namwa that can be eaten raw and are appropriate for processing into several kinds of food products such as dried banana, roasted banana, banana chips and banana desserts [2,19]. Therefore, it is of interest to acquire more knowledge about the nutritional and functional qualities of different varieties of Kluai Namwa and their suitability for processing into food products. The objective of this research is to determine the effects of ripening (green, green-to-yellow and ripe stages) on the nutrient composition, the rate of in vitro starch digestibility, and the GI of banana pulp and processed samples obtained from three varieties of Kluai Namwa.
Maejo Int. J. Sci. Technol. 2015, 9(02), 265-277; doi: 10.14456/mijst.2015.19
267
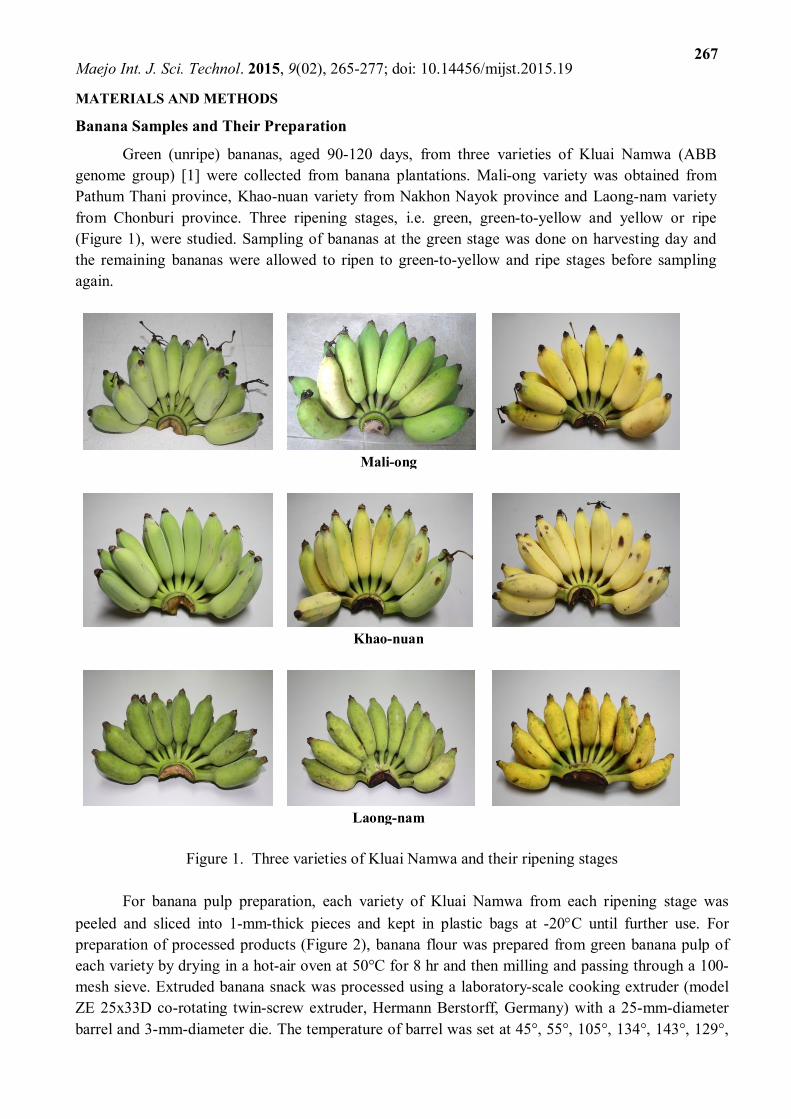
MATERIALS AND METHODS Banana Samples and Their Preparation Green (unripe) bananas, aged 90-120 days, from three varieties of Kluai Namwa (ABB genome group) [1] were collected from banana plantations. Mali-ong variety was obtained from Pathum Thani province, Khao-nuan variety from Nakhon Nayok province and Laong-nam variety from Chonburi province. Three ripening stages, i.e. green, green-to-yellow and yellow or ripe (Figure 1), were studied. Sampling of bananas at the green stage was done on harvesting day and the remaining bananas were allowed to ripen to green-to-yellow and ripe stages before sampling again.
Mali-ong
Khao-nuan
Laong-nam
Figure 1. Three varieties of Kluai Namwa and their ripening stages
For banana pulp preparation, each variety of Kluai Namwa from each ripening stage was
peeled and sliced into 1-mm-thick pieces and kept in plastic bags at -20C until further use. For preparation of processed products (Figure 2), banana flour was prepared from green banana pulp of each variety by drying in a hot-air oven at 50°C for 8 hr and then milling and passing through a 100-mesh sieve. Extruded banana snack was processed using a laboratory-scale cooking extruder (model ZE 25x33D co-rotating twin-screw extruder, Hermann Berstorff, Germany) with a 25-mm-diameter barrel and 3-mm-diameter die. The temperature of barrel was set at 45°, 55°, 105°, 134°, 143°, 129°,

Maejo Int. J. Sci. Technol. 2015, 9(02), 265-277; doi: 10.14456/mijst.2015.19
268
and 120° C and the screw speed was 350 rpm. Samples of banana flour with 6.6% moisture were fed at a rate of 2.07 kg/hr with a feeding moisture rate of 2.65 kg/hr. Banana starch was prepared from Mali-ong pulp at green stage according to a water/alkaline extraction process as performed in our previous study [20].
Banana flour Banana starch Banana snack
Figure 2. Kluai Namwa products
Reagents and Chemicals Hydrolytic enzymes of pancreatic -amylase (Sigma-Aldrich, 23 IU/mg, EC 3.2.1.1), pepsin (Merck, 2000 FIP-U/g, EC 3.4.23.1), amyloglucosidase (Boehringer, EC 3.2.1.3), and a glucose oxidase/peroxidase kit (Sigma-Aldrich) were used for in vitro starch digestibility tests and glucose determination. Other chemical agents were of analytical grade (Merck). Nutritional Composition Banana pulp samples from three varieties of Kluai Namwa were analysed for moisture, protein, fat and ash using AOAC standard methods [21] and carbohydrate was calculated by the difference. The energy content was determined by multiplying the protein, fat and carbohydrate contents by the factors 4, 9 and 4 respectively and then totalling [21]. Soluble sugars were collected after protein precipitation and residue filtration, and then the glucose, fructose and sucrose contents were determined by liquid chromatography [22]. An HP 1100 chromatograph (Agilent Technol- ogies, Germany) was connected with a Prevail carbohydrate column (250 mm x 4.6 mm i.d., 5.0 µm) and an ELSD 2000 ES detector. The mobile phase was composed of acetonitrile-water (3:1) and the flow rate was 1 mL/min. The total dietary fibre (soluble + insoluble) was determined using the enzymatic gravimetric method [23]. The banana sample was subjected to sequential enzymatic digestion by heat-stable α-amylase, protease and amyloglucosidase to remove starch and protein. Filtration of the enzyme digestate and residue washings were done before calculation of the soluble and insoluble dietary fibre values. In Vitro Starch Digestibility Test In vitro starch digestibility was determined following the method of Goñi et al. [15] with slight modification. Blended banana pulp or ground sample of banana flour, starch or snack (50 mg) was mixed with 10 mL of HCl-KCl buffer (pH 1.5) in a tube. Then 0.2 mL of a solution containing pepsin (20 mg) was added and the tube was incubated for 60 min. in a shaking water bath at 40C. The volume of the mixture was made up to 25 mL by adding Tris–maleate buffer. Five mL of a Tris–maleate solution containing -amylase (3.3 IU) was then added and the mixture incubated at 37C to hydrolyse digestible starch. An aliquot sample (1 mL) was taken every 30 min. between 0-
Maejo Int. J. Sci. Technol. 2015, 9(02), 265-277; doi: 10.14456/mijst.2015.19
269
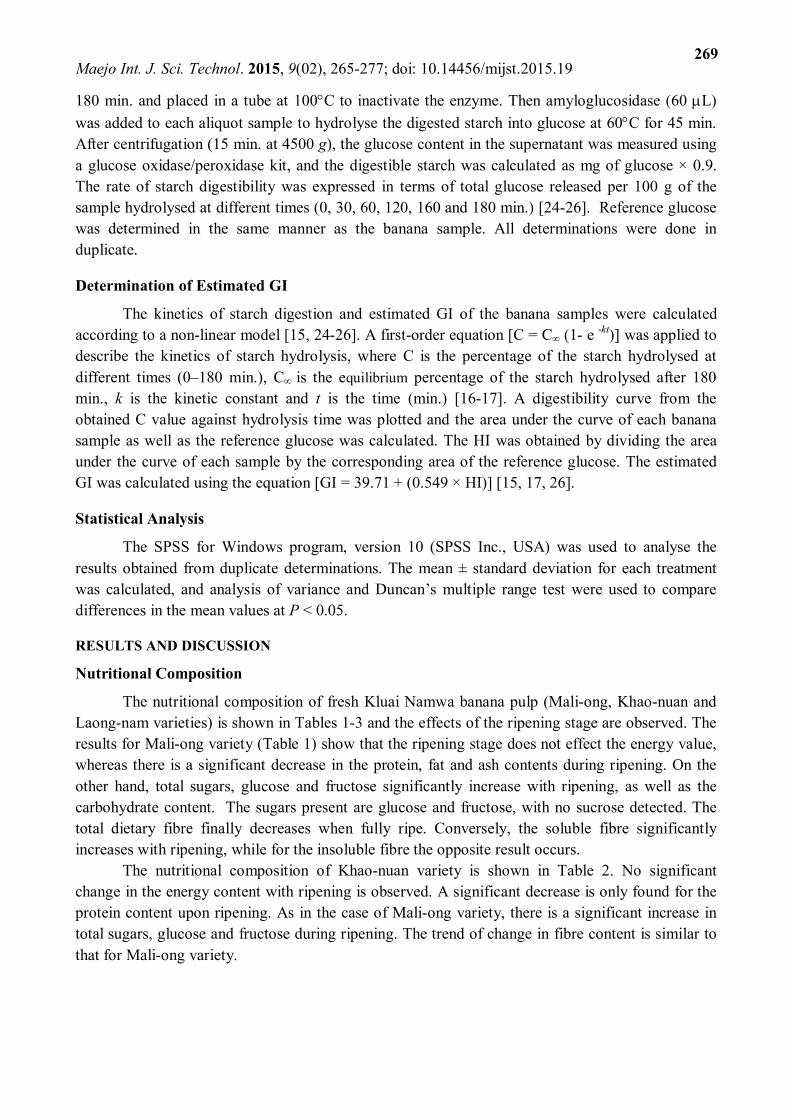
180 min. and placed in a tube at 100C to inactivate the enzyme. Then amyloglucosidase (60 L) was added to each aliquot sample to hydrolyse the digested starch into glucose at 60C for 45 min. After centrifugation (15 min. at 4500 g), the glucose content in the supernatant was measured using a glucose oxidase/peroxidase kit, and the digestible starch was calculated as mg of glucose × 0.9. The rate of starch digestibility was expressed in terms of total glucose released per 100 g of the sample hydrolysed at different times (0, 30, 60, 120, 160 and 180 min.) [24-26]. Reference glucose was determined in the same manner as the banana sample. All determinations were done in duplicate. Determination of Estimated GI The kinetics of starch digestion and estimated GI of the banana samples were calculated according to a non-linear model [15, 24-26]. A first-order equation [C = C∞ (1- e -kt)] was applied to describe the kinetics of starch hydrolysis, where C is the percentage of the starch hydrolysed at different times (0–180 min.), C∞ is the equilibrium percentage of the starch hydrolysed after 180 min., k is the kinetic constant and t is the time (min.) [16-17]. A digestibility curve from the obtained C value against hydrolysis time was plotted and the area under the curve of each banana sample as well as the reference glucose was calculated. The HI was obtained by dividing the area under the curve of each sample by the corresponding area of the reference glucose. The estimated GI was calculated using the equation [GI = 39.71 + (0.549 × HI)] [15, 17, 26]. Statistical Analysis The SPSS for Windows program, version 10 (SPSS Inc., USA) was used to analyse the results obtained from duplicate determinations. The mean ± standard deviation for each treatment was calculated, and analysis of variance and Duncan’s multiple range test were used to compare differences in the mean values at P < 0.05. RESULTS AND DISCUSSION Nutritional Composition The nutritional composition of fresh Kluai Namwa banana pulp (Mali-ong, Khao-nuan and Laong-nam varieties) is shown in Tables 1-3 and the effects of the ripening stage are observed. The results for Mali-ong variety (Table 1) show that the ripening stage does not effect the energy value, whereas there is a significant decrease in the protein, fat and ash contents during ripening. On the other hand, total sugars, glucose and fructose significantly increase with ripening, as well as the carbohydrate content. The sugars present are glucose and fructose, with no sucrose detected. The total dietary fibre finally decreases when fully ripe. Conversely, the soluble fibre significantly increases with ripening, while for the insoluble fibre the opposite result occurs.
The nutritional composition of Khao-nuan variety is shown in Table 2. No significant change in the energy content with ripening is observed. A significant decrease is only found for the protein content upon ripening. As in the case of Mali-ong variety, there is a significant increase in total sugars, glucose and fructose during ripening. The trend of change in fibre content is similar to that for Mali-ong variety.
Maejo Int. J. Sci. Technol. 2015, 9(02), 265-277; doi: 10.14456/mijst.2015.19
270
Table 1. Energy, nutritional composition and moisture content of Kluai Namwa (Mali-ong variety)
Ripening stage
Green Green-to-yellow Yellow
Energy, kcal 392.61 ± 0.75 392.92 ± 0.01 393.19 ± 0.34 Protein 1.14 ± 0.01 a 0.98 ± 0.02 b 0.50 ± 0.00 c
Fat 0.98 ± 0.30 a 0.85 ± 0.03 b 0.79 ± 0.01 b Ash 3.07 ± 0.15 a 2.83 ± 0.01 ab 2.70 ± 0.12 b Carbohydrate 94.81 ± 0.12 a 95.34 ± 0.06 b 96.01 ± 0.14 c Total Sugar 3.49 ± 0.02 a 16.32 ± 0.22 b 55.63 ± 2.76 c Glucose 1.65 ± 0.02 a 7.44 ± 0.17 b 26.56 ± 1.13 c Fructose 1.85 ± 0.00 a 8.88 ± 0.05 b 29.07 ± 1.64 c Sucrose, 0.00 0.00 0.00 Total dietary fibre 10.39 ± 0.01 a 11.23 ± 0.21 a 7.98 ± 0.63 b Soluble fibre 1.33 ± 0.04 a 1.92 ± 0.22 b 2.13 ± 0.20 b Insoluble fibre 5.12 ± 0.53 a 4.81 ± 0.12 a 3.63 ± 0.32 b Moisture, % 67.22 ± 0.45 67.47 ± 0.37 67.90 ± 0.06
Note: Nutritional content is in % of dry weight. Values are means of duplicate analysis. Mean values in a row not sharing a common superscript are significantly different at P < 0.05 by analysis of variance and Duncan’s multiple range test.
Table 2. Energy, nutritional composition and moisture content of Kluai Namwa (Khao-nuan variety)
Ripening stage Green Green-to-yellow Yellow
Energy, kcal 392.83 ± 0.34 392.98 ± 0.18 393.00 ± 0.54 Protein 5.56 ± 0.17 a 4.76 ± 0.14 b 4.73 ± 0.10 b Fat 0.42 ± 0.02 0.41 ± 0.04 0.35 ± 0.06 Ash 2.32 ± 0.06 2.26 ± 0.01 2.19 ± 0.06 Carbohydrate 91.71 ± 0.21 a 92.58 ± 0.09 b 92.73 ± 0.11 b Total Sugar 3.37 ± 0.03 a 25.79 ± 1.19 b 52.98 ± 0.22 c
Glucose 1.98 ± 0.01 a 16.37 ± 0.65 b 34.87 ± 0.26 c Fructose 1.27 ± 0.00 a 9.28 ± 0.54 b 17.95 ± 0.04 c Sucrose 0.12 ± 0.02 0.15 ± 0.00 0.15 ± 0.00 Total dietary fibre 10.39 ± 0.19 a 6.96 ± 0.44 c 9.21 ± 0.12 b Soluble fibre 0.76 ± 0.23 a 1.37 ± 0.01 a 2.25 ± 0.38 b Insoluble fibre 9.62 ± 0.04 a 5.60 ± 0.43 c 6.95 ± 0.26 b Moisture, % 63.10 ± 0.09 a 65.51 ± 0.14 b 67.05 ± 0.20 c
Note: Nutritional content is in % of dry weight. Values are means of duplicate analysis. Mean values in a row not sharing a common superscript are significantly different at P < 0.05 by analysis of variance and Duncan’s multiple range test.
Maejo Int. J. Sci. Technol. 2015, 9(02), 265-277; doi: 10.14456/mijst.2015.19
271
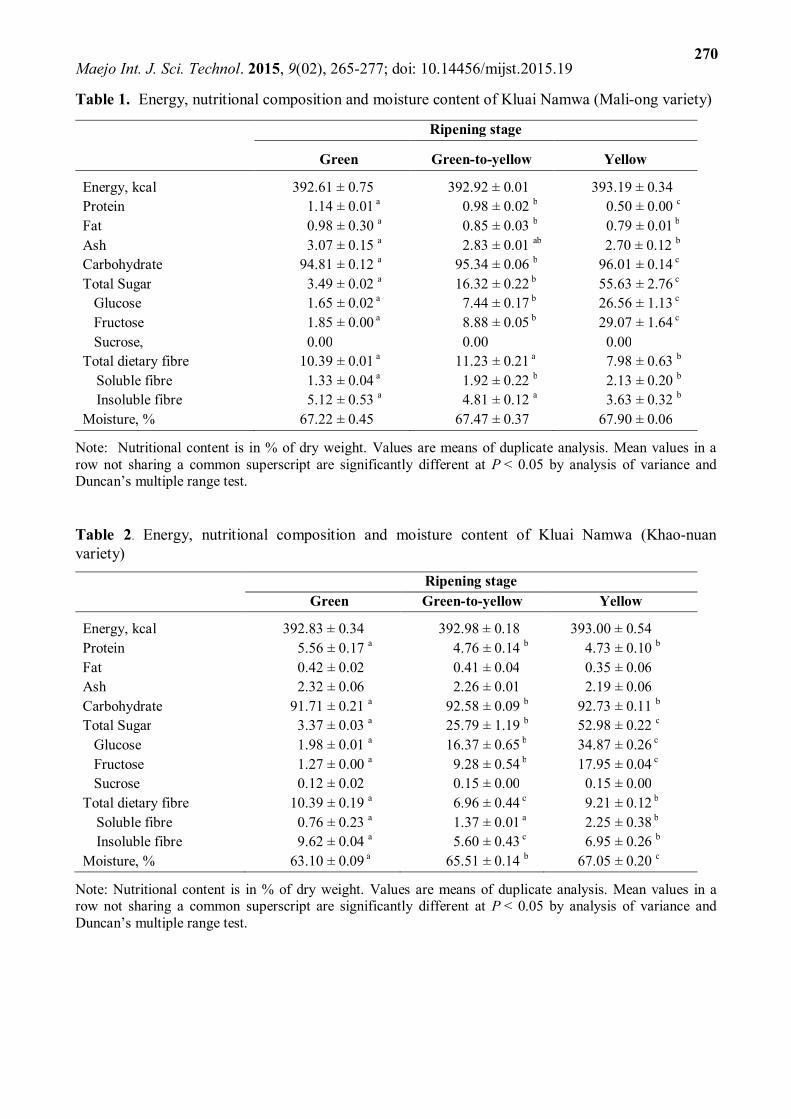
Table 3. Energy, nutritional composition and moisture content of Kluai Namwa (Laong-nam variety).
Ripening stage
Green Green-to-yellow Yellow
Energy, kcal 389.98 ± 0.47 389.29 ± 0.10 390.03 ± 0.16 Protein 1.85 ± 0.13 1.65 ± 0.07 1.91 ± 0.15 Fat 0.00 0.00 0.00 Ash 2.50 ± 0.12 2.68 ± 0.03 2.49 ± 0.04 Carbohydrate 95.65 ± 0.01 95.67 ± 0.09 95.60 ± 0.19 Total Sugar 1.37 ± 0.00 a 20.68 ± 1.08 b 41.61 ± 0.05 c Glucose 0.36 ± 0.00 a 10.79 ± 0.55 b 22.20 ± 0.01 c Fructose 1.01 ± 0.00 a 9.89 ± 0.53 b 19.41 ± 0.06 c Sucrose 0.00 0.00 0.00 Total dietary fibre 12.70 ± 0.04 a 11.47 ± 0.27 b 8.40 ± 0.24 c Soluble fibre 2.52 ± 0.11 2.36 ± 0.21 2.84 ± 0.23 Insoluble fibre 6.19 ± 0.13 a 2.30 ± 0.05 b 1.88 ± 0.11 c Moisture, % 66.46 ± 0.11 a 66.95 ± 0.04 b 68.32 ± 0.05 c
Note: Nutritional content is in % of dry weight. Values are means of duplicate analysis. Mean values in a row not sharing a common superscript are significantly different at P < 0.05 by analysis of variance and Duncan’s multiple range test. The trend in energy values for the Laong-nam variety (Table 3) is similar to those for the other varieties, while the ripening stage does not affect the protein, fat, ash and carbohydrate contents. As in other varieties, significant increase in total sugars, glucose and fructose with ripening is observed. The changes in total, soluble and insoluble dietary fibre contents of Laong-nam are also similar to those for the other varieties. A change in carbohydrates during ripening primarily involves available carbohydrates such as starch being converted into more soluble sugars such as glucose, fructose and sucrose, as well as water at the ripe stage [8]. A study on the occurrence and transformation of banana starch indicates that the disappearance of the starch reserve during banana ripening appears to be relatively rapid because several enzymes (e.g. α-and β- amylases, α-1,4- and α-1,6-glucosidase, invertase, sucrose synthase and sucrose phosphate synthase) as well as the gibberellin hormones act together via more than one pathway [8]. Likewise, the increased moisture and total sugars with ripening are found in this present study. Of the three varieties of Kluai Namwa at the ripe stage, Laong-nam has the lowest content of total sugar (41.61 ± 0.05 g/100g) and Mali-ong the highest (55.63 ± 2.76 g/100g). Mali-ong and Laong-nam contain glucose and fructose no sucrose. However, Cordenunsi et al. [27] reported that Nanicao (AAA) and Mysore (AAB) cultivars have a predominance of sucrose over glucose and fructose. This could be due to the activity of sucrose synthase and sucrose phosphate synthase which are involved in starch synthesis and breakdown during development and ripening of the banana fruit [28], which in turn might stem from the difference in genotype from Kluai Namwa variety (ABB genome), as well as in the planting location and environmental effects. Some studies have shown that people on diets high in dietary fibre have reduced risks of certain diseases such as cancer, coronary heart disease, obesity and possibly diabetes [29-30]. Dietary fibre consists of non-available carbohydrates or non-starch polysaccharides resistant to digestion by human gastrointestinal enzymes. Soluble fibre can also reduce blood cholesterol levels,

Maejo Int. J. Sci. Technol. 2015, 9(02), 265-277; doi: 10.14456/mijst.2015.19
272
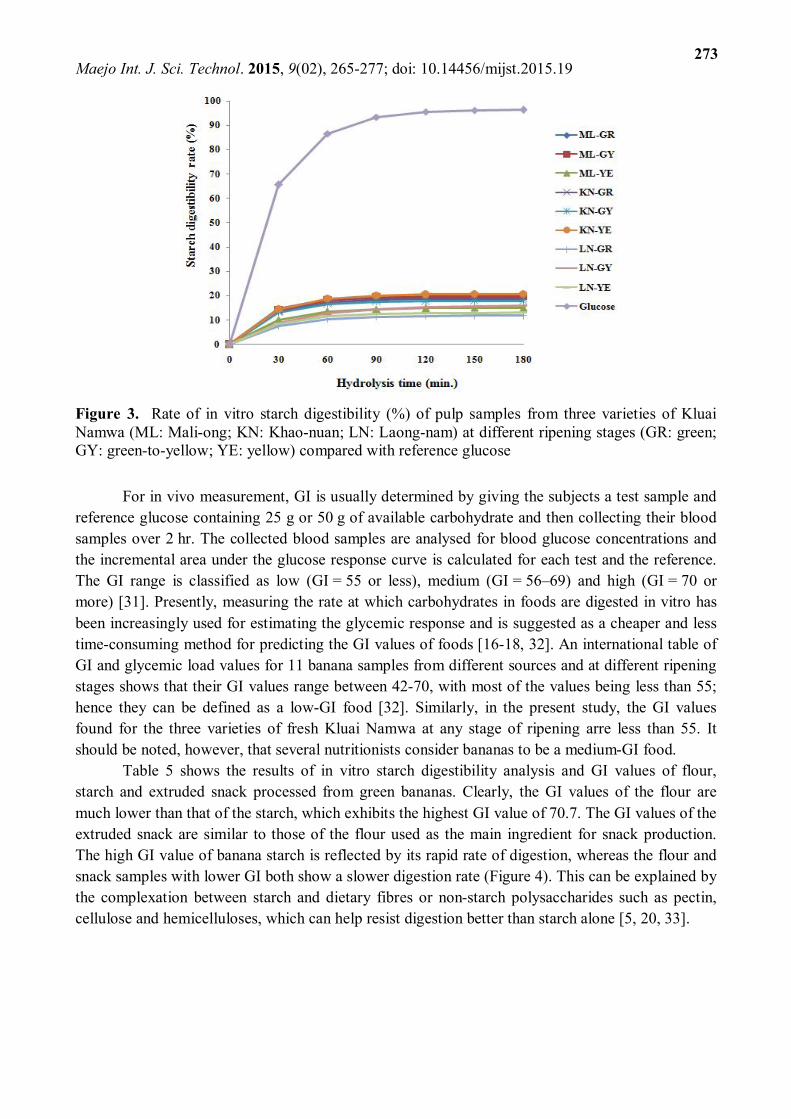
thus helping to reduce the risk of heart disease [29]. Pectin is the most common soluble fraction in ripe bananas [5]. Ripe Kluai Namwa contains a higher level of soluble fibre compared with green ones. The total dietary fibre content found in this study confirms that the three banana varieties are a good source of dietary fibre, in accordance with the findings of Cordenunsi et al. [27]. In Vitro Starch Digestibility and Estimated GI The results of in vitro starch digestibility from the starch hydrolysis model of the three varieties of fresh Kluai Namwa were shown in Table 4. Mali-ong at the ripe stage has significantly lowest GI when compared with the other stages while Khao-nuan and Laong-nam show an opposite result. This seems to indicate that the ripening stage has no effect on GI values of the bananas, although when the three varieties are compared, Laong-nam exhibits the lowest value of 46.4 ± 0.1. Figure 3 shows starch hydrolysis curves of the pulp samples at different ripening stages as compared with the reference glucose. The curves exhibit similar kinetics of starch hydrolysis among the different varieties and ripening stages, although the curve of Laong-nam variety at the green stage appears to show the slowest starch digestion. These findings confirm that bananas have a high level of resistant starch, which accounts for a slow rate of starch digestibility.
Table 4. Equilibrium concentration (C∞), kinetic constant (k), hydrolysis index (HI) and estimated glycemic index (GI) of pulp samples from three varieties of Kluai Namwa at different ripening stages
Sample C∞ k HI Estimated GI
Mali-ong Green 19.5 ± 0.1bc 0.043 21.1 ± 0.3 b 51.3 ± 0.2b Green-to-yellow 19.7 ± 0.1 bc 0.041 21.2 ± 0.2 b 51.3 ± 0.1b Ripe 14.9 ± 0.2 d 0.037 15.8 ± 0.2e 48.4 ± 0.1e Khao-nuan Green 18.8 ± 0.2 bc 0.041 20.2 ± 0.1c 50.8 ± 0.0c Green-to-yellow 18.1 ± 0.4 c 0.039 19.3 ± 0.2d 50.3 ± 0.1d Ripe 20.2 ± 0.5 b 0.039 21.6 ± 0.8 b 51.6 ± 0.4b Laong-nam Green 11.6 ± 0.3e 0.035 12.2 ± 0.2g 46.4 ± 0.1g Green-to-yellow 15.7 ± 0.4d 0.027 15.7 ± 0.2e 48.3 ± 0.1e Ripe 12.6 ± 1.0e 0.038 13.4 ± 0.4f 47.1 ± 0.2f Reference glucose 98.2 ± 2.4 a 0.031 100 ± 0.0a 94.6 ± 0.0a
Note: Values are means of duplicate analysis. Mean values in a column not sharing a common superscript are significantly different at P < 0.05 by analysis of variance and Duncan’s multiple range test.
Maejo Int. J. Sci. Technol. 2015, 9(02), 265-277; doi: 10.14456/mijst.2015.19
273
Figure 3. Rate of in vitro starch digestibility (%) of pulp samples from three varieties of Kluai Namwa (ML: Mali-ong; KN: Khao-nuan; LN: Laong-nam) at different ripening stages (GR: green; GY: green-to-yellow; YE: yellow) compared with reference glucose
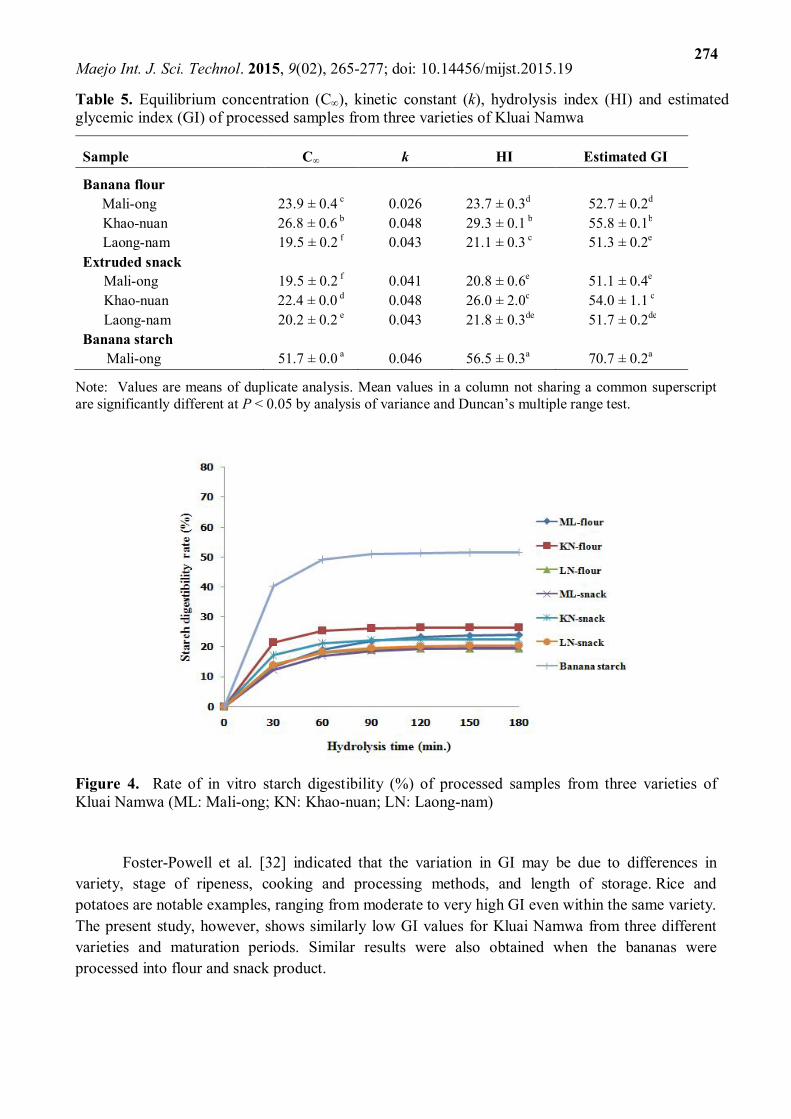
For in vivo measurement, GI is usually determined by giving the subjects a test sample and reference glucose containing 25 g or 50 g of available carbohydrate and then collecting their blood samples over 2 hr. The collected blood samples are analysed for blood glucose concentrations and the incremental area under the glucose response curve is calculated for each test and the reference. The GI range is classified as low (GI = 55 or less), medium (GI = 56–69) and high (GI = 70 or more) [31]. Presently, measuring the rate at which carbohydrates in foods are digested in vitro has been increasingly used for estimating the glycemic response and is suggested as a cheaper and less time-consuming method for predicting the GI values of foods [16-18, 32]. An international table of GI and glycemic load values for 11 banana samples from different sources and at different ripening stages shows that their GI values range between 42-70, with most of the values being less than 55; hence they can be defined as a low-GI food [32]. Similarly, in the present study, the GI values found for the three varieties of fresh Kluai Namwa at any stage of ripening arre less than 55. It should be noted, however, that several nutritionists consider bananas to be a medium-GI food. Table 5 shows the results of in vitro starch digestibility analysis and GI values of flour, starch and extruded snack processed from green bananas. Clearly, the GI values of the flour are much lower than that of the starch, which exhibits the highest GI value of 70.7. The GI values of the extruded snack are similar to those of the flour used as the main ingredient for snack production. The high GI value of banana starch is reflected by its rapid rate of digestion, whereas the flour and snack samples with lower GI both show a slower digestion rate (Figure 4). This can be explained by the complexation between starch and dietary fibres or non-starch polysaccharides such as pectin, cellulose and hemicelluloses, which can help resist digestion better than starch alone [5, 20, 33].
Maejo Int. J. Sci. Technol. 2015, 9(02), 265-277; doi: 10.14456/mijst.2015.19
274
Table 5. Equilibrium concentration (C∞), kinetic constant (k), hydrolysis index (HI) and estimated glycemic index (GI) of processed samples from three varieties of Kluai Namwa
Sample C∞ k HI Estimated GI
Banana flour Mali-ong 23.9 ± 0.4 c 0.026 23.7 ± 0.3d 52.7 ± 0.2d Khao-nuan 26.8 ± 0.6 b 0.048 29.3 ± 0.1 b 55.8 ± 0.1b Laong-nam 19.5 ± 0.2 f 0.043 21.1 ± 0.3 c 51.3 ± 0.2e Extruded snack Mali-ong 19.5 ± 0.2 f 0.041 20.8 ± 0.6e 51.1 ± 0.4e Khao-nuan 22.4 ± 0.0 d 0.048 26.0 ± 2.0c 54.0 ± 1.1 c Laong-nam 20.2 ± 0.2 e 0.043 21.8 ± 0.3de 51.7 ± 0.2de Banana starch Mali-ong 51.7 ± 0.0 a 0.046 56.5 ± 0.3a 70.7 ± 0.2a
Note: Values are means of duplicate analysis. Mean values in a column not sharing a common superscript are significantly different at P < 0.05 by analysis of variance and Duncan’s multiple range test.
Figure 4. Rate of in vitro starch digestibility (%) of processed samples from three varieties of Kluai Namwa (ML: Mali-ong; KN: Khao-nuan; LN: Laong-nam)
Foster-Powell et al. [32] indicated that the variation in GI may be due to differences in variety, stage of ripeness, cooking and processing methods, and length of storage. Rice and potatoes are notable examples, ranging from moderate to very high GI even within the same variety. The present study, however, shows similarly low GI values for Kluai Namwa from three different varieties and maturation periods. Similar results were also obtained when the bananas were processed into flour and snack product.

Maejo Int. J. Sci. Technol. 2015, 9(02), 265-277; doi: 10.14456/mijst.2015.19
275
CONCLUSIONS Starch in Kluai Namwa banana is degraded during ripening almost entirely into soluble sugars, viz. glucose and fructose. The total dietary fibre decreases with ripening while soluble fibre content increases. The Laong-nam variety has the lowest energy (390.03 ± 0.16 kcal/100g), the lowest total sugar (41.61 ± 0.05 g/100g) and the highest soluble fibre (2.84 ± 0.23 g/100g) when ripe. The GI values of pulp samples from Kluai Namwa of all varieties are less than 55, the green Laong-nam variety exhibiting the lowest GI (46.4 ± 0.1). All fresh bananas, as well as the flour and extruded snack processed from green bananas, exhibit similar kinetics of slow starch digestion, with Laong-nam at the green stage showing the slowest rate of digestion. ACKNOWLEDGEMENTS The authors thank the National Research Council of Thailand for research funding and Kasetsart University for constant support. REFERENCES 1. N. Chomchaloa, “Words for Banana”, Thailand Network for the Conservation and Enhancement of Landraces of Cultivated Plants, Bangkok, 2008, pp.92-99 (In Thai). 2. S. Achavachajchuan and C. Maksumpun, “Thai Bananas”, Platapean Publishing, Bangkok, 2007, pp.6-24 (in Thai). 3. Editorial Board for Matichon Technology-ChaoBan, “Kluai Namwa for Thai Economic and Income Earning”, 2013, http://www.matichonbook.com/index.php/occupation/978-974-02- 1214-0.html (Accessed: January 2014) (In Thai). 4. N. Vatanasuchart, B. Niyomwit and W. Narasri, “Resistant starch, physicochemical and structural properties of bananas from different cultivars with an effect of ripening and processing”, Kasetsart J. Nat. Sci., 2012, 46, 461-472. 5. X. Duan, G. Cheng, E. Yang, C. Yi, N. Ruenroengklin, W. Lu, Y. Luo and Y. Jiang, “Modification of pectin polysaccharides during ripening of postharvest banana fruit”, Food Chem., 2008, 111, 144-149. 6. G. Aurore, B. Parfait and L. Fahrasmane, “Bananas, raw materials for making processed food products”, Trends Food Sci. Technol., 2009, 20, 78-91. 7. N. Faisant, A. Buléon, P. Colonna, C. Molis, S. Lartigue, J. P. Galmiche and M. Champ, “Digestion of raw banana starch in the small intestine of healthy humans: Structural features of resistant starch”, Br. J. Nutr., 1995, 73, 111-123. 8. P. Zhang, R. L. Whistler, J. N. BeMiller and B. R. Hamaker, “Banana starch: Production, physicochemical properties, and digestibility__A review”, Carbohydr. Polym., 2005, 59, 443-458. 9. U. Lehmann and F. Robin, “Slowly digestible starch – its structure and health implications: A review”, Trends Food Sci. Technol., 2007, 18, 346-355. 10. P. Zhang and B. R. Hamaker, “Banana starch structure and digestibility”, Carbohydr. Polym., 2012, 87, 1552-1558. 11. R. L. Whistler and J. R. Daniel, “Molecular structure of starch”, in “Starch: Chemistry and Technology”, 2nd Edn. (Ed. R. L. Whistler, J. N. BeMiller and E. F. Paschall), Academic Press, Orlando (FL), 1984, pp.153-182.
Maejo Int. J. Sci. Technol. 2015, 9(02), 265-277; doi: 10.14456/mijst.2015.19
276
12. D. J. Jenkins, C. W. Kendall, L. S. Augustin, S. Franceschi, M. Hamidi, A. Marchie, A. L. Jenkins and M. Axelsen, “Glycemic index: Overview of implications in health and disease”, Am. J. Clin. Nutr., 2002, 76, 266S-273S. 13. H. N. Englyst, J. Veenstra and G. J. Hudson, “Measurement of rapidly available glucose (RAG) in plant foods: A potential in vitro predictor of the glycaemic response”, Br. J. Nutr., 1996, 75, 327-337. 14. K. N. Englyst, H. N. Englyst, G. J. Hudson, T. J. Cole and J. H. Cummings, “Rapidly available
glucose in foods: An in vitro measurement that reflects the glycemic response”, Am. J. Clin. Nutr., 1999, 69, 448-454.
15. I. Goñi, A. Garcia-Alonso and F. Saura-Calixto, “A starch hydrolysis procedure to estimate glycemic index”, Nutr. Res., 1997, 17, 427-437. 16. M. Frei, P. Siddhuraju and K. Becker, “Studies on the in vitro starch digestibility and the
glycemic index of six different indigenous rice cultivars from the Philippines”, Food Chem., 2003, 83, 395-402.
17. P. Hu, H. Zhao, Z. Duan, Z. Linlin and D. Wu, “Starch digestibility and the estimated glycemic score of different types of rice differing in amylose contents”, J. Cereal Sci., 2004, 40, 231-237. 18. M. Swieca, B. Baraniak and U. Gawlik-Dziki, “In vitro digestibility and starch content, predicted glycemic index and potential in vitro antidiabetic effect of lentil sprouts obtained by different germination techniques”, Food Chem., 2013, 138, 1414-1420. 19. Anonymous, “Banana: Thai fruit that should be rapidly developed for industrial products”, 2009, http://positioningmag.com/prnews/prnews.aspx?id=82319 (Accessed: January 2014). 20. N. Vatanasuchart, B. Niyomwit and K. Wongkrajang, “Resistant starch content, in vitro starch digestibility and physico-chemical properties of flour and starch from Thai bananas”, Maejo Int. J. Sci. Technol., 2012, 6, 259-271. 21. W. Horwitz (Ed.), “Official Methods of Analysis of AOAC International”, 17th Edn., AOAC International, Gaithersburg (MD), 2000, Methods 925.45, 938.08, 989.05 and 992.23. 22. W. Horwitz (Ed.), “Official Methods of Analysis of AOAC International”, 18th Edn., AOAC International, Gaithersburg (MD), 2006, Ch.33. 23. G. W. Latimer (Ed.), “Official Methods of Analysis of AOAC International”, 19th Edn., AOAC International, Gaithersburg (MD), 2012, Ch.45. 24. Y. Granfeldt, I. Björck, A. Drews and J. Tovar, “An in vitro procedure based on chewing to predict metabolic response to starch in cereal and legume products”, Eur. J. Clin. Nutr., 1992, 46, 649-660. 25. K. S. Sandhu and S. T. Lim, “Digestibility of legume starches as influenced by their physical and structural properties”, Carbohydr. Polym., 2008, 71, 245-252. 26. K. Srikaeo and J. Sangkhiaw, “Effects of amylose and resistant starch on glycaemic index of rice noodles”, LWT - Food Sci. Technol., 2014, 59, 1129-1135. 27. B. R. Cordenunsi, T. M. Shiga and F. Lajolo, “Non-starch polysaccharide composition of two cultivars of banana (Musa acuminata L.: cvs. Mysore and Nanicão)”, Carbohydr. Polym., 2008, 71, 26-31. 28. J. R. O. do Nascimento, B. R. Cordenunsi and F. Lajolo, “Sucrose synthase activity and expression during development and ripening in bananas”, J. Plant Physiol., 2000, 156, 605- 611.

Maejo Int. J. Sci. Technol. 2015, 9(02), 265-277; doi: 10.14456/mijst.2015.19
277
29. J. L. Buttriss and C. S. Stokes, “Dietary fibre and health: An overview”, Nutr. Bull., 2008, 33, 186-200. 30. L. M.. Ohr, “Fortifying with fiber”, Food Technol. Aust., 2004, 58, 71-75. 31. J. C. Brand-Miller, K. Stockmann, F. Atkinson, P. Petocz and G. Denyer, “Glycemic index, postprandial glycemia, and the shape of the curve in healthy subjects: Analysis of a database of more than 1,000 foods”, Am. J. Clin. Nutr., 2009, 89, 97-105. 32. K. Foster-Powell, S. H. Holt and J. C. Brand-Miller, “International table of glycemic index and
glycemic load values: 2002”, Am. J. Clin. Nutr., 2002, 76, 5-56. 33. R. V. da Mota, F. M. Lajolo, B. R. Cordenunsi and C. Ciacco “Composition and functional properties of banana flour from different varieties”, Starch/Stärke, 2000, 52, 63-68.
© 2015 by Maejo University, San Sai, Chiang Mai, 50290 Thailand. Reproduction is permitted for
noncommercial purposes.