magnetic induction plasma engine - nasa · nasa cr-54762 i ir i 1 final report magnetic induction...
TRANSCRIPT
. '
NASA CR-54762
1 '
!
ff 663 July 66 . MAGNETIC INDUCTION PLASMA ENGINE
BY
Lee Heflinger, Stuart Ridgway, and Allan Schaffer I
t b
I
ITHRU) ,
F (PAGES) 2 <
CCATEGORY)
P,E- 5 4 I b D (NASXCR OR TMTOR AD NUMBER)
' -
prepared for
NATIONAL AERONAUTICS AND SPACE ADMINISTRATION
CONTRACT NAS 3-5912
GENERAL TECHNOLOGY CORPORATION 96 10 Bellanca Avenue
Loe Angeles, California
. .
https://ntrs.nasa.gov/search.jsp?R=19670003864 2018-07-16T03:10:24+00:00Z

N O T I C E
This report was prepared a s an account of Government sponsored work. Neither the United States, nor the National Aeronautics and Space Administration (NASA), nor any person acting on behalf of NASA:
A. ) Makes any warranty or representation, expressed or implied, with respect to the accuracy, completeness, or usefulness of the information contained in this report , o r that the use of any information, apparatus, method, or process disclosed in this report may not infringe privately owned rights; o r
B.) Assumes any liabilities with respect to the use of, o r fo r damages resulting from the use of any information, apparatus, method or process disclosed in this report.
As used above, "person acting on behalf of NASA" includes any employee or contractor of NASA, or employee of such contractor, to the extent that such employee or contractor of NASA, o r employee of such contractor prepares, disseminates, or provides access to, any information pursuant to his employment or contract with NASA, or his employment with such contractor.
Requests f o r copies of this report should be referred to
National Aeronautics and Space Administration Office of Scientific and Technical Information Attention: A F S S -A Washington, D. C. 20546

NASA CR-54762 I
I r
I
1
FINAL REPORT
MAGNETIC INDUCTION PLASMA ENGINE
BY
Lee Heflinger, Stuart Ridgway, and Allan Schaffer
prepared for
NATIONAL AERONAUTICS AND SPACE ADMINISTRATION
April 5, 1965
CONTRACT NAS 3-5912
Technical Management NASA Lewis Research Center
Cleveland, Ohio Spacecraft Technology Division
H. G. Kosmahl
GENERAL TECHNOLOGY CORPORATION 96 10 Bellanca Avenue
Los Angeles, California
ABSTRACT
J
b'
This report describes work performed at General Tech-
nology Corporation under NASA Contract NAS-3-5912, which covers
the final phase in a magnetic induction plasma accelerator develop-
ment program.
develop an engine that accelerated a plasma to a velocity correspond-
ing to a specific impulse of 3000 seconds, o r more, with good efficiency.
Good accelerative coupling had been demonstrated in the previous work
between helium plasma and a traveling t ransverse 450 gauss magnetic
field, but with excessive wall interaction. The wall interaction was
not significantly reduced by the changes in magnetic field geometry
investigated.
improvement by shortening the accelerator.
The aim of this development program has been to
A theoretical study of the interaction suggests potential
/WWR
ii

a
ACKNOWLEDGEMENTS
The authors wish to acknowledge the meticulous efforts of
Richard Robbins who constructed all the equipment used in this
experiment and aided in taking the data, and the assistance of
Louis Bianchi during the final phases of the project.
iii
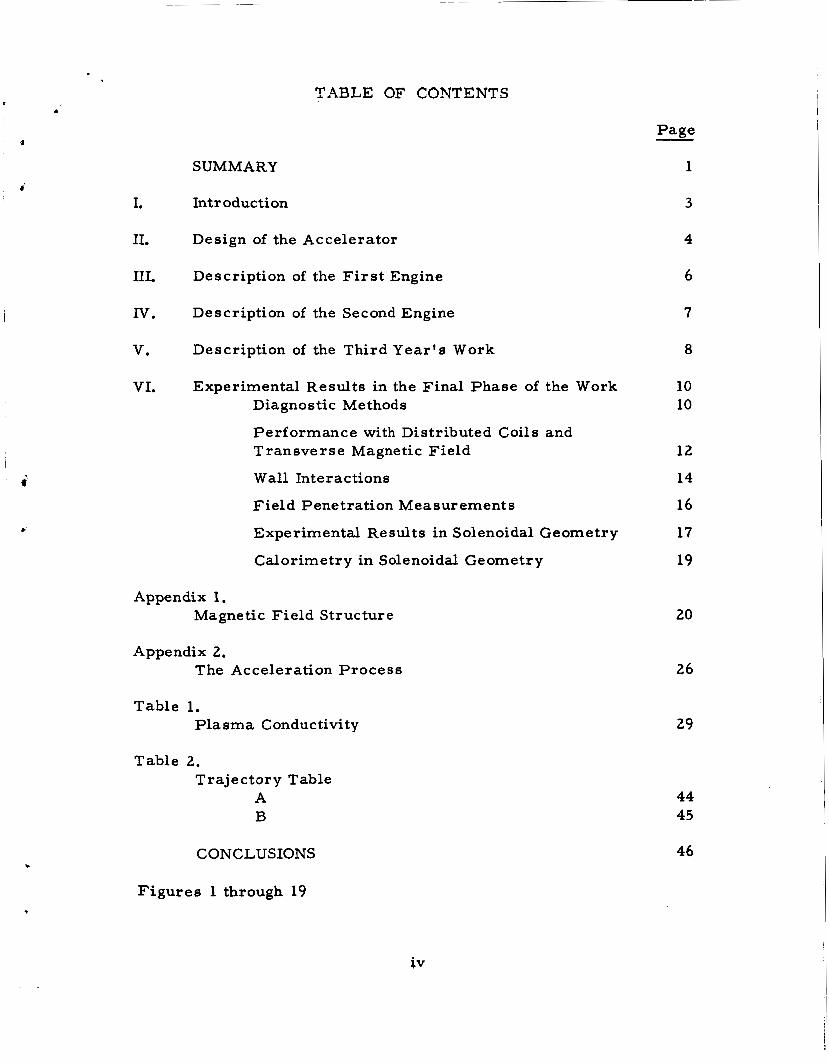
TABLE OF CONTENTS i .
1
i I.
11.
111.
Iv.
V.
VI.
l i
e
SUMMARY
Introduction
Design of the Accelerator
Description of the First Engine
Description of the Second Engine
Description of the Third Year 's Work
Experimental Results in the Final Phase of the Work Diagnostic Methods
Performance with Distributed Coils and T ran sve r s e Magnetic Field
W a l l Interactions
Field Penetration Measurements
Experimental Results in Solenoidal Geometry
Calorimetry in Solenoidal Geometry
Appendix 1. Magnetic Field Structure
Appendix 2. The Acceleration Process
Table 1. Plasma Conductivity
Table 2. Trajectory Table
A B
Page
1
3
4
6
7
8
10 10
-
12
14
16
17
19
20
26
29
44 45
CONCLUSIONS 46
Figures 1 through 19
iv

LIST OF FIGURES
*
Figure
1. Specific impulse a s a function of value plenum pressure for various propellants and transverse magnetic field.
2. Specific impulse a s a function of mass loading for various propellants and transverse magnetic field.
3. Specific impulse as a function of the reciprocal of the mass loading for various propellants and transverse magnetic field.
4. Total and kinetic energy a s a function of m a s s loading for various propellants and transverse magnetic field.
5. Calorimetric results for helium and t ransverse mangetic field.
6. Distribution of heat transfer to propulsion tube walls for transverse magnetic field. Helium a t 15 and 25 to r r valve plenum pressure.
7. Distribution of heat transfer to propulsion tube walls for transverse magnetic field. Helium a t 30 and 50 to r r valve plenum pressure.
8. Penetration of transverse magnetic field into plasma.
9. Specific impulse for various propellants and cylindrically symmetric magnetic field.
10. Kinetic energy and total energy as a function of mass loading for various propellants and cylindrically symmetric magnetic field.
11. Distribution of heat loss to propulsion tube wall a t 30 tor r helium valve plenum pressure for cylindrically symmetric magnetic field.
12. Distribution of heat loss to propulsion tube wall a t 50 tor r helium valve plenum pressure for cylindrically symmetric magnetic field.
13. Electrical conductivity of helium plasma as function of the internal energy for pressures typical of the plasma accelerator.
14. Trajectories in the t, z plane for two fluid elements.
V

I 15. Plasma velocity as a function of the phase of the plasma element relative to the moving magnetic field.
16. Plasma velocity a s a function of distance down the accelerator tube.
17. The final phase of a plasma element relative to the moving magnetic field a s a function of the starting phase. transverse direction defocusing region is shown.
Phase compression into a
18. Computed motion of the plasma perpendicular to the direction of acceleration. field.
Displacement as a function of phase relative to the
19. Computed motion of the plasma perpendicular to the direction of acceleration. propulsion tube.
Displacement as a function of distance down the
vi

P a g e 1
SUMMARY
At the conclusion of the previous years work good acceler-
ative coupling had been demonstrated to a helium plasma, with specific
impulses of 6000 seconds observed, and thrusts of the order of several
newtons under pulsed conditions. However 5070 of the energy and momen-
tum transferred to the plasma was found to be lost at the walls of the
propulsion tube.
The motivating force that directed the efforts of the final
phase of the work was to understand the wall interactions, and hope-
fully to mitigate them.
of the magnetic field.
drive coils that formed the magnetic field by a set of coils in which adja-
cent coils overlapped.
median plane of the apparatus, but a t the pole tips the field was oscillating
in time and stationary in space.
netic field throughout the volume of the accelerator tube.
improvement in the reduction of the wall interactions was not forthcoming,
although there was a significant improvement in thrust .
Two modifications were made in the geometry
The f i rs t was to replace the system of individual
The original method gave a moving field on the
The revised method gave a moving mag-
The anticipated
In the t ransverse geometry for helium a maximum specific
impulse of 7500 seconds was observed at a centerline magnetic field of
780 gauss, and a mass loading of 5 x 10 kg. Data for helium, nitrogen,
and argon at centerline magnetic fields of 540 gauss gave a specific im- 8
pulse that reached a maximum of 6400 seconds for helium at the 5 x 10 kg m a s s loading, and decreased with increasing mass loading for helium, and
the other gases.
function of mass loading independent of the gas chosen.
of transfer efficiency were 5070, and of calorimeteric efficiency were also
5070.
-8
The data was consistant with specific impulse being a unique
Typical good values
At the higher mass loadings the thrust reached 4.5 newtons.
The other geometrical variation t r ied was a change to cylin-
A sequence of four coils with their axis drically symmetric geometry.
coincident with the axis of the propulsion tube was used.
ment the acceleration comes from the radial component of the magnetic
field, and it is hoped that the longitudinal component of field will give
In this arrange-
Page 2
some containment of the plasma.
and in general is appreciably smaller than the fields available in the
transverse geometry, and one therefore expects poorer accelerative
coupling to the plasma.
The radial field i s zero on the axis,
These expectations were borne out.
For helium in the best case the portion of energy absorbed
by the plasma that appeared as directed kinetic energy was about one
third, while two thirds appeared a s heat. There was also somewhat bet-
ter isolation of the plasma from the wall, for about two thirds the
energy was in the exhaust, and one third went to the tube walls a s heat.
The best transfer efficiency was 28%. was 4200 seconds.
The maximum specific impulse
An analytical discussion of the acceleration process, and of
the motion of the plasma in a direction perpendicular to the acceleration
direction i s conducted in Appendix 2. It gives some indication that there
might exist a regime of operation that would give good acceleration with-
out wall interaction.
analysis with the help of more powerful computing methods, and
experimentally tes t the more promising configurations.
A future program might profitably extend the

Page 3
I. Introduction
The ships man lifts off his planet to explore the void,
earth’s satellites, and tEe other planets must be propelled by the r ea r -
ward ejection of mass.
and its necessity limits the useful loads and the possible destinations
of space ships.
fuels used both as the ejected mass and the source of energy. A
quality measure for a space propulsion system i s the specific impulse, the thrust available per unit mass expenditure rate, usually expressed
in seconds. Present chemical propellants a r e capable of 300 seconds,
but many interesting missions could well use a specific impulse ten
times a s great.
This burden must be carr ied from the s tar t ,
His present attainments have been made with chemical
To the question - does the vast store of energy in the
nucleus hold the key to the desired far ranging engines - we must
recognize two partial answers. If thermal forces a r e used to acceler-
ate the propellant, a specific impulse of perhaps 1000 seconds is avail-
able.
may be had, but with the limitation of low thrust.
propulsion system envisages nuclear energy transformed to electrical
energy, and the electrical energy used to accelerate the propellant
to a useful velocity.
If electrical forces a re used, then very high specific impulses
An electrical
The electrical acceleration may use either electrostatic
or electro magnetic forces.
reasonable impulse but suffers from very low thrust.
engine promises a much higher thrust (although sti l l small compared to
chemical rockets), and some forms avoid the use of electrodes that
may erode and waste away in the course of a long mission.
The first gives good efficiency and
The magnetic
The object of the presently reported development program
was to develop an engine that provided a specific impulse in the range
of 2000 - 10,000 seconds with good electrical efficiency and mass
utilization using electromagnetic forces for propellant acceleration.
Page 4
11. Design of the Accelerator
I ?
A desirable accelerator would have the characterist ics of
hight thrust, low erosion of walls, high electrical efficiency, suitable
specific impulse, desirable propellant, high mass utilization, and a
power demand within the capabilities of projected space nuclear power
plants. To orient oneself to the magnitudes of the essential quantities,
let us apply some elementary analysis to an ideal accelerator that de-
l ivers one-half kilogram force (4.9 newtons) of thrust at a specific im-
pulse of 3000 seconds. = 1.66
x 10 -4 kilogram/second. The velocity of the accelerate *ass i s
9 . 8 meters/seconds, or 29,400 meters/second.
beam i s 1/2 m v2 = 1.43 x 10
with a specific power of 0 . 1 kw/kg, thus weighing 1430 kg, and assign equal
masses for the propellant, the structure and the payload. The initial accel-
eration of the 4290 kilogram vehicle would be 1. 17 x
duration of powered flight would be 8.6 x 10
and the total velocity change in field f ree space would be 29,400 ln 3 /2
or 11,900 meters/second, sufficient for many interesting missions that
would s ta r t from earth's orbit.
The mass flow rate m would be
The kinetic energy rate in the 5 watts. Let us further imagine a nuclear plant
gravities. The 6 seconds, closely 100 days,
It i s not the purpose here to examine how this ideal performance
will be degraded a s realistic weights of power plants, attainable effici-
encies, and the consequences of maneuver in a gravitational field a r e
considered. We need only remark that at constant mass flow rate the
energy price of acceleration goes as the square of the exhaust velocity,
while the thrust i s only linear with velocity: in general there will be an
optimum specific impulse for missions that must be executed in a finite
t ime even if no limit i s placed on the total amount of energy available from
the power plant.
The velocity of the exhaust s t ream from an engine with a
specific impulse ten fold greater than that from a chemical rocket will
be ten times as great, and the energy density will be one hundred times
as great. It i s thus a challenge to the designer of such an accelerator
Page 5
to achieve such a high energy density.
solid
must fail.
the armature will volatilize it. The low mass flow ra te and the high
energy density lead to the conclusion that the propellant that is to be
accelerated will be a gas a t low density, ionized to provide electrical
conductivety, a plasma.
Any thoughts of accelerating
nonsuPerconducting macroscopic matter in some kind of motor
A dissipative loss of only 1% of the accelerating energy into
In this program it was decided to accelerate plasma with a
density of the order of 10 l6 particles/crn3 by means of a moving
transverse magnetic field.
the large thrusts available.
the resul t of two considerations.
conducting the exploration of the acceleration problem a t lower
densities.
i s so high that an electron will make many collisions in the t ime that
it would take i t to execute a cyclotron orbit in the magnetic field.
Thus the behavior of the plasma would be that of a continuous conducting
fluid, and the Hall effect would be negligible, that i s the current in the
plasma would be in the direction of the electric field vector. The t rans-
verse geometry of the magnetic field was chosen for its difference from
other efforts, and the expectation of strong coupling between the
magnetic field and the plasma.
The choice of magnetic forces is to gain
The choice of the density was made a s
The f i rs t i s that other programs were
The second is that at a high density the collision frequency
The acceleration method can be viewed in two ways. If
the conductivity of the plasma is very high and the magnetic pressure
is greater than the plasma pressure,then one may consider the moving
magnetic field a s an impenetrable piston that moves down the propul-
sion tube driving the plasma before it.
built may be interpreted fairly well on this model.
of view is to look a t the plasma a s the armature in an induction motor.
Currents a r e induced in it by the slip of the magnetic field past the
plasma.
accelerate it forward.
engine that was built and tested.
The behavior of the f i r s t engine
The second point
These currents give r i s e to J x B forces on the plasma that
This picture is more appropriate to the second

Page 6
111. Description of First Engine
The first engine built formed its moving magnetic field by
the ringing discharge of a group of capacitors.
rectangular loops of copper s t rap with holes through a pair of opposite
sides of the loop for the propulsion tube.
these coils in controlled sequence to give about a four cycle ringing
discharge.
pressures varying from 50 microns to 5000 microns.
to which the propellant was accelerated and other characterist ics of
the motion were determined by a fast rotating mi r ro r framing camera
that was developed for the purpose.
first years work with this engine were:
The coils were
Capacitors were fired through
The propellant was originally in the propulsion tube a t
The velocity
The prominent results of the
1. It i s possible to get good coupling to a plasma with a
transverse magnetic field and to accelerate it to a velocity
close to the phase velocity of the magnetic field.
2.
pressure be about equal to the plasma pressure.
For good coupling it was desirable that the magnetic
3. current in adjacent coils of 90".
Good acceleration required a relative phase of the
4. coils overlap to the extent that the maximum of the
magnetic field moved smoothly down the tube.
Good acceleration required that the fields of adjacent
5 . conditions as good acceleration.
Minimization of the wall interaction required the same
e
Page 7
N. Description of Second Engine
1
Since the first engine allowed no efficiency or thrust
measurements, the second stage engine was built to operate for 500
cycles of oscillation of the magnetic field.
with this engine.
All further work was done
It consisted of:
1. A megawatt oscillator at 480 kc.
2.
propellant for the 1.25 milliseconds of operation of the system.
A pulsed gas valve that would introduce a constant flow of
3.
controlled sequence.
Timing circuits to operate the oscillator and valve in
4. ment of back reaction.
A set of drive coils mounted on a pendulum for the measure-
5. A vacuum chamber for the engine to exhaust into.
6 . to the plasma.
Instrumentation to measure the electrical energy delivered
7.
appearing a t the wall and delivered to the vacuum chamber.
Calorimeters for the measurement of the plasma energy
The work of the second year consisted mainly in the design
and construction of this engine, and some preliminary tes ts . With the
oscillator it was possible to achieve moving magnetic fields that had a
peak value of 700 gauss on the axis. oscillator was 1.25 milliseconds, and the frequency was 480 kc, giving
a phase velocity of the magnetic field of about 54,800 meters/second.
It was possible to achieve a 90" phase relation between the currents
The time of operation of the
in adjacent coils, and this phase relation was not significantly perturbed
by the presence of plasma.

Page 8
V. Description of Third Year’s Work
?
i
With the apparatus essentially completed, the third year’s
work consisted in evaluating various propellants and conditions of
operation.
second.
attained.
the plasma with the walls of the propulsion tube were considerably
more severe than would have been anticipated from the f i r s t year’s
observations.
yielded the conclusions that of the energy absorbed by the plasma in
a favorable regime of operation, half went into the kinetic energy of
the plasma a s indicated by the electromagnetic back reaction, and the
other half appeared a s heat. Measurements were made of the energy
transfer to the propulsion tube walls, and to a copper bag calorimeter
into which the propulsion tube exhausted. Half the energy input to the
plasma appeared at the tube walls, and the other half appeared in the
bag calorimeter.
tion of these measurements is that these two energy t ransfers have the
same ratio of heat to kinetic energy, so one must conclude that half of
the kinetic energy given to the plasma i s lost at the walls of the propul-
sion tube.
propulsion tube with a moveable inner wall. This wall was suspended
a s a pendulum, and the drag forces exerted upon it were measured by
observing i ts deflections.
The best propellant was found to be helium, with nitrogen
Electromagnetic specific impulses of 6000 seconds were
During this work it became apparent that the interaction of
A combination of calorimetric and thrust measurements
The only thermodynamically reasonable interpreta-
This interpretation was verified by tes ts made using a
The loss of useful thrust, and the erosion of the walls
consequent A major effort of
the third year was to attempt to understand them and reduce them to
an acceptable value. The flow field of the plasma was explored with
small glass spherical pendulum bobs in the flow field whose quarter
cycle deflections were photographed. These measurements showed
that down the propulsion tube and Off the axis the flow was partly
outward to the wall.
magnetic forces .
upon such wall losses i s intolerable.
It seems clear that this flow is due to electro-
Gas pressure forces a r e insufficient to explain the
observed di-;ergencc of the no;.;.. A za?cu?ation of the -;;.a?! drag

Page 9
based on the laws of turbulent heat and momentum transfer also yields
a magnitude much too small to explain the observed results.
tailed results of these studies a r e reported in the annual report for the
third year.
The de-
Page 10
VI . Experimental Results in Final Phase of the Work.
I
I n this section we shall present the experimental results of
the concluding phases of the program.
accelerating magnetic field were investigated.
core with its windings on pole pieces was replaced with a set of four
coils on each side of the propulsion tube that were overlapped in such
a way a s to provide a field that translated uniformly down the propul-
sion tube a t the walls a s well a s in the center.
ation gave a running field at the center, but at the walls gave a field that
was a superposition of fields that were running in both directions.
construct a running field requires the overlapping of time periodic
fields of different phase.
for overlap at the walls of the tube a s well a s in the center.
field geometry tested was a running axially symmetric field that was
formed by winding the coils with their axes coincident with the propulsion
tube axis.
provided by the radial component of the field, which tends to be appreci-
ably smaller than the transverse fields available in the previouse case.
A large axial component of the magnetic field is present, and it is hoped
that this would restrain the plasma from the wall.
Two new geometries of the
In the f i r s t the ferr i te
The original configur-
To
The overlapping of the coil windings provided
The second
In this geometry the accelerative coupling to the plasma i s
Diagnostic Method
The quantities of interest for the evaluation of the performance
of the engine a r e the thrust, the mass utilized, the specific impulse, the
energy input to the plasma, the energy that appears as translational
kinetic energy, the heat energy content of the plasma, and the momentum
and energy loss to the wall. The methods used for determining these
quantities have been described in previous reports, but for complete-
ness we shall recapitulate them here, and discuss their uncertainties.

Page 11
\
The mass used is determined by an ion gauge that determines the jump
in pressure in the main vacuum tank after a shot.
reproducible readings a re obtained after several preliminary shots
scrub the propulsion tube wall and the bag calorimeter. There was
usually no significant difference in mass used between oscillator on and
oscillator off except in the case of neon, where i t was observed that
the discharge was penetrating up the duct that led the gas into the
propulsion tube. This restricted the propellant flow, probably by
f*x B' forces in the upstream direction, since the thrust and specific
impulse were anomalously low in the case of clean neon.
was measured by determining the back impulse transferred to the
pendulously mounted drive coils. Combining the impulse with the mass
utilized gives the specific impulse. The translational kinetic energy
may also be computed from these measurements if the assumption i s
made that all the plasma is accelerated to the same velocity, and this
assumption is made in the data analysis to be presented.
was measured by observing the deflection of the drive coil pendulum
with a commercial differential transformer instrument. Its calibra-
tion was not as steady as could be desired, and frequent recalibration
was necessary.
to a few percent, but occasional
some points.
Accurate and
The thrust
The impulse
In general the impulse measurements were correct
e r r o r s a s large as 10% may exist in
The energy input to the drive coils f rom the oscillator was
measured with Hall effect multipliers that determined the integral of
V - I over the millisecond operation of the oscillator.
losses were determined by integrating 1' over the same time by hot wire
detectors. resistance wire that carr ied a portion of the coil current was measured
with a thermocouple. The system was calibrated using no plasma load
to determine the calibration ratio between the two energy instruments,
and a graphite load whose temperature r i s e gave the calibration of the
energy scale.
that the energies be proportional to the square of the charging voltage.
When the energy absorbed by the plasma was half the total energy input
The coil copper
In this device the temperature r i s e in a short length of
A consistancy check was made in which i t was asked
,
4
Page 12
to the coils, the measurements seem to be good to 2 to 370. At very low
mass loadings of the accelerator, when the plasma absorbs 10% of the
energy input to the drive coils or l e s s , the calculated energy absorbed
i s the difference of two fairly large numbers, and is subject to
considerably greater e r r o r .
consistant data on the energy absorption if the valve plenum pressure
was at o r below 5 tor r .
low mass loadings.
In general i t was not possible to get
Thrust measurements were also difficult at
A copper bag calorimeter was placed downstream of the
propulsion tube to catch the exhaust f rom the accelerator.
instrumented with thermocouples to determine the temperature r ise .
Thermocouples were attached to twelve positions on the propulsion
tube wall to determine the heat transfer to the wall.
bility and energy balance comparisons with the electrical energy measure - ments the e r r o r s a re not believed to exceed 570.
It was
F rom reproduci-
Performance With Distributed Coils and Transverse Magnetic Field
Measurements were made of thrust, heat transfer, and energy
transfer for helium, and of thrust and energy transfer for nitrogen,
argon, and neon. There was definite evidence of a i r contamination of
the neon so the results a r e omitted except for the remark that they
were not much different from those for nitrogen. In Figure 1 is pre-
sented the specificimpulse a s a function of the valve plenum pressure
for helium, nitrogen, and argon a t 25 kv charging voltage, and for
helium at 30 kv charging voltage.
tor increases, the exit velocity falls off.
r i se significantly above synchronous velocity.
what interpretation to place on this result.
same data as a function of the mass loading instead of the valve plenum
pressure, and it i s clear the results for the different gases fair into
each other quite well. This indicates that the electrical conductivity
of the different gases is not much different over the range of loadings
for which data was taken, and that the significant parameter controlling
As the mass loading of the accelera- At 10 t o r r the helium values
We are uncertain as to
In Figure 2 i s plotted the
Page 13
' 4
the specific impulse is the mass loading.
acceleration process predicts that the exit velocity exponentially
converges to the phase velocity a s the reciprocal of the mass loading.
In Figure 3 we have plotted the specific impulse a s a function of the
reciprocal of the mass loading, and the empirically determined fit of
1 -. 1208/m the theoretically predicted form, I = 220 t 6900 (1 - e
where the mass loading m i s in mill igrams. The small constant
t e r m in the formula chosen to fit the data is without theoretical
foundation, but was included for the slight improvement that it gave in
the fit for the high mass loading part of the curve.
theory predicts that the coefficient of
-10 6 Bo LAt/2 where is the plasma electrical conductivity,
B the magnetic field amplitude, L the accelerator length, A
the propulsion tube area, t the time duration of the gas admission,
and the factor 10 i s due to the fact that m has been expressed in
milligrams. Substituting actual values in this formula yields a coef-
ficient 0.635 which is five time s the observed value. This discrepancy
comes about from the fact that the theory used assumes that the accel-
erator extends indefinitely in the direction which is perpendicular to
the field and the acceleration direction.
plasma in the simplified model consists of currents alternately plus
and minus in the
at infinity.
must run along the wall.
the increased non-thrust productive path for currents to flow reduces
the computed coefficient by a factor
An elementary theory of the
SP
The elementary
l / m in the exponent should be 6 2
0
6
The current pattern in the
x direction which form closed loops by connection
In the actual finite accelerator the loop closing currents
An approximate calculation of the effect of
4.
In Figure 4 a r e plotted the total and the kinetic energy a s a
function of the mass loading for the three gases.
the plasma for the three gases lies reasonably well along a single curve.
The trend line was computed from the previously obtained fit to the
specific impulse data. The total energy, however, is appreciably
different for each gas.
the total energy i s determined to be equal to m w with v the
phase velocity and v the plasma velocity. This quantity was
The kinetic energy of
In Appendix A of the previous Annual Report
P
P
Page 14
.
computed from the f i t to the specific impulse data, and the result lay
above all the total energy data, but did follow the helium results fairly
well.
between the magnetic field and the plasma, or equivalently that the
inductance of the plasma being negligible compared to the resistance.
This sheds no light on the distinct differences between the gases.
dependence of ionization potential with degree of ionization is very
similar for nitrogen and argon, and cannot be invoked to explain the
nitrogen argon difference.
cular weight must be in some way accountable, but if so i t becomes
somewhat of a mystery as to why the kinetic energy and specific impulse
for the three gases fit so well together.
The theory depended upon the hypothesis of inelastic collision
The
One suspects that the differences in mole-
Wall Interactions
For the transverse geometry of the magnetic field, the wall
interaction was studied for helium. There was no particular difference
from the results obtained earlier in the program with the field provided
by the discrete poles.
ratio of the heat observed in the bag calorimeter and the part of the
accelerator tube wall downstream of the last accelerating coil to the
total energy input, ran about 50% with no particular dependence upon the
mass loading.
interesting features a r e that the heat out of the accelerator closely follows
at reduced scale the shape of the total energy in put curve; and that the wall transfer
electromagnetic back reaction on the drive coils.
The calorimetric efficiency which is taken as the
The calorimetric results a r e given in Figure 5. The
closely follows the kinetic energy determined from the
If the gas driven to the wall has the same proportion of
kinetic energy to heat energy a s the gas exiting from the accelerator, then
the calorimetric efficiency measures the factor by which the back reaction
thrust must be multiplied to get the net useful thrust.
the transfer efficiency and the calorimetric efficiency gives a net
efficiency of 25%. obtained in the actual engine to that for an ideal engine that converted
a l l the electrical input energy into directed motion of the plasma without
The product of
This net efficiency is the ratio of the thrust

wall interaction and without heating the plasma.
In Figures 6 and 7 a r e shown the detailed distributions of the
The direction of energy t ransfer to the walls of the propulsion tube.
the magnetic field is horizontal.
greater perpendicular to the direction of the field than parallel to it.
The energy t ransfer is very nearly the same in both magnitude and
distribution to that observed with the discrete poles in the ear l ier work,
If the accelerator were shortened, and the importance of the transfer
in the direction perpendicular to the field and the acceleration direction
reduced by significantly heightening the accelerator, a possibly very
significant improvement in the efficiency might be obtained.
The energy transfer is somewhat
,
I
Page 16
Field Penetration Measurements
Measurements were made of the amplitude of the transverse
magnetic field in the median plane a s a function of the mass loading.
These measurements show the extent to which the magnetic field
penetrates the plasma.
with the mass loading, but is not so great as to make completely
inapplicable a model that neglects the contribution of the currents in
the plasma to the magnetic field.
The axial position of the measurement was at the midpoint of the
accelerator.
independent of both mass loading, and of position in the tube, we must
interpret the decrease in field penetration with increasing mass loading,
As the plasma velocity decreases, the slip velocity increases, and the
currents induced in the plasma increase.
exploit this effect to study in a more detailed manner the convergence
of the plasma velocity to synchronism.
The results show that the shielding increases
The results a r e plotted In Figure 8.
Since the electrical conductivity of the plasma i s fairly
It might be possible to
Page 17
Experimental Results in Solenoidal Geometry
Measurements similar to those made in the t ransverse
The geometry were made with the solenoidal accelerating coils.
coils were overlapped in order to give a moving magnetic field through-
out the volume of the propulsion tube.
same a s in the t ransverse case.
0" and the 90" sets of coils was considerably larger than in the
transverse case.
was necessary to remove this interaction.
helium, nitrogen, nitric oxide, and neon.
The phase velocity was the
The mutual inductance between the
A considerable modification of the balancing circuit
The gases studied were
Nitric oxide was studied to tes t whether the ratio of the
ionization potential to the dissociation potential of diatomic gases was
a significant factor in the performance in the accelerator. This
possibility was suspected from the failure of hydrogen to give good
performance, Hydrogen has a low dissociation potential, 4.4 volts, and
a relatively high ionization potential, 15.6 volts. Thus the discharge
could be quenched by the absorption of energy in dissociation, which
yields no current ca r r i e r s . Nitrogen is much better in this respect,
the dissociation potential being 9. 1 volts, and the ionization potential
being 15.5 volts.
volts, and an ionization potential of 9. 5 volts.
potentials i s 1070 more favorable than for nitrogen, and the ionization
potential is 5070 lower, so it would be expected that less energy would
be consumed in ionization. This argument would have more force for
an accelerator in which the gas was more gently ionized and accelerated
than the present device. In the present accelerator the energy deposi-
tion in the plasma i s so large that multiple ionization i s the usual case,
and the energy cost of f irst ionization i s not great significance.
dissociation quenches the starting of the discharge in hydrogen, but
for the other gases that escape the starting troubles the effect must
be small ,
inferior t o nitrogen.
Nitric oxide has a dissociation potential of 6 . 1
The ratio of these
The
The performance of nitric oxide in the accelerator was slightly

Page 18
The performance of neon was greatly inferior to that
obtained for the other gases.
contamination by inleakage of a i r into the gas handling system.
handling procedure was such that a small leak was of no consequence
for gases available in cylinders, since there was a steady flow of the
gas through the system at all t imes. Neon, being expensive, was
attached to the system in liter flasks, and a small leak could build up
contamination.
system truly tight, both to allow neon tes ts , and to assure that the
leaks that perturbed the neon resul ts were sufficiently small that the
previous results were not in question.
not a s good as a i r contaminated neon!
It was suspected that this was due to
The
Considerable effort was spent to make the gas handling
The result - pure neon was
For both clean neon, and for helium it was observed that the
mass of gas admitted to the system was not proportional to the valve
plenum pressure. At low pressures the admission was deficient. This
we believe i s due to the discharge penetrating the duct that admitted
the gas to the propulsion tube.
in the transverse geometry.
paths for the induced currents, c i rc les about the axis, that a r e f ree
of the intervention of the wall. In the confined space of the entrance
duct only in the solenoidal geometry were conditions proper for the
existance of a discharge.
This effect occurred very occasionally
The solenoidal geometry has clear closed
In Figure 9 is plotted the specific impulse of the three gases
as a function of the mass loading.
does not fit so well together a s it did in the t ransverse geometry case.
The trend line is drawn through the helium data.
impulse, 4150 seconds for helium, is about 2 / 3 of that obtained in the
t ransverse geometry.
magnetic field structure indicates that the forces to be expected on the
plasma should be appreciably less .
The data for the different gases
The maximum specific
The analysis presented in the appendix on
In Figure 10 is presented the data on the kinetic energy and
the total energy.
tion of the electr ical energy supplied than in the transverse case.
The kinetic energy i s a considerably smaller frac-
The
Page 19
transfer efficiency has a maximum of 287'0 a t a mass loading of .165mg
of helium.
is below that for helium at corresponding mass loading.
The trend of the total energy for nitrogen and nitric oxide
Calorimetry in Solenoidal Geometry
I ' i
In Figure 11 is presented the distribution of the heat transfer
to the wall for helium at 30 torr valve plenum pressure, and in Figure
12 is presented the distribution at 50 to r r plenum pressure. One
expects the side and top heat t ransfers to be identical because of the
cylindrical symmetry of the magnetic field.
leads from the coils may be the cause of the modest deviations from
symmetry. Differences in the axial distribution of the heat transfer
is observed for the two mass loadings studied and for the transverse
geometry.
the two geometries.
to the walls i s magnetic field structure sensitive, which is reassuring
to observe although it surpr ises no one. In the t ransverse case the
heat transfer drops abruptly beyond the drive coil area, while in the
solenoidal case the transfer holds up to the end of the propulsion tube.
At the higher mass loading in the solenoidal case the transfer shows a
small minimum in the region of the third coil, and a small drop a t the
end, compared to a steady climb in the heat transfer in the lesser
loading case with distance down the propulsion tube.
Stray fields from the
One would be surprised at the lack of a difference between
One may conclude that the motion of the plasma
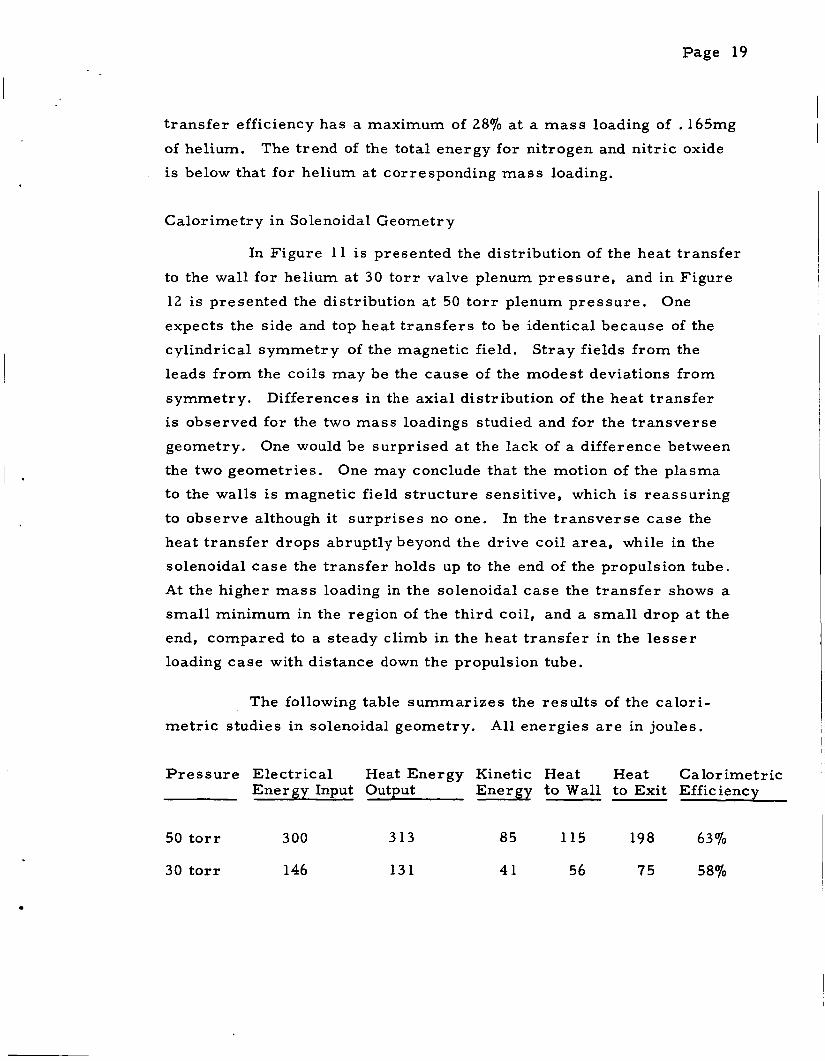
The following table summarizes the results of the calori-
metr ic studies in solenoidal geometry. All energies a r e in joules.
P re s su re Electrical Heat Energy Kinetic Heat Heat Calorimetric Energy Input Output Energy to Wall to Exit Efficiency
50 to r r 300 3 13 85 115 198 637'0
30 tor r 146 131 41 56 75 587'0
Magnetic Field Structure
Page 20
Appendix 1
It is the intention in the design of the magnetic accelerating
structure to provide a magnetic field from a set of coils carrying
alternating currents of suitably chosen phase that translates in the
acceleration direction.
show what may be attained in the way of accelerating and focusing
forces in plane and cylindrical geometry. The equations must be
considerably simplified to make them tractable, but it i s hoped
that it will provide a useful first approximation to the t rue state
of affairs .
The following derivation i s intended to
The first assumption that will be made is that the induced
currents in the plasma a r e sufficiently small compared to the field
producing currents in the drive coils that they may be neglected.
Field penetration measurements show that this simplification
should not be grossly misleading. Secondly, since the dimensions
of the apparatus a r e very small compared to the 480 kc radio wave
length, displacement currents are of no consequence.
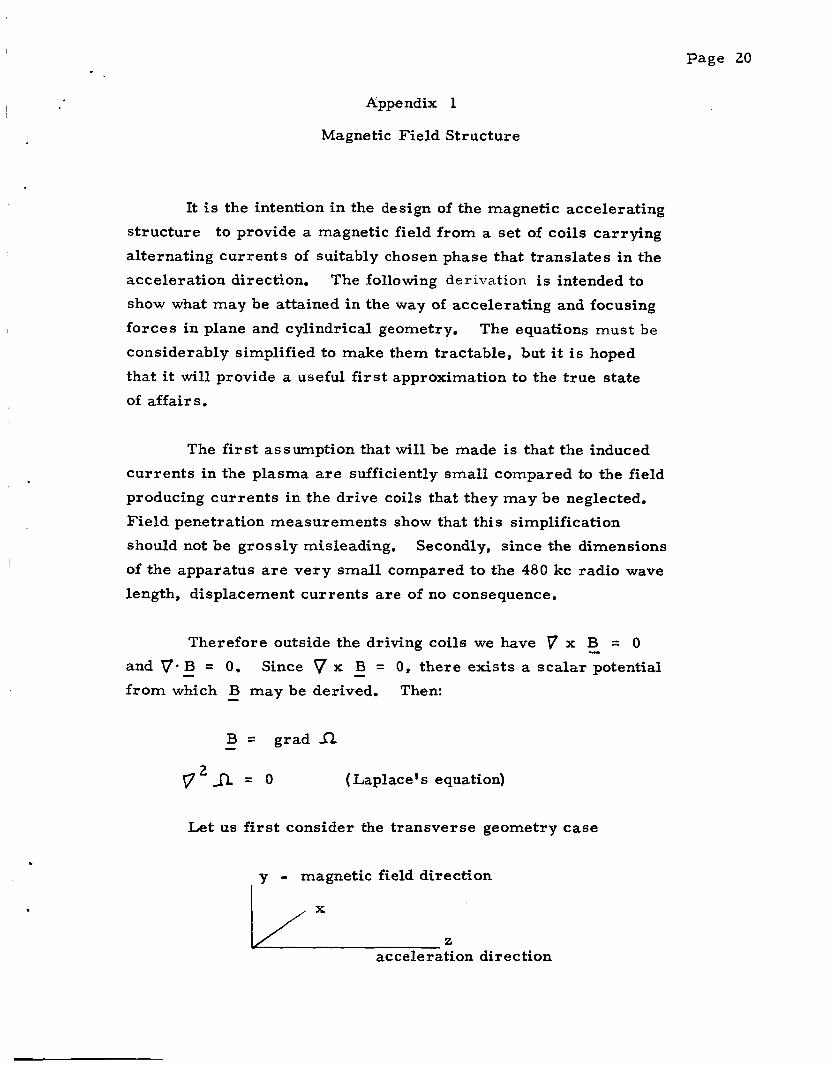
Therefore outside the driving coils we have v x B = 0 - and V- B = 0. Since v x B = 0, there exists a scalar potential
f rom which B may be derived. Then: -
-
v 2 f i = 0 (Laplace's equation)
Let us first consider the transverse geometry case
y - magnetic field direction
L z acceleration direction

Page 21
,
with a xagnetic field normal to the median plane, of infinite extent
in the x direction and translating in the z direction at a velocity V.
We desire that
B = B cos 2~ (x - v t ) / X , Bx = 0, B = O i n themed ian Y 0 Z
plane. This suffices to determine the field. Separating Laplace's
e quati on:
2 r so that the z dependence of the solution will be trigonometric and the
y dependence hyperbolic.
being the familiar separation constant. r we wi l l choose real ,
The z equation is:
2 I ? z t r z = o .
- i r e The general solution is Z = Ce i r z t De
Similarly the solution of the y equation is
Y = Ee t F e - T Y
2 It is apparent that the choice r2 = 47r / A wi l l give the correct
field variation along the z direction in the median plane. We wish:
- a r t */h - 27r =Os -T (z - vt'
- 2.r; ;Lh Z = Ce t D e
to get the correct e and time dependence. This is accomplished

when:
2rriVt/A ; 2D = e -2rrivt /A 2C = e
Page 22
Since the desired solution for B i s symmetric about the median plane
so our final results for the potential and the y and z components of the
field are:
n = ( B ~ /2.rr) si& (21~y/x cos 2.(z-vt)/h
B = o
B
B
X
= Bo cash (2i~y/X ) COS ~ T T ( z - v ~ ) / ~
= -Bo sinh ( 2 m y / X ) sin 2n(z-vt)/A Y
Z
It will be shown that the induced current J in the plasma is in the
x direction. The forces on the plasma a r e given by F = J x B or - - -
Fx = 0
F = - J B Y x z
Z X Y Y Z F = J B ( J = 0, J = 0)
The currents a r e most easily found in a coordinate system moving
with the field. The force on a charge q i s F = q(E t (v -v) x B ) where -p - - - -

Page 23
v i s the plasma velocity in the laboratory coordinate system. Since B -P is constant in the moving coordinate system, E = 0, and the E. M. F. (v -v) x B drives the currents. This vector is in the x direction, -P - and we have thus:
L.
-
J = (-vp t vz) By , and defining (v - -p v ) = -s' v -X
the slip velocity and writing the result in the laboratory coordinate
system:
J = d vsBo cosh 2~ry/), c o s 2 ~ r (2 - vt) /A X
The force density F = J x B - - -
F~ = uvJ Q t c d ~ n y / b a d z r ( 2 - W ~
We have the interesting r e su l t that the accelerating force i s always in the forward direction, whereas the force perpendicular to
the direction of acceleration oscillates toward and away from the axis
at twice the relative frequency.
plane, and grows rapidly away from the median plane.
This latter force i s zero at the median
In a very similar way the field structure and accelerating
forces may be solved for a solenoidal geometry. is now solved in cylindrical coordinates, yielding solutions that a r e the product of trigometric functions of z - vt and Bessel functions of r .
Writing :
Laplace's equation
- B = g r a d n
V 2 A = O
n = R(r) Z(Z)
The separated equations are:
d2Z t p2Z = 0 7 uz
dr L. r d r

Page 24
The solutions a re :
I .
In a way similar to the transverse magnetic field as the induced
electromotive force of interest, E can be found to be: e'
From this and the magnetic field, the force density is:
2
Fo = Q
We see that again the accelerating force i s always downstream
oscillating between zero and peak at double the relative frequency, and
that the radial force i s alternately inward and outward at twice the
relative frequency.
i s zero on the axis, and increases approximately linearly with radius.
The radial force is also zero on the axis and goes approximately a s
the square of the radius.
One difference l ies in that the downstream force
There is another difference between the t ransverse and the
cylindrical situation. and the radial or t ransverse force is different in the two cases.
might be invoked to explain the somewhat better isolation of the plasma
The relative phase between the accelerating force This
Page 25 2 from the wall in the cylindrical case.
between sr/2 and IT, or 3 r / 2 and 2rr, the accelerating force increases a s the
plasma slips back on the magnetic field.
quadrants would be regions of stable acceleration, and therefore preferred
by the plasma in conditions for good acceleration. For these quadrants the
radial force is to the axis.
i s proportional to cos
those of "stable" acceleration, and the y force, t sin 4rr (z - vt ) /h
is away from the median plane in these quadrants.
If the argument of the sin t e r m is
One would then expect that these
In the t ransverse case the accelerating force 2
2 r ( z - vt) /b and the f i r s t and third quadrants a re
In this derivation of the forces there has been no restriction to a
constant s lip ve lo c i t y .
Page 26
APPENDIX 2
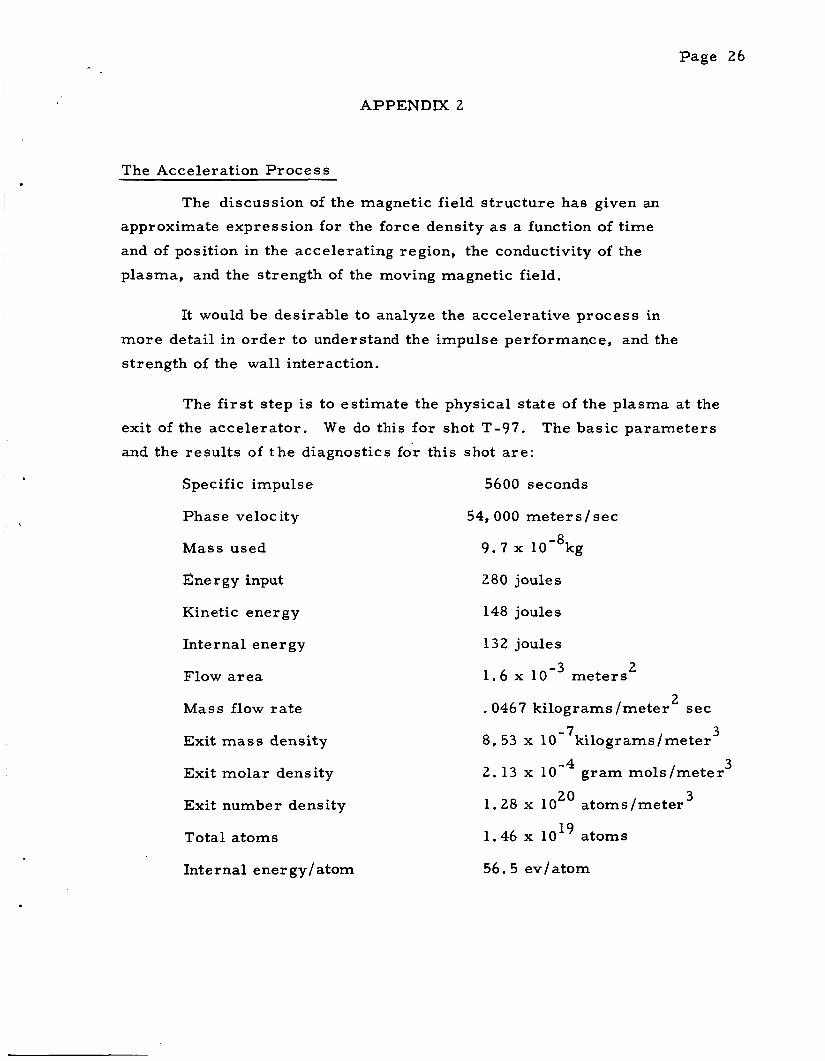
The Acceleration Process
The discussion of the magnetic field structure has given an
approximate expression for the force density a s a function of time
and of position in the accelerating region, the conductivity of the
plasma, and the strength of the moving magnetic field.
It would be desirable to analyze the accelerative process in
more detail in order to understand the impulse performance, and the
strength of the wall interaction.
The f i r s t step i s to estimate the physical state of the plasma at the
The basic parameters exit of the accelerator.
and the results of t he diagnostics for this shot a re :
We do this for shot T-97.
Specific impulse 5600 seconds
Phase velocity
Mass used
54,000 me te r s / sec
9 . 7 x 10⁻⁸kg
Energy input 280 joules
Kinetic energy 148 joules
Internal energy
Flow a rea
Mass flow rate
Exit mass density
Exit molar density
Exit number density
Total atoms
132 joules
1.6 x meters
,0467 kilograms /meter sec
2
2
8,53 x 10⁻⁷kilograrns/meter 3
-4 3 2.13 x 10 gram mols /meter
1.28 x lo2' atoms/meter
1.46 x 10¹⁹ atoms
3
Internal ener gy/atom 56.5 eu/atom

Page 27
9 Internal energy / kg 1.36 x 10 joules/kg
Entrance velocity 883 mete r s / sec
To evaluate the force on the plasma one needs to know the sl ip
The slip velocity will appear
The electrical
velocity and the electrical conductivity.
a s a result of an integration of the equation of motion.
conductivity will depend upon the energy deposited in the plasma during
the course of the acceleration.
have, for practical purposes, at most two values, depending upon
whether the energy deposited i s enough for single or for double ioniza-
tion of the helium propellant gas.
We will show that the conductivity will
It will turn out, for the regimes of interest in the accelerator,
that the conductivity i s controlled by scattering of the drifting electrons
by the ions.
increases counterbalancing the effect of the increased number of
electrons for carrying current.
ionized gas
As the ionization increases the number of scattering centers
Spitzer* gives for the resistivity of an
3 N = 6.53 x 10 l n j b ohm - cm
3 / 2
1 where : - i s proportional to the Debye length.
with temperature and electron density.
the most important factor controlling the resistivity of the plasma.
Ln;li varies quite slowly
Temperature of the plasma is
F rom shot T-97 we have found an internal energy of 56.5 ev/atom, which i s sufficient to singly ionize all the gas, and doubly ionize an
appreciable fraction of it.
and the energy input was computed in the following manner from the
assumption of thermodynamic equilibrium and the validity of the Saha
equation:
A relation between the fractional ionization
*Physics of fully ionized gases, Lyman Spitzer, Jr., Interscience, New York, 1956
Page 28
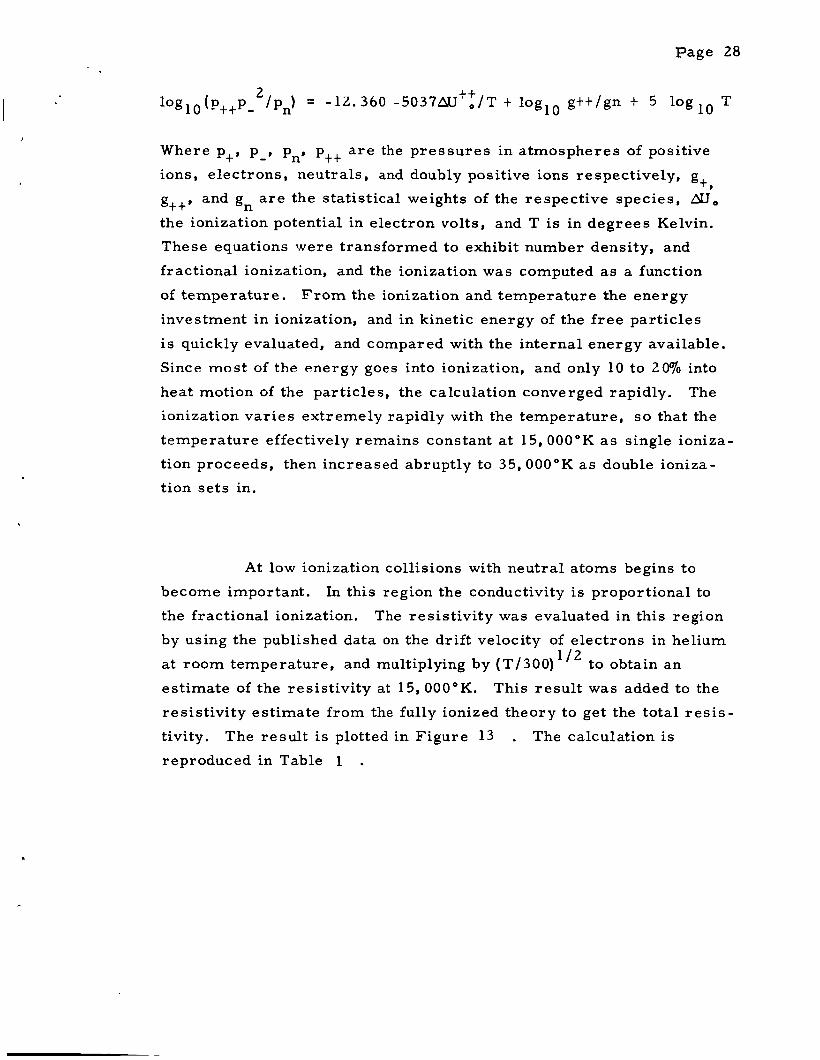
Where p,, p-, p,, p,, a r e the pressures in atmospheres of positive
ions, electrons, neutrals, and doubly positive ions respectively, g +, gt+, and g a r e the statistical weights of the respective species, N o n the ionization potential in electron volts, and T is in degrees Kelvin.
These equations were transformed to exhibit number density, and
fractional ionization, and the ionization was computed as a function
of temperature.
investment in ionization, and in kinetic energy of the f ree particles
i s quickly evaluated, and compared with the internal energy available.
Since most of the energy goes into ionization, and only 10 to 20% into
heat motion of the particles, the calculation converged rapidly. The
ionization varies extremely rapidly with the temperature, so that the
temperature effectively remains constant a t 15, 000°K a s single ioniza-
tion proceeds, then increased abruptly to 35,000"K a s double ioniza-
tion sets in.
F rom the ionization and temperature the energy
At low ionization collisions with neutral atoms begins to
become important.
the fractional ionization. The resistivity was evaluated in this region
by using the published data on the drift velocity of electrons in helium
at room temperature, and multiplying by (T/3O0)li2 to obtain an
estimate of the resistivity at 15, 000°K.
resistivity estimate from the fully ionized theory to get the total res i s
tivity. The result is plotted in Figure 13 . The calculation i s
reproduced in Table 1 .
In this region the conductivity is proportional to
This result was added to the
Page 29
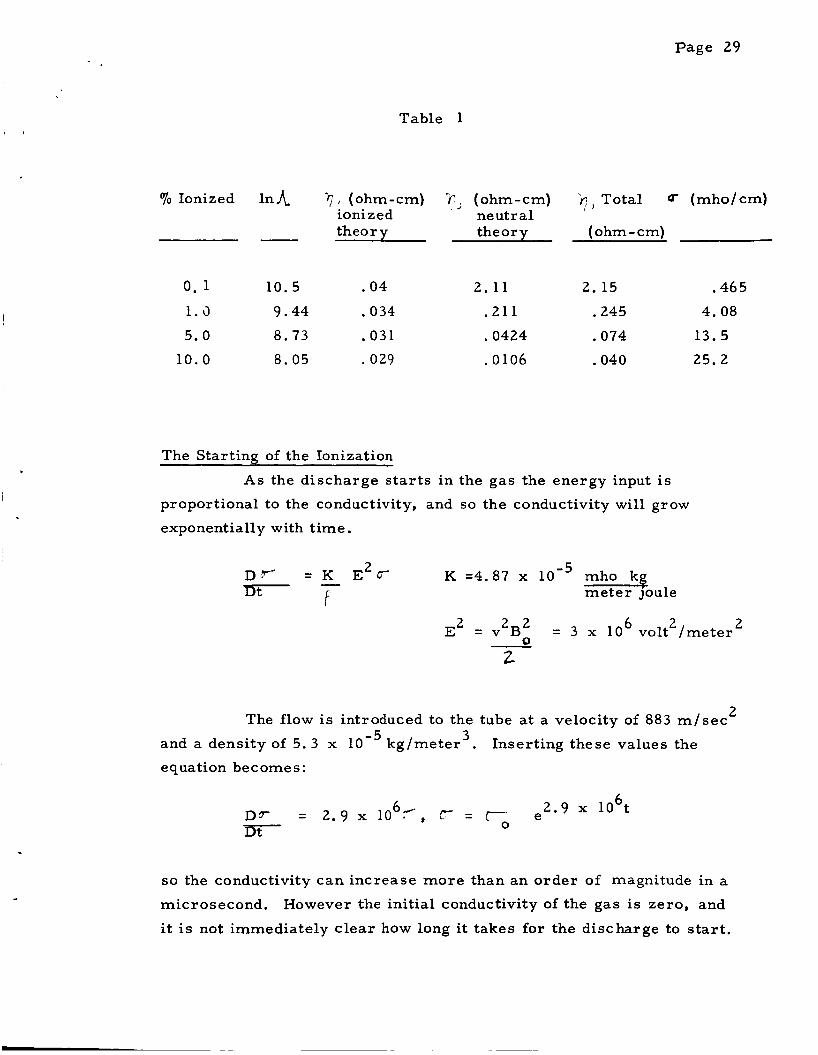
Table 1
70 Ionized l n h 9 ) (ohm-cm) T i (ohm-cm) ? ) Total Q (mho/cm) ionized ne utr a1 the0 r y theory ( ohm - cm)
0 .1 10.5 .04 2.11 2. 15 .465
1 .3 9.44 .034 .211 .245 4.08
5.0 8.73 .031 .0424 .074 13.5
10.0 8.05 . 029 .0106 .040 25.2
The Starting of the Ionization
As the discharge s tar ts in the gas the energy input is
proportional to the conductivity, and so the conductivity will grow
exponentially with time.
-5 K =4.87 x 10 mho kg 2 D Y' = K E C D t f . meter joule
E' = v 2 ~ 2 = 3 x 10 6 volt 2 /meter 2 0
2 The flow is introduced to the tube at a velocity of 883 m/sec 3 and a density of 5.3 x kg/meter . Inserting these values the
equation becomes:
6 2.9 x 10 t C; e D6 = 2.9 x 10 6, - , ~y = Dt
so the conductivity can increase more than an order of magnitude in a
microsecond. However the initial conductivity of the gas is zero, and
it is not immediately clear how long it takes for the discharge to start.
Page 30
.
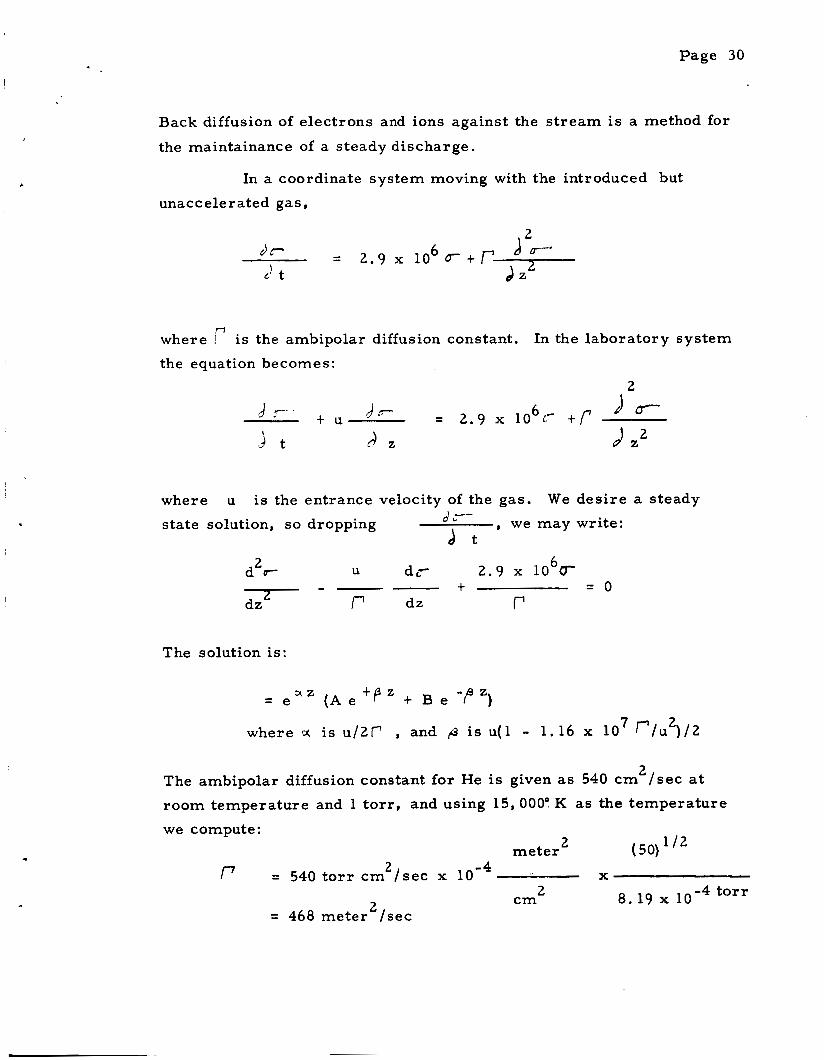
Back diffusion of electrons and ions against the s t ream i s a method for
the maintainance of a steady discharge.
In a coordinate system moving with the introduced but
unaccelerated gas,
n where I
the equation becomes:
i s the ambipolar diffusion constant. In the laboratory system
J b c 2
6 b- = 2.9 x 10 L' + r + u 4 .--' j t r S Z d z2
where u i s the entrance velocity of the gas. We desire a steady , we may write: state solution, so dropping d r--
J t 6
U d r 2 . 9 x 10 6 2 d o -
dz IT dz = o
r z---+
The solution is:
= e CXZ ( A e + p z + B e -?") where x i s u / 2 f , and p is u( 1 - 1.16 x l o 7 r / u 2 ) / 2
2 The ambipolar diffusion constant for He i s given as 540 c m /sec a t
room temperature and 1 tor r , and using 15,0000 K as the temperature
we compute: (50) / 2 2 meter
X 2 -4 r = 540 t o r r c m / sec x 10
2 = 468 meter / sec
-4 t o r r 8.19 x 10 2 cm
Page 31
and obtain for the solution:
6 = e*942z (A cos 78.62 t B sin 78.62)
We need to match this solution to that which obtains in the
region of constant conductivity. In this region we write: 2
d C d r 6 u- = 2.9 x 10 bt t r -
2 dz dz
where d is now no longer the electrical conductivity, but is proportional
to the ionization, and would be the conductivity if electron ion encounters
were of no consequence.
region. At the junction = 6, is the constant conductivity in this second
d6 = 2.9 x 10 6 v u = 3280 5 t8 a E
dr = 3280 7az 1 de-
Applying the boundary condition that C = 0 at entrance, and - - = 3200 dz
at the transition point,
3279
78.6 -4
cot 78.62; = - = 41.7
z, = 3.04 x 10 meters
Thus the initiation region is extremely small.
The choice of the boundary conditionQ'(0) = 0 requires that
the current of electrons and ions diffusing to the left be annulled by
recombination on the back end of the propulsion tube. If it is assumed
that this face reflects this diffusion current, it can be shown that there
is no growth region at all, and the gas begins with essentially the full

Page 32
constant conductivity of the singly ionized region.
For practical purposes the conductivity may be taken a s
constant during the acceleration process a t a value of 3000 - 3500 mho/meter
until about 30 electron volts/atom of heat energy have been absorbed
by the plasma, then i t r i s e s to about 14,000 mho/meter.
The Velocity Field.
In the section on magnetic field structure, we obtained the
expression
2 F = ( V - w ) ~ B COS 21~ ( Z - vt)/h 0
for the force density on the plasma.
velocity for the plasma conditions of T-97 we calculate: At a slip velocity of 1/2 the phase
F = (27,400 m/sec) (3000 mho/meter) (2.04 x lom3
2 3 webers/meter ) (1/2) = 84,000 newtons/meter
FV, an estimate of the total force, = 15.8 newtons which is
3 to 4 times the actual back reaction observed, but shows that the
estimated body force is of the right order of magnitude.
that a conductivity 1 / 10 a s great would not allow the observed accelera-
tion.
It does show
Let us estimate the gas pressure a t 50% ionization and
double the exit density
p = n ( 1 t x)RT = (4.26 x 10-l' mols/cc) (1.5) ( 8 . 3 x 10 7 ) (1.5 x 10 4 ) = 800 dynes/cm2 = 80 newtonslm 2
To compare this with the electromagnetic force density we must divide
it by some characterist ic length in order to get a force per unit volume,

Page 33
which for the acceleration should be the length of the accelerator, and
for divergence toward the wall should be the propulsion tube radius.
For the length of the accelerator, 0 .1 meter , we get 800 newtons/m , small compared to the body force, and for the radius of the propulsion
tube, .023 m, we get 3,500 newtons/m ,
3
3
At f u l l single ionization the mean time to reach equilibrium -7 between ions and electrons is 2 x 10 seconds at the exit density.
At 10% ionization the time is 2 x 10 seconds. The lag of the ion
temperature behind the electron temperature should have some effect,
and cause the plasma pressure to be somewhat lower than estimated
here.
-6
To examine the field plasma interaction from another point
of view, let u s reproduce from Cowling* the fundamental equation for
the behavior of a magnetic field in a fluid of constant conductivity:
1 ? i s a magnetic diffusivety. = -
1 6 2 and for our plasma? = = 2.66 x 10 cm /sec 45r ( 3 x abmho/cm)
The second te rm of the equation represents the tendency of
the magnetic field to diffuse through the plasma, and the f i rs t t e r m the
tendency to transport the field a s though i t were frozen into the
material.
be carr ied with the material, and at the same time they leak through it.
When both terms a r e significant the lines of force tend to
The condition for the transport to dominate the leak is that
the magnetic Reynolds number
- LV Rm - - 31
be large compared with unity. L is a characterist ic length, and V a
*Magnetohydrodynamics, T. G. Cowiing, Interscience, New- Yozk, 1956

Page 34
velocity comparable with velocities actually present. For our case
11 3 N 6 L - = 1.8 cm, V = 2 . 7 x 10 cm/sec 2Tr
R = 1.82 m
so the leak i s very important, and the calculation of the fields in the
plasma by neglecting the effects of the induced currents has fair validity.
The externally applied fields quickly and fully establish themselves in
the plasma.
Cowling gives for the t ime of decay of a motion of material
across lines of force, when resistance i s important, the formula
t = 8.53 x g/cm3 = 1.39 x 10 -7 sec
3 x 1 x 2.04 x 10'
At the entrance f i s nearly 100 fold greater, so
5 t = 10- seconds.
This means that except in the ear ly stages of acceleration, the plasma
motion is fairly quick to establish itself in synchronization with the
field.
= 8200 dynes/cm2, which is an order of magnitude greater than the
gas pressure.
5 At a field of 450 gauss, the magnetic pressure i s H2 8TT 8 ~ r
= 2.04 x 10
Estimated Electromagnetic Confinement
2 If the central pressure is 800 dynes/cm , and the wall is
a t zero pressure, the slip velocity toward the wall will be

Page 35
PI/ d
z 2
4 300 dynes/cm /2.3cm
3 x 10 abmho/cm x 2.04 x 10 gauss - = 5.7 x IO cm/sec 5 2 -
-8
Since the pressure is small compared to the electromagnetic
body forces, we may write the Eulerian equation of motion for the
plasma with only the body force as:
!W 2 2 2ll f ( d w- t w -) T (v - w) Bo cos - ( z - vt)
) I S d t -' z
and the equation of continuity:
; ( : w) t = o ' t 2 2
2 We will derive an approximate solution of these equations by replacing cos 21T - ( z -vt) by i ts average value of 1 / 2 # in the force te rm. We then
focus our interest on a steady flow solution, drop the time derivatives,
and integrate the equations.
approximation, we place i t in the f i r s t equation, res tore the time
deviative of w, and the time dependence of the force, in order to obtain a second approximation.
solving the time dependent equation of continuity was attempted, but
proved to be beyond our analytical powers.
,f
Using the density derived from the f i rs t
A third approximation that would involve
If j p = 0, Q w = powo = m (mass rate/unit area)
so the equation becomes

Page 36 I
2 0
f W 4 W f Z T B I
= I dz
v - w 0 2m0
2 - r Boz/2mo w = v - ( v - w 0 ) e
This states that the velocity converges upon the phase velocity
of the moving magnetic field. The characterist ic length of the
accelerator in which the slip decreases by a factor of e being
= .0152 meters . The length of the accelerator being . 113 2m0
2 bBO
meters, this gives 7.45 characteristic lengths a s the acceleration
distance, so we find that the plasma should come up to phase velocity
very quickly, and coast through the latter part of the system. This
characteristic length is proportional to the mass accelerated, and so
one should expect a falling off in exit velocity a s the propellant mass
per shot is increased. We proceed to the next approximation.
Restoring the time dependence to the equation of motion
we have :
41T
A
2 - - f - - - o w - ~ B o (v - w) (1 t cos - ( z - vt$ 1 3 ~
w ;at C‘Z 2m0
4l-r x Introducing new independent variables z’ = - z
t’ = + v t
The equation simplifies to: 2
; I w ’ = F B o h ( l - w’) (1 t cos (2’ - t’)) 1 dwl F T “m K-

Page 37
I .
Next we transform to a coordinate system moving with
This has the purpose of simplifying the force te rm, velocity v.
and using the general relations for any function f
we obtain:
_- w' ,i w' r t"' -t (w - 1) zll = h (w) ( 1 - w) ( 1 t cos 2 1 1 )
2 1 r B o / 3
where we have replaced by , X . 8rr m
0
This equation may be attacked by the method of Lagrange*. step i s to solve the related system of ordinary equations
The f i rs t
dt - dz - dw 1- w-l - q ( W ) (1 - w) (1 t cos 2)
The second pair may be integrated to give:
1 - c1 z t s i n z + o ( l n w =
6 ( c l - z - sin z) and w = e . Inserting obtain a second relation by integration
dz
t - J e f i ( c l - z - sin z) - 1
this into the f i r s t pair we
- - c2
*Differential Equations, Abraham Cohen, D. C. Heath & CO. , 1933, pg 250 ff .

Page 38
The general solution of the partial differential equation i s then:
dz 1
< ) z t s i n z t -1nw) = 0 $ ( t - 1 /-
e M(cl - z - sin z) -1
I '
Where @ i s an a rb i t ra ry function, which in principle may be solved
for w a s a function of z and t. The constant c is a parameter 1 in the t e rm for the purposes of the indicated dz
L K ( c , - z - s i n z ) -1
integration, but then should be replaced by the quantity z t sin z t 1 - In w after the integration is completed.
by direct substitution.
for fitting the boundary conditions.
The solution may be verified oi
It remains to transform this to a form suitable
We may write the solution in the form:
t - j 1 expid (z - t t sin (z - t) t z l n w - 0 - s i n 8 ,? -1
*
1 - = G (z - t + sin (z - t) + ;r( In w)
Where G is an arbi t rary function of its argument, and we have t rans-
formed back to the laboratory coordinate system.
If the initial velocity w a t z = 0 is substituted in this 0
equation, both sides become a function of t
obtain the dependance of G on its argument. Let c1 be the argu-
ment of G. We obtain
which can be solved to
d e
exp[i ( c l - 8 - s in6 fl -1 ( a) G(Cl) = t -
1 - c1 = - t - s i n t + l n w
0 with
1 Solving (b) for t we write t = Y (2 In wa - c ) where the function 1
y is determined by the equation
y(x f si2 x! = x
Page 39
so finally we obtain for our solution
2 - t
= o t - (a: 1 In wo - c l ) ;I d e
exp [ d ( c l - 6 - s in6 ) l - 1 1 - J(; l n w - c l )
= ( z - t) t s i n ( z - t) t ix In w
0
1 - c 1 with
We wi l l cast this result in a slightly more convenient form:
Putting @ = - 8 / t - z
and denoting the starting phase by P o = to
1 1 Go t s in&o = - In w - c l , c1 = - l n w - d o - s i n 4 R 0 o( 0 0
The solution appears in the form:
/ t - z
at the lower limit, and 1 One recognizes that the integrand i s - 1 - w 0
a t the upper limit. Each substitution of d in the solution 1 I-w 0 gives a trajectory in the t, z plane that i s followed by a particular
fluid element. This may be shown in the following way.
tion of the solution yields:
Differentia-
Page 40
dt - dz dt = 4 ( t - z t sin ( t - z ) - pl - sin ) 1 - w e 0 0
0
dz - = w which is the equation for the dt -W dt = -dz
trajectory of a fluid element. A knowledge of the starting phase and
the instaneous phase determines the velocity from
1 1 c = - In w -to - s i n # = - In w -4'- sin$ 1 4 0 0
The evaluation of the integral allows one to determine the
values of t and z corresponding to the values of phasepand of
the velocity w attained.
The integration was done numerically for two values of
starting phase, $J being a maximum and zero respectively at the start of the motion.
The results a r e given in Table 2. A plot i s made of z vs t derived
from these two solutions, and plotted in Figure 14. The = 0
curve shows the velocity increasing slowly at the start, remaining
steady for a while in the region 34 t < 3. 5 corresponding to the
= 0, and Po = - 3 . 2, corresponding to the force 0
vicinity of the zero of the force at @ = TI and then rapidly accelerating
as jd increases toward 2rr. Essentially synchronous velocity is reached
at = 2rr, and a z value of 1.5. F rom then on the plasma moves for -
ward at synchronous velocity, and the phase remains constant.
units of this discussion, the active length of the accelerator is 12 units
long, so synchronous velocity is reached very early.
In the
F o r the trajectory starting ear l ier a t # = - 3 . 2, at the zero 0
of the force function, the velocity remains small until the phase passes
through zero. Then the force has built up and the velocity
i 1

Page 41
accelerates to a value of 0.65 of synchronous during the progress of
the phase to tm, where the forceis again zero. The plasma waits
for quite a while, for the phase is changing slowly with time, since the
velocity is not too far f rom synchronous.
becomes favorable for acceleration, and the velocity comes up to
essential synchronism at a z value of 10, and a phase close to
that of the 4 = 0 solution. One observes some compression in
the phase difference between these two trajectories. For the second
trajectory nearly the whole length of the accelerator i s used in
reaching synchronous velocity.
Eventually the phase again
The fluid velocity is available a s function of the starting
phase and the change of ph.ase of the fluid element relative to the moving
magnetic field.
q o = 0 and 4 attained down the accelerator in Figure 16 . shown the velocity a s a function of distance if the modulated force is
replaced by i ts average value.
abcissa is expanded near the orgin to present the details of the early
acceleration. One may see that if a, which i s a measure of the
ratio of the strength of the accelerating force to the mass loading were
much smaller than its actual value, the final velocity would fall
significantly below synchronism.
It is plotted a s a function of A @ for the two cases
= - 3 . 2 in Figure 15 , and a s a function of the distance
On that graph is also
The
The next problem is that of the motion of the plasma toward
If the plasma reaches synchronous velocity, it is a simple the walls.
matter to determine the phase of the plasma at output as a function of
the starting phase.
that the output phase is constant at 4 .8 for a fairly wide range of
input phase in the neighborhood of Since we have already
integrated the trajectory starting at - 3 . 2 to obtain z and t a s a
function of phase, and since the phase bunching observed indicates that
a significant portion of the plasma will follow this trajectory, we will
determine the motion of the plasma in the
The results a r e plotted in Figure 17 . One observes
-3.2.
y direction, t ransverse to

Page 42
the direction of acceleration for that trajectory. With v being
the velocity in the y direction, we write
d J -7 + .dz is the comoving derivative Dt where
For convenience in the numerical integration, this equation is written
with
integrations. The new equation is: 4 as the independent variable, since it was used in the other
This equation is linear. It contains the assumption that the y velocity
is small compared to the slip velocity, so that the
v x B does not contribute significantly to the E. M. F. that drives the
induced current in the plasma.
u* B, t e rm in
- -
With the above restriction in mind, the equation was inte-
grated by Milnes' method, and the solution for starting values
% = 0 is presented in Figure 18 . The climbing of y toward
infinity at = 4.84 is to be expected, since this limiting value of
@ i s reached as z and t reach infinity. The solution i s plotted
as a function of the more interesting variable z in Figure 19 . One
observes that a t the s ta r t the plasma i s moved very slightly outward,
and then driven strongly toward the axis. At the time it reaches the
axis it has a high velocity toward the axis, and the force i s changing
sign from focusing to defocusing.
would be driven through the median plane, and strongly outward on
the opposite side.
been so far neglected, to come into play, and reflect the motion about
the median plane.
elastic, and the t rue state of affairs obtained by continuing the solu-
tion f rom its image in the median plane.
y = 1,
The equation predicts that the plasma
In reality w e expect gas pressure forces, which have
It seems reasonable that the bounce should be
The solution shows that a

Page 43
large portion of the plasma will be driven strongly into the wall before
exiting from the accelerator. An inspection of the equation indicates
that probably only a small range of starting phase will yield solutions
that do not diverge strongly from the center during the course of the
transit of the plasma down the tube.
This analysis has assumed that the velocity in the y direc-
tion is small compared to the sl ip vetocity, so that it is correct to
neglect the forces due to the motion in the y direction across the
field lines.
plasma toward the wall to be l e s s vigorous than predicted.
it cannot prevent the motion toward the wall, for if it did the y velocity
would be sufficiently small that the hypothesis behind the equation would
be fully valid.
The inclusion of these forces will cause the ejection of the
However,
If one examines the details of the acceleration to synchronous
velocity and the motion toward the wall, one notices that if the accelerator
were half as long the acceleration performance would not be too much
degraded, but the amount of wall interaction might be greatly reduced.
I t may not be out of place to remark here that the accelerator studied in the f i r s t year’s work was considerably shorter, and this difference
may explain the absence of wal l interactions in that case.
TABLE I1 A
I m 6
0 . 0
,
. 4
. 8
1. 2
1. 6
2.0
2.4
2. 8
3. 2
3. 6
4. 0
4.4
4. 8
5.2
5.6
6.0
6. 2
6.4
6. 5
6. 6
6.64
W t z
, 0 1600
.02549
.039 17
,05629
.07433
.08904
.09820
. 10171
. 10211
. 10308
. 10842
. 12236
. 15092
. 20422
.30005
.46755
.59067
.74776
.84086
.94400
.98861
00000
.40834
.82157
1.24156
1.66956
2. 10532
2.54689
2.99 152
3.43697
3.88276
4.32981
4.78152
5.24405
5.72902
6.26138
6.90683
7. 33175
7.94303
8.43600
9. 18335
10.67 69
0
.00834
,02157
.04156
,06956
. 10532
. 14689
. 19152
.23697
.28276
.32981
. 38152
.44405
.52902
.66138
.90683
1. 13175
1.54303
1.93600
2.58335
4.0369
Page 44

I .
b -2. 8
-2.4
-1. 6
- . 8
. o
. 8
1.2
1.6
2.0
2.4
2.8
3.2
3. 6
4.4
4. 6
4.7
4.8
4. 8 4
TABLE I1 B
W
. 0 16062
, 0 16636
.021980
.0417 12
. 10211
.24997
. 35922
.47435
.56823
.62673
.64912
. 6 5 168
.65782
.78092
.85721
.90604
.96316
.98875
t 2
.4065 1
.81313
1.62835
2.45309
3. 31058
4.27380
4.84938
5.53778
6.37994
7. 38379
8.4967 5
9.64343
10.79757
13. 51585
14.6256
15.4794
17. 1109
18.986
.00651
,01313
.02835
.05309
. 11058
.27380
.44938
.73778
1.17994
1.78379
2.49675
3.24343
3.99757
5.9 1585
6.8256
7.5794
9. 1109
10.982
. Page 45

Page 46
CONCLUSIONS
It is possible to obtain strong coupling between a moving 16 3
particles/cm . transverse magnetic field and a plasma o.f density 10
Exit velocities of the order of the phase velocities of the magnetic
field could be achieved a t an appropriate mass loading, corresponding
to specific impulses of 6000 to 7000 seconds. Wall interactions were
a serious problem that was not resolved in the course of the program.
It was possible to gain a fair understanding of the performance +--J
of the accelerator.
body forces on the plasma, gave a good explanation of the dependence
of the specific impulse upon mass loading, and the relative independence
of specific impulse on propellant choice; and a semiquantitative explana-
tion of the strength of the wall interactions.
The theory, which took account only of the J x B
The problems that need to be solved before the engine could
be considered for development for a mission a r e several.
wall interactions a r e excessive.
flattening the c ros s section of the accelerator and shortening it.
Firs t , the
It seems possible to reduce them by
The second problem is that of the theoretical l imit to the
efficiency of 500/0, which is due to the average slip velocity of the plasma
relative to the magnetic field being 5070.
velocity to improve this situation so that the average slip i s held to perhaps
20%.
for small wall interactions,
of a two or three stage engine, probably with modulation of the feed so
the plasma enters at phases such that the electromagnetic forces a r e
mostly focusing.
One must have a variable phase
This conflicts with the requirement that the accelerator be short
This points to the potential desirability

Page 47
The third problem is that of the large internal energy
investment in ionization.
appears as internal energy goes almost entirely into ionization.
Complete single and some double ionization is achieved.
reduction in the inelasticity of the interaction between the magnetic
field and the plasma that could be gained by the use of variable
phase velocity would reduce the ionization.
to as low as 10% without seriously affecting the strength of the
coupling.
in this specific impulse region.
At present the 5070 input energy that
The
It could be reduced
There is no need to pursue easily ionized propellants
The fourth problem is that of the drive coil losses.
Approximately 5070 of the output power of the oscillator was lost
in the drive coils. The frequency of operation, 480 kc, is in a
region where litz wire techniques a r e quite helpful, and a reduction
in the losses by a factor of three, and possible ten, may be expected
by the use of litz wire for the drive coils.
Let us somewhat arbitrari ly estimate ultimately attainable
efficiencies at each stage of the acceleration process:
Power conditioning 9 570 R.F. Power Generation 85%
Drive Coil Efficiency 90%
Acceleration Efficiency 8070
Transport Efficiency 90% (100q0 W a l l Loss)
The combination of these efficiencies predicts a possible overall
efficiency of 5 270.
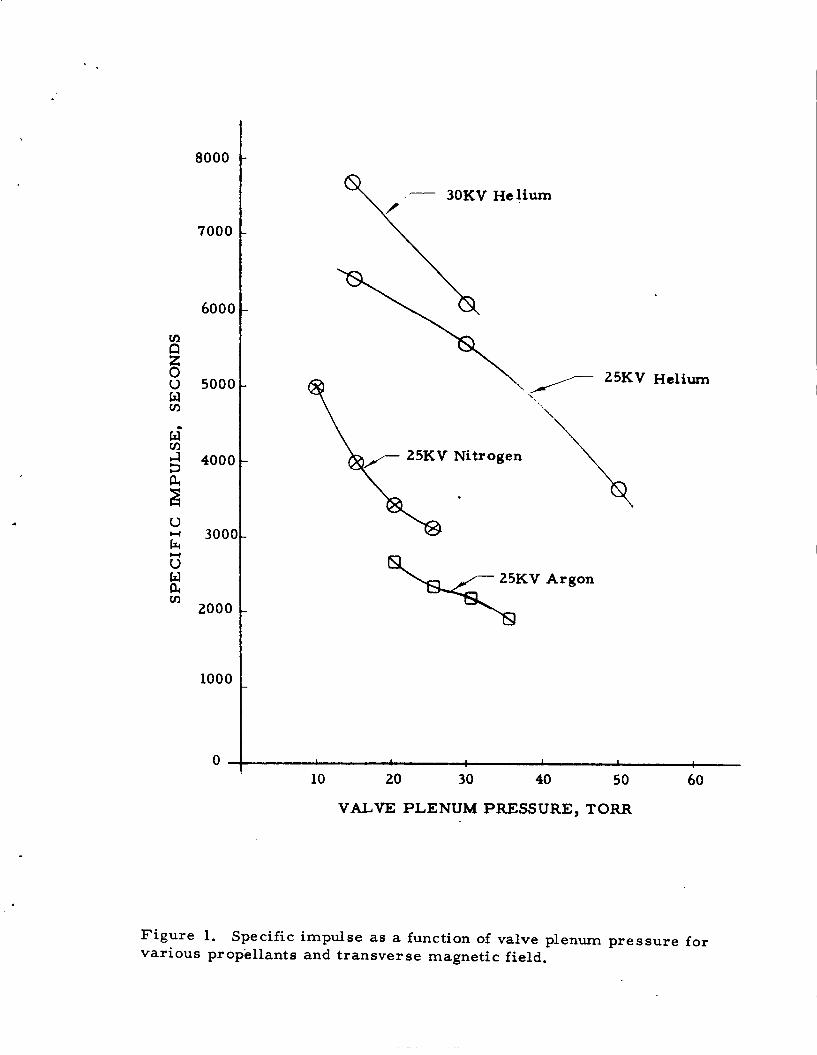
8000
7000
6000
v1 n z 0 U 5000 w v1
w" v1 $ 4000
b u - 300C 6(
w PI
ij
2000 v1
1000
0 -
',\
\
- 25KV Argon k I 1 I
10 20 30 40 50 60
VALVE PLENUM PRESSURE, TORR
Figure 1. various propellants and transverse magnetic field.
Specific impulse as a function of valve plenum pressure for

d
o Q 0
.
1 1 I I 1 I I 0 0 0 0 0 0 0 0 0 0 0 0 0 0 0 0 0 IC; 9 cl? * m
0 0 E cn
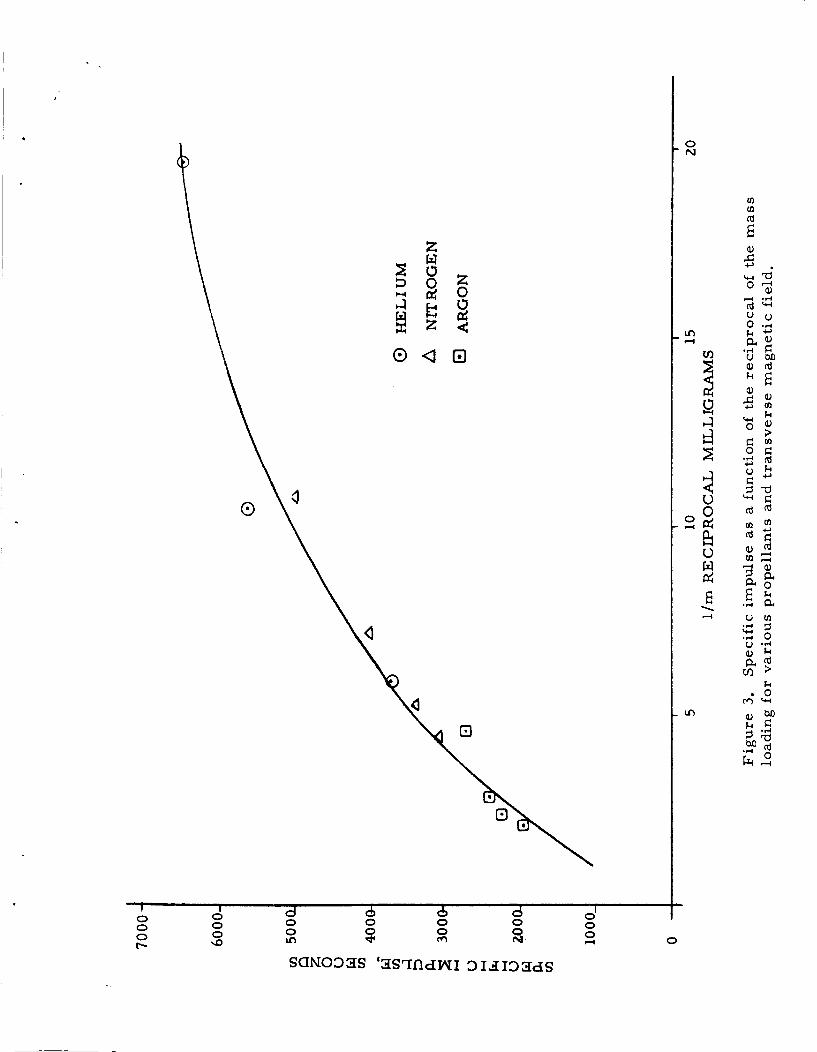
I '
1 I 0 0 0 9
d d 6 d 0' 0 0 0 0 0
0 0 s m 3 4 0 0
In
0 0 0 tc
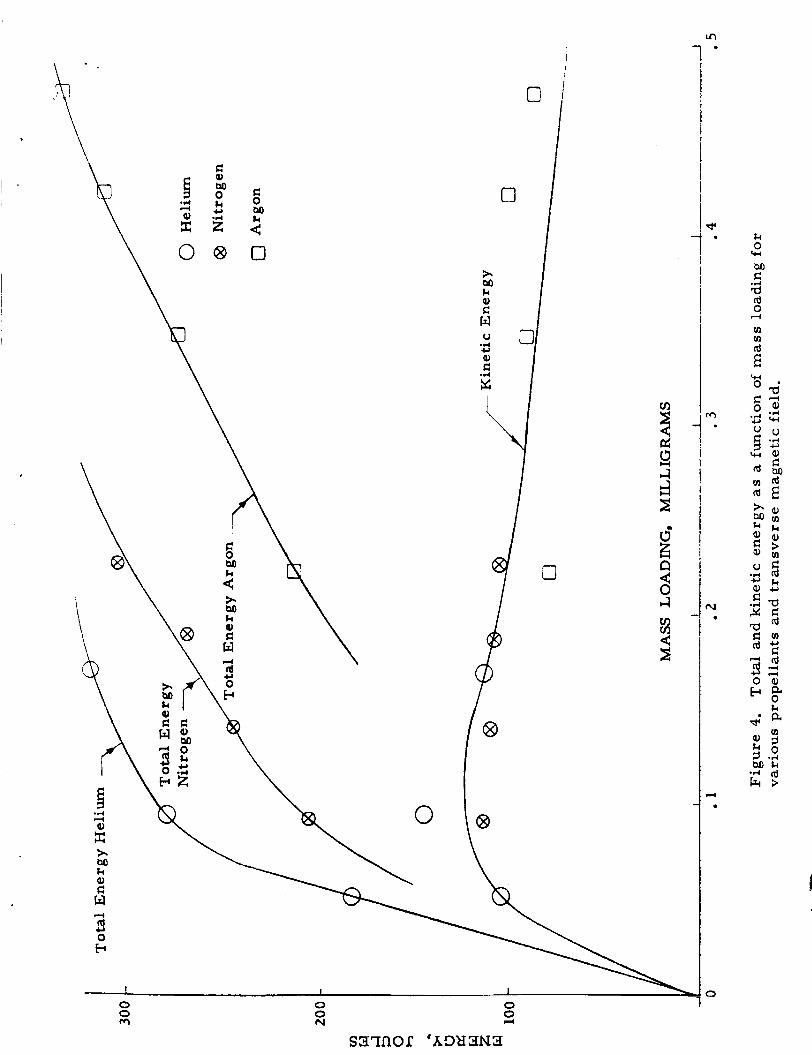
M z 0
In .
* .
m
N .
r( .
0
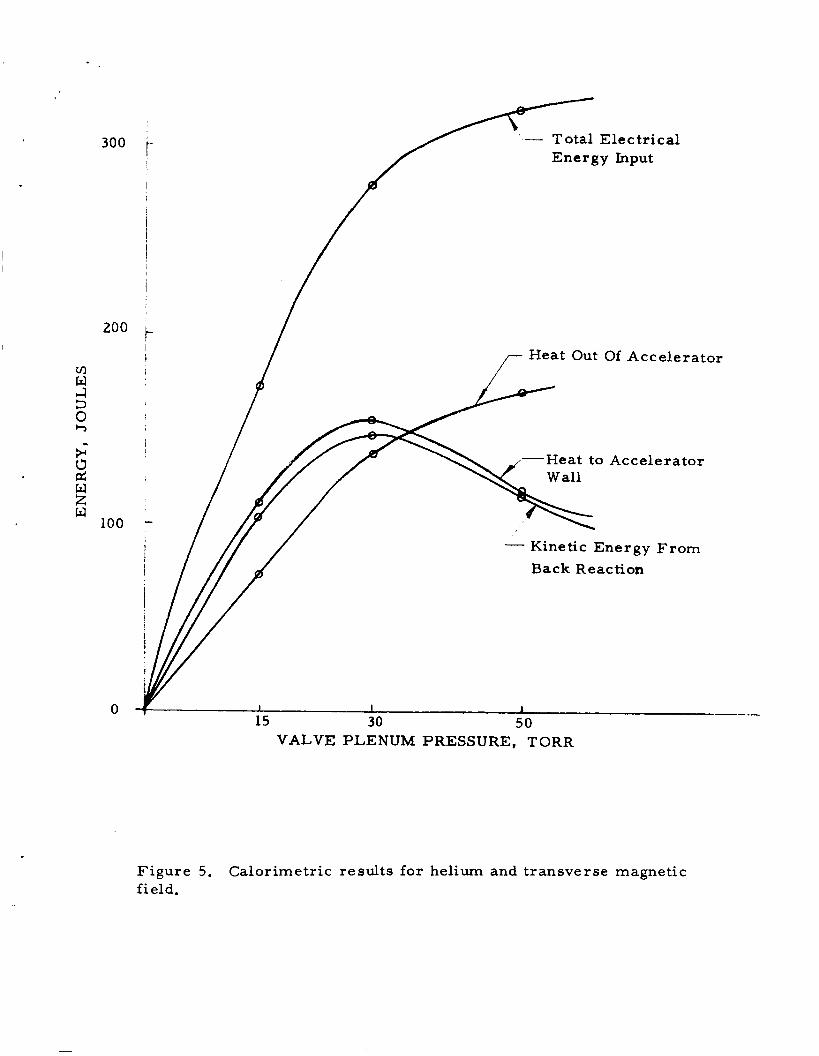
300 - Total Electrical Energy hput t- d
/ i
/ 200
Heat Out Of Accelerator
/- d VI G! 0 c,
-Heat to Accelerator k Wall d
w l2 100
- Kinetic Energy Back Reaction
From
0 1 30
1
50 .I
15 VALVE PLENUM PRESSURE, TORR
Figure 5. field.
Calorimetric results for helium and transverse magnetic

I
j t
,
2. 8
2.4
2.0
1. 6
1. 2
0.8
0 .4
0 .
7 Top (25 Torr Helium)
\ TOP (15 Torr Helium)-
Side (25 Torr Helium) -
Side (15 Torr Helium)--
\ , \ I
x
/ \\ "'\
\ /a \'\>
/
\
\ \
I 1 1 I I 1
20 40 60 8C 100 120 140
AXIAL POSITION, mm.
Figure 6 . for transverse magnetic field. plenum pressure.
Distribution of heat transfer to propulsion tube walls Helium at 15 and 25 torr valve
2.8
2. 4.
2.0
1. 6.
1. 2.
0. 8.
0.4 .
0 - 20 40 60 80 100 120
AXIAL POSITION, mm.
Figure 7. t ransverse magnetic field. p r e s sure.
Distribution of heat transfer to propulsion tube walls for Helium at 30 and 50 tor r valve plenum

1. c
0.5
0 Helium
8 Nitrogen
a Argon
1 I I
0 15 25 50 Valve Plenum Pressure, Torr
Figure 8. Penetration of transverse magnetic field into plasma.

u k
.r(
c u
Y
c p D D
0 0 0 0 0 0 L n e
0 0 0 CC)
0 0 0 N
a 0 2
r rd u k
4 4
.rl
a c
a c cd
0 k EL cn 9 0 k fd > k 0 w
.rl
SCIN033S 3STndrJI 31dI33dS

.d
e, a
a Q n

I . '
N
E U
2 . 0
1. 6
1 . 2
0 . 8
0 . 4
0 .
Q
Q
w --SIDE 0
i
20 40 60 80 100
AXIAL POSITION, mm
Figure 1 1 . helium valve plenum pressure for cylindrically symmetric magnetic field.
Distribution of heat loss to propulsion tube wall at 30 torr
0 * 1.
/////////////// DRIVE COIL AREA
/ //// /// // /////////////’/
Figure 12. helium valve plenum prerrure for cylindrically symmetric magnetic field.
Distribution of heat lorr to propulsion tube wall at 50 torr

0 M .d
2 M A '3 k Id c, v3
4 0 9
0 0 d
0 a0
0 IC
0 9
0 vi
0 N
k 0 c, (d k
u v C r d
d (dr-l
0 r(
0

* \
N rn
I I
0
'8-
0 II
-s-" i

0 II
I .ao
1 I 1 1 I I I I I
0 QI OD e 9 In * 0 N w . .
I C
i i
1.
.
.
.
.
.
, .
I
O L 1
-
9 -
8 -
I
6 c
4
/ /
/ /
/
I 1
0 - /--
/ I I
/ /
/ 9 -
,- a, = -3.2
8 -
7l 6
5 -
/
- Horizontal Scale Change /
I 1 I 1 I I I 1 I 1
= Q
Average Force
Horizontal Scale Change
/-- / .I I
/ /
I 1
0 . 2 . 4 . 6 . 8 1.0 2.0 4.0 6.0 8.0 10.0 12.0
DISTANCE ALONG PROPULSION TUBE z
Figure 16. accelerator tube.
Plasma velocity as a function of distance down the

, ' .
e
-4 7'
I I I I I 00 9 * N 2
00
9
9
N
0
N I
f
9 I
.
.
N 4 I
I I I 0 N .. 0
b r(
-w 0
L n
0
4
0
m
0
hi
0 4
0
0
0 . 4 I
0
N I
0
rn i
.

t
L
Y
3. c
2. a
1 .0
I fi0 = - 3 . 2
1 V I I 1 I
B 0 2 4 6 8 10 12 I4
Figure 19. of acceleration. tube.
Computed motion of the plasma perpendicular to the direction Displacement a s a function of distance down the propulsion

DISTRIBUTION LIST FOR SUMMARY REPORT
CONTRACT NAS3-59 12
NASA Headquarters
600 Independence Avenue, S. W. Washington, D. C. 20546
FOB- 10B
NASA Marshall Space Flight Center Huntsville, Alabama 358 12
Commander Aeronautical Systems Division Wright-Patterson AFB, Ohio 45433
NASA-Lewi s Re search Center 21000 Brookpark Road Cleveland, Ohio 441 35
' .
b
General Dynamics /Astronautics P. 0. Box 1128 San Diego, California 921 12
General Electric Company Valley Forge Space Technology Center P. 0. Box 8555 Philadelphia 1, Pennsylvania
Electro-Optical Systems, Inc. 125 North Vinedo Avenue Pasadena, California 9 1107
Attn: RNT / Jame I Lazar RNT/J. Mullin RRP/Dr. K. H. Thom
Attn: E. Stuhlinger
Attn: ASRMPE/R. River
Attn: Electromagnetic Propulsion Div. G. Seikel Attn: Space craft T e chnolog y Division J. H. Childs Dr . H. G. Koemahl Attn: Library Attn: Reports Control Office Attn: Spacecraft Technology
Procurement Section John H. DeFord
Attn: Technology Utilization Office John Weber
Attn: Dr. A. Larsen
Attn: Dr. P. Gloersen
A ten. Dr. Gordon Cann
AVCO-Everett Research Laboratory A Division of AVCO Corporation 2385 Revere Beach Parkway Everett 49, Massachusetts
Allison Division General Motors Corporation Indianapoli 8 , Indiana
Litton Industries Beverly Hills, California
Res ear ch Division American Radiator and Standard Corp. P. 0. Box 2003 New Brunswick, New Jersey
TRW Space Technology Laboratories TRW Inc. One Space P a r k Redondo Beach, California
At-. Dr. S. Janes
Attn: T. Rosebrock
Attn: Dr. A. Penfold
Attn: E. C. Okress
Attn: C. L. Dailey
Ma s sac hus e tt s Ins ti tut e of T e chnol o g y Cambridge, Massachusetts 02139 Dr. E. Covert
Attn:
A F W L WLPCICapt. C. F. Ellis Kirtland Air Force Base, New Mexico
NASA Scientific & Technical Information At*.
P. 0. Box 33 College Park, Maryland 20740
Facility NASA Representative RQT-2448
Aero s pac e Cor por a ti on P. 0. Box95085 Library Technical Documents Los Angeles, California 90045 Group
Attn:
We s tinghoue e As tronuclear Laboratories Pittsburgh, Pennsylvania 15 2 34 H. W. Szymanowski, Manager
Attn:
Electric Propulsion Laboratory
Radio Corporation of America As tr o -Electric a1 Division Dr. W. H. Hendel Princeton, New J e r s e y
A ttn:
Republic Aviation Attn: Farmingdale, L. I. New York 11735 A. Kunen

.
t
8
United States Atomic Energy Commission Division of Technical Information Extension P. 0. Box 62 Oak Ridge, Tennessee
Case Institute of Technology Engineering Division University Circle Cleveland, Ohio 44 10 6
Attn: Dr. Eli Reshotko