magnetic tweezers experiments to probe the mechanics of ... · praktikum: g5b july 18, 2018...
TRANSCRIPT

Magnetic Tweezers Experiments toProbe the Mechanics of Nucleic Acids
Praktikum: g5bJuly 18, 2018
Ludwig-Maximilians-University MunichDepartment of Physics
Franziska Kriegel, Philipp Walker and Prof. Jan Lipfert


Contents
1 Introduction 1
2 Theory 32.1 Force-Extension Behavior of Molecules . . . . . . . . . . . . . . . 3
2.1.1 Freely-Jointed Chain Model (FJC) . . . . . . . . . . . . . 32.1.2 Worm-Like Chain Model (WLC) . . . . . . . . . . . . . . 6
2.2 Double-stranded DNA under Force and Torque . . . . . . . . . . 82.2.1 Force Calibration in a Magnetic Tweezers Setup . . . . . . 82.2.2 Inducing Twists on DNA Molecules . . . . . . . . . . . . . 10
3 Setup 133.1 Experimental Setup . . . . . . . . . . . . . . . . . . . . . . . . . . 133.2 Software . . . . . . . . . . . . . . . . . . . . . . . . . . . . . . . . 163.3 Flow cell and Attachment Chemistry . . . . . . . . . . . . . . . . 18
4 Measurements 194.1 Preparation of the Flow cell . . . . . . . . . . . . . . . . . . . . . 194.2 Experiment 1: Force-Extension Measurement . . . . . . . . . . . . 234.3 Experiment 2: Rotation-Extension Measurement . . . . . . . . . . 24
5 Analysis 255.1 Analysis Experiment 1: Force-Extension Measurement . . . . . . 255.2 Analysis Experiment 2: Rotation-Extension Measurement . . . . . 25
III

Chapter 1
Introduction
The mechanics of single molecules in biological systems play a crucial role in generegulation. The binding of proteins to DNA molecules often provokes a conforma-tional change. These structural changes decide either the protein is active or not.As all biological processes contain binding and unbinding of molecules, the studyof mechanical properties is of huge interest. There are several single-moleculetechniques such as the atomic-force microscope (AFM), optical tweezers (OT) ormagnetic tweezers (MT) to measure mechanical parameters of molecules such asDNA or proteins.
Figure 1.0.0: Principle of a magnetic tweezers setup: A magnetic bead is attachedto the DNA molecule using specific binding, while the other end is attached tothe bottom of the flow cell trough antibody binding. Permanent magnets areplaced just above the flow cell and exert a magnetic force on the bead. Thestretching force and the rotation of the molecule can be controlled by controllingthe magnets position in translation and rotation. The diffraction pattern of thebead is observed using an inverted microscope and gives rise of the x, y and zposition of the beads center.
1

2 CHAPTER 1. INTRODUCTION
In MT a superparamagnetic bead is attached to the molecule of interest (hereDNA) , while the other end is attached to the bottom of the flow cell. Permanentmagnets placed just above the flow cell exert a magnetic field that induces amagnetic force on the magnetic bead and thus the DNA molecule, see Figure1.0.0. The gradient of the magnetic force is nearly constant over typical moleculesizes, this implies that the magnetic force is constant over the field of view (force-clamp). In contrast to an AFM there is no feed back loop needed to exert constantforces also over a longer period of time.
In MT a CMOS camera is used to track the magnetic bead’s movement outof focus. Using its diffraction pattern, one can derive the bead’s and such themolecules x,y and z position, from which the molecule’s extension as well as thestretching force acting on the DNA molecule is calibrated.
DNA is highly packed in the cell nucleus. Due to its helical structure DNAundergoes conformational transitions upon the addition of stretching forces andtorques. In MT molecules can be twisted by rotating the magnets. Freely orbitingmagnetic tweezers (FOMT) and magnetic torque tweezers (MTT) additionallyallow to measure angular changes within the molecule.
This experiment is about studying mechanical properties of DNA using mag-netic tweezers. Here you should learn the principles of a conventional magnetictweezers setup and perform a standard force-extension measurement of double-stranded DNA and a rotational measurement to observe DNA supercoiling.
Question 1: What is a force-clamp?
Chapter 2
Theory
In this laboratory course you are asked to perform force-extension measurementson double-stranded DNA, which means to apply various stretching forces andobserve the DNA’s tether extension. In a second experiment you are asked toapply turns to the DNA molecule and study its behavior upon analyzing changesin the DNA’s length. This Chapter covers briefly the theoretical background thatis needed to do this laboratory course.
2.1 Force-Extension Behavior of Molecules
In order to describe the response of constant forces acting on biological macro-molecules, we would like to introduce two typical theoretical models, the freely-jointed chain model (FJC) and the worm-like chain model (WLC). The firstmodel (FJC) considers the molecule as a chain, consisting of rigid segments,while the other model (WLC) considers the molecule as an isotropic rod that iscontinuously flexible.
2.1.1 Freely-Jointed Chain Model (FJC)
The FJC model considers a polymer of total length L that consists of N monomerseach with the same length l (Kuhn-length):
L = N · l
~R is the end- to- end vector of the molecule, describing the ”actual” size ofthe molecule in its environment. All segments are described by a vector l · ~ri. There are no interactions between the monomers and the bond between twovectors ~ri and ~ri+1 is flexible (random walk), see Figure 2.1.1. All conformationsof the polymer are equally likely to occur in solution and follow the Maxwell-Boltzmann distribution. If an external force ~F = f · ~ez acts on the molecule, thepotential energy Eα
pot of the molecule in a particular angular confirmation α is:
3

4 CHAPTER 2. THEORY
Eαpot = −
N∑i=1
~F · l · ~ri = −l · fN∑i=1
cos θi (2.1.1)
Where θ is the angle between one monomer and F the force acting in z-direction.
Figure 2.1.1: In the FJC model a polymer is considered to consist of N rigidsegments with length l. Also shown in this figure is the definition of the end- to-end vector ~R, which which is spanned from the first segment to the last segmentof the polymer.
The response (extension) of a molecule to a force acting on it, can be derivedthrough statistical mechanics. A canonical ensemble is a statistical ensemble torepresent all possible states of a mechanical system that is in thermal equilib-rium. In a canonical ensemble the volume V, the number of particles N and thetemperature T are considered constant. The canonical partition sum Z can bedefined using the following formula and inserting equation (2.1.1) leads to thefollowing result:
Z =∑α
e−EαpotkT =
∑α
N∏i=1
efl cos θikT = (
∑α
efl cos θkT )N (2.1.2)
Where k is the Boltzmann constant and T is the temperature.
Due to the fact that the angle is continuous, the sum can be replaced by anintegral, integrating over the whole space:
Z = (
∫dΩ · e
fl cos θkT )N = (
2πkT
flsinh(
fl
kT))N (2.1.3)
2.1. FORCE-EXTENSION BEHAVIOR OF MOLECULES 5
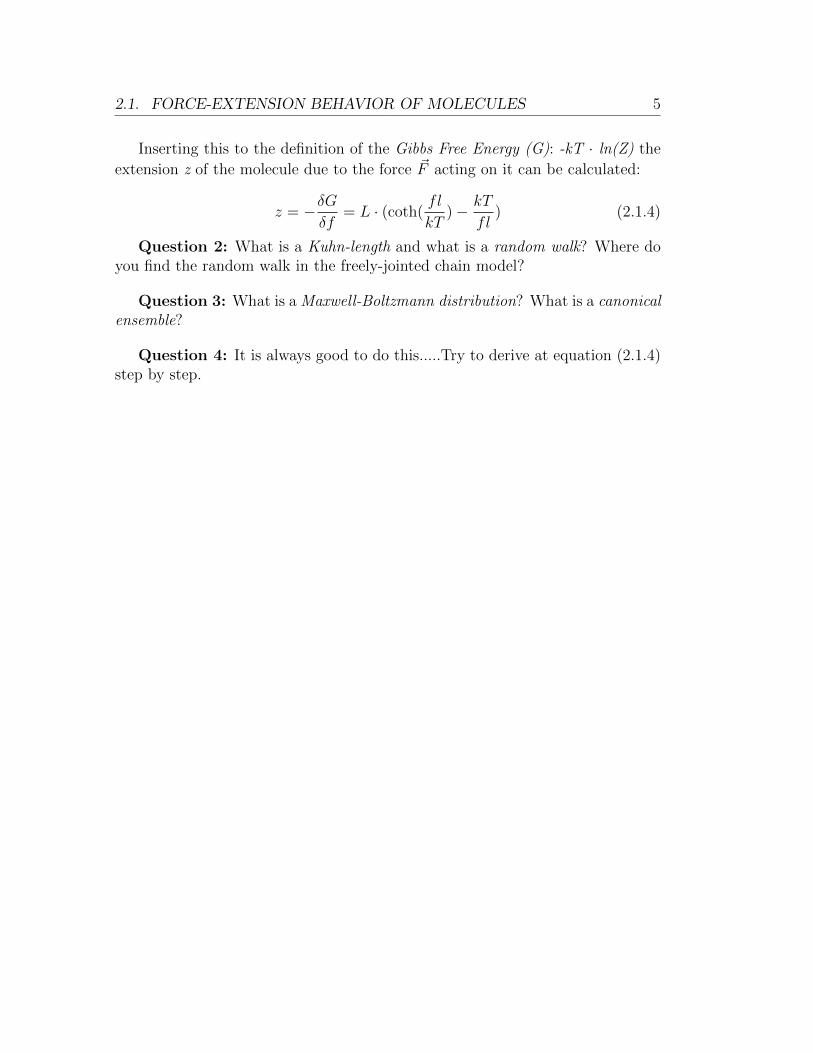
Inserting this to the definition of the Gibbs Free Energy (G): -kT · ln(Z) the
extension z of the molecule due to the force ~F acting on it can be calculated:
z = −δGδf
= L · (coth(fl
kT)− kT
fl) (2.1.4)
Question 2: What is a Kuhn-length and what is a random walk? Where doyou find the random walk in the freely-jointed chain model?
Question 3: What is a Maxwell-Boltzmann distribution? What is a canonicalensemble?
Question 4: It is always good to do this.....Try to derive at equation (2.1.4)step by step.
6 CHAPTER 2. THEORY
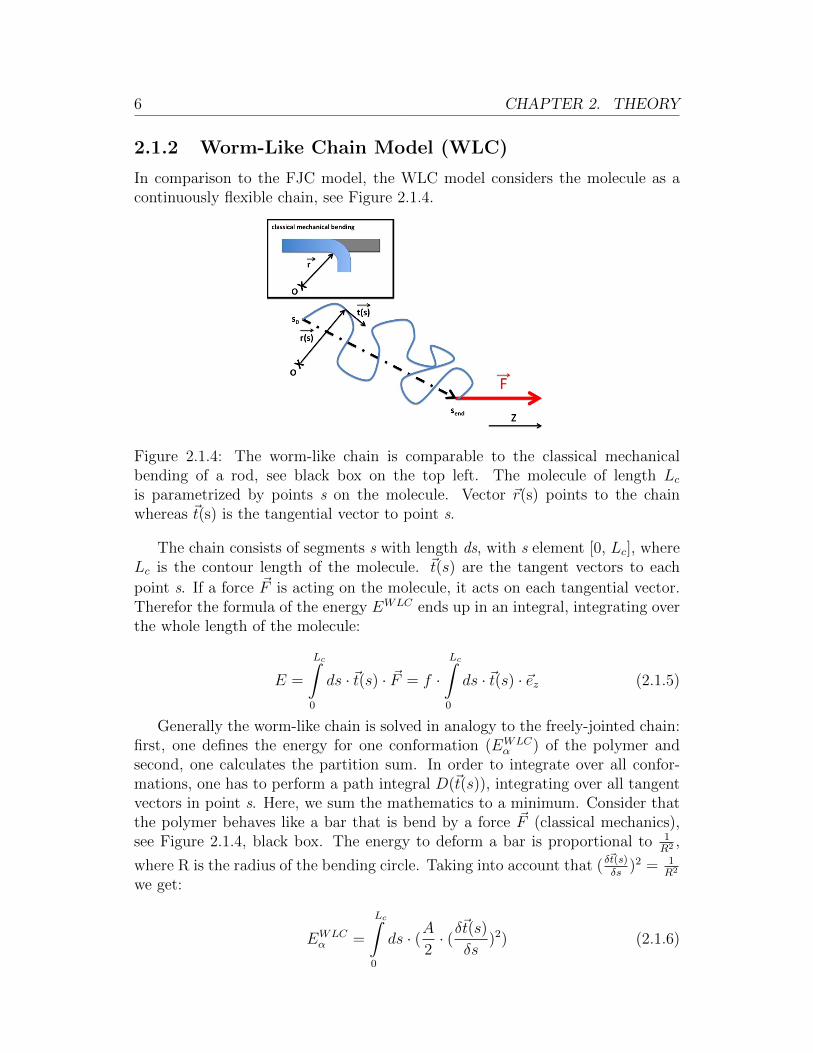
2.1.2 Worm-Like Chain Model (WLC)
In comparison to the FJC model, the WLC model considers the molecule as acontinuously flexible chain, see Figure 2.1.4.
Figure 2.1.4: The worm-like chain is comparable to the classical mechanicalbending of a rod, see black box on the top left. The molecule of length Lcis parametrized by points s on the molecule. Vector ~r(s) points to the chainwhereas ~t(s) is the tangential vector to point s.
The chain consists of segments s with length ds, with s element [0, Lc], whereLc is the contour length of the molecule. ~t(s) are the tangent vectors to each
point s. If a force ~F is acting on the molecule, it acts on each tangential vector.Therefor the formula of the energy EWLC ends up in an integral, integrating overthe whole length of the molecule:
E =
Lc∫0
ds · ~t(s) · ~F = f ·Lc∫0
ds · ~t(s) · ~ez (2.1.5)
Generally the worm-like chain is solved in analogy to the freely-jointed chain:first, one defines the energy for one conformation (EWLC
α ) of the polymer andsecond, one calculates the partition sum. In order to integrate over all confor-mations, one has to perform a path integral D(~t(s)), integrating over all tangentvectors in point s. Here, we sum the mathematics to a minimum. Consider thatthe polymer behaves like a bar that is bend by a force ~F (classical mechanics),see Figure 2.1.4, black box. The energy to deform a bar is proportional to 1
R2 ,
where R is the radius of the bending circle. Taking into account that ( δ~t(s)δs
)2 = 1R2
we get:
EWLCα =
Lc∫0
ds · (A2· (δ
~t(s)
δs)2) (2.1.6)

2.1. FORCE-EXTENSION BEHAVIOR OF MOLECULES 7
Where A = kT · LP . LP is called persistence length and defines the rigidityof the chain. Segments, smaller than the persistence length behave like a rigidrod. Segments larger than the persistence length are flexible and can be bend.An exact solution of the WLC model is hard to derive, as one has to perform thepath integral:
~t(L)∫~t(0)
D(~t(s)) · exp(−LP2
) ·L∫
0
ds(δ~t(s)
δs)2 (2.1.7)
Doing an interpolation facilitates the solution of the worm-like chain. Therelation of force-extension for a worm-like chain behaving molecule is in 90 percentagreement to the exact solution:
fLPkT
=z
L+
1
4 · (1− zL
)2− 1
4(2.1.8)
Where f is the force acting on the molecule, LP is the persistence length, z isthe extension and LC is the total length of the molecule.
Question 4: What is the difference between the end-to end distance and thecontour length of a molecule?
Question 5: How many fitting parameters does Equation 2.1.8 have? Is thisformula an exact solution or is it an approximated solution?
Question 6: What is the persistence length? Is the persistence length tem-perature dependent (think of spaghetti: is the persistence length the same beforeand after cooking it)? What do you think is the persistence length of ds DNA?
8 CHAPTER 2. THEORY
2.2 Double-stranded DNA under Force and Torque
In this Chapter we explain how the stretching force on the bead is calibrated ina magnetic tweezers setup and how DNA reacts to induced torques.
2.2.1 Force Calibration in a Magnetic Tweezers Setup
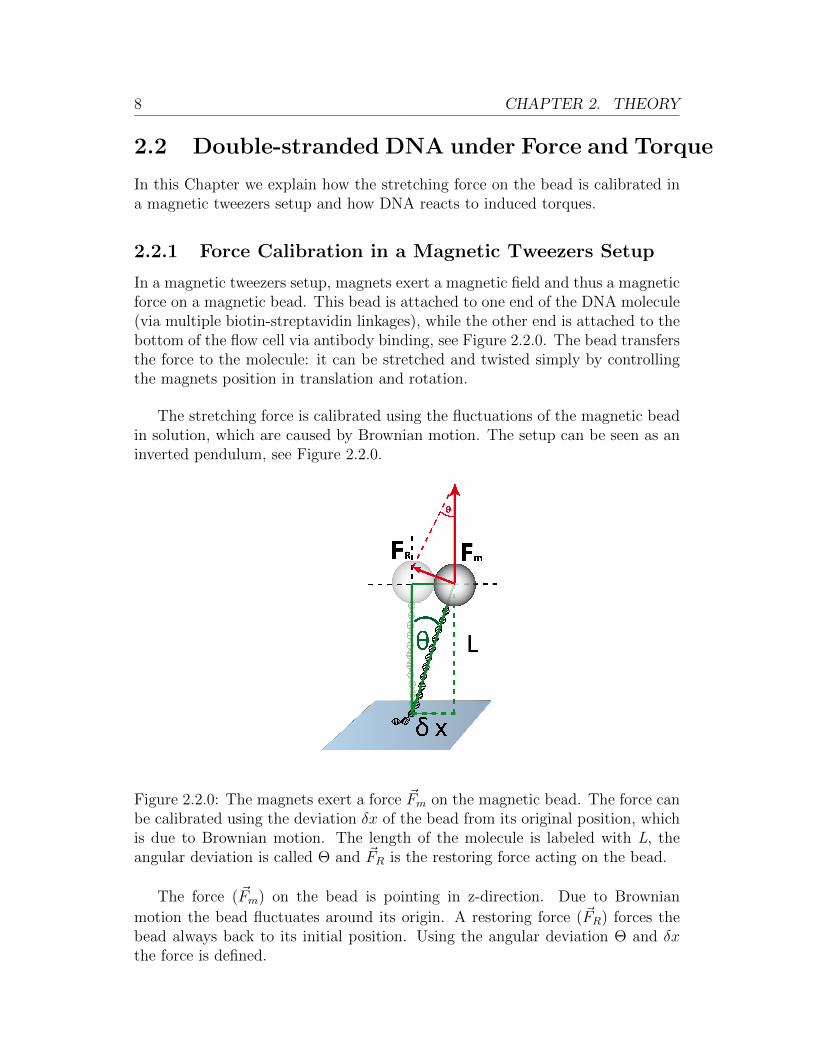
In a magnetic tweezers setup, magnets exert a magnetic field and thus a magneticforce on a magnetic bead. This bead is attached to one end of the DNA molecule(via multiple biotin-streptavidin linkages), while the other end is attached to thebottom of the flow cell via antibody binding, see Figure 2.2.0. The bead transfersthe force to the molecule: it can be stretched and twisted simply by controllingthe magnets position in translation and rotation.
The stretching force is calibrated using the fluctuations of the magnetic beadin solution, which are caused by Brownian motion. The setup can be seen as aninverted pendulum, see Figure 2.2.0.
Figure 2.2.0: The magnets exert a force ~Fm on the magnetic bead. The force canbe calibrated using the deviation δx of the bead from its original position, whichis due to Brownian motion. The length of the molecule is labeled with L, theangular deviation is called Θ and ~FR is the restoring force acting on the bead.
The force (~Fm) on the bead is pointing in z-direction. Due to Brownian
motion the bead fluctuates around its origin. A restoring force (~FR) forces thebead always back to its initial position. Using the angular deviation Θ and δxthe force is defined.

2.2. DOUBLE-STRANDED DNA UNDER FORCE AND TORQUE 9
~FR = sin Θ · ~Fm =δx
l· ~Fm (2.2.1)
We find that the bead is in a harmonic potential with spring constant κ = Fml
.The system has only one degree of freedom and therefore we derive at:
1
2· κ · (δx)2 =
1
2kBT (2.2.2)
Inserting the spring constant and solving the equation for Fm, we can calculatethe force acting on the bead:
Fm =l · kBT(δx)2
(2.2.3)
In order to calibrate the force, one has to measure the xy-movement of thebead (several times of its characteristic time).
Question 6: What is Brownian motion?
Question 7: What is the characteristic time of a system? In this case: doesthe characteristic time of the system depend on the stretching forces?
Question 8: How could one increase the forces in an MT setup?
10 CHAPTER 2. THEORY
2.2.2 Inducing Twists on DNA Molecules
MT are able to induce twists on DNA molecules. DNA is a right handed moleculeand behaves (for forces larger 1 pN) different upon the direction of applied numberof turns n. Positive turns twist DNA with its helical nature, while negative turnstwist the molecule against its helical nature. The response of DNA to appliedturns depends on the stretching force. For forces smaller 1 pN, DNA behavessymmetric according to the applied number of turns, see Figure 2.2.3A (leftcolumn). For a small number of turns the molecule’s extension stays constant,while the molecular torque increases linearly. Beyond the buckling transition(indicated with blue squares for 0.9 and 1.1 pN) the molecule’s extension decreaseslinearly, while the molecular torque stays constant. At the buckling transition itis energetically more favorable to form DNA plectonemes as indicated by coarse-grained simulations in 2.2.3B in contrast to staying overwound. In the post-buckling regime every turn of the molecule leads to the formation of a DNAsupercoil. For higher stretching forces (> 1pN) the respond of DNA upon thedirection of applied turns is asymmetric. While in general the buckling pointshifts to a larger number of applied turns with higher stretching forces, there isno buckling point in negative direction, see Figure 2.2.3A (right column). Insteadtorque-induced melting occurs at -10 pN·nm. Torsional stress is hereby releasedby local basepair breaks.
At the buckling point (nb) the DNA’s extension is reduced due to the forma-tion of supercoils. The change in the end-to end distance corresponds to the partof DNA that forms DNA supercoils.
Etorsion = 2πn · Γ (2.2.4)
Γ =C
L· 2πn (2.2.5)
Where Γ is the Torque and C is the torsional stiffness.
At the buckling point (nb) the twist energy Etorsion of the molecule corre-sponds to the energy that is needed to form such a loop (Eloop). Eloop has twocontributions: the work W that is needed to shorten the DNA and Ebend to bendthe DNA strand.
Etorsion(nb) = Eloop = W + Ebend (2.2.6)
One supercoil can be seen as a circle with radius r. The work, needed toreduce the length of the DNA molecule against the force F is
W = −2πrF (2.2.7)

2.2. DOUBLE-STRANDED DNA UNDER FORCE AND TORQUE 11
Figure 2.2.3: (A) Extension (top) and torque vs. applied number of turns (bot-tom) for different stretching forces. Buckling points (nb) are indicated for 0.9pN and 1.1 pN in the extension vs. turns plot with a blue square. (B) Coarse-grained DNA simulations show torsionally relaxed DNA, underwound DNA (upontorque-induced melting at -10 pN·nm) and overwound DNA with the formationof DNA plectonemes. References: Kriegel et al. Nucleic Acids Res. 2017 “Prob-ing the salt dependence of the torsinal stiffness of DNA by multiplexed magnetictorque tweezers” and Kriegel et al. Nucleic Acids Res. 2018 “The temperaturedependence of the helical twist of DNA”.
while the energy for the bending to perform one loop is (see WLC)
Ebend =
∫ 2πr
0
dsA
2
1
r2= πA
1
r(2.2.8)
Minimizing the looping energy one can derive the radius r of the loop
r =
√A
2F(2.2.9)
Having the radius, one can calculate the buckling torque Γb and the numberof turns nb where the buckling takes place.
Γb =√
2AF (2.2.10)
nb =L
2πC·√
2AF (2.2.11)

12 CHAPTER 2. THEORY
Question 9: What is the buckling point? What happens if the number ofturns n is exactly nb?
Question 10: How does the torque of ds DNA behave (referring to thebuckling point)?
Question 11: Where is/where are the buckling point(s) in Figure 2.2.3?
Chapter 3
Setup
This Chapter describes the experimental setup, the software used to control theinstrument, and the fabrication of the flow cells used in this experiment.
3.1 Experimental Setup
In MT the molecule of interest is attached to the surface of a flow cell and onthe other side to a superparamagnetic bead (Figure 3.1.0). A pair of permanentmagnets placed above the flow cell exert magnetic fields, which in turn inducemagnetic forces on the superparamagnetic bead. The stretching force can be con-trolled by changing the permanent magnets position in translation. The moleculesrotation can be controlled by rotating the magnets. The flow cell is mounted ona flow cell holder, such that the flow cell is placed on top of the oil objective. Theobjective itself can be moved up and down very precisely using a piezo, whichis in particular needed to perform a ”look up table” for z-tracking. To controlliquid exchange a pump is connected to the flow cell. A LED monochromaticallyilluminates the flow cell through the gap (1 mm) of the magnet assembly. Pic-tures of the illuminated area are taken by a CMOS camera and transferred to acomputer where image analysis is performed. The tether itself cannot be seen inMT, that is why the beads are tracked and used for data analysis.
Measurements of the bead are performed out-of focus. The diffraction pat-tern of the bead is used in order to track the tether extension along z (Figure3.1.0). A calibration of the bead’s diffraction pattern is performed prior to themeasurement. Therefore the magnets are brought close to the flow cell to exertlarge stretching forces which cause small fluctuations of the bead itself. The po-sition of the objective can be controlled by a piezo. In oder to create a ”look-uptable (LUT)”, the objective’s position is moved in nanometer steps (e.g. 100nm) and the bead’s diffraction pattern is captured. To get precise informationin vertical direction the software interpolates between each picture and creates
13

14 CHAPTER 3. SETUP
LED
Pump
Lens
CCD
Piezo
LensMirror
Objective
NNSS
Liquidinow
Tetheredbead
Referencebead
Magnets+ Holder
Figure 3.1.0: Overview of a Magnet Tweezers Setup. A pair of permanent mag-nets is placed on top of the flow cell. The light of the LED illuminates the samplefrom above. The light is directed to a camera via a mirror and a lense.
the LUT. During the measurement the piezo is kept at a fixed position and thecurrent diffraction pattern of the beads are compared to the LUT, which returnsthe extension of the molecule. For the lateral position of the bead, the center ofthe diffraction rings are calculated via cross-correlation.
Figure 3.1.0: Tracked pictures of magnetic particles. The pattern of the diffrac-tion rings changes with distance to the focus. This feature is used to determinethe molecule’s extension.
To reduce effects of mechanical drift, which can disturb the measurements inlateral as well as in vertical direction, a reference bead is tracked. Reference beadsare beads that are stuck to the surface of the flow cell. To correct for drift, therecorded trace of the reference bead is subtracted from bead’s that are attachedto DNA molecules. Note: saved values in this course are without subtraction ofthe reference bead.

3.1. EXPERIMENTAL SETUP 15
You are asked to perform a force calibration of the MT setup as well as force-extension measurements for DNA molecules. Figure 3.1.0 illustrates the forcesfor each height of the magnets used in this laboratory course and can be used towrite measurement protocols.
0 1 2 3 4 5 6 7 8 9 100
1
2
3
4
5
6
Magnet distance (mm)
Forc
e (p
N)
Force vs. Magnet Position for MyOne Beads
0 2 4 6 8 1010−2
10−1
100
101
Figure 3.1.0: Force vs. magnet position calibrated for the setup used in thislaboratory course and for MyOne beads. The solid line is a double-exponentialfit to the measured values.

16 CHAPTER 3. SETUP
3.2 Software
The software to control the instrument is written in LabVIEW. The piezo stageand both motors to control the magnets (translation and rotation) can be con-trolled using the software. The pump to exchange fluids has to be used manually.
Figure 3.2.0: “BeadTrackerMain.vi” is the main window of the software. It con-tains a real time image, as well as the option to select for beads and perform aLUT.
The software consists of three separated windows (see Figure 3.2.0 and 3.2.0).A live picture of the field of view (FOV) of the flow cell is shown in “BeadTrack-erMain.vi” window. Basic setup configurations, selection of beads and the LUTare made in this window. Motors and the piezo stage are controlled in “Mo-torUI.vi”. “ExperimentProgramUI.vi” contains all options to start and controlmeasurements.

3.2. SOFTWARE 17
The bead positions are tracked in real time and saved in text files including themotor positions. Another text file contains the “sections” frame number writtenin a protocol (see Figure 4.2.2).
(a) In the window “ExperimentProgra-mUI.vi” the folder path can be defined,protocols can be written and measure-ments can be started.
(b) With “MotorUI.vi” the piezo-stage aswell as the two motors for the magnets canbe controlled manually.
Figure 3.2.0: “ExperimentProgramUI.vi” and “MotorUI.vi” to start measure-ments and to control motor positions, respectively.
18 CHAPTER 3. SETUP
3.3 Flow cell and Attachment Chemistry
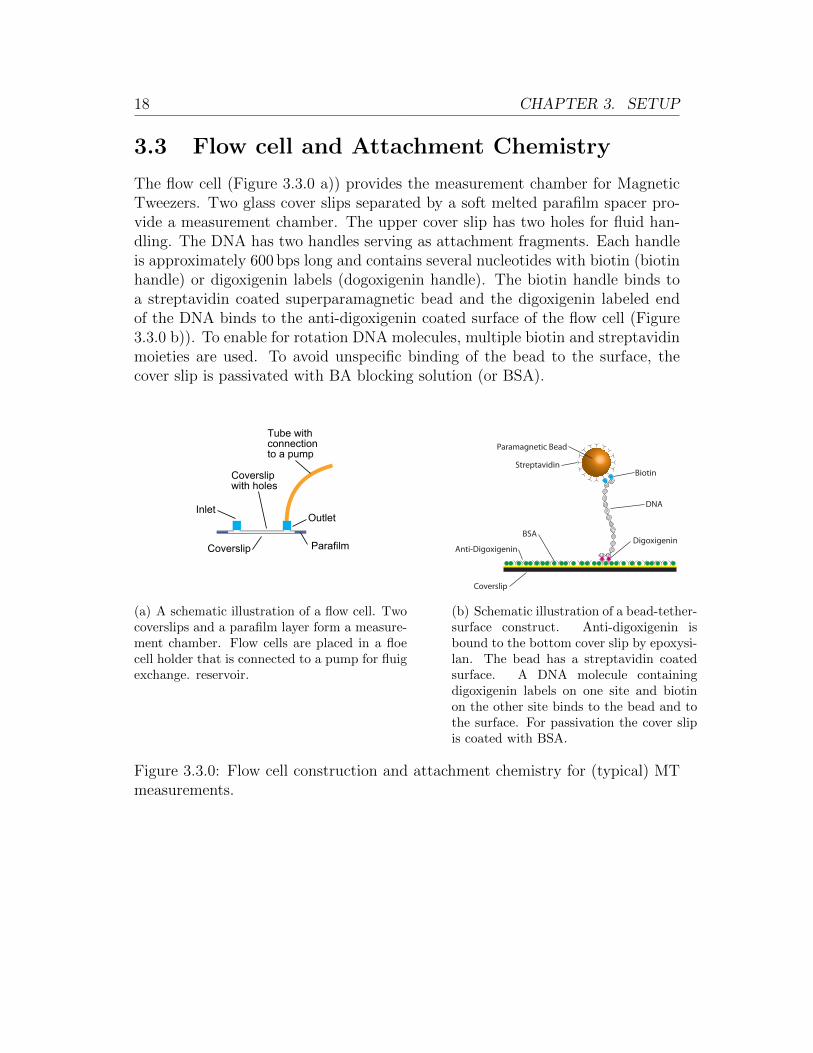
The flow cell (Figure 3.3.0 a)) provides the measurement chamber for MagneticTweezers. Two glass cover slips separated by a soft melted parafilm spacer pro-vide a measurement chamber. The upper cover slip has two holes for fluid han-dling. The DNA has two handles serving as attachment fragments. Each handleis approximately 600 bps long and contains several nucleotides with biotin (biotinhandle) or digoxigenin labels (dogoxigenin handle). The biotin handle binds toa streptavidin coated superparamagnetic bead and the digoxigenin labeled endof the DNA binds to the anti-digoxigenin coated surface of the flow cell (Figure3.3.0 b)). To enable for rotation DNA molecules, multiple biotin and streptavidinmoieties are used. To avoid unspecific binding of the bead to the surface, thecover slip is passivated with BA blocking solution (or BSA).
InletOutlet
Parafilm
Coverslipwith holes
Coverslip
Tube withconnectionto a pump
(a) A schematic illustration of a flow cell. Twocoverslips and a parafilm layer form a measure-ment chamber. Flow cells are placed in a floecell holder that is connected to a pump for fluigexchange. reservoir.
Biotin
DNA
BSA
Anti-DigoxigeninDigoxigenin
Paramagnetic Bead
Streptavidin
Coverslip
(b) Schematic illustration of a bead-tether-surface construct. Anti-digoxigenin isbound to the bottom cover slip by epoxysi-lan. The bead has a streptavidin coatedsurface. A DNA molecule containingdigoxigenin labels on one site and biotinon the other site binds to the bead and tothe surface. For passivation the cover slipis coated with BSA.
Figure 3.3.0: Flow cell construction and attachment chemistry for (typical) MTmeasurements.
Chapter 4
Measurements
This Chapter guides you through the experiments today. Read the text carefully,tray to follow the manuscript and ask the tutor if you have questions.
4.1 Preparation of the Flow cell
The flow cell was already coated with anti-digoxigenin and stored over night witha BA-blocking solution. Before you can start the experiments you have to preparethe flow cell by yourself. You have to prepare a DNA-Bead solution, give this tothe flow cell, flush with buffer such that you remove unbound beads from the celland insert magnets. A step-by step protocol follows.
Make sure a tutor is present and get familiar with the instrument. Before youstart with the following protocol, remove and remount the magnet holder. Fur-thermore, try to move the z-motor and rotation motor. In the end, the magnetholder has to be removed and the motor has to be set to “all up”.
• Cleaning the beads: add 2 µl of well mixed MyOne-bead solution to 10 µl1x PBS and mix
• Use a magnetic holder to keep beads to one side and remove 10 µl
• Redo washing step
• Add 10 µl 1x PBS
• Add 1.0 µl DNA and wait for 15 min. Mix solution by tapping the reservoirevery 3 minutes, avoid mixing with a pipette (results in DNA nicks)
• Fill up with 180 µl 1x PBS
• Remove magnets if not done so far
19

20 CHAPTER 4. MEASUREMENTS
• Flush flow cell with 600 µl 1x PBS (v = 170 µlmin
)
• Fill the chamber with ca. 60 µl DNA-beads and wait for 10 min
• Flush with 800 µl 1xPBS (v = 400 µlmin
)
• Mount magnets and drive them down to about 2 mm distance to the flowcell
Get a tutor (if necessary) for the following steps!
Note: From this point, the magnets should never have a larger distance than8 mm from the flow cell for more than 20 seconds to avoid sticking of the beads.
Within the next step you have to select for beads that are bound to a single,coilable DNA molecule.
• Move the piezo-stage (window “MotorUI.vi”) to get the beads in focus(ideally you find two foci one for beads attached to DNA and one for beadsunspecifically attached to the surface of the flow cell)
• Choose the beads that have DNA attached
• Move the piezo-stage 8 µm upwards
• Search in the field-of-view in window “BeadTrackerMain.vi” for two beadswhich are not moving, i.e. unspecifically attached to the surface, and whoseinterference rings are not overlapping. Remember their positions. Thesebeads can be used as reference beads.
• Press “select beads” and click “remove all”. Press “add” and click on thetwo beads chosen before as reference beads. Now, click on every other beadyou can see whose interference rings are not overlapping. Make sure thatthe squares that the program puts around the beads is fully visible in thefield of view. Do not use beads that are too close to the edge. LabVIEWwill crash!
• Press “close” to close the window

4.1. PREPARATION OF THE FLOW CELL 21
For z-tracking a LUT has to be calibrated for every single bead:
• If necessary: get a tutor
• Move magnets to a distance of 0.3 mm to apply a high force, which is neces-sary to avoid large fluctuations of the beads during the LUT-measurement.
• Click on “Tracking” in the “BeadTrackerMain.vi” window and type theactual piezo position minus 5 µm into the field “ZLUT Start piezo Z”. Thissets the lowest piezo position for the LUT. The LUT settings are by default100 steps a 100 nm in the upward direction, so that the actual piezo positionis in the middle of the LUT.
• Press “Build ZLUT” to start the LUT measurement and wait until thesoftware has finished
• In case you are asked “QTrk DLL path...”, press two times “ok” in thewindows that popped up
The setup is now ready to track beads. To ensure that tracked beads areattached to a single and coilable DNA tether, we perform three tests prior to theactual measurements:
• Choose a folder to save the measurements and a name for your measurementin window “ExperimentProgramUI.vi”
• Check that the motor position is still at 0.3 mm
• Start the measurement with the button “Run experiment” in the window“ExperimentProgramUI.vi”
• A new window will pop up
• Wait until the camera reacts (frame number in this window) before youclick on any other button. LabVIEW is “slow”.
• Move the motor to 12 mm distance, wait 10 seconds and drive back to0.3 mm
• Stop measurement (“abort experiment”)
• Activate “Trace & LUT” in window “BeadTrackerMain.vi”, click throughthe traces and delete every bead which has a smaller change in distance as1.5 µm (not the two reference beads zero and one!). Note: You can changethe number of frames which are shown in the trace and you can subtracta reference bead from the traces to see the z- extension more clearly. Askyour tutor if you have problems.
22 CHAPTER 4. MEASUREMENTS
• Change the measurement name for the second measurement
• Check that the motors are at a distance of 0.3 mm (≈ 5 pN)
• Start the measurement
• Rotate the motors to - 30 turns (at 1 turn/s)
• Rotate back to 0 turns
• Stop the measurement
• What do you expect according to Figure 2.2.3? Check the traces for beadswho did not behave as expected and delete them with “Discard bead”
• Change the measurement name for the third test
• Rotate -20 turns at a distance of 4 mm (0.5 pN) and back to 0
• What do you expect according to Figure 2.2.3? Check the traces and discardbeads.
• Never discard the last bead. This can crash LabVIEW. If the last bead isnot usable in your case, make a note in you lab book and ignore the datain the analysis at home
If you have less than two good beads left, contact your tutor.Do not discard beads anymore!
4.2. EXPERIMENT 1: FORCE-EXTENSION MEASUREMENT 23
4.2 Experiment 1: Force-Extension Measurement
Magnetic Tweezers measure only relative length changes, but not the currenttotal length of a tether. Therefore, start with a measurement to get the zeroposition of the tether, i.e. when the bead touches the surface. To get this value,measure again from 0.3 mm to 12 mm (15 s) to 0.3 mm, magnet height. Do notdiscard beads anymore.
In a second file, determine the force for varying magnet heights for all DNAmolecules, similar to Figure 3.1.0. Therefore write a measurement protocol andconsider that the characteristic time of the system can be calculated by
τc =12 · π2 · η ·R
F· l (4.2.1)
with η the viscosity (1.1 · 10−3 kgms
), l the extension of the tether, R the radius ofthe bead (0.5 µm) and F the force. The precision of the measurement ε dependson how often the characteristic time will be measured. It is defined by
ε =
√τct
(4.2.2)
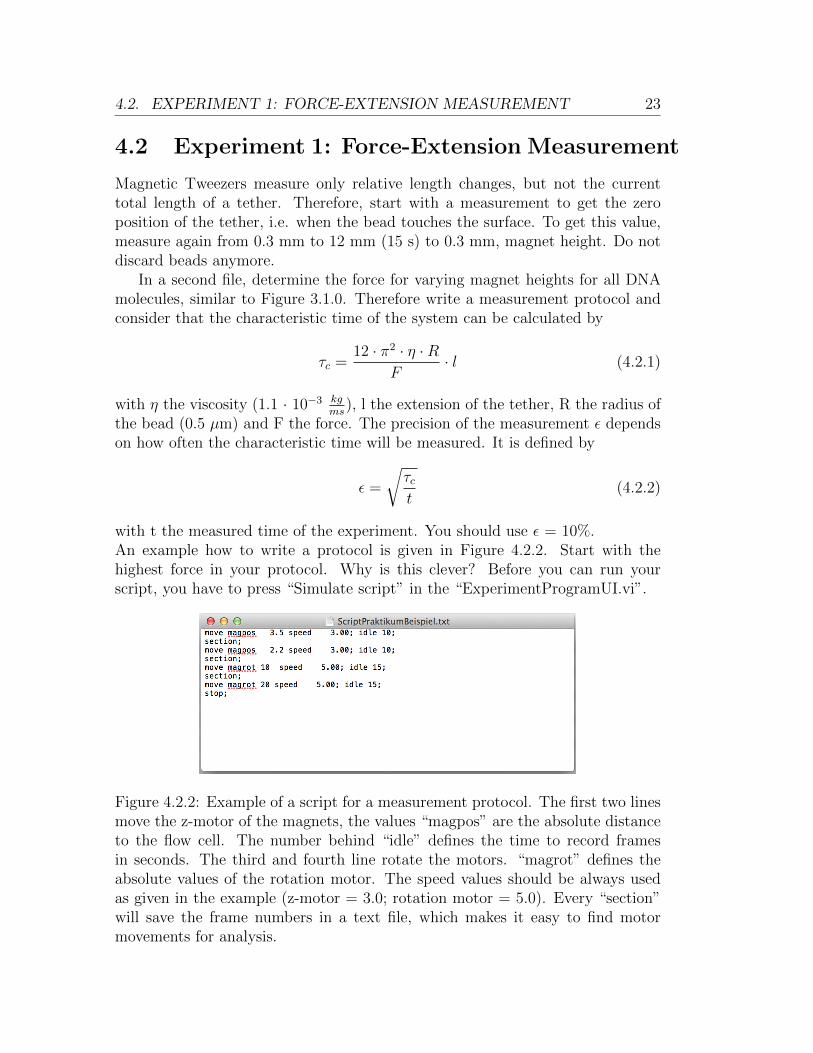
with t the measured time of the experiment. You should use ε = 10%.An example how to write a protocol is given in Figure 4.2.2. Start with thehighest force in your protocol. Why is this clever? Before you can run yourscript, you have to press “Simulate script” in the “ExperimentProgramUI.vi”.
Figure 4.2.2: Example of a script for a measurement protocol. The first two linesmove the z-motor of the magnets, the values “magpos” are the absolute distanceto the flow cell. The number behind “idle” defines the time to record framesin seconds. The third and fourth line rotate the motors. “magrot” defines theabsolute values of the rotation motor. The speed values should be always usedas given in the example (z-motor = 3.0; rotation motor = 5.0). Every “section”will save the frame numbers in a text file, which makes it easy to find motormovements for analysis.
24 CHAPTER 4. MEASUREMENTS
4.3 Experiment 2: Rotation-Extension Measure-
ment
Here, you should test DNA tether extension when turning the magnets. Thereforemeasure rotation curves from - 40 to + 40 turns in steps of 2 turns at forces of5.0 pN, 2.0 pN, 1.5 pN, 1.0 pN, 0.7 pN, 0.5 pN and 0.4pN. Start with the highestforce. Why is this clever? Use Figure 3.1.0 to estimate the z position of themotors. It is recommended to start a new measurement for every force for easieranalysis. A measurement time of 10 s for each turn is sufficient.
Chapter 5
Analysis
5.1 Analysis Experiment 1: Force-Extension Mea-
surement
• Create a plot as shown in Figure 3.1.0. Fit an exponential function to yourdata.
• Plot the force-extension of the DNA molecule and fit the FJC as well asthe WLC. Determine the Kuhn length (FJC) as well as the persistencelength (WLC). For how many basepairs is the DNA molecule supposed tobe stiff? Compare your values to literature. Which model describes betterthe behavior of DNA?
5.2 Analysis Experiment 2: Rotation-Extension
Measurement
• Plot the extension of the DNA vs. the number of turns for every force
• Explain the difference of the plots for all forces
• Determine the size of one supercoil
• Determine the buckling point nb and the buckling torque Γb for all forcesand determine the torsional stiffness of DNA
25