magnit 1 h2016_reviewed
TRANSCRIPT

INVESTOR PRESENTATION
1H 2016 FINANCIAL RESULTS published on August 24, 2016

Magnit at a Glance
Magnit at a Glance
Source: Company, Thomson Reuters, Company’s calculations based on IFRS accounts for 1H2016
2
2 397 Cities & Towns
№1 Russian Food Retail
Chain by Revenue
and Number of Stores
12 888 Total Number
of Stores
4 677 thous.sq.m.
Selling Space
34 DCs
5 836 Trucks
Multi-format Business Model
Comprising Convenience, Hypermarkets,
“Magnit Family” & Drogerie Stores
№3 Retailer in Europe
in Market
Capitalization $16bn Market
Capitalization
>7% Share in Russian
Grocery Sector
(As of FY 2015)
Shareholder Structure as of 1H 2016
61,4% Free-float
35,1% Sergey Galitskiy, CEO
0,8% Lavreno Ltd. (Cyprus)
0,1%
As of June 30, 2016
As of June 30, 2016
2,7% Other

Magnit at a Glance
Key Metrics
3
Source: Company’s estimates and calculations
522bn 14,7 %
5,01%
Net
Margin
9,89%
EBITDA
Margin
1,1
Net debt/
LTM EBITDA
1000-1100 80 1200
P =
Revenue growth
Y-o-Y
Guidance for FY2016
Figures for 1H 2016
14-16% Sales Growth Rub
10-10,5%
EBITDA Margin
67bn Capex Rub
New Convenience Stores New Hypermarkets New Drogerie Stores

Magnit at a Glance
Strategy
4
Growth
Value Efficiency
Multi-format Organic
Store Growth
Geographic
Scope
Density of Store
Coverage
Low
Prices
High
Quality
Assortment Cost
Management
Vertical
Integration
Centralization

65
Magnit at a Glance
Russian Food Retail Market
5
Market Composition by Format
RUB 13 410bn Market
Size
FY 2015 % Modern
Retail
Penetration
Non-Modern Modern
Source: INFOLine, as of December 31, 2015
65% 35%
Top-7 Retail Chains
22,5%
Modern Non-Chain
Stores
16,5%
Other chains
26%
Traditional Trade
28%
Open Markets
7%

Magnit at a Glance
Magnit vs Peers
6 Source: Companies, INFOLine, Thomson Reuters, Magnit’s Estimates
Number
of Stores, eop 2015
Selling Space
thous. sq.m., eop
2015
Revenue
RUB bn, eop 2015
Market Cap
US$ bn, eop 2015
Market Share
%, eop 2015
7
6
2
2
1
3
2
Not public
Not public
950,6
808,8
272,3
252,8
162,5
415,6
225,0
12089
7 020
2 708
172
146
96
87
Magnit
X5
Dixy
Lenta
Okey
Auchan
Metro
4 414
3 333
908
882
593
836
661
19,0
5,1
0,5
3,3
0,5

2 588 Drogerie Stores 92 511 658 745 237 238
107
9 902 Convenience Stores
228 Hypermarkets
170 Magnit Family
34 Distribution Centers
6 44 33 52 12 12 11
8 63 38 64 15 30
10
358
1684 2667 2961 972 895
365
Operational Overview
Geographical Coverage
7 Source: Company,
as of June 30, 2016
2 397 Cities
& Towns
7 Federal
Regions
North
Caucasus Southern Volga North
West
Urals Siberia Central
1 8 10 8 2 3 2

Operational Overview
Logistics System
8 Source: Company,
as of June 30, 2016
12 888 Total Number
of Stores
1 351 thous.sq.m.
Warehousing Space
34 DCs
5 836 Trucks
10
8
8
3
1
2
2
Central
Volga
Southern
Urals
North Caucasus
North West
Siberia
3684
3957
2293
1179
462
826
487
464,141
283,871
310,387
142,533
40,799
73,601
35,438
Centralization Ratio
%
90
10
92
8
Convenience Stores
1H2016 Future Targets
73
27
80
20
Hypermarkets
Delivered from DC
Delivered from supplier
Delivered from DC
Delivered from supplier

Operational Overview
Suppliers
9 Source: Company,
as of June 30, 2016
5 800 Domestic
Suppliers
4 600 Local Suppliers
1 200 Federal Suppliers
Assortment
55% 45%

Operational Overview
Direct Import
10
Source: Company,
Direct Import – as of December 31, 2015;
Private Label – as of June 30, 2016
11 % Share
of Revenue 611 PL
SKUs M 84% Food
Items
Private Label
9 % International
Direct Import 757 Open
Contracts

Operational Overview
Employees
11 Source: Company,
as of June 30, 2016
259 389 Employees
31 650 Average
Monthly
Salary 11% Wage Rate
Increase
P =
190 420 In-store
Personnel
36 592 People Engaged
in Distribution
19 923 People in Regional
Branches
10 031 People Employed
by Head Office
1000 employees
2 423 Other

Operational Overview
Competitive Attributes
12
43-45 % of Family
Budget
Spent on Food
Location Quality
(of Products)
Assortment Reliability Atmosphere Prices
5 000 People —
Minimum
Population
(1 500–1 600 Families)
4 000-9 500 Monthly
Family Food
Budget P =
Overlap “Good”
Cannibalization
Magnit #1
Magnit #2
500m
Competitor #1 Competitor #2
Competitor #3
500m
Sales Catchment Area
Source: Company’s Estimates

Convenience Store

Operational Overview
Convenience Store
14 Source: Company,
as of June 30, 2016
457 sq.m.
Total
327 sq.m.
Selling Space
89% Food
11% Non-food
25% Owned
75% Leased
Format Description Key Operational Statistics Opening
Size of the Store Average Ticket Payback
Store Ownership Structure
Sales Mix
Traffic
tickets/sq.m./day
Sales Density
sales/sq.m./year
LFL 1H2016 –1H2015,%
243,80 P = $3,47
245 306 P = $4 024
-0,36 Average
Ticket, RUB
2,21 Traffic
1,85 Sales
2,7
3 years
If Leased
If Owned
Cost of New Store
per sq.m. of Total Space, thousand RUB
Time to Maturity
6 months
4-6 years
Owned 35-105
Leased 10-19
Hypermarket

Operational Overview
Hypermarket
16 Source: Company,
as of June 30, 2016
80% Food
20% Non-food
73% Owned
27% Leased
Format Description Key Operational Statistics
Size of the Store Average Ticket
Store Ownership Structure
Sales Mix
Traffic
tickets/sq.m./day
Sales Density
sales/sq.m./year
LFL 1H2016 – 1H2015,%
596,91 P = $8,5
272 278 P = $4 467
1,1
6 503 sq.m.
Total
2 897 sq.m.
Selling Space
-2,48 Average
Ticket, RUB
-7,86 Traffic
-10,15 Sales
Opening
Payback
6-9 years
Cost of New Store
per sq.m. of Total Space, thousand RUB
Owned 56-98
Leased 31-41
8-15 months
Time to Maturity
S: up to 3 000
M: 3 000-6 000
L: over 6 000

Magnit Family

Operational Overview
Magnit Family
18 Source: Company,
as of June 30, 2016
2 148 sq.m.
Total
1 100 sq.m.
Selling Space
84% Food
16% Non-food
37% Owned
63% Leased
Format Description Key Operational Statistics Opening
Size of the Store Average Ticket Payback
Store Ownership Structure
Sales Mix
Traffic
tickets/sq.m./day
Sales Density
sales/sq.m./year
LFL 1H2016 – 1H2015,%
447,9 P = $6,4
349 703 P = $5 737
1,9
6-9 years
Cost of New Store
per sq.m. of Total Space, thousand RUB
Owned 71-112
Leased 31-54
8-15 months
-2,31 Average
Ticket, RUB
-4,03 Traffic
-6,25 Sales
Time to Maturity

Drogerie Store

Operational Overview
Drogerie Store
20 Source:
Company, as of June 30, 2016
290 sq.m.
Total
229 sq.m.
Selling Space
100% Non-food
13% Owned
87% Leased
Format Description Key Operational Statistics Opening
Size of the Store Average Ticket Payback
Store Ownership Structure
Sales Mix
Traffic
tickets/sq.m./day
Sales Density
sales/sq.m./year
LFL 1H2016 – 1H2015,%
305,3 P = $4,4
114 924 P = $1 885
10,86 Average
Ticket, RUB
-4,00 Traffic
6,42 Sales
0,9
3 years
If Leased
If Owned
Cost of New Store
per sq.m. of Total Space, thousand RUB
Time to Maturity
6 months
Owned 20-70
Leased 9-16
4-6 years

80%
20%
Size
of the Store sq.m.
Average
Ticket
Traffic
Tickets/ sq.m./day
Density
Sales/ sq.m./year
Sales
Mix
LFL 1H2016-
1H2015 %
Store Owner-
ship Structure
Payback Years
Cost of New
Store per sq.m.
of Total Space
Time
to Maturity Months
• Total
• Selling Space
• Food
• Non-food
• Av.ticket
• Traffic/ Sales
• Owned
• Leased
13%
87%
37%
63%
73%
27%
25%
75%
Operational Overview
Format Summary
21 Source: Company, as of June 30, 2016; * Excludes selling space designated for leases
Hypermarket
Drogerie
Store
Magnit
Family
457
6 503
290
2 148
327
2897*
229
1 100
Owned
RUB 35-105k
Leased
RUB 10-19k
2,7
1,1
0,9
1,9
P.243,8
$3,5
P.596,9
$8,5
P.305,3
$4,4
P.447,9
$6,4
P.245 306
$4 024
P.272 278
$4 467
P. 114 924
$1 885
P.349 703
$5 737
89%
11% Convenience
store
6
8-15
6
8-15
3 (if leased)
6-9
3 (if leased)
6-9
4-6 (if owned)
4-6 (if owned)
Owned
RUB 56-98k
Leased
RUB 31-41k
Owned
RUB 20-70k
Leased
RUB 9-16k
Owned
RUB 71-112k
Leased
RUB 31-54k
84%
16%
100%
-0,36
-2,48
10,86
-2,31
2,21
-7,86
-4,00
-4,03
1,85
-10,15
6,42
-6,25
Financial Overview
Summary P&L
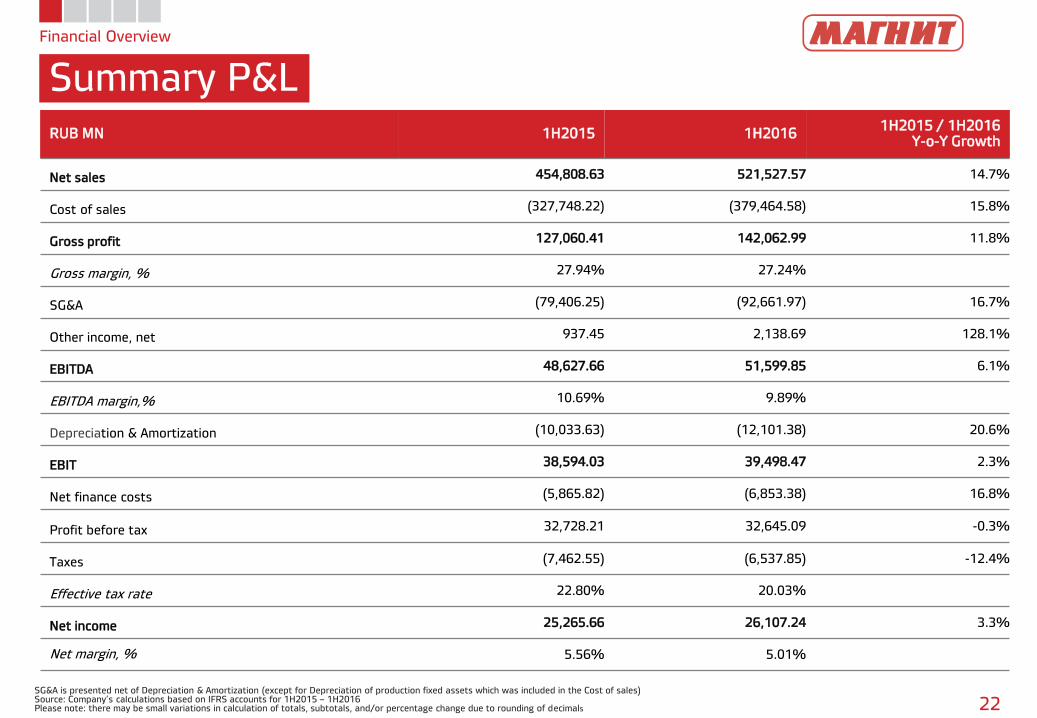
SG&A is presented net of Depreciation & Amortization (except for Depreciation of production fixed assets which was included in the Cost of sales) Source: Company’s calculations based on IFRS accounts for 1H2015 – 1H2016 Please note: there may be small variations in calculation of totals, subtotals, and/or percentage change due to rounding of decimals 22
RUB MN 1H2015 1H2016 1H2015 / 1H2016
Y-o-Y Growth
Net sales 454,808.63 521,527.57 14.7%
Cost of sales (327,748.22) (379,464.58) 15.8%
Gross profit 127,060.41 142,062.99 11.8%
Gross margin, % 27.94% 27.24%
SG&A (79,406.25) (92,661.97) 16.7%
Other income, net 937.45 2,138.69 128.1%
EBITDA 48,627.66 51,599.85 6.1%
EBITDA margin,% 10.69% 9.89%
Depreciation & Amortization (10,033.63) (12,101.38) 20.6%
EBIT 38,594.03 39,498.47 2.3%
Net finance costs (5,865.82) (6,853.38) 16.8%
Profit before tax 32,728.21 32,645.09 -0.3%
Taxes (7,462.55) (6,537.85) -12.4%
Effective tax rate 22.80% 20.03%
Net income 25,265.66 26,107.24 3.3%
Net margin, % 5.56% 5.01%

20
25 26
1H2014 1H2015 1H2016
349 455
522
1H2014 1H2015 1H2016
Financial Overview
Revenue & Costs
23 Source: Company’s calculations based on IFRS accounts for 1H2014-1H2016
27,8 27,9 27,2
10,5 10,7 9,9
5,6 5,6 5,0
0
5
10
15
20
25
30
1H2014 1H2015 1H2016
Revenue Dynamics RUB bn
Net Income Dynamics RUB bn
Margin Dynamics SG&A Expense Structure
Revenue — 522 RUB bn
Gross
Margin
EBITDA
Margin
Net
Margin
%
+30,3%
11,5% -0,5%
+14,7% +29,0%
+3,3%
LFL LFL
Sales Growth, RUB
Sales Growth, RUB
2,07 (0,42) ― Packaging & Raw Materials
1,84 (0,37) ― Repair & Maintenance
50,08 (10,05) ― Payroll & Related Taxes
1,56 (0,31) ― Taxes, Other than Income Tax
11,50 (2,31) ― Deprecation & Amortization
25,81 (5,18) ― Rent & Utilities
3,00 (0,60) ― Other
in SG&A,% in Revenue, %
2,51 (0,50) ― Advertising
1,63 (0,33) ― Bank Services
20%
104 703 RUB mn
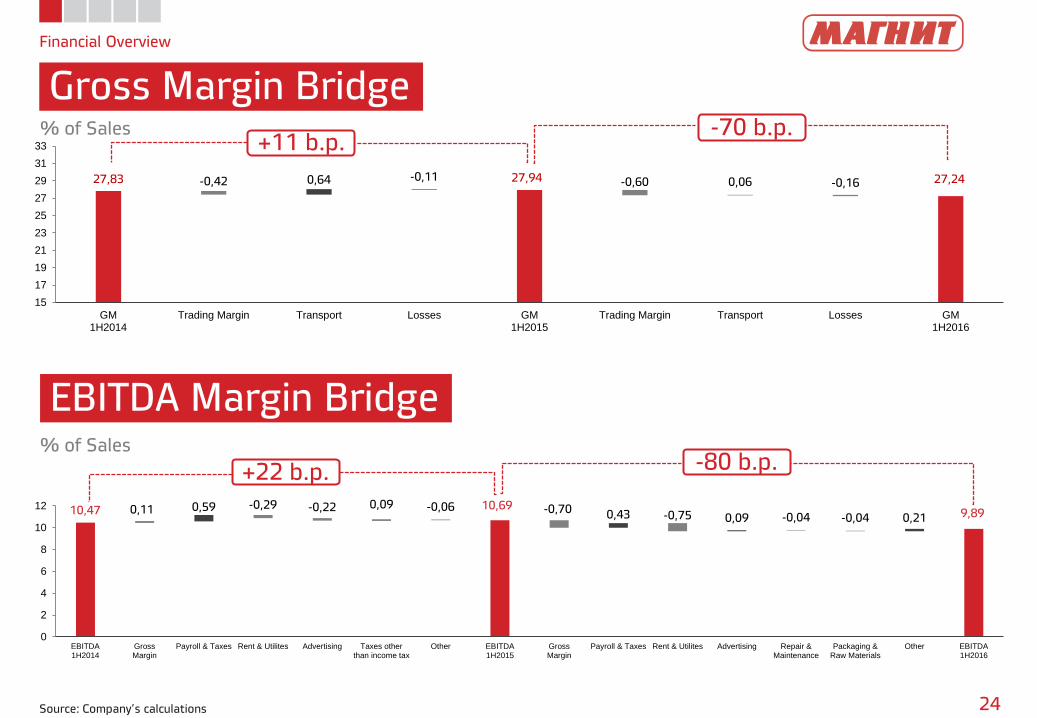
27,83 27,94 27,24 -0,42 -0,11 -0,60 -0,16 0,64 0,06
15
17
19
21
23
25
27
29
31
33
GM1H2014
Trading Margin Transport Losses GM1H2015
Trading Margin Transport Losses GM1H2016
Financial Overview
Gross Margin Bridge
24 Source: Company’s calculations
EBITDA Margin Bridge
% of Sales
% of Sales
+11 b.p. -70 b.p.
+22 b.p. -80 b.p.
10,47 10,69 9,89
-0,29 -0,22 -0,06 -0,70 -0,75 -0,04 -0,04
0,11 0,59 0,09 0,43 0,09 0,21
0
2
4
6
8
10
12
EBITDA1H2014
GrossMargin
Payroll & Taxes Rent & Utilites Advertising Taxes otherthan income tax
Other EBITDA1H2015
GrossMargin
Payroll & Taxes Rent & Utilites Advertising Repair &Maintenance
Packaging &Raw Materials
Other EBITDA1H2016

49 065
36 336
11 551
-5 777
-2 239 -5 735
-4 755 -24 434
-351 -19 299
1 972
Financial Overview
Free Cash Flow
25 Source: Company’s calculations based on IFRS accounts for 1H2015-1H2016
Working Capital Analysis
The Average Days Payable to
Suppliers is 38 Days.
Inventory Management Days is 57 Days
Working Capital: RUB 34 258 mn as of
30.06.2016
RUB mn
1H 2015
1H 2016
Adjusted for loss from disposal of PPE, provision
for doubtful receivables, foreign exchange loss,
gain on disposal of subsidiary Calculated as additions
+ transfers of PP&E
during the respective
period
Does not include cash flow from
financing activities
51 182
23 519
2 374 -3 505
-16 964
-6 796 -3 903
-21 018
-127 -20 982 15 102
AdjustedEBITDA
Change inWorking capital
Net InterestExpense
TaxesPaid
OCF Capex Other CashFlow
from InvestingActivities
FCF Payment ofDividents
Other CashFlow
from FinancingActivities
CF

Financial Overview
Balance Sheet
Source: Company’s calculations based on IFRS accounts for FY2014 - 1H2016 Please note: there may be small variations in calculation of totals, subtotals, and/or percentage change due to rounding of decimals 26
RUB MN 2014 2015 1H2016
ASSETS
Property plant and equipment 232,968.80 265,995.94 275,088.83
Other non-current assets 6,043.82 6,380.79 6,102.59
Cash and cash equivalents 17,691.54 8,390.90 4,885.52
Inventories 81,475.66 116,471.59 123,665.09
Trade and other receivables 813.26 993.67 672.00
Advances paid 4,849.30 5,295.73 4 147.20
Taxes receivable 69.38 96.67 376.07
Short-term financial assets 475.18 246.78 268.87
Prepaid expenses 242.53 320.91 350.42
Income tax receivable 131.86 - -
TOTAL ASSETS 344,761.33 404,192.98 415,556.59
EQUITY AND LIABILITIES
Equity 143,651.62 165,140.60 186,475.82
Long-term debt 44,410.14 59,411.19 34,959.71
Other long-term liabilities 10,617.70 12,998.59 14,024.63
Trade and other payables 66,794.61 88,372.22 73,498.37
Short-term debt 51,256.67 44,817.12 85,207.60
Dividends payable 14,372.03 16,993.86 7.10
Other current liabilities 13,658.56 16,459.40 21,383.36
TOTAL EQUITY AND LIABILITIES 344,761.33 404,192.98 415,556.59

Financial Overview
Capex Analysis
27
1 CAPEX for 1H2016 amounts to RUB 21,018 mn
Source: Company’s calculations based on IFRS accounts for FY2015, Company’s Estimates for FY2016
Buildings: Complete & under
Construction
Machinery & Equipment Other Assets Land
36 231 15 750 541 1 753
FY 2015 (Actual) 1
RUB 54 bn
FY 2016 (Estimates)
RUB 67 bn
RUB 500 mn
Buildings: Complete & under
Construction
Machinery & Equipment Other Assets Land
41 000 23 000 1 000 2 000
RUB 500 mn

95 667
104 228
120 167
77 975
95 837
115 282
51 257
44 817
85 208
44 410
59 411
34 960
2014 2015 1H2016
Net Debt
Short-term Debt
Long-term Debt
%
Financial Overview
Debt Burden
28 Source: Company’s calculations based on IFRS accounts for FY2014-1H2016
12,9
8,7
7,5
0,0
2,0
4,0
6,0
8,0
10,0
12,0
14,0
2014 2015 1H2016
0,9 0,9
1,1
0
0,5
1
1,5
2
2014 2015 1H2016
Debt Level Dynamics RUB mn
Credit Metrics Credit Profile
EBITDA / Finance Expenses
Net Debt / LTM EBITDA
The Company Has
an Impeccable Credit History
Collaboration with
the Largest Banks
Low Debt Burden:
Net Debt / LTM EBITDA Ratio of 1,1
No Currency Risk: 100%
of Debt is Rub Denominated
Matching Revenue Structure
Insignificant Interest Rate Risk:
Interest Payments are Made
at Fixed Rates Primarily
53,6% 43,0%
70,9%
29% of Debt is Long-term
Approximately 59%
of LT Debt is Rub Bonds

Contact Information
Contact Information
29
Timothy Post
Head of Investor Relations
+7 (961) 511-7678
http://ir.magnit.com
15/2 Solnechnaya Street
Krasnodar, 350072
Russian Federation