main street refresh: lake city transformation strategies
TRANSCRIPT

Main Street Refresh: Lake City TRANSFORMATION STRATEGIES
Community Land Use + Economics Group, LLC APRIL 2016
C O N T E N T S
The Main Street Refresh
3
Market overview
6
Surveys
9
Transformation Strategies
13
Next steps 17

3
T H E M A I N S T R E E T R E F R E S H Since its launch in 1980, the National Main Street Center has helped several thousand towns and cities revitalize their historic downtowns and neighborhood commercial corridors. But much has changed since the Main Street program began. Big-box stores and online shopping have transformed the retail industry. The Baby Boom, Gen-X, and Millennial generations have each reshaped community development priorities. Concern about environmental sustainability has heightened public interest in reusing older buildings, producing goods and services locally, and improving air, water, and land quality. These changes – and many others – have altered the economic, political, and cultural environments within which commercial district revitalization and development takes place. In 2015, the National Main Street Center launched an in-depth examination of the progress that communities with active downtown and commercial corridor revitalization programs were making in reaching their goals. One of the outcomes of this examination is the “Main Street Refresh” initiative. The “Main Street Refresh” aims to rethink the traditional Main Street model so the program is more responsive to economic context, its outcomes are directly measurable, and its methodology is available to all communities and to many different types of organizations. Colorado Main Street and the Department of Local Affairs created a special pilot project to allow three Colorado towns to join a national pilot project for the Main Street Refresh. Lake City is one of the 13 pilot cities nationally (including the three Colorado towns). The goal is to test and refine changes in the Main Street model before it is introduced to communities throughout the nation. At the core of the Main Street Refresh are economically-grounded “Transformation Strategies”. These Strategies will serve as a guide for revitalization activity over the next 3-5 years. All program activities should be guided by these Strategies, with activities spanning the Four Points of the Main Street approach: Design: Improving all the physical and visual aspects of the district Organization: Cultivating partnerships and resources for the district Promotion: Marketing the district
4
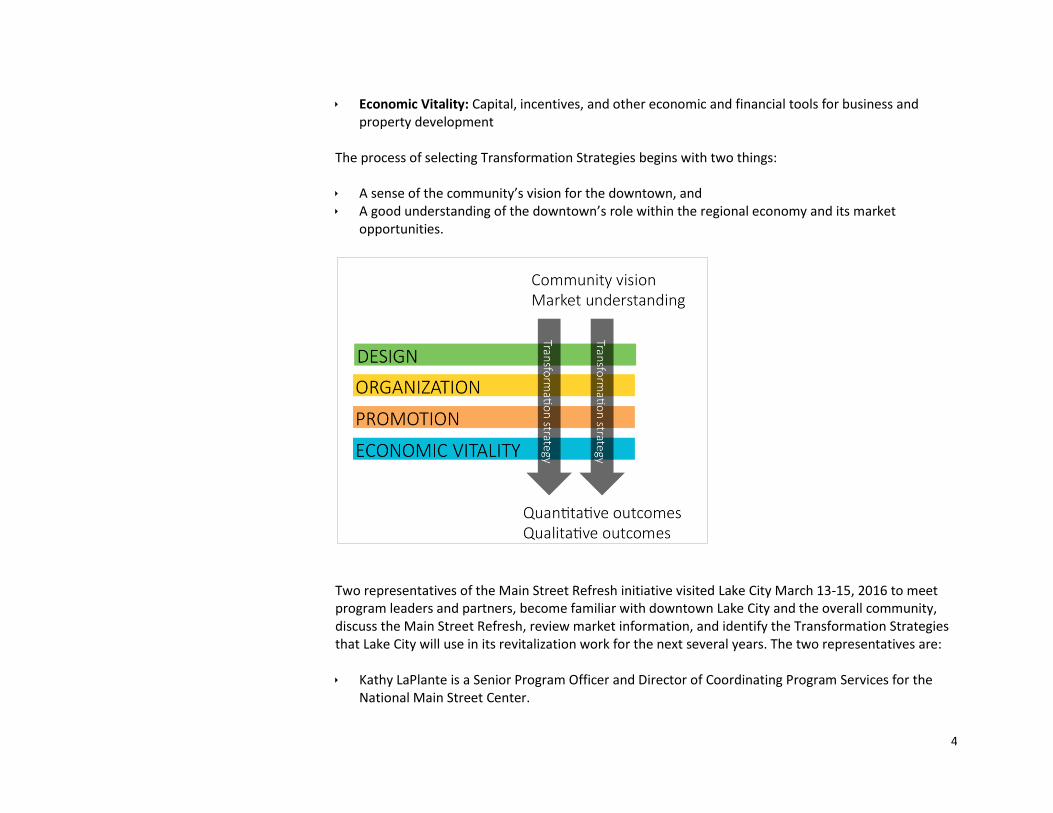
Economic Vitality: Capital, incentives, and other economic and financial tools for business and property development
The process of selecting Transformation Strategies begins with two things: A sense of the community’s vision for the downtown, and A good understanding of the downtown’s role within the regional economy and its market
opportunities.
Two representatives of the Main Street Refresh initiative visited Lake City March 13-15, 2016 to meet program leaders and partners, become familiar with downtown Lake City and the overall community, discuss the Main Street Refresh, review market information, and identify the Transformation Strategies that Lake City will use in its revitalization work for the next several years. The two representatives are: Kathy LaPlante is a Senior Program Officer and Director of Coordinating Program Services for the
National Main Street Center.
5
Joshua Bloom is a principal with the Community Land Use + Economics, LLC (CLUE Group) and a
former program officer of the National Main Street Center. Tim Stroh, Colorado Main Street architect, joined Kathy and Josh for the visit. This report summarizes the market information we gathered in preparation for the site visit: Basic demographic and trade area characteristics Retail sales void analysis Downtown business mix characteristics Results of surveys of the Lake City Main Street program’s leadership group and of the general public It then outlines the Transformation Strategies the leadership group discussed during the site visit and lists some next steps for the group to consider.

6
M A R K E T O V E R V I E W DEMOGRAPHIC HIGHLIGHTS Because of Lake City’s remote location, regional retail competition – and even Colorado’s overall strong economy – have limited local impact. As a result, Lake City’s very small local market does not change much from year to year. Among the Lake City’s key demographic characteristics are the following: The population is stable. Lake City’s population of about 400 people remained stable from 2010 to
2015 and is projected to stay essentially unchanged through 2020. (That said, because of the very small numbers, a new real estate development of even modest size could cause a measurable population shift, at least as a percentage of the total.)
Median household income is high for a small town. Household income of $52,599 compares
favorably with the County’s ($56,000) and the State’s ($59,000). However, as we learned from deeper conversations, local household income is influenced by second-home owners who declare Lake City as their domicile (to take advantage of favorable tax rates), but who actually reside out of state. Anecdotally, the household income of full-time Lake City residents is lower.
Median age in Lake City is 49.2 years old. That is far older than the State’s median of 36.2 years, but
is likely influenced by second-home owners.
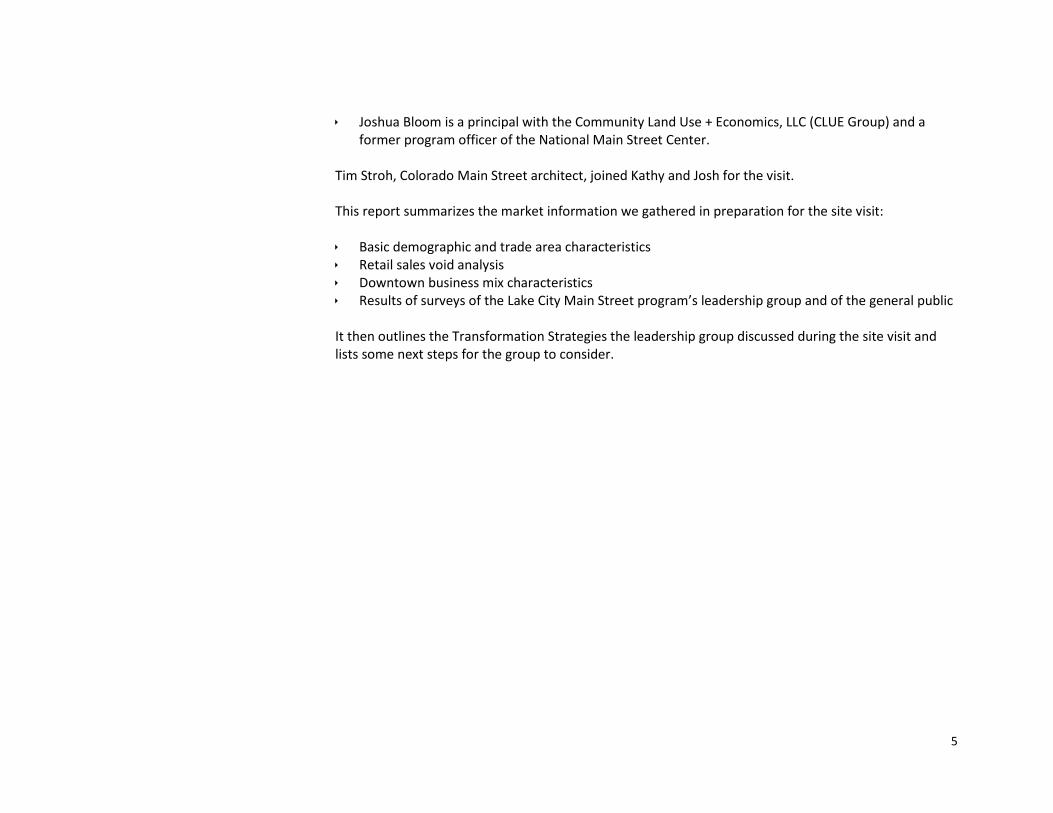
DOWNTOWN BUSINESS CHARACTERISTICS We compiled an inventory of business entities for the whole Town of Lake City. Within the town, there are approximately 110 business entities (including nonprofit and for-profit businesses and government offices). The infoUSA database estimates that 44 of those businesses are retail or retail-service, however a visual survey would suggest the actual number is probably half that. According to this inventory, retail accounts for about 10% of businesses, and restaurants and accommodation account for 21% of businesses. InfoUSA also estimates jobs per business. Accommodation and food services account for approximately 23% of jobs in Lake City; public administration accounts for about 27% of jobs.
7
Chart: Percentate of workers in Lake City and percentage of businesses, by industry/sector. (Sources: Polk City Directories/infoUSA, CLUE Group)
RETAIL SALES VOID We conducted a retail sales void analysis for Lake City, comparing the volume of sales Lake City businesses are currently attracting against the amount of money that Lake City’s residents are likely spending (in total, not just in Lake City). People shop in many different places. They usually shop for convenience goods – like gasoline and groceries – close to where they live or work. They usually buy clothes at shopping malls, big-box stores, or online. Every year, they buy more things online. So, the relationship between “supply” (the sales volume that businesses capture) and “demand” (the amount of money that households in that area spend) is never a one-to-one relationship. If a community’s businesses attract more sales than the
8
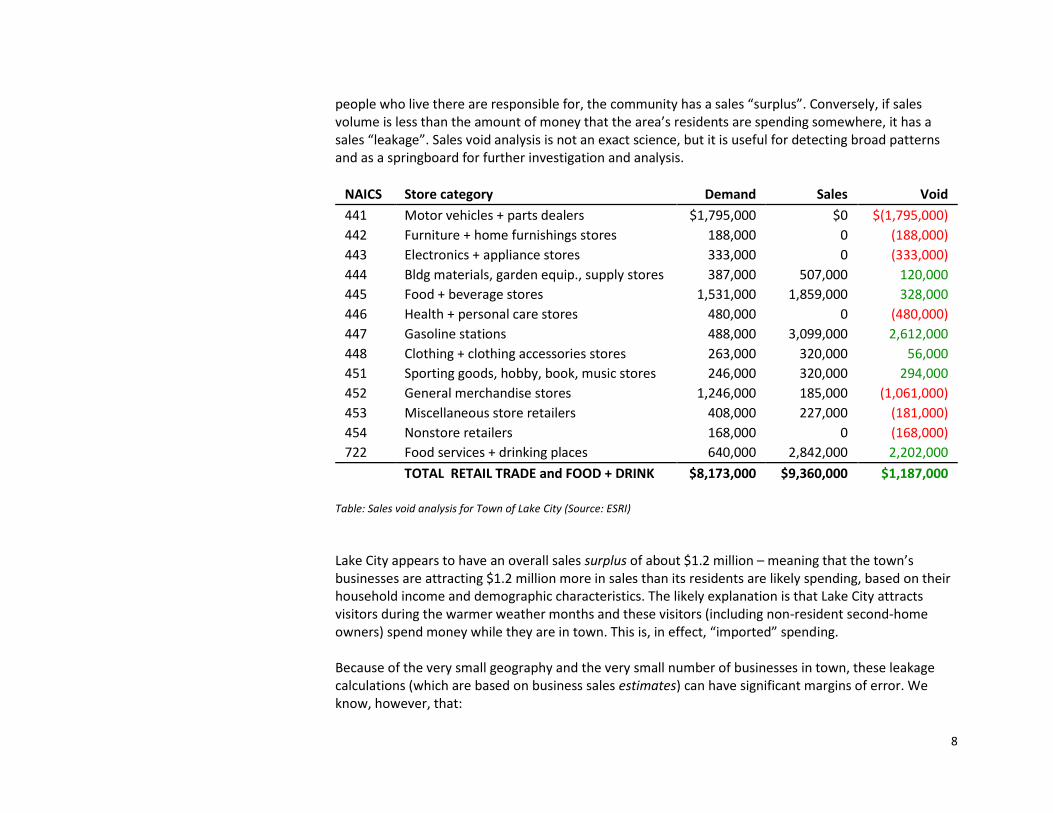
people who live there are responsible for, the community has a sales “surplus”. Conversely, if sales volume is less than the amount of money that the area’s residents are spending somewhere, it has a sales “leakage”. Sales void analysis is not an exact science, but it is useful for detecting broad patterns and as a springboard for further investigation and analysis.
NAICS Store category Demand Sales Void
441 Motor vehicles + parts dealers $1,795,000 $0 $(1,795,000)
442 Furniture + home furnishings stores 188,000 0 (188,000)
443 Electronics + appliance stores 333,000 0 (333,000)
444 Bldg materials, garden equip., supply stores 387,000 507,000 120,000
445 Food + beverage stores 1,531,000 1,859,000 328,000
446 Health + personal care stores 480,000 0 (480,000)
447 Gasoline stations 488,000 3,099,000 2,612,000
448 Clothing + clothing accessories stores 263,000 320,000 56,000
451 Sporting goods, hobby, book, music stores 246,000 320,000 294,000
452 General merchandise stores 1,246,000 185,000 (1,061,000)
453 Miscellaneous store retailers 408,000 227,000 (181,000)
454 Nonstore retailers 168,000 0 (168,000)
722 Food services + drinking places 640,000 2,842,000 2,202,000
TOTAL RETAIL TRADE and FOOD + DRINK $8,173,000 $9,360,000 $1,187,000
Table: Sales void analysis for Town of Lake City (Source: ESRI)
Lake City appears to have an overall sales surplus of about $1.2 million – meaning that the town’s businesses are attracting $1.2 million more in sales than its residents are likely spending, based on their household income and demographic characteristics. The likely explanation is that Lake City attracts visitors during the warmer weather months and these visitors (including non-resident second-home owners) spend money while they are in town. This is, in effect, “imported” spending. Because of the very small geography and the very small number of businesses in town, these leakage calculations (which are based on business sales estimates) can have significant margins of error. We know, however, that:

9
Large portions of Lake City household spending do leak, much of it to grocery and big-box stores in
Gunnison, and
There are whole categories of goods and services which cannot be purchased in Lake City (e.g., motor vehicles, furniture, and electronics), and all of those sales leak elsewhere.
For several categories, we believe actual sales are probably underestimated: For example, some motor vehicle parts are sold in connection with repairs at the local gas stations, and garages and some health and personal care products are sold at local grocery stores. And, in the category of “non-store retailers” (which include online purchases) the total sales are probably underestimated, but these sales are, of course, not captured locally.
S U R V E Y S With the help of the Lake City Main Street staff, we conducted two online surveys: A survey of the program’s board of directors A public survey Both surveys asked respondents to list the three words that come to mind when thinking about downtown Lake City. Both surveys asked for thoughts about what could be improved downtown. The leadership survey asked for thoughts about downtown’s greatest problems and about the actions it should undertake. The leadership survey returned six responses; the public survey returned 11 responses. These are very small numbers and they are not representative of the whole Lake City community, but we mapped the “three words” question as “word clouds” to see how the surveys compared:
THREE WORDS Respondents to both surveys used the word “historic” to describe downtown Lake City, and they used several other positive descriptions, like “beautiful” and “quaint”. Positive words outnumbered negative

10
words in both surveys. Nevertheless, there was a variety of negative words, as well, though not much overlap among the words used: “under-achieving”, “vacancies”, “pot holes”, “undeveloped”, “disconnected”, and “very bad”.
LEADERSHIP SURVEY WORD CLOUD: “What three words come to mind when you think about downtown Lake City?”
PUBLIC SURVEY WORD CLOUD: “What three words come to mind when you think about downtown Lake City?”
11
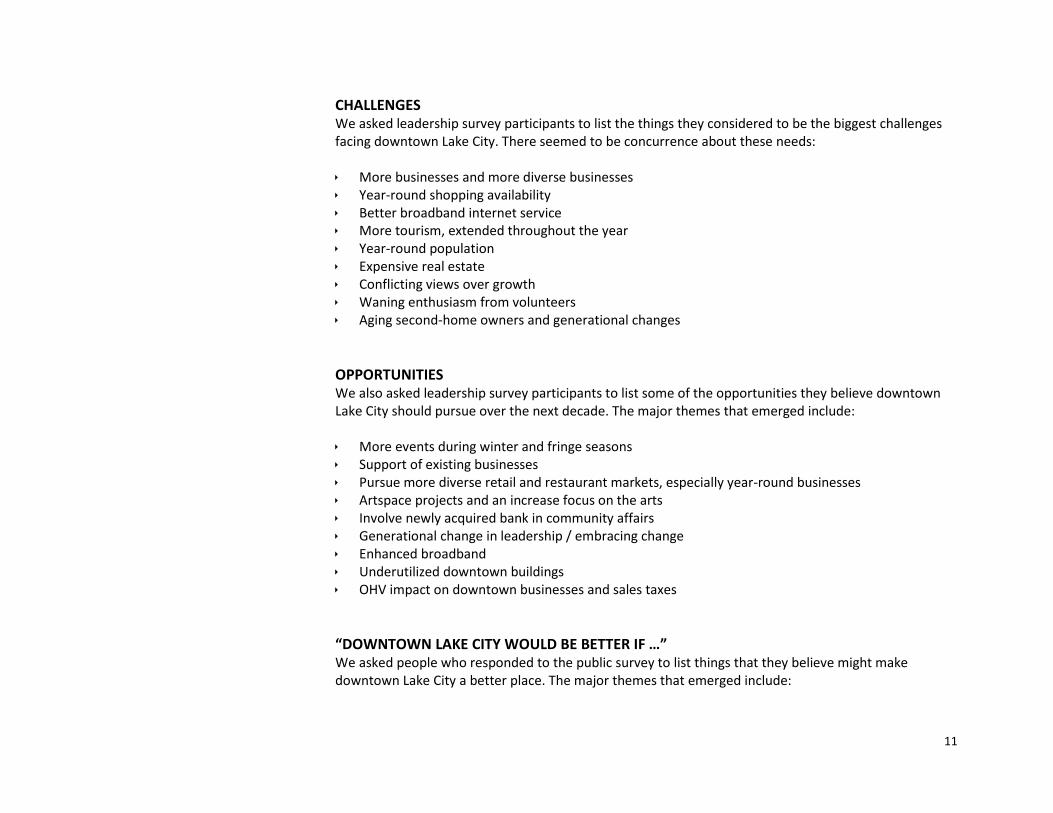
CHALLENGES We asked leadership survey participants to list the things they considered to be the biggest challenges facing downtown Lake City. There seemed to be concurrence about these needs: More businesses and more diverse businesses Year-round shopping availability Better broadband internet service More tourism, extended throughout the year Year-round population Expensive real estate Conflicting views over growth Waning enthusiasm from volunteers Aging second-home owners and generational changes
OPPORTUNITIES We also asked leadership survey participants to list some of the opportunities they believe downtown Lake City should pursue over the next decade. The major themes that emerged include: More events during winter and fringe seasons Support of existing businesses Pursue more diverse retail and restaurant markets, especially year-round businesses Artspace projects and an increase focus on the arts Involve newly acquired bank in community affairs Generational change in leadership / embracing change Enhanced broadband Underutilized downtown buildings OHV impact on downtown businesses and sales taxes
“DOWNTOWN LAKE CITY WOULD BE BETTER IF …” We asked people who responded to the public survey to list things that they believe might make downtown Lake City a better place. The major themes that emerged include:

12
It had greater variety of businesses, and a hotel Businesses stayed open year-round There were fewer tourist/trinket oriented businesses Maybe more benches The visitor center were closer to downtown businesses There was a bandstand in the square with summer music Don’t change a thing, it is awesome, if you start changing it the city will lose it's charm
WHAT BUSINESSES DO PEOPLE PATRONIZE? The public survey asked respondents to list the downtown businesses they most often patronize. Since all surveys were sent to full-time residents, the responses reflect local habits rather than visitor habits. Interestingly, however, several of the most-often-mentioned businesses are those that would also likely be patronized by visitors – businesses like ice cream and restaurants/bars.
PUBLIC SURVEY WORD CLOUD: “Which businesses do you most often patronize in downtown Lake City?”

13
T R A N S F O R M A T I O N S T R A T E G I E S
In our work session on the second morning of our visit, the Lake City Main DIRT staff, Main Street board members, and community partners discussed several potential Transformation Strategies and settled on two that seem to make the most sense: 1. Necessities: Goods and services for residents
Focuses on developing a cluster of retail and service-sector businesses that fulfill day-to-day needs of nearby residents – the things people tend to buy close to home. Given Lake City’s isolation, this is an essential function of retail activities in downtown and the other small commercial nodes.
2. Tourism and Arts: For second-home owners, recreation and the outdoors
A tourism strategy addresses people who visit Lake City from elsewhere. Currently, this peaks during the warm weather months, when second-home owners come for relaxation, access to outdoor adventures (e.g., hiking, fishing, OHV), and arts. Shorter-stay visitors come for the same reasons, but may also come just for an event (like “Uncorked”). Historic setting, natural beauty, authenticity, and independent businesses are all important qualities when attracting visitors.
The following pages provide more detail in how these two Transformation Strategies might look:

14
STRATEGY 1 – NECESSITIES: GOODS AND SERVICES FOR RESIDENTS Who are the customers? This strategy primarily serves Lake City residents (who have to make regular, long-distance shopping trips for their larger shops). It also serves second-home owners, who stay in Lake City for a couple of weeks or longer. “Necessities” are the day-to-day goods and services that people need to be able to purchase close to home. These convenience-type goods and services are commodities and, ordinarily, commodities tend to be price-sensitive. However, convenience-type purchases are strongly influenced by a shopper’s desire not to travel, making customers less price-sensitive than when buying more occasional items. In Lake City, there is broad recognition that having necessities available locally is a critical need. Benefits and trade-offs For Lake City, the main trade-off for the necessities-based strategy is that most of the businesses in this category are not destinations. That means, while people may visit some downtowns specifically for their unique retail stores, necessity-type retail is an convenience rather than a destination. Potential products and services The Necessities strategy encompasses many retail and service businesses. This list is not exhaustive, but illustrates the range of businesses that can participate in a Necessities or convenience-based strategy: Accounting and tax services Auto repair Bakery Banks and credit unions Barbers and hair salons Bars Cafe or coffee shop Convenience store Daycare Dollar stores Dry cleaners Flowers and houseplants Gas stations Gifts
Greeting cards Hardware store Laundromats Medical and dental services Office supplies Pharmacy Phone stores Prepared food stores Printing and shipping Quick-service restaurants Sit-down restaurants (esp. mod-price point) Snacks Supermarket / grocery store Take-out restaurants
15
STRATEGY 2: TOURISM & ARTS Who are the customers for this strategy? Tourism is a vast category and its participants do not fit any one customer profile. In Lake City, tourism includes visitors to historic places, weekend/second-home owners, outdoors enthusiasts, participants in the arts, and others. Tourism can exist at varying price points, but our assumption is that visitors to Lake City are generally more affluent than year-round residents – meaning they have more disposable income to spend on dining, retail, and activities. Return and annual visitors to Lake City are generally familiar with the available restaurants, retail shops, and outdoor attractions. However, new short-stay visitors are less familiar with existing businesses and will benefit from information that helps them learn about Lake City and area offerings. Benefits and trade-offs A primary economic benefit of tourism is that it brings outside consumer spending to the community. These “imported customers” add to the buying power of households in the immediate trade area. As a result, commercial districts that attract tourists can often support more restaurants and retail than the local population could support on its own. Tourism can also be an important generator of local jobs and employment in businesses directly and indirectly related to the hospitality industry. During peak visitor times, the Lake City can support more businesses than currently exist. However, because the season is currently so short, it means only a relative handful of businesses can be open as year-round operations. There can also be potential trade-offs to attracting large numbers of tourists: Locals may not be happy about an increase in visitors if it makes the town feel “less local,” if it gets crowded, if prices go up, if it becomes hard to find housing, if short-term rentals (like AirBnB) bring a transient character to the community, or if the influx spurs gentrification. In more extreme cases, the business mix may shift in ways that are not helpful to residents, such as an increase in stores selling t-shirts and souvenirs. Potential products and services Because visitors are not at home, they have some needs that locals would rarely use, such as lodging, tour guides, art galleries, recreational equipment rental, etc. Visitors also have some needs that overlap with locals, especially in the convenience category (e.g., drug store, grab-and-go meals and restaurant

16
dining). The following list is not exhaustive but illustrates the range of businesses that can participate in the Tourism & Arts strategy: Antique and vintage apparel Antique and vintage home furnishings Art galleries Bed and Breakfasts Bike rental Bookstore Cafés Car rental Children's activities businesses (e.g., mini-golf,
pottery, beading) Craft stores (esp. locally made) Delicatessen / sandwich shop Drug store
Hotels Ice cream shops Jewelry stores Meals to go (e.g., boxed lunches) Outfitters (e.g., hiking, camping, canoeing,
hunting, etc.) Restaurants Segway and alternative transportation rental
(e.g., mopeds, boats, OHVs, etc.) Short-term rental homes and apartments (e.g.,
AirBnB) Souvenir stores Tour guides

17
N E X T S T E P S 1. Confirm support for the Transformation Strategies. The board and staff of Lake City DIRT and the
should meet within the next month to review the two Transformation Strategies we discussed during our visit and to confirm their support for them.
2. Identify the key activities that need to take place for each of the Transformation Strategies.
Assuming the board and its partners concur with the Transformation Strategies, the board and staff should then continue to brainstorm, discuss, and agree on the key activities that need to take place to successfully achieve the goals of each of the Transformation Strategies. We will work on an initial list of activities in a conference call scheduled for April 19, 2016.
3. Meld Lake City DIRT’s current work plan to align with the Transformation Strategies. As part of our
first conference call, we will review the current Lake City DIRT work plan and discuss how the Transformation Strategies could serve as a different kind of organizing system. Follow-ups to our first conference call will include confirmation of the board’s choice of these Transformation Strategies and review the major activities needed for each Strategy. Then, after our discussion, the board and staff should detail each major activity. For each activity, board and staff should:
Assign responsibility to the organizations, agencies, and/or individuals who should be involved
in the activity and to those who are assuming responsibility for its completion,
Estimate the budget for the activity and identify funding source(s),
Establish a timeline for the activity’s completion, and
Decide how to measure the activity’s progress (e.g., “five new businesses in 2016”, “increase event participation by 20 percent”, “attract 1,000 new visitors to Lake City”, etc.).
4. Schedule “coaching calls” with us. We would like to “meet” once a month by conference call to
review progress on these Transformation Strategies and to offer ongoing support and problem-solving assistance.