maize phenotyping under the seeds of discovery initiative...
TRANSCRIPT

Maize Phenotyping under the Seeds of Discovery
Initiative: The Brute Force Method
Martha C. Willcox
Maize Landrace
Improvement Coordinator

Coauthors:CIMMYT:Juan Burgueno, Armando Guadarrama, Daniel
Chepetla, Enrique Rodriguez, Dan Jeffers, George Mahuku,
Iván Ortiz-Monasterio, Natalia Palacios, Félix San Vicente,
Rosemary Shrestha, Samuel Trachsel, Sarah Hearne, Peter
Wenzl
INIFAP: Noel Gómez, Alejandro Ortega, Ernesto Preciado,
Víctor Vidal
Pioneer-Mexico: Fernando González, Heriberto Torres, Marco
Oropeza
Gates Foundation: Gary Atlin
UAAAN-UL: Armando Espinoza Banda
Bidasem: María E. Rivas-Dávila
ICAMEX: Francisco Javier Manjarrez
Productores de Semilla de Copandaro: Humberto Vallejo

Seeds of Discovery

Genome Wide Association Study(GWAS) in Maize
● Breeder’s Core Collection from the CIMMYT Maize
Germplasm Bank (4471 accessions).
● One plant per accession crossed with a CIMMYT hybrid to
make a series of modified topcrosses.
The same plant was sampled for DNA extraction/GBS
● Accessions were crossed hybrids of their same environmental adaptation (where possible).
Tropical Accessions X Tropical Hybrid
Subtropical Accessions X Subtropical Hybrids
Highland Accessions X Highland Hybrid


Drought
115o 110o 105o 100o 95o 90o 85o
30o
25o
20o
15o
30o
25o
20o
15o
115o 110o 105o 95o 90o 85o
Agua Fría, Pueb
Tlaltizapán, Mor
El Batán, MexCelaya, GTO
San PedroLagunillas, Nay
Ocotito, Guerrero
Tarimbaro , Michoacan
Guadalupe-Victoria, Chiapas
Torreon, Coahila
Trial Sites in Mexico: GWAS
Stalk Rot; Quality
Cercospora
Drought; HeatHeat & Drought
Stalk Rot
Tar Spot Complex
Obregon, Sonora
Cortazar, GTONumaran, MI
Iguala, GRO
Almoloya, Mex
Low Nitrogen, Ear Rot,Quality, Turcicum
Low Nitrogen

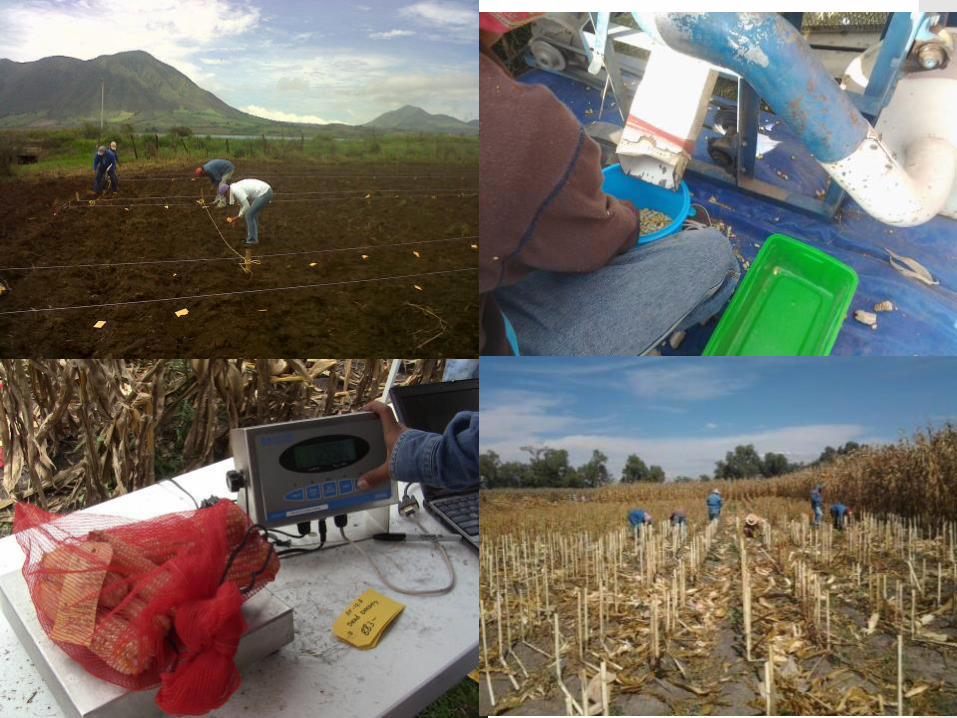
Phenotypic Trials
● 36 trials planted - 34 harvested (34,606
rows and over 687,000 unique data points)
● 19 Trials for abiotic Stresses (Drought, Heat,
Low Nitrogen)
● 11 Trials for diseases (Tar Spot Complex,
Grey Leaf Spot, Turcicum Leaf Blight,
Fusarium Ear Rot, Fusarium and
Acremonium Stalk Rot)
● 3 Trials hand pollinated to produce grain
for Quality Component Analysis.

Yield and Agronomic Data Taken :
All Locations
● Yield (field weight, grain and cob weight,
moisture, number of ears)
● Plant Height and Ear Height
● Male and Female Flowering (50% of row)
● Stalk and Root Lodging

Experimental Design
Unreplicated augmented row-column
design
For each trial location accessions are
selected for adaptation zone and maturity.
Overlapping sets of topcross entries
Two widely adapted commercial checks
and resistant and susceptible checks
where appropriate

Faja
20 1 2 3 4 5 6 7 8 9 10 11 12 13 14 15 16 17 18 19 20
19 40 39 38 37 36 35 34 33 32 31 30 29 28 27 26 25 24 23 22 21
18 41 42 43 44 45 46 47 48 49 50 51 52 53 54 55 56 57 58 59 60
17 80 79 78 77 76 75 74 73 72 71 70 69 68 67 66 65 64 63 62 61
16 81 82 83 84 85 86 87 88 89 90 91 92 93 94 95 96 97 98 99 100
15 120 119 118 117 116 115 114 113 112 111 110 109 108 107 106 105 104 103 102 101
14 121 122 123 124 125 126 127 128 129 130 131 132 133 134 135 136 137 138 139 140
13 160 159 158 157 156 155 154 153 152 151 150 149 148 147 146 145 144 143 142 141
12 161 162 163 164 165 166 167 168 169 170 171 172 173 174 175 176 177 178 179 180
11 200 199 198 197 196 195 194 193 192 191 190 189 188 187 186 185 184 183 182 181
10 201 202 203 204 205 206 207 208 209 210 211 212 213 214 215 216 217 218 219 220
9 240 239 238 237 236 235 234 233 232 231 230 229 228 227 226 225 224 223 222 221
8 241 242 243 244 245 246 247 248 249 250 251 252 253 254 255 256 257 258 259 260
7 280 279 278 277 276 275 274 273 272 271 270 269 268 267 266 265 264 263 262 261
6 281 282 283 284 285 286 287 288 289 290 291 292 293 294 295 296 297 298 299 300
5 320 319 318 317 316 315 314 313 312 311 310 309 308 307 306 305 304 303 302 301
4 321 322 323 324 325 326 327 328 329 330 331 332 333 334 335 336 337 338 339 340
3 360 359 358 357 356 355 354 353 352 351 350 349 348 347 346 345 344 343 342 341
2 361 362 363 364 365 366 367 368 369 370 371 372 373 374 375 376 377 378 379 380
1 400 399 398 397 396 395 394 393 392 391 390 389 388 387 386 385 384 383 382 381
Surco 1 2 3 4 5 6 7 8 9 10 11 12 13 14 15 16 17 18 19 20
Example of Trial Design
Standard commercial checks ( and ) to adjust for spatial variance
and link trials from multiple locations and trait specific, resistant ( ) and
susceptible ( ) checks, to adjust for spatial variation for specific traits
within the trial.

Model for Analysis
Acc.
TopcrossesCheck 1 Check t
Hybrid 1 Hybrid p
Accession 11
Accesión 1a1
Accession p1
Accesión pap
Trial
Mean
BLUPs -
(Best Linear Unbiased predictors)
calculated for male accession
parent by removing the average
effect of the hybrid tester and
using check entries to adjust for
spatial variation.

Challenges
● Range of maturities (flowering extends for
5 weeks)
● Lodging
● Segregation
● Diversity of environments (both origin of
accessions and evaluation sites).

Comparison of average female flowering date with range
of female flowering for 191 accession topcrosses (per
plant data)
75 80 85 90 95 100
Average Female Flowering (days post planting)
70
75
80
85
90
95
100
Range
of F
em
ale
Flo
weri
ng
(mín
imu
m, m
ea
na
nd
má
xim
um
)

Tar Spot Complex

Photo: Rosemary Shrestha
Tar Spot Complex

Tar Spot Trials
● 2011B Guadalupe-Victoria, Chiapas – 600
Accession/Topcross entries
● 2012B Guadalupe-Victoria, Chiapas – 810
accession/topcross entries (including
accessions per se)
● 2 foliar ratings 0-5 scale (Ceballos and
Deutsch) two weeks apart.
● Data taken both by row and as average
of 6 plants per row

Relationship between Tar Spot rating and Yield (2nd foliar rating: scale 0-
5; average of 6 plantas)
=Accessions; = Topcrosses; = Commercial Checks
Oaxa280
Guat153
(CML269/CML264)/Oaxa280
(CML495/CML494)/Guat153
Tar Spot Foliar Rating (0-5)
Yie
ld(g
/plo
t)

Relationship between Root Lodging and Tar Spot Rating (2nd foliar
rating)
=Accessions; = Topcrosses; = Commercial Checks
Oaxa280
Guat153(CML269/CML264)/Oaxa280
(CML495/CML494)/Guat153
Tar Spot Foliar Rating (0-5)
Ro
ot
Lo
dg
ing
%

Characterization for Stalk Rot

Fusarium Stalk Rot: Artificial Inoculation

Relationship between Yield and Stalk Rot Scale (percentage of
stalks with disease x intensity of disease) =Topcrosses ; = Commercial Checks
Stalk Rot Scale (proportion of stalks with Acremonium strictum
times intensity 1-5)
Yie
ld (
t/ha 1
2%
hum
)

Evaluation of Accessions PerSe for Acremonium Stalk Rot
Accession Perse (2013) Accession Topcross (2012)
Entry Stalk Rot Scale Average Stalk Rot Scale Average
Commercial (resistant check) 0.43 0.5
PUEB45 1.16 1.7
MORE85 1.53 2.3
GUER125 1.59 2.4
NAYAGP6 2.13 2.5
CHIS128 2.56 2.9
MICH21 3.21 2.9
TC X URUG39 (susceptible) 4.5 5.97

Lots of data still to analyze…
Thank You
