malcolm baldrige national quality award application...
TRANSCRIPT

Malcolm Baldrige National Quality Award Application 2015
5875 West Van Horn Tavern Rd. | Columbia, MO 65203

I
Table of Contents Table of Contents……………………………………………..I
Eligibility Certification Form…………………………II-X Organization Chart...………………………………………XI
Application Form…………………………………………..XII Glossary of Terms and Abbreviations………………XIII-XIV
Organizational Profile…………………………........ OP-1 P.1 Organizational Description……………............OP-1
P.1.a Organizational Environment………. ..OP-1 P.1.b Organizational Relationships….…….OP-2
P.2 Organizational Situation………………OP-3 P.2.a Competitive Environment…….……..OP-3 P.2.b Strategic Context……………….........OP-4 P.2.c Performance Improvement System….OP-4
Category 1: Leadership…………………………………… 7 1.1 Senior Leadership……………………………….. 7 1.1.a Vision, Values and Mission……………... 7
1.1.b Communication and Organizational Performance……………………………... 8
1.2 Governance and Societal Responsibilities……….9 1.2.a Organizational Governance…..……….. 9
1.2.b Legal and Ethical Behavior………..........10 1.2.c Societal Responsibilities…......................1 1
Category 2: Strategy……………………………………...13 2.1 Strategy Development………………………….13 2.1.a Strategy Development Process………….13 2.1.b Strategic Objectives……………………..15 2.2 Strategy Implementation………………………...15
2.2.a Action Plan Development and Deployment………………………...……15
2.2.b Action Plan Modification……………….17 Category 3: Customers…………………………………...17 3.1 Voice of the Customer……………………..…...17 3.1.a Customer Listening……………………..17
3.1.b Determination of Customer Satisfaction and Engagement…..…..........17
3.2 Customer Engagement……………..…………...18 3.2.a Product Offerings and Customer
Support…………………………...……...18 3.2.b Customer Relationships…………...……20 Category 4: Measurement, Analysis, and Knowledge Management………………………………………...…...21
4.1 Measurement, Analysis, and Improvement of Organizational Performance………………...21
4.1.a Performance Measurement………...….....21 4.1.b Performance Analysis and Review…..........23
4.1.c Performance Improvement……...............23 4.2 Knowledge Management, Information, and Information Technology…….……….......……....24 4.2.a Organizational Knowledge………...…..24 4.2.b Data, Information, and
Information Technology………………...25 Category 5: Workforce…………………………………...26 5.1 Workforce Environment………………………..26
5.1.a Workforce Capability and Capacity……...26 5.1.b Workforce Climate……………................27 5.2 Workforce Engagement………………………...28
5.2.a Workforce Engagement and Performance…..………………………...28
5.2.b Workforce and Leader Development…...29 Category 6: Operations………………………....................30
6.1 Work Processes…………………………………..30 6.1.a Product and Process Design......................30 6.1.b Process Management…………………....31 6.1.c Innovation Management………...............32 6.2 Operational Effectiveness………………………32 6.2.a Process Efficiency and Effectiveness…...32
6.2.b Supply-Chain Management……….............33 6.2.c Safety and Emergency Preparedness…......34 Category 7: Results…………………………………….…35 7.1 Product and Process Results……………………35
7.1.a Customer-Focused Product and Process Results…………...…………35-42
7.1.b Work Process Effectiveness Results..35-42 7.1.c Supply-Chain Management Results...35-42 7.2 Customer-Focused Results……………………..42
7.2.a Customer-Focused Results………….42-45 7.3 Workforce-Focused Results…………................45 7.3.a Workforce-Focused Results…………….45
7.4 Leadership and Governance Results………….....50 7.4.a Leadership, Governance, and Societal
Responsibility Results………………....50 7.4.b Strategy Implementation Results……….52 7.5 Financial and Market Results…………………...53 7.5.a Financial and Market Results...……..53-55

XIII
MidwayUSA Glossary of Terms and Abbreviation
A
Active Customer – Customers who have placed an order within the last 365 days
ANB – America Needs Baldrige: a website maintained with Baldrige information and white papers
ATF – Bureau of Alcohol, Tobacco, Firearms, and Explosives
AOS – Available On Site
B
BAR – Baldrige Award Recipient
BCM – Baldrige Category Meeting
BL – Bucket List: a list of strategically important ideas
BOD – Board of Directors
BPEG – Baldrige Performance Excellence Group
C
CAM – Category Analysis Matrix
CAP – Company Action Plan
CAR – Corrective Action Report
CC – Core Competency
CDT – Career Development Team
CEO – Chief Executive Officer
CFM – Customer Focus Meeting
CKM – Company Key Measure: direct measures of performance toward OGs and SKRs
CKR – Customer Key Requirement
CRM – Customer Relationship Management
CS – Customer Support
CSAT – Customer Satisfaction
CSP – Company Strategic Plan
CSS – Customer Satisfaction Surveys
CSR – Customer Service Representative
Culture Statement – a written document that defines our Culture
CVP – Customer Value Proposition
D
DAP – Department Action Plan
DBM – Department Baldrige Meeting
DKM – Department Key Measure
DKS – Department Knowledge Sharing
DLT – Department Leadership Team: the managers within a department who report directly to the VP
DSP – Department Strategic Plan
E
EFG – Employee Focus Group
EKR – Employee Key Requirement
ES&E – Employee Satisfaction & Engagement
ES&ES – Employee Satisfaction & Engagement Survey
F
FS – Financial Services
H
HAM – HR Analysis Matrix
HR – Human Resources
I
ICP – Integrated Contingency Plan
Inactive Customer – Previous Customers who have not ordered within the last 365 days
IS – Information Systems
ISO – International Organization for Standardization
K
KCG – Key Conservation Groups
KM – Key Measures
KP – Key Process
KR – Key Requirement: the most important documented needs that must be met to achieve stakeholder satisfaction
KS – Key Stakeholder
KWS – Key Work Systems
L
LDC – Leadership Development Candidate
LERC – Legal, Ethical, and Regulatory Compliance
LO – Logistics
LS – Leadership System
LTG – Long-Term Goal

XIV
M
MAM – Marketing Analysis Matrix
ME – Merchandising
MIDAS – MidwayUSA’s Integrated Data Analysis System
MK – Marketing
MPC – Master Planning Calendar
MQA – Missouri Quality Award
MRR – Monthly Results Review
MS – Mission Statement
MW – MidwayUSA
N
NPV – Net Present Value: an analysis tool used to understand the value of a project/investment
NRA – National Rifle Association
NRA Round-Up Program – allows Customers to round up to the nearest dollar on their purchases for donation to the NRA
O
OFI – Opportunity for Improvement
OFM – Operations Focus Meeting
OG – Operational Goal
Organizational DNA Walls – a series of key documents posted in each building on campus
P
PCI – Payment Card Industry
PH&I – Package Handling & Insurance
PIS – Performance Improvement System: a system that maintains all improvement and innovation ideas (CAPs, DAPs, CARs, OFIs, BL items)
PLM – Product Line Manager
PMP – Project Management Process
Q
QMS – Quality Management Systems
R
R&R – Rewards and Recognition
RMA – Risk Management Association
S
SA – Strategic Advantage
Sales & MK Team – Sales & Marketing Team: made up of President, VP-MK, VP-ME, VP-CS and MK Manager
SAOS – Segmentation Available On-Site
SC – Strategic Challenge
SHKR – Shareholder Key Requirement
SKR – Stakeholder Key Requirement
SL – Senior Leader
SLT – Senior Leadership Team: each department head (VPs) and the President, also referred to as Senior Leaders
SO – Strategic Objectives
SOTB – State of the Business
SP – Strategic Plan
S/P – Supplier/Partner
S/PA – Supplier/Partnership Agreement
S/PKR – Supplier/Partner Key Requirement
SPM – Strategic Planning Meeting
SPP – Strategic Planning Process
SWOT – Strength, Weakness, Opportunity, Threat: an analysis tool
U
UPS – United Parcel Service
V
V&C – Values & Culture
Vignette – a brief instructional television or web clip
VOC – Voice of the Customer process
VP – Vice President
W
WAM – Website Analysis Matrix
WI – Work Instruction
Work Instruction Sheet – a one-page work instruction reference document
WP – White Paper: a Senior Leader-created instructional document
WPMP – Work Process Management Process
WSM – Work System Map
Y
YWCE – Youth Wildlife Conservation Experience
- This symbol indicates points of learning and integration
- This symbol is used to denote CKMs

OP-1
Organizational Profile P.1a(1) What are your main product offerings? We are an internet retailer of shooting, hunting and outdoor products. In alignment with our Mission, our main product offerings are the products we sell and services we provide to meet our Customer Key Requirements (CKRs). We offer over 110,000 products from over 800 Suppliers, spanning 17 different product categories (airguns, ammunition, archery, black powder guns, books, videos & software, camping & survival, clothing, footwear, gun parts, gunsmithing supplies, hunting gear, knives & tools, military surplus, optics, reloading supplies, self-defense & police and shooting gear). We offer these products nationally through many marketing channels, to over 1.1 million active Customers. Customers choose MidwayUSA (MW) because of our unique Customer Value Proposition (CVP) which drives Customer acquisition, retention and loyalty. Our CVP is: MW has Just About Everything® for Shooting, Hunting and the Outdoors; we have highly competitive prices; our Nitro Express Shipping® provides Super-Fast, Low-Cost delivery; we’re extremely easy to do business with; and we’re role model supporters of the Shooting Sports Industry. What is the relative importance of each to your success? Within the products we sell, the relevant importance of the 17 different product categories is shown in Fig P.1-1.
Figure P.1-1 Percent of Projected 2015 Sales by Product Category Core Categories % sales % sales Confidential Growth Categories % sales % sales
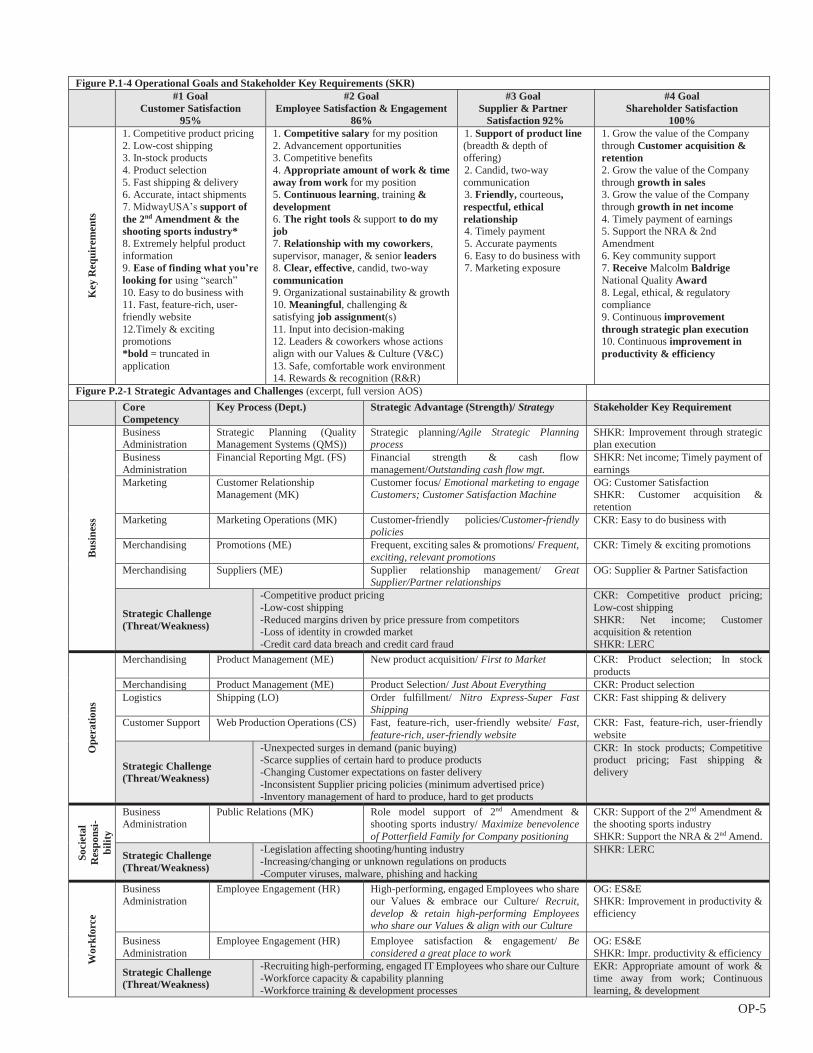
What mechanisms do you use to deliver your products? MW takes orders from Customers and fulfills them through our state-of-the-art Nitro Express shipping system. Customers place 93.5% of their orders on our website. We also have a Customer Service area to serve Customers via phone, email and web chat. We communicate our CVP and product offering to our Customers via our website, search engines, other websites, TV, flyers, email, social media and public relations. Our key Partner in shipping is UPS who delivers over 85% of our Customers’ orders. We also offer delivery through USPS and onsite order pickup through our Customer Order Pickup area, which allows Customers to place and receive an order in 30 minutes or less. P.1a(2) What are your stated MISSION, VISION, and VALUES? Our Mission Statement (MS) which includes our Vision, Purpose, Mission and Values is shown in Fig. P.1-2. What are your organization’s CORE COMPETENCIES and what is their relationship to your MISSION? We define our key work systems (KWS) as those central to fulfilling our mission. These KWS contain the processes directly related to delivering CKRs (Fig. P.1-4). We have core competencies (CCs) in our KWS and overall business administration. Therefore, our CCs are Merchandising (ME), Marketing (MK), Customer Support (CS), Logistics (LO) and Business Administration. The process strategies within our KWS address CKRs, provide strategic advantages (SAs), and are difficult for our competitors to imitate.
Figure P.1-2 Mission Statement Vision
Our desired future state To be the best-run, most respected business in America,
for the benefit of our Customers. Purpose
Why we exist To be a role-model organization for America and to maximize the long-
term value of the organization for our shareholders, by meeting or exceeding our Operational and Long-Term Goals.
Mission What we do
We are an internet retailer of shooting, hunting and outdoor products relying on high-performing, engaged Employees who share our Values
and align with our Culture. Values
The non-negotiable family principles that guide us - Honesty - Respect for others - Accountability - Integrity - Teamwork - Stewardship - Humility - Positive attitude - Loyalty
P.1a(3) What is your WORKFORCE profile? MW has 384 Employees: 171 hourly full-time, 57 hourly part-time and 156 salaried full-time. We have 8 departments and 1 division. 4 departments and 1 division focus on executing our KWS, 4 departments focus on executing support work systems (Fig. P.1-3).
Figure P.1-3 Workforce Groups and Segments Segmented by: FT or PT
Pop. %
Segmented by: Department
Pop. %
Full-time 85% Corporate 2% Part-time 15% Marketing 3% by: Status Merchandising 8% Exempt (Salaried) 41% Customer Support 16% Non-Exempt (Hourly) 59% Logistics 50% by: Tenure Financial Services (FS) 5% 0-1 Year 16% Human Resources (HR) 2% 1-3 Years 38% Information Systems(IS) 11% 3-5 Years 13% Quality Management 2% 5-9 Years 19% Military Surplus (Div.) 1% 10+ Years 14% by: Position Grade 1 Entry-level Hourly 11% 7 Analyst/Developer 10.4% 2 Hourly Level 2 31% 8 Manager 8% 3 Hourly Level 3 12% 9 Senior Manager 3% 4 Hourly Level 4 5% 10 Vice President 3% 5 Administrative 2% 11 President .3% 6 Specialist/Supervisor 14% 12 CEO .3%
What recent changes have you experienced in WORKFORCE composition or your WORKFORCE needs? We are a stable and growing organization that hasn’t experienced any major changes in workforce composition or needs in several years. Biannually we survey Employees to ensure we fully understand their key requirements (KRs). This allows us to monitor for significant changes in workforce needs. What are your WORKFORCE or employee groups and SEGMENTS? See Fig. P.1-3. What are the educational requirements for different employee groups and SEGMENTS? We prefer a high school diploma for our hourly entry-level positions (Grades 1-4). Our position grades 5-7 require either an Associate's degree, Bachelor's degree or equivalent experience and certifications. Our position grades 8-12 require at least a Bachelor's degree. What are the KEY drivers that engage them in achieving your MISSION and VISION? The key elements that engage our Employees in achieving our Mission and Vision are in Fig.

OP-2
P.1-4, under “Employee Satisfaction & Engagement” (ES&E) Company Key Measure (CKM) (7.3-10a). What are your organized bargaining units (union representation)? We are a non-union company with highly satisfied, engaged Employees. What are your organization's special health and safety requirements? ES&E is our #2 Operational Goal (OG) and an Employee KR (EKR) is a Safe, comfortable work environment. There are few safety requirements, most of which involve ergonomics, lifting and fork lift operation. Safety measures include Experience Modification Rate (7.3-7) and our ES&E survey result for Safe, Comfortable Work Environment (7.3-5). There are no special health requirements. As a result of our Safety and Training processes, we haven’t had a lost time accident for 4 years (7.3-6a). P.1a(4) What are your major facilities, technologies, and equipment? The MW operation is located on a 21-acre campus in Columbia, MO, consisting of 4 buildings (265,000 total square feet - 180,000 square feet warehouse space and 85,000 square feet office space). Our Nitro Express shipping system takes an order from submission to fulfillment in 30-minutes or less, allowing us to offer same day shipping, meeting our CKR Fast shipping & delivery. We have one of the most sophisticated computer networks in the industry with 33 Employees dedicated to developing proprietary software applications to create systems to meet our stakeholder KRs (SKRs). We use cutting-edge technologies from IT leaders like Microsoft, Hewlett-Packard, Cisco, Interactive Intelligence and major logistics companies like Hytrol and Metler Toledo. Our in-house application development capability provides agility and allows us to integrate multiple cutting-edge technologies to create value-added innovation within our KWS. P.1a(5) What is the regulatory environment under which you operate? What are the KEY applicable occupational health and safety regulations; accreditation, certification, or registration requirements; industry standards; and environmental, financial, and product regulations? We maintain compliance with U.S. Department of Transportation, Internal Revenue Service, Missouri Department of Revenue, Bureau of Alcohol, Tobacco, Firearms, and Explosives (ATF), Occupational Safety & Health Administration and applicable local ordinances and State regulations. Compliance is reviewed by the Board of Directors (BOD) and Senior Leadership Team (SLT) through our Legal, Ethical and Regulatory Compliance (LERC) Report (CKM) (7.4-5). We became ISO 9001:2000 registered in 2008 and have completed 5 successful continuing assessment audits and 2 recertification audits with no major findings; one of which registered us to the new ISO 9001:2008 standard (7.4-6) While not regulatory by nature, MW is fully committed to using the Baldrige Excellence Framework to lead and manage the business; as stated in our Culture Statement, we strive to be the “purest Baldrige colony on the planet”. We have a Shareholder KR (SHKR) to Receive the Baldrige Award every 6th year. We applied for and received the Missouri Quality Award (MQA) in 2008 and Baldrige Award in 2009 (7.4-12). P.1b(1) What are your organizational structure and GOVERNANCE system? What are the reporting relationships among your GOVERNANCE board, SENIOR LEADERS, and parent organization, as appropriate? We are a private, family-owned business comprised of 8
departments and 1 division. The division is led by a senior manager reporting to the President. Departments are made up of areas and sections. Departments are led by Vice Presidents (VPs), areas by senior managers/managers, and sections by managers/supervisors. VPs report to the President, President to the CEO and CEO to the BOD. There are 4 members of the BOD; all are shareholders and family members. The BOD provides top level direction and financial oversight for the Company to ensure stakeholder interests are protected. Our Organizational Governance document (Fig. P.1-5 and available on site (AOS)) shows the roles and responsibilities of our BOD, CEO and President.
Figure P.1-5 Organization Governance (excerpt, full version AOS) Authority Board CEO President Articles of Incorporation and Bylaws A I I Company Mission Statement A I I Company Strategic Obj./Strategic Plan A I Key Company Policies A I Department Mission Statements A Department Strategic Plans A A=Approve I=Input
P.1b(2) What are your KEY market SEGMENTS, CUSTOMER groups, and STAKEHOLDER groups, as appropriate? As defined in our MS (Fig. P.1-2), our key market segment is domestic internet retailing to Customers who purchase products in the shooting, hunting and outdoor industry. We further categorize Customers into segments based on activity (types of shooting, reloading, gunsmithing, hunting, etc. See 3.2b1). Our Customers Groups are based on Customer life cycle: active, inactive and prospective. Our key stakeholder (KS) groups are Customers, Employees, Suppliers/Partners (S/Ps) and Shareholders. What are their KEY requirements and expectations for your products, CUSTOMER support services, and operations? Our SKRs are shown in our OG document (Fig. P.1-4). Our strategy is to achieve our OGs by meeting or exceeding SKRs. Achieving our OGs is how we determine and measure success. What are the differences in these requirements and expectations among market SEGMENTS, CUSTOMER groups, and STAKEHOLDER groups? Since we operate in one market segment, domestic internet retailing, we have found CKRs do not vary between Customer groups. This is validated through our CKR survey. We survey each Customer group and other Stakeholder groups (Employees and S/P) annually to determine their KRs and level of satisfaction and engagement. We receive KRs directly from the Shareholders through the CEO and BOD. We must meet or exceed our SKRs to achieve our OGs (Fig. P.1-4). P.1b(3) What are your KEY types of suppliers, PARTNERS, and COLLABORATORS? What role do they play in your WORK SYSTEMS, especially in producing and delivering your KEY products and CUSTOMER support services? Our Suppliers are the organizations we purchase products from to resell to our Customers; our key Suppliers are the top 20 Suppliers based on sales. The top 10 represent X% of our sales and the next 10 represent X%. These Suppliers are known as Top 10/Next 10. Our Partners are defined as any organization with which we have a business relationship other than Suppliers. Our key Partners are the top 10 Partners central to fulfilling our mission. Examples include

OP-3
the National Rifle Association (NRA), UPS, Elavon and Google. Our Supplier’s role in our KWS is to provide product for resale to Customers. Two of our key Partners play a significant role in our KWS. UPS’s role in our work system is to deliver over 85% of our Customers’ orders; and Elavon processes 100% of our Customers’ credit cards when ordering. What role do they play in enhancing your competitiveness? Competitiveness is enhanced by meeting or exceeding our CKRs better than our competitors. Product Suppliers are key to helping us meet our CKRs Competitive product pricing, In-stock products and Product selection (this CKR links to the Supplier/Partner KR (S/PKR) Support of product line). Confidential information removed. In 2012, we negotiated a new agreement with a key Partner, UPS, to become our primary shipping provider. Now, over 85% of our Customer orders are handled by UPS. This enabled us to negotiate additional discounts and delivery programs to better meet our CKRs Low-cost shipping and Fast shipping and delivery. Our President and VP of LO meet with UPS annually to review and improve this important service to our Customers. Our partnership with the NRA helps us meet the CKR Support of the 2nd Amendment and the shooting sports industry. MW is an industry leader in supporting the 2nd Amendment and the shooting sports industry. MW founded and continues to support the NRA Round-Up Program and the Friends of the NRA Program. We also partner with the MidwayUSA Foundation (founded by the Potterfield’s) which helps communities and organizations raise funds to support their high school, college and other youth shooting teams. This level of industry support is key to engaging our Customers. What are your KEY mechanisms for two-way communication with suppliers, PARTNERS, and COLLABORATORS? We communicate with our S/P through meetings, Supplier Partnership Agreements (S/PA), contracts, phone calls, emails and S/P surveys. What role, if any, do these organizations play in contributing and implementing INNOVATIONS in your organization? We work with Suppliers to serve our Customers and meet their CKRs by buying at the best price, optimizing our product offering and innovating marketing campaigns to promote specific products. We work with our shipping providers via contract negotiations to innovate processes to provide CKRs, Low-cost shipping and Fast shipping & delivery. These innovative ideas reduce shipping cost and provide improved or new services to our Customers. What are your KEY supply-chain requirements? Our key supply chain requirements are primarily dictated by our CKRs (Fig. P.1-4). The highest ranking CKRs are Competitive product pricing, Low-cost shipping, In-stock products, Product selection, and Fast shipping & delivery. We select S/P based on their ability to help us meet our CKRs. To meet CKRs, we require our Suppliers provide competitively priced products that our Customers want; timely, reliable delivery of sufficient inventory to meet Customer demand; and to interface with our state-of-the-art purchasing and logistics systems. We require our shipping providers have competitive rates; pick up orders at the end of each business day; and provide timely, reliable delivery to our Customers. Annually we survey our Suppliers and key Partners to identify their KRs (Fig. P.1-4) and determine how well we are meeting them. We also survey our
Customers on their KRs as they pertain to their product, service and delivery expectations to determine their satisfaction with our ability to meet their KRs. We design our processes to meet or exceed S/PKRs (Fig. P.1-4). We maintain performance measures for Suppliers that are derived from SKRs (Fig. P.1-4). We have a Supplier performance report to monitor these measures. Among other measures, sales growth, margin percent, return rate, inventory turns, in stock rate and total purchase order lines received on time are included in the report. We balance all of our SKRs when evaluating our S/Ps. P.2a(1) What is your competitive position? What are your relative size and growth in your industry or the markets you serve? In alignment with our MS, we have a strategy “to be the best-known, most respected internet retailer of shooting, hunting and outdoor products in America. [Confidential information removed.] The competitive landscape is shifting as Customers search for the best overall delivered price (price plus shipping costs). As a result, we have either recently completed or are working on executing Company Action Plans (CAPs) to address our CKRs Competitive product pricing and Low-cost shipping. Since we received our first Baldrige Award in 2009, we have had a 115% increase in Customers, 99% increase in sales and a 13% increase in Employees. This aligns with our SHKRs Customer acquisition & retention, Growth in sales and Improvement in productivity & efficiency. We have had an average active Customer growth of 19% and average sales growth of 21.3% over the past 11 years (2004-14). We project continued double-digit growth over the next 5 years (long-term planning horizon). We have been one of the fastest growing companies in our industry over the past 11 years at 21.3% growth, growing at over 3 times the average industry growth rate (6.9%; 2008-14) and over 2 times the average growth rate of our #1 industry competitor, (9%; 2005-14). Our #1 overall competitor, has averaged 26.1% overall product sales growth (2009-14). It is important to note, due to the size of our #1 overall competitor, we aren’t able to obtain data on their average growth in the product categories we sell, which we believe to be an extremely small percentage of their overall business. HOW many and what types of competitors do you have? MW considers any retailer who sells shooting, reloading or outdoor products with a significant online presence as a competitor. Companies who are wholesalers, distributors, or primarily operate retail stores are not considered competitors. P.2a(2) What KEY changes, if any, are affecting your competitive situation, including changes that create opportunities for INNOVATION and collaboration, as appropriate? Two key changes affecting us are market volatility and the emergence of our #1 overall competitor. Our industry is greatly impacted by political uncertainty (strategic challenge (SC)), which can drive large swings in demand for the products offered. This demand can be greater than the capacity of our Suppliers to produce products, which creates another SC, “Scarce supplies of certain hard to produce products” (P.2-1) (CKR In stock products). These SCs were realized at the end of 2012 when news of potential industry-impacting legislation spread throughout our Customer community. This news caused industry-wide panic with unprecedented demand which resulted in scarce supply of some products continuing through 2013. The result of this market

OP-4
surge in was a 2-year, 63% growth in sales in relation to 10% growth goals for 2012 and 2013. This market surge created the opportunity for us to leverage our Supplier relationships to get scarce products and innovate our service by allocating/rationing products and limiting purchase quantities. In 2014, our sales normalized back to pre-surge levels of performance which continued an industry-leading, 11-year growth trend (7.5-1) averaging 21.3% growth that has been sustained into 2015. The emergence of our #1 overall competitor and their strategy of high-growth, low-profit, creates pressure on pricing and shipping charges. This competitive environment change created a SC in meeting our CKRs Competitive product pricing and Low-cost shipping. In response, innovation has occurred, resulting in new proprietary systems and the use of Partners to better meet these CKRs. For example, through our Strategic Planning process (SPP), we partnered with a 3rd party software provider to incorporate competitive pricing intelligence into our Pricing processes, renegotiated a new contract with our primary shipping provider, and re-engineered our proprietary system for calculating shipping charges. Additionally, we have several 2015 APs designed to continually focus on our ability to meet our CKRs Competitive product pricing and Low-cost shipping. P.2a(3) What KEY sources of comparative and competitive data are available from within your industry? Our key sources of comparative and competitive data within our industry are our Bizrate Customer satisfaction surveys (CSS), product Suppliers and annual reports from publicly-owned competitors. What KEY sources of comparative data are available from outside your industry? Comparative information is actively sought in both executing and improving our processes by benchmarking with organizations outside of the industry: Bizrate CSS, Internet Retailer, Warehousing Education and Research Council, Economic Research Institute, MQA and Baldrige Award recipients (BARs). What limitations, if any, affect your ability to obtain or use these data? Our industry is small enough that we don’t have an overarching organization to gather and maintain data from members, so any comparison data we want, must be obtained on our own. An additional challenge arises because nearly all of the organizations within the industry are privately held and treat this information as confidential. To address this, many of our comparisons come from outside of our industry or from publicly traded competitors. P.2b What are your KEY STRATEGIC CHALLENGES and ADVANTAGES in the areas of business, operations, societal responsibilities and WORKFORCE? Our SAs arise from our CCs. Within our CCs, we have several key processes (KPs), driven by strategies. These strategies provide SAs and are difficult for our competitors to imitate. These processes and strategies are captured as strengths on our Strength, Weakness, Opportunity, Threat (SWOT) analysis for use in our SPP. Our CCs and resulting SAs are developed to meet our SKRs. Our SCs are generally external in nature and are captured on our SWOT as threats or weaknesses for use in our SPP. See Fig. P.2-1 for a list of our SAs and SCs. P.2c What are the KEY elements of your PERFORMANCE improvement system, including your PROCESSES for
evaluation and improvement of KEY organizational projects and PROCESSES? We have an extensive Performance Improvement System (PIS) (see Cat. 6) designed to systematically and effectively identify and manage strategic initiatives (CAPs and Department Action Plans (DAPs)), Corrective Action Reports (CARs) and Opportunities for Improvement (OFIs) throughout the organization. See P.2-2. Figure P.2-2 Performance Improvement System Key Elements Process reviews, process strategies and work instructions (WI) Monthly Company and Department scorecard reviews Department dashboard and leaderboard review Annual process effectiveness audits ISO registration and external audits Monthly Operations Focus meetings (OFM) CARs and OFIs generated by feedback from Stakeholders Idea development, categorization, prioritization, implementation SPP, CAPs, DAPs Project Management process
While we have many performance and process measures, performance at the highest and most important level is measured by our 13 CKMs, which are direct measures of performance toward our OGs and SKRs. These 13 CKMs (Fig. P.2-3) are how we define success. Figure P.2-3 Company Key Measures * Key Measure Operational Goal Customer Satisfaction Customer Satisfaction (7.2-1a) Supplier/Partner Satisfaction S/P Satisfaction (7.1-29b) ES&E ES&E (7.3-10a) Shareholder Satisfaction Shareholder Satisfaction
Active Customers Shareholder Satisfaction (7.2-7) Gross Sales $ Shareholder Satisfaction (7.5-1) Net Income % Shareholder Satisfaction (7.5-2) % of Earnings Paid on Time Shareholder Satisfaction (7.4-4) NRA Round-Up % Shareholder Satisfaction (7.2-9) % of Pre-Tax Profit Contribution Shareholder Satisfaction (7.4-9) Receipt of Baldrige Award Shareholder Satisfaction (7.4-12) % Compliant – LERC Shareholder Satisfaction (7.4-5) Strategic Plan Execution Shareholder Satisfaction (7.4-10) Productivity (Sales $/Employee $) Shareholder Satisfaction (7.3-4)
*CKMs are denoted in Category 7 by this symbol: Also included is the following symbol: which indicates points of learning and integration.
OP-5
Figure P.1-4 Operational Goals and Stakeholder Key Requirements (SKR) #1 Goal
Customer Satisfaction 95%
#2 Goal Employee Satisfaction & Engagement
86%
#3 Goal Supplier & Partner
Satisfaction 92%
#4 Goal Shareholder Satisfaction
100%
Key
Req
uire
men
ts
1. Competitive product pricing 2. Low-cost shipping 3. In-stock products 4. Product selection 5. Fast shipping & delivery 6. Accurate, intact shipments 7. MidwayUSA’s support of the 2nd Amendment & the shooting sports industry* 8. Extremely helpful product information 9. Ease of finding what you’re looking for using “search” 10. Easy to do business with 11. Fast, feature-rich, user-friendly website 12.Timely & exciting promotions *bold = truncated in application
1. Competitive salary for my position 2. Advancement opportunities 3. Competitive benefits 4. Appropriate amount of work & time away from work for my position 5. Continuous learning, training & development 6. The right tools & support to do my job 7. Relationship with my coworkers, supervisor, manager, & senior leaders 8. Clear, effective, candid, two-way communication 9. Organizational sustainability & growth 10. Meaningful, challenging & satisfying job assignment(s) 11. Input into decision-making 12. Leaders & coworkers whose actions align with our Values & Culture (V&C) 13. Safe, comfortable work environment 14. Rewards & recognition (R&R)
1. Support of product line (breadth & depth of offering) 2. Candid, two-way communication 3. Friendly, courteous, respectful, ethical relationship 4. Timely payment 5. Accurate payments 6. Easy to do business with 7. Marketing exposure
1. Grow the value of the Company through Customer acquisition & retention 2. Grow the value of the Company through growth in sales 3. Grow the value of the Company through growth in net income 4. Timely payment of earnings 5. Support the NRA & 2nd Amendment 6. Key community support 7. Receive Malcolm Baldrige National Quality Award 8. Legal, ethical, & regulatory compliance 9. Continuous improvement through strategic plan execution 10. Continuous improvement in productivity & efficiency
Figure P.2-1 Strategic Advantages and Challenges (excerpt, full version AOS) Core
Competency Key Process (Dept.) Strategic Advantage (Strength)/ Strategy Stakeholder Key Requirement
Bus
ines
s
Business Administration
Strategic Planning (Quality Management Systems (QMS))
Strategic planning/Agile Strategic Planning process
SHKR: Improvement through strategic plan execution
Business Administration
Financial Reporting Mgt. (FS) Financial strength & cash flow management/Outstanding cash flow mgt.
SHKR: Net income; Timely payment of earnings
Marketing Customer Relationship Management (MK)
Customer focus/ Emotional marketing to engage Customers; Customer Satisfaction Machine
OG: Customer Satisfaction SHKR: Customer acquisition & retention
Marketing Marketing Operations (MK) Customer-friendly policies/Customer-friendly policies
CKR: Easy to do business with
Merchandising Promotions (ME) Frequent, exciting sales & promotions/ Frequent, exciting, relevant promotions
CKR: Timely & exciting promotions
Merchandising Suppliers (ME) Supplier relationship management/ Great Supplier/Partner relationships
OG: Supplier & Partner Satisfaction
Strategic Challenge (Threat/Weakness)
-Competitive product pricing -Low-cost shipping -Reduced margins driven by price pressure from competitors -Loss of identity in crowded market -Credit card data breach and credit card fraud
CKR: Competitive product pricing; Low-cost shipping SHKR: Net income; Customer acquisition & retention SHKR: LERC
Ope
ratio
ns
Merchandising Product Management (ME) New product acquisition/ First to Market CKR: Product selection; In stock products
Merchandising Product Management (ME) Product Selection/ Just About Everything CKR: Product selection Logistics Shipping (LO) Order fulfillment/ Nitro Express-Super Fast
Shipping CKR: Fast shipping & delivery
Customer Support Web Production Operations (CS) Fast, feature-rich, user-friendly website/ Fast, feature-rich, user-friendly website
CKR: Fast, feature-rich, user-friendly website
Strategic Challenge (Threat/Weakness)
-Unexpected surges in demand (panic buying) -Scarce supplies of certain hard to produce products -Changing Customer expectations on faster delivery -Inconsistent Supplier pricing policies (minimum advertised price) -Inventory management of hard to produce, hard to get products
CKR: In stock products; Competitive product pricing; Fast shipping & delivery
Soci
etal
R
espo
nsi-
bilit
y
Business Administration
Public Relations (MK) Role model support of 2nd Amendment & shooting sports industry/ Maximize benevolence of Potterfield Family for Company positioning
CKR: Support of the 2nd Amendment & the shooting sports industry SHKR: Support the NRA & 2nd Amend.
Strategic Challenge (Threat/Weakness)
-Legislation affecting shooting/hunting industry -Increasing/changing or unknown regulations on products -Computer viruses, malware, phishing and hacking
SHKR: LERC
Wor
kfor
ce
Business Administration
Employee Engagement (HR) High-performing, engaged Employees who share our Values & embrace our Culture/ Recruit, develop & retain high-performing Employees who share our Values & align with our Culture
OG: ES&E SHKR: Improvement in productivity & efficiency
Business Administration
Employee Engagement (HR) Employee satisfaction & engagement/ Be considered a great place to work
OG: ES&E SHKR: Impr. productivity & efficiency
Strategic Challenge (Threat/Weakness)
-Recruiting high-performing, engaged IT Employees who share our Culture -Workforce capacity & capability planning -Workforce training & development processes
EKR: Appropriate amount of work & time away from work; Continuous learning, & development

1

2
Category 1: 1.1a(1) HOW do SENIOR LEADERS set your organization’s VISION and VALUES? Our MS (P.1-2) contains our Vision, Purpose, Mission and Values. It is the foundation of our operations and strategic direction and is governed by the BOD which aids in sustainability. The BOD reviews/validates/changes MS during 4th quarter each year, prior to new planning cycle. Senior leaders (SLs) provide input as part of SPP (Fig. 2.1-1), during “set the direction”, which considers changing needs and market direction. The President recommends changes to CEO, and CEO submits for review and approval at quarterly BOD meetings. SLT reviews MS during monthly Strategic Planning meetings (SPMs) to ensure strategic plan (SP) alignment with MS and MS alignment with Company needs. As a result of changing needs, SLs recommended changing our MS in 2013 to focus on internet retailing. This BOD-approved change set a new direction for the SPP. HOW do SENIOR LEADERS DEPLOY the VISION and VALUES through your LEADERSHIP SYSTEM, to the WORKFORCE, to KEY suppliers and PARTNERS, and to CUSTOMERS and other STAKEHOLDERS, as appropriate? Our Leadership System (LS) (Fig. 1.1-1) is reviewed/updated during Leadership meetings (one of 6 Baldrige Category Meetings (BCMs) (1.1a3). LS shows how SLs guide/sustain our Company, including how SLs communicate/deploy important information like Vision, V&C. Vision and Values are on our MS which is posted in the following locations (seen by visiting Customers, S/P and all Employees and Shareholders): building entrances, conference rooms, Organizational DNA Walls in each building, departments, intranet, Employee badges, website and Facebook (Customers) and S/PAs (S/P). We use our white paper (WP) on MS to teach Vision and Values to Employees, key S/P during meetings, the community at Baldrige Performance Excellence Group (BPEG)-Sharing Days, and all stakeholders on America Needs Baldrige (ANB) website. SLs deploy MS to Employees in quarterly State of the Business (SOTB), Department Knowledge Sharing (DKS) meetings, monthly Department Baldrige Meetings (DBMs) and new hire orientations. If we change our MS, President leads posting ceremonies in each department and communications are updated. Vision, V&C are integrated into operations and deployed to stakeholders through actions. Values are engraved in sidewalks. In 2013, CEO and President began speaking at new hire orientations to improve deployment of Vision, V&C, OGs and Long-Term Goals (LTGs). During the 2012/13 market surge some competitors raised prices. Our Vision, V&C led us to hold prices. We deployed our strategy to Customers through marketing and received great feedback, including a standing ovation from 1000+ Customers at a key conservation group banquet speech! HOW do SENIOR LEADERS’ personal actions reflect a commitment to those VALUES? Values are non-negotiable family principles that guide us. SLs are committed to living by our Values and creating a Culture where Employees live by and are held accountable to our Values. SLs have Values memorized and they teach Employees about their meaning. SLs designed Employee performance/360 reviews to include ratings on V&C. Employees not in alignment are put on performance improvement plans or dismissed. There has never been a SL in violation or need of improvement in any Value. SLs ensure new hires align with our Vision, V&C. The Career Development
Team (CDT) interviews all salaried candidates to determine fit. SLs speak at SOTB, DKS and BPEG-Sharing Days, partly to discuss Vision, V&C. The CEO and President regularly give speeches on Vision, V&C, both inside/outside the Company. Outside audiences include Customers, S/P and members of key communities. Our ES&E survey asks about SLs actions aligning with V&C. In 2011 the President started leading biannual Employee Focus Groups (EFGs) to get feedback from Employees and promote a culture of trust and transparency. 1.1a(2) HOW do SENIOR LEADERS’ actions demonstrate their commitment to legal and ETHICAL BEHAVIOR? How do they promote an organizational environment that requires it? SLs serve as role models by living the Values and holding Employees accountable for actions. Employees are committed to pursuing our Vision, living by our Values, executing our Mission and achieving OGs. Our Recruiting & Hiring process ensures alignment to MS, OGs and Culture. CDT validates alignment during interviews. Performance/360 reviews evaluate on performance, V&C. We reward and recognize (R&R) high performance and role model alignment to MS, OGs and Culture. Violations of Values and LERC issues are recorded on our LERC report (CKM) (7.4-5). The President is immediately notified of LERC issues and a Level 1 CAR is created containing the problem (root cause) and solution. BOD, CEO and VPs are notified within 24 hours. SLs review LERC in SPM and Leadership meetings to discuss issues and incorporate process improvements. BOD reviews LERC quarterly. SLs deploy Vision, V&C, all aligned with legal and ethical behavior, to stakeholders systematically (1.1a1). 1.1a(3) HOW do SENIOR LEADERS’ actions build an organization that is successful now and in the future? A focus on success starts with our MS, OG, Culture Statement, Company Strategies and LTG; governed by our BOD with SL input. It is enhanced by our SPP. Our Recruiting & Hiring process and CDT ensure we hire Employees who align with our Vision, V&C. Long-term success is enhanced by SLs commitment to learning about and deploying modern leadership and management principles (Baldrige, ISO, LEAN, Six Sigma). SLs are dedicated to pursuing our Vision, living by our Values, executing our Mission and achieving OGs. SLT has 201 total years’ experience (averaging 22+ years) and averages 16 years tenure at MW. All SLs have MQA or Baldrige examiner experience (MQA uses the Baldrige Excellence Framework), totaling 23 years, with 19 site visits. One SL was a MQA judge for 5 years. SLs work as a team in BCMs and other meetings to ensure we are operating in alignment with our Vision, Mission, V&C, OGs and Baldrige. SLs have a systems perspective of the Company and work together to do the right things (pursuing our Vision, executing our Mission, achieving our OGs). Shareholders are committed to long-term success with SKRs requiring growth in Customers, sales and profits; alignment with the Baldrige Excellence Framework and requiring we receive the Baldrige Award as often as possible. HOW do they create an environment for the achievement of your MISSION, improvement of organizational PERFORMANCE, PERFORMANCE leadership, organizational LEARNING, and LEARNING for people in the WORKFORCE? SLs focus on success, achievement of Mission, performance improvement, performance leadership and learning using integrated approaches as shown in our LS.

3
Highlights include BCMs: a) quarterly Leadership meetings where we manage the LS b) monthly SPMs where SLs and select Leadership Development Candidates (LDCs) meet all day to review results and create/manage SPs c) quarterly Customer Focus meetings (CFMs) where we review Voice of the Customer process (VOC) results/feedback for integration into the PIS d) quarterly Knowledge Management meetings where we review knowledge assets, information and technology e) quarterly Workforce Focus meetings where we discuss results from the ES&E process, including suggestions f) monthly OFMs where we focus on process improvements and our PIS. We have monthly results review (MRR) meetings where CEO, President and departments review performance via scorecards (2.1a3). SLs lead Employees in execution of department Missions (daily operations) and APs to achieve strategic objectives (SOs). Other approaches include Department MS, strategies, key measure (KM) goals, SWOT analyses, work system maps (WSM), scorecards, leaderboards, dashboards, Marketing Plan, analysis matrices, training and WIs. Employees are hired and evaluated on alignment with Vision, V&C. Key Employees have a passion for our industry. SLs deploy modern leadership and management principles, SOs, SPs and results through SOTB, DKS and DBM. Using the SPP, SOs and APs are created to maintain and improve performance to OGs. The SPP and SP are aligned at department levels to ensure performance improvement integration. ISO, which includes CARs and OFIs integrated into our PIS, aids in performance improvement and learning. SLs promote organizational learning by mentoring, preparing/teaching WPs, R&Ring high performance, using performance/360 reviews to provide feedback, inviting LDCs as guests to meetings, arranging carpools for trips, providing tuition reimbursement and setting training budget at 2.1% of payroll. 36% of salaried Employees have been MQA/Baldrige Examiners (7.3-17). HOW do they create a WORKFORCE culture that delivers a consistently positive CUSTOMER experience and fosters CUSTOMER ENGAGEMENT? BOD and SLs create a Customer-focused Culture by making Customer Satisfaction (CSAT) (CKM) (7.2-1a) our #1 OG. Processes, strategies, OGs, SOs, APs, OFIs and CARs are centered on CKRs to ensure CSAT and engagement. In 2014, we created a CAP to improve our VOC. We improved our Customer survey; satisfaction, engagement and dissatisfaction measures; and approach to incorporating feedback into our PIS. The VOC integrates Customer feedback into a central location for dissemination to process performers for complaint resolution and process improvement. SLs review Customer-focused results in CFMs to prioritize top-level improvements (3.1a1). HOW do they create an environment for INNOVATION and INTELLIGENT RISK taking, achievement of your STRATEGIC OBJECTIVES, and organizational agility? Our Culture includes agility, focus on success, managing for innovation, management by fact, delivering value and results, and continuous improvement. SLs ensure work systems and processes are designed and executed in alignment with our Culture. Our PIS captures and prioritizes innovation, OFIs and CARs. We have formal calls for innovation at SOTB and Opportunity Focus meetings. We do extensive planning, market, SWOT and return on investment analysis on projects for major decisions. We have a measure for tracking SO and SP
Execution (CKM) (7.4-10) and review it during MRRs. We use Decision Making 1-Pagers to capture facts and benefits for making proposals. Intelligent Risk – in 2012, we projected an Obama reelection would cause fear of legislation and panic buying of ammunition and gun parts. In response, we created a CAP called the "Big Buy Theory" and purchased bulk quantities of product that would be scarce after the election. This led to a record 2013. Agility – weeks into 2013, we re-wrote our SP. Our market shifted as fear of industry-impacting legislation spread through our Customer community. This caused demand and supply shortages in certain areas. Rather than continue with our current SP, we revised it to better meet stakeholder needs. A new CAP, “Operation Double Action”, consisted of 71 new actions that put Customers first. HOW do they participate in succession planning and the development of future organizational leaders? Succession planning is part of our LS. We identify successors for key positions and provide tools to prepare them for success. Our Leadership Development process, reviewed during CDT and Leadership meetings, identifies future leaders and aligns them with development opportunities (managed on LDC list). SLs mentor LDCs (President is mentoring 24 Employees in 2015).
In 2010, the CEO set a SO to “Improve Leadership Skills”. SLs created a CAP to improve the Leadership Development process which produced the LDC list, development activities and formalized leadership development approaches. 1.1b(1) HOW do SENIOR LEADERS communicate with and engage the entire WORKFORCE and KEY CUSTOMERS? As shown in our LS, SLs communicate with and engage Employees via SOTB, DKS, DBMs, new hire orientations, Student Development Program, mentoring, open-door culture, ES&E process, EFGs, break room TVs, email, postings, Pizza with the President, Letter from President in monthly newsletter, monthly newsletter, postings, etc. The Employee Communication Matrix captures communications, topics, participants and frequency (5.2a1). SLs communicate with and engage Customers via promotions, Flyers, package stuffers, emails, website information/services, Larry’s Short Stories, TV commercials, TV vignettes, YouTube, Facebook, Twitter, Larry Line, CS, VOC, PR, KCG appearances, etc. The Marketing Plan shows Customer communication and engagement initiatives (3.2b1). HOW do they encourage frank, two-way communication, including EFFECTIVE use of social media, when appropriate? At SOTB meetings, the CEO, President and VPs address LDC, Department Leadership Teams (DLTs) and guests. Each SL presents and answers questions at SOTB at least twice per year. At DKS meetings, SLs present to all department Employees on SOTB content and the CEO or President speaks and answers questions. Our open-door culture allows Employees to bring concerns or ideas to SLs. SLs cell numbers and email addresses are on the intranet. Our PIS allows Employees to enter CARs and OFIs. The CEO and President speak at new hire orientations on Vision, V&C, OGs and answer questions. SLs communicate with/engage Employees during mentoring, meetings, Company trips, carpools to events and walk-arounds. Employee communication is facilitated through our ES&E process which includes biannual, ES&E survey. SLs involve Employees in EFGs, which the President moderates, hearing feedback from approximately 144

4
Employees annually to help improve ES&E. Customer feedback is received through our VOC which captures feedback from CS (emails, phone calls), CSS, Facebook, YouTube and our website. Numerous cycles of learning have occurred as a result of our two-way communications with Customers and Employees as all feedback is integrated into our processes. All communications are designed to foster trust and transparency. HOW do they communicate KEY decisions and organizational change? Our LS shows how SLs use SOTB, DKS, DBMs, Department Musters, VP Q&A Sessions, e-mails from the President, intranet, social media, break room TVs, etc. to deploy key decisions and organizational changes. In 2013, Employees in EFGs suggested we hold VP Q&A sessions following key decisions and organizational changes. We improved our Communications process shortly after the EFG. HOW do they reinforce HIGH PERFORMANCE and a CUSTOMER and business focus by taking a direct role in motivating the WORKFORCE, including by participating in reward and recognition programs? SLs and managers R&R innovation, safety, reliability, loyalty, performance and key community support using tools such as lunches, shooting activities, Bullseye Bucks, emails and certificates of recognition. Profit sharing pays a percentage of company earnings to Employees. We have paid profit sharing 11 years in a row and celebrate Profit Sharing Day in February with lunch and cake. The CEO, Brenda Potterfield and President distribute checks and personally thank each Employee. R&R is held at SOTB and DKS meetings. At holiday parties, CEO, Brenda Potterfield and President recognize Employees with 5+ year’s tenure. Those same people, SLs and peers have a party with cake to recognize milestone anniversaries (15, 20, 25, 30 years). We use email, intranet and newsletters to recognize birthdays, anniversaries, promotions, achievements and milestones. SLs mentor LDCs. The Million Dollar Club allows CEO and President to recognize CS Employees who have taken over $1M in orders and LO Employees who have shipped over $5M or received over $10M of product. Employees receive certificates, Bullseye Bucks, name on a plaque and have cake. LO portion of Million Dollar Club was added in 2012 after EFG input. 1.1b(2) HOW do SENIOR LEADERS create a focus on action that will achieve the organization’s MISSION? Through daily operations and the SPP, SLs and Employees pursue our Vision, execute our Mission and achieve OGs. Processes and the SP are designed to achieve OGs and LTGs. APs, CARs and OFIs are identified in results reviews during SPMs, DBMs, and through the Process Review process and are captured in the PIS. SLs lead SOTB, DKS and DBMs, with calls for innovation in SOTB and Opportunity Focus meetings, and a focus on action guided by results from scorecard and process reviews. SLs train modern leadership and management principles. SOs focus on current and future performance to OGs. SLs lead departments in creating Department SPs (DSPs) aligned with the Company Strategic Plan (CSP). Monthly AP updates are given by SLs and project managers. We use our SP Execution measure to monitor execution to plan (2.1a3/4.1a1). How do SENIOR LEADERS create a focus on action that will improve the organization’s PERFORMANCE, achieve INNOVATION and INTELLIGENT RISK taking, and attain its VISION? The Company, led by SLs, is aligned and focused on pursuing our Vision, executing our Mission and
achieving OGs. The SPP is designed to meet OGs and LTGs. MRRs are conducted at all levels (2.1a3). Quarterly Focus on the Future meetings ensure SLs are planning for the future. BCMs ensure alignment with Baldrige and future success. Company, Department and individual scorecards (or performance/360 reviews as appropriate), leaderboards and dashboards are balanced and aligned with OGs and LTGs. Intelligent risk is integrated into processes and SPs. SLs lead market analysis and make decisions based on facts and intuitive competence. When taking intelligent risk, we conduct analysis and submit proposals via Decision Making 1-Pagers, Executive Summaries for APs, special buy proposals, etc. On Feb 13, 2015, a surge in demand occurred after the ATF announced a potential ban on a certain type of ammunition after March 16. The industry sold out quickly and we acquired the last known supply from a Canadian Supplier who was new to us. We created a CAP, “Operation Steel Core”, that satisfied thousands of Customers. It was 3 weeks from announcement until the ammo was received and sold. This plan led to a record single product sales day, a record sales day and a record sales month. How do SENIOR LEADERS identify needed actions? Through daily operations and meetings (SOTB, DKS, SPM, BCM, DBM, DLT, SLT, Sales & MK Team meetings, etc.) performance to OGs is reviewed and actions are identified, prioritized and executed. Agility is built into operations and planning processes. For example, we identify needed actions through MRRs and dashboard performance. If a KM performs below 85% of goal 3 months in a row, a CAR is submitted and a solution identified to improve performance (4.1b). EFGs identify needed actions and generate ideas that are reviewed in Workforce Focus meetings. The VOC uses Customer input to identify actions and ideas. Ideas are captured in our PIS as CAPs, DAPs, CARs, OFIs or Bucket List (BL) items. HOW do SENIOR LEADERS, in setting expectations for organizational PERFORMANCE, include a focus on creating and balancing VALUE for CUSTOMERS and other STAKEHOLDERS? Organizational performance is measured by our ability to meet OGs which are to satisfy each KS by meeting their KRs (Fig. P.1-4). Company and Department scorecards are balanced and reviewed to ensure KRs and goals are met. Operations and meetings (1.1a3), are focused on pursuing our Vision, executing our Mission and achieving OGs. Processes for goal setting consider balance. Processes for identifying and prioritizing improvements and taking action, focus on value and long-term success (2.1a1/b2). 1.2a(1) HOW does your organization ensure responsible GOVERNANCE? Governance documents (Fig. P.1-5, AOS) outline responsibilities of BOD, CEO, President, VPs and Managers. They communicate accountability, decision-making authority, empower Employees and protect stakeholder interests. Deployment includes Organizational DNA Walls, intranet and WPs (see Employee Communication Matrix AOS). Governance is reviewed in BOD and Leadership meetings. HOW do you review and achieve the following KEY aspects of your GOVERNANCE system? •Accountability for SENIOR LEADER’s actions: The CEO and President present during BOD meetings on OGs, budget, LTGs, CSP, financial and LERC results. BOD sets direction and provides guidance on Vision, V&C through MS, as indicated in our LS. SLs are held accountable to results through performance reviews and

5
BOD feedback. •Accountability for strategic plans: SLs manage SPs through the SPP (2.1a1). CSPs are approved by the CEO and reviewed by the BOD. DSPs are approved by the President. We have a SHKR Improvement through SP execution and a CKM (SP Execution) aligned with it. VPs have a Department Key Measure (DKM) for DSP Execution. Results are reviewed in MRRs. •Fiscal accountability: BOD sets OGs and the CEO/President set SOs annually. OG performance is reviewed in BOD meetings. A report is made to the BOD if an OG is not achieved along with APs to address. SLs are held accountable for OGs and financial results during performance reviews and MRRs. An independent firm audits financials annually. •Transparency in operations: BOD requires full disclosure of LERC violations through LERC report. BOD and Employees have access to SPs, KMs, operations and financial information via user interfaces, intranet and postings. Transparency is built into our LS (Fig. 1.1-1). •Selection of GOVERNANCE board members and disclosure policies for them, as appropriate: BOD consists of four family members. Organizational Governance outlines BOD authority to select BOD members and the strategy is family-only. The BOD is held accountable to Vision, V&C. There has never been a V&C violation for a BOD member. BOD books contain agendas and minutes from previous meetings. •Independence and EFFECTIVENESS of internal and external audits: Independence and effectiveness is addressed using internal resources outside of departments being audited (internal audits) and external resources (external audits – ISO, inventory, financial, 401k and regulatory). SLs review ISO and process effectiveness audits during OFMs and financial audits during Leadership meetings. Financial and operational results are reviewed during BCMs, MRRs and DBMs. BOD selects external auditors and reviews/approves audit results annually. •Protection of STAKEHOLDER and stockholder interests, as appropriate: The President and VPs have MRRs to review scorecards. SLT reviews OG results in SPMs. OGs balance SKRs. BOD reviews performance to OGs and LERC during BOD meetings. •Succession Planning for SENIOR LEADERS: As a part of Succession Planning process, CDT manages plan for SL and key positions. SLT reviews plan during Leadership meetings. BOD approves annually (5.2b3). 1.2a(2) HOW do you evaluate the PERFORMANCE of your SENIOR LEADERS, including the chief executive, and your GOVERNANCE board? BODs set Vision and maintains a focus on future needs to ensure ongoing success relative to OGs and LTGs. BOD reviews performance to OGs and LERC quarterly to evaluate effectiveness of each other, CEO and President. CEO also evaluates President on performance to budget and SP Execution. President evaluates VPs on Department Scorecards which include execution of DSPs, budget, ES&E and process results. CEO and President meet monthly to review results. President meets monthly with VPs through MRRs (2.1a3). Biannual performance reviews are given to VPs by President. All SLs receive annual 360 reviews. HOW do you use PERFORMANCE evaluations in determining executive compensation? The Compensation & Benchmarking Review process determines compensation for all SL and Employees based on performance (from reviews), market information and cost of living. Profit sharing is based on individual KM (high) performance and position (5.2a4).
HOW do your SENIOR LEADERS and GOVERNANCE board use these PERFORMANCE evaluations to advance their development and improve both their own EFFECTIVENESS as leaders and that of your board and LEADERSHIP SYSTEM, as appropriate? BOD uses performance to OG and LERC to guide development. Input from performance/360 reviews and MRRs are used by SLs to improve performance through SOs, APs and personal development plans. SLs’ leadership skills are enhanced through the Leadership Development process: MQA/Baldrige examiner participation, lunch and learns, WP development and speeches. 1.2b(1) HOW do you anticipate and address public concerns with your products and operations? We obtain information from the NRA, National Shooting Sports Foundation, S/P and trade shows through our Legislative Tracking process to anticipate public concerns. ME and MK Employees review industry publications including the Shooting Wire, NRA-ILA Alerts and NSSF Bullet Points to keep updated on industry news, changes in public concern and issues affecting MW. Through the VOC and Market Analysis processes, we anticipate public concerns with future products and operations. Threats and public concerns are addressed through daily operations, the SPP and SWOT. •HOW do you address any adverse societal impacts of/anticipate public concerns with your products and operations? We design, deploy and improve processes to ensure legal, ethical and regulatory compliance. Examples include the Product Delivery Restriction process to prevent the sale of products to restricted areas and underage Customers. Processes ensure products are sold to Customers who can legally accept delivery. We manage hazardous products using the Product Hazmat Management process. •HOW do you prepare for these impacts and concerns proactively, including through conservation of natural resources and EFFECTIVE supply-chain management PROCESSES, as appropriate? We design processes with agility to meet changing legal and societal concerns. The Product Delivery Restrictions process allows for rapid response to regulatory changes. LERC issues are communicated to S/P and we work collaboratively to address current issues and prevent future issues. When planning for new developments, the Safety & Facilities Manager provides site plans to authorities to ensure compliance. Plans are designed to meet current requirements, anticipate future needs and regulatory changes. Boone County Regional Sewer District, who controls/maintains our wastewater system, performs testing and reporting to Missouri Dept. of Natural Resources. What are your KEY compliance PROCESSES, MEASURES, and GOALS for meeting and surpassing regulatory and legal requirements, as appropriate? Key compliance processes are Product Delivery Restrictions, Product Hazmat Management and Hazmat Shipper Training processes. KM are State Regulatory Compliance, ATF Regulatory Compliance and Department of Transportation Compliance. Goals are 100% compliance on the LERC report. What are your KEY PROCESSES, MEASURES, and GOALS for addressing risks associated with your products and operations? We address risk through Server Anti-Virus and Risk Management processes which include activities to ensure compliance, security, loss prevention and assess risk. Insurance is in force to protect assets and operations. Suppliers

6
selling high-risk products must have certificates of insurance. We monitor Cyber Security Preparedness (7.1-23) and Credit Card Fraud (7.1-22). Goal is 100% LERC compliance (7.4-5). 1.2b(2) HOW do you promote and ensure ETHICAL BEHAVIOR in all interactions? Honesty is the first Value on MS. We operate 100% legally and ethically. Promoting ethical behavior begins with our Recruiting & Hiring process screening for fit with V&C, background checks and drug tests. Employees are evaluated biannually on performance, V&C and submit to random drug tests. We deploy Vision, V&C to Employees through postings, SOTB, DKS and new hire orientations; Suppliers through S/PA; Customers through website and all Stakeholders through our actions. LERC report and actions taken ensures ethical behavior. SLs lead by example (1.1a2). What are your KEY PROCESSES and MEASURES or INDICATORS for enabling and monitoring ETHICAL BEHAVIOR in your GOVERNANCE structure; throughout your organization; and in interactions with your WORKFORCE, CUSTOMERS, PARTNERS, suppliers and other STAKEHOLDERS? Values are the non-negotiable family principles that guide us. All Stakeholders live by our Values and are held to them as shown in Fig. 1.2-1. Figure 1.2-1 Processes for Enabling & Monitoring Ethical Behavior Process (Department) Measure Stakeholder
Monitored LERC Report (FS) LERC (7.4-5) SH, E, S/P Drug & Alcohol Free Workplace (HR) LERC (7.4-5) E ES&E (HR) (EKR: Leaders/coworkers whose actions align with our V&C)
EKR score (7.4-8)
E
Supplier Performance Evaluation (ME) LERC (7.4-5) S/P S/P Satisfaction Survey (ME) (S/PKR: Friendly, courteous, ethical relationship)
S/PKR score (7.4-7)
E
Interaction Quality Monitoring (CS) Quality Monitoring Score
E
Loss Prevention (FS) Credit Card Fraud (7.1-22)
C
Inventory Review (FS) LERC (7.4-5) E Risk Management (FS) Audit % (7.4-3) All
Key–Customers (C); Employees (E); Suppliers/Partners (S/P); Shareholders (SH) HOW do you monitor and respond to breaches of ETHICAL BEHAVIOR? The BOD and SLT review Values and LERC report quarterly. HR and SLT are notified of Values violations which are responded to immediately. Incidents are reviewed and appropriate action is taken. Depending on the level of action needed, an AP or CAR is created (1.1a2). 1.2c(1) HOW do you consider societal well-being and benefit as part of your strategy and daily operations? Our Culture includes key community support (CKR, Support of the 2nd Amendment & the shooting sports industry and SHKR, Key community support (CKM) (7.1-7)). Sustaining our heritage is good for key communities and America. We consider key community support in our SPP and operations. The Potterfield family is generous, donating half our profits to the industry. How do you contribute to societal well-being through your environmental, social, and economic systems? We recycle paper, plastic, cardboard, pallets and metal. We minimize box usage by maximizing cube utilization. In 2008, we replaced Styrofoam packing peanuts with inflatable air pillows made of recycled plastic, reducing packaging needs. We use super T-8 energy efficient light fixtures. We are virtually paperless, submitting electronic purchase orders and not accepting mail orders. Most marketing is done electronically, with only flyers being printed. Shareholders donate half our profits to the
industry to sustain our heritage. We conduct blood/charity drives and promote/teach Baldrige through BPEG-Sharing Days. We averaged 21.3% growth per year over the past 11 years allowing us to add 200 Employees and provide profit sharing during that time to fuel economic prosperity. We also provide societal well-being through our strategy to “Be a leader in the area of compensation & benefits, well above average”. 1.2c(2) HOW do you actively support and strengthen your KEY communities? We design processes in alignment with our Culture. Part of our Culture is to support key communities. Examples: Founding/supporting NRA Round-Up and Friends of NRA programs, creating MidwayUSA Foundation, founding/supporting BPEG-Sharing Days, sponsoring shooting events, conducting blood/charity drives, producing educational TV vignettes and sponsoring KCG events. We are a family-owned Company with generous owners who donate half our profits to key communities. We offer NRA Round-UP to Customers and have collected $11M since 1992. We encourage NRA and key community membership by offering discounts on Employee purchases. Office Employees have NRA membership level outside offices/cubicles. Employees have NRA membership level on business cards and email signatures. Departments with all Employees as NRA members have plaques with "100% NRA Department". We maintain the ANB website to share WPs and presentations created by SLs on Baldrige. In 2013 the Shareholders donated $1M to the Baldrige Foundation for the 1st Missouri public school to receive a Baldrige Award. On March 4, 2013, we reached 1 million Active Customers, had a “Thanks a Million” celebration and sent a check for $1 Million dollars to the NRA/ILA National Endowment for the Protection of the 2nd Amendment. What are your KEY communities? The NRA, shooting sports industry, KCGs, Baldrige and local area. HOW do you identify them and determine areas for organizational involvement, including areas that leverage your CORE COMPETENCIES? The BOD creates the MS and identifies/validates key communities with SL input. We identify key communities that align with our Vision, Purpose, Mission, V&C. Key communities are reviewed biannually by SLs in Leadership meetings and by BOD in BOD meetings. SLs leverage CCs to provide value to key communities when we identify needs through innovation or meetings. In 1992, we created the NRA Round-Up program to leverage our CC of CS (Order Taking) to collect money on behalf of the NRA. HOW do your SENIOR LEADERS, in concert with your WORKFORCE, contribute to improving these communities? Key community support is a SHKR and Support of the 2nd Amendment & shooting sports industry is a CKR. We ask Customers to round-up orders to the next dollar to support the NRA. 100% of SLs are NRA Life Members and many are members of other KCGs. Some SLs and Employees volunteer with KCGs. We require NRA Memberships to purchase at discounted Employee prices and Employees must round-up orders for the NRA. We encourage and measure Employee NRA Participation and 66% are members (7.3-12). SLs mentor organizations on Baldrige through BPEG-Sharing Days and directly. In 2012, we started the Youth Wildlife Conservation Experience where local youth attend KCG conventions to learn about conservation and our industry. This has been adopted by 9 KCGs with $3.8M providing opportunities for 185,000 youth.

7

8
Category 2: 2.1a(1) HOW do you conduct your strategic planning? We conduct strategic planning via monthly all-day SPMs with SLT and monthly DBMs with DLT (Fig. 2.1-1). The SPP is designed to facilitate and integrate strategic planning at the company and department level resulting in the creation of a CSP (CAPs) and DSPs (DAPs). The SPP is deployed through SOTB, DKS, DBMs and SPP WP and reviewed annually for improvements in SPMs/DBMs and the Work Process Management process (WPMP). Effectiveness of the SPP is determined by our ability to meet our OGs and SP Execution CKM (7.4-10). In 2014, a review of the SPP generated an OFI to improve the process, requiring BL items be fully vetted prior to inclusion on future year SPs, this better ensures we understand the value proposition of the potential CAP. What are the KEY PROCESS steps? KP steps are numbered 1-7 in Fig. 2.1-1. Our Strategic Plan Development Timeline ensures process steps are executed by creating a detailed timeline with milestones that includes all meetings and actions to be taken to create our SP and integrate the SPP, Marketing Plan, Workforce Planning and Budgeting processes. On an annual basis, through our Master Planning Calendar process, we schedule all reminders and meetings from the timeline for the next year from a central planning calendar to ensure all participants are included. The timeline is reviewed monthly and milestone status is tracked to ensure execution. Who are the KEY participants? The key participants are the BOD, CEO, President, SLT, DLT, select LDCs (Fig. 2.1-1). What are your short- and longer-term planning horizons? Our strategic planning time horizon is 5 years. Our short-term is current year and next year; long-term is years 2-5. As needed, we identify LTGs beyond that horizon. Planning horizons and LTGs are deployed in SOTB and DBMs. In 2010, based on our 2009 Baldrige Feedback Report, we extended our long-term horizon from 3 to 5 years to align with our long-term focus. HOW are they addressed in the planning PROCESS? In the short-term horizon we create the next year's SP, execute and adjust the current year SP, and review the results of completed APs in the control phase. In the long-term, we generate ideas and draft future year SPs for required actions, focusing on facility capacity and staffing. This occurs at the company and department level. LTGs may generate APs for future year SPs. HOW does your strategic planning PROCESS address the potential need for: •Transformational change and prioritization of change initiatives? Our SPP is specifically designed to identify the need for transformational change and to enact and sustain that change. The need arises from changes or projected changes in OGs, CKM results, SKRs, the market, competitive or regulatory environment, or BOD direction. This is identified through reviews of information in the SPP (Fig. 2.1-1 Steps 1&3) and culminates in the creation of Company and Department SWOT analyses which are used to select APs to achieve SOs. SPMs/DBMs allow for quick response to a sudden need for transformational change. The overall strategy for prioritization is to focus on high value ideas. Each idea being considered receives a relational value for initial prioritization and additional value information captured during analysis. Initiatives selected for implementation are prioritized in the PIS based on value and resource capacity. Priorities are reviewed monthly at the department and company level. •Organizational agility and operational flexibility? See 2.2b. In 2013, a
review of results showed our ES&E OG was below goal. Analysis of data showed a need to improve satisfaction in our LO Department. In April, we added a CAP “Operation Grand Slam” which implemented 13 major improvements resulting in a 10 point increase in satisfaction in LO to 87%. 2.1a(2) HOW does your strategy development PROCESS stimulate and incorporate INNOVATION? Managing for innovation is part of our Culture. A key to stimulating innovation is our Company Strategy to “Recruit, develop & retain high-performing Employees who share our Values and align with our Culture”, including being dedicated to organizational learning. Our Recruiting & Hiring process uses our Culture Statement as part of the criteria for selecting Employees and our Performance Evaluation process reinforces alignment by using it to evaluate performance. Our engaged Employees are encouraged to innovate through annual process reviews and training, Focus on the Future, Opportunity Focus and OFMs, calls for innovation at SOTB, DKS and DBMs, accessibility to our PIS to submit ideas (all Employees have access), our strategy to “seek benchmark data”, and organizational transparency including sharing the CSP, SWOT and BL with all Employees. We incorporate external analysis input into our process such as Baldrige/MQA Feedback reports and benchmark information. A DKM on Continuous Improvement Projects measures innovation (7.1-21). In 2013, we identified an OFI with our approach to collecting and reviewing ideas for improvement and innovation; through a CAP we created a PIS which captures all ideas. The PIS is reviewed monthly at the company and department level to identify and incorporate innovation into SPs. In 2014, we improved integration by linking all PIS items to a Department’s Area, Section or Work process for use in the WPMP. HOW do you identify STRATEGIC OPPORTUNITIES? Fig. 2.1-1 Step 3. SLT/DLT conducts an analysis of key information. We leverage our SA “Supplier relationship management” to get market information for our Marketing Plan (3.2b1/6.2b). The information described in 2.1a3 is used to conduct the SWOT which identifies and captures SAs, strategic opportunities and SCs. The SWOT is used to select CAPs/DAPs to meet our SOs and OGs. Key strategic opportunities pursued as intelligent risks are addressed with a CAP. SWOTs are deployed in SPM/DBM, posted on the intranet, and in the Strategic Planning room. HOW do you decide which STRATEGIC OPPORTUNITIES are INTELLIGENT RISKS for pursuing? We decide which strategic opportunities are intelligent risks to pursue through our AP Identification process (Fig. 2.1-1 Box S/T) which allows Employees to submit ideas to the BL via their VP using a Decision Making 1-Pager. Ideas on the BL are reviewed in the SPM. Strategically important ideas for achieving SOs and OGs are selected for analysis using our Executive Summary form in the PIS. Ideas with a completed Executive Summary are reviewed in the SPM and a determination is made on whether or not to add the idea to a SP in the planning horizon. Part of the Decision Making 1-Pager and Executive Summary includes a stakeholder impact analysis (which SKRs will be impacted by the AP), a value analysis (net present value/return on investment), and review of alignment with future direction (LTGs). In 2014, we obtained market information from our Suppliers that led us to add “Asset
9
product strategy/process” as an opportunity to our SWOT. We decided to pursue this as an intelligent risk in 2015 to purchase all available inventory of 3 products, allowing us to become the single source for these products (SHKRs Customer acquisition & retention and Growth in sales). What are your KEY STRATEGIC OPPORTUNITIES? Our key strategic opportunities are: [Confidential information removed.] All items have a 2015 or 2016 AP and are captured on our SWOT. 2.1a(3) HOW do you collect and analyze relevant data and develop information for your strategic planning PROCESS? Fig. 2.1-1 Step 3. Financial trends and projections are analyzed for use in our SPP and SWOT through integration of our Budgeting process and SPP. There are 4 levels of MRRs. Department Scorecards are reviewed by the VP/DLT and VP/President. The basis of the Department Scorecard is process performance and helps us understand current and needed CCs, and work system performance. The Company Scorecard reports results for each OG/KS and is reviewed monthly by the President/SLT and CEO/President. The Company Scorecard includes results aligned with SKRs from Customer, Employee, and S/P surveys and our performance against SHKRs. This information is analyzed and integrated with our SWOT and SPP. Information is collected from multiple sources through our Marketing Research and WAM Chart Management processes, such as benchmarking competitor /comparative organizations, industry publications, and stakeholder input (e.g. Supplier meetings, satisfaction surveys, and EFGs). We have several tools to facilitate the analysis of this information. The Category Analysis Matrix (CAM) provides an overview of product categories and defines our competitors and how they compete in the market; Website Analysis Matrix (WAM) focuses on comparative information on website features; Marketing Analysis Matrix (MAM) provides comparative information on marketing efforts and policies; and HR Analysis Matrix (HAM) analyzes our Employee benefits, services, and policies compared to industry and local organizations and BARs (4.1a2). The integrated Sales & MK Team analyzes, develops and incorporates information into the WAM, CAM, MAM and Marketing Plan; the HAM is analyzed and developed by HR. Top level findings are presented in the CFM (WAM, CAM, MAM) and Workforce Focus (HAM) meetings for integration. Items for inclusion in the SWOT or BL are identified and used to create the SP. Each matrix is posted in the Strategic Planning room and appropriate department for additional deployment. BCMs refer items to SPM through PIS. In 2010, we improved our competitive analysis through the creation of our WAM. Further learning came as it was shared and other departments created analysis matrices. In this collection and ANALYSIS, HOW do you include these KEY elements? •Your STRATEGIC CHALLENGES AND STRATEGIC ADVANTAGES See 2.1a2; Fig. 2.1-1 Step 3. Data and information is collected, analyzed and used to create the SWOT. The SWOT determines our SAs and SCs. •Risks to your organization's future success? We mitigate risks to future success with our strategy to “use Baldrige as our leadership and management framework.” As a part of our SPP, we collect and analyze internal and external data (Fig. 2.1-1 Step 3), and capture risks to future success as threats on our SWOT. This information is used both to set the direction of our
SP and develop APs. •Potential changes in your regulatory environment? Our Legislative Tracking process monitors potential changes to our regulatory environment at federal, state and local levels. We partner with shipping providers to identify potential changes in product storage or shipping requirements. This information serves as a SPP input to ensure compliance and forecast potential impact to processes and product offering. Critical or large scale regulatory changes are executed as a CAP or DAP. •Potential blind spots in your strategic planning PROCESS and information? We deploy the SPP and SP at SOTB, DKS and DBM to gather input from all levels in the organization and to identify blind spots. Blind spots are also identified as we conduct the Company/Department SWOTs and update analysis matrices. This information is reviewed in our SPM/DBM and incorporated into the SP and SPP. •Your ability to execute the strategic plan? We integrate our SPP, Budgeting and Workforce Planning processes to identify blind spots and ensure resources are available to execute SPs. This information is reviewed in SPM/DBM. For constrained human resources, additional time estimate meetings are held to further define time requirements. Conflicts are resolved in the SPM/DBM. We have CKM and DKM, SP Execution (7.4-10), to measure the percent of SP completed versus goal. The CKM (CSP Execution) is reviewed in MRRs, BOD and SOTB meetings; DKM (DSP Execution) is reviewed in MRRs. If performance to goal or circumstances require a shift in plans, we review the resource requirements of the changes or reallocations and adjust our SP accordingly. 2.1a(4) What are your KEY WORK SYSTEMS? Our KWS deliver our CKRs; they are ME, MK, CS and LO. HOW do you make WORK SYSTEM decisions that facilitate the accomplishment of your STRATEGIC OBJECTIVES? We review and validate work systems (Fig. 2.1-1 Box G&M) annually for effectiveness and to ensure alignment with current and future business needs, including capitalizing on our CCs and accomplishing our SOs. The Organizational Governance document identifies levels of authority for work system changes. When a work system change is considered, several factors are reviewed using the Process Design process (Fig. 6.1-2) including SOs and SKRs. HOW do you decide which KEY PROCESSES will be accomplished by external suppliers and PARTNERS? HOW do those decisions consider your CORE COMPETENCIES and the CORE COMPETENCIES of potential suppliers and PARTNERS? Our SPP includes a review of KWS and CCs. If a CC is needed, we evaluate costs and barriers to entry and our capacity and capability to develop that CC. We consider CCs of S/Ps via 2-way communication and evaluation. We align our decision to perform KPs internally or externally with whichever is most likely to provide a SA. HOW do you determine future organizational CORE COMPETENCIES and WORK SYSTEMS? Our SPP determines the need for future CCs and work systems (Fig. 2.1-1 Box G). We validate our MS, OGs, KSs, SKR results and conduct a SWOT. Changes to these may require a new CC. When a needed CC is identified, the process described earlier determines if it’s pursued internally or externally. If we pursue internally, but it isn’t well supported by current work systems, work systems are modified or created to develop the CC.

10
2.1b(1) What are your organization's KEY STRATEGIC OBJECTIVES and timetable for achieving them? Our key SOs are designed to meet OGs through satisfying KSs by meeting or exceeding KRs. The timetable for achieving SOs is the end of the plan year. SOs are set for each year in the time horizon. In 2015, 3 new SOs were set through the Direction Setting process to provide focus in key areas. (Fig. 2.1-2) Figure 2.1-2 Key Strategic Objectives and Goals Strategic Objective 2015 2016 2017 2018 2019 2020 Improve Customer Sat. 95% 95% 95% 95% 95% 95% Maintain Employee Sat. 86% 86% 86% 86% 86% 86% Maintain Sup/Part Sat. 92% 92% 92% 92% 92% 92% Improve Shareholder Sat. 100 100 100 100 100 100 Improve Gross Margins via Growth Categories % Conf Conf Conf Conf Conf Conf
Improve Efficiency % 17.7 17.6 17.5 17.3 17.1 16.9 Improve Inventory Turns on Standard Inventory 10 10 10 10 10 10
What are your most important GOALS for these STRATEGIC OBJECTIVES? See Fig. 2.1-2. What KEY changes, if any, are planned in your products, CUSTOMERS and markets, suppliers and PARTNERS, and operations? [Confidential information removed.] 2.1b(2) HOW do your STRATEGIC OBJECTIVES achieve appropriate balance among varying and potentially competing organizational needs? Varying and competing needs arise from the differing KRs of the 4 KSs. Aligning SOs and OGs with each KS and then creating a SP each year to achieve OGs by addressing the different SKRs ensures needs are balanced and met. Results are reviewed in MRRs (2.1a3). HOW do your STRATEGIC OBJECTIVES: •Address your STRATEGIC CHALLENGES and leverage your CORE COMPETENCIES, STRATEGIC ADVANTAGES and STRATEGIC OPPORTUNITIES? See Fig. 2.1-1 Step 3. Our SWOT identifies SAs, SOs, and SCs and is used in Step 1 to create SOs. SOs have APs to address a SC, leverage a SA or CC, pursue a SO, or create a CC. In 2013, through our results review and Customer and market analyses, we identified a SC in meeting our CKR Low-cost shipping. This impacted our ability to meet our CSAT OG (CKM) (7.2-1a) and SO to increase CSAT. We created a CAP “PH&I Re-engineering” which resulted in a 4 point increase in our CSS result on shipping charges. •Balance the short- and longer-term planning horizons? The BOD sets the OGs and provides LTGs which may extend beyond the time horizon. The CEO/President set SOs for the time horizon. Due to our rapidly changing environment, the SPP balances our short and LTGs by defining next year’s SP in detail and capturing critical APs for future SPs on our BL. •Consider and balance the needs of all KEY STAKEHOLDERS? Our SOs are designed to balance the needs of all stakeholders (see above 2.1b2). BCMs refer stakeholder input to SPM through PIS. 2.2a(1) What are your KEY short- and longer-term ACTION PLANS? What is their relationship to your STRATEGIC OBJECTIVES? See Fig. 2.2-1.
Figure 2.2-1 Strategic Objectives and Key Action Plans (full AOS) Year Strategic Objective
Stakeholder Key Requirement Key Action Plans
2015 Shareholder Satisfaction Receive Baldrige Award
-Apply for and Receive Baldrige Award
2015 Customer Satisfaction Low-cost shipping
-Cartonization Logic -Carton Size/Selection Optimization
2015 Shareholder Satisfaction Customer acquisition & retention
-Military Surplus Div. Creation -50-50 Supplier Co-op Flyers -Become an Amazon Seller
2016 Shareholder Satisfaction Growth in net income
-Inbound Freight Management Process
2016 Shareholder Satisfaction Receive Baldrige Award
-Baldrige/MQA Feedback Report Improvements
2018 Shareholder Satisfaction Growth in sales
-500-Year Campus Planning and Development
HOW do you develop your ACTION PLANS? Fig. 2.1-1, Step 1, the direction is set by reviewing analyses and validating key information to create SOs. In Step 3 (Box L-R), strategic and operational analyses are done to develop ideas for potential APs, captured as BL items or OFIs in the PIS. BL items are reviewed in SPM and OFIs are reviewed in DBMs to identify key ideas for CAP/DAPs to achieve SOs. See 2.1a2. Project managers use the Project Management process to further define APs, including scope, requirements, goals, and timelines. 2.2a(2) HOW do you DEPLOY your ACTION PLANS? HOW do you DEPLOY your ACTION PLANS to your WORKFORCE and to KEY suppliers and PARTNERS, as appropriate, to ensure that you achieve your KEY STRATEGIC OBJECTIVES? After APs are developed and prioritized, the CSP is approved by CEO/President, and deployed to Shareholders for review in the Q4 BOD meeting. SLT deploys CSP to all Employees at SOTB, DKS, DBM, and the intranet; it is deployed to key S/Ps in annual meetings as appropriate. Each DSP is reviewed with all VPs for capacity and integration. DSPs are approved by the President, deployed to SLT and then Employees in DKS, DBM, and the intranet. AP stakeholders are identified for APs through the Project Management process. Knowledge sharing and learning occurs when stakeholders provide input and identify blind spots and APs are revised or new ideas are added to the PIS. HOW do you ensure that you can sustain the KEY outcomes of your ACTION PLANS? To achieve SOs, APs must achieve and sustain key planned outcomes. We conduct results reviews of completed APs in SPM/DBM against established goals (Fig. 2.1-1 Step 7). Review continues until results meet expectations on a sustainable basis. When results are not meeting expected outcomes, SLT/DLT plans action to address the issue. 2.2a(3) HOW do you ensure that financial and other resources are available to support the achievement of your ACTION PLANS while you meet current obligations? Integration of the SPP with Workforce Planning and Budgeting processes ensures resources are available to execute processes and achieve APs (Fig. 2.1-1 Box U&V). During the planning year, we identify APs for the following year; this information is used to create department budgets. Long-term planning provides integration through financial projections and key metrics for the time horizon. In 2009 we integrated the Budgeting and Workforce Planning processes with the SPP.In 2012 we further improved by creating a Planning Metrics model to incorporate key data such as projected sales, invoice volume, and active Customers into these processes. HOW do you allocate these resources to support the plans? Using our integrated approach described above, we allocate resources to support the plans based on overall value and this priority order: 1) CAR1 2) Process execution 3) CAP 4) DAP 5) CAR2/OFI. Workforce Planning ensures each position allocates time using this strategy. Resource needs for APs are reviewed with stakeholders through the Project Management

11
process to ensure resources are provided. SLT/DLT reviews SP progress and results monthly and adjusts resources as needed. HOW do you manage the risks associated with the plans to ensure your financial viability? The value proposition of each AP is outlined in an executive summary that is evaluated by SLT for potential risk and reward. The expected results of approved APs are incorporated into our long-term projection model to provide the financial impact overview. Governance documents define levels of authority for expenses and contractual obligations to minimize financial risk (2.1a2). 2.2a(4) What are your KEY WORKFORCE plans to support your short- and longer-term STRATEGIC OBJECTIVES and ACTION PLANS? HOW do the plans address potential impacts on your WORKFORCE members and any potential changes in WORKFORCE CAPABILITY and CAPACITY needs? We create annual training plans for all departments through our Onboarding & Training process, development plans for professional Employees as a part of the Performance Review process, and development plans for Employees identified as LDCs through our Leadership Development process (5.2b3). The integration of our SPP, Workforce Planning and Budgeting processes, ensures alignment between workforce plans and SOs and APs. If an AP or SO cannot be achieved with current capability and capacity, action is taken to provide staffing and/or training to acquire new skills. Our key workforce plan for 2015 is to create and staff a new Military Surplus Division (CAP). In alignment with a LTG, we have a plan to relocate our facility to a new campus to support business growth. Longer-term SOs/APs are supported by our plan to have DLTs serve as MQA examiners. 96% of DLTs have served or are serving in 2015. We will be at 100% when the 1 newly-promoted DLT serves in 2016. 2.2a(5) What KEY PERFORMANCE MEASURES or INDICATORS do you use to track the achievement and EFFECTIVENESS of your ACTION PLANS? The SP is designed to deliver OGs, so the most important measures for tracking the achievement and effectiveness of APs are our CKMs (Fig. P.2-3/7.1-0), which are direct measures of performance toward our OGs. These results are reviewed in MRRs. Progress on implementing APs is reported in the SPM/DBM based on meeting milestones as set in the Project Management process. APs not meeting milestones are discussed for further action. After implementation, AP results are reviewed in the SPM/DBM until sustainable. A real-time measure for implementing the SP, SP Execution, was created in 2009 to monitor progress on executing the CSP. HOW does your overall ACTION PLAN measurement system reinforce organizational ALIGNMENT? OGs are set by BOD in alignment with MS. SOs are set by CEO/President to deliver OGs. APs are developed by SLT/DLT to deliver SOs. Each OG represents a KS to ensure balance. SOs and APs have goals aligned with achieving an OG. SLT/DLT review performance in relation to AP goals. In 2011 DSP Execution was added to Department Scorecards for review in MRRs. 2.2a(6) For these KEY PERFORMANCE MEASURES or INDICATORS, what are your PERFORMANCE PROJECTIONS for your short- and longer-term planning horizons? CKMs (Fig. P.2-3) are denoted with a in Category 7 and include time horizon performance projections.
HOW does your projected PERFORMANCE on these MEASURES or INDICATORS compare with your PROJECTIONS of the PERFORMANCE of your competitors or comparable organizations and with KEY BENCHMARKS, as appropriate? We show industry and benchmark leadership in results and projections for our CKMs throughout our time horizon. See Category 7. If there are gaps in PERFORMANCE against your competitors or comparable organizations, HOW do you address them? Comparative and competitive information is compiled and analyzed as part of the SPP. Analysis of this information drives the development of SOs and APs that are designed to address current or projected gaps. See 2.1b2. 2.2b HOW do you establish and implement modified ACTION PLANS if circumstances require a shift in plans and rapid execution of new plans? Monitoring market conditions and business needs on a continuous basis may establish the need for changes to APs or SPs. Agility is provided through our SP Modification process which allows for rapid approval APs to be added to SPs any time. When circumstances shift, Project Managers or AP owners recommend scope changes for APs at any time. Monthly SPM/DBMs provide additional agility and full deployment of changes. When modifying APs or SPs, workforce capability and capacity are also reviewed and adjusted to accommodate for the change. Category 3: 3.1a(1) HOW do you listen to, interact with, and observe CUSTOMERS to obtain actionable information? Customer Satisfaction is our #1 OG, therefore listening to, interacting with and observing Customers will always be critical to our success. From a top level, we listen to and observe Customers via Customer-driven results such as Gross Sales (7.5-1), Customer Retention (7.2-5), New Buying Customers (7.1-20) and Product Return Rate (7.1-14) along with other indirect response measures indicated on scorecards that are reviewed in MRRs (2.1a3). Many of our direct and indirect listening methods are listed in Fig. 3.1-1.
Figure 3.1-1 VOC Listening Methods
Dir
ect
CSS (see Fig. 3.1-2) Post-order Post-fulfillment Post-interaction Non-buyer Competitor Phone Mail Email
Chat Facebook YouTube Other Social Media Product Reviews PIQR Product Returns Larry Line
Indi
rect
Gross Sales Category Sales Performance Customer Retention Customer Acquisition Product Returns
Click Through Rates Order Frequency Average Order Values
Information is aggregated, aligned with CKRs and analyzed for potential action through the VOC. VOC integrates KWS departments by deploying information for review each week. Actionable information is resolved immediately or entered into the PIS for process improvements or APs. In 2013, to better understand our ability to meet the CKR Extremely helpful product information, we improved our process for collecting product information quality ratings by enabling Customers to provide direct, actionable feedback on opportunities to improve the product information provided on our website.

12
HOW do your listening methods vary for different CUSTOMERS, CUSTOMER groups, or market SEGMENTS? We directly listen to Customer groups using different types of CSS (Fig 3.1-2), and indirectly in our one market segment through our Market Research process, which includes sales and market share analysis and gathering information from our S/Ps. We also listen to many different individual Customers, which may be members of any Customer group, using both indirect and direct listening methods indicated in Fig. 3.1-1. In addition, our Customer Relationship Management (CRM) process uses this information to ensure marketing communications are specifically tailored and delivered to the correct Customers. HOW do you use social media and Web-based technologies to listen to CUSTOMERS, as appropriate? Our Social Marketing process is managed by a full-time staff member who monitors Customer activity across all major social websites, including Facebook, Twitter, Google+, YouTube and a variety of industry-related web forums. Actionable feedback is captured, categorized and input into our VOC for review and improvement. In 2015, we improved our Social Marketing and Public Relations processes by implementing the use of a 3rd party media monitoring service (Vocus) to expand our listening reach and help determine Customer sentiment (the % of positive vs negative press across all mediums). HOW do your listening methods vary across the CUSTOMER life cycle? We listen to all Customers, including Customers in different stages of their life cycle, through our VOC listening methods (Fig. 3.1-1). In addition, we specifically tailor our CSS by Customer life cycle, which aligns with Customer groups (Fig. 3.1-2). HOW do you seek immediate and actionable feedback from CUSTOMERS on the quality of products, CUSTOMER support, and transactions? We ask Customers to provide feedback via our CSS, regardless of whether a purchase was made. Customers who visit our website are asked to take a non-buyer survey, and we seek feedback from active Customers with post-order and post-fulfillment surveys. Customers who interact with us via phone are asked to complete a survey on their satisfaction with support provided by individual Customer Service Representatives (CSRs), Customers shopping on our website can provide feedback on the quality of product information and all Customers with an email address (97.3% have an email address in our system) are asked to review the products they purchase. Input from listening methods is fed into our VOC and several other processes where it is reviewed and acted upon, either immediately or through entry into our PIS as a CAR, future AP or OFI. 3.1a(2) HOW do you listen to potential CUSTOMERS to obtain actionable information? HOW do you listen to former CUSTOMERS, potential CUSTOMERS, and competitors’ CUSTOMERS to obtain actionable information on your products, CUSTOMER support, and transactions, as appropriate? We listen to potential Customers through our non-buyer survey, which is presented to potential Customers who visit our website but do not purchase. We receive approximately 15,000 non-buyer survey results each year. We also use our different types of CSS (Fig. 3.1-2) and our VOC listening methods (Fig. 3.1-1) to gather feedback from all Customer groups; active, inactive (former) and prospective (potential). Competitor surveys collect satisfaction
information, reasons for shopping elsewhere and purchase information against our top 10 overall competitors. The CKR survey collects information on the KRs of each Customer group to determine if variation exists. Actionable information is reviewed in our Sales & MK Team meetings for inclusion in the Marketing Plan or PIS. 3.1b(1) HOW do you determine CUSTOMER satisfaction, dissatisfaction and ENGAGEMENT? HOW do your determination methods differ among your CUSTOMER groups and market SEGMENTS as appropriate? We conduct a series of CSS to determine Customer satisfaction and dissatisfaction (Fig. 3.1-2). CSS results are aligned with CKRs and segmented by Customer group. Our post-order, post-fulfillment and non-buyer surveys are conducted by Bizrate, which offers surveys with standardized questions to Customers of internet retailers. We select specific questions from their pool of questions that align with our CKRs so we get direct feedback from Customers on our ability to meet their KRs.
Figure 3.1-2 Customer Satisfaction Surveys by Customer Group
Survey Customer Group
Active Inactive Prospective Post-order X Post-fulfillment X Post-interaction X X X Non-buyer X X X CKR X X X Competitor X X X Post-order survey collects satisfaction information immediately after the completion of a sale; also collects satisfaction with competitor information. Post-fulfillment survey collects satisfaction information after the order has been delivered to the Customer. Post-interaction survey collects satisfaction information on support provided by a CSR after a phone interaction. Non-buyer survey collects information on satisfaction, reason for non-purchase, and satisfaction with competitors CKR survey asks Customers to select and rank their KRs Competitor survey collects Customer’s satisfaction with, and shopping behavior information for, competitors
All survey information is aggregated, analyzed and used in our VOC to implement improvements through the SPP and WPMP.
Customer dissatisfaction is calculated as the percent of negative comments received through CSS (7.2-2). Customers provide approximately 14,000 comments through 40,000 surveys per month. Customer engagement is determined through evaluation of Customer Loyalty (7.2-6), Customer Advocacy (7.2-8), Facebook Engagements (7.2-3), Facebook Page Likes (7.2-4), NRA Round-Up Percentage (7.2-9) and Customer Retention (7.2-5), which considers both order frequency and recency. Customer Satisfaction (7.2-1a), Customer Dissatisfaction (7.2-2) and measures related to Customers engagement are reported on Company and MK scorecards for review in MRRs and CFMs. HOW do your measurements capture actionable information to use in exceeding your CUSTOMERS' expectations and securing your CUSTOMERS' ENGAGEMENT for the long term? Exceeding Customer expectations means understanding their needs (KRs) and designing processes to exceed their requirements. Customer satisfaction measures on our Company Scorecard are aligned with CKRs. Each CKR is aligned with at least one measure from our CSS, and where applicable, a process measure. Therefore, results indicate the exact KR that needs action. The process measures provide additional details on determining

13
what process needs improvement to address the poor result. Results are reviewed in MRRs and improvements are captured in the PIS for action. To secure long-term engagement, changes made based on these results are incorporated into marketing messages for Customers. 3.1b(2) HOW do you obtain information on your CUSTOMERS' satisfaction with your organization relative to other organizations? HOW do you obtain information on your CUSTOMERS' satisfaction: •relative to their satisfaction with your competitors? We conduct a competitor survey to determine Customers’ satisfaction with us relative to their satisfaction with our competitors. The survey is segmented by Customer group and aligned with CKRs. In addition, the survey collects which competitors are being shopped, visit frequency, and demographic information. We also include a “satisfaction with competitor” question in our post-order and non-buyer surveys. Survey data is integrated with the VOC and is reviewed in CFMs. Improvements are captured in the PIS for prioritization. In 2013, a review of our CSS results indicated decreasing satisfaction with our ability to execute our strategy of “Competitive pricing”, which would have potentially prevented us from meeting our #1 CKR Competitive product pricing. Benchmarking was conducted for validation, and our Pricing process was reviewed and deemed in need of improvement. A CAP, “Competitive Price Benchmarking Process Creation”, was created, it changed the Price Benchmarking process from a manual 200-product price comparison to an automated 20,000-product comparison of our top 6 competitors. •relative to the satisfaction of CUSTOMERS of other organizations that provide similar PRODUCTS or to industry BENCHMARKS as appropriate? We compare our CSS results to a satisfaction index created from Bizrate’s Circle of Excellence (CoE) award winners. MW has won the Bizrate CoE 7 times, most recently in 2014. This index provides satisfaction information on the top 2.9%, best-in-class, internet retailers that we use to compare to the satisfaction of our Customers (7.2-1a). We also create and manage analysis matrices showing our relative position in the marketplace. These matrices (2.1a3) are updated regularly, posted in applicable departments and our strategic planning room, and deployed in CFMs and DBMs. This information is used in daily operations and SPP to rapidly respond to changing market and Customer requirements. 3.2a(1) HOW do you determine product offerings? HOW do you: •determine CUSTOMER and market needs and requirements for product offerings and services? Our main product offerings are the products we sell and the services we provide to meet our CKRs. The broad categories of products we sell are determined by our MS. The New Product Plan process, which includes input from Supplier meetings (6.2b), tradeshows, Customers and competitor benchmarking, identifies additional product opportunities. Our “Just About Everything” (JAE) strategy guides the specific product selection. We carry all products that represent value to Customers. This does not mean we carry everything, but we strive to carry at least one product choice for Customers across product types in each product category. We hire PLMs and ME staff who have a passion for our industry and are consumers of our products. This connection with our products helps ensure
we stay current with emerging product trends. PLMs submit proposals for new products to our New Products Committee, which works to ensure alignment with our MS, JAE strategy and CKRs. The services we provide are kept in alignment with CKRs by continually monitoring the marketplace via our Marketing Research and SPP processes. These processes yield a SWOT, and MAM, WAM and CAM that compare our product offerings and services to competitors and best-in-class organizations. CKR surveys are conducted annually with all Customer groups to determine KRs. Results are reviewed in MRRs, CFMs and Sales & MK Team meetings; improvements are integrated with SPP. •identify and adapt product offerings to meet the requirements and exceed the expectations of your CUSTOMER groups and market SEGMENTS? •identify and adapt product offerings to enter new markets, to attract new CUSTOMERS, and to create opportunities to expand relationships with current CUSTOMERS as appropriate? Our main product offerings are the products we sell and the services we provide to meet our CKRs. We identify changes and additions to the products we sell by analyzing input from Supplier meetings, tradeshows, newswires, forums, Customers (VOC) and competitor benchmarking to create plans for each product category, or new product categories, as part of the New Product Plan process. Our KWS are designed to meet or exceed each CKR. We identify and adapt our KWS and the services we provide by reviewing CSS results and complaints (VOC) and through the Marketing Research, SPP, and WPMP processes. This analysis covers the policies, features and benefits we offer versus those offered by best-in-class companies and competitors. Identified improvements are documented in the PIS for prioritization and execution through SPP and WPMP. In 2014, competitor benchmarking indicated there was only one significant company offering military surplus products with little or no competition. MW created a new division for the acquisition of military surplus products at the beginning of 2015 (CAP), and in the first few months has increased military surplus sales nearly 900%. 3.2a(2) HOW do you enable CUSTOMERS to seek information and support? CS is a KWS. Our website is designed to help Customers find the products they want through features such as search, product detail pages and a help area. We also enable Customers to seek information and support through phone, email, chat and social media. Our “High quality, useful product information” strategy guides us to provide the information Customers need to make buying decisions. All electronic marketing communications link directly to the most appropriate area on our website, making it extremely easy for Customers to find information. By reviewing competitive and comparative process information, we identified an opportunity to support Customers via a new mechanism, web chat. This service is in perfect alignment with our internet retail mission and was added in 2011 to support the checkout process. During 2012, it was expanded to support the entire website. We currently interact with an average of 7,000 Customers per month via web chat. HOW do you enable them to conduct business with you? 93.5% of our Customers conduct business with us on our website. We enable Customers to conduct business with us by helping them find the products they’re looking for using

14
website search, gathering the products they’d like to purchase in our website shopping cart, and taking orders with our website’s checkout feature. We also enable Customers to conduct business with us over the phone, where a CSR helps them find the products they’re looking for and takes their order.
WHAT are your KEY means of CUSTOMER support, including your KEY communication mechanisms? Our key means of Customer support are our website and Customer Service processes that provide the capability for phone, email, chat and social media (e.g., Facebook) interactions with Customers. Our key communication mechanisms are our website, social media, email, internet advertising such as organic listings and pay-per-click (PPC) ads on search engines, and promotional flyers sent through mail. HOW do they vary for different CUSTOMERS, CUSTOMER groups, or market SEGMENTS? Some Customers prefer to conduct business with us almost exclusively through our website, while other Customers choose to interact and conduct business almost exclusively over the phone. Additionally, there are Customers who use nearly all of the differing Customer support mechanisms we provide. Key communication mechanisms also vary by Customer and Customer group. Customers and Customer groups are analyzed to understand the most effective means of marketing through our CRM and Marketing Research processes, and different types of marketing communications and advertisements are used depending on the results. For example, new Customers are primarily reached through internet advertising and email to prospective Customers, while active Customers are mostly engaged through promotional flyers and emails based on purchase history. In 2014, our Marketing Research process and SPP revealed an opportunity to reach more prospective Customers through selling products on the Amazon.com Marketplace. After testing the concept to prove it was viable and would result in a positive return, we created a 2015 CAP called, “Become an Amazon Seller”. HOW do you: •determine your CUSTOMERS’ KEY support requirements? We determine Customers’ KRs through our CKR survey, which asks Customers to identify and rank their requirements of doing business with us. This information is reviewed in CFMs and integrated with our SPP. •DEPLOY these requirements to all people and PROCESSES involved in CUSTOMER support? Our CKRs are listed under our #1 OG of Customer Satisfaction on our OG posting. This posting is on our website and intranet and is
displayed in all departments, conference rooms and common areas throughout our facilities. OGs and the requirements necessary to achieve them, are reviewed in all SPMs/DBMs, SOTB and DKS meetings. All Customer-related CAPs, DAPs, CARs and OFIs in our PIS are aligned with a CKR. 3.2a(3) HOW do you determine your CUSTOMER groups and market SEGMENTS? Our market segment is defined by our MS (Fig. P.1-2), which is approved by our BOD. Our one market segment is domestic internet retailing to Customers who purchase products within the shooting, hunting and outdoor industry. Potential changes to the market segment are determined through SWOT analysis, business results review, Customer feedback and market analysis. Requested changes to the MS are presented to our BOD at their quarterly meeting. Customer groups are determined by Customer life cycle and are divided into 3 key Customer groups: prospective, active and inactive. Prospective Customers are those who have never placed an order with MW. Active Customers are those who have placed an order within the last rolling 12-month period and Inactive Customers are those who have ordered previously, but have not ordered within the last rolling 12-month period. HOW do you: •use information on CUSTOMERS, markets, and product offerings to identify current and anticipate future CUSTOMER groups and market SEGMENTS? We use our CRM, VOC, SPP, Sales & MK Team meetings, Marketing Plan, Social Marketing and Market Analysis processes to gather, analyze and use information on current and future Customers, product offerings and market segments. These processes gather, review and analyze sales results/trends, Customer purchasing patterns, Customer origin, Customer characteristics, information from Suppliers, industry trends, industry trade organizations (e.g. KCGs), tradeshows, industry newswires, political news, MAM, WAM, web search and new product requests from Customers and potential Customers to anticipate future Customer groups and market segments. The results of these reviews are consolidated and reviewed and evaluated in our CFMs, DBMs and Sales & MK Team meetings, for referral to our SPM or entered into the PIS. •consider competitors' CUSTOMERS and other potential CUSTOMERS and markets in this segmentation? We focus on our top 5 competitors overall, and top 3 competitors in each product category. This approach ensures small Suppliers that may hold significant market share in their categories are not overlooked. We use our Marketing Research process to create competitive analysis matrices to evaluate our market position in relation to our competitors. These primarily include the CAM, WAM and MAM that indicate the policies, features and benefits we offer versus those offered by competitors. We review the matrices in CFMs, and make improvements through execution of CAPs, DAPs, CARs and OFIs. This review, and resulting actions, ensure we remain relevant in the marketplace. Additionally, we use public information such as quarterly/annual reports, Supplier information, hunting license holders and National Instant Criminal Background Checks to determine where we can best leverage our CCs and expand our market presence. •determine which CUSTOMERS, CUSTOMER groups, and market SEGMENTS to emphasize and pursue for business growth? We use our Marketing Research process to determine Customer, Customer groups and market segment growth opportunities. By reviewing

15
sales performance, information from annual reports, input from S/Ps and competitor activities, we identify opportunities in underserved markets or specific market segments. In 2011, market research identified a Supplier with smaller Customers than MW with more than 10 times our sales. Further research showed we didn’t stock enough inventory, nor order appropriate quantities, to support sales potential. An AP was created and sales increased 3233% in the following 12-months. 3.2b(1) HOW do you build and manage CUSTOMER relationships? HOW do you market, build and manage relationships with CUSTOMERS to: •acquire CUSTOMERS and build market share? We market, build and manage relationships with Customers through executing a fully integrated Marketing Plan. The Marketing Plan outlines the strategies, methods, tools and budget we will use to market to and communicate with Customers. Our market segment, along with each Customer group, is addressed independently with specific, targeted marketing efforts. Customer relationships are built by understanding our CKRs, and then meeting or exceeding them. Relationships are further built by understanding individual characteristics of Customers and targeting our marketing communications to ensure each Customer and segment gets the information most relevant to them. Specifically, CRM is a key process in the MK Department that manages Customer life cycle, Customer behavior, Customer lists, Customer selection for promotions, and marketing research. The results of these processes, which drive Customer acquisition and retention, are measures on the MK Scorecard and are reviewed in MRRs as well as daily operations. To acquire Customers through relationships, our Customer List Management process ensures we select pre-qualified prospective Customers, match them with our current Customers, purge duplicates and incorporate them into our Promotions process. Prospective Customers are obtained from industry-specific email lists, state hunting license lists, Facebook sweepstakes, Customer referrals and other sources where they have expressed an interest in the outdoor sports market. We build market share by effectively incenting Customers to try MW through marketing campaigns aimed at prospective Customers. We review effectiveness in MRRs and take action through CAPs, DAPs, CARs and OFIs. •manage relationships with CUSTOMERS to manage and enhance your brand image? We use many approaches to market and build relationships with Customers all centered on our CVP, CKRs, and V&C as outlined in our Marketing Plan. We use our Founder and CEO, Larry Potterfield (Larry), as the face and voice of MW. He serves as our Company spokesperson and is the real life actualization of our Values. He is featured in TV vignettes and commercials, videos, flyers, social media postings and press releases. This personification of our Values reinforces our brand image and helps Customers ‘connect’ with MW allowing us to build strong relationships with them. In addition, MW is the main benefactor of the MidwayUSA Foundation. Our owners provide 50% of their pre-tax profit to the foundation, which provides funding through endowments to preserve and perpetuate the shooting sports industry. This industry benevolence along with our unwavering support of the NRA and 2nd Amendment helps Customers feel a personal connection and alignment between MW and their beliefs. We also use a robust CRM process and have a dedicated manager
whose sole focus is to ensure Customer acquisition, retention and accurate, effective targeted marketing. The results of this process are reviewed in MRRs. •retain CUSTOMERS, meet their requirements, and exceed their expectations in each stage of the CUSTOMER life cycle? Our CRM process is designed to acquire and retain Customers. Each Customer group is based on life cycle. We manage Customers throughout their entire life cycle from acquisition until they are inactive for 3 years. Each phase of the Customer life cycle is treated independently, and has a series of marketing campaigns and communications designed to develop the relationship between Customers and MW. We use activity based communications and incentives for first time visitors to our website, specialized welcome communications and incentives for first time buyers, specialized communications and incentives for Customers likely to move from Active to Inactive and “Win-Back” communications and incentives for Customers who are inactive. We have a SHKR Customer acquisition & retention, results are reviewed in MRRs and necessary action is taken immediately or integrated into the PIS. •increase their ENGAGEMENT with you? We increase engagement with Customers by delivering targeted, relevant promotions and information to them through our vast array of marketing tools. Our CRM process ensures Customers only get communications that are relevant to them. By providing relevant content, we show Customers we understand who they are and what they want, which increases their engagement with us. We also increase Customer engagement through our Social Marketing process that uses a combination of posting techniques including posts directly from Larry, typically formed as a question so our Facebook friends are compelled to comment. In addition, we share highly engaging content from industry S/Ps. We measure and report Customer engagement on the MK scorecard, which is reviewed in the MRRs; action is taken immediately or input into the PIS. We proactively seek Customer engagement through soliciting product reviews from Customers who place orders. Additionally, we personalize our business by using Larry as the face and voice of MW, enabling Customers to engage with him at tradeshows and industry events. We are the industry leader in supporting causes important to Customers and the originator of many programs designed to support and sustain our industry. For example, we created the Friends of the NRA program, the NRA Round-Up program, the Scholastic Shooting Trust and the MidwayUSA Foundation (1.2c2). HOW do you leverage social media to manage and enhance your brand image and to enhance CUSTOMER ENGAGEMENT and relationships with your organization as appropriate? We use our Social Marketing process to enhance Customer engagement by direct posts of Larry participating in industry activities, sharing industry news from our Partners, and congratulating Suppliers, and even competitors, on accomplishments. We publish a series of industry short stories authored by Larry, which are shared through social media. We allow Customers to express themselves on our social sites. We use social media to engage Customers through communicating our role model support of the shooting sports industry and the causes our Customers support. Facebook engagement is measured through the number of Facebook likes, shares, reposts and comments we receive. These results are reviewed in MRRs and CFMs (7.2-3).

16
3.2b(2) HOW do you manage CUSTOMER complaints? We manage Customer complaints via our Incident Creation & Resolution and VOC processes. Input from Customers gathered via phone, email or chat in our CS area is captured as an incident. Relevant incidents are combined with feedback gathered through CSS, which is aggregated and aligned with CKRs during execution of the VOC. All negative feedback is read and classified weekly. The information is then reviewed in CFMs, Sales & MK Team meetings and, to ensure integration, by CS, MK, ME and LO DLTs in weekly meetings. Items classified as actionable are assigned to an individual for resolution, which, if possible, occurs immediately. If the issue is too complicated for resolution by an individual, it is documented in the PIS for prioritization. Complaints requiring follow up with Customers are designated as “actionable” through the VOC. CSRs follow up on actionable incidents until resolution. Resolution rate for actionable complaints captured through VOC is reviewed in MRRs. In 2015, through a DAP, we improved integration between CS and MK by including complaints captured as incidents as an input in our VOC. HOW do you resolve complaints promptly and EFFECTIVELY? Our Incident Creation & Resolution and VOC processes ensure prompt and effective complaint resolution. Actionable incidents are monitored by CS supervisors to ensure resolution in accordance with timeframe goals. CSRs have individual performance measures related to the time their incidents remain open and the effectiveness of their service. Weekly reporting via the VOC identifies complaints requiring action that must be resolved within a set timeframe. Complaints addressed through our PIS require goals and a control phase, during which results are monitored for effectiveness and sustainability. In 2014, our VOC alerted us to an issue being discussed on our Facebook page related to high shipping charges on certain small sized products. Upon researching the issue, we discovered our system was not allowing these products to ship in the smallest shipping package possible. We created a CAR, fixed the issue and thanked the Customers on Facebook for bringing it to our attention. HOW does your management of CUSTOMER complaints enable you to recover your CUSTOMERS’ confidence and enhance their satisfaction and ENGAGEMENT and avoid similar complaints in the future? Our management of Customer complaints through our Incident Creation & Resolution and VOC processes enables us to recover Customer confidence, and enhance Customer satisfaction and engagement, through prompt, effective follow up by CSRs and by enabling us to take action through CAPs, DAPs, CARs and OFIs. Significant improvements are communicated to Customers through our key communication mechanisms, and smaller improvements are communicated to select groups or individual Customers when appropriate. Review of Customer complaints through the VOC allows for identification of patterns. To ensure we don’t receive similar complaints in the future, issues that cannot be immediately resolved are captured as CARs in our PIS, which requires the identification and resolution of the root cause of a complaint. We use this information to improve our processes through the WPMP. Category 4: 4.1a(1) HOW do you use data and information to track daily operations and overall organizational PERFORMANCE? We use integrated information aligned
with achieving our OGs and SKRs to track daily operations and overall performance. We have real-time data available in our systems and on the intranet to guide decision making in daily operations. For example, the Company Dashboard, Today’s Business report and Mission Control dashboard are used daily for decision making. Sales and receiving data from the Company Dashboard are used to adjust the timing of daily and weekly email marketing promotions. The invoice velocity from the Today’s Business report is used to develop hourly/daily projections as input to our Workforce Management process in LO to allocate resources. The Company Scorecard tracks performance to our SKRs and Department Scorecards track process performance. During the SPMs, SLT reviews, defines and validates measures that roll up into performance results against SKRs and OGs. AP measures are defined as part of the SPP. We produce monthly financial reports and deploy via the intranet site. Scorecards and financial reports are reviewed through MRRs. Performance on achieving OGs and SKRs (including financial results) are reviewed with BOD quarterly. HOW do you • select, collect, align and integrate data and information to use in tracking daily operations and overall organizational PERFORMANCE? We select 1 question from our satisfaction surveys as the KM for each CKR, EKR and S/PKR. This is done because the perception of our KSs is critical to understanding performance. Our Shareholders don’t prefer to be surveyed, instead, they select the exact measures and goals to be achieved for their satisfaction. We select supporting process measures for KRs to provide leading indicators of process performance that impact meeting KRs. The above information is reported on the Company Scorecard. Within departments, process measures are selected based on alignment with area processes in each department’s WSM to gauge performance. New processes and work systems are built using the Process Design process (Fig. 6.1-2) which requires the identification of stakeholders and measures for integration and performance monitoring. Data and information is collected through systems and applications and is made available on the intranet and MW’s Integrated Data Analysis System (MIDAS) through reports, dashboards and scorecards. OG, SKR KMs, KPs and corresponding measures, SO, CAPs and DAPs are all aligned. We further deploy data and information through regular performance reviews, SPM/DBMs, DKS and SOTB meetings. Our measurement and analysis framework is defined in our Measurement and Analysis WP (AOS). •track progress on achieving STRATEGIC OBJECTIVES and ACTION PLANS? Progress on SOs through CAPs and DAPs is tracked through our SP Execution (7.4-10) measure at the company level and department level. SO goals and measures are reported and reviewed in SPM, SOTB and DKS. AP milestones are tracked through the PIS and reviewed at SPMs/DBMs. We use this information in SPMs/DBMs to monitor progress and redirect or allocate resources. What are your KEY organizational PERFORMANCE MEASURES, including KEY short- and longer-term financial MEASURES? Performance at the highest and most important level is measured by our CKMs. These are the principal factors that determine our success and are outlined in P.2c and in Fig. P.2-3. HOW frequently do you track these MEASURES? CKMs and supporting measures are tracked and reviewed both on a
17
real-time basis via dashboards and on a monthly basis via scorecards which are reviewed in the MRRs (2.1a3). In BOD meetings, shareholders review CKM results and discuss any changes to CKMs, OGs or SHKRs. In the SPM following the BOD meeting, SLT discusses any changes or additions from the BOD. All KMs are reviewed by SLT during the MRRs, throughout the year measures may be added, removed or modified as necessary. Long-term financial measures and planning metrics are reviewed annually in a SPM with subsequent review by the President and CEO. In 2014, MIDAS was implemented to consolidate KM data collection and automatically populate data in scorecards, dashboards and reports. This improvement reduced errors and improved integration and the accessibility of data. See 6.1b1. 4.1a(2) HOW do you select and EFFECTIVELY use comparative data and information? To achieve our Vision, our Goals & Comparative Data process calls for us to continuously seek appropriate comparative data on best practice companies to assess our performance. When selecting comparative data, we first determine if it is appropriate. Once appropriateness is determined, the best performing organization is selected to help us achieve benchmark leadership performance. As mentioned in P.2a3, obtaining comparative data can be challenging because our industry is small enough that we don’t have an overarching organization to gather and maintain data from members, so any comparison data we want must be obtained on our own. Because of this we rely heavily on our publicly traded competitors. HOW do you select and EFFECTIVELY use KEY comparative data and information to support operational decision making? In alignment with our Goals & Comparative Data process, comparative data is selected by SLT for relevancy and appropriateness to evaluate performance using the following criteria: 1) Benchmarks (best practice), world-class, Baldrige winners; may be outside the industry or competitors. Best practice competitors or industry organizations are selected as benchmarks for industry-driven measures, such as Gross Margin % (7.5-3), In Stock Rate (7.1-26), etc. When choosing between competitors on these measures, the best-performing, most appropriate competitor is selected. 2) Competitors 3) Industry 4) External 5) Internal. All KMs have at least one source of comparative data when feasible and appropriate. Information to support operational and strategic decision making is selected by department VPs who choose data that measures process performance and performance against OGs/SKRs. VPs meet annually with the President to review the goals and comparative data for the planning time horizon. During the SPP, comparative data is used for validation, for setting KM goals and to aid in determining SAs, SCs and opportunities for innovation. In 2011 and 2014 respectively, the HAM and MAM charts were added as analytical tools to obtain comparative and benchmark information for Employee benefits and marketing information in direct alignment with the KWS and OGs. Learning from the addition of each tool was applied to subsequent tools. In 2014, through a CAP, we added Competitive Price Intelligence software to monitor and benchmark selected competitors in direct alignment with our #1 CKR Competitive product pricing (2.1a3/3.1b2). 4.1a(3) HOW do you use VOICE-OF-THE-CUSTOMER and market data and information? Customers are our #1 KS
and CSAT is our #1 OG. Effective use of VOC and market data is critical to achieve Customer engagement, indicated by high levels of satisfaction, loyalty, retention and advocacy. Our VOC integrates and categorizes all VOC data and deploys it to the appropriate process performer for immediate resolution or entry into the PIS for improvements through SPP or WPMP (3.1a). We have CSS and process measures aligned with CKRs that are reviewed in SPMs and by the President/CEO. Review of this information generates improvements which are captured in the PIS. SLT reviews Category 3 elements in CFMs including current and potential Customer listening, CSAT, engagement and dissatisfaction. In 2013 using our VOC we learned of the dissatisfaction of our website sign-in and checkout capabilities, so we created the Website Sign-in & Checkout Re-engineering CAP. Since the completion of this CAP the satisfaction with checkout measure for CSAT has gone from 91.1% to 92.6%. HOW do you; • select and EFFECTIVELY use VOICE-OF-THE-CUSTOMER and market data and information (including aggregated data on complaints) to build a more CUSTOMER-focused culture and to support operational decision making? The VOC and market data we gather is aligned with CKRs to ensure effective use. We integrate the data and information through our PIS for improvement through our SPP and WPMP. Our Customer Engagement and VOC processes are defined and illustrated in our Customer Focus WP. In 2014, MK improved the VOC process to include weekly reporting to all departments (including complaint data) with feedback incorporated into the Sales & MK Team review. •Use data and information gathered through social media, as appropriate? See 1.1b1; 3.1a1. In 2012, we added social media methods as VOC input to enhance Customer engagement. Relevant data is captured on the SEO, PR and Social Media Dashboards and is reviewed on the MK Department Scorecard. Social media improvement and innovation ideas to increase engagement are captured and managed through the PIS. The Engagement Review component of the Social Marketing process provides detection and response mechanisms to any sudden changes in Customer sentiment. Changes to policies are implemented through the SPP, Customer Policy Management and WPMP. 4.1a(4) HOW do you ensure that your PERFORMANCE measurement system can respond to rapid or unexpected organizational or external changes? Our measurement and analysis framework is designed to be agile, which means we capture data in a way that allows it to be easily reconfigured. This ensures we are able to rapidly present data and information to meet changing organizational needs. The measurement and analysis framework is reviewed in our SPM/DBMs, MRRs and Knowledge Management meetings for improvement. Results of our measurement and analysis framework are evaluated in relation to meeting our OGs in our MRRs. As the BOD changes OGs or as SKRs change, we update our framework to maintain alignment with business needs. In 2014, we responded to changing organizational needs by creating dashboards to present daily results on measures that were previously only reviewed monthly. This allowed departments to monitor performance and respond quickly to changes in performance. 4.1b HOW do you review your organization’s PERFORMANCE and capabilities? Process and KR performance is reviewed in MRRs (2.1a3), SPMs/DBMs and
18
OFMs, in addition to daily monitoring through reports, dashboards and scorecards. Financial performance is reviewed through monthly financial reports and CKMs. Capabilities and performance needs are forecasted through the Planning Metrics model in the Budgeting and Workforce Planning processes. They are reviewed during the SPP, SPM/DBMs. Weekly SLT and DLT meetings communicate current events and discuss tactical issues impacting performance that may require immediate attention. Monthly, ME updates sales projections and the sales multiplier which drive inventory replenishment. LO and CS use this information to review and adjust staffing capacity; FS uses it to update weekly and monthly cash flow. For longer term capability planning, SWOT analyses are conducted to evaluate our ability to execute our SP, including achieve OGs and LTGs. Planned growth is aligned with LTGs. Current and needed CCs are reviewed in SPMs addressing organizational capabilities (5.1a4). See at 2.1a1(3rd ); 2.1b2; 3.1b2. HOW do you use your KEY organizational PERFORMANCE MEASURES, as well as comparative and CUSTOMER data, in these reviews? Results reviews include comparison to benchmarks, competitors, industry, external, internal and historical information as appropriate to ensure valid results, conclusions and goal setting. Customer data is input into performance reviews as KMs. KM results are indicated with a Green-Yellow-Red indicator system in alignment with performance level to aid in analysis (6.1b1). CAPs, DAPs, CARs and OFIs are input into the PIS to improve performance through the SPP and WPMP. What ANALYSES do you perform to support these reviews and to ensure that conclusions are valid? KMs in red for 3 consecutive months require a CAR (1.1b2/6.1b1), a root cause analysis, and an identified solution be entered into the PIS. Root cause analyses may include a review of comparative and historical data to ensure conclusions are valid. As appropriate, an AP is created to address identified performance or capability issues. CARs and APs requiring results monitoring are placed in control phase and are monitored in SPM/DBMs and OFMs until the measure is meeting requirements. HOW do your organization and its SENIOR LEADERS use these reviews to; •assess organizational success, competitive PERFORMANCE, financial health, and progress on achieving your STRATEGIC OBJECTIVES and ACTION PLANS? Organizational success is assessed in MRRs by reviewing performance against OGs and KMs, comparative data and benchmarks. Our ability to sustain success is dependent upon completing our SP and successful operation of our processes (2.2a5). The SP is designed to achieve, sustain or improve performance relative to OGs. We review progress on APs, SO and OGs in our SPM/DBMs. SP execution is measured and reviewed as described in 4.1a1 and BOD meetings (7.4-10). The SP and SP Execution measure are on our intranet site. •Respond rapidly to changing organizational needs and challenges in your operating environment, including any need for transformational change in organizational structure and WORK SYSTEMS? Regular reviews of reports, dashboards, scorecards and SWOTs in the SPM/DBMs and DKS meetings and the integration of this information with the SPP provides the agility needed to respond rapidly to changing organizational and transformational needs and
challenges. SOs and APs address these needs and challenges.In 2013, performance reviews showed an increase of web orders compared to phone orders and a decreasing trend of orders to call ratio. Using this information, we merged our eCommerce department with our Contact Center department making one new department called CS. This was done to drive collaboration between the two to better serve our Customers’ overall communication venues. HOW does your GOVERNANCE board review the organization’s PERFORMANCE and its progress on STRATEGIC OBJECTIVES and ACTION PLANS, if appropriate? The Organizational Governance document (Fig. P.1-5) requires BOD review and approval of SHKRs, Company Strategies, OGs and LTGs. All governance items are reviewed as a part of the BOD meeting agenda. Per the SPP (Fig. 2.1-1), the CEO and President review the Company Scorecard together monthly and quarterly with the BOD. The Company Scorecard includes performance of all CKMs including SP Execution (7.4-10). Each BOD meeting also includes a review of SOs and goals achieved through APs. BOD members and SLs receive and review monthly Company financial statements. Input from the BOD is referred to the SPP for integration. 4.1c(1) HOW do you share best practices in your organization? Sharing of best practices comes through collaboration between departments and areas during BCMs and SPMs/DBMs. The President and VPs of all departments are required to attend BCMs which review all aspects of our work systems. Best practice sharing occurs during these thorough discussions. This information is deployed to Department Managers in DBMs and DKS, where additional sharing occurs. Additionally, each CAP, DAP, CAR and OFI in the PIS has identified stakeholders who assist in the design of the solution. Best practices are shared from other departments as the solution is designed, implemented and documented in WIs. HOW do you identify organizational units or operations that are HIGH PERFORMING? HOW do you identify their best practices for sharing and implement them across the organization, as appropriate? CKM and DKMs include relevant best practices and comparative data, historical trends and goals to identify the level of performance. Each KM is owned by a department and results indicate the level of performance of the department. This information is reviewed in MRRs. High performance and best practices are also identified by auditors through the ISO Audit and Process Effectiveness Audit processes. Audit results and best practices are reviewed by SLT in the OFM for deployment across all departments. 4.1c(2) HOW do you project your organization’s future PERFORMANCE? HOW do you use findings from PERFORMANCE reviews and KEY comparative and competitive data in projecting future PERFORMANCE? We obtain analytical data from sources to use as input for future performance projections. Our sources include: market analysis (comparative and competitive), political climate monitoring, historical KM results, market trends in product categories, new product expansion plans, and tools including CAM, WAM, HAM and MAM. This information is fed into our SPP and Budgeting processes to project future performance (long-term horizon). The integration of the SPP and Budgeting process allows APs to be created to achieve future performance goals in alignment with projections (2.1a3).

19
HOW do you reconcile any differences between these PROJECTIONS of future PERFORMANCE and PERFORMANCE PROJECTIONS developed for your KEY ACTION PLANS (addressed in 2.2a[6])? APs are created to attain SOs, OGs and LTGs. Each AP is aligned with a SO and OG and has goals and measures to determine the result needed from implementation. If a review of projections reveals a gap between future performance projections and projections for APs, the AP scope is revisited and adjusted or a new AP, CAR or OFI is created to address the shortfall. 4.1c(3) HOW do you use findings from PERFORMANCE reviews (addressed in 4.1b) to develop priorities for continuous improvement and opportunities for INNOVATION? Each SPM starts with a review of our Company Scorecard (CKMs and supporting measures) and the Company SWOT. Each DBM has a review of the Department Scorecard (DKMs and supporting measures) and includes a quarterly Department SWOT. This allows SLT/DLT to identify performance issues that may impact our ability to attain SOs and OGs both now and in the future. This information is used to prioritize opportunities for continuous improvement and innovation which are captured as CAPs, DAPs, CARs, OFIs and BL items in the PIS. HOW do you DEPLOY these priorities and opportunities to work groups and functional-level operations? Company priorities are deployed in the SLT, DLT, SPMs, SOTB and DKS meetings. Department priorities are deployed in the DLT, DBMs, DKS, Department Musters and tactical meetings. Company and department priorities are captured in the PIS and are available to all Employees on the intranet. HOW do you DEPLOY these priorities and opportunities, when appropriate, to your suppliers, PARTNERS, and COLLABORATORS to ensure organizational ALIGNMENT? We conduct annual meetings with key S/Ps to deploy our priorities and opportunities and ensure organizational alignment. The meetings with key Suppliers also include a review of product selection, pricing, Marketing Plans, CAPs, programs and changes to the S/PA, as appropriate. Deployment also occurs through our S/PAs, email or phone calls, as appropriate. We communicate with key S/Ps frequently to share best practices and information on changing market and regulatory conditions. In 2009, to expand performance in the CKR Fast shipping & delivery, we worked with UPS, a key Partner, to extend trailer pickup times, allowing us to integrate key partner capabilities and extend our “In by-out by” same day shipping promise to 6 PM each day (7.1-16). 4.2a(1) HOW do you manage organizational knowledge? Each of our over 750 processes is documented in a WI on our intranet. Processes and WIs are reviewed, updated and trained for important changes on an annual basis or as changes occur (6.1b3). We maintain nearly all of our knowledge on our extremely robust intranet as listed in Fig. 4.2-1. We became ISO certified in 2008 and have re-certified every 3 years, to ensure a systematic, sustainable approach to documenting processes and other organizational knowledge. In 2014 through a DAP we improved our approach to our Company Glossary by transitioning it from a Word document to a searchable wiki format that also allowed for easy cross reference between terms. HOW do you; •collect and transfer WORKFORCE knowledge? Company/Department strategies, strategy one-
pagers, Department Work System Maps, WIs and WI sheets are on the intranet for Employee access and are used in training Employees. This information is reviewed to ensure alignment with current business needs and to collect changing workforce knowledge. This approach is a key element of our sustainability by preventing silos and is augmented by posting key documents on our Organizational DNA Walls in each building (Fig. 4.2-1).
Figure 4.2-1 Methods for Managing Organizational Knowledge (AOS) Method Knowledge Review
Cycle Key Documents MS, OGs, Culture Statement,
LTGs, Governance, Strategies, CCs, LS, Key Communities, LERC Report, SWOTs
Monthly/ Quarterly/ Annually
Strategic Plans Company and Department SPs Annually Marketing Plan Plan for acquiring & retaining
Customers, building market share and growing the business.
Annually
PIS APs, CARs, OFIs, BL items On-going MIDAS Results, KMs, scorecards,
dashboards, leaderboards, reports Daily/Weekly/Monthly
Work Instructions Process execution steps and information
Annually
Company Glossary Definitions of KMs and key business terms
Annually
System Narratives System-run process execution steps & information
Annually
Company Policies Policies to guide Employees, Suppliers and Customers
Annually
Organizational Charts Department reporting structure Annually Job Descriptions Process responsibilities, key
performance measures and specifications
Annually
Company Journal Historical key company milestones and events
Annually
Employee Center Employee and performance data On-going •Blend and correlate data from different sources to build new knowledge? We use our Data Gathering process to incorporate data from internal and external sources into our data warehouse where it can be blended together to facilitate correlation analyses to build new knowledge. This blended information is the basis of our scorecards, dashboards and reports. Many of our daily dashboards contain a blend of data from different sources. For example, in 2014, the CS dashboard was created based on changing business needs. It contains a combination of data from our CSS provider (BizRate), phone server database, web analytics provider (Coremetrics) and transactional database. Also, the SEO, PR and Social Media dashboard contains data from Facebook, SEO analytics provider (Conductor) and Coremetrics. •Transfer relevant knowledge from and to CUSTOMERS, suppliers, PARNTERS and COLLABORATORS? The transfer of relevant knowledge to Customers is accomplished via 30+ different email communication points, Facebook, Twitter, YouTube, Google +, web chat, phone calls, and TV vignettes and commercials, and from Customers via the VOC which collects, trends and distributes information to other departments for action on a weekly basis (3.1a1). The transfer of relevant knowledge is accomplished to/from Suppliers through our Supplier Relationship process which is designed to provide for the S/PKR Candid, two-way communication. It includes regular strategic meetings and outings with key Suppliers, S/PAs, Supplier Satisfaction surveys and Supplier Performance Evaluations which cover performance on key results. The transfer of relevant knowledge to/from key Partners is

20
accomplished through annual summit meetings where requirements and performance on key results are discussed with key members of MW and the Partner. In 2013, using Supplier feedback, we improved our Supplier Relationships process for key Suppliers by changing from providing information regarding their performance through a web portal site to inviting them on an annual basis to visit MW and discuss performance and long-term plans including financial and marketing plans. This change has resulted in developing stronger partnerships with our Suppliers as measured by our S/P Satisfaction survey. •Assemble and transfer relevant knowledge for use in your INNOVATION and strategic planning PROCESSES? See 2.1a3. Assembly and transfer of knowledge is an integral part of our SPP. Knowledge relevant to innovation and the SPP is collected from Employees through our PIS and is used in improving and innovating systems and processes through the execution of CAPs, DAPs, CARs, OFIs and BL items. Ideas in the PIS are categorized by the processes they impact. When a process is reviewed or audited, all related ideas are easily identified. We enhance this approach by systematically communicating our SPP, CSP and DSPs at all levels of the organization. Other methods for assembling and transferring relevant knowledge include Company/Department SWOTs, SKRs and Company/Department Strategies. 4.2a(2) HOW do you use your knowledge and resources to embed LEARNING in the way your organization operates? The use of knowledge is embedded within our MS and Culture Statement. These top-level documents set the direction. We hire for V&C. Tools such as WPs, CAPs, DAPs, CARs, OFIs, WIs, Process Review process, system narratives and MIDAS have learning embedded in the process steps. Organizational learning is the goal of knowledge management. By the creation, collection, storage and transfer of knowledge, the whole concept of knowledge management enables us to embed knowledge and learning into processes, to continuously improve practices and pursue the achievement of our goals as evident in MW’s growth and performance trends. 4.2b(1) HOW do you verify and ensure the quality of organizational data and information? When possible, to reduce human error and increase efficiency, we capture data automatically to verify and ensure quality. We maintain a Company Glossary containing definitions for all KMs and all KM reporting pulls from a single source (data warehouse) to ensure data consistency and accuracy. In 2015, we improved our Beta Testing & Release and Change Management processes to include improved steps for ensuring data integrity. HOW do you manage electronic and other data and information to ensure their accuracy and validity, integrity and reliability, and currency? We apply access levels and edit checks throughout applications as appropriate and conduct data hygiene reviews monthly through our Database Maintenance process. When a measure is developed, we analyze the data to validate the results. Results are compared to goals, benchmarks and historical information and we incorporate manual checks and reconciliation where appropriate. Our systems either automatically capture or generate data at the point of creation and therefore produce real-time data. Data is immediately relayed to other KWS for use in process execution. 4.2b(2) HOW do you ensure the security of sensitive or privileged data and information? We apply access levels to
data and information and automatically enforce Employees password rotation every 90 days. All Employees with high-level data access are required to sign a non-compete and confidentiality agreement prior to employment. We require all new Employees review and sign acknowledgment of our Network Security and Information Systems & Communication Equipment policies and we maintain a Confidential Information policy. We use secure socket layer to protect sensitive Customer information during transmission and receipt, and a third party provider, Elavon, to encrypt and store Customer’s credit card information. In 2014, we implemented an annual external IT systems audit to validate data security and integrity for financial reporting data. Findings from the audits and input from participating in local security groups are used to improve security processes. Due to our diligence in securing sensitive information, we have never experienced a data breach! HOW do you manage electronic and other data and information to ensure confidentiality and only appropriate access? HOW do you oversee the cybersecurity of your information systems? “Keep it secure” is an IS strategy. Security is embedded into applicable IS processes. Examples include: Database Security, Active Directory Management, Application Management, Workstation Management, Email Management, Server Anti-virus Management and Compliance Management processes. Additionally, we have an annual external IT audit to help ensure data security and integrity. Findings from the audit are used to improve relevant processes. MW networks are protected with intrusion detection systems and firewalls. Systems logs on these devices ensures tracing in the event of a cybersecurity breach. MW’s web presence is served by segmented network security zones. Payment Card Industry (PCI) compliance is maintained through an annual independent audit assessment. Virus and malware solutions are deployed on all workstations. We measure Cyber Security Preparedness (7.1-23). 4.2b(3) HOW do you ensure the availability of organizational data and information? Information is available through the Company intranet site and Midas in real-time, as appropriate, and accessed by role-based security levels. Availability is monitored and any key system with performance degradation will alert the appropriate team for resolution. We also measure data availability on the appropriate Department Scorecard which is reviewed in MRRs. HOW do you make needed data and information available in a user-friendly format and timely manner to your WORKFORCE, suppliers, PARTNERS, COLLABORATORS, and CUSTOMERS, as appropriate? We ensure data and information availability through: Workforce: Intranet, MIDAS (scorecards, dashboards and reports), real-time software applications and standard meetings (SOTB, DKS, SPM, DBM, BCMs). Employees can submit an OFI through the PIS requesting modifications to existing data and information. Suppliers/Partners: See 4.2a1. Annual strategic meetings and outings, Supplier Performance Evaluations and S/PAs. Customers: See 4.2a1. MW’s website and CS department provide real time information on orders and Customer account information. We provide user-friendly web features such as wish lists, product arrival notifications, email a product to a friend, and product due dates. Feedback collected from Customers through the VOC is used to improve user-

21
friendliness of the data and information (3.1a1). We provide timely transactional and promotional emails to keep Customers informed and ensure user-friendliness through our Customer Communications process which includes input from the VOC. The effectiveness of above approaches is verified through the MRRs, where SLT reviews survey results for Customers (7.2-1a/b), Employees (7.3-10a/b) and S/Ps (7.1-29a/b). SLT reviews data accessibility and alignment in Knowledge Management meetings ensuring appropriate stakeholders are considered. 4.2b(4) HOW do you ensure that hardware and software are reliable, secure and user-friendly? Hardware and software reliability, security and user-friendliness starts with software and hardware acquisition strategies in terms of brand and Supplier, product, service and support and are carried out through our Third Party Software Selection, Shared Service Hosting & Support and IS Procurement processes. Maintenance agreements, contracts and updates are maintained on key items. Software and hardware are regularly updated on workstations and servers. We replace computers and other hardware routinely to enhance their security and reliability. Systems are monitored for stability and performance throughout the day and during deployments. Key internally developed software (e.g. credit card processing) undergoes an outside audit to ensure it is secure for our stakeholders. We use Microsoft user interface standards to ensure user friendliness as well as involving subject matter experts who are end users in application development for process design and improvement. 4.2b(5) In the event of an emergency, HOW do you ensure that hardware and software systems and data and information continue to be secure and available to EFFECTIVELY serve CUSTOMERS and business needs? Core systems are monitored 24/7 and IS is automatically notified of any unusual events which can be addressed remotely. Our Integrated Contingency Plan (ICP) (6.2c2) contains emergency response procedures which include the following: Infrastructure diagrams for network servers and overall architectural design, daily data backups, offsite storage, nightly test restores of core database, supply of backup equipment for KPs and uninterruptible power source coverage for all computer systems. Emergency preparedness is reviewed for improvements by SLT in OFMs and through conducting annual ICP tabletop exercise. Category 5: 5.1a(1) HOW do you assess your WORKFORCE CAPABILITY and CAPACITY needs? Our Workforce Planning process is integrated with our SPP and Budgeting process. The process starts with an update of the Planning Metrics model which captures sales information for our long-term planning horizon. These metrics translate into direct and indirect staffing needs. SLT reviews current and projected process performance and requirements, OGs, SOs, SWOT analyses and SPs to determine projected staffing needs. These needs are captured in the Department Org Labor Budget models. Our Non-exempt Staffing model is used to project hiring needs for hourly Employees in LO and CS. Monthly, ME provides updated sales projections which allows LO and CS to understand direct labor needs. LO and CS meet with HR on a quarterly basis to review the model to validate and/or adjust the hiring plan for the next quarter (2.2a3/4.1b). In 2013, we improved our internship program to align with the following
years’ resource needs so we can move the intern into a planned position, reducing our time-to-fill on planned new positions. HOW do you assess the skills, competencies, certifications, and staffing levels you need? Through the SPP, Performance Management, and Leadership Development processes, and a constrained resource evaluation we estimate resource requirements needed for process and AP execution, then prioritize and schedule the APs based on the resource limitations. This information, as well as certification, education, skills inventory data and performance information, is then used to create our recruiting plan to support the Company needs. Direct labor staffing needs are based on our Planning Metrics model as described above. The recruiting plan is then reviewed in our non-exempt recruitment planning meetings where recruiting needs are adjusted to current business projections. 5.1a(2) HOW do you recruit, hire, place and retain new WORKFORCE members? We have Company Strategies to, “Recruit, develop, & retain high-performing Employees who share our Values & align with our Culture” as well as, “Hire new Employees who want to live in the Midwest; & give priority to promoting from within”. Our Recruiting & Hiring process includes processes such as Career Fairs, Student Development program, Employee Referral program and an Internship program, as well as leveraging partnerships with local colleges and using social media to attract candidates. During the interview process we evaluate candidates’ job skills and V&C alignment. Candidates for salaried positions meet with our CDT, where they are evaluated for fit into V&C. Our Onboarding & Training process ensures effective transition into new roles. We retain Employees through our ES&E process, where we continually listen, learn and improve in order to meet the EKRs. In 2012 through EFGs, Employees made us aware of a gap in our Recruiting & Hiring process. Employees working on their degree were interested in how they could start a career at MW. Using this feedback, we created the Student Development Program which provides currently enrolled students a detailed tour of our facility to learn about other opportunities at MW. After the tour, Employees eat lunch with the President and ask questions regarding careers at MW. Since the inception of this process, through 2014, we have promoted 26% of the participating Employees into a salaried position. HOW do you ensure that your WORKFORCE represents the diverse ideas, cultures, and thinking of your hiring and CUSTOMER community? It is our strategy to “Recruit, develop and retain high-performing Employees who share our Values and align with our Culture”. We place a priority on hiring Employees with a passion for our industry to ensure our Customer community is represented. Our strategy to “Hire new Employees who want to live in the Midwest…” was developed because results indicate higher retention rates for Employees with a connection to the Midwest. Recruiting mechanisms are varied and attract candidates from a variety of industries which ensures diversity within our workforce. We have professional Employees that have come from careers across the country with backgrounds in the financial, automotive, military and educational fields. We leverage the diverse ideas of our workforce by encouraging all Employees to input OFIs into our PIS for integration with our SPP and WPMP. We also include a Q&A session in all of our deployment meetings.

22
5.1a(3) HOW do you organize and manage your WORKFORCE? How do you organize and manage your WORKFORCE to; •Accomplish your organization's work? Our work systems are designed to support our Mission and achieve our OGs. We have 4 KWS: ME, MK, CS and LO and 4 support work systems: FS, HR, IS and QMS. We have 8 departments and 1 division. 4 departments and 1 division (ME, MK, CS, LO, Military Surplus) focus on executing our KWS and 4 departments (FS, HR, IS, QMS) focus on executing our support work systems. The 8 departments are led by VPs and the 1 division is led by a Senior Manager, all reporting to the President. All of the processes are designed to deliver SKRs. •Capitalize on your organization's CORE COMPETENCIES? We have a strategy to maintain a CC in each of our KWS, each CC is aligned with one of our OGs. Our MS and Company Strategies guide the design of our work systems to leverage our CCs. Review of our process measures reinforce, sustain and improve our CCs. CCs are posted on Organizational DNA Walls and the intranet. •Reinforce a CUSTOMER and business focus and •exceed PERFORMANCE expectations? Our #1 OG is CSAT. Our Company Scorecard balances all SKRs, with work systems designed to achieve and exceed our OGs. Scorecard performance is monitored and reviewed at each level of the organization through MRRs and individual performance reviews. Scorecards and reviews are available to all Employees via the intranet. Our Performance Management process aligns individual goals with OGs. Our Corrective Action/Preventive Action procedure requires any KM underperforming for 3 consecutive months to have a CAR incorporated into our PIS for improvement (CAR1 for CKM and CAR2 for DKM). 5.1a(4) HOW do you prepare your WORKFORCE for changing CAPABILITY and CAPACITY needs? The integration of SPP, Budgeting and Workforce Planning processes prepares our workforce for changing capability and capacity needs. Any AP requiring a new capability would address the need for additional staff or training through the AP. An annual review of job descriptions includes a review of the knowledge, skills and abilities needed for each position. As needs change, job descriptions are updated, current staff is trained and new hires are selected based on the new capability needs. We also communicate the current and future CSPs/DSPs and results at DKS, DBM and LO Department meetings (2.2a2). To adjust for changing hourly Employee capacity needs, we reduce work schedules (slow time) to align with our strategy to avoid layoffs and utilize overtime and part-time Employees to meet short-term increases in staffing needs. We communicate overtime and slow time requirements as far in advance as possible. We manage our Staffing Strength levels (7.3-1) to understand our workforce capacity and Slow Time/Overtime Hours Worked (7.3-2) to ensure we meet the EKR Appropriate amount of work & time away from work. How do you •Manage your WORKFORCE, its needs and your organization’s needs to ensure continuity, prevent WORKFORCE reductions and minimize the impact of such reductions, if they become necessary? Our organizational structure is designed to meet our SOs in alignment with the SP. Through monthly review of our actual and projected sales, we have the agility to adjust our staffing accordingly. Our Workforce Focus meeting and non-exempt
recruitment planning meeting allows us to address current business impacts while ensuring the ability to meet our SKRs. This agility allows us to adjust our workforce and recruiting as business demands increase or decrease. With the business surge in 2013 these processes allowed us to quickly identify hiring needs to ensure a continued focus on CSAT (CKM) (7.2-1a). Subsequently, for times of lower than projected business like in 2014, our Non-exempt Staffing models have turnover built into them so we can allow natural attrition to lower direct labor cost. We also utilize slow time to reduce direct labor cost. These things in conjunction allow us to implement the strategy to avoid layoffs. In fact, MW has never experienced a layoff in its 38 year existence. This allowed agility to be employed in 2014 and all new positions were cancelled to control our operating expenses. •Prepare for and manage periods of WORKFORCE growth? We prepare for, and manage, periods of workforce growth through the integration of our SPP, Budgeting, Workforce Planning and Recruiting & Hiring processes. We plan for current and future business growth, as evidenced by our results of meeting our SKR of double-digit growth (7.5-1). Projected and actual business results are deployed to the entire organization through SOTB, DKS, DBMs and our intranet. All Employees can access our ‘Company Results’ intranet page, showing real-time business results. We maintain a Planning Metrics model as input for calculating direct labor needs which feeds into our Budgeting, Workforce Planning and Recruiting & Hiring processes. In December 2012, due to a rapid increase in business, we declared a state of emergency, suspending our 2013 SP and implementing a CAP “Operation Double Action”, consisting of 72 action items to improve and sustain service to our Customers under the new market conditions. We created an Open Interview process which allowed us to interview over 100 applicants in 1 day. We held 2 open interview days and hired 58 LO and CS Employees. •Prepare your WORKFORCE for changes in organizational structure and WORK SYSTEMS, when needed? When a change in organizational structure or work system is identified through our SPP and Budgeting processes, we use our Communication Plan Management process to notify Employees of the upcoming changes. APs are created including milestones for process training, documentation updates and the transition of responsibilities to ensure Employees are fully prepared. In 2013 we decided to re-create the QMS Department and move the Business Intelligence area from IS to QMS to facilitate integration. Employees impacted by this transition were notified in advance and an AP was created to outline the milestones for a smooth transition. This transition has shown to be effective through QMS’s 2015 ES&E score of 89%. 5.1b(1) HOW do you ensure workplace health, security, and accessibility for the WORKFORCE? We use our Safety processes and measures (7.3a2), including a full-time Facilities & Safety Manager, regulatory compliance and a continual focus on meeting our EKR Safe, comfortable work environment through our ES&E process to ensure workforce health, security and accessibility. These processes include routine fire and tornado drills, as well as business continuity planning. Access and security of our facilities is ensured by requiring ID badge swipes for all entry doors, with additional accessibilty requirements and improvemtents being incorporated into the

23
design, plan and build and/or modifications of our facilities in strategic planning. In 2010 we installed our new Nitro Express shipping system which provided us many productivity, accessibility and technological improvements in our LO Department and has been a major factor in our great safety record over the last 5 years. What are your PERFORMANCE MEASURES and improvement GOALS for your workplace environmental factors? Our EKR Safe, comfortable work environment is assessed through the ES&E survey. In the first quarter 2015 survey, we received a score of 88% against a goal of 86% (7.3-5). We also measure Experience Modification Rate (7.3-7), with a goal of 0.90 for 2015 and Lost Time (7.3-6a) as well as other safety indicators that are reviewed in MRRs. Results are available in 7.3a2 and AOS. On April 24, 2015 we celebrated our 4-year anniversary since our last lost time injury. For your different workplace environments, what significant differences are there in these factors and their PERFORMANCE MEASURES or targets? The primary difference in these factors is the standing, lifting and ergonomics between our warehouse and office environments. During the design of workplace environments we consider ergonomics and task specific needs. In 2014, our eCommerce and CS Departments were combined and relocated to one existing facility. A new office environment was designed specifically to support the new Web Production Area of CS, taking into consideration ergonomics for comfort and increased productivity. LO’s Nitro Express shipping system has taken multiple factors of health, security, accessibility and productivity into account when the work area was designed. Although we have differences in our office and warehouse environments, our performance measures and goals do not differ. We demonstrate benchmark leadership results in all safety measures in both workplace environments (7.3-5, 7.3-6a, 7.3-6b, 7.3-7). (Segmentation AOS (SAOS)) 5.1b(2) HOW do you support your WORKFORCE via services, benefits, and policies? Our HR strategy to “Be a leader in the area of compensation & benefits, well above average” drives the improvement and implementation of services, benefits and policies to support our workforce. Our ES&E process provides feedback from Employees on their EKR Competitive benefits to continually listen, learn and improve. Benefits, services and policies are reviewed annually through the HAM process, allowing us to compare our offering to local, industry and Baldrige organizations. Our Policy Management process reviews all policies annually, with additional feedback from the ES&E process, CDT and PIS.Since 2011, feedback from the ES&E process has driven over 65 improvements. We deploy policies, services and benefits using new hire orientations, benefit enrollment meetings, emails, newsletter, break room TVs and the intranet. HOW do you tailor these to the needs of a diverse WORKFORCE and different WORKFORCE groups and SEGMENTS? What KEY benefits do you offer your WORKFORCE? In alignment with our compensation and benefits strategy, we offer a broad range of benefits, providing flexibility to the needs of our workforce. Benefits listed in Fig. 5.1-1 are provided to all full-time Employees and to part-time Employees as indicated.
5.2a(1) HOW do you foster an organizational culture that is characterized by open communication, HIGH PERFORMANCE, and an engaged WORKFORCE? Open communication, high performance and an engaged workforce is fostered through our LS (Fig. 1.1-1), including, DKS, open-door culture, 360 Reviews, Department Musters, ES&E surveys, EFGs and performance evaluations. We maintain an Employee Communication Matrix that documents the information we need to communicate to Employees, the venues that are used and who is responsible for ensuring the communication. Additional opportunities for our exempt Employees include LDC, BCMs, SOTB, DBMs, mentoring, structured carpools, and scorecard, leaderboard and dashboard reviews. As part of our Leadership Development process, 36% of our salaried staff have served as MQA examiners which reinforces the Baldrige Excellence framework and a focus on performance excellence. This culture is sustained by hiring in alignment with our V&C.
Figure 5.1-1 Comprehensive Benefit List (Key Benefit) (*Available to part-time Employees) Medical Insurance Paid Parental Leave Dental Insurance Paid Floating Holidays Life/AD&D Insurance Blood Drives* Vision Insurance Anniversary Cookouts* Supplemental Life Insurance Service Awards* Accident Insurance Anniversary Gifts* Critical Illness Insurance Popcorn Fridays* Short-term Disability Sporting Clays * Long-term Disability Holiday Party* Flex Spending Account Fresh Flowers* Health Savings Account Free Coffee & Fruit* 401(K)* Tuition Reimbursement* Profit Sharing* Range Memberships* Paid Vacation Leave Smoking Cessation* Paid Family Sick Leave Hunting and Fishing Club Paid Holidays Employee Appreciation Week*
HOW do you ensure that your organizational culture benefits from the diverse ideas, cultures, and thinking of your WORKFORCE? Our workforce comes from a variety of backgrounds, educations and industries. To ensure our Culture benefits from this diversity, we have multiple processes and venues in place for Employees to provide input into how we run the business, including SOTB, DKS, SPM/DBM, MRRs, ES&E surveys, EFGs, PIS, LS and our open-door culture (2.1a2). HOW do you EMPOWER your WORKFORCE? One of our Company Strategies is to balance the needs of all our stakeholders, one of our EKRs is Input into decision making, and one of our Values is “Accountability”. We use knowledge sharing settings such as SOTB, DKS, SPM/DBM and OFM to provide Employees with information to understand the direction of the business, which gives them the tools they need to provide valuable input and make better decisions. Our work systems and processes are designed to empower Employees to accomplish the organization’s work and meet our SKRs. Our Organizational Governance document, job descriptions, scorecards and performance reviews define authority, accountability and measurement against goals. Additionally, all Employees are encouraged to submit ideas into the PIS for integration with the SPP and WPMP. 5.2a(2) HOW do you determine the KEY drivers of WORKFORCE ENGAGEMENT? We determine the drivers of Employee (workforce) engagement through our ES&E

24
process. The ES&E survey asks Employees to identify their EKRs, prioritize and weight the importance of each, and assess how we are doing at meeting those requirements. As part of EFGs and the ES&E survey, action items to improve engagement are recommended in Workforce Focus meetings, where SLT considers the proposals as a SPP input. Any changes to the EKRs are incorporated into the OGs as a part of the SPP. HOW do you determine these drivers for different WORKFORCE groups and SEGMENTS? The strategy for our ES&E process is to continually listen, learn and improve. Our ES&E survey allows us to look at results for the entire organization and by different workforce groups, departments and segments. Results are deployed and integrated with improvement efforts applicable to each department. A DAP was created to address the results of the Q1 2014 ES&E survey, which showed benefit-eligible Employees were not satisfied with our retirement benefits. The 2014/15 DAP increased our 401(k) contribution, reduced the eligibility period to enroll, and transitioned the 401(k) to our Employee Center. Results from subsequent survey cycles have shown significant improvement in our EKR Competitive benefits. 5.2a(3) HOW do you assess WORKFORCE ENGAGEMENT? We assess engagement through our ES&E process. Analysis of survey results allows us to identify gaps in meeting our EKRs and recommend actions (APs, OFIs, CARs) to improve results during Workforce Focus meetings. In 2011, our President started moderating all 16 EFGs annually, hearing from 144 different Employees on how we can improve ES&E. This has been extremely helpful in allowing us to more effectively respond to EKR OFIs and to build trust and transparency. We further improved our process in 2014 by redesigning our ES&E survey to more accurately identify the factors that affect engagement. This approach was shared with a group of Employees to gain stakeholder input and their feedback was used to refine the survey for official deployment. What formal and informal assessment methods and MEASURES do you use to determine WORKFORCE ENGAGEMENT, including satisfaction? Our formal method for assessing satisfaction and engagement is our ES&E survey (7.3-10a). Informal methods include Employee Productivity (7.3-4), Innovation Rate (7.1-21), ES&E survey Participation Rate (7.3-11), 360 reviews (AOS) and Total Company NRA Participation (7.3-12). HOW do these methods and MEASURES differ across WORKFORCE groups and SEGMENTS? Methods for determining ES&E do not differ by workforce groups and segments; however, results are segmented for analysis. With the improvements we made to the ES&E survey in 2014, each Employee identifies their most important EKRs and indicates how we are doing in meeting their KRs. To obtain actionable input, EFGs are then conducted based on department segmentation and focus is put on that segment’s 3 EKRs with the greatest opportunities for improvement. HOW do you also use other INDICATORS, such as WORKFORCE retention, absenteeism, grievances, safety, and PRODUCTIVITY, to assess and improve WORKFORCE ENGAGEMENT? We review the results for our indicators of workforce engagement through Workforce Focus meetings and SPM/DBMs. These measures include: Voluntary Turnover (7.3-13), R&R Utilization, Employee
Rewards Index (7.3-8), EKR scores, Recordable Case Rate, Lost Time (7.3-6a), Number of Days Away from Work and Restricted Days (7.3-6b). Performance for measures not meeting goal are identified and action is taken through our ISO Corrective Action/Preventive Action procedure (6.1b1). 5.2a(4) HOW does your WORKFORCE PERFORMANCE management system support HIGH PERFORMANCE and WORKFORCE ENGAGEMENT? We use the processes related to the “Measure & Analyze Results” and “Learn & Improve" portions of our LS as our overall system for performance management. In addition to the above we use our “Communicate/Deploy” portion to support high performance and workforce engagement while aligning with our V&C. Using our Performance Management process we provide candid performance feedback aligned with our V&C to empower Employees to strive for higher performance. We also provide resources for Employees to use in their development such as: resource library, WPs, tuition reimbursement, Student Development Program and the Leadership Development process. As part of the CAP “Operation Grand Slam” in 2013, we improved our Performance Management process and increased the frequency from annually to quarterly for hourly Employees to increase their engagement.
HOW does it consider WORKFORCE compensation, reward, recognition, and incentive practices? Our compensation and benefit strategy is, “To be a leader in the area of compensation & benefits; well above the average.” To meet our #1 EKR Competitive salary, we have a robust Compensation & Benchmarking Review process that ensures we pay in alignment with our strategy by benchmarking the pay range of each position and rewarding high performance. We have a best-practice Profit Sharing process incentivizing high performance, innovation and alignment with our V&C. It allows us to share profits with Employees based on organizational performance. We cater lunch to our LO staff when mandatory overtime is needed to serve our Customers during higher than projected sales or holiday “heal-up” periods (we close our facility for all major holidays). We provide managers with tools to R&R Employees for outstanding performance through our Employee R&R process (1.1b1). HOW does it reinforce •INTELLIGENT RISK taking to achieve INNOVATION, •a CUSTOMER and business focus, and •achievement of your ACTION PLANS? Through our LS, Employees receive the information and tools needed to create, analyze and propose ideas for intelligent risks to achieve

25
innovation. By aligning APs, OFIs, CARs and BL items in our PIS with our SKRs and OGs, we reinforce a Customer and business focus on all actions taken for improving and innovating processes and systems. Achievement of APs is reinforced through measurement of SP Execution and meeting AP milestones (2.2a5). Additional reinforcement comes through the integration of SPM/DBM, BCMs, MRRs and SPP. 5.2b(1) HOW does your LEARNING and development system support the organization’s needs and the personal development of your WORKFORCE members, managers, and leaders? The LS includes processes designed to meet the needs of the organization and the personal development needs of our workforce. We provide Employee development through our Performance Management processes including 360 reviews (for salaried Employees), performance reviews, individual development plans and process training. Our Leadership Development and Succession Planning processes identify future leaders of the organization and provide those Employees with additional development opportunities such as mentoring, MQA examiner training, SPM invitations, etc. (5.2b3/1.1a3). By using these development tools we prepare Employees for more responsibility to support long-term organizational growth.
In 2014/15 as a part of our CAP “Apply for and Receive Baldrige Award”, LDCs participated in writing and scoring our award application. This same group is leading all meetings for our MQA site visit. HOW does the system •Address your organization’s CORE COMPETENCIES, STRATEGIC CHALLENGES, and achievement of short and long-term ACTION PLANS? As part of our LS, our SPP is designed to develop APs that address a SC, leverage a SA or CC, pursue a strategic opportunity, or create a CC, all to achieve SOs and OGs. BCMs facilitate the integration, development, deployment and execution of our SP. Each department has a priority board within the PIS to organize their current and upcoming APs, OFIs and CARs to achieve our goals (2.1b2). •Support organizational PERFORMANCE improvement, organizational change, and INNOVATION? As part of our LS, the PIS, SPP and WPMP support organizational performance improvement, change and innovation through results reviews and creation of APs, OFIs and CARs. A root cause analysis determines the appropriate action to improve processes and systematically monitor results to determine the effectiveness of improvements. •Support ethics and ethical business practices, and •Improve CUSTOMER focus? Supporting our Values and aligning with our Culture is a requirement for working at MW. Our Recruiting & Hiring process evaluates candidates for organizational fit. Our performance review process and 360 reviews are aligned with our V&C to continually reinforce the importance of this alignment. In addition, ethics and transparency are part of our Culture Statement, with all LERC results reviewed at our Leadership and BOD meetings. •Ensure the transfer of knowledge from departing or retiring WORKFORCE members? We maintain work system maps and WIs for all processes in the organization (6.1a2/6.1b3). This structure, along with our Job Descriptions, Training and Exit Interview processes allows us to transfer the knowledge between departing or retiring Employees. In 2013, while planning for the retirement of a long-term manager, we improved our Retirement process, to allow select salaried
positions to transition to a part-time role to aid in the transfer of knowledge before full retirement. •Ensure the reinforcement of new knowledge and skills on the job? Our LS reinforces new knowledge and skills through performance reviews which include a review of Employee performance against Values, Culture and goals, and creates an individual development plan. This also integrates with Department Training Plans, where skills and competencies needed to achieve SCs, accomplish APs, or implement process improvements can be identified through the integration of SPP, Workforce Planning and Budgeting processes. 5.2b(2) HOW do you evaluate the EFFECTIVENESS and efficiency of your LEARNING and development system? We evaluate the effectiveness and efficiency of our LS through our ES&E process and MRRs (2.1a3). The effectiveness of these processes is evidenced by our results including: results for Promotions from Within (7.3-15), Leadership Development Success Rate (7.3-16) and ES&E results (7.3-10a). In 2013, the need for an organizational change was identified in order to meet LTGs. As a result, we promoted 6 LDCs to new leadership roles, aligning with our, “Promote from within” strategy. HOW do you; •Correlate LEARNING and development outcomes with findings from your assessment of WORKFORCE ENGAGEMENT and with KEY business RESULTS reported in category 7. •Use these correlations to identify opportunities for improvement in both WORKFORCE ENGAGEMENT and LEARNING and development offerings? Our OGs balance the needs of all stakeholders. We are able to understand the relationship between ES&E and key business results for all stakeholders through a review of survey results and process measures. EFG action items and low-performing results are reviewed by SLT in the Workforce Focus meetings and referred to SPP for consideration as initiated by our ES&E process. In 2013, results analysis revealed our CKR Fast shipping & delivery was not in alignment with our EKR Appropriate amount of work & time away from work around holidays. As a result, we adjusted the same-day shipping goal to same-day +1 during holiday weeks to minimize the amount of overtime and thereby meet our EKR Appropriate amount of work & time away from work. 5.2b(3) HOW do you manage effective career progression for your organization? HOW do you manage career development for your WORKFORCE? We manage the effective career progression and development of our workforce through our LS which includes our Performance Management processes. Our performance reviews include a review of Employee performance against Values, Culture and goals, and create an individual development plan. Additionally, our LDC process identifies future leaders of the organization and provides those Employees with further development opportunities such as mentoring, MQA examiner training, SPM and OFM invites, process effectiveness audit participation, and Leadership and Management Q&A’s. Currently, our LDC process includes 38% of our salaried staff. For hourly Employees in LO we created a career path poster depicting what needs to be done to get from one position to another. This works with our Training process, helping Employees understand where they are in their career progression. HOW do you carry out succession planning for management and leadership positions? Succession planning

26
is part of our LS and is accomplished through our Succession Planning process. Key positions are identified and potential successors for those positions are selected from our LDC list. We create development plans for successors to prepare them for their potential future position using our Leadership Development process. Our Leadership Development and Succession Planning processes are reviewed during CDT and Leadership meetings and through the WPMP. Category 6: 6.1a(1) HOW do you determine KEY product and WORK PROCESS requirements? We identify the SKRs for our products and processes through our Stakeholder surveys (3.2a1). We solicit a ranking and rating from our Stakeholders for each self-identified KR. We determine and incorporate these KRs into our MS, OGs, Culture Statement and Company/Department Strategies through our SPP (Fig. 2.1-1, Step 1 Box A-J). We use analysis matrices in ME, MK, CS and HR to benchmark, compare and determine requirements of our products and processes (2.1a3). We identify and prioritize opportunities through a comparative gap analysis. The results are reviewed in CFMs. Innovation and improvement ideas are captured in the PIS for integration with the SPP and WPMP. In 2015, our Customers identified a new CKR Ease of finding what you’re looking for. This new CKR resulted in a CAP designed to re-engineer search on our website. What are your organization's KEY WORK PROCESSES? Our key work processes (KPs) are the non-administrative area processes, within our KWS, which are directly responsible for delivering our CKRs. Each KP is represented on Department Work System Maps. In 2014, we split our MK KPs into their own department to allow for better focus in achieving our CKRs and to better align with our KWS definition. MK integration is enhanced, through a review of marketing and promotional efforts, including results from our ME, MK and CS work systems, during our Sales & MK Team meetings.
Figure 6.1-1 Key Processes (Work System Maps AOS) Merchandising (includes Military Surplus Division):
Suppliers, Product Offering, Product Information, Pricing, Inventory, Promotions and Entering New Markets
Marketing: Marketing Operations, Advertising, Internet Search, Customer Relationship Management, Public Relations and Voice of the Customer
Customer Support: Customer Account Management, Customer Inquiry Management, Customer Service Operations, Customer Service Training, Order & Invoice Management, Order Placement, Web Design & Development, Web Production Operations and Web Stability & Performance
Logistics: Command & Control, Shipping, Picking, Stocking, Warehouse, Repack, Receiving, Inventory Control, Returns, Facilities and Safety
What are the KEY requirements for these WORK PROCESSES? The KRs, defined as our SKRs, are listed on our OGs document (Fig. P.1-4) and are posted in every building entrance, on Organizational DNA Walls in each building, every conference room, each department, on the intranet and website. 6.1a(2) HOW do you design your products and WORK PROCESSES to meet requirements? Our main product offerings are the products we sell and the services we provide to meet our CKRs. The products we sell do not require design work at MW. The services we provide are accomplished through our processes which we design using our Process Design process. The Process Design process is the first step of
our WPMP (Operations Focus – Work Process Management WP) which requires either the identification and/or review of the process to ensure SKRs are identified and met. The Process Design process is integrated with our SPP (Fig. 2.1-1 Step 6) and Project Management process. During this process, project managers follow the steps as they design and/or re-engineer processes (Fig. 6.1-2).
Figure 6.1-2 Process Design Process Plan: Determine fit within work system, budget, benchmark, align with LTG Gather Requirements: Current state work flow mapping, KMs and goals, align with SKRs, strategies Design: Future state work flow mapping, align with LEAN principles, incorporate relevant PIS entries, align with Organizational Governance documents Review & Validate: Test application and/or process, gather feedback from Stakeholders to ensure design requirements are met, finalize future state work flow map, acquire final approval Update Documentation: Validate important terms are in Company Glossary, create WIs/WI sheets, create application/system narratives as required, update Department Work System Map
HOW do you incorporate new technology, organizational knowledge, product excellence, customer value, and the potential need for agility into these products and processes? We manage, improve, innovate and align our KPs with business needs, business direction and evolution of our SKRs through our WPMP. Our PIS is integrated with the WPMP. The attributes of new technology, organizational knowledge, product excellence, Customer value and agility are captured, evaluated and prioritized in the PIS for execution as CAPs, DAPs, CARs, OFIs and BL items. For example, in 2013, a CAP was created to achieve our #2 OG and SO ES&E. Based on Employee feedback regarding new technology, a new Employee Center was created to allow Employees to access compensation, benefit and time-off data from home. 6.1b(1) HOW does your day-to-day operation of WORK PROCESSES ensure that they meet key process requirements? Process owners review DKMs and supporting measures to ensure products and processes meet SKRs. For example, LO monitors Same Day Shipping (7.1-16), a measure for our CKR Fast shipping & delivery, on 3 levels; throughout the day as an in-process measure in our Mission Control dashboard to ensure we meet our goal of 99% same day, on a daily basis to chart progress against our monthly and annual goals, and on a monthly and annual basis as a DKM. We use our VOC (3.1a1) to ensure we are meeting our CKRs. We use dashboards to monitor the daily performance of operations. For example, our Company Dashboard reports measures aligned with SKRs, including gross sales, average order value and in-stock rate. Dashboard measures align with KMs on our scorecards. We conduct an annual review of all of our processes, through our Process Review process, to ensure alignment with KRs and facilitate integration and improvement. What KEY PERFORMANCE MEASURES or INDICATORS and in-process MEASURES do you use to control and improve your WORK PROCESSES? While we have many performance and process measures, performance at the highest and most important level is measured by our 13 CKMs, which are direct measures of performance toward our OGs and SKRs (Fig. P.2-3). Each SKR has a KM and each area process in a department has a KM. CKMs are reported on the Company Scorecard and all KMs, including CKMs, are reported on a Department Scorecard as DKMs for ownership

27
and accountability. We use scorecards, which include over 150 key and supporting measures, to evaluate, control and improve processes on a systematic basis. These scorecards use a Green-Yellow-Red indicator system at the individual measure level, to identify when corrective action is required. Per our Corrective Action/Preventive Action procedure, 3 consecutive red months (3 review periods where the KM is below 85% of goal) require a CAR be issued to realign measure performance to process KRs (CAR1 for CKM and CAR2 for DKMs). HOW do these MEASURES relate to end-product quality and performance? Our KMs and supporting measures, as well as the processes which direct the day-to-day operations, are directly aligned with SKRs and our OGs (Fig. P.1-4). For example, our #1 CKR of Competitive product pricing aligns with our measure of Prices Relative to Other Online Retailers (CSS) (7.1-1) and Competitive Pricing Index (AOS). In addition, our APs are designed to support SKRs. Upon completion, an AP is placed in a control phase, before closing, to ensure the AP delivers the performance results as planned. By assessing performance against goals and appropriate benchmarks we are able to directly ascertain end-process quality and performance. In 2014, we ensured all measures on our Company Scorecard were represented on a Department Scorecard for ownership and accountability. We created a Scorecard & Dashboard Management process and integrated it within our ISO Audit process to ensure sustained alignment. 6.1b(2) HOW do you determine your KEY support PROCESSES? We determine and define our key support processes as the non-administrative area processes within our support work systems that are directly or indirectly responsible for delivering SKRs. What are your key support processes?
Figure 6.1-3 Key Support Processes (Work System Maps AOS) Financial Services:
Budgeting, Cash Management, Accounts Payables Management, Payroll Management, Financial Reporting Management, Freight Bill & Claim Management, Tax Compliance, Risk Management and Contract Services
Human Resources: Recruiting & Hiring, Onboarding & Training, Performance Management and Employee Engagement
Information Systems: Application Management, Database Management, Helpdesk Management, Server Operations and Web Operations
Quality Management Systems: Leadership & Management Framework, Strategic Planning, Work Process Management and Measurement & Analysis
HOW does your day-to-day operation of these PROCESSES ensure that they meet KEY business support requirements? We ensure key support processes meet business support requirements in the same manner we ensure KPs meet process KRs (6.1b1). For example, FS monitors the KM, Timely Payment of Invoices (7.1-27), to ensure we pay our Suppliers on time. Paying our Suppliers on time meets the S/PKR Timely payment which positions us to receive pricing discounts and first chance at special product buys. These two advantages help ensure we are able to satisfy our SHKR Growth in net income and allows us to meet our CKR Competitive product pricing. Through regular review of dashboards, reports and measures we monitor the day-to-day and overall performance of our key support processes. As a result we are able to review underperforming processes and respond to changing operating conditions as appropriate.
6.1b(3) HOW do you improve your WORK PROCESSES to improve products and PERFORMANCE, enhance your CORE COMPETENCIES, and reduce variability? We use our WPMP, which aligns with ISO requirements, to design, manage and innovate (improve) all our processes to meet or exceed SKRs, achieve breakthrough innovation, and maintain alignment with business needs and direction. Included in the WPMP is an annual review of all processes and process documentation (4.2a1). We use our ISO Audit process to assess ISO compliance and determine if processes are meeting requirements. We use process effectiveness audits, and LEAN and Six Sigma projects to improve process effectiveness, efficiency and reduce performance variability. Improvements and corrective actions identified through reviews, audits and improvement projects (LEAN and Six Sigma) are captured, evaluated and prioritized in the PIS for execution as a CAP, DAP, CAR, OFI or BL item. This approach enhances our CCs as each CC is represented by KPs. In 2011 a review of the Inventory Control process identified an OFI in effectiveness and efficiency. We changed from a year-end physical inventory count, which required shipping operations to shut down for three days, to a more reliable, real-time inventory count by creating and executing a Cycle Counting process to continually count inventory without impacting operations. We have incorporated multiple cycles of learning into our ISO Audit process through process reviews. Improvements include the addition of verifying ISO, Baldrige and Measurement & Analysis compliance to our ISO Audit process and creating new Process Effectiveness Audits to give a greater focus to improving work systems and processes. 6.1c HOW do you manage for INNOVATION? We manage innovation by developing, categorizing, prioritizing and implementing strategically important ideas. Innovation is developed through multiple methods including: SPMs, annual process reviews, VOC input (3.1a1/3.2b2), Focus on the Future and Opportunity Focus meetings, BCMs, DKSs and DBMs. We also have formal calls for innovation in our EFGs, DKS and SOTB meetings. Innovation is recorded in the PIS and reviewed and prioritized through SPM/DBMs, WPMP and Continuous Improvement meetings. Innovation ideas, identified as strategically important, are captured as BL items in the PIS and reviewed for inclusion as APs on the SP (Fig. 2.1-1 Box R). Innovation implementation is accomplished through APs, OFIs, or CARs. We provide all Employees access to add ideas to our PIS. We currently have over 3400 ideas captured in our PIS in various stages of consideration and implementation. Since 2011 we have implemented over 2000 ideas (7.1-21). HOW do you pursue the STRATEGIC OPPORTUNITIES that you determine are INTELLIGENT RISKS? See 2.1a2 for how we determine intelligent risks worth pursuing. Strategic opportunities pursued as intelligent risks are addressed with a CAP through our SPP (Fig. 2.1-1). Organizational and Departmental Governance documents outline thresholds of risk acceptance for different management levels in the organization. HOW do you make financial and other resources available to pursue these opportunities? The SPP (Fig. 2.1-1) is integrated, with our Workforce Planning & Budgeting processes to determine and satisfy labor and financial needs. Each strategic opportunity has its resource requirements documented in its PIS entry. In 2014, in our PIS, we improved

28
our approach to identifying, capturing and recording resource hours. This information is used to prioritize projects and allocate required and constrained resources. FS maintains, through systematic processes, relationships with our banks to exercise greater lines of credit so we can capitalize on strategic opportunities. In 2013, during a period of rapid growth, multiple departments met to re-evaluate business needs; ultimately these banking relationships enabled the purchase of the additional inventory needed to meet a 60% increase in Customer demand. We have KM at the company and department level, SP Execution, to measure the percent of SP completed versus goal. The CKM (CSP Execution) is reviewed in MRRs, BOD and SOTB meetings. The DKM (DSP Execution) is reviewed in the MRRs. If performance to goal or circumstances require a shift in plans, we review the resource requirements of the changes or reallocations and adjust our SP. HOW do you discontinue pursuing opportunities at the appropriate time to enhance support for higher-priority opportunities? Our MS, OGs and Company Strategies guide our decision to discontinue pursuing opportunities in support of higher priority opportunities better aligned with our Vision “to be the best-run, most-respected business in America, for the benefit of our Customers.” In our SPM, we review the progress of each opportunity, managed as a CAP, evaluating its performance to date, and whether there are competing priorities deserving of the project’s resources based on business need in alignment with our MS, OGs and Company Strategies. At the end of 2014, based on our Vision, we made the decision to discontinue our International Sales program to allow us to focus on becoming “the best” in our key market segment, domestic internet retailing. Although international sales contributed ~1.6% to our sales, the resources consumed by the process prevented allocating those resources to our key market segment. 6.2a HOW do you control the overall costs of your operations? Control begins with designing our systems and processes to meet SHKRs Growth in net income and Improvement in productivity & efficiency (7.5-2, 7.3-4, 7.3-3) and is sustained by using ISO and our WPMP to design, manage, innovate and train our processes. By hiring Employees who share our Values of “Accountability” and “Stewardship”, we ensure our workforce Culture is focused on productivity and efficiency. Control continues with the integration of our SPP, Workforce Planning and Budgeting processes. Our Budgeting process establishes cost performance goals for each key and support work system; each department has a cost measure on their Department Scorecard. We conduct MRRs (2.1a3) and top level results reviews quarterly with the BOD. Cost control is built into APs through established goals and measures. We use ideas within our PIS to improve performance through SPP/WPMP when below goal. HOW do you; •Incorporate CYCLE TIME, PRODUCTIVITY, and other efficiency and EFFECTIVENESS factors into your WORK PROCESSES? We determine KMs and goals (controls) for our processes in alignment with SKRs. We review effectiveness and efficiency measures on a monthly and in-process basis at both the company and department level. We have also established productivity measures for individual Employees, where appropriate. These individual performance measures are integrated with the Performance Management process.
Department reviews have led to improvements in KM performance. For example, the implementation of the Nitro Express shipping system in 2010, subsequent efficiency and productivity improvements from 2011-2014 increased system throughput from 780 to 1765 invoices per hour, a 126% improvement. •Prevent defects, service errors, and rework? •Minimize warranty costs or CUSTOMERS’ PRODUCTIVITY losses, as appropriate? •Minimize the costs of inspections, tests and PROCESS or PERFORMANCE audits, as appropriate? Our Process Design process (6.1-2) includes a focus on meeting SKRs and using LEAN principles to ensure we prevent defects, service errors and rework. Additionally, we design our processes to minimize the cost of inspections and audits by including automated system checks/mistake-proofing which prevent errors and rework. We also reduce the costs of inspections, tests and audits, through automated in-process reports or alerts to identify variances or non-compliance to process design. During process execution, process performers submit preventive actions (OFIs) to our PIS to help identify and prioritize improvements in terms of cost and value creation, to increase effectiveness, efficiency and prevent defects, errors, or rework. We use documented WIs/WI sheets (required by ISO) to train Employees to ensure consistent, best-practice process execution in alignment with the design. Customer productivity losses come from their need to return products they ordered. Our effectiveness in minimizing this through process design is evidenced by our benchmark leading return rate of less than 1.5% (7.1-14). We minimize returns by designing our processes to meet CKRs including Extremely helpful product information, which ensures we provide the information Customers need to make the right purchasing decision. In 2015, we improved our Process Effectiveness Audit process to include training the participating LDCs on LEAN/Six Sigma to further develop our Employee’s use of these principles in their jobs. Results of Process Effectiveness Audits are reviewed in OFMs. •Balance the need for cost control with the needs of your CUSTOMERS? Stakeholders and SKRs are identified and balanced annually through our SPP. Within our CKRs, we must meet Customer needs (KRs) such as Competitive product pricing (7.1-1) and Fast shipping & delivery (7.1-5) to achieve our CSAT OG (7.2-1a). Within our SHKRs, we must achieve cost control requirements such as Improvement in productivity & efficiency (7.3-3/7.3-4) and Growth in net income (7.5-2). To achieve our OGs, we have to meet all SKRs, including those listed above. In our MRRs, we review our Company Scorecard which includes measures for each SKR (2.1a3/7.1-0). This approach ensures the balance of all SKRs, including the need for cost control and Customers’ needs. The effectiveness of our ability to balance these needs is demonstrated in the benchmark leadership performance on the measures listed above. Process performers and owners review performance and ensure KRs are being met, while identifying improvements that better balance costs and stakeholder interests. In 2013 we made a decision, based on our CKRs and Values, to not change our pricing in the wake of unprecedented demand, while some competitors raised theirs by as much as 300%. We also limited Employee purchases and enhanced our program of product quantity limits in order to serve Customers, expending additional constrained resource time to ensure we served as many Customers as

29
possible. In 2014, we improved our Promotional Product Selection process to ensure any products receiving promotional placement had been purchased with a cost-incentive structure. This has allowed us to balance the CKR Timely & exciting promotions with our need for cost control which relates directly to our SHKR Improvement in productivity & efficiency. 6.2b HOW do you manage your supply chain? The management of our supply chain starts with our OGs and SKRs. For example, in 2012, we negotiated a new agreement with a key Partner, UPS. This enabled us to receive additional discounts and delivery programs to better meet our CKRs In-stock products and Fast shipping & delivery. Management continues through executing processes, standardized policies, S/PAs and contracts. At a top level, the execution of our supply chain follows a recurring process cycle: Supplier Program management, Supplier Relationship management, Purchasing, Inventory management, Receiving, Accounts Payable Management, Shipping and Measurement & Analysis. Annually we survey our Suppliers and key Partners on their KRs and their satisfaction with our ability to meet their KRs. We also evaluate Supplier performance through our Supplier Performance Evaluation process. We use this information to identify innovation and improvement ideas for our supply chain management processes, which are captured in the PIS for integration with the SPP and WPMP. In 2013, we negotiated an agreement to reduce our charges for hazardous material shipments with UPS, later discovering we were being improperly billed. Through a CAR and our WPMP we designed and executed a process to validate all negotiated freight Partner contract elements upon approval and implementation. HOW do you; •Select suppliers and ensure that they are qualified and positioned to not only meet operational needs but also enhance your PERFORMANCE and your CUSTOMERS' satisfaction? We recognize S/Ps are critical to meeting our CSAT OG, therefore we have a strategy to maintain “Great S/P relationships”. Our S/Ps are selected and maintained based on their ability to help us meet our OGs. Suppliers are selected through the Supplier Relationship Management & Setup process on the basis of estimated performance to specific criteria directly related to supporting our ability to meet SKRs. The criteria includes their ability to support our ME Strategies and CVP in addition to meeting minimum sales, margin and inventory turns requirements. Supplier performance is managed monthly using the Supplier Performance Evaluation process. Our approach to creating great S/P relationships also includes processes for collaboration and planning to improve sales and marketing results with all S/Ps. We provide a special focus on key Suppliers, known as Top 10/Next 10, including annual planning meetings at Supplier facilities and at MW. During these meetings we integrate with their marketing and financial plans to allow both parties to understand how we can work together to enhance performance and CSAT. In 2014, we improved our Supplier Performance Evaluation process to set expectations and boundaries for our product Suppliers to better align with our business needs. In September 2014 we further improved our Supplier process by introducing a New Products Committee to review and approve the addition of new products and to systematically review the performance of new Suppliers. •Measure and evaluate your suppliers' PERFORMANCE?
Supplier performance is evaluated using the same process and criteria for Supplier selection (6.2b). We use reports to monitor Supplier performance. These reports include inventory analysis and aging, in transits, in stock rate and overall Supplier performance reporting. This data is integrated with our dashboards, ME scorecard, Company Scorecard and monthly category sales reviews by product line. Additional opportunities to measure and evaluate Supplier performance occur through our Supplier Visits, Supplier Meeting Prep and Sales Representative Communication processes. •Provide feedback to your suppliers to help them improve? ME maintains a “Great S/P relationships” strategy to establish a guiding principle for effective communication with our Suppliers and aligns with the S/PKR Candid, two-way communication. Feedback is provided through our Supplier Relationship Management process which details steps for providing feedback, including performance reports, frequency and methods of contact, and documenting Supplier feedback in our Product Center application and PIS. Annually we meet with the Top 10/Next 10 Suppliers to provide feedback and enhance collaboration. •Deal with poorly performing suppliers? Suppliers are notified when they fail to meet performance criteria outlined in the Supplier Performance Evaluation process. If notification doesn’t resolve the performance issue, we may discontinue the Supplier through our Supplier Deactivation process. Prior to deactivation, performance issues are escalated, as appropriate, to allow for senior management and executive involvement for resolution. In 2014, escalation from PLM to ME Manager to ME VP to President improved delivery performance with a Supplier, Remington® Ammunition. These process steps protect our financial interests and also treat Suppliers with courtesy and respect, in alignment with our Values and ME Strategies. 6.2c(1) HOW do you provide a safe operating environment? Our #2 OG, ES&E, includes the EKR Safe, comfortable work environment. We design, execute, manage, improve and innovate in alignment with business needs and SKRs for a safe operating environment. Our approach begins with prevention, including facility design and construction, meeting or exceeding all regulatory standards for the workplace, workforce safety and building codes. Safety is included in training of all applicable processes within departments and applicable Employee policies during new hire orientation. We also maintain a trained Safety Response Team to respond to safety incidents and deliver basic first aid. In 2012, we deployed WI sheets to emphasize process safety precautions. Equipment operation, such as fork-lifts, require specific training and certification. The effectiveness of this approach is validated through our benchmark leading performance on safety performance measures (7.3-5, 7.3-6a, 7.3-6b, 7.3-7). HOW does your safety system address accident prevention, inspection, root-cause ANALYSIS of failures, and recovery? We train Employees on process requirements, including safety to address accident prevention. We review safety performance measures on a monthly basis. We pursue incidents, as part of our Employee Injury Management process to identify OFIs/CARs, including a root cause analysis, which are captured in our PIS. Safety inspections are conducted by our Facilities area on pertinent safety equipment and systems. In 2012, in an effort to prevent cuts, we improved the model of
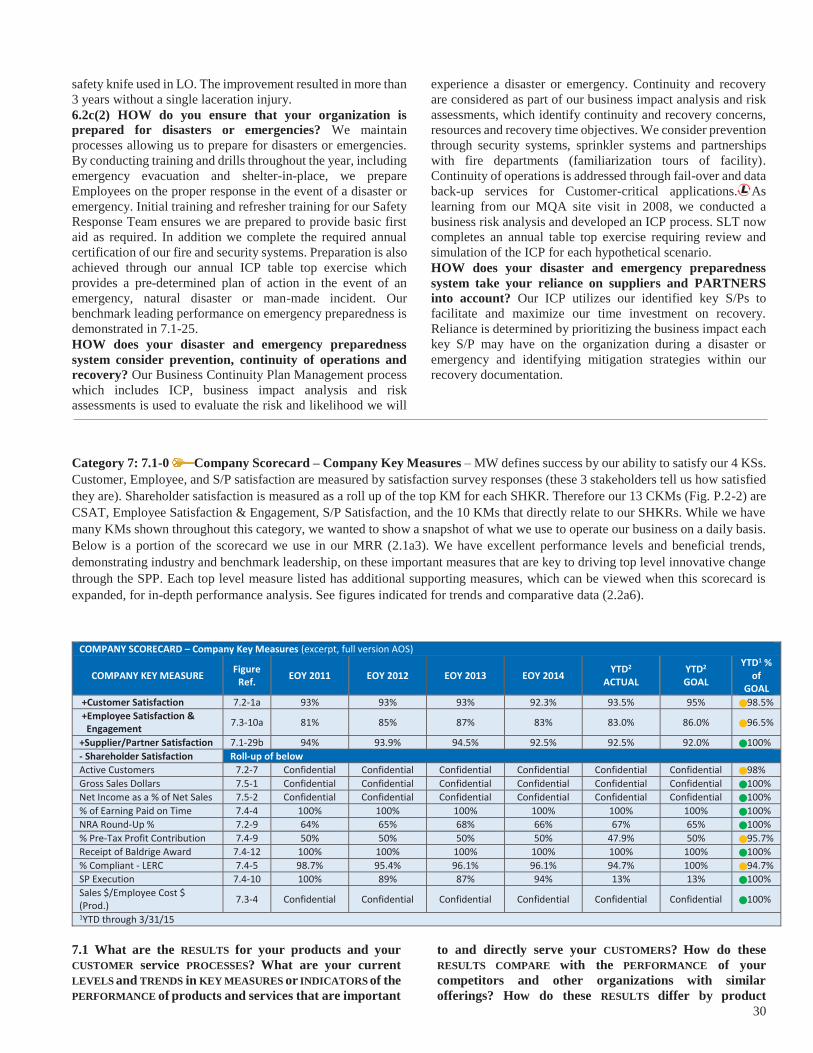
30
safety knife used in LO. The improvement resulted in more than 3 years without a single laceration injury. 6.2c(2) HOW do you ensure that your organization is prepared for disasters or emergencies? We maintain processes allowing us to prepare for disasters or emergencies. By conducting training and drills throughout the year, including emergency evacuation and shelter-in-place, we prepare Employees on the proper response in the event of a disaster or emergency. Initial training and refresher training for our Safety Response Team ensures we are prepared to provide basic first aid as required. In addition we complete the required annual certification of our fire and security systems. Preparation is also achieved through our annual ICP table top exercise which provides a pre-determined plan of action in the event of an emergency, natural disaster or man-made incident. Our benchmark leading performance on emergency preparedness is demonstrated in 7.1-25. HOW does your disaster and emergency preparedness system consider prevention, continuity of operations and recovery? Our Business Continuity Plan Management process which includes ICP, business impact analysis and risk assessments is used to evaluate the risk and likelihood we will
experience a disaster or emergency. Continuity and recovery are considered as part of our business impact analysis and risk assessments, which identify continuity and recovery concerns, resources and recovery time objectives. We consider prevention through security systems, sprinkler systems and partnerships with fire departments (familiarization tours of facility). Continuity of operations is addressed through fail-over and data back-up services for Customer-critical applications. As learning from our MQA site visit in 2008, we conducted a business risk analysis and developed an ICP process. SLT now completes an annual table top exercise requiring review and simulation of the ICP for each hypothetical scenario. HOW does your disaster and emergency preparedness system take your reliance on suppliers and PARTNERS into account? Our ICP utilizes our identified key S/Ps to facilitate and maximize our time investment on recovery. Reliance is determined by prioritizing the business impact each key S/P may have on the organization during a disaster or emergency and identifying mitigation strategies within our recovery documentation.
Category 7: 7.1-0 Company Scorecard – Company Key Measures – MW defines success by our ability to satisfy our 4 KSs. Customer, Employee, and S/P satisfaction are measured by satisfaction survey responses (these 3 stakeholders tell us how satisfied they are). Shareholder satisfaction is measured as a roll up of the top KM for each SHKR. Therefore our 13 CKMs (Fig. P.2-2) are CSAT, Employee Satisfaction & Engagement, S/P Satisfaction, and the 10 KMs that directly relate to our SHKRs. While we have many KMs shown throughout this category, we wanted to show a snapshot of what we use to operate our business on a daily basis. Below is a portion of the scorecard we use in our MRR (2.1a3). We have excellent performance levels and beneficial trends, demonstrating industry and benchmark leadership, on these important measures that are key to driving top level innovative change through the SPP. Each top level measure listed has additional supporting measures, which can be viewed when this scorecard is expanded, for in-depth performance analysis. See figures indicated for trends and comparative data (2.2a6).
COMPANY SCORECARD – Company Key Measures (excerpt, full version AOS)
COMPANY KEY MEASURE Figure Ref. EOY 2011 EOY 2012 EOY 2013 EOY 2014 YTD2
ACTUAL YTD2
GOAL
YTD1 % of
GOAL +Customer Satisfaction 7.2-1a 93% 93% 93% 92.3% 93.5% 95% 98.5% +Employee Satisfaction & Engagement 7.3-10a 81% 85% 87% 83% 83.0% 86.0% 96.5%
+Supplier/Partner Satisfaction 7.1-29b 94% 93.9% 94.5% 92.5% 92.5% 92.0% 100% - Shareholder Satisfaction Roll-up of below Active Customers 7.2-7 Confidential Confidential Confidential Confidential Confidential Confidential 98% Gross Sales Dollars 7.5-1 Confidential Confidential Confidential Confidential Confidential Confidential 100% Net Income as a % of Net Sales 7.5-2 Confidential Confidential Confidential Confidential Confidential Confidential 100% % of Earning Paid on Time 7.4-4 100% 100% 100% 100% 100% 100% 100% NRA Round-Up % 7.2-9 64% 65% 68% 66% 67% 65% 100% % Pre-Tax Profit Contribution 7.4-9 50% 50% 50% 50% 47.9% 50% 95.7%
Receipt of Baldrige Award 7.4-12 100% 100% 100% 100% 100% 100% 100% % Compliant - LERC 7.4-5 98.7% 95.4% 96.1% 96.1% 94.7% 100% 94.7% SP Execution 7.4-10 100% 89% 87% 94% 13% 13% 100% Sales $/Employee Cost $ (Prod.) 7.3-4 Confidential Confidential Confidential Confidential Confidential Confidential 100% 1YTD through 3/31/15
7.1 What are the RESULTS for your products and your CUSTOMER service PROCESSES? What are your current LEVELS and TRENDS in KEY MEASURES or INDICATORS of the PERFORMANCE of products and services that are important
to and directly serve your CUSTOMERS? How do these RESULTS COMPARE with the PERFORMANCE of your competitors and other organizations with similar offerings? How do these RESULTS differ by product

31
offerings, CUSTOMER groups and market SEGMENTS, as appropriate? We measure each of our CKRs with at least one KM and other supporting measure(s). Our Customers have identified the 12 most important factors to their satisfaction (Fig. P.1-4); the following measures are our KMs for each CKR. These measures are our Customer’s perception of how we are doing. In 2014, to ensure our performance on CSS items was being compared to only industry leaders in performance, we changed our benchmark to use an index of BizRate Circle of Excellence (COE) winners. Out of more than 4,700 internet retailers, the Bizrate Circle of Excellence winners represent the top 2.9% in CSAT (MW is a 7 time winner, winning most recently in 2014). Therefore, this benchmark represents that MW is in the 97th percentile. As shown on our CKR measures 7.1-1 through 7.1-12, we demonstrate benchmark leadership in all important measures for our Customers, in perfect alignment with our Vision. CKR 1 - Competitive Product Pricing 7.1-1 Price Relative to Other Online Retailers (CSS) results demonstrate benchmark leadership levels and a beneficial trend sustained over time. Our results are projected to continue into the future (projections listed as future goals). Our high levels on this measure demonstrates that our Customers are very satisfied with product prices.
CKR 2 – Low-Cost Shipping 7.1-2 Shipping Charges (CSS) results show excellent performance levels and a beneficial trend sustained over time on Customer’s satisfaction with our shipping charges. Due to changing Customer expectations for shipping charges, our scores in this area changed slightly from 2012/13. This was identified as a SC and to address it the CAP “PH&I Re-engineering” was created to lower shipping charges. Implementation of this CAP resulted in a 4 point increase and led to returning high levels of performance. Due to continued process improvements for this CKR Low-cost shipping, we project sustained improvement toward benchmark on this measure.
CKR 3 – In-Stock Products 7.1-3 Product Availability (CSS) results show excellent performance levels, above 90%, and a beneficial trend sustained over time, despite our SC “Scarce supplies of certain hard to produce products”. We perform very near benchmark, which puts us close to the top 2.9% of all internet retailers, despite the challenges we have faced getting certain products from our Suppliers during the market surge of 2012/13. Our projections are to reach benchmark in 2016 due to the APs noted in 7.1-26. Our excellent performance levels demonstrate we outperformed our industry in product availability and meet our CKR In-stock products.
CKR 4 – Product Selection 7.1-4 Selection of Products (CSS) results show excellent performance levels and a beneficial trend sustained over time which are projected to continue into the future. This measure is key to acquiring (7.1-20) and retaining (7.2-5) Customers and our CKR, SA Product selection and “Just about everything” strategy.
CKR 5 - Fast Shipping and Delivery
50%
60%
70%
80%
90%
100%
Prices Relative to Other Online Retailers (CSS)
Actual Goal Bizrate COE (Benchmark)
Better
50%
60%
70%
80%
90%
100%Shipping Charges (CSS)
Actual Goal Bizrate COE (Benchmark)
Better
50%
60%
70%
80%
90%
100%Product Avai lability (CSS)
Actual Goal Bizrate COE (Benchmark)
Better
50%
60%
70%
80%
90%
100%Selection of Products (CSS)
Actual Goal Bizrate COE (Benchmark)
Better

32
7.1-5 On-time Delivery (CSS) results show benchmark leadership levels and a beneficial trend sustained over time which are projected to continue into the future. This measure is in alignment with our SA of “Order fulfillment”, our high performance on Same Day Shipping (7.1-16) and is important to addressing our SC “Changing Customer expectations on faster delivery”. This indicates that our Customers are satisfied with our shipping speed and that satisfaction is projected to increase in the future.
CKR 6 – Accurate, Intact Shipments 7.1-6 Accurate, Intact Shipments (CSS) results show excellent performance levels, over 95%, sustained over time. This is a custom survey question we added to our CSS in 2014 to better align our measurement system with the CKR Accurate, intact shipments. As this is a custom question no benchmark data is available. We project this peak performance will continue.
CKR 7 - MidwayUSA’s Support of the 2nd Amendment & Shooting Sports Industry 7.1-7 MidwayUSA’s Support of the 2nd Amendment & Shooting Sports Industry (CSS) results show excellent performance levels, over 97%, sustained over time, and are projected to continue into the future. Results reflect MW’s industry-leading support provided to 3 of our key communities; the NRA, shooting sports industry and KCGs. This result is directly related to our SA “Role model support of the 2nd Amendment and shooting sports industry” and our NRA Round-up result (7.2-9). Ensuring the future of hunting and shooting sports is important to our Customers and vital for the long-term success of MW. This new CSS measure was implemented as a custom survey question for MW in 2014 to
measure our Customers’ satisfaction with our Support of the 2nd Amendment and shooting sports industry (CKR).
CKR 8 – Extremely Helpful Product Information 7.1-8 Clarity of Product Information (CSS) results demonstrate benchmark leadership levels sustained over time. This high level of performance is projected to continue due to the effectiveness of APs designed to increase this measure and maintain the results on product information clarity (CAP in 7.1-13).
CKR 9 – Ease of Finding What You’re Looking For Using “Search” 7.1-9 Ease of Finding What You’re Looking For (CSS) results show excellent performance levels and a beneficial trend sustained over time. To further improve this measure, we have a CAP “Search and Browse Improvement” in progress to leverage our SA “Fast, feature-rich user-friendly website” by providing improved search feature control to better meet this CKR.
CKR 10 – Easy to Do Business with
50%
60%
70%
80%
90%
100%
On-Time Delivery (CSS)
Actual Goal Bizrate COE (Benchmark)
Better
50%
60%
70%
80%
90%
100%Accurate, Intact Shipments (CSS)
Actual Goal
Better
50%
60%
70%
80%
90%
100%
MidwayUSA's Support of the 2nd Amendment (CSS)
Actual Goal
Better
50%
60%
70%
80%
90%
100%Clarity of Product Information (CSS)
Actual Goal Bizrate COE (Benchmark)
Better
50%
60%
70%
80%
90%
100%
Ease of Finding What You Are Looking For (CSS)
Actual Goal Bizrate COE (Benchmark)
Better

33
7.1-10 Customer Support (CSS) results demonstrate benchmark leadership levels that have been sustained over time. We project this high level of performance will be sustained in the future as we continue to leverage our SA “Customer focus”. This measure is highly reflective of hiring in alignment with our Culture of “Customer-focused excellence” and our Company Strategy to “Put Customers first”.
CKR 11 – Fast, Feature-Rich, User-Friendly Website 7.1-11 Overall Look and Design of Website (CSS) results demonstrate benchmark leadership levels and a beneficial trend sustained over time. Due to continual improvements to our website, to further leverage our SA “Fast, feature-rich user-friendly website”, we project our Customers' satisfaction with the look and design of our website will continue to increase.
CKR 12 – Timely & Exciting Promotions 7.1-12 Timely & Exciting Promotions (CSS) results show excellent performance levels and a beneficial trend sustained over time. This is a unique measure to MW that was implemented in 2014. Due to continual improvement and innovation in our sales and marketing processes to leverage our SA “Frequent, exciting sales & promotions”, we project the existing beneficial trend in Customers' satisfaction with promotions will continue..
Other important product quality measures include:
7.1-13 Product Information Quality Rating results show benchmark leadership levels and a beneficial trend sustained over time. This measure is important in meeting our CKR Extremely helpful product information. We project continued benchmark performance due to efforts such as our CAP “Product Information Management – Product Description and Information Improvement”.
7.1-14 Product Return Rate and product return rate as a % of cost of goods sold (COGS) results demonstrate sustained benchmark leadership levels that are projected to continue into the future. This measure integrates with our CKR Extremely helpful product information and our CKR Accurate, intact shipments as these are the primary drivers of product returns.
7.1b1 PROCESS EFFECTIVENESS and Efficiency: What are your PROCESS EFFECTIVENESS and efficiency RESULTS? What are your current LEVELS and TRENDS in KEY MEASURES or INDICATORS of the operational PERFORMANCE of your KEY WORK and support PROCESSES, including PRODUCTIVITY, CYCLE TIME, and other appropriate MEASURES of PROCESS EFFECTIVENESS, efficiency, and INNOVATION? How do these RESULTS compare with the PERFORMANCE of your competitors and other organizations with similar PROCESSES? How do these RESULTS differ by PROCESS types, as appropriate? In addition to measures listed here, the following results also show excellent levels and trends of process effectiveness and efficiency Company-wide: Profit $ per Employee Cost $ (Efficiency) (7.3-3), Sales $ per Employee Cost $ (Productivity) (7.3-4) and Cost to Operate (7.5-4). 7.1-15 Total Net Cost per Invoice results demonstrate benchmark leadership levels and a beneficial trend sustained
50%
60%
70%
80%
90%
100%Customer Support (CSS)
Actual Goal Bizrate COE (Benchmark)
Better
50%
60%
70%
80%
90%
100%Overall Look and Design of Website (CSS)
Actual Goal Bizrate COE (Benchmark)
Better
50%
60%
70%
80%
90%
100%Timely & Exciting Promotions (CSS)
Actual Goal
Better
50%
60%
70%
80%
90%
100%Product Information Quality Rating
Actual Goal (Benchmark)
Better
0%
3%
6%
9%
12%
15%Product Return Rate
Return Rate GoalReturns % of COGS (% Benchmark)
Better

34
over time. This performance demonstrates our ability to control expenses. Through the systematic use of LEAN and Six Sigma tools we are able to continually reduce the cost of processing and shipping Customer orders. 2014’s result was due to recovery from the market surge in 2012/13, with 2015 clearly showing evidence of a return to excellent performance. 2014 recovery initiatives were based on a strategy to avoid layoffs (see related beneficial trend for Slow-Time (7.3-2)) and retain experienced staff for future growth requirements. In addition, we managed costs from a 2-year 63% sales growth to a normalized 10% sales growth projection levels, ultimately contributing to our overall lower Cost to Operate (7.5-4), demonstrating benchmark leadership levels. This measure directly relates to SHKRs Improvement in productivity & efficiency and Growth in net income, and Net Income as a Percentage of Net Sales (7.5-2).
7.1-16 Same Day Shipping results demonstrate benchmark leadership levels and a beneficial trend sustained over time. This measure is in alignment with our high performance on On-time Delivery (CSS) (7.1-5), and is important to our CKR Fast shipping & delivery, SA “Order fulfillment”, and our SC “Changing Customer expectations on faster delivery”. Our Culture of “Customer-focused excellence" and SPP ensures our focus will remain on sustaining these results over the long-term, as indicated by our projections. (Carrier SAOS)
7.1-17 Website Conversion measures how effective our website is at converting visits into orders. As an internet retailer with 93.5% of gross sales generated through our website, website conversion is an indicator of how well we deliver our Fast, feature-rich, user-friendly website CKR and
SA. Due to the industry’s extremely high demand and limited supply (7.1-26) in 2012/13, website conversion decreased slightly. A root cause analysis revealed that due to our SC “Scarce supplies of certain hard to produce products”, many Customers were visiting our website multiple times to see if products had become available. The return of results in 2014/15 to a beneficial trend and related measures validate this analysis; high levels of CSAT with Product Availability (7.1-3) indicates we outperform our industry in providing our Customers with available products, which has led to growth in Active Customers (7.2-7) and Gross Sales (7.5-1). We perform favorably to our #1 industry competitor, who was not as impacted by product availability due to differences in product offerings.
7.1-18 Website Availability results demonstrate sustained benchmark leadership levels over our #1 overall competitor. This measure relates directly to our SA and CKR Fast, feature rich, user-friendly website and displays the effectiveness of our CS website-related processes. As our website is our primary channel of Customer interaction, high performance is critical to delivering a satisfying experience. Website availability is a basic requirement of the Overall Look and Design of Website (7.1-11) and helps reduce Customer Dissatisfaction (7.2-2).
7.1-19 Website Speed results show excellent performance levels and a beneficial trend sustained over time. Website speed compared to our #1 industry competitor, shows MW far exceeds their results on this measure that is important in achieving CSAT (#1 OG), our CKR Fast, feature rich, user-friendly website (7.1-11), and is a key factor of influence for Website Conversion (7.1-17).
Total Net Cost per Invoice - LO
Actual Goal F. Curtis Barry & Co (External)
Better
40%
50%
60%
70%
80%
90%
100%Same Day Shipping
Actual Goal (Benchmark)
Better
0%
1%
2%
3%
4%
5%Website Conversion
Actual Goal (Competitor)
Better
50%
60%
70%
80%
90%
100%Website Availability
Actual Goal Comp. (Benchmark)
Better
Comparative data

35
7.1-20 New Buying Customers results show excellent performance levels and a beneficial trend that have been sustained over time. While our trend shows a drop in 2014, this followed a huge increase in 2012/13, which far exceeded our goals. As stated earlier, this increase was due to the market surge in 2012/13. This surge caused a tremendous influx of new Customers who normally wouldn’t have purchased. New buying Customer levels normalized with the market in 2014. Our pre-surge positive trend continues, as we return to 2012 levels by the end of 2016. We are above goal for 2015 and project a continued positive trend through our long-term planning horizon. New buying Customers contributes to the excellent levels on our CKM, Active Customers (7.2-7) and is related to the SHKR Customer acquisition & retention. (This graph shows additional historical data to better depict the long-term focus on improving acquisition of new buying Customers.) (Product category SAOS) (Please note hollow green bars indicate end of year projections on measures for cumulative results throughout Category 7.)
7.1-21 Innovation Rate results demonstrate benchmark leadership levels and a beneficial trend sustained over time. This measure reports the number of items in our PIS that have been implemented. Innovation is the basis of our SP and helps improve all processes throughout the organization through our PIS. MW has multiple methods of innovation (CAP, DAP, BL, CAR, OFI) and these items can be conceptually created by any Employee in the company through the PIS. Due to our Culture of “Managing for innovation” and “Continuous improvement” we project this outstanding trend will continue into the future.
7.1b(2) What are your emergency preparedness results? What are your current LEVELS and TRENDS in KEY MEASURES or INDICATORS of the EFFECTIVENESS of your organization’s preparedness for disasters or emergencies? How do these RESULTS differ by location or PROCESS type, as appropriate? 7.1-22 Credit Card Fraud results demonstrate sustained benchmark leadership levels that are projected to continue into the future. Results indicate performance for preventing credit card fraud, which is evidence of effective cyber security (7.1-23), fraud management and secure website construction. Our excellent sustained trends consistently outperform the benchmark from Elavon and our #1 overall competitor. As an internet retailer, one of our greatest threats to prepare for is the threat (SC) of “Computer virus, malware, phishing and hacking”. This is important to our Customers and to our SHKRs Legal, ethical & regulatory compliance and Growth in net income.
7.1-23 Cyber Security Preparedness results demonstrate sustained benchmark leadership levels with no outages or data compromises in the last 5 years. Security of Customer data and IT systems are important concepts in the internet retail marketplace, where the majority of transactions are credit card. Cyber security preparedness leads to a reduction in Credit Card Fraud (7.1-22), PCI Compliance (7.1-24) and reduced Customer Dissatisfaction (7.2-2).
2011 2012 2013 2014 2015 Proj - 2020
Outages / Data Compromises 0 0 0 0 0 0
40%
50%
60%
70%
80%
90%
100%Website Speed
Actual Goal (Competitor)
Better
New Buying Customers
Actual Goal
Better
0
200
400
600
800
1000Innovation Rate
Actual Goal CPH (BAR Benchmark)
Better
0.00%
0.05%
0.10%
0.15%
0.20%
0.25%Credit Card Fraud
Actual GoalAmazon (Competitor) Elavon (Benchmark)
Better
Benchmark

36
7.1-24 PCI Compliance results show we have maintained the highest levels of performance possible since 2011 (best practice) and are on par with our #1 overall competitor, who is also PCI compliant. By utilizing the IS strategy of “Keep it secure”, MW has determined our approach to meeting compliance requirements will be to secure our IT systems to a level that meets or exceeds requirements in protecting our Customers’ data. Preventing security breaches increases the Customer’s confidence in MW and mitigates impact on Customer Loyalty (7.2-6). Compliance is validated by a 3rd party and involves an investigation of our Compliance Management process coupled with penetration testing.
2011 2012 2013 2014 2015 Proj - 2020
PCI Compliant 100% 100% 100% 100% 100% 100%
7.1-25 MidwayUSA Workplace Emergency Preparedness Activities results demonstrate sustained benchmark leadership levels, at 100%, over the last 4 years in these activities. This chart represents MW’s commitment to exceed minimum compliance requirements with local, state and federal regulations and to ensure these plans are properly documented and trained, providing for our EKR Safe, comfortable work environment. Our ICP is tested annually, including tabletop exercises. In 2014, we became actively involved in our Local Emergency Preparedness Committee and started exercising with the IS department on the Disaster Recovery Plan. We conduct a campus-wide building evacuation drill annually and quarterly evacuation drills for the LO Employees include all shifts. We conduct a campus-wide shelter-in-place drill annually. We have one trained rescuer for every 15 Employees, conduct annual blood-borne pathogen training and have AEDs in each building. We submit an annual waste report and conduct internal and external small quantity generator site inspections annually.
Preparedness Activities Completed 2012 2013 2014 2015 Proj.
-2020
ICP 100% 100% 100% 100% 100% Emergency Evacuation & Shelter-In-Place 100% 100% 100% 100% 100%
Safety Training Management 100% 100% 100% 100% 100%
Facility Waste Management n/a n/a 100% 100% 100%
Fire Systems 100% 100% 100% 100% 100%
Preparedness Activities Completed 2012 2013 2014 2015 Proj.
-2020
ICP 100% 100% 100% 100% 100% Emergency Evacuation & Shelter-In-Place 100% 100% 100% 100% 100%
Safety Training Management 100% 100% 100% 100% 100%
Facility Waste Management n/a n/a 100% 100% 100%
Fire Systems 100% 100% 100% 100% 100% 7.1c What are your supply-chain management RESULTS? What are your RESULTS for key measures or indicators of the performance of your supply chain, including its contribution to enhancing your performance? 7.1-26 In-Stock Rate results show excellent performance levels and a beneficial trend sustained over time for this difficult measure in our industry. As indicated by our SC “Scarce supplies of certain hard to produce products”,
manufacturers in our industry have difficulty supplying products that are subject to “panic buying” when political situations affecting our industry arise. Root cause analysis has shown this to be an industry-wide challenge, not a Company or process issue. Nevertheless, we have performed well in this CKR In-stock products by leveraging our relationships with key Suppliers to increase our allocation of these products. In addition, we have created the DAP “PO Follow-up Process” to work with our Suppliers, as well as modifying our ordering schedules by completing the CAP “SugOrder Re-engineering” to help increase this measure. As presented in 7.1-3, CSAT levels with product availability have shown levels above 90% and a beneficial trend despite our Supplier’s difficulty in meeting Customer demand which means our Customers perceive us as performing well in this area compared to their expectations and compared to our competitors. (Product category SAOS)
7.1-27 Timely Payment of Invoices results demonstrate sustained benchmark leadership levels, outperforming all of our competitors, including our #1 industry competitor and benchmark. This measure is confirmed externally by our Dun & Bradstreet Paydex Rating (7.5-7). Meeting this requirement is an important factor in maintaining our S/P relationships. Our reliability with payment contributes to our “Frequent, exciting, relevant promotions” SA and allows us to negotiate more favorable terms with our Suppliers, contributing further to our SA “Financial strength & outstanding cash flow management”.
7.1-28 Inventory Turns results demonstrate benchmark leadership levels and a beneficial trend sustained over time. Results have improved significantly from 5.2 turns in 2004 to 7.8 so far this year. Starting in 2013, our goals were lowered and we intentionally increased our inventory to leverage our SA “Financial strength & outstanding cash flow management”
50%
60%
70%
80%
90%
100%In Stock Rate
Actual Goal (Competitor)
Better
50%
60%
70%
80%
90%
100%Timely Payment of Invoices
ActualGoalS/P Timely Payment Satisfaction - MWS/P Timely Payment Satisfaction - Comp. (Benchmark)
Better

37
(7.5-5) to take advantage of a strategic opportunity to acquire asset inventory (an intelligent risk, see 2.1a2) in addition to making large promotional buys to further support our SHKR Growth in sales and Customer acquisition & retention. In short, we used our financial strength to invest in additional inventory to drive our sales beyond our goals when our Suppliers presented us with purchasing opportunities. In 2016, we will be back to an all-time high of nearly 9 turns and are projecting to stay at that level, in alignment with our goal. Our excellent performance levels and beneficial trend has provided lower operating costs (7.5-4) and increased cash flow based on efficient management of this key asset (7.5-5). Our benchmark leadership results are considerably better than our #1 industry competitor, and Risk Management Association’s (RMA) industry benchmark. (SAOS) (This graph shows additional historical data to better depict the long-term focus on improving results in this area.)
7.1-29a Supplier & Partner Satisfaction by Key Requirement We are the industry and benchmark leader in S/P satisfaction. Our sustained, outstanding satisfaction levels are well above those of our best performing competitor. This is important to our SAs “Great supplier/partner relationships” and “New product acquisition”. These, in combination, help us meet our CKRs of Competitive product pricing, In stock products, Product selection, and Timely & exciting promotions. (Supplier and Key Partner SAOS)
Key Requirement 2011 2012 2013 2014 competitor
Proj -2020
Support of product line n/a n/a 88.5% 87.4% 71.7% 92%
Candid two-way communication n/a 93.7% 95.0% 94.6% 75.6% 92%
Friendly, courteous, ethical relationship
97.0% 96.0% 97.0% 95.9% 83.8% 92%
Timely payment 96.0% 95.9% 98.1% 97.6% 87.3% 92% Accurate payments 96.6% 96.3% 98.7% 97.3% 87.5% 92%
Easy to do business with 96.0% 93.8% 96.0% 93.2% 69.9% 92%
Marketing exposure 88.0% n/a 87.7% 84.2% 76.1% 92%
7.1-29b Supplier & Partner Satisfaction is our #3 OG and a CKM. We are the industry and benchmark leader in S/P satisfaction. Our sustained, outstanding satisfaction levels are well above those of our best performing competitor. This is important to our SAs “Great supplier/partner relationships” and “New product acquisition”. These help us meet our CKRs Competitive product pricing, In stock products, Product selection, and Timely & exciting promotions. (Supplier and Key Partner SAOS) (This graph shows additional historical data to better depict the long-term focus in this area.)
7.2a(1) What are your CUSTOMER satisfaction and dissatisfaction results? What are your current LEVELS and TRENDS in KEY MEASURES or INDICATORS of CUSTOMER satisfaction and dissatisfaction? How do these RESULTS compare with those of your competitors and other
organizations providing similar products? How do these RESULTS differ by product offerings, CUSTOMER groups, and market SEGMENTS, as appropriate? We have 3 Customer groups: prospective, active, and inactive. (SAOS)
7.2-1a Customer Satisfaction is our #1 OG. Our #1 Company Strategy is to “Put Customers first”. Having satisfied and engaged Customers is the single most important factor ensuring our ongoing success. This leads to Customer acquisition (7.1-20), Customer Retention (7.2-5) and Customer Loyalty (7.2-6) which leads to growth in Gross Sales (7.5-1) and growth in Net Income (7.5-2). Our results demonstrate benchmark leadership levels and a beneficial trend sustained over time. Our Culture of “Customer-focused excellence” and our SA of “High-performing, engaged Employees who share our Values and embrace our Culture” in addition to our SPP (SA) ensures our focus will remain on sustaining these results over the long-term, as indicated by our projections.
2
4
6
8
10Inventory Turns
Inventory Turns Turns Goal
Comp.(Competitor) RMA (Benchmark)
Better
50%
60%
70%
80%
90%
100%Supplier & Partner Satisfaction (SPSS)
Actual Goal Comp. (Benchmark)
Better

38
(Segmentation by CKR in 7.2-1b; Buyer/non-buyer, Customer group SAOS) (This graph shows additional historical data to better depict the long-term focus on improving results on this area.)
7.2-1b Customer Satisfaction by CKR can be seen in the CSS measures in 7.1 and validates our Customer’s favorable view of our ability to meet or exceed their KRs (see 7.2-1a).
CKR 1 7.1-1 CKR 7 7.1-7 CKR 2 7.1-2 CKR 8 7.1-8 CKR 3 7.1-3 CKR 9 7.1-9 CKR 4 7.1-4 CKR 10 7.1-10 CKR 5 7.1-5 CKR 11 7.1-11 CKR 6 7.1-6 CKR 12 7.1-12
7.2-2 Customer Dissatisfaction results show excellent performance levels and a beneficial trend sustained over time.
Pursuit of continuous improvement led to creating this measure which shows the percentage of negative CSS comments from our Customers. Because it is not used by other organizations, a benchmark is unavailable. This measure is important to our #1 OG and CKR Easy to do business with. Integration with the VOC and CFMs ensures we will continue to meet long-term projections.
7.2a(2) What are your CUSTOMER ENGAGEMENT RESULTS? What are your current LEVELS and TRENDS in KEY MEASURES or INDICATORS of CUSTOMER ENGAGEMENT, including those for building CUSTOMER relationships? How do these RESULTS compare over the course of your CUSTOMER life cycle, as appropriate? How do these RESULTS differ by product offerings, CUSTOMER groups, and market SEGMENTS, as appropriate? 7.2-3 Facebook Engagements results show excellent performance levels and a beneficial trend sustained over time. Because we uniquely measure the total number of likes, comments, shares, link clicks, other clicks and video plays on the MW Facebook page content as an indicator of Customer
engagement and building Customer relationships, we are unable to benchmark this data.
7.2-4 Facebook Page Likes results show excellent performance levels and a sustained beneficial trend which are projected to continue into the future. We use this measure as a means of further validating our Facebook Engagements (7.2-3) performance compared to competitors; we outperform our #1 overall competitor, in the number of Facebook page likes in relation to sales dollar. This is important in relation to our SA “Customer focus” and indicates our ability to engage and build relationships with Customers.
7.2-5 Customer Retention results demonstrate benchmark leadership levels and a beneficial trend sustained over time. While our trend shows a drop in 2014, this was following a
50%
60%
70%
80%
90%
100%Customer Satisfaction (CSS)
Active Actual Active Goal Bizrate COE (Benchmark) (Competitor)
Better
0%
2%
4%
Customer Dissatisfaction
Actual Goal
Better
0.000
0.010
1.000
-
10
20
30
40
50
Like
s x 1
0000
Facebook Page Likes
Actual GoalMW Likes/Sales $ Amazon Likes/$ (Competitor)
Like
s/Sa
les$
Better
Competitor likes

39
huge increase of New Buying Customers (7.1-20) in 2012 and 2013, which far exceeded our goals. As stated earlier, an unexpected surge in business occurred in late 2012 and through 2013 because of “panic buying” of certain products for fear of legislation. A huge influx of Customers, who normally would not have purchased, entered the market during this time and we were not able to sustain this level after the business normalized in 2014. While we did retain a good portion of these new Customers, we weren’t able to retain our usual percentage as Customers resumed their normal purchasing behaviors. However, our overall trend of Active Customer growth (7.2-7) has been excellent and our Customer retention trend is once again positive and projected to remain positive. (SAOS)
7.2-6 Customer Loyalty (CSS) results demonstrate benchmark leadership levels and a beneficial trend sustained over time. This is an important measure of CSAT and engagement, which shows our Customers’ continued desire to purchase from MW. This measure directly relates to our SHKR Customer acquisition & retention; we project continued best in class performance due to our commitment to Customers. (Customer group SAOS)
7.2-7 Active Customers is a measure of acquiring and retaining distinct Customers who have purchased in the last 12-month period and is key to our long-term success. Our excellent performance levels in acquiring and retaining active Customers is clearly evident in the long-term sustained beneficial trend below. Our steady growth in active Customers has been critical to our overall sales growth and reflects our Culture of “Customer-focused excellence”. Our 2015 projection is based on market normalization after the 2012/13 market surge and continues our long-term outstanding trend on this measure. This CKM for the SHKR Customer acquisition & retention, our SPP, and our Culture of “Delivering value and results” will ensure we continue to meet our aggressive projections in the future. (Customer type and many additional SAOS) (This graph shows additional historical data to better depict the long-term focus on improving results in this area.)
7.2-8 Customer Advocacy (CSS) results demonstrate sustained benchmark leadership levels. This is an important measure of CSAT and engagement showing the eagerness of our Customers to recommend and actively promote MW. We measure advocacy through the CSS question, “Likelihood to recommend to others”. This measure is directly related to our SHKR Customer acquisition & retention. We project continued best in class performance due to our Culture of “Customer-focused excellence”. (Customer group SAOS)
30%
40%
50%
60%
70%
80%Customer Retention
Actual Goal Forrester Research (External)
Better50%
60%
70%
80%
90%
100%Customer Loyalty (CSS)
Actual Goal Bizrate COE (Benchmark)
Better
A
2007 2008 2009 2010 2011 2012 2013 2014 2015 2016 2017 2018 2019 2020
Active Customers
Actual Goal Amazon (Benchmark)
Better
50%
60%
70%
80%
90%
100%Customer Advocacy (CSS)
Actual Goal Bizrate COE (Benchmark)
Better
Competitor (Benchmark)

40
7.2-9 NRA Round-Up Percentage results demonstrate benchmark leadership levels and a beneficial trend sustained over time.Our results significantly outperform the combined NRA Endowment contribution dollars from all other sources and results are projected to continue benchmark leadership in the future. This result measures performance on the CKM for the SHKR Support of the NRA & 2nd Amendment. It is an indicator of Customer engagement and depicts the percentage of orders on which Customers rounded up their purchase total to contribute to the NRA. This measure is also important to our CKR Support of the 2nd Amendment & the shooting sports industry (7.1-7) and influences our SC “Legislation affecting shooting/hunting industry”. This measure is an indicator of Customer engagement levels because it is a voluntary contribution that Customers may choose while shopping with us. (This graph shows additional historical data to depict our long-term commitment to this key community.)
7.3a(1) What are your WORKFORCE CAPABILITY and CAPACITY RESULTS? What are your current LEVELS and TRENDS in KEY MEASURES of WORKFORCE CAPABILITY and CAPACITY, including appropriate skills and staffing levels? How do these RESULTS differ by the DIVERSITY of your WORKFORCE and by your WORKFORCE groups and SEGMENTS, as appropriate? 7.3-1 Staffing Strength results show excellent performance levels and a beneficial trend sustained over time. This newly created indicator of capacity, which measures the percent of approved positions currently staffed, is directly related to our EKR Appropriate amount of work & time away from work. It is important to achieving SOs (7.4-11) and Net Income (7.5-2), by managing staffing levels to execute processes and the SP. It is also an indicator of the effectiveness of our Recruiting & Hiring process and Employee engagement. This unique measure is not able to be benchmarked. (Department, exempt/non-exempt SAOS)
7.3-2 Slow Time Hours as a % of Paid Hours Worked result has been trending favorably since Q2 2014. Coming off of the 2012/13 market surge, MW had higher levels of staffing than were required after the market normalized. We have a strategy to avoid workforce layoffs, and have never had one in our 38-year existence, therefore we managed our workforce by reducing work schedules (slow time) in Q1/Q2 2014. This
new measure, created based on EFG feedback in 2014, allows us to monitor and balance work time and prevent layoffs and dissatisfaction due to the number of hours worked. To fully meet the EKR Appropriate amount of work & time away from work, we also manage overtime to ensure we maintain balance for hourly Employees. We have performed exceptionally well compared to external sources for overtime hours worked. (Department SAOS)
7.3-3 Profit $ per Employee Cost $ (Efficiency) results demonstrate benchmark leadership levels and a beneficial trend sustained over time. In fact, our profit per Employee was 43 times higher than our #1 overall competitor in 2014, our 8th year of outperforming them. The excessively high 2013 data point was caused by 2012/13 market surge. In 2014, the market normalized and we are now seeing the beneficial, long-term trend continue. This is an important measure of our SHKR Improvement in productivity & efficiency and an indicator of capacity and capability. The outstanding results on this measure contribute to the sustained positive trends and growth in Net Income (7.5-2/5.1a4). (Department SAOS) (This graph shows additional historical data to better depict the long-term focus on improving efficiency.)
$0
$5
$10
$15
$20
50%
60%
70%
80%
90%
100%
Roun
d-U
p $
x 10
0000
Roun
d-U
p %
NRA Round-Up %
Round-Up % Round-Up % Goal Round-Up $ All Non-MW NRA Endowment $ Contributions (Benchmark)
Better
50%
60%
70%
80%
90%
100%Staffing Strength
Actual Goal
Better
0%
5%
10%
15%
20%Slow Time/Overtime Hours Worked
Slow Time ActualSlow Time/Overtime GoalOvertime ActualFederal Reserve Economic Data (Overtime External)
Better

41
7.3-4 Sales $ per Employee Cost $ (Productivity) is a CKM for the SHKR Improvement in productivity & efficiency and is an indicator of capacity and capability. It is important in balancing our Shareholder Satisfaction and ES&E OGs. Results demonstrate benchmark leadership levels and a beneficial trend sustained over time. In fact, in 2014, MW’s sales per Employee was 52% higher than our #1 overall competitor. Employee cost is our #1 expense, therefore this sustained positive trend significantly contributes to the sustained positive trends in overall lower Cost to Operate (7.5-4) and growth in Net Income (7.5-2), with both of these performing better than benchmarks. (Department SAOS) (This graph shows additional historical data to better depict the long-term focus on improving productivity.)
7.3a(2) What are your WORKFORCE climate RESULTS? What are your current LEVELS and TRENDS in KEY MEASURES or INDICATORS of WORKFORCE climate, including those for WORKFORCE health, safety, and security and WORKFORCE services and benefits, as appropriate? How do these RESULTS differ by the DIVERSITY of your WORKFORCE and by your WORKFORCE groups and SEGMENTS as appropriate?
7.3-5 Safe and Comfortable Work Environment (ES&E Survey) results demonstrate sustained benchmark leadership levels. Our Culture of a “Safe, comfortable, clean, appropriate work environment” encourages Employees to identify safety issues, report all injuries, and work as a team to prevent injuries and safety incidents. This result from our ES&ES (Employee Satisfaction & Engagement Survey) addresses the EKR Safe, comfortable work environment (#2 OG) and improves insurance costs. (Department, Exempt/non-exempt SAOS)
7.3-6a Lost Time results demonstrate sustained benchmark leadership levels. In fact, we have been at zero lost time since 2012, and on April 24, 2015 we celebrated our 4-year anniversary since our last lost time injury. This measure relates directly to ES&E and the EKR Safe, comfortable work environment (#2 OG).
$-
$10
$20
$0
$1
$2
$3Profit $ per Employee Cost $ (Efficiency)
ActualGoalMW Profit $/EmployeeAmazon Profit $/Employee (Competitor)
Better
$250,000
$500,000
$750,000
$1,000,000
$1,250,000
$0
$5
$10
$15
$20
Sale
s $ /
Empl
oyee
Sale
s $/ C
ost $
Sales $ per Employee Cost $ (Productivity)
Actual Goal MW Sales $/Employee Sales $/Employee (Competitor)
Better
50%
60%
70%
80%
90%
100%Safe, Comfortable Work Environment (ES&ES)
Actual
Goal
Society for Human Resource Management (Benchmark)
Better
Competitor

42
7.3-6b Number of Days Away From Work & Restricted Days results demonstrate benchmark leadership levels and a beneficial trend sustained over time. In fact, we have been at zero since 2012 for both days away from work and restricted days. This measure is monitored to ensure the effectiveness of MW’s Return to Work program, which places Employees back into the workforce following a work-related injury. This measure relates directly to ES&E and the EKR Safe, comfortable work environment (#2 OG). (Injury SAOS)
7.3-7 Experience Modification Rate (EMOD) results demonstrate benchmark leadership levels and a beneficial trend sustained over time. In 2015, we were informed by our insurance provider that we have the best EMOD in the State of MO for our industry. EMOD represents our calculated risk factor based on industry type, MW’s loss history and discounts based on safety measures. This measure relates directly to EKR Safe, comfortable work environment (#2 OG) and is important to our ability to control worker’s compensation insurance costs.
7.3-8 Employee Rewards Index results demonstrate sustained benchmark leadership levels. This index is an indicator of the services and benefits provided to our workforce and directly relates to our EKR Competitive benefits (see 5.1b2). Our sustained excellent levels on this measure lead to higher levels of ES&E (#2 OG) (7.3-10a), which leads to higher Profit $ per Employee Cost $ (7.3-3).
Since implementing this as a systematic process in 2014, our strategy to operate in the top quartile has demonstrated benchmark leadership (see 4.1a2). This index is created using a comparative scoring scale based on the level of benefits and services offered by both local, competitor and BAR organizations. (Benefit SAOS)
7.3-9 Employees Compensated at Target results demonstrate benchmark leadership levels and a beneficial trend sustained over time. This is the key indicator of our #1 EKR Competitive salary for my position. Our strategy to pay at the statewide 75th percentile is key in meeting this EKR.This measure was created in 2012 to ensure we fully deploy our strategy. Our sustained outstanding results and beneficial trend on this measure help us maintain high levels of ES&E (#2 OG) (7.3-10a). Our pay strategy exceeds the WorldatWork benchmark of paying at the 65th percentile. (Exempt/non-exempt SAOS)
0.33
0 0 0 00
0.2
0.4
0.6
0.8
1
1.2
1.4Lost Time
MW Goal OSHA MO DOL (Benchmark)
Better
100 0 0 0 0
50100150200250300350
0102030405060
# Tr
ansf
ers
# Da
ys A
way
OSHA Number of Days Away From Work& Restricted Days
Total # Days Away from WorkDays Away GoalOSHA - US (Days Away Benchmark)Total # Transfers/Restriction DaysRestricted Days Goal
Better
0.65
0.75
0.85
0.95
1.05
Experience Modification Rate
Actual GoalIndustry Benchmark State Average (External)
Better
1
1.2
1.4
1.6
1.8
2
2.2
2.4Employee Rewards Index
Actual Top Quartile Goal BAR Avg (Benchmark)
Better
50%
60%
70%
80%
90%
100%Employees Compensated at Target
Actual Goal Benchmark (see text)
Better

43
7.3a(3) What are your workforce engagement RESULTS? What are your current LEVELS and TRENDS in KEY MEASURES or INDICATOR-S of WORKFORCE satisfaction and WORKFORCE ENGAGEMENT? How do these RESULTS differ by the DIVERSITY of your WORKFORCE and your WORKFORCE groups and SEGMENTS as appropriate? In addition to the measures listed here, the following results also demonstrate benchmark leadership levels and beneficial trends: Sales $ per Employee Cost $ (Productivity) (7.3-4) and Innovation Rate (7.1-21). 7.3-10a Employee Satisfaction & Engagement is our #2 OG, confirming our dedication to our Employees. Our best-practice ES&E process has allowed us to consistently improve our level of performance from 76% in 2004 to as high as 87% in 2013. This outstanding trend has led to levels that demonstrate benchmark leadership for overall ES&E (#2 OG), as determined by our ES&E survey. In 2014, we improved our ES&E survey to better align with EKRs (5.2a3) and allow Employees to share improvement ideas directly with the President in EFGs. This improvement also led to a change in the way the measure was reported. Demonstrating leadership level results and an overall greater Employee commitment to the organization, leads to improved efficiency (7.3-3), productivity (7.3-4) and innovation (7.1-21). (Department, exempt/non-exempt, part-time/full-time and EKR SAOS) (This graph shows additional historical data to better depict the long-term focus on improving ES&E.)
7.3-10b Employee Satisfaction & Engagement Segmented by Department It is important for department VPs to understand the satisfaction and engagement levels of their Employees. MK/CS have missing data due to reorganizations. Previous results are included within the other reported departments.
2011 2012 2013 2014 2015 Q3 BAR Proj -
2020 Total Company 81% 85% 87% 86% 83% 86% 86%
SLT 85% 94% 93% 94% 94% 86% 86% ME 87% 84% 86% 82% 85% 86% 86% LO 78% 83% 87% 81% 79% 86% 86% FS 89% 87% 88% 87% 88% 86% 86% HR 89% 95% 93% 89% 84% 86% 86% IS 74% 83% 86% 86% 84% 86% 86% QMS 89% 95% 93% 89% 89% 86% 86% MK n/a n/a n/a 88% 90% 86% 86% CS n/a n/a n/a 82% 82% 86% 86% Goal 85% 90% 86% 86% 86% 86% 86%
7.3-11 ES&E Survey Participation Rate results demonstrate benchmark leadership levels for non-exempt Employees and excellent levels for exempt Employees. Beneficial trends have been sustained over time for both segments. This measure is an
7.3-12 Total Company NRA Participation % results show excellent performance levels and a beneficial trend sustained over time. This is another important indicator of Employee engagement. This measure shows the percentage of Employees with an active NRA membership and is a clear indicator of Employee’s engagement in our Mission as they are solely responsible for buying their membership. This measure is directly related to our SHKR Support the NRA & 2nd Amendment and CKR Support of the 2nd Amendment & Shooting Sports Industry (7.1-7). In February 2015, the IS department achieved 100% NRA participation, an indicator of addressing our SC “Recruiting high-performing, engaged, IT Employees who share our Culture”. (Department SAOS)
50%
60%
70%
80%
90%
100%Employee Satisfaction & Engagement (ES&ES)
Actual Goal Baldrige Recipients (Benchmark)
Better
50%
60%
70%
80%
90%
100%ES&E Survey Participation
ExemptNon-ExemptGoalBeyond Feedback (Benchmark)
Better

44
7.3-13 Voluntary Turnover results show excellent performance levels and a beneficial trend sustained over time. This measure represents the rate full-time Employees have voluntarily left MW. We have seen a sustained decrease in voluntary full-time turnover over the last few years, which is directly related to ES&E (7.3-10a), Employee Rewards Index (7.3-8) and Employees Compensated at Target (7.3-9). Our non-exempt workforce consists of 25% part-time Employees, the majority of which are college students. We monitor turnover for this segment (non-exempt, part-time Employees AOS), however, due to the inherently temporary nature of this segment, we consider the Voluntary Full-Time Turnover measure to be a key indicator of workforce engagement. To continue improving our turnover, we have many APs dedicated to improving ES&E in 2015 (AOS). This measure relates directly to EKR Meaningful, challenging & satisfying job assignment(s). (Exempt/non-exempt, department, part-time/full-time SAOS)
7.3-14 Rewards and Recognition (ES&E Survey) results show excellent performance levels and a beneficial trend sustained over time. Results are nearing benchmark performance and are projected to increase due to our focus on ES&E (5.2a2). This measure relates directly to our EKR Rewards & recognition and is indicative of Employee satisfaction with our R&R processes. (Department SAOS)
7.3a4 What are your WORKFORCE and leader development RESULTS? What are your current LEVELS and TRENDS in KEY MEASURES or INDICATORS of WORKFORCE and leader development? How do these RESULTS differ by the DIVERSITY of your WORKFORCE and by your WORKFORCE groups and SEGMENTS, as appropriate? 7.3-15 Promotions From Within results demonstrate benchmark leadership levels and a beneficial trend sustained over time. These results are a reflection of our “Promote from within” strategy and our Recruitment & Hiring, Performance Management, and Leadership Development processes. Results are also directly related to our Leadership Development Success Rate (7.3-16) and Training Hours per FTE (7.3-19) measures. It is important to our EKR Advancement opportunities and is a key indicator of workforce and leader development. This measure is also important to organizational sustainability and succession planning. (Department SAOS)
40%
50%
60%
70%
80%
90%Employee NRA Participation
Actual Goal Nosler (Industry)
Better
0%
10%
20%
30%
40%
50%
60%Voluntary Full-Time Turnover
Total Company Goal MBS (External)
Better
50%
60%
70%
80%
90%
100%Rewards & Recognition (ES&ES)
Actual Goal Mesa (BAR Benchmark)
Better
50%
60%
70%
80%
90%
100%Promotions from Within
Actual Goal SHRM (Benchmark)
Better
Comparative data
Comparative data
Comparative
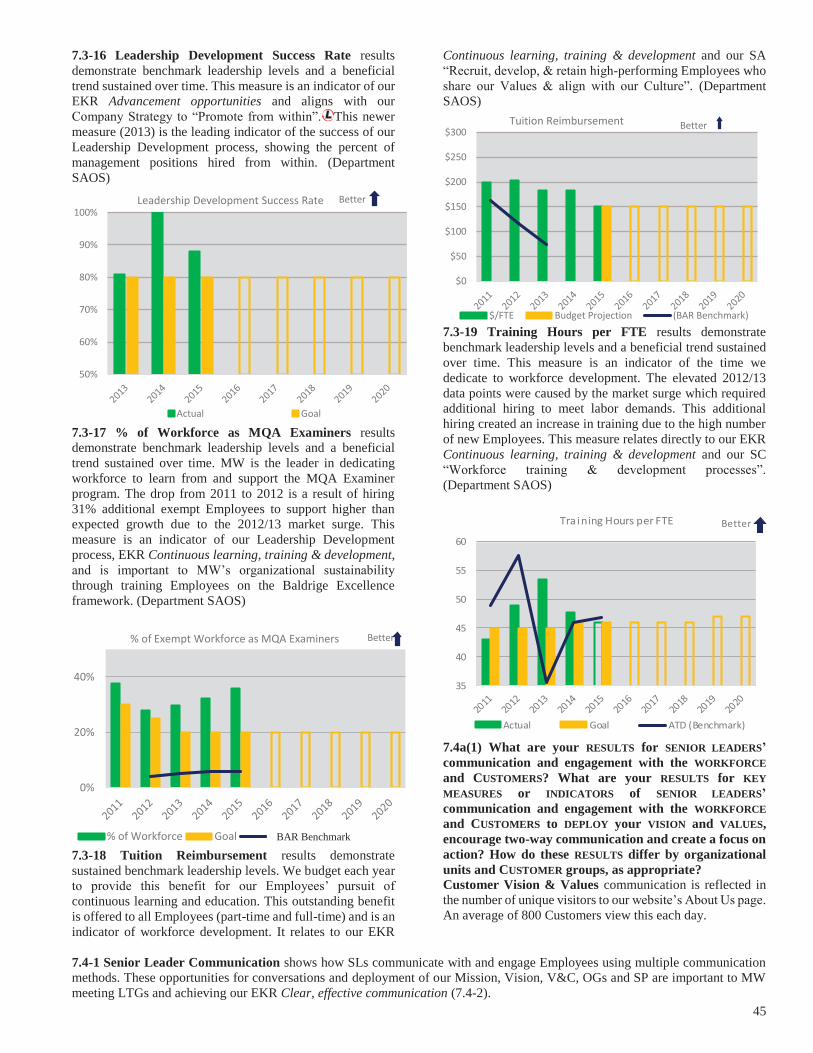
45
7.3-16 Leadership Development Success Rate results demonstrate benchmark leadership levels and a beneficial trend sustained over time. This measure is an indicator of our EKR Advancement opportunities and aligns with our Company Strategy to “Promote from within”. This newer measure (2013) is the leading indicator of the success of our Leadership Development process, showing the percent of management positions hired from within. (Department SAOS)
7.3-17 % of Workforce as MQA Examiners results demonstrate benchmark leadership levels and a beneficial trend sustained over time. MW is the leader in dedicating workforce to learn from and support the MQA Examiner program. The drop from 2011 to 2012 is a result of hiring 31% additional exempt Employees to support higher than expected growth due to the 2012/13 market surge. This measure is an indicator of our Leadership Development process, EKR Continuous learning, training & development, and is important to MW’s organizational sustainability through training Employees on the Baldrige Excellence framework. (Department SAOS)
7.3-18 Tuition Reimbursement results demonstrate sustained benchmark leadership levels. We budget each year to provide this benefit for our Employees’ pursuit of continuous learning and education. This outstanding benefit is offered to all Employees (part-time and full-time) and is an indicator of workforce development. It relates to our EKR
Continuous learning, training & development and our SA “Recruit, develop, & retain high-performing Employees who share our Values & align with our Culture”. (Department SAOS)
7.3-19 Training Hours per FTE results demonstrate benchmark leadership levels and a beneficial trend sustained over time. This measure is an indicator of the time we dedicate to workforce development. The elevated 2012/13 data points were caused by the market surge which required additional hiring to meet labor demands. This additional hiring created an increase in training due to the high number of new Employees. This measure relates directly to our EKR Continuous learning, training & development and our SC “Workforce training & development processes”. (Department SAOS)
7.4a(1) What are your RESULTS for SENIOR LEADERS’ communication and engagement with the WORKFORCE and CUSTOMERS? What are your RESULTS for KEY MEASURES or INDICATORS of SENIOR LEADERS’ communication and engagement with the WORKFORCE and CUSTOMERS to DEPLOY your VISION and VALUES, encourage two-way communication and create a focus on action? How do these RESULTS differ by organizational units and CUSTOMER groups, as appropriate? Customer Vision & Values communication is reflected in the number of unique visitors to our website’s About Us page. An average of 800 Customers view this each day.
7.4-1 Senior Leader Communication shows how SLs communicate with and engage Employees using multiple communication methods. These opportunities for conversations and deployment of our Mission, Vision, V&C, OGs and SP are important to MW meeting LTGs and achieving our EKR Clear, effective communication (7.4-2).
50%
60%
70%
80%
90%
100%Leadership Development Success Rate
Actual Goal
Better
0%
20%
40%
% of Exempt Workforce as MQA Examiners
% of Workforce Goal Concordia (BAR Benchmark)
Better
BAR Benchmark
$0
$50
$100
$150
$200
$250
$300Tuition Reimbursement
$/FTE Budget Projection (BAR Benchmark)
Better
35
40
45
50
55
60
Tra ining Hours per FTE
Actual Goal ATD (Benchmark)
Better

46
Communication Mechanism Initiated By Frequency Audience Hours SL Mentoring SL Quarterly Select LDC 177 BCMs SL Monthly Select LDC 102 DBM VP Monthly DLT, guests 24 Leadership/Management Q&A CEO Monthly Select LDC 24 Pizza with the President President Annual All Employees 18 EFGs President Biannually Select Employees 16 SOTB SL Quarterly DLT, LDC, R&R guests 16 Industry Q&A CEO Monthly Select Employees 12 Supervisor Q&A CEO Monthly LO/CS Supervisors 12 DKS VP Quarterly All Employees 8 New Hire Orientation CEO, President Upon Hire All Employees 4.5 Student Development President, VP-HR Biannually Student Employees 4 Posting Ceremonies SL Upon Revision All Employees 2
7.4-2 Clear, Effective, Candid, Two-Way Communication (ES&E Survey) results show excellent performance levels sustained over time. In 2014 we changed our survey which led to a change in the way this measure was reported. By continually striving to improve this measure towards the benchmark through our ES&E survey and process, we have developed many new communication venues including the new President-led EFGs. Focusing on meeting this measure ensures Employees understand the direction of the organization and have the opportunity to voice their opinion. This KM for the EKR Clear, effective communication helps us achieve our #2 OG ES&E. (Department and exempt/non-exempt SAOS)
7.4a(2) What are your RESULTS for GOVERNANCE accountability? What are your KEY current findings and TRENDS in KEY MEASURES or INDICATORS of GOVERNANCE and internal and external fiscal accountability, as appropriate? 7.4-3 Audit % results demonstrate benchmark leadership levels, at a best practice performance of 100%, that have been sustained over time. These results demonstrate a commitment to maintaining governance and fiscal accountability. Due to this commitment, we project continued best practice performance on this measure of successful financial audits.
2011 2012 2013 2014 2015 Proj. - 2020
Audit % 100% 100% 100% 100% 100% 100%
7.4-4 % of Earnings Paid on Time is the CKM for the SHKR Timely payment of earnings. Our results demonstrate benchmark leadership levels, at a best-practice performance of 100% for both % of Earnings Paid on Time and % of Net Income Distributed, that have been sustained over time. These
are directly related to our SA “Financial strength & outstanding cash flow management” and are critical to our SA “Role model support of the 2nd Amendment & shooting sports industry” and SHKR Key community support, by providing money to support pre-tax contributions (7.4-9). additional historical data to depict our long-term commitment to paying our Shareholders on time.)
2011 2012 2013 2014 2015 Proj. - 2020
% of Net Income Distributed 100% 100% 100% 100% 100% 100%
% Paid on Time 100% 100% 100% 100% 100% 100% 7.4a(3) What are your legal and regulatory RESULTS? What are your RESULTS for KEY MEASURES or INDICATORS of meeting and surpassing regulatory and legal requirements? How do these RESULTS differ by organizational units, as appropriate? 7.4-5 Legal, Ethical, and Regulatory Compliance Report is the CKM for the SHKR Legal, ethical, regulatory compliance and is important to addressing our SC “Increasing/changing or unknown regulations on products”. Our results demonstrate sustained benchmark leadership levels, at a best practice performance of 100%, that have been sustained over time, indicating exceptional legal, ethical and regulatory compliance. In alignment with our V&C, we are committed to running 100% legally and ethically within the regulatory environment under which we operate (P.1a5). The LERC result and report are reviewed by the BOD and SLT for compliance with laws, regulations and Company V&C to ensure our sustained best practice performance. (This chart shows additional historical data to depict our long-term commitment to legal, ethical and regulatory compliance.)
2007 2008 2009 2010 2011 Percent Compliant
100% 98.6% 99.3% 97.3% 98.7% 2012 2013 2014 2015 Proj. - 2020 95.4% 96.1% 96.1% 100% 100%
7.4-6 ISO Registration results have been at a best practice level of 100% since its creation in 2008. We became ISO 9001:2000 registered in 2008 and have successfully completed 5 continuing assessment audits and 2 recertification audits with no major findings; one of which registered us to the new ISO 9001:2008 standard. ISO certifies MW maintains its Quality Policy and proper documentation of our 750+ processes that are reviewed once per year; which helps ensure ongoing
50%
60%
70%
80%
90%
100%
Clear, Effective, Candid, Two-Way Communication (ES&ES)
Actual Goal NBRI (Benchmark)
Better

47
improvements to productivity (7.3-4), efficiency (7.3-3) and that Employees have the Right tools to do my job (EKR).
2011 2012 2013 2014 2015 Proj. - 2020
ISO Registration 100% 100% 100% 100% 100% 100%
7.4a(4) What are your RESULTS for ETHICAL BEHAVIOR? What are your RESULTS for KEY MEASURES or INDICATORS of ETHICAL BEHAVIOR, breaches of ETHICAL BEHAVIOR, and STAKEHOLDER trust in your SENIOR LEADERS and GOVERNANCE? How do these RESULTS differ by organizational units, as appropriate? In addition to measures listed here, see LERC Report (7.4-5). 7.4-7 Friendly, Courteous, Respectful, Ethical Relationship (S/P Satisfaction Survey) results demonstrate benchmark leadership levels sustained over time. This result is from our S/P Satisfaction survey and is directly related to SPKR Friendly, courteous, ethical relationship (#3 OG). (Supplier & Key Partner and Product Category SAOS)
7.4-8 Leaders & Coworkers Whose Actions Align with Values & Culture (ES&E Survey) results demonstrate benchmark leadership levels and a beneficial trend sustained over time. This is the direct measure of our Employee’s perception of ethical behavior within MW. This is the KM for the EKR Leaders & coworkers whose actions align with our Values & Culture and is closely related to EKR Relationship with my coworkers & leaders (#2 OG). (Department SAOS)
7.4a(5) What are your RESULTS for societal responsibilities and support of your KEY communities? What are your RESULTS for KEY MEASURES or INDICATORS of your fulfillment of your societal responsibilities and support of your KEY communities? In addition to measures listed here, Total Company NRA Participation (7.3-12), NRA Round-Up Percentage (7.2-9) and % of Exempt Workforce as MQA Examiners (7.3-17) are indicators of fulfilling societal responsibilities and key community support..
7.4-9 Percent of Pre-Tax Contributions is a CKM for the SHKRs Key community support and Support the NRA and 2nd Amendment. Our results demonstrate benchmark leadership levels that have been sustained over time. Our performance levels have been at the benchmark IRS 50% maximum contribution level since 2011. Since 2008, MW has made over $100 million in charitable contributions resulting in an industry leader level support of the NRA, 2nd Amendment and our key communities. (This graph shows additional historical data to depict our long-term commitment to supporting key communities.)
7.4b What are your RESULTS for the achievement of your organizational strategy and ACTION PLANS? What are your RESULTS for KEY MEASURES or INDICATORS of the achievement of your organizational strategy and ACTION PLANS? What are your RESULTS for building and strengthening CORE COMPETENCIES? What are your RESULTS for taking INTELLIGENT RISKS? 7.4-10 SP Execution results demonstrate benchmark leadership levels and a sustained beneficial trend over time. MW consistently outperforms all other organizations, who have an upper average of 73%. (This comparative data includes results from over 90 organizations.) Our benchmark leadership levels on this measure are key to providing our SA “Strategic planning” and obtaining our SOs and OGs (7.4-11). (Department SAOS) (This graph shows additional historical data to better depict the long-term focus on results in this area.)
50%
60%
70%
80%
90%
100%
Friendly, Courteous, Respectful, Ethical Relationship (SPSS)
Actual Goal Comp. (Benchmark)
Better
50%
60%
70%
80%
90%
100%
Leaders and Coworkers Whose Actions Align with Our Values and Culture (ES&ES)
Actual Goal (BAR Benchmark)
Better
0%
20%
40%
60%
$-
$10
$20
$30
$40
Cont
ribut
ion
% o
f Pre
-Tax
In
com
e
Cont
ribut
ion
$ in
Mill
ions
Percent of Pre-Tax Contribution
Contribution $ Contribution $ Goal Contribution % Contribution % Goal IRS (% Benchmark)
Better

48
7.4-11 Performance Toward Accomplishing SOs and OGs Our SPP is designed to meet OGs through SOs. This result shows we have sustained excellent performance levels over time toward accomplishing our OGs and SOs. Satisfying our stakeholders and meeting SHKRs measures the effectiveness of our SP including building and strengthening CCs and taking intelligent risks. In 2015, we added 3 new SOs (Fig. 2.1-2); results for these new SOs are tracked monthly (AOS). (This chart shows additional historical data to better depict the long-term focus on results in this area.)
7.4-12 Receipt of Baldrige Award is a clear indicator of achieving our organizational strategy to use Baldrige as our leadership and management framework. Receiving the Baldrige Award every 6 years is a SHKR. We also have a new LTG to receive the MQA every 3 years using this as a development tool for our LDCs. We first received the MQA in 2008 and the Baldrige award in 2009. We project we will continue to meet this SHKR in 2015 and the long-term planning horizon due to our commitment to training our future leaders on the Baldrige Excellence Framework (7.3-17).
2009 2010 2011 2012 Baldrige Award 100% 100% 100% 100%
2013 2014 2015 Proj Proj. - 2020 100% 100% 100% 100%
7.5a(1) What are your financial PERFORMANCE RESULTS? What are your current LEVELS and TRENDS in KEY MEASURES or INDICATORS of financial PERFORMANCE, including aggregate MEASURES of financial return, financial viability, and budgetary PERFORMANCE, as appropriate? How do these RESULTS differ by market SEGMENTS and CUSTOMER groups, as appropriate? In addition to measures listed here, another indicator of financial performance is Percent of Earnings Paid on Time (7.4-4). In our one market segment, we have one contributing Customer group to financial performance: active Customers.
7.5-1 Gross Sales Dollars is the CKM for the SHKR Growth in sales and is a significant factor to ensure our ongoing success. Our results demonstrate benchmark leadership levels and a beneficial trend sustained over time. We have been one of the fastest growing companies in our industry over the past 11 years at 21.3% growth, growing at over 3 times the average industry growth rate (6.9%; 2008-14) and over 2 times the average growth rate of our #1 industry competitor (9%; 2005-14). This has been driven by our increase in CSAT (7.2-1a), ability to negotiate allocations of product with Suppliers, Supplier Satisfaction (7.1-29a/b) and agility in response to rapidly changing market conditions. We project to continue this outstanding trend in growth for the 5-year planning horizon, based on planned Customer acquisition and growth in product offering. (Product category, promotion SAOS) (This graph shows additional historical data to better depict the long-term focus on improving results in this area.)
50%
60%
70%
80%
90%
100%Strategic Plan Execution
Actual Goal KPI Library (External)
Better
50%
60%
70%
80%
90%
100%
Customer Satisfaction Employee Satisfaction &Engagement
Supplier & Partner Satisfaction Shareholder Satisfaction
Performance Toward Accomplishing SOs and OGs
2009 2010 2011 2012 2013 2014 2015 Goal 2016 2017 2018 2019 2020
Better

49
7.5-2 Net Income as a Percentage of Net Sales is the CKM for the SHKR Growth in net income and is key to our EKR Organizational sustainability & growth. Our results demonstrate benchmark leadership levels and a beneficial trend sustained over time. In fact, we have sustained substantial 43.8% average growth per year since 2004; considerably better than our benchmark and our #1 overall competitor. This has been driven by our increases in productivity (7.3-4), strategic planning (7.4-10), management of inventory turns (7.1-28) and growth in sales (7.5-1). (This graph shows additional historical data to better depict the long-term focus on improving results in this area.)
7.5-3 Gross Margin % is directly related to SHKR Growth in net income. Results demonstrate benchmark leadership levels and a beneficial trend sustained over time; considerably better than our benchmark and #1 overall competitor. In 2014, MW implemented a new strategy to lower shipping charges to Customers, resulting in a lower planned gross margin % for 2015 and future years, to meet our Customer’s #2 CKR, Low-cost shipping (7.1-2). (This graph shows additional historical data to better depict the long-term focus on this area.)
7.5-4 Cost to Operate is directly related to SHKR Growth in net income. Results demonstrate benchmark leadership levels and a beneficial trend sustained over time; considerably better than our benchmark and #1 overall competitor. Operating expenses are closely managed through the Budgeting process which is integrated with the SPP. Through efficiency (7.3-3), we have reduced operating costs by 6 points from 2004–15, directly improving SHKR Growth in net income (7.5-2). Lower operating costs have also enabled us to reduce shipping charges to achieve CSAT (7.2-1a). (Additional historical data is shown to better depict long-term improving trend.)
-20%
-10%
0%
10%
20%
30%
40%
$0
$100
$200
$300
$400
$500
$600Gr
oss S
ales
$ in
Mill
ions
Sales Goal % Growth (+/-)% Growth Goal Cabela's % Growth (+/-) (Benchmark) RMA % Growth (Industry Average)
Gross Sales Trend
Annu
alPe
rcen
t Gr
owth
Better
0%
5%
10%
15%
20%
25%
$0
$10
$20
$30
$40
$50
$60
$70
Net
Inco
me
$ in
Mill
ions
Net Income Goal % of Net Sales Comp. % of Net Sales (Competitor) RMA (Benchmark)
Net Income
Net
Inco
me
% o
f Net
Sal
es
0%
10%
20%
30%
40%
50% Gross Margin %
Actual Goal (Competitor) RMA (Benchmark)

50
7.5-5 Return on Assets results demonstrates benchmark leadership levels and a beneficial trend sustained over time; considerably better than our benchmark and #1 overall competitor. This directly measures our efficiency in using assets to generate income and is a direct result of excellent inventory turns performance (7.1-28) and Supplier Financed Inventory (AOS). Our budget and SPP ensure we sustain these results into the future.
7.5-6 Profit Sharing Distribution results demonstrate benchmark leadership levels and a beneficial trend sustained over time. Shareholders distribute profit to Employees to R&R for service and performance. In 2014, profit sharing was paid to Employees at a pro-rated amount in line with gross sale performance to goal (7.5-1). Although we have paid profit sharing for 11 years, in 2007 we created a systematic approach to determining distribution amount. (Additional data included to show long-term trends.)
7.5a(2) What are your marketplace PERFORMANCE RESULTS? What are your current LEVELS and TRENDS in KEY MEASURES or INDICATORS of marketplace PERFORMANCE, including market share or position, market and market share growth, and new markets
entered, as appropriate? How do these RESULTS differ by market SEGMENTS and CUSTOMER groups, as appropriate? 7.5-7 Dun and Bradstreet Paydex Rating results demonstrates benchmark leadership levels and a beneficial trend sustained over time. We are well above the benchmark (average days to pay) as reported by independent agency, Dun and Bradstreet. This measure is directly related to S/PKR Timely payment. Per the benchmark, we consistently outperform our industry competitors.
7.5-8 Market Share/Market Share Growth shows we continue to gain market share in our core categories. We have been one of the fastest growing companies in our industry over the past 11 years at 21.3% growth, growing at over 3 times the average industry growth rate (6.9%; 2008-14) and over 2 times the average growth rate of our #1 industry competitor (9%; 2005-14). We continue to leverage Supplier relationships to drive industry leading growth. (Additional market share SAOS)
0%
10%
20%
30%
40%
50%Cost to Operate
% Net Sales Goal RMA (Benchmark) Amazon (Competitor)
Better
Comparative data
0%
40%
80%
120%
160%Return on Assets
Actual GoalAmazon (Industry) RMA (Benchmark)
Better
0
3
6
9
$0
$1
$2
$3
Payo
ut $
/ Em
ploy
ee in
Th
ousa
nds
Prof
it Sh
arin
g Pa
yout
$ in
M
illio
ns
Profit Sharing Distribution
Profit Sharing Payout ($) Projected Payout ($)MW $/Employee $/Employee (BAR Benchmark)
Better
76
77
78
79
80
81
82Dun & Bradstreet Paydex Rating
Actual Goal D&B (Benchmark)
Better
Confidential information removed