managaccount_ch11
TRANSCRIPT

8/12/2019 ManagAccount_Ch11
http://slidepdf.com/reader/full/managaccountch11 1/43
00 M A N A G E M E N T A C C O U N T I N G . P R I N C I P L E S A N D A P P L I C A T I O N S00C H A P T E R 3 • C O S T F L O W S
Objectives
By the end of this chapter you will be able to: Page
1. Explain what is meant by differential costing 323
2. Differentiate between relevant and irrelevant data for decisions 323
3. Define some terms used in differential costing 323
4. Distinguish between quantitative and qualitative data and informationfor decisions 327
5. Analyse the benefits and costs for some decisions: advertising; acceptor reject special order prices or offers; make or buy a product or
component; add, modify or drop a ser vice, product or department;sell now or process further; shut down or seasonal closure 327
6. Explain when and how linear programming is used for decisions 345
7. Solve some simple constraint problems using graphical analysis 345
11
Differentialcosting andlinear programming
00C H A P T E R 3 • C O S T F L O W S
Manag Account-Chap 11 17/6/02 2:54 PM Page 322

8/12/2019 ManagAccount_Ch11
http://slidepdf.com/reader/full/managaccountch11 2/43
323C H A P T E R 1 1 • D I F F E R E N T I A L C O S T I N G A N D L I N E A R P R O G R A M M I N G
Introduction Differential costing is not an alternative costing method. It involves analysing
data and providing information that will assist in making decisions. Despite itsname, the data used in the analysis is not restricted to the possible costsinvolved in a decision but also to revenues. Decisions also need to take intoaccount some factors that are difficult to put a dollar value on, and thesequalitative factors must be included in any report to decision makers.
Any decision requires examining the difference between the costs and thebenefits of alternate proposals. This is where the term ‘differential costing’ comesfrom—an analysis of the difference in costs and/or benefits between two or morecompeting proposals. This chapter looks at a number of situations in whichquantitative and qualitative information is required. The chapter finishes withan introduction to linear programming, a technique that is used when there areconstraints on the available resources which will affect decisions.
Relevant and irrelevant dataRelevant costs (and revenues) are those that will affect, or be affected by, the decision.For example, a business has to make a decision on whether it should produce an extra100 items or not. The total cost of raw material for these 100 items, where each itemrequires $100 of raw material, is relevant to the decision. If the items are made, theraw material cost will go up by $10 000—that is, the difference in raw material costsbetween the two alternatives (to make or not make the items) is $10 000. If the extra100 units might affect the current selling price, this is also a relevant factor but much
more difficult to quantify (put a dollar value on).Irrelevant costs (and revenues) are those that will not be different regardless of thedecision. If, in the example above, the factory rates of $15 000 per annum will notchange regardless of whether the 100 units are made or not, the cost of these rates isnot relevant. The rates will be $15 000 per annum whether or not the extra items aremade. Irrelevant data should be ignored when providing information for decisions.
Relevant information is, therefore, the information that has a bearing on thefuture and is different for the alternatives that are part of the decision.
Which costs are relevant depends on the decision being made, and a number of different types of decisions will be examined in this chapter. Deciding which costs,revenues and qualitative data are relevant is the first and a difficult step in any analysis.With some categories of costs the degree of relevance is fairly easy to determine. Some
of the categories of costs and their degree of relevance are outlined below.Historical costs
Decisions are made about the future—you cannot decide on something that hasalready occurred. You can learn from past decisions but you cannot change them oncethey have been implemented. Accountants may use historical cost data as a basis for
Manag Account-Chap 11 17/6/02 2:54 PM Page 323

8/12/2019 ManagAccount_Ch11
http://slidepdf.com/reader/full/managaccountch11 3/43
324 M A N A G E M E N T A C C O U N T I N G . P R I N C I P L E S A N D A P P L I C A T I O N S
predicting the future. The historical cost data produced from a normal costing systemis not of itself relevant data to be used in the decision, but the predictions based onthose historical costs may be relevant to the decision.
Example 11.1
Benjamin’s Plastics rents industrial factory space and has plastic extruding machinery that isworking at about 75% capacity. This computer controlled machinery cost $118 800 two yearsago. A toy manufacturer and assembler has asked for a quotation for the supply of doll par ts,which would require some additional casual labour and overtime.
The historical cost of the extruding machinery is not relevant to this decision as there isspare capacity. Benjamin’s Plastics cannot decide not to purchase the machinery! Thepredicted additional cost of casual labour and overtime is relevant to this decision as thesecosts will be incurred in the future if the quotation is accepted and the doll parts are made.
Self-test problem 11.1
Indicate which of the following costs are historical costs:
(a) Cost of machinery purchased one year ago.(b) Expected increase in casual labour costs due to accepting a new order.(c) Amount paid for setting up and incorporating the business.(d) Budgeted sales revenue from additional sales.(e) Special packing that will be required if an overseas order is accepted.(f) Pallets purchased last year for stacking inventory of raw materials.(g) The cost of clothes purchased by a retailer that are on sale at a reduced price because
they are out of fashion.(h) The cost of new machinery that is being considered as a replacement in the next
financial year.
Sunk costsSunk costs are historical costs. They are costs that have already been incurred. Sunk costsare irrelevant to any decision as they cannot be changed by a decision now or in thefuture. The historical costs in Example 11.1 and Self-test problem 11.1 were sunk costs.
Self-test problem 11.2
Sydney Coach Builders has some obsolete (but new) seats that are in the books at theoriginal cost of $58 000. These seats are no longer used in new coaches being built as they do not comply with NSW seat belt regulations. These seats could be modified to comply withregulations at an expected cost of $24 000, which would give a saving of $52 000 on buyingnew seats. South-West Treks Pty Ltd of Tasmania still operates coaches that were built with
the old seats and have offered to purchase the entire stock for $34 000.(a) Which cost is a sunk cost?(b) Which of the figures is not relevant?(c) What should Sydney Coach Builders do—sell the old seats and buy new ones or modify
the old seats? Provide figures to support your answer.(d) If South-West Treks only offered $27 000, would your advice to Sydney Coach Builders be
different? Why?
Manag Account-Chap 11 17/6/02 2:54 PM Page 324

8/12/2019 ManagAccount_Ch11
http://slidepdf.com/reader/full/managaccountch11 4/43
325C H A P T E R 1 1 • D I F F E R E N T I A L C O S T I N G A N D L I N E A R P R O G R A M M I N G
Imputed costs
Imputed costs do not actually involve a cash outlay and they are not recorded in theledger. These costs are hypothetical costs that represent the value of a resource used.Examples of imputed costs include the interest cost of capital invested, salary cost of asole proprietor and rental value of buildings owned. While these imputed costs are notrecorded in the books of account, they are relevant and important in arriving at validcomparisons. They bridge the gap between accounting for costs and economic reality.
Imputed costs may also be classified as opportunity costs, which are discussedbelow.
Example 11.2
Ebis MM Pty Ltd has a multimedia product it would like to develop. It is looking to buy anestablished business that has the expertise and equipment to carry out the development.Two businesses are on offer, one owned by a sole trader and the other a limited liability company. The sole owner acts as the manager for the sole-trader business. If the sole-
trader’s business is purchased, Ebis will need to employ a manager. Summary profitstatements and return on capital for the current year show:
Sole-trader business Company business$ $
Sales 489 900 740 000less Expenses
Materials 189 760 285 940Salaries and wages—general 87 600 140 700Manager’s salary 105 000Other overheads 54 000 81 550
331 360 613 190Net profit (before income tax) $158 540 $126 810Capital of the business $3 000 000 $3 000 000
Rate of net profit (before tax) on capital 5.3% 4.2%
To make a valid comparison between these two businesses, the figures for the soletrader might be ‘adjusted’ by imputing (adding in) a manager’s salary (if this business ispurchased a salary will need to be paid to replace the sole owner). Other possible imputedfigures will depend on the methods of financing the purchase of either business. If amanager’s salary is an imputed cost and estimated at $105 000 per annum, the net profit of the sole trader’s business will be $53 540 and the rate of return on capital is 1.8%. Giventhese comparative figures, a purchase price for each business can now be established.
Self-test problem 11.3
Indicate which of the following would give rise to an imputed cost when a decision about alter-natives is to be made. Discuss how the imputed cost would be calculated.
(a) A loan of $100 000 to a supplier as part of a purchase contract at a rate of interest thatis 4% below similar risk loans.
Manag Account-Chap 11 17/6/02 2:54 PM Page 325

8/12/2019 ManagAccount_Ch11
http://slidepdf.com/reader/full/managaccountch11 5/43
326 M A N A G E M E N T A C C O U N T I N G . P R I N C I P L E S A N D A P P L I C A T I O N S
(b) Labour has been paid for time taken to install new machinery.(c) An investment in a capital asset.(d) A sole trader provides his/her personal car to the business.(e) Electricity cost incurred and paid.(f) Partners in a trading partnership do not draw salaries.
Opportunity costs
In general, opportunity costs exist whenever a scarce resource has multiple uses. Anopportunity cost is the value of one alternative forgone by deciding on another use of the resource. For example, using funds (a resource) to invest in one particular assetmeans that the alternative earnings from using those funds is forgone (passed up).Opportunity costs are taken into consideration when making decisions because theearnings from alternative uses must be compared.
Opportunity costs measure sacrifices associated with alternative opportunities. If there is no sacrifice, no opportunity cost exists. Resources such as factories,equipment, money, time and employee talent may all have opportunity costs.Opportunity costs may be relevant to a particular decision but may be overlooked inpractice because it may be difficult to put a value on them.
Example 11.3
K. & N. Canteens Pty Ltd operates a number of canteens in colleges throughout Victoria. Onecanteen needs remodelling to cater for an increased number of students. This remodellingwill take two weeks. What opportunity cost is involved and how would K. & N. Canteensminimise this cost?
Solution
While the canteen is closed, no sales will be made. The opportunity cost is the lost contribu-tion margin on those sales. This cost would be minimised by closing down and remodelling
during a holiday break.
Self-test problem 11.4
Hills Warehouse & Transport Pty Ltd leases a warehouse at $25 000 per month. Manage-ment is considering alternatives for using available space. Two alternatives are:
(a) sublease the space for $5000 per month;(b) use the space as a turn-around area for a new route—expected net revenues amount to
$52 800 per annum.
For each of these alternatives, indicate what the opportunity cost is. Which alternative wouldyou recommend?
Future costs/benefits
As the name implies, future costs or benefits are those that are expected or budgeted.Decisions are made about the future so these are the costs or benefits that are used inmaking a decision. Future costs or benefits are not necessarily all relevant. When afuture cost or benefit is the same under two proposals it is not relevant.
Manag Account-Chap 11 17/6/02 2:54 PM Page 326

8/12/2019 ManagAccount_Ch11
http://slidepdf.com/reader/full/managaccountch11 6/43
327C H A P T E R 1 1 • D I F F E R E N T I A L C O S T I N G A N D L I N E A R P R O G R A M M I N G
You should now be able to do Question 11.1.
Quantitative and qualitative data and informationAccountants usually provide data or information expressed in numerical terms. Dataor information that is stated in numbers is known as quantitative data. Typically,these numbers will show which alternative gives the higher profit or the least cost.Decisions are rarely made based on quantitative information alone. Other factorscannot be expressed effectively in numerical terms but must be considered whenmaking a rational decision. These are called qualitative factors. For example, whenconsidering a long-term supply contract, management would need to take into consid-eration the reputation of the supplier, the supplier’s quality control, whether thesupplier will deliver on time, the financial position and future stability of the supplier,and alternative suppliers if the one selected were to cease business. If the supplier is inan overseas country, the stability and political situation in that country will also needto be considered.
The different decisions in the remainder of this chapter consider both the quanti-tative and the qualitative factors involved.
Self-test problem 11.5
For each of the following factors, indicate whether it is a qualitative or a quantitativefactor in a decision:(a) The cost of materials expected to be consumed in manufacturing a product.(b) The cost of importing raw materials.(c) The political stability in an overseas country from which supplies may be purchased.(d) The possible loss of customer goodwill from closing down a product line.(e) The possible loss of current customers by selling some product at a special shor t-term
price to only one new customer.(f) Future government policy on the GST.(g) A product sold in Australia requires 10% added for the GST whereas export sales of this
product are currently GST-free.(h) A soft drink manufacturer has obtained a long-range weather forecast for the forthcoming
summer and this indicates very hot and dry conditions.(i) The budgeted sales of soft drinks for the predicted very hot and dry summer.(j) The perceived environmental impact of building an oil refining plant on the Derwent River
in Tasmania.
Differential cost analysisThere are two main ways in which the data can be analysed and presented asinformation:1. present total figures for the alternatives in columns and show a final column for
differences; or
Manag Account-Chap 11 17/6/02 2:54 PM Page 327

8/12/2019 ManagAccount_Ch11
http://slidepdf.com/reader/full/managaccountch11 7/43
328 M A N A G E M E N T A C C O U N T I N G . P R I N C I P L E S A N D A P P L I C A T I O N S
2. present only the differences, or increments, in revenues and costs (the reason whythis topic is also called ‘incremental costing’).In the decisions that follow, you should try and present the information in ways
that will be easy to follow by managers who may not necessarily be accountants.Include both qualitative and quantitative information in answers, and only includeinformation that would be relevant in arriving at a rational decision.
Most of the decisions that follow are short-term, non-routine decisions. Thismeans that they are one-off decisions that are not major strategic decisions. Strategicdecisions involving large amounts of finance usually affect the business over a numberof years and may change the way it does business or finances operations. Short-termdecisions, on the other hand, often ignore the time value of money as they areassumed to be for a short period of time.
Advertising
Many businesses will set an advertising budget for the year and that amount is spent.Often there is no analysis on the effectiveness of such advertising and advertising isseen as a means of keeping the product or the business name in the public’s ‘eye’.There are occasions when a particular advertising expenditure is decided upon for aparticular project (e.g. the launch of a new product) or in an effort to increase thesales of a current product. This advertising expenditure must be justified and issubject to management decision.
A lot of judgment is required in determining how much advertising will increasesales. It is one of the more difficult problems that business managers have to dealwith. You would probably be aware of some companies that ask you where you heardabout them (e.g. newspapers, television, radio, telephone). They do this so that theycan get some idea of how effective their advertising strategies are.
If management decides to spend more on advertising, it needs to know what typeof advertising to spend it on (e.g. television, radio, newspaper, mail drops).
Advertising costs in each sector of the media would need to be compared withprojected benefits from each type of advertising. Remember that the extra cost of advertising needs to be compared with the extra ‘margin’ from sales generated by theadvertising.
Example 11.4
If a publisher has an overall margin of 33 1/ 3% from its sales, by how much would sales needto increase to pay for an advertising expenditure of $30 000?
The answer is not $30 000. The answer is $30 000/0.333 = $90 000.This is because the ‘cost of sales’ also increases when sales increase. In our example,
sales of $90 000 mean that there would be costs incurred in publishing the books. As themargin is 33 1/ 3%, the cost would be 66 2/ 3% of $90 000, namely $60 000. Therefore, saleswould have to increase by $90 000 to pay for the extra advertising expense of $30 000.Naturally, management would prefer sales greater than $90 000 so that additional profit canbe earned.
Manag Account-Chap 11 17/6/02 2:54 PM Page 328

8/12/2019 ManagAccount_Ch11
http://slidepdf.com/reader/full/managaccountch11 8/43
329C H A P T E R 1 1 • D I F F E R E N T I A L C O S T I N G A N D L I N E A R P R O G R A M M I N G
Self-test problem 11.6
If a retailer has an overall margin of 20% from its sales, by how much would sales need toincrease to pay for an advertising expenditure of $36 000?
You should now be able to do Question 11.2.
An analysis of advertising is often carried out on an incremental basis. Theobjective is to determine the point at which extra money spent on advertising nolonger produces an increase in the total contribution margin.
Example 11.5
Epsanal Pty Ltd makes ice and ice-cream products sold under its own brand name. The
manager of the ice products division has proposed an increase in the advertising budget inNovember and December as new flavours and packaging are being introduced. A marketanalysis for the forthcoming six months 1 October to 31 March shows the following budgetedsales of cartons with varying increases in advertising expenditure:
Cartons
No increase in adver tising budget 17 800An increase of $25 000 in advertising 20 300An increase of $50 000 in advertising 22 300
The sales price of $38 per carton and the unit variable costs of $27 per carton are notexpected to change over the six months. Fixed selling and administrative costs allocated tothe ice division, excluding the additional advertising, are expected to be $125 000 for the six
months.Should the advertising budget be increased? Explain.
Solution
The contribution margin per carton is $11 (sales price of $38 less unit variable cost $27).
Total analysis
Advertising level Present Plus $25 000 Plus $50 000Cartons 17 800 20 300 22 300Contribution margin $195 800 $223 300 $245 300Selling and administrative $125 000 $150 000 $175 000Net profit $70 800 $73 300 $70 300
Incremental analysis
Advertising level Plus $25 000 Plus $25 000Increase in car tons sold 2 500 2 000Increase in contribution margin 27 500 $22 000Additional advertising cost $25 000 $25 000Increase (decrease) in net profit $2 500 ($3 000)
Manag Account-Chap 11 17/6/02 2:54 PM Page 329

8/12/2019 ManagAccount_Ch11
http://slidepdf.com/reader/full/managaccountch11 9/43
330 M A N A G E M E N T A C C O U N T I N G . P R I N C I P L E S A N D A P P L I C A T I O N S
It can be seen from this relatively simple decision that profit will probably increase if advertising is increased by $25 000. Spending a further $25 000 (i.e. $50 000 in total) willactually reduce profit overall even though sales will increase.
Notice that the contribution margin was used in the answer. This is a usual technique inshort-term decisions, and where the total contribution margin exceeds any increases in fixedcosts, the proposal would be accepted.
Self-test problem 11.7
A. D. Manufacturing Company has spent $289 780 on the research and development of adigital board that improves the graphics on inexpensive computers. The manager of Researchand Development estimates that it will take another $86 000 to finish development and tomake the board a marketable product. The sales team has surveyed the market and hasprovided the following estimates of advertising launch costs and the resulting sales levels forthe first six months of sales:
Advertising Sales$ Units
40 000 13 00080 000 19 000
100 000 24 000120 000 26 000140 000 27 000
The projected selling price is $38.00 per board and the cost accountant has estimatedunit variable manufacturing and distribution costs at $30.00 per board. The current fixedmanufacturing and administration costs are $381 520 per annum and this amount is notexpected to change if this product is made. The advertising launch costs are not included inthe cost accountant’s figures.
Management must make a decision on whether or not to complete the development and
the amount to spend on launching the product. Advise management and provide a report onthe quantitative factors.
You should now be able to do Question 11.3.
Accept or reject a special order
Setting the price for a one-off order is a short-term decision that depends not only onthe economic analysis (e.g. special price, costs involved and resulting profit on theorder) but several qualitative factors. This decision is not about setting the normalselling prices of products, which is a substantial topic deserving a chapter of its ownand requiring a thorough economic and marketing analysis.
A special order may be received with an offer price that may be below the normalselling price. In fact, the price may be below the apparent full cost. At first sight itmay seem sensible to reject an offer that is below normal selling price, especially if theprice is below our calculated total unit cost.
Manag Account-Chap 11 17/6/02 2:54 PM Page 330

8/12/2019 ManagAccount_Ch11
http://slidepdf.com/reader/full/managaccountch11 10/43
331C H A P T E R 1 1 • D I F F E R E N T I A L C O S T I N G A N D L I N E A R P R O G R A M M I N G
You should recall from earlier chapters that a unit cost that includes allocatedfixed costs might not be the appropriate cost for making decisions. The factors thatyou need to consider in most decisions on accepting or rejecting a special offer are:Quantitative factors:• Unit special selling price.• Unit variable cost of making, selling and distribution.• The contribution margin per unit on this order (this is, of course, the result of the
above two factors—selling price less variable cost. If there is no contributionmargin, then the special price would be unacceptable in economic terms.
• Any additional special costs that may be incurred on this order (e.g. specialpacking for an export order). These are deducted from the contribution margin toestablish if there is still a positive profit on the order. If there is a profit on theorder, the qualitative factors will need to be considered (remember that qualitativefactors are those that would be difficult to value in dollar terms).
Qualitative factors in special order decisions:• The effect on current customers of accepting this order. Customers who found out
about a special price given to another customer would not be happy and there is,therefore, a possibility of losing future sales (with the consequent loss of thecontribution margin on those sales) and the loss of customer goodwill.
• Spare capacity must be available and, therefore, current fixed costs will not beaffected. If there is no spare capacity available, the opportunity cost of thefacilities used on the special order will need to be added in to the relevant costs.
• Even if the present special order price is not profitable, the prospect of increasingmarket share might lead to a decision to accept the special price.
Example 11.6
Poly-Flooring Manufacturing Pty Ltd makes and sells vinyl flooring in sheets and tiles. Thepresent factory facilities are operating at about 80% capacity, producing 78 000 squaremetres of varying thickness.
One of the products produced is an antistatic vinyl sheet that can be hot-air weldedtogether to form seamless flooring and wall covering. This is used in hospitals and laborato-ries as it is easier to keep germ-free. The normal selling price throughout Australia is $8.00per square metre, excluding freight. A summary of production costs for making 11 000square metres of this product in the last six months shows:
Total Per metre$ $
Direct raw materials 9 350 0.85Packing materials 2 750 0.25Direct labour 15 400 1.40
Variable manufacturing overhead 3 300 0.30Fixed manufacturing overhead 20 900 1.90Variable selling and administrative overhead 2 750 0.25Fixed selling and administrative overhead 11 550 1.05
$6.00
Manag Account-Chap 11 17/6/02 2:54 PM Page 331

8/12/2019 ManagAccount_Ch11
http://slidepdf.com/reader/full/managaccountch11 11/43
332 M A N A G E M E N T A C C O U N T I N G . P R I N C I P L E S A N D A P P L I C A T I O N S
An agent in the Philippines states that he can obtain a contract for the supply of 6000square metres of antistatic sheeting at A$4.20 per square metre. The agent would beentitled to 10% commission on the sale price. Special export packaging would cost anadditional $2400 on this order. Freight and insurance on this order, not included in the sellingprice, would cost $1500.
Advise management on whether the order should be accepted or rejected.
Solution
As the capacity using the current facilities is 97 500 square metres, there is availablecapacity. Fixed manufacturing costs will, therefore, not change and are not relevant to thisdecision. It is assumed that both variable and fixed selling and administrative costs will alsonot be affected by this decision and are, therefore, not relevant.
$ $Sales price 4.20less Variable manufacturing costs
Direct raw materials 0.85Packing (present) 0.25
Direct labour 1.40Variable factory overhead 0.30 2.80Contribution margin per square metre 1.40Total contribution from sale 6000 square metres $1.40 8400less Special order costs
Freight 1500Export packing 2400Agent’s commission (6000 $0.42) 2520 6420
Profit from this order 1980
The order should be accepted as it contributes towards fixed costs and profits. Capacity is available and even after relaxing the assumption about current variable selling expensethere would still be a profit.
A special price on an export sale is unlikely to affect current customers in Australia.There is also the possibility of expanding the export sales business if this contract goesahead.
It would be more profitable if the company could increase local sales volume at pricesabove $4.20 per square metres but the effect on local customers would need to beconsidered.
Self-test problem 11.8
A company at present operates at 80% of capacity, producing 50 000 units per annum.A budget for the year is:
Total Per unit
$ $Sales 500 000 10.00less Manufacturing expense
Variable 100 000Fixed 200 000 300 000 6.00
( Continued)
Manag Account-Chap 11 17/6/02 2:54 PM Page 332

8/12/2019 ManagAccount_Ch11
http://slidepdf.com/reader/full/managaccountch11 12/43
333C H A P T E R 1 1 • D I F F E R E N T I A L C O S T I N G A N D L I N E A R P R O G R A M M I N G
Total Per unit$ $
Gross profit 200 000 4.00less Selling and administration expense
Variable 50 000Fixed 50 000 100 000 2.00
Net profit 100 000 2.00
An order is received from Tanzania for 5000 units at $5 FOB. Special export packing willincrease manufacturing costs by $0.50 per unit on this order. The present variable sellingand administrative costs will be reduced by $0.20 per unit on this order. A commission of 10% on sales price will be payable to the Tanzanian agent.
Required
(a) Calculate the increase or decrease in profit if this order is accepted.(b) Discuss factors other than profit that should be taken into account when considering
short-term special order price decisions.
You should now be able to do Questions 11.4 and 11.5.
Make or buy a product or component
Many manufacturers use component parts in the assembly of finished products. Forexample, General Motors (Holden) purchases and installs transmissions from Borg-Warner and tyres from several tyre sellers.
Manufacturers may produce component parts themselves or purchase them froman outside source. For example, a refrigerator manufacturer may produce the electricmotor itself or may purchase the electric motor from a specialist and install it in the
refrigerator.The factors that you need to consider in most decisions on making or buying acomponent part are:
Quantitative factors:• Variable costs of producing the part.• Unit variable cost of purchasing from external supplier.• Costs that would be avoided if the change is from producing the part to
purchasing it.• Contribution margin available from alternative uses of the space made available
by purchasing rather than making.
Qualitative factors in special order decisions:
• Control over quality of the part—usually if the part is made, the business hascontrol over the quality.• The long-term stability of the supplier, including the political stability of the
country of the supplier if the part is purchased from overseas.• Adverse relationship with the supplier if the decision is made to make a part
instead of purchasing.
Manag Account-Chap 11 17/6/02 2:54 PM Page 333

8/12/2019 ManagAccount_Ch11
http://slidepdf.com/reader/full/managaccountch11 13/43
334 M A N A G E M E N T A C C O U N T I N G . P R I N C I P L E S A N D A P P L I C A T I O N S
• Future prices to be paid if the decision is made to purchase.• Spare capacity must be available and therefore current fixed costs will not be
affected.
Example 11.7
K. & N. Canteens Pty Ltd operates a canteen in a major metropolitan college. At present,sandwiches are made at the counter by canteen staff. Part-time staff are employed in this jobduring busy periods of the day, lunch and evening.
A catering business, Chestertons Pty Ltd, has proposed the supply of ready-madesandwiches packed in plastic containers. The canteen manager has provided you with thefollowing estimated figures:
Present monthly costs of sandwich operation during term time $
Staff costs involved with making sandwiches 7 220Staff costs involved with serving the customer 4 500
Cost of space used by sandwich bar (e.g. rent, electricity) 3 000Por tion of overheads (e.g. depreciation, cleaning, insurance) 4 000Materials (e.g. bread, fillings) 9 780
$28 500
Average number of sandwiches sold in a month is 30 000.Average price of producing and selling a sandwich is, therefore, $0.95 each.
The offer from Chestertons is for the supply of 30 000 sandwiches per month at a costper sandwich of $0.55 each. The supply will be limited to a maximum of eight varieties perday and varieties will be subject to available supplies at the time.
Recommend to K. & N. Canteens Pty Ltd whether they should continue making thesandwiches or purchase them from Chestertons. Include in your recommendation both quan-titative and qualitative factors that need to be considered.
Solution
The first step is to determine the relevant costs in the decision. Certain assumptions may need to be made and these should be clearly stated in any report or recommendation. In thiscase, the costs included in the manager’s estimates that are probably not relevant are the‘occupancy’ costs of space used, the share of the other overhead costs and the staff costsof serving customers. These costs will probably not be affected either way, as sandwicheswill still be sold in the space allowed.
The relevant costs of making sandwiches that will be saved if the sandwiches arepurchased from Chestertons will be:
$Staff costs involved with making sandwiches 7 220
Materials (e.g. bread, fillings) 9 78017 000
The average variable cost of producing a sandwich is, therefore, $0.57 each.
Manag Account-Chap 11 17/6/02 2:54 PM Page 334
8/12/2019 ManagAccount_Ch11
http://slidepdf.com/reader/full/managaccountch11 14/43
335C H A P T E R 1 1 • D I F F E R E N T I A L C O S T I N G A N D L I N E A R P R O G R A M M I N G
The quote from Chestertons is slightly cheaper than this variable cost and might beaccepted but other factors need to be considered:
• The quality of the supply from Chestertons and possible complaints from collegestudents if the quality is not high. This may result in jeopardising the canteen lease.
• The financial stability of Chestertons.• The continuity of supply and supply when required.• The lack of variety and reliance on the supplier for variety.• Staff morale by dropping some casual staff if sandwiches are purchased.
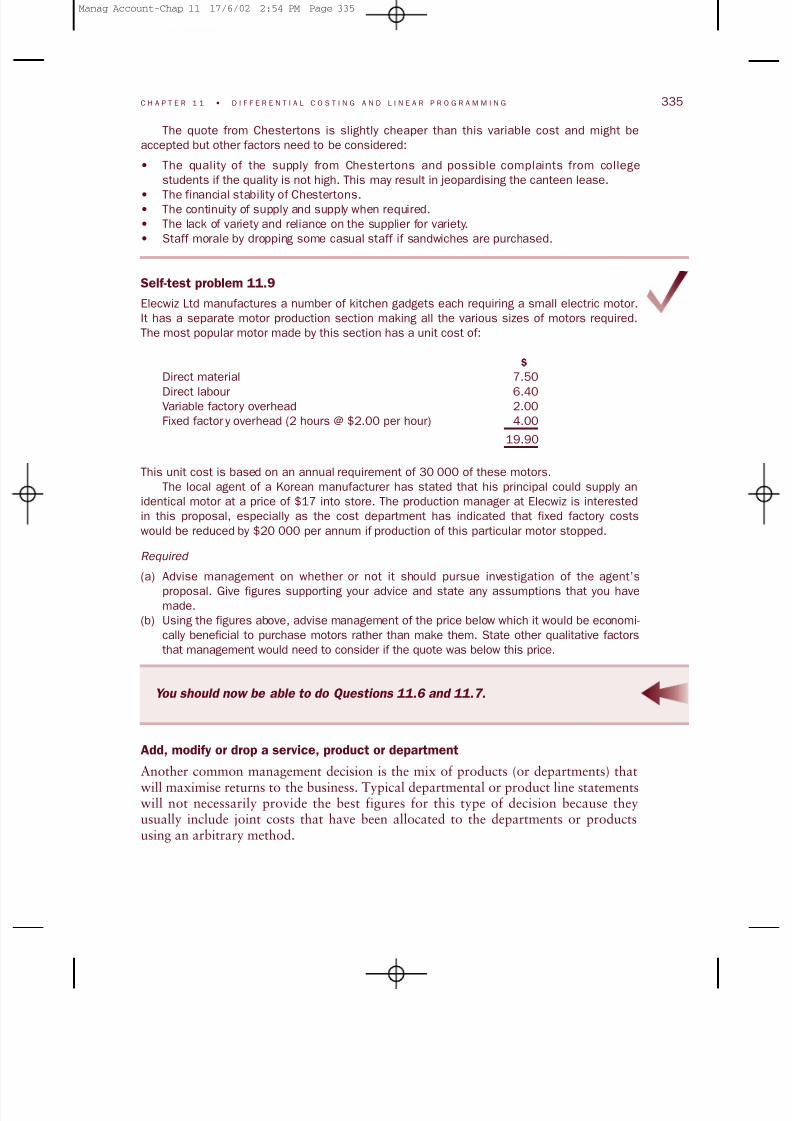
Self-test problem 11.9
Elecwiz Ltd manufactures a number of kitchen gadgets each requiring a small electric motor.It has a separate motor production section making all the various sizes of motors required.The most popular motor made by this section has a unit cost of:
$Direct material 7.50
Direct labour 6.40Variable factory overhead 2.00Fixed factor y overhead (2 hours @ $2.00 per hour) 4.00
19.90
This unit cost is based on an annual requirement of 30 000 of these motors.The local agent of a Korean manufacturer has stated that his principal could supply an
identical motor at a price of $17 into store. The production manager at Elecwiz is interestedin this proposal, especially as the cost department has indicated that fixed factory costswould be reduced by $20 000 per annum if production of this particular motor stopped.
Required
(a) Advise management on whether or not it should pursue investigation of the agent’sproposal. Give figures supporting your advice and state any assumptions that you havemade.
(b) Using the figures above, advise management of the price below which it would be economi-cally beneficial to purchase motors rather than make them. State other qualitative factorsthat management would need to consider if the quote was below this price.
You should now be able to do Questions 11.6 and 11.7.
Add, modify or drop a service, product or department
Another common management decision is the mix of products (or departments) thatwill maximise returns to the business. Typical departmental or product line statementswill not necessarily provide the best figures for this type of decision because theyusually include joint costs that have been allocated to the departments or productsusing an arbitrary method.
Manag Account-Chap 11 17/6/02 2:54 PM Page 335

8/12/2019 ManagAccount_Ch11
http://slidepdf.com/reader/full/managaccountch11 15/43
336 M A N A G E M E N T A C C O U N T I N G . P R I N C I P L E S A N D A P P L I C A T I O N S
Once again, the problem revolves around relevant costs and revenue and decisionsare based on the contribution provided by the product or department compared withany change in fixed costs arising from the decision.
Example 11.8
Manacc Ltd makes three hardware products, A, B and C, in its factory. The products are soldto hardware distributors throughout Australia and no stocks are kept of finished products.
A summary profit statement by product for the last year shows:
Products TotalA B C $
Units 80 000 90 000 25 000Sales 800 000 450 000 500 000 1 750 000less Costs
Variable 500 000 270 000 300 000 1 070 000
Fixed 250 000 150 000 220 000 620 000750 000 420 000 520 000 1 690 000
Profit/(loss) 50 000 30 000 (20 000) 60 000
Management is concerned with the loss of $20 000 shown on product C. It is consideringdropping this product from its operation. Advice to management will depend on a number of assumptions. Each of the following possible assumptions should be treated independently.
(a) Assume that management has no immediate plans to utilise the capacity made availableby dropping product C, and that none of the fixed costs will be reduced should product Cbe dropped.
If the profit statement above is recast after dropping product C, the total column willshow:
$Sales 1 250 000less Costs
Variable 770 000Fixed 620 000
1 390 000Profit/(loss) (140 000)
Obviously, the company will be worse off by $200 000. A quicker way of answering thistype of question is to consider the relevant figures only. The answer may then be restatedas:
Manag Account-Chap 11 17/6/02 2:54 PM Page 336

8/12/2019 ManagAccount_Ch11
http://slidepdf.com/reader/full/managaccountch11 16/43
337C H A P T E R 1 1 • D I F F E R E N T I A L C O S T I N G A N D L I N E A R P R O G R A M M I N G
$Sales that will be lost 500 000Variable costs avoided 300 000Lost contribution margin from dropping C 200 000
less Savings in fixed costs NilIncrease (decrease) in company profit (200 000)
(b) Now assume that $150 000 of the fixed costs that are allocated to product C representsupervision and other costs that will be avoided (not incurred) in the shor t term if productC is dropped. Assume also that management has no immediate plans to utilise thecapacity made available by dropping product C.
$Lost contribution margin from dropping C 200 000less Savings in fixed costs 150 000Increase (decrease) in company profit (50 000)
The answer shows that product C should not be dropped because the company will stillbe $50 000 worse off if it is dropped.
(c) Assume that the facilities made available by dropping product C could be used to produceanother 50 000 units of product B. As there is a market for 50 000 additional units of product B, these could all be sold at the current selling price of product B. To answer thisquestion only the relevant contribution margins from each alternative need be compared.
$Lost contribution margin from dropping C 200 000Additional contribution margin from B
(50 000 units @ $2.00 per unit (a )) 100 000Increase (decrease) in company profit (100 000)(a ) The contribution margin per unit for B is calculated as ($450 000 – $270 000) divided
by 90 000 units = $2.00 per unit.
The company would be worse off by $100 000 by swapping from producing product C toproducing 50 000 additional units of product B.
(d) Suppose that management has for some time considered producing another item,product D. Market estimates indicate that 60 000 units could be sold in a year at aselling price of $7.00 per unit. The variable cost per unit to make and sell product D willbe $3.50. The new product could be made using the facilities at present allocated toeither product B or product C (i.e. one of either product B or product C would have to bedeleted from the range). Advise management, with figures, if either product B or productC should be deleted in favour of producing product D.
Once again, the only figures that need to be considered are the relative contributionmargins from each of the three products.
Manag Account-Chap 11 17/6/02 2:54 PM Page 337

8/12/2019 ManagAccount_Ch11
http://slidepdf.com/reader/full/managaccountch11 17/43
338 M A N A G E M E N T A C C O U N T I N G . P R I N C I P L E S A N D A P P L I C A T I O N S
$Contribution margin provided by C 200 000Contribution margin provided by B 180 000Contribution margin provided by D (60 000 units @ $3.50 per unit) 210 000
Based on the figures alone, product D might replace product B. Other qualitativefactors that need to be considered and that are not stated in the case are:
• Are any of the products complimentary—that is, will dropping one affect the salesfrom any of the others?
• While the analysis is in the short term, product changes are often part of a longer termstrategic plan. Will the market for product D, for example, continue in the longer term?
• Adding a new product usually requires a greater cost in adver tising and additionalworking capital to build up raw material inventory. None of these costs are includedabove.
In general, decisions about changes in a product mix are made by examining thecontribution margin of each product and the possible changes in avoidable fixed costs.
Self-test problem 11.10
Doolight Manufacturing Pty Ltd manufactures three types of flooring products, cork, vinyl andparquet. A budgeted profit statement for the for thcoming year shows:
Vinyl Cork Parquet Total$ $ $ $
Sales 500 000 400 000 600 000 1 500 000less Variable costs 300 000 250 000 350 000 900 000Contribution margin 200 000 150 000 250 000 600 000less Fixed costs 170 000 180 000 200 000 550 000Profit (loss) 30 000 (30 000) 50 000 50 000
The fixed costs of the business have been classified into those that are directly related tothe individual departments making each product (mainly supervision costs) and those thathave been allocated on the bases of relative floor space. This analysis shows:
Vinyl Cork Parquet Total$ $ $ $
Direct (avoidable) 75 000 50 000 80 000 205 000Allocated on relative space 95 000 130 000 120 000 345 000Total fixed costs 170 000 180 000 200 000 550 000
Required
(a) Management is considering whether or not to cease the manufacture and sale of corkflooring because it cannot raise the selling price without affecting volume. If no other usecan be made of the available facilities, advise management of the consequences of stopping the production of cork.
Manag Account-Chap 11 17/6/02 2:54 PM Page 338

8/12/2019 ManagAccount_Ch11
http://slidepdf.com/reader/full/managaccountch11 18/43
339C H A P T E R 1 1 • D I F F E R E N T I A L C O S T I N G A N D L I N E A R P R O G R A M M I N G
(b) Assume that the facilities made available by stopping production of cork can be used toproduce a new product, artificial grass. Estimates for this product are for $500 000sales with variable costs of $300 000 and additional annual fixed costs of $60 000.Advise management on whether or not artificial grass should replace the cork product.
You should now be able to do Questions 11.8 and 11.9.
Sell now or process further
Chapter 16 deals more fully with the manufacturing situation where more than oneproduct emerges from a single process. Techniques for allocating the joint costbetween the products are shown. A product emerging from a joint process may have amarket value as is or it may be processed further to create another product. A
decision may be required on whether to sell the product at the end of the joint process(at ‘split-off’ point) or to process it further and sell it as another product.The important part of this decision is that the costs of processing up to the point
where it becomes a separately identifiable product may not be relevant. The decisioninvolves further processing costs and the change in sales price to be gained from thatfurther processing.
Example 11.9
Thomas Blakely Ltd obtains cylinder stock from the Shell refinery and after further refining itproduces two joint products, bright stock and petrolatum.
The cost of cylinder stock and the joint process amounts to $300 000 per month and theoutput is 100 000 litres of bright stock and 50 000 litres of petrolatum. No adjustments canbe made to the process to vary these relative amounts. The selling prices of these productsat split-off point (the end of the joint process) are:
Bright stock $2.80 per litrePetrolatum $1.05 per litre
Management is considering a proposal to further process the petrolatum into superfineoil to be sold to a sewing machine manufacturer. This further process also requirespackaging the oil in small plastic bottles with the sewing machine manufacturer’s brandname. The sewing machine manufacturer currently imports this oil from Korea at an in-storecost of A$3.80 per litre.
The factory manager has produced the following figures for a senior managementmeeting at which a decision will be made on providing the sewing machine manufacturer witha price for the superfine oil:
Manag Account-Chap 11 17/6/02 2:54 PM Page 339

8/12/2019 ManagAccount_Ch11
http://slidepdf.com/reader/full/managaccountch11 19/43
340 M A N A G E M E N T A C C O U N T I N G . P R I N C I P L E S A N D A P P L I C A T I O N S
Cost per litre$
Cost from joint process ($300 000/150 000 L) 2.00Further variable processing cost of petrolatum 1.95Additional fixed cost ($25 000 per month/50 000 L) 0.50
4.45Plus mark-up 25% 1.10Price 5.55
Comment on the factory manager’s figures and establish the cost per litre that isrelevant to this decision. If the sales price cannot exceed the current import price, shouldThomas Blakely Ltd sell at split off-point or process and sell the superfine oil to the sewingmachine manufacturer?
Solution
The cost from the joint process is not relevant to the decision because this is incurredregardless of the decision to process after the split-off point. The further processing costs
and the selling price at split-off point is the minimum price below which it would be better tosell at split-off.
$Further processing cost per litre 2.45Selling price at split-off point 1.05Minimum selling price 3.50
If the sales price after further processing is $3.80 per litre, the company will be better of by $15 000 per month as follows:
$ $Sales of superfine oil (50 000 L @ $3.80) 190 000
less sale value of petrolatum (50 000 L @ $1.05) 52 500Incremental revenue from processing further 137 500less Further processing costsVariable (50 000 L @ $1.95) $97 500Fixed facility cost $25 000 122 500Increase in contribution margin from processing further $15 000
Any sale price over $3.50 will result in an increased contribution margin from furtherprocessing.
Self-test problem 11.11Tantara Co-Op Ltd has a joint process from which two joint products emerge. Monthly averageproduction and sales prices are:
Manag Account-Chap 11 17/6/02 2:54 PM Page 340

8/12/2019 ManagAccount_Ch11
http://slidepdf.com/reader/full/managaccountch11 20/43
341C H A P T E R 1 1 • D I F F E R E N T I A L C O S T I N G A N D L I N E A R P R O G R A M M I N G
Product X—20 000 kg. Market price is $10.00 per kilogram.Product Y—50 000 kg. Market price is $1.00 per kilogram.The joint process cost to produce these quantities is $140 000.The relative quantities of each product cannot be changed in the joint process.
Management is considering processing product Y further into a new product called Z. Theadditional processing cost would be $1.50 per kilogram of product Y input into the process.The market price of product Z would be $4.00 per kilogram. The yield in this additionalprocess will be 80%—that is, for each input of 10 kilograms of product Y, only 8 kilograms of product Z will be derived.
The factory clerk has prepared the following schedule for management:
$ $Allocation of $140 000 joint costsProduct X (20 000/70 000 $140 000) 40 000Product Y (50 000/70 000 $140 000) 100 000
140 000Net income from new product Z
Revenue from Z (40 000 kg @ $4.00 per kilogram) 160 000less Cost of producing ZAllocated joint cost (product Y) $100 000Additional processing (50 000 $1.50) $75 000 175 000
Loss from further processing Y into Z 15 000
Required
Management has asked you to examine these figures and to make a recommendation.
You should now be able to do Questions 11.10 and 11.11.
Shut down or seasonal closure
A business that is operating at a loss may consider shutting down. A profitablebusiness that operates on a seasonal basis (e.g. a ski lodge) may also consider shuttingdown in the ‘off-season’. A decision to shut down needs to take into consideration thefollowing:• The business may be better off remaining open if the products or services cover
their variable costs and contribute towards the recovery of fixed costs.• Certain costs will continue even if the business closes down. For example,
depreciation, council rates, insurance and security of premises will continue aftershutting down.
• The costs of retrenchment of current staff and other costs of shutting down.• The costs of reopening that will be incurred after shutting down.• The cost of recruitment and training of new staff when reopening after shutting
down.
Manag Account-Chap 11 17/6/02 2:54 PM Page 341

8/12/2019 ManagAccount_Ch11
http://slidepdf.com/reader/full/managaccountch11 21/43
342 M A N A G E M E N T A C C O U N T I N G . P R I N C I P L E S A N D A P P L I C A T I O N S
Example 11.10
Laksa Catering Company operates a cafeteria and coffee shop at a college. The area isleased for $192 000 per annum. A profit statement for a month during term and a monthduring vacation shows:
During term time During vacation$ $
Revenue 287 650 128 900less Direct costs
Wages 148 000 82 000Supplies 88 290 30 325Cutlery and crockery 6 900 1 500Lease 8 000 8 000Cleaning 5 000 5 000Sundry fixed overheads 2 800 2 800Depreciation equipment 2 000 2 000
Total direct costs 260 990 131 625Net profit (loss) 26 660 (2 725)
Additional information
The lease, sundry fixed overheads and a yearly cleaning contract for $10 000 are allocatedequally each month. Cutlery and crockery replacement costs are expensed when purchased.
Management is considering closing the operation during holidays because it shows aloss. Advise management, including any assumptions that you make.
Solution
Contribution during holidays $
Revenue 128 900less Relevant direct costs
Wages 82 000Supplies 30 325Cutlery and crockery 1 500
113 825Net contribution $15 075
In the short term, only those costs that would be avoided are relevant to this decision.The operation contributes at least $15 075 towards the lease and other fixed overheadduring the holidays and the business would be worse off by this amount if it closed downduring this period. There would also be additional staff costs for retraining each time theoperation started up and staff morale might be affected.
Self-test problem 11.12
Mt Wilhelmina Lodge operates in the Victorian snowfields. Last year’s revenue statement by season and by the two main revenue areas showed:
Manag Account-Chap 11 17/6/02 2:54 PM Page 342

8/12/2019 ManagAccount_Ch11
http://slidepdf.com/reader/full/managaccountch11 22/43
343C H A P T E R 1 1 • D I F F E R E N T I A L C O S T I N G A N D L I N E A R P R O G R A M M I N G
Winter SummerAccommodation Restaurant Accommodation Restaurant
$ $ $ $Revenue 2 190 670 498 000 487 000 98 000less Costs
Staff—operations 772 100 232 600 153 650 33 300Staff—administration 160 000 55 000 95 000 55 000Supplies 289 590 158 855 58 775 27 325Crockery, cutlery, linen 88 420 19 900 18 430 3 100Rates and insurance 12 550 4 420 5 490 600Electricity, gas, wood 38 980 15 880 12 889 1 760
Cleaning 25 890 10 400 5 980 2 885Repairs and maintenance
Normal 8 995 6 880 2 400 1 980Major 29 470 9 525
DepreciationLodge 150 040 8 090 150 040 8 090Restaurant equipment 2 600 2 600
Other overheads (fixed) 12 000 6 000 4 000 2 000Total costs 1 558 565 520 625 536 124 148 165Net profit (loss) 632 105 (22 625) (49 124) (50 165)
Additional information
1. Staff costs include all salary oncosts. Assume that all staff costs for the restaurantwould cease if that operation were closed. Also assume that total accommodation admin-istrative costs would continue, even if the accommodation were closed during summer.
2. Rates and insurance, depreciation and other fixed overheads are allocated to periods andoperations using various methods.
3. Major repairs and maintenance are carried out in the off-season. These repairs would stillbe necessary even if the lodge were closed in summer.
4. Cutlery and crockery replacement costs are expensed when purchased.Required
Management is considering whether or not to close restaurant operations and whether or notto close down in the summer months. You are required to advise management, taking intoconsidering the additional information. You will have to make some assumptions and stateother matters that would need to be considered.
You should now be able to do Question 11.12.
Decisions with constraints on resourcesIn many problems there may be limits to the availability of resources. A limitation onthe availability of a resource is called a constraint . A problem with only oneconstraint does not require any special techniques, but linear (or in some casesinteger) programming techniques are used if there are several constraints.
Manag Account-Chap 11 17/6/02 2:54 PM Page 343

8/12/2019 ManagAccount_Ch11
http://slidepdf.com/reader/full/managaccountch11 23/43
344 M A N A G E M E N T A C C O U N T I N G . P R I N C I P L E S A N D A P P L I C A T I O N S
Contribution margin per unit of constraint
Where a resource is limited, the contribution margin per unit of that constraint mustbe determined.
Example 11.11
A company makes two products, A and B. The costs and contribution margins per unit forthese products have been calculated as follows:
A B$ $
Sales price 26.00 16.00less Variable costs
Direct material 8.00 6.00Direct labour 6.00 3.00Overhead 6.00 3.00
20.00 12.00Contribution margin per unit 6.00 4.00
It takes 2 hours to make one unit of A and 1 hour to make one unit of B.If there are only 30 000 direct labour hours available (i.e. direct labour is a constraint),
which product should be produced?If product A is selected, 15 000 units could be produced with a total contribution of
$90 000 (15 000 units $6 per unit). If product B is selected, 30 000 units could beproduced with a total contribution margin of $120 000 (30 000 units $4 per unit).
Therefore, product B is more profitable, and if there are no other constraints it should beproduced in preference to product A.
The contribution margin should be expressed as an amount per unit of constraint ratherthan per unit of output. That is:
Product A contribution margin = $3 per direct labour hourProduct B contribution margin = $4 per direct labour hour
Self-test problem 11.13
Constraint Company has plant available to make two products, X and Y. The unit profits forthese two products have been estimated as:
X Y$ $
Sales price 45.00 30.00less Variable costs
Direct material 10.00 12.00Direct labour 12.00 6.00Variable overhead 8.00 4.00Fixed overhead 4.00 2.00
34.00 24.00Profit per unit 11.00 6.00
Manag Account-Chap 11 17/6/02 2:54 PM Page 344

8/12/2019 ManagAccount_Ch11
http://slidepdf.com/reader/full/managaccountch11 24/43
345C H A P T E R 1 1 • D I F F E R E N T I A L C O S T I N G A N D L I N E A R P R O G R A M M I N G
Factory overheads are applied at a rate of $6.00 per direct labour hour. The maximumannual practical capacity is 60 000 hours with a fixed factory overhead of $120 000.
Required
(a) If direct labour hours is the only constraint, which product or combination of productsshould be produced?
(b) If the estimated maximum demand for product X is 25 000 units and for product Y is45 000 units, which product, or combination of products, should be produced? (Thelabour constraint still applies.)
Note : This problem is used to demonstrate the use of graphical analysis where constraintsoccur. You should make sure that you understand this question before looking at the sectionin the chapter on linear programming.
You should now be able to do Question 11.13.
Linear programmingA problem with more than one constraint and with more than two products can besolved using a technique called linear programming . Where there are only two orthree constraints and a maximum of two products, the problem can be shown in agraph. Larger problems can now be solved easily with computers and even inspreadsheet programs (e.g. using Solver in Microsoft Excel).
The objective in problems is to either maximise profit or to minimise costs. Theproblem is usually set out in equation form with an objective function (maximise orminimise) and a set of constraints. The objective function and the constraints can beplotted on graph paper and the solution obtained by reading off values on the graph.
Example 11.12Self-test problem 11.13 will be solved using graphical analysis. A summary of this problem is:
Contribution margins per unit are $15.00 for product X and $8.00 for product Y.A maximum 60 000 direct labour hours are available and it takes 2 hours to make oneunit of product X and 1 hour to make one unit of product Y.Maximum demand is 25 000 units of product X and 45 000 units of product Y.
The objective is to maximise the total contribution margin subject to the constraints. Thisis set out as a ‘model’:
Let X = number of units of X to produce and sellLet Y = number of units of Y to produce and sell
Maximise:Z = 15 X + 8 Y (maximise the number of units of X $15 plus the number of units
of Y $8)Subject to:2 X + 1 Y 60 000 (2 hours the number of units of X plus 1 hour number of units of
Y must be less than or equal to 60 000 hours)X 25 000 (the number of units of X must be less than the maximum demand of
25 000)
Manag Account-Chap 11 17/6/02 2:54 PM Page 345

8/12/2019 ManagAccount_Ch11
http://slidepdf.com/reader/full/managaccountch11 25/43
346 M A N A G E M E N T A C C O U N T I N G . P R I N C I P L E S A N D A P P L I C A T I O N S
Y 45 000 (the number of units of Y must be less than the maximum demand of 45 000)
X , Y ≥ 0 (both X and Y must not be negative, i.e. greater than or equal tozero)
The mathematical symbol is used to represent ‘less than or equal to’ and ≥ is used torepresent ‘greater than or equal to’.
To plot this ‘model’ on a graph, use the horizontal axis as the number of units of oneproduct (in this example, X will be represented on the horizontal axis) and the vertical axis forthe other product (product Y in this example).
With the constraint 2 X + 1 Y 60 000, if X is zero, then the maximum Y = 60 000. Thatis, if no units of X are produced, the whole of the 60 000 hours will produce 60 000 units of Y. Therefore, this point can be plotted on the graph. In Figure 11.1 this point is the 60 000units mark on the Y -axis and zero on the X -axis. Similarly, if no units of Y are produced, thewhole 60 000 hours can be used to produce 30 000 units of X. This point is the 30 000units mark on the X -axis. A line joining all of the points between 60 000 on the Y -axis and30 000 on the X -axis will contain all of the combinations of products X and Y that will satisfy the constraint. This line is shown in Figure 11.1 and is labelled C . The origin of the graph is
marked A and at this point no units of either product X or Y are produced.
10
20
30
40
50
60
70
10 20 30 40 50 60 70
2 X + Y ≤ 60 000
C
A
Y ( ' 0 0 0 )
X ('000)
Figure 11.1 • First constraint 2 X + 1 Y 60 000
Manag Account-Chap 11 17/6/02 2:54 PM Page 346

8/12/2019 ManagAccount_Ch11
http://slidepdf.com/reader/full/managaccountch11 26/43
347C H A P T E R 1 1 • D I F F E R E N T I A L C O S T I N G A N D L I N E A R P R O G R A M M I N G
Now the other two constraints need to be added. It would not make sense to producemore than 45 000 units of Y as that is the maximum market for that product. So a constraintline is added to restrict product Y to a maximum of 45 000 units. Similarly, a constraint lineis needed restricting the quantity of product X to a maximum market demand of 25 000 units.Figure 11.2 shows these new constraint lines added.
Any point in the shaded area bounded by the corner points (vertices) marked as A, B , C ,D and E in Figure 11.2 will provide a possible combination of products X and Y. This area iscalled the feasible solution space . The optimum solution always lies on an outside cornerpoint (vertex) of the feasible solution space.
To establish which corner point provides the optimum solution, the objective function thatis being maximised ( Z = 15 X + 8 Y ) can be drawn on the graph. The problem is that themaximum contribution margin (represented by Z ) is not known, and there are many lines thatcan be drawn that would satisfy this equation. However, the objective function line will be theline that is farthest from the origin (point A on the graph) and just touches a corner point.
The objective function line can be drawn anywhere on the graph so long as the totalcontribution margin is the same amount along the line and is determined by the equation Z =15 X + 8 Y . All of these contribution margin lines will be parallel to each other (i.e. the slope of the line will be the same). The method of obtaining the objective function (contributionmargin) line is:
10
20
30
40
50
60
70
10 20 30 40 50 60 70
Y ( ' 0 0 0 )
2 X + Y ≤ 60 000
C
X ('000)
A
B
D
E
Y ≤ 45 000
X ≤ 25 000
The shaded area bounded by thepoints ABCDE is called the feasiblesolution space.
Figure 11.2 • All constraints added
Manag Account-Chap 11 17/6/02 2:54 PM Page 347

8/12/2019 ManagAccount_Ch11
http://slidepdf.com/reader/full/managaccountch11 27/43
348 M A N A G E M E N T A C C O U N T I N G . P R I N C I P L E S A N D A P P L I C A T I O N S
1. Make the contribution margin ( Z ) any figure that will make the arithmetic easy. The figureof $240 000 has been selected in this example because each contribution margin perunit ($15 and $8) divides evenly into $240 000. If the equation is restated as 15 X + 8 Y = $240 000, then a line can be plotted in the same manner as the constraints. This linewill be where X = 16 000 and Y = 30 000 and this is shown as a dashed line in Figure11.3 and labelled Z .
2. Place a ruler along this contribution margin line and move the ruler away from the origin(A) in the direction of the arrow shown in Figure 11.3 so that it remains parallel to thedrawn objective function line labelled Z . When the ruler is farthest away from the originand just touches a corner point (i.e. is still feasible), the contribution margin ismaximised. The dashed line touching corner point C in Figure 11.3 is the objectivefunction line that is far thest from the origin and just touching the feasible solution space.
The maximum contribution margin is obtained at corner point C in Figure 11.3 where45 000 units of product Y are produced and 7500 units of X are produced. This can beproved by looking at all of the possible contribution margins at the corner points in thefeasible solution space:
10
20
30
40
50
60
70
10 20 30 40 50 60 70
Y ( ' 0 0 0 ) C
X ('000)
A
B
D
E
Optimum solution is where the objectivefunction line is farthest from origin ( A)and touches a corner point of thefeasible solution space
Z
Figure 11.3 • Objective function lines plotted
Manag Account-Chap 11 17/6/02 2:54 PM Page 348

8/12/2019 ManagAccount_Ch11
http://slidepdf.com/reader/full/managaccountch11 28/43
349C H A P T E R 1 1 • D I F F E R E N T I A L C O S T I N G A N D L I N E A R P R O G R A M M I N G
Corner points Units of products Contribution marginX Y $
A 0 0 0B 0 45 000 360 000
C 7 500 45 000 472 500D 25 000 10 000 455 000E 25 000 0 375 000
Example 11.13
Flat-track Products Pty Ltd has estimated the contribution margin of its two products to be:
Product A —$14 per unitProduct B —$21 per unit
Both products require machining and assembly. Machine hours and assembly hours perproduct, and maximum hours available per month are:
Machining AssemblyProduct A —hours per unit 0.5 3.0Product B —hours per unit 1.0 2.0Maximum hours available 4000 12 000
Management would like to know which combination of products to produce.
(a) Formulate the problem as a linear programming model.(b) Solve the problem by preparing a graph to determine the optimal product mix. On the
graph, show all constraints, the objective function line and the feasible solution space.Advise management.
Solution
(a) The linear programming model is represented by:Let A = the number of units of product A to produceLet B = the number of units of product B to produce
Maximise:Z = 14 A + 21 B (maximise the total contribution margin)
Subject to:0.5 A + 1.0 B 4 000 (machine hours constraint)3.0 A + 2.0 B 12 000 (assembly hours constraint)A, B ≥ 0 (A and B cannot be negative)
(b) The machining constraint 0.5 A + 1.0 B 4000 means that the maximum number of product A that could be produced would be 8000 (i.e. if no machining time was allocatedto product B, 8000 units of A could be produced, each unit requiring 0.5 hours). Similarly,the maximum number of product B that could be produced would be 4000. This is then
plotted as shown in Figure 11.4.The assembly constraint 3.0 A + 2.0 B 12 000 means that the maximum number of product A that could be produced would be 4000 (i.e. if no assembly time was allocatedto product B, 4000 units of A could be produced, each unit requiring 3 hours). Similarly,the maximum number of product B that could be produced would be 6000. This is thenplotted as shown in Figure 11.4.
Manag Account-Chap 11 17/6/02 2:54 PM Page 349

8/12/2019 ManagAccount_Ch11
http://slidepdf.com/reader/full/managaccountch11 29/43
350 M A N A G E M E N T A C C O U N T I N G . P R I N C I P L E S A N D A P P L I C A T I O N S
The optimum solution where the contribution is maximised is at corner point C shownin Figure 11.4. The contribution at each corner point can be calculated as:
Corner points Units of products Contribution marginA B $
A 0 0 0B 0 4 000 84 000C 2 000 3 000 91 000D 4 000 0 56 000
Self-test problem 11.14
MicroMoth Ltd assembles and sells two models of computers, A and B. Demand for thesecomputers is high and there is a two-month backlog of orders. Model A gives a unit contribu-tion margin of $120, while model B gives a unit contribution margin of $90.
9
8
7
6
5
4
3
2
1
1 2 3 4 5 6 7
P r o
d u c
t B
( ' 0 0 0 )
C
Product A ('000)
A
B
D
8 9
assembly constraint3.0 A + 2.0 B ≤ 12 000
2000, 3000
feasiblesolutionspace
Machining constraint0.5 A + 1.0 B ≤ 4000
optimum solution is to produce2000 units of product A and3000 units of product B ; totalcontribution margin = $91 000
Figure 11.4 • Constraints plotted and feasible solution space shaded
Manag Account-Chap 11 17/6/02 2:54 PM Page 350

8/12/2019 ManagAccount_Ch11
http://slidepdf.com/reader/full/managaccountch11 30/43
351C H A P T E R 1 1 • D I F F E R E N T I A L C O S T I N G A N D L I N E A R P R O G R A M M I N G
Due to a shipping strike by waterfront workers, three of the imported components are inshort supply for the coming month. The number of these components available and thenumber required in each model are:
No. of parts required for:Component Total available Model A Model B
IC301 chips 3000 6 3PIA 1600 2 2T40 controller 1200 3 0
All other components are readily available and the above supply shortages are the only constraints that need to be considered.
Required
Using a graph, determine the quantity of each model to be produced to maximise the totalcontribution margin. Your graph should indicate the constraint lines, the feasible solutionspace and an estimated objective function line.
You should now be able to do Questions 11.14 to 11.16.
Problems of minimising costs can also be solved using a graph. Minimisationproblems are usually concerned with minimising costs but with constraints requiring aminimum level of production (otherwise costs would be minimised by producingnothing!). The constraints are plotted in the same way as in maximisation problemsbut are usually expressed as ‘greater than or equal to’ and the symbol ≥ is used.
Example 11.14
Agrifeed Ltd operates two production lines and each line produces a mixed output of animalfeed in the form of cake, pellets and meal. The two production lines are run intermittently asrequired and the hourly output of the two lines is as follows:
Cake Pellets Meal
Production line A 25 tonnes 15 tonnes 10 tonnesProduction line B 50 tonnes 5 tonnes 75 tonnes
It costs $10 an hour to run production line A and $25 an hour to run production line B.The orders on hand require 2000 tonnes of cake, 525 tonnes of pellets and 1350 tonnes of meal, and the factories will be run simultaneously until these quantities are available. Howlong should each line operate in order to provide sufficient output to meet the orders onhand?
This problem is set out as:Let X = the hours that production line A will operateLet Y = the hours that production line B will operate
The objective is to minimise the total cost from running the production lines. The totalcost of running production line A will be $10 X hours and for running production line B itwill be $25 Y hours. The objective function is:
Manag Account-Chap 11 17/6/02 2:54 PM Page 351

8/12/2019 ManagAccount_Ch11
http://slidepdf.com/reader/full/managaccountch11 31/43
M A N A G E M E N T A C C O U N T I N G . P R I N C I P L E S A N D A P P L I C A T I O N S
Minimise:C (cost) = 10 X + 25 Y
Subject to:25 X + 50 Y ≥ 2000 (the output of cake from both production lines must be at least
equal to 2000 tonnes)15 X + 5 Y ≥ 525 (the output of pellets from both production lines must be at least
equal to 525 tonnes)10 X + 75 Y ≥ 1350 (the output of meal from both production lines must be at least
equal to 1350 tonnes)X , Y ≥ 0 (the hours X and Y must not be less than zero)
The graphical solution is set up in the same way as a maximisation problem. Thisexample uses the X -axis to show the number of hours to run production line A and the Y -axisfor the hours to run production line B. Each constraint is plotted on the graph. For the firstconstraint, if production line A is used to produce the whole 2000 tonnes, then it will need torun for 80 hours. If production line B is used to produce the whole 2000 tonnes, then it willneed to run for 40 hours. A line is drawn on the graph from 40 hours on the Y -axis to80 hours on the X -axis. And any point on this line will represent the combination of hours for
both lines in which the total output will be 2000 tonnes. This line, together with lines drawnfor the other constraints, is shown in Figure 11.5.The hours required to minimise cost is shown on the graph in Figure 11.5 as point C . This
shows that running production line A for 60 hours and production line B for 10 hours willproduce a minimum cost. Putting these hours into the objective function, the minimum cost is$850 (60 hours $10 plus 10 hours $25). You may have noticed that while this solution
352
110
100
90
80
70
60
50
40
30
20
10
10 20 30 40 50 60 70
P r o
d u c
t i o n
l i n e
B ( h o u r s
)
C
Production line A (hours)
A 80 90
pellets output contraint15 X + 5 Y ≥ 525
feasiblesolutionspace
100 110 120 130
objective function 10 X + 25 Y
cake output constraint25 X + 50 Y ≥ 2000
meal output constraint10 X + 75 Y ≥ 1350
Figure 11.5 • Graph for minimisation example
Manag Account-Chap 11 17/6/02 2:54 PM Page 352

8/12/2019 ManagAccount_Ch11
http://slidepdf.com/reader/full/managaccountch11 32/43
C H A P T E R 1 1 • D I F F E R E N T I A L C O S T I N G A N D L I N E A R P R O G R A M M I N G 353
minimises the cost, it produces 950 tonnes of pellets (15 tonnes per hour in line A 60hours, plus 5 tonnes per hour in line B 10 hours) and this is 450 tonnes more than theorders. This would need to be considered in the final decision on running the lines.
The feasible solution space in this example is the area to the right of all of the constraint
lines. The minimum cost line is drawn as before but it is moved towards the origin (point A)until it reaches the corner point of the feasible solution space that is nearest the origin.
Self-test problem 11.15
An animal feed must provide at least 2000 calories and 120 protein units per day to providerequired growth rates. It is possible to use two ingredients, the particulars of which are:
Calories per kilogram Protein units per kilogram Cost per kilogram
Ingredient 1 500 10 $0.75Ingredient 2 200 20 $0.50
Required
Using a graph, determine the optimal mix of ingredients to minimise cost.
You should now be able to do Question 11.17.
Summary1. Differential costing is the process of providing relevant information to
management that will assist it in making decisions.
2. Relevant quantitative information consists of those costs and revenues that will be affected by any decision. Relevant information, therefore, has abearing on the future.
3. Historical costs are not affected by a decision but may be used to predict relevant future costs.
4. Sunk costs are historical costs that cannot be altered by any decision. Theyare not relevant and can be ignored in any quantitative analysis.
5. Imputed costs are relevant cos ts that are not usually recorded in theaccounts of a business. They are costs that do not involve an outlay of cashbut are included in order to make valid comparisons.
6. An opportunity cost is the value of one alternative forgone (given up) by a
decision made on another use of the resource.7. Quantitative data or information refers to the numbers (units or dollars)
used in an analysis and recommendation. Qualitative data or informationrefers to factors that must be considered but which cannot be expressed innumerical terms.
Manag Account-Chap 11 17/6/02 2:54 PM Page 353

8/12/2019 ManagAccount_Ch11
http://slidepdf.com/reader/full/managaccountch11 33/43
M A N A G E M E N T A C C O U N T I N G . P R I N C I P L E S A N D A P P L I C A T I O N S354
8. The differential cost analysis may be presented in tables showing totals for each alternative, or as differences between two alternatives.
9. There are many possible differential cost decisions for which both quanti-tative and qualitative data or information will be required. The mainareas covered in this chapter are advertising, accept or reject a special order price, make or buy a product or component, change in product linesor departments, sell now or process further, and temporary shutdowns.
10. Decisions may involve constraints on resources and the relevant figure touse in these decisions is the contribution margin per unit of that constraint.
11. Decisions involving more than one constraint and a number of productscan be formulated and solved using linear programming. Computerised linear programming packages may be used. In simple cases, a graph can bedrawn that will provide answers.
12. Linear programming provides answers to the mix of products that should be made or sold so as to maximise the total contribution margin or tominimise the total relevant costs.
Questions11.1 A summary of cost types that are relevant and not relevant for decision
making is:
Relevant costs Irrelevant costs
Future costs Historical (sunk) costsIncremental costs Non-incrementalAvoidable costs UnavoidableImputed costs No-cash expensesOpportunity costs
For each of the following, indicate whether the costs involved are relevantor irrelevant, and classify them into one of the cost types listed above:(a) In a decision about replacing a vehicle, the cost of the vehicle to be
replaced is in the ledger at $35 000.(b) A business intends to purchase machinery for $50 000. The cost of the
capital to be invested in this business is 10%.(c) The cost of indirect labour paid in a period was $12 000.
(d) The fixed supervision salary costs for a division will no longer beincurred if the division is closed down.(e) The expected cost of labour will be reduced by 10% if machinery is
purchased.(f) If machinery is purchased, the salary for the factory supervisor will
remain the same.
Manag Account-Chap 11 17/6/02 2:54 PM Page 354

8/12/2019 ManagAccount_Ch11
http://slidepdf.com/reader/full/managaccountch11 34/43
C H A P T E R 1 1 • D I F F E R E N T I A L C O S T I N G A N D L I N E A R P R O G R A M M I N G
(g) Garments that had been purchased for $85 000 need alterations costing$12 000 before they can be sold for $40 000. If they are not altered theycan be sold for $15 000.
(h) Fixed occupancy costs (e.g. lease, security, property insurance) will not
change with a proposed increase in production of 5%.11.2 If a retailer has an overall margin of 30% from its sales, by how much would
sales need to increase to pay for an advertising expenditure of $45 000?11.3 R. V. B. Enterprises Pty Ltd operates a number of computer stores. The
company is considering setting up a website to increase its market. It alsoconsiders that at the end of two years the customer base could be sold for asubstantial gain.
Two options are being considered: to develop its own website or to use awell-known website, such as, Yahoo! to host the electronic store. The set-up,advertising, potential contribution margin, and infrastructure costs for the twooptions have been reported by a marketing consultant and show:
Own website Professional hosting$ $
Initial set-up 84 000 36 000Advertising costs
First six month period 186 000 170 000Second six month period 240 000 210 000Third six month period 180 000 160 000Fourth six month period 150 000 150 000
Sales contribution marginFirst six month period 100 000 90 000Second six month period 190 000 200 000Third six month period 220 000 230 000Fourth six month period 250 000 240 000
Administration and other fixed costsEach six months 180 000
The administration and other fixed costs are an allocation of the costs of current information technology facilities in the company. The professionalwebsite service fee (in addition to the advertising costs) is $4000 per monthplus turnover royalty that averages 5% of the contribution margin. Undereach alternative, it is estimated that the business (customer base) will be soldat the end of the two-year period for $250 000.Required
(a) Advise management on which alternative would be best. Set your answerout so that it indicates the profit or loss for each six-month period andcumulatively for each alternative.
(b) In view of the poor survival rate of this type of business (a ‘dot com’company) in recent history, what other matters would you raise withmanagement?
355
Manag Account-Chap 11 17/6/02 2:54 PM Page 355

8/12/2019 ManagAccount_Ch11
http://slidepdf.com/reader/full/managaccountch11 35/43
M A N A G E M E N T A C C O U N T I N G . P R I N C I P L E S A N D A P P L I C A T I O N S
11.4 The sales estimates for Dartford Piping Ltd are based on a forecast that for thenext six months the regular market for its product Decla will be at 70% of available normal manufacturing capacity.
Budget estimates for the full year show the following:
At normal capacity At 80% of normal capacity
Sales in units 72 000 57 600Sales price per unit $7 $7Total costs $384 000 $326 400
In addition to the regular sales budgeted above, two offers to purchase havebeen received at reduced prices. One is for a local order for 2000 units at $6 perunit. The other calls for 2400 units delivered to an overseas market at $5.00 perunit. The overseas order would require an additional $0.40 per unit for packing,and $600 for shipping and forwarding costs for the whole consignment.Required
(a) Determine the profit at 70% of normal capacity for the next six monthswithout the two special orders.
(b) Advise management on the desirability of accepting or rejecting either orboth of the two special orders, indicating the profit or loss and otherfactors involved in each case if they are accepted.
(c) State the minimum unit price below which any further orders should berejected.
11.5 Dural Manufacturing Company manufactures office furniture for majorretailers. One of the items is an executive return desk made from Tasmanianoak. The normal selling price of this desk is $1760 including 10% GST.
The Sultan of Zarawak has offered to purchase 200 of these desks at aprice of A$1100. Exports are GST-free. Production of these 200 desks wouldnot increase fixed production costs as they can be produced with the currentfacilities.
A budget schedule showing the costs of producing and selling 500 of thesedesks shows:
Unit cost Total costs for 500 desks$ $
Timber, leather, brackets 390 195 000Direct labour 275 137 500Factory overhead —variable 275 137 500Factory overhead —fixed 180 90 000Fixed marketing 30 15 000Fixed administration 50 25 000Sales commissions 40 20 000
1240 620 000
The export order will require special packing that will cost $20.00 perdesk. Freight and insurance on the 200 desks will total $6000. An agent’scommission of 5% of the sales price will replace the local sales commission of $40.00 per desk.
356
Manag Account-Chap 11 17/6/02 2:54 PM Page 356

8/12/2019 ManagAccount_Ch11
http://slidepdf.com/reader/full/managaccountch11 36/43
C H A P T E R 1 1 • D I F F E R E N T I A L C O S T I N G A N D L I N E A R P R O G R A M M I N G
Required
Management is considering the offer and would like to know the effect on theoverall profits if this order were accepted. Provide management with advice.
11.6 Gem Electric makes electrical appliances. Electric ovens and microwavesrequire an electronic timing device that Gem Electric currently makes. Theannual budgeted production level is 10 000 of these timing devices.
A & C Controls Pty Ltd has said that it can deliver these into stores at $10per timing device. The cost accountant for Gem Electric has provided a unitcost of manufacturing this timing device and this shows:
$Direct materials 3.00Direct labour 5.00Manufacturing overhead —variable 1.00Manufacturing overhead —fixed 2.50
11.50
The fixed manufacturing overhead of $2.50 includes $0.75 of discre-tionary costs that would cease if the timers were purchased from A & CControls. The other fixed manufacturing costs are allocated committed costs.However, if the timers were purchased, the space made available would beused for storage and this would save $10 000 per annum.Required
(a) Prepare a report for management that will show the effect on total costsif the timers were purchased rather than manufactured.
(b) Advise management on this decision, providing it with any other factorsthat should be considered.
11.7 Campaire Ltd manufactures small air-conditioners suitable for installation in
trucks and caravans. The condenser unit in each air-conditioner is formedfrom copper tubing, and this process is currently carried out in Campaire’sforming area in the factory. Due to a lack of expansion space, the managementof Campaire is considering the purchase of condensers from a specialist coppermanufacturer, Coptube Ltd.
Allowing for normal damage of 100 units during the assembly of thecondensers into the air-conditioners, Campaire has extracted the followinginformation relating to forming an annual requirement of 20 300 goodcondensers:
$Cost of copper tubing delivered into store 175 440Direct labour 199 200
Factory overhead (excluding depreciation) 61 200Cost of carrying average copper tubing inventory 2 924The depreciated value of equipment used to form the condensers is
$12 000 and its expected remaining useful life is five years. Thisequipment could readily be used elsewhere in the plant.
Sale of damaged condensers as scrap 600Sale of scrap copper tubing 800
357
Manag Account-Chap 11 17/6/02 2:54 PM Page 357

8/12/2019 ManagAccount_Ch11
http://slidepdf.com/reader/full/managaccountch11 37/43
M A N A G E M E N T A C C O U N T I N G . P R I N C I P L E S A N D A P P L I C A T I O N S
The factory overhead is considered as fixed but these costs will be used inexpanding other production.
The quotation from Coptube is for an order of 20 400 condensers,delivered in lots of 425 per week. The price quoted is $20 per condenser
delivered into store. Coptube will also collect damaged condensers and payCampaire $7 per unit. This supply contract requires renegotiation each year.
Required
(a) State whether Campaire should make or purchase the condensers.Support your decision with a schedule of costs and income.
(b) State some of the factors other than costs that would favour a decision to:make the condensers or purchase the condensers.
11.8 Cavity Sweets manufacturing is divided into three departments: chocolates,toffee and pastilles. The unit manufacturing costs per kilogram of output fromthese departments were budgeted at the start of the year as follows:
Chocolates Toffee Pastilles$ $ $
Direct material 3.05 0.80 1.20Direct labour 1.00 1.00 1.00Factory overhead 1.25 1.20 1.25
5.30 3.00 3.45
The applied factory overhead cost was based on the following summarybudgets for the year:
Chocolates Toffee Pastilles
Direct variable ($) 20 000 10 000 15 000Direct fixed ($) 20 000 15 000 15 000Allocated fixed ($) 60 000 35 000 45 000
100 000 60 000 75 000Budgeted kilograms 80 000 50 000 60 000
The allocated fixed overheads are mainly occupancy costs and relativefloor space occupied by each department was used to distribute the total costbetween departments.
Actual production and sales for the year were:
Kilograms Sales$
Chocolates 70 000 450 000Toffee 50 000 250 000
Pastilles 55 000 300 0001 000 000
Selling and administrative costs (considered as all fixed) for the yearamounted to $160 000. The sales force markets all three products jointly. For
358
Manag Account-Chap 11 17/6/02 2:54 PM Page 358

8/12/2019 ManagAccount_Ch11
http://slidepdf.com/reader/full/managaccountch11 38/43
C H A P T E R 1 1 • D I F F E R E N T I A L C O S T I N G A N D L I N E A R P R O G R A M M I N G
departmental profit statements, the selling and administrative cost areapportioned between departments according to their relative sales value.
Required
(a) Prepare a profit statement for the year by department and in totalshowing any under or over applied overhead as an adjustment to cost of goods sold. The statement should show gross profit and net profit.
(b) Recast the profit statement in a form that will highlight to managementthe short-term effect of closing down any one department.
(c) Using the results from (a) and (b), prepare advice for management on theeffect of a decision to close down chocolate production.
11.9 Hills & Frost Pty Ltd makes four different types of fillers for plastics manufac-turers. These are designated type A, type B, type C and type D. Themanagement of Hills & Frost is examining possible changes to the productmix so as to improve profitability. Several separate proposals are beingconsidered and you are to provide figures for these proposals.
A summary profit statement and other information is shown in thefollowing table:
Total Type A Type B Type C Type D
Sales ($) 626 000 100 000 180 000 126 000 220 000Cost of goods sold ($) 442 740 47 500 70 560 139 680 185 000Gross profit ($) 183 260 52 500 109 440 (13 680) 35 000Selling andadministrative ($) 120 120 19 900 29 760 28 260 42 200
Net profit beforetax ($) 63 140 32 600 79 680 (41 940) (720)
Kilograms sold 10 000 12 000 18 000 20 000Variable cost of goodssold per unit ($) 2.50 3.00 6.50 6.00
Variable selling andadministrative perunit ($) 1.15 1.25 1.00 1.20
Each of the following possibilities is to be considered independently of theothers. Only consider the changes proposed for the particular products in eachproposal (i.e. assume that the activity of other products remains the same).
Required
(a) If type C is discontinued, what will be the effect on net profit before tax?(b) If type C is discontinued, current customers will cease to buy 2000
kilograms of type B, which is a complimentary product. What will be thecombined effect on profit if type C is dropped?(c) If the sales price of type C is increased to $8.00 with a consequent
decrease in the number of kilograms sold to 15 000, what will be theeffect on profit?
359
Manag Account-Chap 11 17/6/02 2:54 PM Page 359

8/12/2019 ManagAccount_Ch11
http://slidepdf.com/reader/full/managaccountch11 39/43
M A N A G E M E N T A C C O U N T I N G . P R I N C I P L E S A N D A P P L I C A T I O N S
(d) The department in which type C is produced could be used to produce16 000 kilograms of a new type E. This new type would sell for $9.50per kilogram and its variable costs would total $8.05 per kilogram. If type E replaces type C, what will be the combined effect on profit?
(e) Part of the department in which type A is produced can be converted toproduce type D. Sales prices will also change. Production and sales of type D can be increased to 25 000 kilograms to be sold at $10.50 perkilogram. This would require reducing the output of type A to 5000kilograms at a sales price of $12 per kilogram. What would be the effecton total income from this change?
(f) Adding a second shift could double production of type A, but shiftallowances and other costs would increase the variable cost of goods soldto $4.50 per kilogram for each additional kilogram above present sales. If the 10 000 additional kilograms of type A can be sold for $8.50 each,what will be the total effect on net profit from doubling the output of type A?
11.10 Silverwater Paints Ltd produces anti-rust chemicals that are used by structuralengineering businesses. Raw materials are converted though two processes.The output from the second joint process is three different grades of thechemical, A, B and C. Each of these chemicals is further refined in individualprocesses. The selling prices per litre of these chemicals at the end of allprocessing are $14, $9 and $8 respectively.
Production and costs estimated for the coming year are:
Costs from Unit costs ($)Product Litres produced joint processing Further processing Total cost
Grade A 10 000 5 6 11Grade B 20 000 5 3 8Grade C 25 000 5 2 7
The relative quantities of each grade of chemical cannot be changed in thejoint process. Further processing costs for each grade of chemical would beeliminated if the product were not processed further.
Required
For each of the following independent situations, advise management:(a) A competitor is now importing a product that is similar to grade B
chemical but it sells for $6 per litre. Should Silverwater Paints continue toproduce grade B chemical? What price should it charge?
(b) The grade A chemical can be sold at split-off point (i.e. before furtherprocessing) for $8.50 per litre. Should the product be sold at split-off
point or should Silverwater Paints continue to process it further and sellit for $14 per litre?(c) If the sales price of grade C declines to $5 because of competition, what
effect will this have on production and sales?
360
Manag Account-Chap 11 17/6/02 2:54 PM Page 360

8/12/2019 ManagAccount_Ch11
http://slidepdf.com/reader/full/managaccountch11 40/43
C H A P T E R 1 1 • D I F F E R E N T I A L C O S T I N G A N D L I N E A R P R O G R A M M I N G
11.11 Pepi Products makes three types of durable vinyl seat coverings that arestamped with the logo of the purchaser. The products are first produced froma joint process and each is then processed further in separate productiondepartments.
The current month’s production schedule and other data are:Unit costs ($)
Sales price Metres FurtherProduct per metre produced Joint cost processing Total cost Profit (loss)
$ $Tuff-One 5 10 000 $3.10 $2.20 $6.30 (13 000)Fortress 11 6 000 3.10 4.10 $7.20 22 800Everlast 16 4 000 3.10 5.30 $8.40 30 400
The relative quantities of each product cannot be changed in the jointprocess.
Further processing costs for each product would be eliminated if the
product were not processed further.Required
(a) The managing director would like to know why the biggest sellingproduct is showing a loss. He thinks the figures are wrong. Advise themanager on the figures.
(b) An importer is marketing a product to government departments thatwould be a direct substitute for the product Fortress. To compete withthis imported product the sales price of Fortress would need to bereduced to $6.50. Should Pepi Products sell Fortress at this price?
(c) If the management of Pepi Products has a policy that a gross profit of 20% on sales must be maintained, what would your answer be to part(b) above?
11.12 Pacific Peace Pty Ltd operates several holiday resorts in islands around theSouth Pacific. Due to political unrest in one island nation, the averageoccupancy rate (percentage of rooms occupied) in Pacific Peace’s resort on thatisland has reduced from 80% down to 60%. This is expected to continue untilthe next parliamentary elections in six months time. It is expected that theoccupancy rate will return to at least 80% from then onwards.
A summary of last season’s profit statement (same six months) for thisresort, Peaceful Palms, when the occupancy rate was 80%, is:
$Revenue
Accommodation 480 000
Restaurant 128 900Boat, windsur fer, scuba and ski hire 184 300793 200
ExpensesSupplies —accommodation 33 600Supplies —restaurant 90 230
361
( Continued)
Manag Account-Chap 11 17/6/02 2:54 PM Page 361

8/12/2019 ManagAccount_Ch11
http://slidepdf.com/reader/full/managaccountch11 41/43
M A N A G E M E N T A C C O U N T I N G . P R I N C I P L E S A N D A P P L I C A T I O N S
$Electricity and water 12 180Salaries 237 960Insurance 55 520Lease on island 120 000Depreciation 138 640Other overheads (e.g. stationery, travel) 12 690
700 820Profit $92 380
Management is considering closing Peaceful Palms down for the next sixmonths as it expects a loss. You have been asked to advise. Furtherinformation that you have obtained indicates that:(a) the revenue from the restaurant and boating equipment hire varies in
direct proportion to the accommodation occupancy rate;(b) the cost of supplies varies in direct proportion to the revenue to which it
relates;(c) the cost of electricity and water and other overheads varies in proportion
to total revenue;(d) both the salaries and insurance would reduce by 5% at an occupancy rate
of 60% and would reduce by 50% if the resort closed down for sixmonths–these reductions are on the figures at 80% occupancy rate;
(e) depreciation would reduce by $50 000 if the resort closed down—itwould remain the same at the 60% occupancy rate.
Required
Prepare a profit statement for the six months at an occupancy rate of 60%.Advise management what the loss would be if the resort were closed for sixmonths.
11.13 Gambole & Donnetti make two types of exercise machines, Gyro and Heavo.Sales prices and unit costs are:
Gyro Heavo$ $
Sales price 200.00 140.00Costs
Direct materials 60.00 36.00Direct labour 20.00 30.00Variable factory overhead 40.00 20.00Fixed factory overhead 20.00 10.00Selling (all variable) 28.00 20.00Administrative (all fixed) 10.00 10.00
178.00 126.00Net margin 22.00 14.00
362
Manag Account-Chap 11 17/6/02 2:54 PM Page 362

8/12/2019 ManagAccount_Ch11
http://slidepdf.com/reader/full/managaccountch11 42/43
363C H A P T E R 1 1 • D I F F E R E N T I A L C O S T I N G A N D L I N E A R P R O G R A M M I N G
Required
Factory overhead is based on a rate of $15 per machine hour.(a) If there are 30 000 machine hours available, which product should be
produced?(b) If there are 30 000 machine hours available but the market for Gyro and
Heavo are 10 000 and 4000 respectively, which product or combinationof products should be produced?
11.14 Prepare a graph and solve the following linear programming model:Maximise:Z = 20X + 30Y Subject to:60X + 24Y ≤ 60020X + 40Y ≤ 400X , Y ≥ 0
11.15 Prepare a graph and solve the following linear programming model:Maximise:Z = 40X + 30Y Subject to:80X + 40Y ≤ 320020X + 70Y ≤ 1400X , Y ≥ 0
11.16 Woodenway Manufacturing makes table and chairs in four departments. Thetables and the chairs both require time in the woodworking and assemblydepartments, and the products are polished and completed in individualfinishing departments.
Output limitations by departments are:Department Weekly capacity and hours per product
Woodworking 560 hours (chairs, 4 hours; tables, 8 hours)Assembly 180 hours (chairs, 2 hours; tables, 2 hours)Chair finishing 70 chairs (2 hours per chair)Table finishing 60 tables (2 hours per table)
Chairs and tables contribute $30 and $40 respectively towards fixed costsand profits.
Required
Set this problem up as a graph and determine the number of chairs and tablesto be made each week so as to maximise profits. Assume that all products canbe sold and that the tables and chairs are not sold in sets.
11.17 Fiturn Pty Ltd operates two machines, X and Y, each of which can produce amixed output of two products, A and B. The possible hourly output fromthese two machines, and total requirements for the products for the day areshown on page 364.
Manag Account-Chap 11 17/6/02 2:54 PM Page 363

8/12/2019 ManagAccount_Ch11
http://slidepdf.com/reader/full/managaccountch11 43/43
M A N A G E M E N T A C C O U N T I N G . P R I N C I P L E S A N D A P P L I C A T I O N S
ProductsA B
Machine X —output per hour 5 2Machine Y —output per hour 10 1Total required per day 40 10
The variable cost per hour of running machine X is $10 per hour and formachine Y is $25 per hour.
Required
(a) Set this minimisation problem up as a linear programming model.(b) Prepare a graph and determine the number of hours each machine, X and
Y, should be run each day to satisfy the constraints and minimise runningcosts.
364
Manag Account-Chap 11 17/6/02 2:54 PM Page 364