management accounting and organizational change : impact
TRANSCRIPT

Edith Cowan University Edith Cowan University
Research Online Research Online
Theses: Doctorates and Masters Theses
2010
Management accounting and organizational change : impact of Management accounting and organizational change : impact of
alignment of management accounting system, structure and alignment of management accounting system, structure and
strategy on performance strategy on performance
Tuan Tuan Mat Edith Cowan University
Follow this and additional works at: https://ro.ecu.edu.au/theses
Part of the Business Administration, Management, and Operations Commons
Recommended Citation Recommended Citation Tuan Mat, T. (2010). Management accounting and organizational change : impact of alignment of management accounting system, structure and strategy on performance. https://ro.ecu.edu.au/theses/149
This Thesis is posted at Research Online. https://ro.ecu.edu.au/theses/149

Edith Cowan University
Copyright Warning
You may print or download ONE copy of this document for the purpose
of your own research or study.
The University does not authorize you to copy, communicate or
otherwise make available electronically to any other person any
copyright material contained on this site.
You are reminded of the following:
Copyright owners are entitled to take legal action against persons who infringe their copyright.
A reproduction of material that is protected by copyright may be a
copyright infringement.
A court may impose penalties and award damages in relation to
offences and infringements relating to copyright material. Higher
penalties may apply, and higher damages may be awarded, for
offences and infringements involving the conversion of material
into digital or electronic form.

MANAGEMENT ACCOUNTING AND ORGANIZATIONAL CHANGE:
IMPACT OF ALIGNMENT OF MANAGEMENT ACCOUNTING SYSTEM,
STRUCTURE AND STRATEGY ON PERFORMANCE
TUAN ZAINUN TUAN MAT
A thesis submitted in partial fulfilment of the requirements for the degree of
Doctor of Philosophy
School of Accounting, Finance and Economics
Faculty of Business and Law
Edith Cowan University, Perth
Western Australia
December 2010

MANAGEMENT ACCOUNTING AND ORGANIZATIONAL CHANGE:
IMPACT OF ALIGNMENT OF MANAGEMENT ACCOUNTING SYSTEM,
STRUCTURE AND STRATEGY ON PERFORMANCE
School of Accounting, Finance and Economics
Faculty of Business and Law
Edith Cowan University, Perth
Western Australia
Principal Supervisor: Professor Malcolm Smith
Associate Supervisor: Dr Hadrian Djajadikerta
December 2010

USE OF THESIS
The Use of Thesis statement is not included in this version of the thesis.

ii
ABSTRACT
The business environment in Malaysia has changed rapidly over recent decades, and
continues to change. Globalization has brought new technology and made the
business environment in Malaysia open to greater competition. Central Government
economic policy relating to ‘knowledge economy (k-economy)’ and vision 2020
have also opened the market up for competition and certainly increased
technological development. These changes have impacted greatly on the business
environment in Malaysia, especially on manufacturing industry, which has been
identified as the most active and important contributor to the Malaysian economy.
Literature has identified that changes in both external and internal organizational
factors have influenced changes in management accounting practices in
organizations. When business organizations respond to challenges by embarking on
a change management path, they are faced with the choices of which ones of the
many management methods, techniques and systems would be most effective. This
is important as the management accounting system plays an important role in
providing useful information to management, especially in the decision making
process. Many researchers have shown an interest in understanding the way in which
management accounting and organizational changes respond to the changing
business environment. However, most of this research has to date been conducted in
a developed economy setting especially in Western countries.
This study aims to investigate the impact of alignment among the changes in external
and internal organizational factors, with the changes in management accounting
practice on performance. The framework has been developed based on the literature
from Western countries and Malaysia (as well as other less developed countries).
The six areas in the framework comprise changes in external organizational factors
(namely, competitive environment and advanced manufacturing technology),
internal factors (namely, structure and strategies), management accounting practices
and performance. To meet the research objectives, a quantitative research design was

iii
adopted involving the use of a mailed survey to collect data from various types of
manufacturing companies in Malaysia. In total, 212 valid responses were obtained
and analysed. Structural equation modelling, using the CBSEM approach was
employed as the main statistical technique to test the hypothesized model. Non
parametric techniques were also employed to test the subsidiary hypothesis.
Interestingly, the findings of the study showed significantly different results from
those studies conducted in developed countries. It might be due to the government
policies which often favour firms in manufacturing industry (e.g., many incentives
are given to these firms). The results revealed a positive alignment among the
external environmental factors and organizational factors with management
accounting practices, which in turn positively impacted on organizational
performance. Surprisingly, the findings showed that changes in manufacturing
accounting practices and strategies were influenced by changes in advanced
manufacturing technology (AMT), but these changes were not influenced by changes
in market competition. Results also showed that neither market competition nor
AMT had influenced change in organizational structure.
This study also provides evidence of an interrelationship between management
accounting practices and structure, but with no evidence of a reciprocal relationship
between management accounting practices and strategy. Results from the subsidiary
hypotheses also support the main hypotheses. The distinctive findings obtained in
this study make a contribution to our knowledge of the relationship between
management accounting systems and organizational change, as well as providing
helpful insights to practitioners in making decisions in the face of a changing
business environment.

iv
DECLARATION
I certify that this thesis does not, to the best of my knowledge belief:
(i) incorporate without acknowledgement any material previously submitted
for a degree or diploma in any institution of higher education;
(ii) contain any material previously published or written by another person
except where due reference is made in text; or
(iii) contain any defamatory material.
I also grant permission for the Library at Edith Cowan University to make duplicate
copies of my thesis as required.
Signature: ..............................
Date: 6 December 2010

v
Some sections of this thesis have already been presented as conference paper or
conference proceedings, and have been published in an academic journal:
Conference paper and proceeding
Tuan Mat, T.Z., Smith, M., and Djajadikerta, H., 2009, Determinants of management
accounting change in Malaysian manufacturing companies. Proceedings of The 5th
International Management Accounting Conference, November, Kuala Lumpur,
Malaysia.
Paper published in academic journal
Tuan Mat, T.Z., Smith, M., and Djajadikerta, H., 2010, Determinants of management
accounting and control system in Malaysian manufacturing companies, Asian
Journal of Accounting & Governance, 1, 79-104.

vi
ACKNOWLEDGEMENT
I would like to acknowledge the foremost contribution provided by my Principal
Supervisor, Professor Malcolm Smith for his guidance throughout the completion
process of this thesis. He has made important comments and suggestions at every
stage of my learning process. The period of my study has been an opportunity for me
to learn from his experience and devotion to research. I would also like to thank Dr
Hadrian Djajadikerta for his association in supervising this project.
I wish to thank people who provided their academic knowledge to help me to
complete the thesis. I also wish to thank the University Teknologi MARA Malaysia
and Ministry of Higher Education Malaysia, for their financial support.
I am indebted to my family especially my husband, daughter and son for their
encouragement, support and love. They have been an inspiration to me. This
appreciation is also extended to my parents for their support and prayer for my
success. Without help from all of these people, it would have been difficult to
complete the study.

vii
TABLE OF CONTENTS
Use of Thesis................................................................................................................ i
Abstract ...................................................................................................................... ii
Declaration ................................................................................................................ iv
Acknowledgement .................................................................................................... vi
Table of Contents ..................................................................................................... vii
List of Tables ............................................................................................................ xii
List of Figures ......................................................................................................... xiv
CHAPTER ONE: INTRODUCTION AND OVERVIEW ..................................... 1
1.1 Introduction ........................................................................................................... 1
1.2 Background and Significance of the Study ........................................................... 3
1.3 Research Question................................................................................................. 6
1.4 Research Model..................................................................................................... 7
1.5 Study Design ......................................................................................................... 8
CHAPTER TWO: LITERATURE REVIEW ....................................................... 12
2.1 Introduction ......................................................................................................... 12
2.2 Management Accounting and Its Evolution........................................................ 12
2.3 Management Accounting Change ....................................................................... 15
2.3.1 Contingency Theory .................................................................................. 18
2.3.2 Institutional Perspectives ........................................................................... 21
2.4 Changes in Competitive Environment and Advanced Manufacturing
Technology.......................................................................................................... 23
2.5 Competitive Environment, Technology and Organizational Change ................. 26
2.5.1 Organizational Structure ............................................................................ 27
2.5.2 Organizational strategy .............................................................................. 29
2.6 Competitive environments, technology and management accounting
practices ............................................................................................................. 33

viii
2.7 Management Accounting and Organizational Change ....................................... 35
2.7.1 Management accounting and structural change ......................................... 38
2.7.2 Management accounting and strategic change .......................................... 41
2.8 Organizational Performance ............................................................................... 43
2.8.1 Management accounting practices and performance. ................................ 45
2.8.2 Organizational structure and performance. ............................................... 46
2.8.3 Organizational strategy and performance. ................................................. 47
2.9 Summary ............................................................................................................. 48
CHAPTER THREE: RESEARCH DESIGN ........................................................ 50
3.1 Introduction ......................................................................................................... 50
3.2 Background to the Survey ................................................................................... 50
3.2.1 Concept of Survey ..................................................................................... 52
3.2.2 Types of Survey ......................................................................................... 53
3.3 Questionnaire Design .......................................................................................... 55
3.3.1 Response Format and Scaling.................................................................... 56
3.3.2 Ethical Issues ............................................................................................. 57
3.3.3 Pre-Test ...................................................................................................... 57
3.4 Instrument Development ..................................................................................... 58
3.4.1 Section A ................................................................................................... 59
3.4.2 Section B.................................................................................................... 60
3.4.3 Section C.................................................................................................... 62
3.4.4 Section D ................................................................................................... 63
3.4.5 Section E .................................................................................................... 64
3.5 Sampling Procedures........................................................................................... 65
3.6 Data Collection Procedures ................................................................................. 68
3.7 Data Analysis ...................................................................................................... 70
3.7.1 Validity and Reliability of Measures ......................................................... 71
3.7.2 Structural Equation Modelling (SEM) ...................................................... 72
3.7.3 Data Distribution and Estimation Techniques ........................................... 75
3.7.4 Model’s Goodness-of-Fit (GOF) ............................................................... 77
3.8 Summary ............................................................................................................. 80

ix
CHAPTER FOUR: HYPOTHESES DEVELOPMENT ...................................... 82
4.1 Introduction ......................................................................................................... 82
4.2 Changes in Competitive Business Environment and Manufacturing
Technology.......................................................................................................... 84
4.2.1 Changes in Competitive Environments, Technology and Organizational
Structure..................................................................................................... 84
4.2.2 Changes in competitive environment, technology and organizational
strategy....................................................................................................... 85
4.2.3 Changes in competitive environment, technology and management
accounting practices .................................................................................. 86
4.3 Changes in Management Accounting Practices .................................................. 87
4.3.1 Changes in management accounting practices and organizational
structure ..................................................................................................... 88
4.3.2 Changes in management accounting practices and organizational
strategy....................................................................................................... 89
4.4 Impact on Performance ....................................................................................... 90
4.4.1 Effect of changes in management accounting practices on performance .. 90
4.4.2 Effect of changes in organizational structure on performance .................. 90
4.4.3 Effect of changes in organizational strategy on performance ................... 91
4.5 Subsidiary Hypotheses ........................................................................................ 92
4.6 Summary ............................................................................................................. 93
CHAPTER FIVE: PILOT STUDY ........................................................................ 94
5.1 Introduction and Background of Pilot Study ...................................................... 94
5.2 Research Method................................................................................................. 94
5.2.1 Sampling and Data Collection Procedures ................................................ 94
5.2.2 Research Instruments ................................................................................. 96
5.2.3 Data Analysis ............................................................................................. 98
5.3 Results and Discussion ....................................................................................... 98
5.3.1 Competitive Environment ......................................................................... 99
5.3.2 Technological Development .................................................................... 100
5.3.3 Organizational Structure .......................................................................... 101
5.3.4 Organizational Strategy ........................................................................... 103

x
5.3.5 Management Accounting Practices ......................................................... 104
5.3.6 Organizational Performance .................................................................... 107
5.3.7 Correlation Matrix for Operational Measures ......................................... 108
5.4 Conclusions and Implications for the Main Study ............................................ 109
CHAPTER SIX: DATA ANALYSIS AND HYPOTHESES TESTING ........... 111
6.1 Introduction ....................................................................................................... 111
6.2 Response and Non-Response Bias .................................................................... 112
6.3 Profile of Responding Companies .................................................................... 113
6.3.1 Industry classification .............................................................................. 114
6.3.2 Company Size .......................................................................................... 114
6.4 Exploratory Data Analysis and Reliability and Validity of the
Measurements ................................................................................................... 116
6.4.1 Competitive Environment ....................................................................... 117
6.4.2 Advanced Manufacturing Technology (AMT) ........................................ 118
6.4.3 Organizational Structures ........................................................................ 119
6.4.4 Organizational Strategy ........................................................................... 119
6.4.5 Management Accounting Practices ......................................................... 120
6.4.6 Organizational Performance .................................................................... 121
6.4.7 Implications for SEM .............................................................................. 123
6.5 Correlations among the Hypothesized Variables .............................................. 124
6.6 Structural Equation Model Analysis and Hypotheses Testing.......................... 125
6.6.1 Hypothesized Model ................................................................................ 127
6.6.2 Model Re-Specification ........................................................................... 131
6.6.3 Assessment of Structural Model Validity ................................................ 135
6.6.4 Hypotheses Testing.................................................................................. 135
6.7 Subsidiary Hypotheses Testing ......................................................................... 138
6.8 Summary ........................................................................................................... 140
CHAPTER SEVEN: DISCUSSION AND CONCLUSIONS ............................. 142
7.1 Introduction ....................................................................................................... 142
7.2 Discussion of Findings ...................................................................................... 144
7.2.1 Changes in Competition, AMT and Structure (H1) ................................ 144
xi
7.2.2 Changes in Competition, AMT and Strategy (H2) ................................. 145
7.2.3 Changes in Competition, AMT and MAP (H3) ....................................... 146
7.2.4 Changes in MAP and Structure (H4) ....................................................... 147
7.2.5 Changes in MAP and Strategy (H5) ......................................................... 148
7.2.6 Impact of Management Accounting and Organizational Change on
Performance (H6-H8) ............................................................................... 148
7.2.7 Technical Level Changes in MAP (H9-H12) ............................................ 150
7.3 Conclusions and Implications ........................................................................... 151
7.4 Contributions to Knowledge ............................................................................. 154
7.4.1 Theoretical contributions ......................................................................... 154
7.4.2 Methodological contributions ................................................................. 155
7.4.3 Practical contributions ............................................................................. 156
7.5 Limitations ........................................................................................................ 156
7.6 Future Research................................................................................................. 157
7.7 Summary ........................................................................................................... 158
REFERENCES ....................................................................................................... 160
APPENDICES....................................................................................................... 175
Appendix A: Information Letter and Questionnaire .............................................. 175
Appendix B-1: Sample Representation .................................................................. 184
Appendix B-2: Demographic Statistics .................................................................. 185
Appendix C: Normality Test for Items of Main Variables ..................................... 186
Appendix D: SEM Output ...................................................................................... 188

xii
LIST OF TABLES
Page
Table 3.1: Summary of Data Collection Procedure 70
Table 3.2: Summary of the Findings of Normality Issue 76
Table 3.3: Guidelines of Establishing Acceptable and Unacceptable Fit 81
Table 5.1: Items Asked in Questionnaire 96
Table 5.2: Descriptive Statistics for Main Variables 99
Table 5.3: Change in Competitive Environment 100
Table 5.4: Change in AMT 101
Table 5.5: Change in Structure 102
Table 5.6: Change in Strategy 104
Table 5.7: Change in MAP 105
Table 5.8: Management Accounting Change Dimensions 106
Table 5.9: Change in Organizational Performance 107
Table 5.10: Correlation Matrix 109
Table 6.1: Descriptive Statistics for Early and Late Respondents 113
Table 6.2: Industry Classification 114
Table 6.3: Results of Descriptive Statistics, Reliability and Validity
(Competitive Environment) 117
Table 6.4: Results of Descriptive Statistics, Reliability and Validity
(AMT) 118
Table 6.5: Results of Descriptive Statistics, Reliability and Validity
(Organizational Structure) 119
Table 6.6: Results of Descriptive Statistics, Reliability and Validity
(Organizational Strategy) 120
Table 6.7: Results of Descriptive Statistics, Reliability and Validity

xiii
(MAP) 121
Table 6.8: Results of Descriptive Statistics, Reliability and Validity
(Performance) 122
Table 6.9: Correlation Matrix among the Constructs 124
Table 6.10: Pearson Correlation Matrix among Hypothesized Variables 125
Table 6.11: Descriptive Statistics for Final Variables 126
Table 6.12: Goodness of Fit Statistics for Hypothesized Model (MLE) 130
Table 6.13: Goodness of Fit Statistics for Modified Model 132
Table 6.14: Goodness of Fit Statistics for Re-Modified Model 134
Table 6.15: Result of Hypothesis Testing 136
Table 6.16: Spearman Correlation Coefficients 139
Table 7.1: Summary of Hypothesis Testing 143

xiv
LIST OF FIGURES
Page
Figure 1.1: Basic Research Model 7
Figure 1.2: Conceptual Model 8
Figure 2.1: Gordon and Miller’s Framework 19
Figure 2.2: A Simplified Model of Contingency Theory 21
Figure 3.1: Basic Survey Process 51
Figure 3.2: Six-Stage Decision Process in SEM 73
Figure 4.1: Hypothesized Model 93
Figure 5.1: Steps Involved in Pilot Study 95
Figure 6.1: Company Size 115
Figure 6.2: Hypothesized Model (WLS) 127
Figure 6.3: Hypothesized Model (MLE) 128
Figure 6.4: Modified Model (Over Fit) 131
Figure 6.5: Re-Modified Model (Good Fit) 133
Figure 7.1: Final Model 150

1
CHAPTER ONE
INTRODUCTION AND OVERVIEW
1.1 Introduction
In the search to understand management accounting in competitive environments and
advance technologies, change has increasingly become a focus for research. Many
firms have experienced significant changes in their organizational design,
competitive environments and technologies. Business environments exhibit a variety
of structures and processes, including flat and horizontal organizational forms,
multidimensional matrix structures, networks of “virtual organizations” and self-
directed work teams. When business organizations respond to challenges by
embarking on a change management path, they are faced with choices of which one
of the management methods, techniques, and systems would be most effective
(Waldron, 2005).
Every organization is located within a particular configuration of contingencies. It is
dependent on the market and technological environment in which it operates its scale
and diversity of operations, the technology applied to its work, and the type of
personnel it employs. To achieve congruence, an appropriate design is the one which
best suits its contextual and operational contingencies. According to Moores and
Yuen (2001, p.352), “to be internally consistent, organizations must have tightly
independent and mutually supportive parts in terms of strategies, structures and

2
process”. The management of organizations faces a challenge to reinforce the
management accounting system, strategies and structures together in order to achieve
competitive advantage and enhance performance. Thus, research needs to be carried
out to help management make appropriate decisions in order to achieve this
congruence.
This study examines companies in Malaysia’s manufacturing industry in responding
to the rapid changes in technological and competitive environment in Malaysia as a
result of globalization. Globalization has changed the environment surrounding
organizations operating in developing countries with an increase in uncertainty,
intensified industry competition and advanced technology. According to Kassim,
Md-Mansur and Idris (2003) globalization brings in new technology and makes a
developing country open to greater competition. These changes may affect the choice
of management accounting practice (MAP) in an organization and may also result in
the need for the firm to reconsider its existing organizational design and strategies in
order to fit with the changing environment. This argument is supported by Burns and
Scapens (2000) and Shields (1997), who suggest that changes in environment cause
changes in organizations, which in turn cause changes in MAP.
As the firm strives to achieve a better fit with its environment, and to be more
successful; sustaining and improving current performance will become critical.
However, very limited research has taken place into how changes in technological
and competitive business environments have caused management accounting and
organizational change in developing countries. Most empirical evidence in this area
originates from research in developed countries (Baines & Langfield-Smith, 2003;
Burns, Ezzamel, & Scapens, 1999; Chenhall & Euske, 2007; DeLisi, 1990; Innes &
Mitchell, 1990; Libby & Waterhouse, 1996; Lucas & Baroudi, 1994; J. A. Smith,
Morris, & Ezzamel, 2005).
The next section presents the background and significance of the study, followed by
the research question, research model and research design.

3
1.2 Background and Significance of the Study
The business environment in a developing country differs from that within a
developed country with regards to market size, access to manufactured inputs, human
capital, infrastructure, volatility and governance. According to Tybout (2000),
although some developing economies are quite large, most are not; the menu of
domestically produced intermediate inputs and capital equipment is often limited; a
scarcity of technicians and scientists also affects flexibility in the production process
and the ability to absorb new technologies; infrastructure is relatively limited;
macroeconomic and relative price volatility is typically more extreme; legal systems
and crime prevention are also relatively poor; and corruption is often a serious
problem.
Malaysia is categorised as the developing country, however it has more advanced
infrastructure and technology compared to most other developing countries.
Malaysian manufacturing industries are also more concentrated than those of most
developed countries (Bhattacharya, 2002). With globalization, the application of
technology in Malaysia has increased, especially through foreign investment (Kassim
et al., 2003). Changes in business environment in Malaysia arising from a market-
oriented economy and government policies that provide businesses with the
opportunity for growth and profits, have made Malaysia a highly competitive
manufacturing and export base.
On the whole, manufacturing industries are the most active and important
contributors to the Malaysian economy after the services sector. In 2006 the
manufacturing sector contributed 31.1% of the total GDP, and 29.1% of total
employment1. In addition, Malaysia’s rapid move from a production-based economy
(p-economy) towards a knowledge-based economy (k-economy) allows companies
to do business in an environment that is geared towards information technology2. The
advance of technology through ICT and computerization has also made management
accounting information flow within organizations in this country more useful, timely,
accurate, and relevant (Omar, Abd-Rahman, & Sulaiman, 2004).
1 Source: FMM directory 2008 Malaysian Industries. 2 Source: Malaysia Industrial Development Authority (MIDA), http://www.mida.gov.my.

4
In developing countries, the manufacturing sector often receives preferential
treatment from policy makers. According to Tybout (2000), most developing
countries’ government promote manufacturing with special tax concessions and
relatively low tariff rates for importers of manufacturing machinery and equipment.
It is also argued that government policies often favour large firms; even when
policies do not explicitly favour large firms, these firms may enjoy de facto
advantages, because sectors with large capital-intensive firms lobby the government
more effectively (Tybout, 2000). Malaysia has industrialized rapidly in the last 20
years, and the confidence gained from this experience has led its leader to formulate
Vision 2020 and k-economy. However, Malaysia’s path to being an industrialized
country has not been based on strong domestic producers but has instead relied on
foreign multinationals to produce for export (Rasiah, 1995).
Based on the distinctive features of market size, access to manufactured inputs,
human capital, infrastructure, volatility and governance, as discussed above, it can be
concluded that the business environment in Malaysia is quite volatile from both
regulatory and macroeconomic perspectives as compared to developed countries,
especially Western countries like U.K., U.S. and Australia. Moreover, as
organizations grow through expanding their range of products or services in response
to more mature and saturated markets, they inevitably confront an increasingly
hostile environment (Moores & Yuen, 2001). But, if there is substantial uncertainty
about future demand conditions for these products, it often makes sense to choose
production techniques that do not lock one into a specific technology; that is, to rely
more heavily on labour (Tybout, 2000). This is because investment in fixed capital
involves long-term commitments to particular products and production volume.
Therefore, manufacturing firms in Malaysia may respond to the changes in
environment in different ways than firms in those countries. Even though much
research on management accounting and organizational change has been carried out
in Western countries like U.K, U.S and Australia, because of these differences,
empirical evidence obtained from research in these countries cannot necessarily be
generalized to the Malaysian environment.
Moreover, the introduction of fast information technology within which firms in
manufacturing industries in Malaysia operate has greatly affected the technological

5
environment. Much literature has identified technological advancement, active
competitors and demanding customers as potential predictors of organizational and
management accounting change (Baines & Langfield-Smith, 2003; Dibrell & Miller,
2002; Innes & Mitchell, 1990; Kaplan & Norton, 1996; Shields, 1997; Waweru,
Hoque, & Uliana, 2004). This aspect is important because the management
accounting system (MAS) requirement can vary significantly depending on how well
known the causes of change in the external environment and their indicators are to
the organization. This argument is supported by Waweru et al. (2004), who found
that an increase in global competition and changes in technology were the two main
contingent factors affecting management accounting change in South Africa. Apart
from these external organizational factors, previous studies also found that contextual
variable factors inside the organizations also have a connection to management
accounting change. As suggested by Moores and Yuen (2001), support from
strategies and structures are important to ensure a consistency in an organization.
Strategy and structure have also been identified in the previous literature as the most
important factors in management accounting change process. Thus, this study is
conducted to further investigate these relationships.
Unlike developed countries, MAP in developing countries may be gained through
“importing” management accounting systems in the manner adopted by foreign
companies establishing operations in developing countries (Abdul-Rahman, Omar, &
Taylor, 2002; Chow, Shields, & Wu, 1999). For example in Malaysia, local
manufacturing companies are still using traditional methods compared to
multinational corporations such as Japanese-owned companies, which mainly use
new management accounting techniques (Abdul-Rahman et al., 2002). Furthermore,
little research has been done in developing countries (see for example, Hoque &
Hopper, 1994; Waweru et al., 2004) and even fewer studies in Asian countries like
Malaysia (e.g., Abdul-Rahman, 1993; Nor-Aziah & Scapens, 2007). These factors
provide further motivation to carry out this research in Malaysia so that it can
contribute to a better understanding of the adoption of changes in organizational and
MAS in a developing country context.
Further, this study attempts to provide incremental contributions to the management
accounting change literature by explaining how organizations implement

6
management accounting innovations, or how redesign of their existing MAS can
improve organizational performance3 (Baines & Langfield-Smith, 2003; Chenhall,
2003; Hyvönen, 2007; Libby & Waterhouse, 1996; Mia & Clarke, 1999; Otley,
1980). Therefore, by looking into the performance implications of the possible
alignment between change in MAS and organizational factors within environmental
uncertainty, the findings of this study will make a significant contribution to
management accounting theory and literature as well as providing guidance for
decision makers, professionals and practitioners.
1.3 Research Question
In its broadest form, the proposed research will address this overall research
question:
“How does the alignment of the management accounting system with
organizational factors improve performance?”
In addressing this primary question, the study will concentrate on the influences of
technology and the competitive business environment on MAP, organization
structure, strategy and the impact of these changes on performance. More
specifically, this study addresses the following research questions:
1. What is the level of changes that have taken place in competitive
environment, manufacturing technology, MAP, structure and strategy in
Malaysian manufacturing companies?
2. How do changes in the competitive business environment and manufacturing
technology in Malaysia manufacturing companies influence the changes in
MAP, organizational structure and strategy?
3. In what ways do changes in MAP, organizational structure and strategy relate
to each other and to what extent will these changes take place?
4. What changes have been made to MAP in organizations facing changes in
3 Detail on this topic is discussed in the literature review chapter.

7
their configurations?
5. In what ways do the alignment among MAS and other organizational factors
influence performance?
1.4 Research Model
The literature review on management accounting and organizational change
presented in Chapter Two suggests the basic framework as presented in Figure 1.1.
Figure 1.1
Basic Research Model
Taking into account different factors which influence organizational and
management accounting change (as explained in Chapter 2), the basic model can be
refined and developed to fit the current study by focusing on the specific
environmental and organizational factors that can influence changes and performance
of an organization, as follows:
ORGANIZATIONAL
CHANGE
MANAGEMENT
ACCOUNTING CHANGE
CHANGES IN
ENVRONMENT
ORGANIZATIONAL
PERFORMANCE

8
Figure 1.2
Conceptual Model
1.5 Study Design
A review on management accounting and organizational change literature shows
some relatively neglected areas. For example the study by Baines and Langfield-
Smith (2003) examined the relationships between the changing competitive
environment, and a range of organizational variables as antecedents to management
accounting change. However, their study was based on the assumption of
unidirectional relationships between the variables. The literature review suggests that
some relationships are in the opposite direction, or even have reciprocal or reverse
causation, which will be further tested by this research. Some new relationships, not
tested by Baines and Langfield-Smith (2003), will also be tested in this study: the
cause of changes in competitive environment with management accounting practices,
changes in technology on organizational strategy, changes in organizational structure
on MAP and the impact of changes in management accounting practices,
organizational structure and strategy on performance. Although Baines and
Changes in
Manufacturing
Technology
Changes in
competitive
environment
Changes in
Organizational
Strategy
Changes in
organizational
structure
Changes in
MAP
Changes in
Organizational
Performance

9
Langfield-Smith (2003) examined the relationships amongst competitive
environment, technology, organizational design, advanced management accounting
practice, and change in reliance on non-financial management accounting
information, they only consider the direct relationship between greater reliance on
non-financial management accounting information and organizational performance.
They did not explore an interaction effect of this relationship on firm performance. A
study by Mia and Clarke (1999) also only indicates the moderating role of the use of
management accounting information on the relationship between the intensity of
market competition and business unit performance, and not the effect on firm
performance.
Based on the contingency fit argument, it can be argued that organizations are likely
to perform effectively if they implement MAS that suit their organization’s
situational factors in an uncertain environment. This suggests a two-way interaction
effect on firm performance between the change in MAS and organizational factors.
Thus, a reverse causation relationship between MAP and organizational factors is
tested in this study. In their study, Baines and Langfield-Smith (2003) also measured
organizational change by means of managers’ perception over a three-year period.
However, it may take organizations more than three years to make substantial
changes in investments in advanced manufacturing technology, or change their use
of MAP, in response to changes in the competitive environment. This study provides
a more detailed survey to capture the time lag between various organizational
changes, which is five years.
Kober, Ng and Paul (2007) studied the interrelationship between management
control systems and strategy in Australian organizations. Their analysis confirmed
the existence of a two way relationship between management control systems and
strategy, whereas, Chenhall and Langfield-Smith (1998b) examined how
combinations of management techniques and MAP enhance the performance of
organizations, under particular strategic priorities. This study extends these
contributions by investigating how the alignment between MAP, organization’s
strategy and structure can improve performance. The extension adds several
refinements to earlier studies, designed to add to the explanatory power of the prior
research. Therefore, a theoretical advance in knowledge can be achieved.

10
Using both contingency and institutional theory, this study contributes to an
elaboration of how the alignment of the MAS with organizational structure and
strategy can contribute to performance improvement in manufacturing firms in
Malaysia. Through providing a better understanding of these relationships, the study
can help practitioners to make better decisions in the face of a changing environment,
as well as helping the organization to overcome barriers to change. Moreover, it also
contributes to the improvement in organizational performance and competitive
advantage. Besides providing more helpful insights to practitioners, the theoretical
framework developed and tested in this study contributes to the organizational and
management accounting change literature.
This is an empirical research study. It is noted that few empirical research studies
have been conducted on this topic (Baines & Langfield-Smith, 2003; Libby &
Waterhouse, 1996; Sulaiman & Mitchell, 2005). Baines and Langfield-Smith (2003,
p. 675) noted that “there has been limited empirical research examining the nature of
the changes in MAS and organizational variables in response to environmental
changes, and whether or not these changes improve performance.” The current study
represents an attempt to fill such an apparent gap in prior research.
This study used a mailed survey of manufacturing companies registered with the
Federation of Malaysian Manufacturers (FMM). The selection of the manufacturing
industry for this study was due to the fact that this industry is known to have rapid
changes in technological and competitive environment. A survey questionnaire is
used as the main method of data collection to examine how changes in competitive
environment and advanced technology cause changes in organization’s design,
strategy and MAP, and how alignment among these variables impacts on
performance. This is a causal study and it attempts to examine how one variable
affects changes in other variables and how these variables are responsible for
changes in organizational performance. The design of the questionnaire for the
study will cover six major areas within the conceptual model and hypotheses, i.e.
competitive environment, advanced manufacturing technology, MAP, organization
structure, strategy, and performance.
The remainder of the thesis is organized as follows. Chapter 2 draws on previous
research to identify the different dimensions of change, causal factors and change

11
process. The adoption of the survey research method and research instruments are
explained and justified in Chapter 3, whereas the hypotheses for this study are
elaborated in Chapter 4. The discussion of findings for the pilot test is provided in
Chapter 5. Data analysis and hypotheses testing for this study are presented in
Chapter 6. Finally, the detailed discussion of the findings is presented in Chapter 7,
together with the conclusions and implications of the findings, its contribution to the
body of knowledge in this area, limitations, and also some recommendations for
future research.

12
CHAPTER TWO
LITERATURE REVIEW
2.1 Introduction
This chapter reviews the research literature on management accounting and
organizational change. It provides the basis for the design of the research conducted
both in terms of research methods used and the aspects of change upon the study.
This chapter is divided into nine sections. The first section discusses management
accounting and organizational change dimensions. This is followed by a discussion
of management accounting change process, the external environment and
technology, as well as a discussion of the relationship among competitive
environment, technology, organizational and management accounting change. The
final sections discuss aspects of performance with management accounting and
organizational change, together with a summary.
2.2 Management Accounting and Its Evolution
The basic purpose of accounting information is to help users make decisions.
Management accounting is branch of accounting that produces information for
managers and forms an important integral part of the strategic process within an
organization. It involves the process of identifying, measuring, accumulating,

13
analysing, preparing, interpreting, and communicating information that helps
managers fulfil organizational objectives (Horngren, Sundem, Stratton, Burgstahler,
& Schatzberg, 2007). Chartered Institute of Management Accountants (UK) views
management accounting as an integral part of management which requires the
identification, generation, presentation, interpretation and use of information relevant
to:
- formulating business strategy;
- planning and controlling activities;
- decision-making;
- efficient resource usage;
- performance improvement and value enhancement.
Johnson and Kaplan (1987) argued for a ‘relevance lost’ in management accounting.
They pointed the issue of inappropriateness of conventional management accounting
techniques which offered little capacity for providing useful and timely information
for better decision and control in the contemporary environment of rapid
technological change and vigorous competition. Following Johnson and Kaplan
(1987), management accounting techniques had rapidly developed for better
decision-making and management control.
To promote a better understanding of the changes in management accounting
practices, the International Federation of Accountants (IFAC) (1998) provides a
framework explaining the development of management accounting. This framework
explains the evolution in management accounting through four recognisable stages.
As explained by Omar et al. (2004, p. 27), the primary focus of each stage are:
Stage 1 (prior 1950)
During this period, most companies were focusing on cost determination, which was
related to stock valuation and the allocation of overheads. Some of the management
accounting techniques that were developed for cost estimation were Last In First Out
(LIFO) and First In First Out (FIFO). Cost estimation was justifiably emphasized
because by estimating the cost, managers were able to control their financial
position.
14
Stage 2 (1965-1985)
By 1965, companies had moved into generating information for the purpose of
management planning and control. This was important because only valuable
information could induce managers to make correct decisions. Management
accounting techniques such as marginal costing and responsibility accounting were
introduced during this stage to help managers to choose the correct course of action
or create strategic business units respectively.
Stage 3 (1985-1995)
Increased global competition accompanied by rapid technological development in the
early 1980s affected many aspects of the industrial sector. During this stage, the
management focus remained on cost reduction, but more process analysis was made
possible by cost management technologies. The aim was basically to reduce waste
when processing the product because this could reduce the expenses incurred, thus
increasing expected profit. Some of the techniques popularly practiced by companies
at this stage include Just in Time (JIT) and Activity-Based Costing (ABC).
Stage 4 (1995 onwards)
In the 1990s world-wide industry continued to face considerable uncertainty and
unprecedented advances in manufacturing technologies, which further increased and
emphasised the challenge of global competition (Abdel-Kader & Luther, 2008). In
this stage, companies focused on enhancing the creation of value through the
effective use of resources. Basically, managers tried to identify factors of drivers that
could potentially increase shareholder value. As such, non-value added activities
were deliberately eliminated. Among the popular techniques introduced during this
stage were Total Quality Management (TQM), Activity-Based Management (ABM),
Benchmarking and Reengineering.
Even though the management accounting evolution can thus be distinguished into
four stages, it is important to note that the techniques used in previous phases
continued to be used in subsequent stages. This is consistent with a view that
traditional and advanced management accounting practices tend to complement each
other (Chenhall & Langfield-Smith, 1998b).

15
2.3 Management Accounting Change
Management accounting change is not a uniform phenomenon. Consequently one
might expect the causal factors of change to be varied and this has indeed been
confirmed by management accounting researchers. It is evident that both the external
factors (environmental) and internal factors (relating to the organization concerned)
have influenced the recent development of new management accounting systems and
techniques. According to Shields (1997), the potential change drivers are
competition, technologies, organizational design and strategies. These drivers of
change also indicate the differing roles which causal factors can have in the process
of change. Change in environment also implies uncertainty and risk which create a
demand for further management accounting change in the form of ‘non-financial’
measures (Vaivio, 1999). Less attention has been given by researchers to the
management accounting change process. Burns and Scapens (2000, p. 4) observed
that, “little research attention has been given to understanding the processes through
which new management accounting systems and practices have emerged (or failed to
merge) through time”.
Change can be addressed in a variety of dimensions. According to The American
Heritage Dictionary, 4th Edition, change includes all of the following aspects:
becoming different or undergo alteration; transformation or transition; going from
one phase to another; making an exchange; modifying; substitution; giving and
receiving reciprocally; replace with another; abandon. This definition illustrates
different types of change and shows that, in general, it is not a uniform phenomenon.
Wickramasinghe and Alawattage (2007) suggest change in management accounting
as a learning methodology to understand how environmental factors shape internal
process within organization. According to them, the process of change reflects on the
question of how management accounting techniques emerged, evolved and were
transformed when new demands from the changing environment are in place.
From a management accounting perspectives, different types of change can be
researched upon. For example Sisaye (2003) study change with respect to the
integration of Activity Based Costing (ABC) into strategy to manage organization’s

16
operating activities. It is suggested that ABC can contribute to improve
organizational performance if implemented as part of the overall organizational
change strategy. Perera, McKinnon and Harrison (2003), examined changes in term
of introduction, abandonment and reintroduction of transfer pricing in government
trading enterprise as it moved from protected monopolistic status to
commercialization.
Many researchers have shown an interest in understanding management accounting
change (Baines & Langfield-Smith, 2003; Chenhall & Langfield-Smith, 1998b; Innes
& Mitchell, 1990; Libby & Waterhouse, 1996). For example Chenhall and
Langfield-Smith (1998b) have explored the benefit of management accounting
change, but less is known about the forces that induce this change (Laitinen, 2006).
The reasons for management accounting to change are termed “motivational factors”
(Laitinen, 2006). Many researchers have suggested a substantial list of motivational
factors (Baines & Langfield-Smith, 2003; Laitinen, 2001; Libby & Waterhouse,
1996). For example, Innes and Mitchell (1990) found a different set of circumstances
linked with management accounting change, which they termed as follows:
- Motivators (e.g., competitive market, organizational structure, and product
technology)
- Catalyst (e.g., poor financial performance, loss of market share,
organizational change)
- Facilitators (e.g., accounting staff resources, degree of autonomy, accounting
requirements)
The interaction between these variables promotes change not only in management
accounting but also other related disciplines4 (Innes & Mitchell, 1990; Laitinen,
2006). Laitinen (2001) classified these factors in six groups: information needs;
changes in technology and environment; willingness to change; resources for change;
objectives for change; and external requirements. Laitinen (2006), on the other hand,
used four categories of factors to explain management accounting change:
organizational factors; financial factors; motivational factors; management tools.
While, various factors have been associated with management accounting change,
4 For example in organizational study related to structure and strategy.

17
this study considers three factors, i.e., motivational factors, organizational factors and
financial factors. Changes in environment and technology are used as motivational
factors in explaining management accounting change and changes in organizational
factors (i.e., structure and strategy). Besides that, organizational structure and
strategy (organizational factors) are considered as contextual factors inside the firm
that may have a connection to change in management accounting (Moores & Yuen,
2001). Financial factors are used as outcomes of management accounting and
organizational change. Grandlund (2001) suggested that low financial performance
may put economic pressure on the firm to change its MAS to increase performance.
Baines and Langfield-Smith (2003) suggested that if management accounting change
is accompanied with a greater reliance on accounting information, it may result in
improved performance. Thus, financial performance may be an antecedent or an
outcome factor of management accounting change.
Many firms have experienced significant changes in their business environment with
advances in information technology, highly competitive environments, new
management strategies, and a greater focus on quality and customer services. Many
relevant management accounting studies have highlighted the significant changes in
these operating environments (e.g., Burns & Vaivio, 2001; Choe, 2004; Gomes,
Yasin, & Lisboa, 2007; Haldma & Laats, 2002; Hopwood, 1990; Hussain & Hoque,
2002; Innes & Mitchell, 1995; Kaplan & Norton, 1996; Libby & Waterhouse, 1996;
Scapens, 1999; Vamosi, 2003) which have influenced the choice of which
management accounting systems and techniques would be most effective (Waldron,
2005) and engendered the organization to reconsider its design and strategy (Baines
& Langfield-Smith, 2003) in maintaining and/or improving performance (Chenhall
& Langfield-Smith, 1998a; Choe, 2004).
Organizational change is a central issue within organizational theory, management
and accounting. Hopwood (1987, p. 207) claimed that ‘very little is known of the
processes of accounting change’. This has provoked controversy over the theory of
why and how changes are occurring. As argued by Quattrone and Hopper (2001, p.
404), ‘what the concept of change means, whether it can be conceptualized
independently from its process and how these factors relate to the practice of
accounting is taken for granted and is poorly understood. Researchers have
18
commended various theoretical frameworks to explain these accounting changes, e.g.
Gordon and Miller (1976) commend contingency theory whereas Burns and Scapens
(2000) proffer old institutional economic theory (OIE). Contingency theory
explained how changes in an environment surround organization causes changes in
organizational factor as well as its accounting practice and decision making process.
Whereas old institutional economic theory suggest how accounting and organization
can change through the process of institutionalization.
Management accounting research has used a variety of theoretical frameworks to
explain the changes. This study uses both contingency and institutional theory to
explain a need for a good fit between the MAS, external environment and
organizational aspects, to improve performance. This is similar to other studies on
management accounting and organizational change which also use contingency
theory (for example, Baines & Langfield-Smith, 2003; Haldma & Laats, 2002;
Hyvönen, 2007). The following sub-sections summarise the process of management
accounting change from each perspective.
2.3.1 Contingency Theory
Contingency theory is paramount to explain how accounting systems might be
affected by the fit between environmental and organizational factors. Central to the
contingency approach in examining these relationships is the notion of fitness.
Contingency is defined by the Oxford dictionary as:
“The relationship between behaviour and the consequences that is dependent
on that behaviour”.
Contingency theory posits that an appropriate match between organizational
characteristics to contingencies will improve organizational effectiveness (Morton &
Hu, 2008). Donaldson (2001, p. 7) defined “Contingency” as “any variable that
moderates the effect of organizational characteristics on organizational
performance”.

19
In the contingency theory of organizations, there is no universally acceptable model
of the organization that explains the diversity of organizational systems design.
Gordon and Miller (1976) suggested the usefulness of contingency theory for
developing effective management accounting systems. Gordon and Miller (1976)
proposed that the design of accounting information systems should be dependent on
firm-specific contingencies where environmental, organizational and decision style
variables could contribute to understanding such systems (see Figure 2.1).
Figure 2.1
Gordon & Miller’s Framework
Gordon and Miller (1976) also suggested operational measures for each component
of the model. The environmental measures include dynamism, heterogeneity and
degree of differentiation, bureaucratization, available resources, and integration
through committees, rules or policies.
A contingency perspective suggests that effective management accounting systems
should align with both internal and external factors. Depending on the match
between management accounting system characteristics and these various factors
affecting the organization, different levels of effectiveness might be witnessed.
Waterhouse and Tiessen (1978) expanded the organizational context to include both
environmental and technological factors, while Simons (1987) incorporated business
strategy into these measures.
Environment
Accounting Information
System
Organization
Decision
making
style

20
The identification of contextual variables in this study is traced from the original
structural contingency frameworks developed within organizational theory. Early
accounting researchers focused on the impact of environment and technology on
organizational structure (Otley, 1980; Waterhouse & Tiessen, 1978). According to
Chenhall (2007), a new research stream is related to the role of strategy. It has been
incorporated in the traditional organizational model which suggests important links
with environment, technology, organizational structure and MCS.
Over the last few decades, a number of innovative management accounting
techniques have been developed. This innovation is needed to support modern
technologies and new management process. As noted by Abdel-Kader and Luther
(2008, p. 3), “the new techniques have affected the whole process of management
accounting (planning, controlling, decision making and communication) and have
shifted its focus from a ‘simple’ role of cost determination and financial control, to a
‘sophisticated’ role of creating value through the deployment of resources”. It also
has been argued that these ‘new’ accounting techniques are important in the search
for a competitive advantage to meet the challenge of global competition. Thus, to
adapt to these technological development and competitive environment, firms must
design a MAS that is congruent with the new requirements (Gerdin, 2005). However,
it is also noted that few organizations have adopted these new techniques. As cited
by Abdel-Kader and Luther (2008), Tillema (2005) explain the appropriateness of
using advanced techniques is dependent on the circumstances in which these
techniques are being used and this gives rise to the need for a contingency theory
perspective.
Many researchers suggest that an appropriate accounting system depends upon
organizational contextual variables (Gordon & Miller, 1976; Otley, 1980;
Waterhouse & Tiessen, 1978). For example, Otley (1980) proposed the need to
identify specific aspects of an accounting system associated with certain defined
circumstances and demonstrate an appropriate matching. The contingency approach
to management accounting is based on the premise that, there is no universally
appropriate MAS that applies equally to all organizations in all circumstances
(Waterhouse & Tiessen, 1978). Thus, the complex relationship between MAS, its
contextual variables and its impact on organizational performance has attracted

21
numerous researchers to investigate this issue (Baines & Langfield-Smith, 2003;
Jermias & Gani, 2002; Laitinen, 2006). Figure 2.2 shows a simplified contingency
model by Weill and Olson (1989) which could be used to explain this contingent
relationship.
Drawing upon a structural contingency theory of management accounting, this study
examines how technology and environmental factors determine the degree of
changes in MAS and organizational factors (strategy and structure). Further, this
study examines whether firm performance is contingent on the alignment of
management accounting change with the organizational factor in technological
development and competitive environment.
Figure 2.2 A Simplified Model of Contingency Theory
in Organizational Research
2.3.2 Institutional Perspectives
Institutional theory is an adaptive change process framework. It examines the impact
of external environment factors and market conditions on organizational change and
development (Barnett & Caroll, 1995). Using institutional theory, Burns and Scapens
(2000) have conceptualized management accounting change as change in
organizational rules and routines. Under old institutional economic (OIE) theory,
management accounting is conceived as a routine, and potentially institutionalized,
ENVRONMENT PERFORMANCE
ORGANIZATIONAL SUBUNIT
ORGANIZATIONAL SUBUNIT

22
organizational practice. By being institutionalized, management accounting practices
can both shape and be shaped by institutions which govern organizational activity.
Within OIE theory, institution is defined as:
“a way of thought or action of some prevalence and permanence, which is
embedded in the habits of a group or the customs of a people” (Burns &
Scapens, 2000, p.5).
In OIE there are three dichotomies which offer insights into the process of
management accounting change. They are: (1) formal versus informal change;
revolutionary versus evolutionary change; and (3) regressive versus progressive
change (Burns & Scapens, 2000). The formal versus informal change dichotomy will
be used in this study as it is the most appropriate for explaining the reciprocal
relationship between management accounting and organizational change. Formal and
informal management accounting change is used to imply that change is not
specifically directed (formal change), but may evolve out of the intended actions of
the individuals who are enacting and reproducing organizational routines (informal
change). In this study, organizational routines are referred to as organizational
structure and strategy. On the other hand, the other two dichotomies, i.e.,
revolutionary versus evolutionary change, and regressive versus progressive change,
involve a disruption to existing routines and institutions, and focus on a value system
in management accounting changes process, which will not be examined in this
study.
Formal change occurs through the introduction of new management accounting
systems and techniques, which in turn, engender the organization to change. In
contrast, informal change occurs when change in an organization’s operation
condition (i.e. organizational activity such as ownership structure or production
technology) creates the need for change in management accounting practice. Hassan
(2005) provides evidence on formal change. He shows how management accounting
is acted upon to disrupt the hospital’s micro institutions and routines, challenge
physicians’ professional and bureaucratic power and therefore bring change to a
public hospital. J. A. Smith et al. (2005) show the occurrence of informal change
where, organizational change, as effected by the use of outsourcing, causes specific
changes to take place in the organizations' management accounting systems. Both

23
findings provide evidence of a reciprocal relationship between management
accounting and organizational change, where change in management accounting
practices can influence the organization to change (formal change) and change in
organizational activity also can influence management accounting practices to
change (informal change).
The management of change suggests how management accounting change is
intertwined with a changing organizational design and strategy; these have been the
most consistently used organization characteristic and variable in past research (e.g.,
Chenhall, 2003; Lapsley & Pallot, 2000). According to Sisaye (2003), the
institutional approach to organizational change which suggests that organizational
structures, that affect an organization’s learning strategy and ability to adapt changes
in the external environment, provide the context for at least two types of
organizational change strategies: gradual-incremental and revolutionary-radical. In
this case, the institutional framework maintains the view that organizations
irrespective of their structural arrangements, can successfully change if they
implement adaptive strategies of either incremental or radical change to bring about
process innovation changes. Ma and Tayles (2009) in their case study of the
emergence of strategic management accounting is also used institutional framework
to interpret the external and internal influences on the change in management
accounting techniques in their studied organization.
2.4 Changes in Competitive Environment and Advanced
Manufacturing Technology
Environment can be broadly characterized as phenomena that are external to the
organization and which have either potential or actual influence on the organization
(Macy & Arunachalam, 1995, p.67). The external environment may thus relate to
technology, law, politics, economics, culture and demographics. According to
Chenhall (2007, p. 172), environment refers to “ particular attributes such as intense
price competition from existing or potential competitors”. Uncertain environment,
which is impacted from high competition, is an important contextual variable in
contingency-based research.

24
Globalization has changed external environmental factors in developing countries,
which in turn affect the internal operations of organizations as well as their
management accounting practices. This relationship is explained using contingent
theoretic arguments that changes in management accounting practices and internal
operations of organizations are contingent on the “fit” with changes in the external
environment that surrounds them (for a review, see Abdel-Kader & Luther, 2008;
Haldma & Laats, 2002; Macy & Arunachalam, 1995). Competitive environment and
technology advancement have generally been assumed in the literature, to influence
the manufacturing company to change its management accounting practices, as well
as its organizational design and strategies. However, there is little empirical research
to support such relationships and little, if any, research has been conducted in the
context of developing countries.
This study investigates how the alignment between the adoptions of management
accounting practices with organizational structure and strategy in a competitive
environment with advanced technology, influence performance. As compared to a
developed country, Malaysia is categorized as an ‘uncertain’ country, with rapid pace
of change and which has the opportunity for economic growth. Fluctuating interest
rates, inflation, exchange rate and stock exchange indices, are evidence of a business
environment in Malaysia which is volatile. Increased economic uncertainty is an
important cause of changes in management accounting practices5 (Luther &
Longden, 2001). Mia and Clarke (1999) found a positive relationship between the
intensity of market competition and the usefulness of management accounting
information.
The pressure of management accounting and organizational change may come from
the environment of the firm. The most obvious environmental factor is market
competition (Hoque, Mia, & Alam, 2001; Libby & Waterhouse, 1996; Mia & Clarke,
1999). Literature has identified that organizations which operate in competitive
business environment tend to change their management accounting practices,
organizational structures and strategy in order to succeed (e.g., Baines & Langfield-
Smith, 2003; Chenhall & Morris, 1986; Chong & Chong, 1997; Libby &
5 Luther and Longden found that the mean response to the importance of increased uncertainty of the economic environment as a cause of changing management accounting practices in South Africa (high economic uncertainty) is higher than in the UK (more certain economic).

25
Waterhouse, 1996; Luther & Longden, 2001; Mia & Clarke, 1999; Pratt, 2004;
Waweru et al., 2004). For example, Luther and Longden (2001) found evidence that
the organization’s ability to sell abroad and to compete against imports changed
managerial and business practices, forcing change in management accounting.
Technology also becomes an important aspect of management accounting and
organization research drawing on the manufacturing sector. Previously, issues
concerning the role of MAS within advanced manufacturing settings such as Just-In-
Time (JIT), Total Quality Management (TQM) and Flexible Manufacturing (FM)
have been explored. According to Emmanuel, Otley and Merchant (1990),
technological contingency factors include the nature of the production process, its
degree of routine, how well means-end relationships are understood and the amount
of task variety.
It has been evident that new technology will lead to a change in cost structure
(Haldma & Laats, 2002). Since manufacturing technology becomes more advance,
the MAS also becomes more complex and sophisticated to cope precisely with the
manufacturing process. Tight global competition associated with advanced
manufacturing technologies has prompted the need for better cost management
which can be achieved by adopting appropriate MAS. But the adoption of
appropriate MAS alone is not enough in order for the firm to remain competitive;
manufacturing technologies need also to be consistent with business strategy and
organizational structure. Thus, an appropriate fit between technologies, MAS,
strategy and structure helps to build a competitive advantage, thereby enhancing
organizational performance (Hyvönen, 2007).
Hypotheses are formulated in this study using the contingent theoretic arguments that
changes in management accounting practices and internal organizational factors are
contingent on the “fit” with changes in the external environment. Contingency-based
studies have examined MCS as both dependent and independent variables. Good fit
means enhanced performance, while poor fit implies diminished performance
(Chenhall, 2007). This study also use an old institutional economic (OIE) theory
perspective, to explain the reverse causation relationship between organizational and
management accounting change (known as formal and informal change).

26
2.5 Competitive Environment, Technology and Organizational Change
An organization is often interpreted as a configuration of different characteristics.
Numerous dimensions of external context (such as environments, industries and
technologies) and internal organizational characteristics (such as strategies,
structures, cultures, processes, practices and outcomes) have been said to cluster into
configurations. According to Moores and Yuen (2001) organizational configurations
are sets of organizations that share a common profile with respect to key
characteristics such as strategy, structure and the decision making process. In most
configurational research, the focus is on the link between organizational
configuration and performance (Cadez & Guilding, 2008a). In configurational
theory, organizational performance is expected to be positively affected by the
selection of strategic choice and structural design that fits the chosen strategy (Cadez
& Guilding, 2008a).
In the changing environment, markets have become more competitive, mainly in
respect to an increased level of quality and competitively priced products.
Organization may respond to these changes by reorganizing their work processes
through adopting organizational design and strategy that have stronger customer
orientation. In order to compete, many organizations made considerable investments
in advanced manufacturing technology such as computer-integrated manufacturing
and just in time systems (Baines & Langfield-Smith, 2003), which in turn can
increase quality, productivity and flexibility as well as reduce cost.
The institutional approach to organizational change suggests that organizational
structures affect an organization’s learning strategy and ability to adapt to changes in
the external environment. It suggests that the organization structural arrangement can
successfully change if they implement either incremental or radical adaptive strategic
change (Sisaye, 2003). Theorists of revolutionary change have advocated that all
organizational elements such as strategy, structures, people, systems, and culture,
have to be changed simultaneously to achieve maximum organizational alignment
and effectiveness (Huy, 2001).

27
2.5.1 Organizational Structure
In contemporary competitive settings, organizations are increasingly concentrating
on factors that provide value to the customer (Cadez & Guilding, 2008a; Perera,
Harrison, & Poole, 1997). This customer-focus is triggering a flattening of
organizational structures. According to Chenhall (2008) the term “horizontal
organization” has evolved to reflect practices applied in companies that integrate
activities across the value-chain to support a customer-focus strategy. In horizontal
organizations, decisions are made by cross-functional management teams, including
management accountants (Baines & Langfield-Smith, 2003; Naranjo-Gil &
Hartmann, 2007; Scott & Tiessen, 1999).
Organizations are seen as having to deal with physical environments that are
changing more rapidly than the organizations themselves. Consequently, the pressure
on organizations to adapt and change their structures is immense (Schwarz &
Shulman, 2007). Organizational structures address the organization of work
activities, including both personnel and production systems. These structures can be
described along either functional or divisional dimensions, such as, management
controls, levels of hierarchy, decentralization, complexity of job tasks, degree of
functional specialization, and extent of departmentalization, which will vary
according to the organization’s size (Sisaye, 2003).
Structural change is offered as a means to help the organization evolve. This
transition is stimulated by rapid environmental change, increasing complexity and
uncertainty and the predominance of loosely coupled organizational components
(Schwarz & Shulman, 2007). The contingency theory literature indicates that factors
such as technology and the environment affect the design and functioning of the
organization. The past decade has also seen the development of several models of
technology-enabled structural change (Dibrell & Miller, 2002). According to
Khandwalla (1974), adopting new technologies may require changes in
organizational structures and work processes to better suit the capabilities of
improved technology. Thus, for better success, there is a need for a change to
organizational structure fostered by advanced technology applications.
Organizational design/structure represents the patterns and relationships that exist
28
among organization or work unit elements (Macy & Arunachalam, 1995, p.69). A
change in structure can be in the form of new organization structural, de-
departmentalization, centralization, decentralization and size (see, Burns & Scapens,
2000; J. A. Smith et al., 2005; Waweru et al., 2004). In Schwarz and Shulman
(2007), Scott (2005, p.468) emphasis that “organization structures are the product not
only of coordinative demands imposed by complex technologies, but also of
rationalized norms legitimizing adoption of appropriate structural models”.
With globalization, markets have become more competitive and the introduction of
fast information technology has greatly affected the technological environment
within which firms in developing countries operate. Particularly, with an increased
level of high quality, competitively priced product, and use of advanced
manufacturing technology, like computer aided manufacturing and just-in-time
production, firms may respond to reorganizing their work processes by adopting
structures that have stronger customer orientation (Baines & Langfield-Smith, 2003;
Dibrell & Miller, 2002; Keidal, 1994). In particular, a variety of team-based
structures has emerged, including self-managed work teams, and cross-functional
project teams (Cohen & Bailey, 1997). The adoption of teams is associated with
flatter hierarchies and the increased empowerment of lower-level managers and
employees (Chenhall & Langfield-Smith, 1998b; Shields, 1997). To ensure fast and
innovative responses in complex and dynamic environments, there has been a move
away from hierarchical controls and centralized decision making, towards the
allocation of more responsibility to lower levels of the firm.
The development of several models of competitive environment and advanced
technology with structural change can be seen from previous research (Baines &
Langfield-Smith, 2003; Dibrell & Miller, 2002; Lucas & Baroudi, 1994; Pitts, 1980;
Subramaniam & Mia, 2001). For example, Subramaniam and Mia (2001) suggest
that in a competitive environment, organizational commitment through managers’
value orientation towards innovations is influenced by increased decentralization.
Baines and Langfield-Smith (2003) show an indirect effect of competitive
environment on organization design, where the change in this organizational factor
appears to be a response to the change in strategy, which later resulted in changes in
organizational design. Some past studies had shown that competitive environment

29
and advancement in technology have directly affected organization design, where as
some other studies show indirect effects on organizational design.
Adopting new technologies may require changes in organizational structures and
work practices to better suit the capabilities of that technology. Dibrell and Miller
(2002), and Lucas and Baroudi (1994) suggest that advances in technology have
enabled managers to adapt existing forms and create new models for organizational
design that better fit the requirements of an unstable environment. The successful
implementation of information technology and computer networks in an organization
as well as the use of high degree automation and computer aided technology in
production systems (Choe, 2004; DeLisi, 1990; Harris, 1996), often require the
blending of technological and social skills, which can be best achieved through the
adoption of work-based teams or production cells. Dibrell and Miller (2002)
established that information technology has been a catalyst in the development of
new forms of organizational design, where these new structures emphasize products
and customers rather than mass production. A team may manage the complete
processing of products, with each employee performing several functions. Thus, it is
argued that the use of team-based structures in a competitive environment, together
with greater use of advanced technology, enables organizations not only to improve
their speed and flexibility of response, but also to improve the quality of that
response.
2.5.2 Organizational strategy
Since the middle 1980’s, there has been growing interest in researching the way that
manufacturing strategies can be used to gain competitive advantage (Langfield-
Smith, 1997). The dynamic nature of competition is intensifying due to the
increasing speed of knowledge, and is developed through information technology. As
a result, strategy development has had to change from a process of conception to a
process of learning (Feurer & Chaharbaghi, 1995). The strategy an organization
adopts constitutes the logic underlying its interactions with its environment.
According to Sisaye (2003), the strategy the organizations are likely to choose
depends on the nature of the environmental factors and the organizational change/

30
learning strategies and the degree to which organizations define their problems are
related to the type of learning strategy. As cited in Macy and Arunachalam (1995),
Chandler (1962, p.13) defines strategy as,
“the determination of the basic long-term goals and objectives of an
enterprise, and the adoption of courses of action and the allocation of
resources necessary for carrying out these goals.”
Hambrick (1980, p. 567) views strategy “as a pattern of important decision that
guides the organization in its relationship with its environment; affects the internal
structure and processes of organization; and centrally affects the organization’s
performance”. This study focuses on how firms use business strategy in a
competitive market to improve performance. In order to understand the strategic
choice process, it is important to add to our understanding a different type of strategy
typologies. A consideration should be made of the way firms’ position themselves
within their environment by way of competitive strategy. This involves the
identification of a firms’ strategic orientation and how this affects the way in which
MAS are developed and used. Notions of strategic orientation have been derived
from previous studies.
Miles and Snow (1978) developed four types of strategy typologies: prospector,
defender, analyser and reactor, whereas, Porter (1980) proposed two different type of
strategy, i.e., low cost strategy and product differentiation strategy. The typology
developed by Miles and Snow (1978) is based on how companies respond to a
changing environment and align environment with their companies. These generic
strategies are explained as:
Defenders – Firms with a narrow business scope. Top managers are highly expert
in their company’s limited area of operation but tend not to search outside their
domains for few opportunities. Consequently they seldom need to make major
adjustments in their methods of operations and their structure. They devote
primary attention to improving the efficiency of their existing operations.
Defenders operate in relatively stable product areas, offer more limited products
than competitors and compete through cost leadership, quality and service. They
engage in little product/market development.

31
Prospectors – Firms that almost continually search for market opportunities and
they regularly experiment with potential responses to emerging environmental
trends. Because of their strong concern for product and market innovation, they
are sometimes not totally efficient. Prospectors compete through new products
and market development. Product lines change over time and this type of
company is constantly seeking new market opportunities.
Analyser – Firms that operate in two types of product-market domain, one
relatively stable, the other changing. In their stable areas, these companies operate
routinely and efficiently through the use of formalised structures and processes. In
the turbulent areas, top managers watch their competitors closely for new ideas
and then rapidly adopt those that appear to be the most promising.
Reactors – Firms in which the top management frequently perceives change and
uncertainty occurring in their organizational environments but is unable to
respond effectively. Because these firms lack a consistent strategy-structure
relationship, they seldom make adjustments of any sort until environmental
pressure forces them to do so.
However, there have been debates regarding which one of these typologies best
represents holistic configurations of organizational factors. As cited by Cadez and
Guilding (2008b, p. 3), “Olson et al (2005) feel that the Miles and Snow’s typology
is limited due to its internal focus and proposed a hybrid model that represents a
synthesis with Porter’s low cost vs. differentiation typology”. However, according to
Govindarajan and Gupta (1985) the prospector and defender classifications of Miles
and Snow closely parallel with Porter’s differentiation and cost leadership strategies.
Empirical evidence indicates that strategies of defend/ cost leadership do not require
sophisticated information systems, while those of prospect/product differentiate do
(Chenhall, 2003; Langfield-Smith, 1997)
Increasing globalization has resulted in intense and aggressive competition, increased
customer demands and shorter product life cycles (Shields, 1997). A proper link
between strategy and manufacturing operations is the key to developing sustainable
competitive advantage (Porter, 1996). One way in which organizations’ can respond
to increasing customer demands of quality, flexibility and dependability of supply is
through the implementation of advanced information and manufacturing technology.

32
The competitive environment requires that firm’s are able to create value for their
customers and to differentiate themselves from their competitors through the
formulation of a clear business strategy (Simons, 1987). However, it is also argued
that to achieve competitive advantage, a clear business strategy itself is not
sufficient. It must be supported with appropriate organizational factors such as
effective manufacturing technology, organizational design and accounting
information systems (Jermias & Gani, 2002)
The organization should change its strategy to accommodate the change in
environment factors. Several researchers have established that an organization’s
strategy is set up in response to its competitive environment, and the appropriate
matching of strategy and the environment can enhance performance (Baines &
Langfield-Smith, 2003; Chenhall & Langfield-Smith, 2003). According to Davenport
(2000), organizations that do not have their information systems aligned with their
strategic objectives are less successful than organizations that have aligned their
information technology and strategy.
Several empirical researches have also studied the linkage between competitive
environment, advanced technology and strategy. For example, Baines and Langfield-
Smith (2003), Chenhall and Langfield-Smith (2003), Harris (1996), and DeLisi
(1990) show that firms facing a more competitive environment and technology
advancement will change towards differentiation strategy. Fuschs, Mifflin, Miller
and Whitney (2000) found that successful firms aligned key elements of strategy
with the environment. On the other hand, Baines and Langfield-Smith (2003)
confirmed that the relationship between changes leading to a more competitive
environment and changes towards a differentiation strategy were particularly strong,
reflecting environmental change as a driver of strategic change. Baines and
Langfield-Smith (2003) also show a significant relationship between changes in
strategy and changes in advance manufacturing technology.
As the environment becomes dominated by increasingly more demanding customers
and as competitors respond to customer demands in increasingly sophisticated ways,
a firm may place emphasis on developing differentiation strategy that emphasize
more customer-oriented aspects such as quality, flexibility, innovative products and
dependability of supply (Perera et al., 1997). DeLisi (1990), suggests that, in order to

33
enhance competitive advantage, strategy should be changed by employing advanced
information technology. Schroeder and Congden (2000), in a study of small to
medium-sized manufacturers, found the most financially successful firms were those
which demonstrated a tight alignment between strategy and technology, while Kotha
and Swamidass (2000) found that for firms competing on the basis of quality,
customer service, delivery reliability, product features and flexibility, investment in
advanced manufacturing technology resulted in superior growth.
2.6 Competitive environments, technology and management
accounting practices
Previous literature suggests that changes in environmental factors surrounding an
organization can have a significant impact on its accounting and control systems
(Baines & Langfield-Smith, 2003; Hoque & James, 2000; Innes & Mitchell, 1995;
Libby & Waterhouse, 1996; Scapens, 1999; J. A. Smith et al., 2005; Waweru et al.,
2004). For example Waweru et al. (2004) had identified factors which facilitate
change in their studied organizations as competition, technology, new shareholders,
new customers, new accountants, and poor financial performance. Market
competition and technology advancement have been identified as a major trigger for
management accounting change (Baines & Langfield-Smith, 2003; Libby &
Waterhouse, 1996; Waweru et al., 2004). This is based on the argument that with an
increase in uncertain environments, managers need specific forms of management
accounting information to support their decision needs and to assist them to monitor
progress against strategies. This argument is supported with previous contingency-
style management accounting research which suggested that an appropriate fit with
the environment and organizational system is needed to support managers’ new
information requirements (see for example, Chenhall, 2003; Gerdin & Greve, 2004;
Haldma & Laats, 2002; Lapsley & Pallot, 2000; Waweru et al., 2004). Gordon and
Miller (1976) was among the first to encourage this line of contingency-based
inquiry when it posited that MAS are associated with environmental, organizational
and decision-making style factors. The adoption of changes in management
accounting practice is expected to be high for firms operating in advanced
information technology and competitive contexts where understanding costs and

34
measuring performance are keys to survival.
In response to the changes in competitive environment and advancement in
technology, most previous management accounting change research studied changes
in advance management accounting techniques such as activity based costing (ABC)
and total quality management (TQM) (e.g, Abdul-Aziz, Chan, & Metcalfe, 2000;
Chenhall, 1997; Choe, 2004; Innes & Mitchell, 1995; Kaynak & Hartley, 2006;
Sisaye, 2003; Soin, Seal, & Cullen, 2002). Few studies examined the changes in
traditional management accounting techniques such as budgetary controls, standard
costing and cost-volume-profit analysis (e.g., Abernethy & Brownell, 1999; Libby &
Waterhouse, 1996; Waweru et al., 2004).
The efficient and effective management accounting and control system (MACS) is
vital to an organization’s survival; this is evident with the increased focus on quality
and better customer service by firms wishing to retain competitiveness. To remain
competitive, the organizations need to monitor a diverse range of competition factors
such as competition for price and market share, marketing and product competition,
number of competitors, and competitors’ actions, which can be achieved through the
use of MAS that tracks both financial and non-financial performance (Baines &
Langfield-Smith, 2003; Hoque et al., 2001). Haldma and Laats (2002) examined the
influence of external environment, technology and organizational aspects on MAS
change within an Estonian company. They found that increasing competition and
change in market structure have affected the MAS and the use of AMT is associated
with tightening global competition and increasing fixed cost.
It is argued that with the introduction of new technologies in manufacturing
operations, the structure of manufacturing costs has changed. Thus, it requires MAS
to be designed to support, not restrict, the drive for excellence. In the new
environment many firms found their traditional cost accounting measures were
inhibiting the introduction of innovative processes and technologies (Abdel-Kader &
Luther, 2008). The contemporary manufacturing environment focuses on improved
production technology through computer-aided design (CAD), computer-aided
manufacturing (CAM), robotics and efficient operating systems (Askarany & Smith,
2008). These innovations have implications for business operations including MAS.
Technology has become an interesting topic for research, especially in identifying its

35
effect on MAS (Askarany & Smith, 2008; Baines & Langfield-Smith, 2003; Hoque
et al., 2001).
According to Baines and Langfield-Smith (2003), organizations that adopt new and
more advanced manufacturing technologies need to change their MAS to better align
them to adopted technology, to facilitate operations, and to be more successful.
However, Baines and Langfield-Smith (2003) found no significant relationship
between advanced manufacturing technology and advanced management accounting
practices. It has been also suggested that a firm with a fully automated production
environment requires a different kind of MACS such as ABC (Hoque, 2000). Thus,
traditional systems itself cannot effectively help managers to manage resources as
well as identifying relevant cost. Choe (2004) from his study on Korean
manufacturing firms, found a significant positive relationship between the level of
advanced manufacturing technology and the amount of information produced by the
management accounting information system. Thus, it can be concluded that
competitive environment and technological developments in organizations are likely
to have a positive influence on MAS change.
2.7 Management Accounting and Organizational Change
Contingency researchers have argued that MAS and control systems, structures and
processes are influenced by environmental uncertainty, production technology and
strategy. There are various organizational factors that describe those contextual
variable factors inside and outside the firm and which may have a connection to
management accounting change (Laitinen, 2006; Moores & Yuen, 2001). These
contextual variables such as uncertainty, strategy, structure, firm size, production
technology, organizational capacity and intensity of competition are linked to
management accounting change (Laitinen, 2001; Libby & Waterhouse, 1996;
Simons, 1987).
These factors can be broadly classified into environmental and internal factors
(Laitinen, 2006). A detailed discussion on environmental factors had been presented
previously, but we still need to evaluate the interrelationship between management
accounting change and internal factors, i.e., structure and strategy. While previous

36
studies have added to our understanding of the interrelationship between contextual
variables and management accounting change, few, if any, contingency studies have
successfully developed and measured the construct of “appropriate match” between
them. Moores and Mula (1993) suggest that the designers of MAS consider both the
strategy pursued and structure adopted before providing information for decision
makers, to ensure organizational effectiveness. Several empirical studies have tested
the contingent relationship among MAS, organization structure and strategy, and
have found a proper match among them (e.g., Baines & Langfield-Smith, 2003;
Chenhall & Langfield-Smith, 1998b; Moores & Yuen, 2001). However, no study
known to the author, investigates the interrelationship among these variables.
The role of a management accounting system is to provide up-to-date information to
help managers reach informed economic decisions, and to motivate users to aim and
strive for organizational change (Horngren, 1995). Failure to rely on appropriate
accounting information may contribute to ineffective resource management and a
gradual decline in organizational performance. According to Omar, et al. (2004) the
integration of traditional with new management accounting techniques could result in
more effective management accounting systems. Such an integrated phenomenon is
very commonly practiced by Japanese companies worldwide, including in Malaysia.
In contrast with foreign companies, it is found that local manufacturing companies in
Malaysia are still largely employing traditional management accounting systems to
meet their need for both internal and external reporting purposes (Omar et al., 2004).
Another view suggests that comparing traditional and advanced management
accounting practices requires a more holistic view as both sets of practices tend to
complement each other (Chenhall & Langfield-Smith, 1998b). This is explained by
IFAC’s evolution of management accounting, where the traditional techniques
developed in the early stage are continuously used in later stages. Calls for the
development of strategic management accounting are based on the perception that
traditional systems are inadequate in providing information to assist in developing
manufacturing strategies that enable the firm to compete on quality, reliable delivery,
flexibility as well as low cost (Moores & Mula, 1993). Thus, the issue of whether
advanced management accounting practices should be used to complement or
substitute for traditional management accounting practices in a changing

37
environment is still not settled. As noted by Chenhall and Langfield-Smith (1998b, p.
257) “... contextual factors such as manufacturing technology (for example, robotics
and automation) and product diversity may affect the potential usefulness of
traditional management accounting practices. Clearly, the impact ... of combining
traditional and contemporary management accounting practices could be considered
in future research”. Further evidence on this issue might result from this study.
Despite the unsettled issue of types of change in management accounting techniques,
change in an organization’s environment imposes other demands on MAS, including
the necessity of making suitable changes to maintain effectiveness. The effectiveness
of using MAS as a platform for change can be explained by considering the extent to
which the organization develops temporal capacity that is required to manage the
alignment of different modes of change (Chenhall & Euske, 2007). Burns et al.
(1999) argued that changes in management accounting practices are not necessarily
confined to the introduction of new systems (replacement of the existing system);
changes can be in the way management accounting is used (output or operational
modification).
Sulaiman and Mitchell (2005) explored the forms which management accounting
change can take by utilizing a simple typology of MAS change derived from existing
research literature. They found it to consist of addition, replacement, output
modification, operational modification and reduction. They found that replacement
of existing techniques and information output modifications are particularly
significant as these types of change have both a relatively high frequency and
importance.
Management accounting change ranged from comprehensive a costing system to
tentative, partial and temporary change of a more modificatory type (see, Anderson
& Young, 2001; Innes & Mitchell, 1990). The classification of management
accounting change has also been studied by several researchers. For example, Vaivio
(1999) provide instances of change involving the supplementation of information in
existing performance measurement packages, whereas Granlund (2001) observed the
replacement of management decision support system with new techniques.

38
2.7.1 Management accounting and structural change
Organizational structure is one of the primary factors in establishing the overall
control system within an organization, so that the activities of the organization can be
carried out. According to Moores and Mula (1993), MAS forms an important part of
the information and control systems that reinforce and support the basic intent of the
formal structure. They reported that findings from previous research show that large
and technical sophisticated firms were associated with administrative control
strategies defined by decentralisation and structuring with a strong emphasis on
MAS. Whereas, small and dependent firms were associated with interpersonal
control strategies (described by centralisation and lack of autonomy; organic
structure with future oriented information; and decentralisation with perceived
usefulness of aggregated and integrated information). It is also suggested that when
the firm is confronted by high uncertainty a decentralised structure is required, and
consequently a more sophisticated MAS (Abdel-Kader & Luther, 2008). More
sophisticated reports from MAS can help to reduce uncertainty and improve
managerial decision making (Chong & Chong, 1997). This finding leads to a
conclusion that the design of MAS and the control process depend on (or are
contingent upon) the context of the organizational setting in which these controls
operate. However, very few accounting-control researchers have examined the direct
effects of this organization structure on MAS design (Gerdin, 2005).
MAS innovation is influenced by the propensity of organizations to innovate and
their capability to implement innovations. Organizational structure encourages or
discourages the implementation of innovations (Gosselin, 1997). Gosselin (1997)
also stated that organizational innovation theories have been developed and tested
empirically in many organizations, mainly from the non-profit and public sectors.
Very few of these theories were tested in manufacturing environments, and none of
these innovation theories have been studied in an accounting setting. However, this
study does not intend to test the organizational innovation theories, but to investigate
the existence of any interrelationship between MAS and organizational structure, and
whether the alignment between them can improve performance.
As much research focuses on the need for structural change to improve performance
(Michael, Barsness, Lawson, & Balkundi, 2004; Miller & Friesen, 1982), very

39
limited research has focused on the what drives this change. Baines and Langfield-
Smith (2003) have identified competitive environment, technology and strategy as
drivers of structural change. But, the role of MAS in structural change has not been
incorporated. Some of the previous research (Gosselin, 1997; Scott & Tiessen, 1999)
studied the association between MAS and organizational structure. However, they do
not explicitly consider the interrelationship between MAS and organizational
structure and whether the alignment between these two variables can improve
performance.
A study by Gosselin (1997) classified activity-based costing (ABC) as an
administrative innovation, where its implementation may lead to new administrative
procedures, policies and organizational structure. They show that more centralized
and more formal organizations tend to adopt ABC. In recent years management
accounting innovations such as total quality management (TQM), ABC and activity-
based management (ABM) have developed as a response to the changing nature of
operations and competition (Chenhall & Langfield-Smith, 1998a). These
management accounting practices are not restricted to production processes, but also
include innovative approaches to restructuring work practices and developing new
planning and control systems. Many management accounting innovations associated
with these change programs rely on promoting a high degree of employee
involvement, often using work-based teams. The result is that much of the
responsibility for delivering change lies with not only the shop-floor employees
(Cohen & Bailey, 1997) but also senior management. Ma and Tayles (2009) found
evidence that the new management accounting techniques would be adopted if it met
the needs of senior management and it would not have taken place without their
support.
Centralization (or vertical structure) has probably been the most prominent structural
factor in the previous empirical research studying MAS design and changes (for
example, Chenhall & Morris, 1986; Libby & Waterhouse, 1996). In a centralize
structure, the decision making process is less effective and costly because knowledge
has to be transferred to the person who has decision rights. Whereas, under
decentralization the decision rights are transferred to the person who has the
knowledge (Matejka & De Waegenaere, 2000). Matejka and De Waegenaere (2000)

40
found centralized organization will implement changes in their accounting systems
less often than decentralized ones. This result is supported by Chenhall (2008, p.
525), where he noted that accounting systems are consistent with horizontal (or
decentralized) organizations. He suggested that “strategic management accounting
has characteristics related to aspects of horizontal organization as they aim to
connect strategy to the value chain and link activities across the organization...”.
According to Chenhall (2008), a common approach in horizontal organization is
identifying strategic priorities with a customer-oriented focus and then developing
process efficiency and continuous improvements, flattened structures with a team-
based focus and empowerment to help institutionalize change. On the other hand,
Verbeeten (2010) found decentralization has negatively associated with major
changes in the decision-influencing components of MACS.
A critical aspect of adopting team operations is the process of empowerment. Teams
cannot simply be delegated responsibilities. Empowerment places both authority and
responsibility at low levels in an organization. Changing the organization structure,
including the use of teams and employee empowerment, will result in changed
employer and employee expectations, including increased access to relevant
information (Scott & Tiessen, 1999), particularly, management accounting
information.
In an exploratory study of the relationship between an organization’s environment,
structure and MAS, Gordon and Narayanan (1984) concluded that structure was not
significantly related to MAS. Instead they found that MAS and organization
structures are both functions of environmental uncertainty. This is consistent with
findings of Moores and Mula (1993). They found that organizational structure
appears to be of major importance relative to environmental uncertainty and as a
driving force behind the design of MAS. Haldma and Laats (2002) found
organizational structure to be one of the organizational aspects influenced MAS to
change. Whereas Ma and Tayles (2009) found a considerable evidence of how
adoption of new strategic management accounting techniques and approaches
support the new organizational structure. Thus, it would appear that MAS and
structures are perhaps designed contemporaneously as internally consistent control
packages.

41
The role of management accounting in this changed organization structure is not
simply to deliver cost data, but to provide a service that empowers team members to
make the best decision in the light of current changing conditions (Gordon & Miller,
1976). The management accounting of an organization is seen to be both one element
of organizational structure and a consequence of the chosen structure (Luther &
Longden, 2001). Gerdin (2005) also agreed that management control subsystems
may not only complement each other but also substitute for each other. However this
relationship is rarely, if ever, addressed in the previous research. By using a
contingency framework this study aims to address this gap.
2.7.2 Management accounting and strategic change
Competitive advantage and superior performance can be gained through an adoption
of MAS tailored to support business strategy (Simons, 1987). This includes the
implementation of manufacturing processes and administrations functions that
support their particular strategic priorities. It is argued that, the use of management
accounting techniques, especially advanced techniques, can assist employees to more
easily focus on achieving differentiation priorities, such as quality, delivery,
customer service, as it highlights the need to satisfy customer requirements. For
example target costing allows managers to focus on low cost while simultaneously
maintaining customer expectations in areas of quality and functionality. According to
Seal (2001), the MAS is presented as system differentiation. From the perspective of
business policy, system differentiation may be the basis of a successful competitive
strategy.
Strategy represents a very important contingency variable. MAS which is tailored to
support strategy can lead to competitive advantage and superior performance
(Langfield-Smith, 1997). Many scholars suggest that a congruent match between
strategy and MAS is essential to performance (Govindarajan & Gupta, 1985; Simons,
1987). This argument is supported by Kaplan and Norton (1996). They suggest that
the appropriate performance measurement system encourages actions that are
congruent with organizational strategy. Chenhall and Langfield-Smith (1998b) found
that high performing product differentiator strategy firms are associated with

42
management techniques of quality systems, integrated systems, team-based human
research structure, and MAPs incorporating employee-based measures,
benchmarking, strategic planning and activity-based techniques. On the other hand,
high performing low-cost strategy firms are associated with management techniques
of improving existing processes, integrating systems, innovating manufacturing
systems and activity-based techniques. According to Verbeeten (2010) prospecter
and analyzer strategies appear to be positively associated with major changes in
MAS. Therefore, it can be concluded that strategy is an important factor in the design
and use of MAS. This conclusion is congruent with the suggestion by Simons (1987)
where MAS have to be modified in accordance with the strategy of a company.
Moreover, more contemporary viewpoints suggest that there may be a two-way
relationship between these two variables, where “MAS shapes, and is shaped by,
strategy” (Kober et al., 2007, p. 425). A study by Perera et al. (2003), on the
diffusion of transfer pricing innovation suggests that, management accounting
practices may both change as a result and instruments, and vary between the two in
the same organization over time. This result made visible the reciprocal relationship
between management accounting practices and strategy.
This view is confirmed by Kober et al. (2007), where they found that the interactive
use of MAS mechanisms helps to facilitate a change in strategy, and that
mechanisms change to match change in strategy. However, their study did not test
the effect of this relationship on performance. Some other studies have also
investigated the relationship between MAS and strategy. But these studies did not
explicitly consider the interrelationship between MAS and strategy (Baines &
Langfield-Smith, 2003; Hyvönen, 2007; Libby & Waterhouse, 1996). For example,
Baines and Langfield-Smith (2003) found a significant relationship between changes
in strategy and management accounting practices. This finding is supported by prior
research that has found that practices such as quality improvement programs and
benchmarking can support firms pursuing a differentiation strategy (see for example,
Chenhall & Langfield-Smith, 1998b). Ma and Tayles (2009) in their case study also
illustrated an eventual successful management accounting change with clear strategic
focus as a result. They suggest that the adoption of the new practices should be fit
with the organizations’ strategic agenda and those practices that show high relevance
43
to organizations’ strategic objectives are adopted.
The traditional views of the relationship between MAS and strategy suggest that
MAS is an outcome of organizational strategy. Thus, it is not surprising that many
contingency studies have been focusing on organizations’ establishing strategies.
However, with an increasing environmental uncertainty, MAS no longer acts as an
outcome of strategy only, but must help facilitate strategic change in a proactive way
(Kober et al., 2007). It is suggested that an accounting system could help shape the
development of an organization through time (Hopwood, 1990). Kloot (1997) also
suggests that MAS both impacts on, and is affected by, strategy. Thus this study
could shed light on the observations of previous research on the relationship between
MAS and strategy, and how the alignment between them can help in performance
improvement of an organization.
2.8 Organizational Performance
As presented earlier, performance may be an antecedent or an outcome factor of
management accounting and organizational change. Prior studies show that there
may be a link between performance and change. Low financial performance is said
to be one of the reasons for the firm to change its management accounting and
internal organizational factors to improve performance (Granlund, 2001; Laitinen,
2006).
The contingency theory of management accounting suggests that if organizations
implement MAS that suit their organizational and environmental factors, they are
likely to perform better (Chenhall, 2003; Otley, 1980). This approach asserts that
neither the MAS, nor the organizational configuration will effect performance; it is
the fit between MAS and its contextual variables which is the most important
determinant of performance (Jermias & Gani, 2002). Thus, this study investigates
whether the changes in organizational and MAS actually helps firms to improve
performance.
Much research on management accounting and organizational change focuses on
performance in relation to its measurement (e.g., Andon, Baxter, & Chua, 2007;

44
Chenhall & Langfield-Smith, 1998a, 2003; Feurer & Chaharbaghi, 1995; Gomes et
al., 2007; Hoque, 2005; Hoque et al., 2001). Even though some past research has
examined the impact of management accounting and organizational change on
organizational performance (see for example, Baines & Langfield-Smith, 2003;
Choe, 2004; Hoque, 2004; Sisaye, 2003; Waclawski, 1996), these studies examine
the impact of performance from one point of view only, either as a result of
organizational change or management accounting change (e.g., Waclawski, 1996),
and most of this research shows an indirect relationship between organizational
change or management accounting change on performance (e.g., Baines &
Langfield-Smith, 2003).
Hoque (2005) used non-financial performance measures in evaluating organizational
performance operating in an uncertain environment. He argued that traditional
performance measures are unable to satisfactorily reflect firm performance affected
by today’s changing business environment. Traditional measures which focus mainly
on financial criteria such as return on investment or net earnings are narrow in focus,
historical in nature and in many cases are incomplete (Hoque et al., 2001). It is
argued that non-financial performance measures may enable a firm to address
environmental change by clearly monitoring core competencies of the organizational
process as well as creating greater efficiency throughout the organization and help
managers to assess changes in their business environment, determine and evaluate
progress towards the firm’s goals, and affirm achievement of performance (Kaplan &
Norton, 1996). This argument is supported by findings from Baines and Langfield-
Smith (2003) which indicate that organizational performance is significantly
associated with an increased reliance on non-financial management accounting
information.
Hoque et al. (2001) suggest that in today’s environment of computerized
manufacturing and fierce competition, organizations need a multidimensional
performance measurement system that should provide continuous signals as to what
is most important in their day-to-day activities and where efforts must be directed.
Thus, for this study, multiple performance measures are used to measure
performance in manufacturing companies because the use of traditional performance
measurement alone is not enough to measure performance for organizations

45
operating in highly competitive and advanced technology environments.
From the literature, it is suggested that organizational performance tends to be
dependent upon the existence of fit between the use of organizational systems and
the situational factors (Baines & Langfield-Smith, 2003; Chenhall & Morris, 1986;
Haldma & Laats, 2002; Hoque, 2004; Hyvönen, 2007). Langfield-Smith (1997)
provides evidence that a good match among organization’s environment, strategy
and internal structures, and MAS may result in high organizational performance.
As discussed previously, in contingency management accounting research, the fit of
the relationship between the use of MAS and contextual variable is expected to have
an influence on organizational performance. However, this has not been tested in
previous management accounting change research (Baines & Langfield-Smith, 2003;
Libby & Waterhouse, 1996). Therefore, this study explores whether an alignment
between the change in MAS and the above factors might produce superior
performance.
2.8.1 Management accounting practices and performance.
There is strong empirical support for the association between management
accounting practice and performance, with an increased use of non-financial
information. For example, Baines and Langfield-Smith (2003) show that a greater
reliance on non-financial accounting information resulted in improved organizational
performance. Chenhall and Langfield-Smith (1998b) found a greater use of advanced
management accounting practices, such as quality improvement programs,
benchmarking and activity-based management, in firms that placed a strong
emphasis on product differentiation strategies, ultimately resulting in high
performance.
Perera et al. (1997) found a positive association between the emphasis placed on
various forms of management accounting practices in an environment of
manufacturing flexibility, and the use of non-financial measures such as defect rates,
on time delivery and machine utilization. Ittner and Larcker (1995), and Sim and
Killaough (1998) both found a significant positive interaction between TQM

46
practices, management accounting information and performance, while Mia and
Clarke (1999) found an indirect association between the intensity of market
competition and business unit performance through the use of management
accounting information.
While prior studies provide useful insight into management accounting change and
innovations in organizations, so far little, if any, systematic empirical assessment on
whether an alignment of MAS change with organizational factors in uncertain
business environment may improve performance. Laitinen (2006) suggests that large
changes in MAS may be associated with good financial performance. Those
organizations which implement new MAS expect to improve their decision making
or firm performance, thus, it is important to extend this matter to management
accounting research.
2.8.2 Organizational structure and performance.
The contingency approach suggests that combinations of situational and structural
variables may be more associated with organizational performance than either of
these variables acting alone (Dalton, Todor, Spendolini, Fielding, & Porter, 1980).
As cited in Dalton et al. (1980), Zwerman (1970) found no association between
technology-structural fit performance, and Pennings (1976) reported that the fit
between structural and environmental variables appeared to have little effect on
performance. However, Baines and Langfield-Smith (2003) found that strategy is
driving changes in organization design (with a greater use of team based structures)
and resulted in improved organizational performance (with a greater reliance on non-
financial management accounting information). None of these studies focus on the
interrelationship between structure and MAS in performance improvement.
With the increasing use of team based structures, there is an increased need for easily
accessible and relevant information at these levels, as well as relevant information
for top management to evaluate the operations of the firm. Scott and Tiessen (1999)
suggest that non-financial performance measures can form an integral part of the
information base necessary for team success. There is evidence of the existence of a
relationship between organizational design and performance: Pratt (2004) found that,

47
increasing employees' involvement in defining and creating their own work group
goals as part of the mission and strategy will increase organizational performance;
Moores and Yuen (2001) show an increasing need for formal reporting and objective
performance evaluation as firms grow both in terms of activities and number of
employees in order to achieve long term performance.
2.8.3 Organizational strategy and performance.
A clear strategic priority is a necessary but not sufficient condition to ensure high
organizational performance. Some researchers found that strategic priorities should
be supported by an appropriate control system, organizational structure, and
management information system (Chenhall & Langfield-Smith, 1998b). Thus an
appropriate link between them is important to performance improvement. Achieving
an appropriate match between them is predicted to enhance performance (Jermias &
Gani, 2002).
A key component in understanding how operations support strategic priorities and
the interdependency of activities across the value chain is the formulation of
performance measures designed to coordinate manufacturing decisions and activities
to achieve a balanced set of strategic priorities (Chenhall & Langfield-Smith, 1998a).
It has been argued that in order to support and evaluate the achievement of strategic
advantages, reliance on financial performance measures alone will not necessarily
improve financial results, as financial measures only indicate the outcome of past
activities which may be no guide to improving future performance (Choe, 2004).
Davila (2000), and Chong and Chong (1997) suggested that greater use of non-
financial information for business units following a customer-focused or prospector-
type strategy, had a positive impact on performance. On the other hand, Perera et al.
(1997) found support for the hypothesized association between customer-focused
strategy and the use of non-financial measures, but not for the link to organizational
performance.
Thus, strategy, actions and measures have to work consistently. To achieve this,
involvement of financial and non-financial performance measures is important. If
quality and time become essential strategic criteria, financial performance measures

48
alone are less effective for the long run management of the company (Chenhall &
Langfield-Smith, 2003). This does not mean that accounting data are not useful, but
they have to be complemented by non-financial measures.
2.9 Summary
Globalization has changed the environment surrounding organizations operating in
developing countries, with an increase in uncertainty, intensified industry
competition and advanced technology. These have resulted in the need for the firm to
reconsider its existing organizational design and strategies. As the firm strives to
better fit with its environment, and be more successful, sustaining and/or improving
current performance has become critical for organizations. However, very limited
study has so far taken place on how competitive business environment and
technological advancement has influenced management accounting and
organizational change in the context of developing countries. Most empirical
evidence in this area has been obtained from research in developed countries. This
study intends to show how changes in the external environmental and technological
factors in a developing country affect management accounting practices and the
internal organization configuration, and whether these changes can contribute to
performance improvement by the organization. By presenting evidence from
Malaysia, a different perspective to findings is expected.
Prior research in management accounting has also examined the various relationships
between the environment, organizational and management accounting system (see
for example, Albright & Lee, 1995; Chenhall, 2003; Gurd & Thorne, 2003; Kloot,
1997; Lapsley & Pallot, 2000; Rowe, Birnberg, & Shields, 2008). Some types of
information provided by management accounting systems can give rise to
organizational learning (Chenhall, 1997) which in turn increase organizational
performance (Choe, 2004). Although numerous studies have been undertaken into
management accounting and organizational change (for example, Andon et al., 2007;
Chenhall & Euske, 2007; Choe, 2004; Gomes et al., 2007; Jarvenpaa, 2007; Kaynak
& Hartley, 2006; Laitinen, 2006; Lapsley & Pallot, 2000; Naranjo-Gil & Hartmann,
2007; J. A. Smith et al., 2005; Waweru et al., 2004) none of these has specifically

49
examined the interrelationship between management accounting and organizational
change. There are few published studies that have incorporated the impact of these
changes on organizational performance into a single research project. Moreover,
most of these studies did not explain how changes in management accounting
systems take place, with respect to the form of change (either as a replacement with
new techniques or modification of existing techniques) and how such changes might
contribute to the overall success of the organization. Thus, this study attempts to
bridge this apparent gap in prior research by contributing to our understanding of
management accounting and organizational change in Malaysia. In addition, the
literature on the adaptation of management accounting to the environments of
developing countries is limited, thus findings from this study may shed light on the
role of management accounting in companies in other developing societies
undergoing rapid change.

50
CHAPTER THREE
RESEARCH DESIGN
3.1 Introduction
The aspect of this empirical study is based on a review of management accounting
and organizational change literature. A survey is used as the method for data
collection in order to investigate the changes in external as well as internal
organizational factors, and management accounting practices in Malaysia’s
manufacturing companies. A structured survey questionnaire was designed to cover
six major areas within the conceptual model and developed hypotheses. This chapter
is divided into various sections. The sections cover a discussion on the choice of
survey as a data collection method, sampling and data collection procedures,
questionnaire design, instrument development, as well as data analysis.
3.2 Background to the Survey
The review on management accounting and organizational change literature
demonstrated that a case or field study was adopted as a common research method.
As reported by Van der Stede, Young, and Chen (2007), only 30% of all published
empirical management accounting research had used the mail survey method, over

51
the past 20 years6. Using contingency theory, this study aims to obtain a wider
investigation of management accounting and organizational change. To achieve this,
the survey method is seen as more appropriate relative to other methods, i.e., case
and field study, which relies more on context and process. This choice is supported
by Van der Stede et al. (2007), who pointed out that the survey is the common
method used for theory testing in management accounting research.
Figure 3.1 Basic Survey Process
The current study uses a survey method and utilizes structural equation modelling to
test a model of management accounting and organizational change and its causal
association with changes in competitive environment and manufacturing technology,
as well as performance. It is essentially a quantitative research framework. Thus, a
well designed survey is critical in order to draw valid conclusions about the
6 This is based of their review on all empirical management accounting studies published in various journals from 1982-2001.
1: Survey Design ‐ Type of survey chosen ‐ Target respondent ‐ Research questions/ hypotheses ‐ Response categories ‐ Layout of the instrument ‐ Sample selection
2: Pilot Testing ‐ To improve the reliability and
validity of individual questions
3: Data Collection ‐ Relevant and up‐to‐date mailing list ‐ Target specific respondents ‐ Feedback to respondent (e.g.,
incentive, follow‐ups)
4: Measurement Error ‐ Measures of validity and reliability

52
relationships under investigation. Following M. Smith (2003), a basic survey process
is outlined in Figure 3.1.
3.2.1 Concept of Survey
Many scholars provide s definition of surveys. However, these definitions are quite
similar. For example, Bryman (2001, pp. 450-453) defined the survey as;
“.... quantitative research which tends to bring out a static picture of social
life... Survey was designed to provide information about the degree to which
there was a consensus among members of the sample about certain
circumstances”.
The central issue in the survey method is more on how it is deployed rather than with
the method itself (Van der Stede et al., 2007). Survey research can be used for
description and/or explanation. However, descriptive studies are designed to discover
characteristics of a given population, not to test theory. In management accounting
research, surveys are most commonly used for explanation, that is, to test theory that
states the expected casual relationships among a set of variables. Surveys also
provide a quick, inexpensive, efficient, and accurate means of assessing information
about population (Zikmund, 2003). As for this study, a survey is designed based on
the framework suggested by Van der Stede et al. (2007). They identified five key
elements of a well-designed survey;
1. Purpose and design of the survey – A well designed survey should be
conducted with a specific research objective in mind to avoid the
inappropriate selection of samples of respondents and the use of misguided or
irrelevant questions
2. Population definition and sampling – To determine whether valid inferences
can be drawn from the characteristics of the sample and whom the inferences
can be drawn about. This also depends on the sample size and response rate.
3. Survey questions and other research method issues – Focus on design
validity, that is, the extent to which a survey study provides evidence

53
regarding the theories being tested (using pre-test procedures, follow-up
procedures, non-response bias and types of independent measures).
4. Accuracy of data entry – Involves determining the procedures for data entry,
checks for completeness, checks for reliability and accuracy, and rules for
resolving inconsistencies.
5. Disclosure and reporting – Focuses on describing what research procedures
were used and how data were collected and presented.
3.2.2 Types of Survey
This study adopted a longitudinal survey design to establish causal relationships. A
longitudinal design is chosen as it provides greater confidence for causal inferences
than does a cross-sectional design (Pinsonneault & Kraemer, 1993). Longitudinal
design requires either repeated surveys over time or one-time surveys that ask
respondents about measurements over time. Longitudinal study is defined by
Zikmund (2003, p. 187), as;
“A survey of respondents at different points in time, thus allowing analysis of
response continuity and changes over time”
However, it is impossible for this study to conduct a repeated survey at different
points in time as the aim of this study is to investigate the changes over the five year
period from 2003 to 2007, though the study is initiated in early 2008. Therefore, to
deal with this limitation, a one-time survey is used. Moreover, repeated surveys are
also reported as subject to increasing non-response over time, and result in
incomplete longitudinal data (Van der Stede et al., 2007).
Surveys can be conducted in any (or any combination) of these three types; personal
or face-to-face interviews, telephone interviews; and mail (Cooper & Schindler,
2001; Zikmund, 2003). M. Smith (2003, p. 117) also includes email or internet-based
research survey, these are not discussed here because there is still very little literature
in the accounting domain with respect to this type of survey. The most common
method of data collection in survey research is the structured questionnaire
administered to a sample of respondents (Brownell, 1995). As noted above, the form

54
of administration can be either by mail, telephone or face-to-face interview. As the
number of sample companies selected for this study is large (1,000 companies), the
mail survey is adopted as it allows a large enough sample to reduce sampling error to
acceptable levels, at considerably lower cost, and provides no opportunity for
interviewer bias compared to face-to-face and telephone interviews (M. Smith,
2003). However, it is noted that there is no “best” method of survey (Zikmund,
2003). Each method has its own advantages and disadvantages. However, based on
the above arguments, a mailed structured administered questionnaire is adopted in
this study. Besides that, this method also allows respondents to answer questions
when they are free, require short time periods for surveying large samples than
personal or telephone interviews, and the anonymity of the questionnaires permits
respondents to be more candid, so making the results potentially more valid and
reliable (Cooper & Schindler, 2001).
The major weakness of the mail survey is non-response error. Non-response error is
the statistical difference between a survey that includes only those who responded
and a perfect survey that would also include those who failed to respond (Zikmund,
2003, p. 178). However, many studies have shown that better-educated respondents
and those who are more interested in the topic, answer mail surveys (Cooper &
Schindler, 2001). According to Cooper and Schindler (2001), mail surveys with a
return of about 30 percent are often considered satisfactory. However, M. Smith
(2003, p. 125) suggests that response rates of less than 25 percent are common in
accounting research.
This study adopted a research design suggested by Baines and Langfield-Smith
(2003). Several limitations of the Baines and Langfield-Smith (2003) study are
addressed in this research. Firstly, they do not test the interrelationship between the
contextual variables, even though the literature suggests that a reciprocal relationship
between the variables is possible. Secondly, they only used advanced management
accounting techniques to measure management accounting practices in an
organization. It is, however suggested in the literature that companies tend to
combine both advanced and traditional techniques in order to improve performance.
Thirdly, this research provides a more detailed study to capture the time lag between
various organizational changes over five years, compared to the three years

55
considered by Baines and Langfield-Smith (2003). Finally, Baines and Langfield-
Smith (2003) measure changes in manufacturing technology as a consequence of
changes in organizational factors. However, based on a literature review,
manufacturing technology is but one of the environmental factors which can cause
changes in organizational factors. By testing these causal relationships in a
developing economy setting, i.e. Malaysia, different findings might be anticipated.
3.3 Questionnaire Design
A structured questionnaire was developed from existing instruments to enhance the
validity and reliability of the measures (i.e., Askarany & Smith, 2008; Baines &
Langfield-Smith, 2003; Hoque et al., 2001; Hyvönen, 2007; Sulaiman & Mitchell,
2005). Besides the demographic information, sections in the questionnaire covered
all the six areas within conceptual model. They are:
1. Competitive environment.
2. Advanced manufacturing technology.
3. Organizational design
4. Organizational strategy
5. Management accounting practices
6. Organizational performance.
The variables were adopted from previous research in developed countries. Since
manufacturing industry in Malaysia is more concentrated than those of most
developed countries (Bhattacharya, 2002), it is believed that, these variables could be
used in manufacturing firms in Malaysia. However, because there are certain
differences in business environment in Malaysia as compared to developed countries
and most other developing countries (as discussed earlier), the applicability of these
variables in a Malaysian environment was first confirmed through a pilot study of 41
manufacturing companies in Malaysia (see Chapter 5).
In designing the questionnaire, several factors are taken into consideration, notably,
time taken to complete the questionnaire, appropriate person to answer the
questionnaire and the wording used in the questionnaire. The pilot test is required to

56
address these issues. As suggested by M. Smith (2003), time taken to complete the
questionnaire should be less than 20 minutes in order to maintain interest and
motivation of the respondent. A five-year period (2003-2007) has been adopted in
this study as it was conceived in early 2008.
3.3.1 Response Format and Scaling
It is important to take into high consideration on questions format and scaling in
order to produce accurate and meaningful data. There are two types of commonly
used question formats: open-ended and closed questions. Open-ended questions
allow respondents to answer them in any way they choose, while closed questions
require respondents to make choices among a set of alternatives given, thus helping
the respondents to make quick decisions (Sekaran, 2003). As for this study, the main
scaling format used was closed questions, mainly using Likert-scales. However, the
open-ended format was also utilised for the purpose of collecting the respondents’
opinion on the items that were included and/or not included in the questionnaire.
Another important issue in designing a questionnaire is measurement scales to be
used. This is essential in order to ensure that the collected data are appropriate for the
hypotheses testing. The four types of scales are nominal, ordinal, interval, and ratio.
A nominal scale is the simplest type of scale, where the numbers or letters assigned
to objects serve as labels for identification or classification (“in name only”). An
ordinal scale arranges objects or alternatives according to their magnitude in an
ordered relationship. For the interval scale, it not only indicates order, but also
measures order (or distance) in units of equal intervals. The ratio scale has absolute
rather than relatives quantities (Zikmund, 2003, pp. 296-298).
The selection of scales was based on information requirements, the goal of survey,
ease of development and administration, and the data analysis procedures. In this
study the nominal, ordinal and interval scales were used, since respondents are
normally more comfortable with these types of scaling rather than a specific absolute
numbers (Nardi, 2006). A category scale was used for measuring type of industry,
type of product, number of employees and annual sales. Likert-scales were used to
measure changes in competitive environment, manufacturing technology,

57
management accounting practices, organizational structure, strategy and
performance.
3.3.2 Ethical Issues
Ethics are norms or standards of behaviour that guide moral choices about behaviour
and relationship with others (Cooper & Schindler, 2001, p. 112). The goal of ethics
in research is to ensure that no one is harmed or suffers adverse consequences from
research activities. In survey research, a major ethical issue is the invasion of privacy
(Nardi, 2006). In this study, the purpose of the research and the instructions of how
to respond were included in the cover letter. In this letter, respondents were also
informed that any information provided would be treated in the strictest confidence.
As this study used a mail survey, return of the questionnaire was taken to imply
permission (M. Smith, 2003, p. 97). The questionnaire and cover letter used in this
study were approved by the University’s Research Ethics Committee.
3.3.3 Pre-Test
According to Van der Stede et al. (2007), survey questions should always be pre-
tested to assess whether they can be correctly understood and easily answered by
respondents. Thus, the questionnaire was first pre-tested through peer evaluation
(colleagues) at Edith Cowan University (ECU) to test whether respondents can
understand the wording of the questions, the time taken to complete the questionnaire
and if they had difficulties in completing the questionnaire. Besides peer-evaluation,
the questionnaire was also pre-tested in a pilot study on prospective respondents
which included potential users of the data (i.e., accounts/ finance managers in
manufacturing firms in Malaysia). This is consistent with the recommendation by
Dillman (1978), to submit the questionnaires to colleagues, prospective respondents,
and the users of the data for pre-testing.
Pre-testing was undertaken in order to improve the quality of the instruments, to
increase respondent understanding of all questions, and to detect any weaknesses in
the questionnaire. Pre-testing with the prospective respondents is important as it

58
increases the likelihood that the survey uses terminology that reflects the respondents
frame of reference (Van der Stede et al., 2007). Among the suggestions received
during pre-testing among colleagues were concerns that the wording used in the
questionnaire which might cause bias. The questionnaire was revised in response to
these concerns. The updated version of the questionnaires was mailed to 200 sample
companies for the pilot study.
The objectives of the pilot study are to confirm the applicability of the variables in
the Malaysian environment and also to explore the potential association among
changes in a manufacturing business environment with management accounting
practices and organizational factors. Results from the pilot study were used as a
guideline in hypotheses development. Pilot testing is especially important in mail
surveys because there are no interviewers to report problems in the questions and the
survey instrument to the researcher (Van der Stede et al., 2007). Thus, the pilot test
can test both the questions and the questionnaires.
3.4 Instrument Development
The instruments in this study were designed to capture information on the
competitive environment, technologies, management accounting, organizational
structures, strategies and performance. The investigation seeks to find out whether
changes in technology and the competitive business environment cause changes in
management accounting practices, organization’s structure and strategy during a five
year period from 2003 to 2007 inclusively. It is also to find out how the alignment of
the management accounting system, structure and strategy would impact the
performance. The measures used were generated from previous research and had
been modified to suit this study.
The instruments were used in two stages: pilot study and the actual survey. Together
with the findings from the literature search, the results from the pilot study
(exploratory stage) have added to the knowledge on the existing level of competition,
technologies development, organizational and management accounting practices in
Malaysian manufacturing firms. It also facilitates the development of hypotheses for
this study. The instrument development covered the following topics:

59
1. Section A: General demographic information about organization.
2. Section B: Information on environmental and technological change.
3. Section C: Information on organizational change.
4. Section D: Information on changes in management accounting practices
5. Section E: Information on changes in organizational performance.
The variables measured in this study covered all the six areas of the conceptual
framework. An 11-point Likert scale was adopted from the study by Baines and
Langfield-Smith (2003), to capture decrease change (-5 to -1), no change (0) and
increase change (+1 to +5). Where relevant, respondents have the opportunity to
indicate if the various practices or items had never been used or adopted (indicated as
N/A). At the end of the questionnaire, respondents were given a space to give any
comments or suggestions on the questionnaire.
The most important consideration in the Likert scale is the inclusion of at least 5
response categories (Allen & Seaman, 2007). As a general rule, Likert recommend
that it is best to use as wide a scale as possible (Gibbons, 1993). Then, later on, the
responses can be collapsed into condensed categories, if appropriate, for analysis,
especially when the issue of normality arises.
3.4.1 Section A
Section A was designed to seek general information about organizations. The
information covered by questions 1 to 4 included: industry classification, type of
company, type of product, the range of number of employees and the range of total
annual sales.
The question on industry classification was designed to filter out companies
according to their industry group. Generally there are two types of manufacturing
companies classified in Malaysia, i.e., based on consumer product and industrial
product. Federation of Malaysian Manufacturer (FMM) has specifically grouped
these companies in Malaysia into 24 groups based on the product manufactured.
However, these groups can be re-categorized into 11 classifications, for use with this
instrument:

60
1. Electrical and electronics
2. Engineering supporting
3. Food processing
4. Life sciences
5. Machinery equipment
6. Petrochemical and polymer
7. Rubber products
8. Textiles and apparel
9. Transport equipment
10. Basic metal products
11. Wood-based
12. Others
The question on type of company, to determine whether they are local or foreign-
based companies operating in Malaysia, was designed in order to identify if such
companies have responded to the changes in environment in a different way. The
respondents were also asked to identify their product either as a consumer or
industrial product or both.
The question on number of employees of an organization was used to identify the
company size. In identifying the number of employees in the organizations, the
respondents were asked to categorise their organization based on the following
scales:
Less than 50
50-150
151-500
501-1000
Over 1000
3.4.2 Section B
Over the last decade or so, competitive environment and manufacturing technology
have changed significantly, and continue to change. Manufacturing firms have

61
experienced significant changes in their business environment with advances in
information technology and highly competitive environments. Many relevant
management accounting studies have highlighted these changes (e.g., Burns &
Vaivio, 2001; Choe, 2004; Gomes et al., 2007; Haldma & Laats, 2002; Hopwood,
1990; Hussain & Hoque, 2002; Innes & Mitchell, 1995; Kaplan & Norton, 1996;
Libby & Waterhouse, 1996; Scapens, 1999; Vamosi, 2003).
This section seeks information on competitive environment and technological
changes in an organization over the past five years from 2003 to 2007. The purpose
of section B is to identify to what extent competitive environment and advanced
manufacturing technology has changed in the organization.
To measure competitive environment respondents were asked to indicate the extent
to which they believe the competitive environment of their business unit had changed
over the past five years using an 11-point Likert scale. The anchors are ranging from
“significantly less competitive” (-5) to “significantly more competitive” (+5). The
items for competitive environment were derived from instruments used by Hoque et
al. (2001). The items are:
Price competition
Competition for new product development,
Marketing (or distribution channels) competition
Competition for markets (or revenue) share
Competitor’s actions
Number of competitors in your market segments.
As for the advanced manufacturing technology, respondents were asked to indicate
the extent to which they believe the advanced manufacturing technology of their
business unit had changed over the past five years. The anchors of the 11-point scale
are “used significantly less” to “used significantly more”. The items for advanced
manufacturing technology were derived from instruments used by Askarany and
Smith (2008), as follows:
Robotics
Flexible manufacturing systems

62
Computer-aided design
Computer-aided engineering
Computer-aided manufacturing
Computer-aided process planning
Testing machines
Just-in-time
Direct numerical control
Computer integrated manufacturing
Numerical control.
3.4.3 Section C
This section seeks information on changes in the internal organizational factors over
the past five years. This section is aimed to cover the extent to which the use of a
range of organizational design practices and strategic emphasis in the organizations
has changed over the past five years.
The items for organization structure were adapted from instrument employed by
Baines and Langfield-Smith (2003). The 11-point Likert scale ranged from “used
significantly less” to “used significantly more”. They are:
Multi-skilling of workforce
Worker training
Cross-functional teams
Establishing participative culture
Management training
Flattening of formal organizational structures
Work-based teams
Employee empowerment
Manufacturing cells
As for the organization strategy, the measures were also adapted from the instrument
used by Baines and Langfield-Smith (2003), which focused on the differentiation

63
strategy. The 11-point Likert scale ranges from “emphasized significantly less” to
“emphasized significantly more”. The items include:
Provide on time delivery
Make dependable delivery promises
Provide high quality products
Provide effective after sales service and support
Make changes in design and introduce new product quickly
Customize products and services to customer needs
Product availability (broad distribution)
Make rapid volume/product mix changes.
3.4.4 Section D
This section seeks information on changes in management accounting practices in an
organization. This section aimed to identify the extent of the range of use of
management accounting practices in the organization over the past 5 years and also
how these changes took place. The items embrace both traditional and advanced
management accounting techniques using an instrument developed by Baines and
Langfield Smith (2003). However, the instruments used by Baines and Langfield
Smith (2003) only covered advanced management accounting techniques; thus, the
consideration of traditional management accounting techniques is added to the
instruments. To identify the extent of changes in management accounting practices,
an 11-point Likert scale is used, ranging from “used significantly less” to “used
significantly more”.
The same items were used in measuring the form of changes in management
accounting systems, the respondents were asked to indicate the technical level
changes occurring in their organization from the past 5 years, using the instrument
developed by Sulaiman and Mitchell (2005). Five different categories were used to
measure the changes which include addition of new components, replacement of
components, modification of information outputs, modification of the operation of
the system, and reduction of the system, ranging from scale 1 to 5. Scale 0 is used if

64
no changes occurred and “not applicable” if the items were not practiced (indicated
as N/A).
The items include:
Budgetary control
Absorption costing
CVP analysis
Variable costing
Standard costing
Total quality management (TQM)
Target costing
Activity based costing (ABC)
Activity based management (ABM)
Value chain analysis
Product life cycle analysis
Benchmarking
Product profitability analysis
Customer profitability analysis
Shareholder value analysis / EVA
3.4.5 Section E
This section seeks information on changes in organizational performance over the
past five years. Items are measured using a two-part measurement instrument
adopted from Baines and Langfield-Smith (2003). Items include both financial and
non-financial measures (Hoque et al., 2001). The first part of the measure asks
respondents to compare the change in their business unit’s performance relative to
their competitors, over the past five years. An 11—point Likert scale is used, ranging
from “significantly lower performance than competitors” (score -5) to “significantly
higher performance than competitors (scored +5). The second part of the measure
requires respondents to assess the same items in terms of their importance to the
business unit, on a 5-point Likert scale ranging from “no importance” (score 1) to

65
“extremely important” (score 5). The final score is determined by multiplying the
respective “performance” and “importance” scores following (Baines & Langfield-
Smith (2003).
Items include:
Operating income
Sales growth
Return on investment
Cash flow from operations
Market share
Market development,
New product development
Research and development (R&D)
Cost reduction programs/ cost control
Personnel development
Workplace relations
Employee health and safety
3.5 Sampling Procedures
The sample was drawn from manufacturing industry in Malaysia. For several reasons
management accounting change is likely to occur in this type of company (Sulaiman
& Mitchell, 2005). Manufacturing companies are exposed to changes in the
manufacturing environment such as changes in production cost structure (Innes &
Mitchell, 1990) and new high technological manufacturing techniques (Kaplan,
1989). Due to the changes in the manufacturing environment, these companies are
also commonly associated with innovation in management accounting techniques,
such as ABC, JIT and TQM (M. Smith, Abdullah, & Abdul-Razak, 2008).
Furthermore, most prior studies on management accounting change had also selected
manufacturing companies in their survey (for example, Abdel-Kader & Luther, 2008;
Baines & Langfield-Smith, 2003; Cadez & Guilding, 2008a; Gerdin, 2005; Laitinen,

66
2006; Moores & Mula, 1993). This industry is also selected as it is the most active
and important contributor to the Malaysian economy7.
The focus for this study is the manager of the accounts/finance department from
manufacturing companies in Malaysia. The head of the accounting/ finance
department was chosen because most of the manufacturing companies in Malaysia
did not have a separate management accounting unit (M. Smith et al., 2008). As
highlighted by Baines and Langfield-Smith (2003, p. 684), managers’ perceptions are
considered appropriate in this situation, compared to the use of more objective
measures because:
1. It is managers’ perception of the environment which are of interest, as it is
these perceptions that will influence decisions with respect to the choice of
strategy and changes in other organizational and management accounting
variables.
2. It is difficult to measure objectively variables such as the extent of change in
the environment, or change in strategic emphasis.
3. It has been argued that individuals have sufficient understanding of their
decision process to be able to give relatively reliable information.
The list of manufacturing companies in Malaysia was taken from the Federation of
Malaysian Manufacturers (FMM) Directory of Malaysian Industries 20088. There are
more than 2,000 companies registered with FMM. This directory was used as the
sampling frame for this research. A sampling frame is important to make sure
samples adequately represent the intended target population to which the hypotheses-
testing results are generalised (Van der Stede et al., 2007). For example Perera et al.
(1997) used Riddell’s Business Who’s Who Australia 1994 to randomly select 200
managers of manufacturing firms or divisions.
The target population for this study are the manufacturing firms which were
incorporated before 2003. This is congruent with the objective of the survey to
analyse the changes in manufacturing firms over the five years period from 2003 to
2007 inclusively. The survey population of 1,000 manufacturing firms in this study
7 Source: http://www.fmm.com.my 8 This was the latest edition at the time of study.

67
were selected using probability sampling (simple random method). Under probability
sampling, samples are selected such that every element of the survey population in
sampling frame has a known non-zero chance of being selected. Therefore, it
increases the representativeness of survey results (especially with a high response
rate), thus allowing inferences to be made from the sample to the survey population
within a calculable margin of error (Van der Stede et al., 2007). Whereas, in non-
probability sampling, some survey population members are more likely to be
selected in the sample than others. Thus, there is a likelihood of biased samples and
quantitative inferences from such samples, so that they can only be viewed only as
indicative (Van der Stede et al., 2007). Population definition and sample selection are
important because they determine whether valid inferences can be drawn from the
characteristics of the sample.
Out of 1,000 companies, 200 were chosen for pilot study. These companies were
randomly selected from two regions, i.e. Klang Valley and northern region (Penang).
These two regions were selected due to the fact that these are the two most
industrialised areas in Malaysia (FMM, 2008; M. Smith et al., 2008). Response rates
for pilot study also gave a guideline in determining the sample population likely to
be required for the actual survey. From the pilot test, it was anticipated that a
response rate of 20 per cent could be achieved. This study used Structural Equation
Modelling (SEM) as a main data analysis technique, which requires a minimum
sample size of 100 as a suggested rule of thumb. However, it has also been suggested
that a sample size of 200 may be required to generate valid fit measures and to avoid
drawing inaccurate inferences (D. Smith & Langfield-Smith, 2004). Thus, in order to
obtain a target sample of at least 200, 1,000 companies were randomly selected as a
survey population. Such a sample is considered sufficient for statistical analysis and
ultimately for accomplishing the objectives of this research.
Most textbooks recommend a standard treatment in determining sample size, by
deciding how much precision is required (the confidence of interval), which requires
an estimate of both the sample variances and an estimate of the expected response
rate. However, this approach is often not pragmatic when designing studies in
management accounting (Fowler, 1984, cited in Van der Stede et al., 2007, p. 463).
This argument is supported with the following arguments:

68
1. The vast majority of survey studies in management accounting are theory-
testing studies (89%)9, not studies concerned with measuring the “mean” of a
variable within a sample and generalizing it to a population.
2. Surveys in management accounting invariably try to obtain from respondents
as much information as possible related to the multiple variables of interest to
the theory (relationships) being tested (within the confines of acceptable
survey length).
According to Van der Stede et al. (2007), management accounting surveys are
usually designed to make estimates about relationships among multiple variables,
thus, making it unlikely to be able to specify a desired level of precision in more than
just the most general of ways.
3.6 Data Collection Procedures
Data were collected using a mail survey. To enhance the response rate, a reminder
letter was sent out to the whole sample (even if they had already replied) as a follow-
up procedure. According to Dillman (1978), follow-up procedures effectively
improve response rates and help bring the more resistant respondents into the study,
sooner. Another way to increase response rates is to seek cooperation from a
corporate officer, industry association, or some other authority. In this case a letter to
seek the co-operation from FMM in data collection was sent to its Chief Executive
Officer. Phone calls and emails to the respective officer had also been made, but the
response had been negative. Therefore, the data are collected using a self-
administered questionnaire. Another possibility to increase the response rate is
through providing compensation to respondents (monetary and non-monetary). In
this study, compensation is not offered to the respondents as it is costly and might
cause bias. It would also create a further and unnecessary variable for the study.
Following the preparation of the instruments, 200 questionnaires were mailed on 20th
November 2008 for the pilot test. The contact information of the firms was obtained
9 This figure was determined by Van der Stede et al.(2007) by counting all empirical management accounting studies that employ mail survey method published in various accounting journals from 1982-2001.

69
from FMM Directory 2008. Within a month, 41 questionnaires were returned, which
give a response rate of 20.5 percent. Review of the pilot test revealed that the
instruments were applicable to Malaysian manufacturing companies (details of the
pilot study result are discussed in Chapter 4). Therefore, another 800 questionnaires
were sent out on 15th January 2009 to constitute the actual survey. The responses for
the pilot study are added to those from the actual survey to get the total responses for
data analysis.
The questionnaire consists of 8 pages (four double sided pages) plus a cover letter
explaining the purpose of the study and how to respond. Two pre-paid self-addressed
envelopes were attached with the questionnaire. One for returning the questionnaire
and the other one for the respondent to send contact information form. A contact
information form is used for the respondents who wish to have a copy of the survey
result, as had been explained in the covering letter. Different envelopes were used in
order to maintain anonymity of the survey. The covering letter also emphasized that
the information would be treated in the strictest confidence and that only aggregated
findings would be reported in this study. Covering letters were printed on the
University’s letter head; contact information of the researcher and supervisor are also
included in covering letter. Contact information of the University’s Research Ethics
Officers was also provided in the covering letter in case respondents had any
concerns and wanted to speak to an independent person regarding the research
project.
Within three weeks of the mailing of the initial questionnaire, 62 companies had
replied, which give a 7.8 percent response rate (out of 800). A follow-up letter was
sent to all respondents three weeks after the initial questionnaire reminding them
about the questionnaire and seeking their co-operation in completing the survey and
forwarding it using the pre-paid envelope provided. All respondents that had already
responded to the questionnaire were issued with an apology and thanked for their co-
operation in completing the survey.
Within three weeks after sending the first follow-up letter, another 64 companies had
responded, which give a total response rate to date of 8 percent out of the 800. Then,
a second reminder letter was mailed to all respondents three weeks after the first
reminder. This time, a further copy of the questionnaire was attached, just in case

70
they had misplaced the first one, and again all respondents that had responded to the
questionnaire were issued with an apology and thanked for their co-operation in
completing the survey.
The final wave gave another 48 responses. Thus, the total responses to the
questionnaires were 215, which give a response rate of 21.5 percent. However, out of
215 questionnaires returned, three were incomplete, leaving 212 questionnaires
useable for analysis. According to M. Smith (2003, p. 125), such a response rate (i.e.,
less than 25 percent) is now common in accounting research, but, this rate is
considered sufficient for statistical analysis and inferences. The summary of the data
collection process is presented in Table 3.1.
Table 3.1 Summary of Data Collection Procedure
Posted Date No. Of
Questionnaires Replied Response
Rate (%) Pilot study (20th Nov 2008)
200
41
4.1
Actual Survey (15th Jan 2009)
800
62
6.2
First follow-ups (5th Feb 2009)
64
6.4
Second follow-ups (26th Feb 2009)
48
4.8
Total 1,000 215 21.5 Incomplete questionnaires
3
0.3
Useable Questionnaires
212
21.2%
3.7 Data Analysis
The Structural Equation Modelling (SEM) is used as the main statistical technique to
test the hypothesized model developed in this study. Besides SEM, a non-parametric
technique (Spearman’s rank order correlation) was used to test the subsidiary
hypotheses. SEM is a comprehensive tool for testing hypotheses about relationships

71
between variables. The SEM procedure and its use in this study is explained and
justified below.
3.7.1 Validity and Reliability of Measures
Major criteria for evaluating measurements are validity and reliability. Reliability
and validity are two different but closely related conditions. Reliability refers to the
consistency of measurement, whereas validity is the accuracy of the measures
(Holmes-Smith, 2005). Zikmund (2003, p. 300) defined validity as “the ability of a
scale or measuring instrument to measure what it is intended to measure”. There are
three ways to evaluate validity:
1. Face validity – subjective agreements among professionals that a scale
logically appears to reflect accurately what it purports to measure.
2. Criterion validity – the ability of some measure to correlate with other
measures of the same construct.
3. Construct validity – the ability of a measure to confirm a network of related
hypotheses generated from a theory based on the concepts.
Face validity is achieved by using measures established from previous research (i.e.,
Askarany & Smith, 2008; Baines & Langfield-Smith, 2003; Hoque et al., 2001;
Hyvönen, 2007; Sulaiman & Mitchell, 2005). There are two elements of construct
validity: convergent validity and discriminant validity. Convergent validity occurs
when indicators correlate strongly with their assumed theoretical constructs, whereas
dicriminant validity reflects the extent to which the constructs in a model are
different (Holmes-Smith, 2005). Details of these validity measures are explained as
part of the discussion of statistical analysis in Chapter 6.
Reliability is the degree to which measures are free from error and therefore yield
consistent results (Zikmund, 2003). According to Zikmund (2003), two dimensions
which underlie the concept of reliability are repeatability and internal consistency.
Repeatability can be assessed using a test-retest method which involves
administering the same scale or measures to the same respondents at two separate
times to test for stability. If the measure is stable over time, the result of the test

72
should be similar. Internal consistency concerns the homogeneity of the measure.
The split-half method is the most basic technique for checking internal consistency
when a measure contains a large number of items. The other method available is the
equivalent-form method, where two alternative instruments are designed to be as
equivalent as possible.
The reliability of the indicators of construct in the model is assessed by examining
factor loadings of the indicators. Items with loadings of 0.5 or above are retained
since they add adequate explanatory power to the model. Other than that, Cronbach’s
coefficient alpha is used to assess the internal consistency of the measures for each
construct. Cronbach’s alpha has the most utility for multi-item scales at the interval
level of measurement (Cooper & Schindler, 2001).
3.7.2 Structural Equation Modelling (SEM)
SEM is a statistical technique that allows the simultaneous analysis of a series of
structural equations and is particularly useful when a dependent variable in one
equation becomes an independent variable in another equation (D. Smith &
Langfield-Smith, 2004). There are two-stages in SEM process, i.e., the analysis of
the measurement models and analysis of the structural model (Schumacker &
Lomax, 1996; D. Smith & Langfield-Smith, 2004). The measurement model
specifies relations between manifest (observed) variables and latent variables. The
structural model is a model of relations between latent variables, incorporating
specified measurement error. According to Hair, Black, Babin, Anderson and
Tatham (2006) SEM involves a six-stage decision process as outlined in Figure 3.2.
Stages one to three of the process are discussed throughout this chapter, while stages
four to six are discussed with the data analysis in Chapter Six.

73
No Yes
Figure 3.2 Six-Stages Decision Process in SEM
(Source: Hair et al., 2006)
Stage 1 Defining the Individual Constructs
‐ What items are to be used as measured variables
Stage 2 Develop and Specify the Measurement Model
‐ Make measured variables with constructs ‐ Draw a path diagram for the measurement model
Stage 3 Designing a Study to Produce Empirical Results
‐ Assess the adequacy of sample size ‐ Select the estimation method and missing data approach
Stage 6 Assess Structural Model Validity
‐ Assess the GOF and significance, direction, and size of structural parameter estimates
Stage 4 Assessing the Measurement Model Validity
‐ Assess line GOF and construct validity of measurement model
Stage 5 Specify Structural Model
‐ Convert measurement model to structural model
Structural Model Valid?
Refine model and test with new data
Draw substantive conclusions and recommendations

74
SEM is considered the most appropriate method when the research stream has a
relatively sound theory. There is a reasonable strong body of knowledge in modelling
relations between environment, strategy and organizational structure, and a
considerable body of accounting literature that has explored relations between
strategy and non-financial measures (D. Smith & Langfield-Smith, 2004). Moreover,
SEM can be used to specify causal direction in specific situations. However, it
should be noted that although SEM is often referred to as “causal modelling”, it can
only provide evidence of causality, not establish causality (Hult et al., 2006).
SEM emphasizes the analysis of sample variances and covariances rather than
individual cases. Instead of minimizing the sum of squared differences between the
predicted and observed scores for each case, the SEM technique involves minimizing
the difference between the matrix of sample variances and covariances and the
matrix of predicted variances and covariances generated from using a set of
parameters that describe the causal model underlying the relationship amongst the
variables. Thus, SEM develops a comprehensive model to test hypotheses in this
study.
Compared to other traditional analyses, for example multiple regressions, results of
SEM are more informative for management accounting theoreticians. SEM allows a
range of relations between variables to be recognized in the analysis. Thus, SEM
provides the researcher with an opportunity to adopt a more holistic approach to
model building. Other than that, a major difference between SEM and other
traditional analyses is the ability to account for the effects of estimated measurement
error of latent variables. This is particularly relevant to management accounting
research when composite measures are often used to measure the construct. The use
of interaction terms in multiple regressions may encompass significant measurement
error, particularly when used with composite variables. These problems have led
prominent management accounting researchers to suggest that multiple regression
techniques are inappropriate in many situations (D. Smith & Langfield-Smith, 2004).
75
There are two main types of SEM:
1. Covariance-based structural equation modelling (CBSEM), such as Linear
Structural Relations (LISREL).
2. Variance-based (or component-based) approach, for instance Partial Least
Square (PLS).
This study uses a CBSEM approach and employs LISREL for Windows version 8.80
to analyse the data. The CBSEM approach enables researchers to construct
unobservable latent variables, model errors in measurement, and statistically test a
priori theoretical and measurement assumptions against empirical data. As compared
to PLS which is a softer modelling approach used to determine values of the latent
variables for predictive purposes (Chin, 1998), CBSEM involves analysis using a set
of parameters that describe the causal model underlying the relationship amongst the
variables. Under this condition, indicators are viewed as being influenced by the
underlying latent construct (reflective mode).
This study aims to examine the effect of changes in MAP as well as organizational
structure and strategy on performance, which caused by the changes in competitive
environment and AMT. Hence, CBSEM is the best method for analysing the
hypotheses developed from the conceptual framework in this study.
3.7.3 Data Distribution and Estimation Techniques
Multivariate Distribution. Most of the estimation techniques in SEM assume
multivariate normality. In the case of a non-normal distribution, the researcher can
take corrective action to rectify the violation of the normality assumption using data
transformation such as square root, logarithm or inverse (Zikmund, 2003). However,
a new research stream does not encourage data transformation. According to Shook,
Ketchen Jr., Hult, and Kacmar (2004) data transformation is not without problems.
They argued that if the researcher has developed a strong theoretical foundation and
belief in the original specification, data transformation can provide an incorrect
specification. This argument is supported by Hult et al. (2006). They argue against
data transformation as it often violates the theoretical logic underpinning the original

76
dataset. Therefore, another alternative approach is to use an estimation method that
does not assume multivariate normality or that adjusts the model fit statistics and
standard errors of individual parameters estimates, as for example using weighted
least squares (WLS) or an asymptotically distribution free (ADF) estimation
technique (Henri, 2007; Hult et al., 2006; D. Smith & Langfield-Smith, 2004).
According to Henri (2007), out of 41 studies in the management accounting field
using SEM, 25 (61%) did not discuss the distribution characteristics of the data.
Among the 16 studies (39%) that did address the normality issue, three noted the
normality of their data, while 13 observed that their data were non-normal. Of the 13
studies reporting a non-normal distribution, only one did not address the issue of
corrective action. The other 12 studies have either undertaken corrective action or
explicitly recognized and justified that no such action has been attempted. Of the
eight studies reporting corrective action, two have transformed data while the
remaining six have used a specific estimation approach (e.g., generalized least
squares). Similar findings were obtained by Hult et al. (2006) and Shook et al.
(2004). A summary of their findings is presented in Table 3.2 below.
Table 3.2 Summary of the Findings of Normality Issue
Normality Issues Henri (2007) (N=41)
Hult et al. (2006)
(N=148)
Shook et al. (2004) (N=92)
Did not discuss 25 (61%) 134 (91%) 75 (81%) Discussed: - Data normally distributed - Not normally distributed
- No corrective action - Take corrective action
o Transform o Use specific estimation
technique (e.g. GLS, WLS)
16 (39%) 3
13 1
12 8 6
14 (9%) 9 5 1 4 - 4
17 (19%) 8 9 - 9 9 -
Another alternative suggested by Hair et al. (2006) is to ensure that the ratio of
respondents to parameters is higher. A generally accepted ratio to minimize problems
with deviations from normality is 15 respondents for each parameter estimated in the
model. Although some estimation procedures are specifically designed to deal with

77
non-normal data, the researcher is always encouraged to provide sufficient sample
size to allow for the sampling error’s impact to be minimized (Hair et al., 2006). This
study has 13 parameters to be estimated in the model, thus a sample size of 212 is
considered sufficient to minimize the problem (i.e., 13 parameters x 15 respondents =
195 sample size).
Estimation Techniques. The most common SEM estimation procedure are
generalised least squares (GLS) and maximum likelihood estimation (MLE) (which
is the default in most SEM programs such as LISREL). The potential sensitivity of
MLE techniques to non-normality, however, created a need for alternative estimation
techniques. Methods such as weighted least square (WLS) in the LISREL package or
asymptotically distribution free (ADF) estimation in AMOS become available. The
WLS/ADF technique received particular attention due to its insensitivity to non-
normality of the data, but it requires a very large sample to yield more consistent
techniques. Despite all of these estimation techniques becoming more widely
available, MLE continues to be the most widely used approach and it has been
proven to be fairly robust to violations of the normality assumption (Henri, 2007).
Researchers who compared MLE with other techniques had shown that it produced
reliable results in most circumstances (Hair et al., 2006).
3.7.4 Model’s Goodness-of-Fit (GOF)
SEM provides a range of fit indices to assess the overall fit of the entire structural
model. GOF indicates how well the specified model reproduces the covariance
matrix among the indicator items. The basic and most commonly-used fit index
reported is the chi-square (χ2) statistic. With 212 samples analysed in this study, this
approach is considered appropriate to be used (Kline, 1998). The difference in the
covariance matrices is the key value in assessing the GOF of any SEM model. SEM
estimation procedures such as a MLE produce parameter estimates that
mathematically minimize this difference in the specified model. A χ2 test provides a
statistical test of the resulting difference.

78
It is represented mathematically by the following equation:
χ2 = (N - 1)(S - ∑k)
Where N = overall sample size;
S = observed sample covariance matrix;
∑k = SEM estimated covariance matrix.
The SEM estimated covariance matrix is influenced by how many parameters are
free to be estimated (the k in ∑k), so the model degrees of freedom (df) also influence
the χ2 GOF test. The df for an analysis of a covariance structure model is determined
by:
df = ½ [(p)(p + 1)] – k
Where p = total number of observed variables
k = number of estimated (free) parameters
With the χ2 GOF test, the smaller the p-value, the greater the chance that observed
sample and SEM estimated covariance matrices are not equal. Thus, with SEM, we
do not want the p-value for the χ2 test to be small (or significant). If theory is to be
supported by the test, the small χ2is needed (and corresponding large p-value; i.e.
>0.05), that indicates no statistically significant difference between the matrices.
Another problem with χ2 is that the more complex the model, the bigger the χ2 will be
and the more likely it is that the specified model will be rejected (Holmes-Smith,
2005). For this reason, a “normed” χ2 is sometimes used where χ2 is divided by the
df (χ2/df) for the model to give a χ2 measure per df. The acceptable level for normed
χ2 should be greater than 1.0 but smaller than 2.0 (although values between 2.0 to 3.0
indicate a reasonably good fit). Values of less than 1.0 indicate overfit (Holmes-
Smith, 2005).
Other commonly-used fit indices are:
- Goodness of Fit Index (GFI)
- The GFI is an early attempt to produce a fit statistic that was less sensitive
to sample size. The possible range of GFI values is 0 to 1 with higher

79
values indicating better fit. The common threshold value for GFI (as well
as AGFI) is more than 0.95, although values greater than 0.9 also indicate
reasonable fit (see Table 3.3 for detail fit values).
- Root Mean Square Residual (RMR) and Standardized Root Mean Square
Residual (SRMR)
- The RMR is an average of the residuals between individual observed and
estimated covariance and variance terms. SRMR is the alternative statistic
based on residuals. It is a standardized value of RMR and thus is more
useful for comparing fit across models. Lower RMR and SRMR value
represent better fit. RMR and SRMR are sometimes known as badness-
of-fit measures in which high values are indicative of poor fit.
- RMR should be less than 0.05 (Holmes-Smith, 2005).
- Root Mean Square Error of Approximation (RMSEA)
- RMSEA is a measure that attempts to correct for the tendency of the χ2
GOF test statistics to reject models with large samples or a large number
of observed variables. Lower RMSEA values indicate better fit. Like the
SRMR and RMSR, it is a badness-of-fit index. Typically, values of below
0.05 indicate the most acceptable models (although values between 0.05
and 0.08 indicate reasonable fit) (Holmes-Smith, 2005).
- Comparative Fit Index (CFI)
- The CFI is an incremental fit index that is an improved version of the
NFI. The values range between 0 and 1, with higher values indicating
better fit (>0.90) (Holmes-Smith, 2005). Because the CFI has many
desirable properties including its relative, but not complete, insensitivity
to model complexity, it is among the most widely used indices.
- Normed Fit Index (NFI)
- The NFI is one of the original incremental fit indices. It is a ratio of the
difference in the χ2 value for the fitted model and null model divided by
the χ2 value for the null model. It ranges between 0 and 1 and a model
with perfect fit would produce an NFI of 1.

80
- Model Parsimony
- The more parameters added to a model the more sample specific the
model becomes and less likely it is that the different sample could support
such a highly specific model (Holmes-Smith, 2005). The more
parsimonious the model, the more likely it is that the model could
generalised to the population. Thus, the “best” model is the model with
the smallest model parsimony fit measure. Some functions used to
measure model parsimony are Akaike Information Criterion (AIC) and
Consistent Akaike Information Criterion (CAIC).
According to Hair et al. (2006), multiple fit indices should be used to assess a
model’s GOF which include:
- The χ2 value and the associated df
- One absolute fit index (i.e., GFI, RMSEA, or SRMR)
- One incremental fit index (i.e., CFI or NFI, etc.)
- One goodness-of-fit index (i.e., GFI, CFI, NFI, etc.)
- One badness-of-fit index (RMSEA, SRMR, etc.)
The ultimate goal for any of these fit indices is to assist the researcher in
discriminating between acceptably and unacceptably specified models. Academic
journals are replete with SEM results citing a 0.90 value on key indices, such as CFI,
NFI, or GFI, as indicating an acceptable model (Hair et al., 2006). Hair et al. (2006)
provides some guidelines for using fit indices in different situations (see Table 3.3).
The guidelines are primarily on simulation research that considers different sample
sizes, model complexity, and degrees of error in model specification. One key point
across the results is that, simpler models and smaller samples should be subject to
stricter evaluation than are more complex models with larger samples.
3.8 Summary
A survey is chosen in this study due to the fact that the emphasis is on producing a
result based on real-world observations. Conducting high quality survey research

81
requires a set of conditions that are not all within a researcher’s control. Conditions
like good access to population, uses of common language in addressing research
issues, and also the issue of confidentiality appear increasingly difficult to find, not
only in management accounting but also other areas of organization research.
Therefore, in order to ensure a high quality of the survey design, this study uses a
framework suggested by Van der Stede et al. (2007); which includes questionnaire
design, the use of pre-testing, follow-up procedures and non-response bias analysis.
Table 3.3
Guidelines for Establishing Acceptable and Unacceptable Fit
m = number of observed variables; N applies to number of observations per group when applying CFA to multiple groups at the same time.
10 Data in this study fall within this range.
N < 250 N > 250 Statistics m ≤1210 12<m<30 m ≥30 m <12 12<m<30 m ≥30 χ2 Insignificant
p-values expected
Significant p-values can result even with good fit
Significant p-values can be expected
Insignificant p-values can result with good fit
Significant p-values can be expected
Significant p-values can be expected
CFI/NFI/GFI
0.97 or better
0.95 or better
Above 0.92
0.95 or better (do not use with N>1,000)
Above 0.92 (do not use with N>1,000)
Above 0.90 (do not use with N>1,000)
SRMR Could be biased upward; use other indices
0.80 or less (with CFI of 0.95 or higher)
Less than 0.09 (with CFI above 0.92)
Could be biased upward; use other indices
0.08 or less(with CFI above 0.92)
0.08 or less(with CFI above 0.92)
RMSEA Values<0.08 with CFI = 0.97 or higher
Values<0.08 with CFI of 0.95 or higher
Values <0.08 with CFI above 0.92
Values <0.07 with CFI of 0.97 or higher
Values <0.07 with CFI of 0.92 or higher
Values <0.07 with CFI of 0.90 or higher

82
CHAPTER FOUR
HYPOTHESES DEVELOPMENT
4.1 Introduction
The approach of this study is to consider a theory that explicitly examines different
modes of organizational change, (contingency and institutional theory). These
theories are used to develop a framework for conceptualizing management
accounting and organizational change, which not only stresses the stability embodied
in rule-based behaviour and routine of organizational systems and practices, but also
recognizes that rules and routines can change (see, Burns & Scapens, 2000; Huy,
2001; Lapsley & Pallot, 2000; J. A. Smith et al., 2005).
An organization is often interpreted as a configuration of different characteristics.
Numerous dimensions of external context (such as environments, industries and
technologies) and internal organizational characteristics (such as strategies,
structures, cultures, processes, practices and outcomes) have been said to cluster into
configurations (Moores & Yuen, 2001). In a changing environment, markets have
become more competitive, mainly in respect to an increased level of high quality and
competitively priced products. Organizations may respond to this change by
reorganizing their work processes through adopting organizational design and
strategy that have a stronger customer orientation. In order to compete, many
organizations made considerable investments in advanced manufacturing technology

83
such as computer-integrated manufacturing and just in time systems (Baines &
Langfield-Smith, 2003), which in turn can increase quality, productivity, flexibility
as well as reducing cost.
The institutional approach to organizational change suggests that organizational
structures affect an organization’s learning strategy and ability to adapt to changes in
the external environment. Organizational structural arrangements can be successfully
changed through incremental or radical adaptive strategic change (see, Sisaye, 2003).
Theories of revolutionary change advocate that all organizational elements such as
strategy, structures, people, systems, and culture, have to be changed simultaneously
to achieve maximum organizational alignment and effectiveness (Huy, 2001).
Literature has identified that changes in business environment surrounding an
organization cause organizational and management accounting practices to change
(e.g., Baines & Langfield-Smith, 2003; Chenhall & Morris, 1986; Chong & Chong,
1997; Libby & Waterhouse, 1996; Mia & Clarke, 1999; Pratt, 2004; Waweru et al.,
2004). The literature also implies that the relationship between management
accounting and organizational change is reciprocal. These relationships are
illustrated in the basic model presented in Chapter One (Figure 1.1).
Hypotheses are formulated in this study using the contingent theoretic arguments that
changes in management accounting practices and internal operations of organizations
are contingent on the “fit” with changes in the external environment that surrounds it.
Old institutional economic (OIE) theory perspectives are also used to explain the
reverse causation relationship between organizational and management accounting
change (known as formal and informal change).
Based on the research questions, this study focuses on the following six areas: the
competitive environment, advanced manufacturing technology, organizational
structure, organizational strategy, management accounting practices and
organizational performance. With respects to the changes in management accounting
practices, this study also tests the five management accounting change dimensions
developed by Sulaiman and Mitchell (2005):
1. Introduction of new management accounting techniques.
2. Introduction of new techniques as replacements.

84
3. Modification of the information output of the management accounting
techniques.
4. Modification of technical operation of the management accounting
techniques.
5. Removal with no replacements (abandonment).
4.2 Changes in Competitive Business Environment and Manufacturing
Technology
Environment can be broadly characterized as phenomena that are external to the
organization and which have either potential or actual influence on the organization
(Macy & Arunachalam, 1995, p.67). The external environment may thus relate to
technology, law, politics, economics, culture, and demographics. In this section,
hypotheses are developed that examine how changes in competitive environments
and advanced manufacturing technology cause changes in organizational structure,
organizational strategy and management accounting practices.
4.2.1 Changes in Competitive Environments, Technology and Organizational
Structure
Changes in competitive environment and technology put pressure on organizations to
adapt and change their structure (Schwarz & Shulman, 2007). In adopting this
change, horizontal (decentralized) structures like work-based teams have emerged,
(Cohen & Bailey, 1997). It is argued that the use of decentralized structures in a
competitive environment and advanced technology development enables
organizations not only to improve their speed and flexibility of response, but also to
improve the quality of that response. For example, Choe (2004), DeLisi (1990) and
Harris (1996) agree that the successful implementation of information technology
and computer networks in an organization, as well as the use of a high degree of
automation and computer aided technology in the production system, often require
the blending of technological and social skill, which can be best achieved through the
adoption of work-based teams. Thus, the following hypotheses are proposed:

85
H1a Organizations facing a more competitive environment will change to
a flatter organizational structure.
H1b organizations facing changes in manufacturing technology
advancement will change to a flatter organizational structure.
4.2.2 Changes in competitive environment, technology and organizational
strategy
Increasing globalization has resulted in change in the dynamic nature of competition
and technology. As a result, strategy development has also had to change (Shields,
1997). In intense and aggressive competition with increased customer demands and a
shorter product life cycle, a proper link between strategy and manufacturing
operations, are all keys to developing sustainable competitive advantage (Porter,
1996). Customer-focused strategies are of particular interest in this study and it is a
form of product differentiation strategy (Hyvönen, 2007). Recently, customer focus
has been identified as an important aspect of the strategy of the firm (Hyvönen, 2007;
Kaplan & Norton, 1992). This form of strategy provides potential for firms to
effectively differentiate their products or services from competitors by satisfying
customer demands for product features or for timely and reliable delivery and after
sales service (Hyvönen, 2007).
Many companies seek to gain competitive advantage by applying customer-focused
strategy, and a customer focus ideology is embedded in many management
philosophies, i.e. in total quality management, just-in-time or flexible manufacturing.
Li and Ye (1999) found that firms need to make greater investment in information
technology if they are in more dynamic environments and are also pursuing more
externally oriented strategies involving product market expansion. Information
technology is one basis of the application of advanced manufacturing technology,
such as just-in-time. Several empirical research studies suggest that the organization
should change its strategy to accommodate change in competitive environment and
technology. For example, Baines and Langfield-Smith (2003), Chenhall and
Langfield-Smith (2003), Harris (1996), and DeLisi (1990) show that firms facing a
more competitive environment and technology advancement will change towards a

86
differentiation strategy, in addition, Fuschs et. al. (2000) found that successful firms
aligned key elements of strategy with the environment. Therefore, the following
hypotheses are proposed:
H2a Organizations facing a more competitive environment will change
towards a differentiation strategy.
H2b Organizations facing manufacturing technology advancement will
change towards a differentiation strategy.
4.2.3 Changes in competitive environment, technology and management
accounting practices
It is argued that with an increase in uncertain environments, managers need specific
forms of management accounting information to support their decision needs and to
assist them in monitoring progress against strategies. This is supported by a
contingency style of management accounting research which assumes that an
appropriate fit between the environment and organizational system is needed for
management accounting systems to change, and to support managers’ new
information requirements (see for example, Chenhall, 2003; Gerdin & Greve, 2004;
Haldma & Laats, 2002; Lapsley & Pallot, 2000; Waweru et al., 2004).
Literature also suggests that changes in environmental factors surrounding an
organization can have a significant impact on its management accounting systems
(Baines & Langfield-Smith, 2003; Hoque & James, 2000; Innes & Mitchell, 1995;
Libby & Waterhouse, 1996; Scapens, 1999; J. A. Smith et al., 2005; Waweru et al.,
2004). For example Waweru et al. (2004) had identified factors which facilitate
change in the organizations examined in the face of competition, technology, new
shareholders, new customers, new accountants, and poor financial performance.
Market competition and technology advancement have been identified as major
triggers for management accounting change (Baines & Langfield-Smith, 2003; Libby
& Waterhouse, 1996; Waweru et al., 2004).

87
In response to the changes in competitive environment, it is important for companies
to increase focus on production quality and customer service. It had been found that
effective and efficient MAS is an important tool for the companies to remain
competitive (Hoque et al., 2001). Previous studies found that organizations had
changed their MAS to a more effective and efficient systems in order to cope with
the high market competition (for example, Baines & Langfield-Smith, 2003; Haldma
& Laats, 2002; Hoque et al., 2001).
It is also argued that with the introduction of new technologies in manufacturing
operations, the structure of manufacturing costs has changed. Manufacturing
technologies, such as computer integrated manufacturing and just in time systems,
emphasize the way in which direct labour and inventory are vanishing from the
factory, so that speed of operation is determined by the type of automation and
manufacturing system used, and not by how fast the operators can work.
Consequently, a traditional cost control system itself cannot help managers to
manage resources as well as identifying relevant costs. Choe (2004) in his study on
Korean manufacturing firms, found a significant positive relationship between the
level of advanced manufacturing technology and the amount of information
produced by the management accounting information system. This leads to the
hypotheses:
H3a Organizations facing a more competitive environment will change
their management accounting practices.
H3b Organizations adopting advanced manufacturing technology will
change their management accounting practices.
4.3 Changes in Management Accounting Practices
The management of change suggests how management accounting change is
intertwined with a changing organizational structure and strategy; these have been
the most consistently used organization characteristics and variables in past research
(e.g., Chenhall, 2003; Lapsley & Pallot, 2000). Further analysis on change in
management accounting practices, organizational structure and strategies are
88
reviewed below.
4.3.1 Changes in management accounting practices and organizational
structure
Literature has revealed that the design of MAS and the control process depend on the
context of the organizational setting in which these controls operated. For example
Moores and Mula (1993) reported that MAS forms an important part of the
information and control systems that reinforce and support basic intent of the formal
structure. Abdel-Kader and Luther (2008) suggest that firms confronted with high
uncertainty required a decentralised structure and more sophisticated MAS. There are
different views as to whether the centralized or decentralized structure is the most
prominent structural in designing MAS. However Matejka and De Waegenaere
(2000) and Chenhall (2008) both agreed that decentralized organizations tend to
implement changes in their management accounting systems in order to link various
activities across the organization. However, Verbeeten (2010) found a negative
association between decentralize structure and changes in MAS.
Many management accounting innovations associated with the changing nature of
operations and competition rely on promoting a high degree of employee
involvement, often using work-based teams (Chenhall & Langfield-Smith, 1998a).
The role of management accounting in structural change is not simply to deliver cost
data, but to provide a service that empowers team members to make the best decision
in the light of current changing conditions (Gordon & Miller, 1976). Thus, changing
the organization structure, including the use of teams and employee empowerment,
will result in changed employer and employee expectations, including increased
access to relevant information, particularly, management accounting information
(Scott & Tiessen, 1999).
As a consequence, management accounting in an organization is seen to be both one
element of organizational structure and also as an outcome of the chosen structure
(Luther & Longden, 2001). Gerdin (2005) also agreed that management control
subsystems may not only complement each other but also substitute for each other.
Thus, it is suggested that management accounting practices and organizational

89
structure can be changed in both directions. Therefore, the following hypotheses are
proposed:
H4a A change in organization structure will result in changes in
management accounting practices.
H4b A change in management accounting practices will result in changes
in organization structure.
4.3.2 Changes in management accounting practices and organizational
strategy
In pursuing competitive advantage, organizations may implement management
accounting systems that support their particular strategic priorities. This argument is
supported by a numbers of empirical findings: for example, Baines and Langfield-
Smith (2003) in their study on the antecedents of management accounting change,
found a significant relationship between changes in strategy and management
accounting practices, while Chenhall and Langfield-Smith (1998b) in their study on
the relationship between strategic priorities and management accounting techniques,
found that practices such as quality improvement programs and benchmarking can
support firms pursuing a differentiation strategy. In addition, Verbeeten (2010) found
a positive association between strategies and changes in MAS.
Beside these findings, Perera et al. (2003), suggest a reciprocal relationship between
strategy and management accounting practices; they find that transfer pricing policy
may be both a result of strategy and an instrument of strategic change. This finding is
supported by Kober et al. (2007), who found the existence of a two-way relationship
between management control systems and strategy. They also found that the
interactive use of management control system mechanisms helps to facilitate change
in strategy, and that management control system mechanisms change to match a
change in strategy. Thus, the following hypotheses are proposed:
H5a A change in organization strategy will result in changes in
management accounting practices.

90
H5b A change in management accounting practices will result in changes
in organization strategy.
4.4 Impact on Performance
4.4.1 Effect of changes in management accounting practices on performance
There is strong empirical support for the association between management
accounting practice and performance, with an increased use of non-financial
information. For example, Chenhall and Langfield-Smith (1998b) found greater use
of advanced management accounting practices, such as quality improvement
programs, benchmarking and activity-based management, in firms that placed a
strong emphasis on product differentiation strategies, ultimately resulting in high
performance. Perera et al. (1997) found a positive association between the emphasis
placed on various forms of management accounting practices in an environment of
manufacturing flexibility, and the use of non-financial measures such as defect rates,
on time delivery and machine utilization. Ittner and Larcker (1995), and Sim and
Killough (1998) both found a significant positive interaction between TQM
practices, management accounting information and performance, while Mia and
Clarke (1999) found an indirect association between the intensity of market
competition and business unit performance through the use of management
accounting information. Thus, the following hypothesis is proposed.
H6 A change in management accounting practices will result in improved
organizational performance.
4.4.2 Effect of changes in organizational structure on performance
With the increasing use of team based structures, there is an increased need for easily
accessible and relevant information at these levels, as well as relevant information
for top management to evaluate the operations of the firm. Scott and Tiessen (1999)
suggest that non-financial performance measures can form an integral part of the
information base necessary for team success. There is evidence of the existence of a

91
relationship between organizational design and performance: Pratt (2004) found that,
increasing employees' involvement in defining and creating their own work group
goals as part of the mission and strategy will increase organizational performance;
Moores and Yuen (2001) show an increasing need for formal reporting and objective
performance evaluation as firms grow both in terms of activities and number of
employees in order to achieve long term performance. This leads to the following
hypothesis:
H7 A change in organization structures will result in improved
organizational performance.
4.4.3 Effect of changes in organizational strategy on performance
A key component in understanding how operations support strategic priorities and
the interdependencies activities across the value chain is the formulation of
performance measures designed to coordinate manufacturing decisions and activities
to achieve a balanced set of strategic priorities (Chenhall & Langfield-Smith, 1998a).
It has been argued that in order to support and evaluate the achievement of strategic
advantages, reliance on financial performance measures alone will not necessarily
improve financial results, as financial measures only indicate the outcome of past
activities which may be no guide to improving future performance Hoque (2004).
Davila (2000), and Chong and Chong (1997) established that a greater use of non-
financial information for business units following a customer-focused or prospector-
type strategy, had a positive impact on performance. On the other hand, Perera et al.
(1997) found support for the hypothesized association between customer-focused
strategy and the use of non-financial measures, but not for the link to organizational
performance. This leads to the final hypothesis in this section:
H8 A change in organization strategy will result in improved
organizational performance.

92
4.5 Subsidiary Hypotheses
As pointed out earlier, besides testing the changes in management accounting
practices as a consequence of the changes in environment, this study also examines
the management accounting change dimension. When there is a change in MAP,
different type of changes are involved. There are arguments that changes in
management accounting practices are not necessarily confined to the introduction of
new systems (replacement of the existing system); changes can be in the way
management accounting is used (output or operational modification) (Burns et al.,
1999; Sulaiman & Mitchell, 2005).
Several researchers have found that replacement of existing techniques and
information output modifications are particularly significant (for example, Granlund,
2001; Sulaiman & Mitchell, 2005; Vaivio, 1999). The pilot study reveals that
replacement and information output modification are among the choice of the
majority of the respondents who change their management accounting techniques.
Thus, the following subsidiary hypotheses are developed.
H9 Organizations in a changing environment will not change their
management accounting techniques.
H10 Organizations in a changing environment will introduce new
management accounting techniques in parallel with their existing
techniques.
H11 Organizations in a changing environment will replace their existing
management accounting techniques with the new techniques.
H12 Organizations in a changing environment will modify the use of their
existing management accounting techniques.

93
H1a H7 H3a H4a H4b H2a
H6 H1b
H3b H5a H5b H2b H8
Figure 4.1
Hypothesized Model
4.6 Summary
This chapter provide a concise discussion of the development of hypotheses for this
study. Along with the support from the literature, findings from the pilot study
together provide a strong basis in developing these hypotheses. The hypothesized
model presented in the Figure 4.1 summarizes the developed hypotheses11.
11 The subsidiary hypotheses are not part of the structural model.
Changes in Manufacturing
Technology
Changes in competitive environment
Changes in Organizational
Strategy
Changes in organizational
structure
Changes in MAP
Changes in Organizational Performance

94
CHAPTER FIVE
PILOT STUDY
5.1 Introduction and Background of Pilot Study
A pilot study is conducted prior to the actual research survey based on the 41
manufacturing companies in Malaysian. The main objectives are to confirm the
applicability of the variables in Malaysian manufacturing industry and to explore the
potential association among the variables in the conceptual framework. The results
are also used as a guideline in hypothesis development for the main study. The steps
involved in conducting the pilot study are presented in Figure 5.1.
5.2 Research Method
5.2.1 Sampling and Data Collection Procedures
For the pilot study, the sample of 200 manufacturing companies was randomly
selected from FMM Directory 2008. The questionnaire was mailed to the companies
on November 20th, 2008. Together with the questionnaire, a cover letter and replied
paid envelope were included. The cover letter explained the details of the survey,
contact information and also the instructions to reply to the survey. In the cover
letter, the respondents are also informed that all the information provided will be

95
treated in the strictest confidence and that only aggregated findings would be
reported.
Within one month after the initial mail-out to respondents, out of 200, 41 companies
had replied (a response rate of 20.5%). This level of response was considered
sufficient for the pilot testing, thus no follow up procedure was carried out.
Figure 5.1 Steps Involved in Pilot Study
5.2.2 Research Instruments
The variables measured in this study cover the six areas in the conceptual
framework. An 11-point Likert scale is adopted from study by Baines and Langfield-
Smith (2003), to capture a decrease change (-5 to -1), no change (0) and an increase
Questionnaire Development
Sample Selection
Data Collection
Data Analysis
Discussion of Findings
Conclusions and Implications for Main Study

96
change (+1 to +5). Where relevant, respondents had the opportunity to indicate if the
various practices or items had never been used or adopted (indicate as N/A). For the
purposes of analysis this scale is coded 1 to 11, where 6 is the point for no change.
Any item which is not applicable is treated as a missing value. The items comprising
the questionnaire are presented in Table 5.1.
Table 5.1
Items Asked in Questionnaire
Variables Indicators 1. Competitive environment - Price competition
- Competition for new product development
- Marketing/distribution channels competition
- Competition for markets/revenue share
- Competitors’ action - No. Of competitors in your market
segments 2. Manufacturing technology - Robotics
- Flexible manufacturing systems (FMS)
- Computer aided manufacturing (CAM)
- Computer aided design (CAD) - Computer aided engineering (CAE) - Computer aided process planning
(CAPP) - Testing machines - Just-in-time (JIT) - Direct numerical control - Computer integrated manufacturing
(CIM) - Numerical control (NC)
3. Organizational structure - Multi-skilling of workforce - Worker training - Cross-functional teams - Establishing participative value - Management training - Flattening of formal organizational
structures - Work-based teams - Employee empowerment - Manufacturing cells
4. Organizational strategy - Provide on time delivery - Make dependable delivery promise - Provide high quality products - Provide effective after sales service
and support

97
- Make changes in design and introduce quickly
- Customize products and services to customer need
- Product availability (broad distribution)
- Make rapid volume/product mix changes
5. Management accounting practices
- Budgetary control - Full/ absorption costing - Cost-volume-profit (CVP) analysis - Variable/ marginal costing - Standard costing - Total quality management (TQM) - Target costing - Activity-based-costing (ABC) - Activity-based-management (ABM) - Value chain analysis - Product life cycle analysis - Benchmarking - Product profitability analysis - Customer profitability analysis - Shareholder value analysis
6. Organizational performance - Operating income - Sales growth - Return on investment (ROI) - Cash flow from operations - Market share - Market development - New market development - Research and development (R&D) - Cost reduction programs/ cost
control - Personnel development - Workplace relations - Employee health and safety

98
5.2.3 Data Analysis
In order to test the applicability of the variables and to explore the potential
association among the variables, data is analysed using descriptive statistics and
correlation coefficients. Before the data is further tested, it is important to test for the
validity and reliability of the instruments used.
In order to enhance the validity and reliability of the measures, the instruments used
in this study were adopted from the previous expert studies in this field (Askarany &
Smith, 2008; Baines & Langfield-Smith, 2003; Hoque et al., 2001). However, since
no advanced statistical analysis was to be performed on this pilot study data, the
measure of reliability for the overall items was deemed appropriate. In this case,
Cronbach’s alpha is used to test the internal consistency reliability.
From the analysis, Cronbach’s alpha obtained was 0.97 which was deemed good.
The lenient cut-off of 0.60 is common in exploratory research, but, alpha should be at
least 0.70 or higher in order to retain an item in an “adequate” scale. However, many
researchers require a cut-off of 0.80 for a “good scale”. Thus, an alpha of 0.97
obtained in these instruments is considered an excellent outcome.
5.3 Results and Discussion
As discussed in the previous chapter, research instruments in this study were adopted
from the research conducted in developed countries, thus it is important to ensure
that all of these variables are applicable to Malaysian manufacturing industries.
Other than that, results from this pilot study are also used to help in the development
of hypotheses. To achieve this, the potential association among the variables is
tested.
The previous section details the way in which the respondents were asked whether
changes had occurred in the competitive environment, manufacturing technology,
management accounting practices, organizational structure, strategy and performance
of their firm during the five year period from 2003 to 2007. The data in Table 5.2
shows the overall mean of changes in competitive environment, advanced

99
manufacturing technology (AMT), management accounting practices (MAP),
organizational structure, strategy and performance (9.09, 7.83, 8.48, 8.55, 8.94 and
8.00 respectively). These results indicate that manufacturing companies in Malaysia
had placed a greater emphasis in their competition and technological advancement. A
high mean value also indicates that management accounting practices, organizational
structure, strategy and performance in these companies have changed in a positive
way. Details of the results for each of the variables are discussed in the next
subsections.
Table 5.2
Descriptive Statistics for Main Variables
(Likert scale of 1to11: 1-5 = decrease change, 6 = no change, 6-11 = increase change)
In order to accomplish the first objective of the pilot study, descriptive statistics are
used. This method is considered the most appropriate as only the frequencies and
mean score of the data are used to test whether the variables are relevant or not in the
Malaysian manufacturing environment.
5.3.1 Competitive Environment
The descriptive statistics for all predictors’ variables in competitive environment are
presented in Table 5.3. As shown in this table, more than 80% of the respondents
report an increase in competitive environment over the five year period (2003-2007).
Only a minimal number of respondents (less than 8%) report a decrease in
competition, and the same percentage indicates that there were no changes in their
organization. Overall, the result indicates that manufacturing companies in Malaysia
Variable Average Mean
SD
Competitive Environment 9.09 1.23 Advanced Manufacturing Technology (AMT) 7.83 1.14 Management Accounting Practices 8.48 1.00 Organizational Structure 8.55 0.99 Organizational Strategy 8.94 1.17 Organizational Performance 8.00 1.57
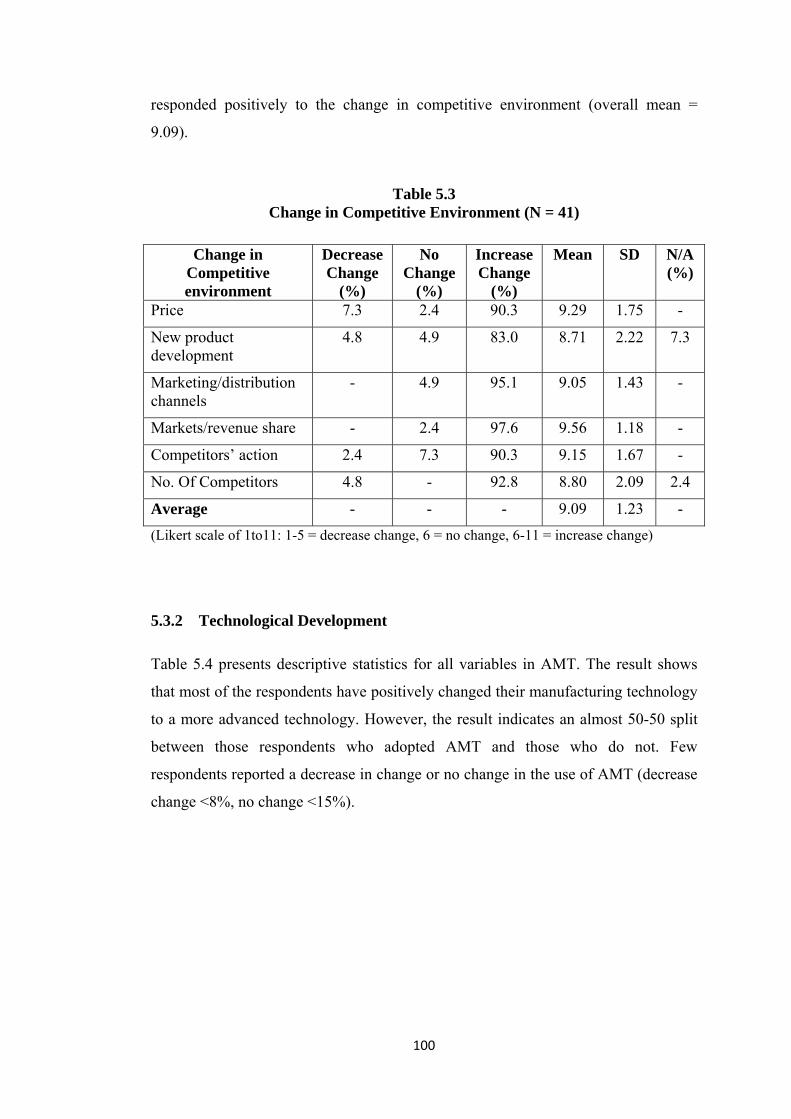
100
responded positively to the change in competitive environment (overall mean =
9.09).
Table 5.3
Change in Competitive Environment (N = 41)
(Likert scale of 1to11: 1-5 = decrease change, 6 = no change, 6-11 = increase change)
5.3.2 Technological Development
Table 5.4 presents descriptive statistics for all variables in AMT. The result shows
that most of the respondents have positively changed their manufacturing technology
to a more advanced technology. However, the result indicates an almost 50-50 split
between those respondents who adopted AMT and those who do not. Few
respondents reported a decrease in change or no change in the use of AMT (decrease
change <8%, no change <15%).
Change in Competitive environment
Decrease Change
(%)
No Change
(%)
Increase Change
(%)
Mean SD N/A (%)
Price 7.3 2.4 90.3 9.29 1.75 -
New product development
4.8 4.9 83.0 8.71 2.22 7.3
Marketing/distribution channels
- 4.9 95.1 9.05 1.43 -
Markets/revenue share - 2.4 97.6 9.56 1.18 -
Competitors’ action 2.4 7.3 90.3 9.15 1.67 -
No. Of Competitors 4.8 - 92.8 8.80 2.09 2.4
Average - - - 9.09 1.23 -

101
Table 5.4 Change in AMT (N = 41)
(Likert scale 1to11: 1-5 = decrease change, 6 = no change, 6-11 = increase change)
Even though majority of the respondents report an increase in the used of AMT, the
result shows the extent to which the use of particular forms of AMT are not really
high during the past five years (overall mean = 7.83). Furthermore, the result also
indicates that 20% to 49% of the respondents do not use a particular AMT in their
organization. Computer aided engineering (CAE) and numerical controls (NC) are
the most unpopular technologies for Malaysian manufacturing companies, while the
just-in-time (JIT) system is the most popular (76%).
5.3.3 Organizational Structure
Table 5.5 below, details the descriptive statistics for variables in organizational
structure:
Technological Change
Decrease Change
(%)
No Change
(%)
Increase Change
(%)
Mean SD N/A
(%)
Robotics 7.2 7.3 48.8 7.62 2.43 36.6
FMS 4.9 12.2 51.2 7.82 1.72 31.7
CAM 4.8 12.2 56.2 7.87 1.99 26.8
CAD 4.8 12.2 46.4 7.92 1.35 36.6
CAE 7.2 7.3 36.7 7.14 2.22 48.8
CAPP 7.2 2.4 58.7 7.68 2.12 31.7
Testing machine 2.4 7.3 63.3 8.67 1.90 26.8
JIT 2.4 2.4 75.7 8.39 1.60 19.5
Direct NC - 14.6 41.5 7.83 1.43 43.9
CIM 4.8 7.3 51.3 7.65 1.89 36.6
NC 2.4 14.6 34.2 7.52 1.91 48.8
Average - - - 7.83 1.14 -

102
Table 5.5
Change in Organizational Structure (N = 41)
(Likert scale of 1to11: 1-5 = decrease change, 6 = no change, 6-11 = increase change)
The result shows that around 80% or more of responding organizations have
increasingly changed to a more flatten structure within the five year period. This
evidence show that manufacturing companies in Malaysia have changed towards a
horizontal structure (decentralization). Worker training, management training and
employee empowerment are reported as the most important variables in the
organization structure (90.3%).
Less than 5% of the respondents indicate a decrease change in their organizational
structure and less than 13% of them reported that there is no change. Furthermore,
except for manufacturing cells (14.6%), less than 8% of responding organizations
indicate that particular organizational structures are not in practice in their
organization (cross-functional teams, establishing participative value, flattening of
formal organizational structure and work-based teams). Overall, organizational
Structural Change Decrease Change
(%)
No Change
(%)
Increase Change
(%)
Mean SD N/A
(%)
Multi-skilling 4.8 7.3 87.9 8.32 1.86 -
Worker training 4.8 4.9 90.3 8.83 1.53 -
Cross-functional teams
2.4 2.4 87.9 8.87 1.23 7.3
Establishing participative value
- 7.3 85.4 8.47 1.29 7.3
Management training
4.8 4.9 90.3 8.73 1.83 -
Flattening of formal organizational structure
2.4 12.2 83.0 8.25 1.51 2.4
Work-based teams - 9.8 85.3 8.62 1.39 4.9
Employee empowerment
2.4 7.3 90.3 8.68 1.67 -
Manufacturing cells - 7.3 78.1 8.20 1.28 14.6
Average - - - 8.55 0.99 -
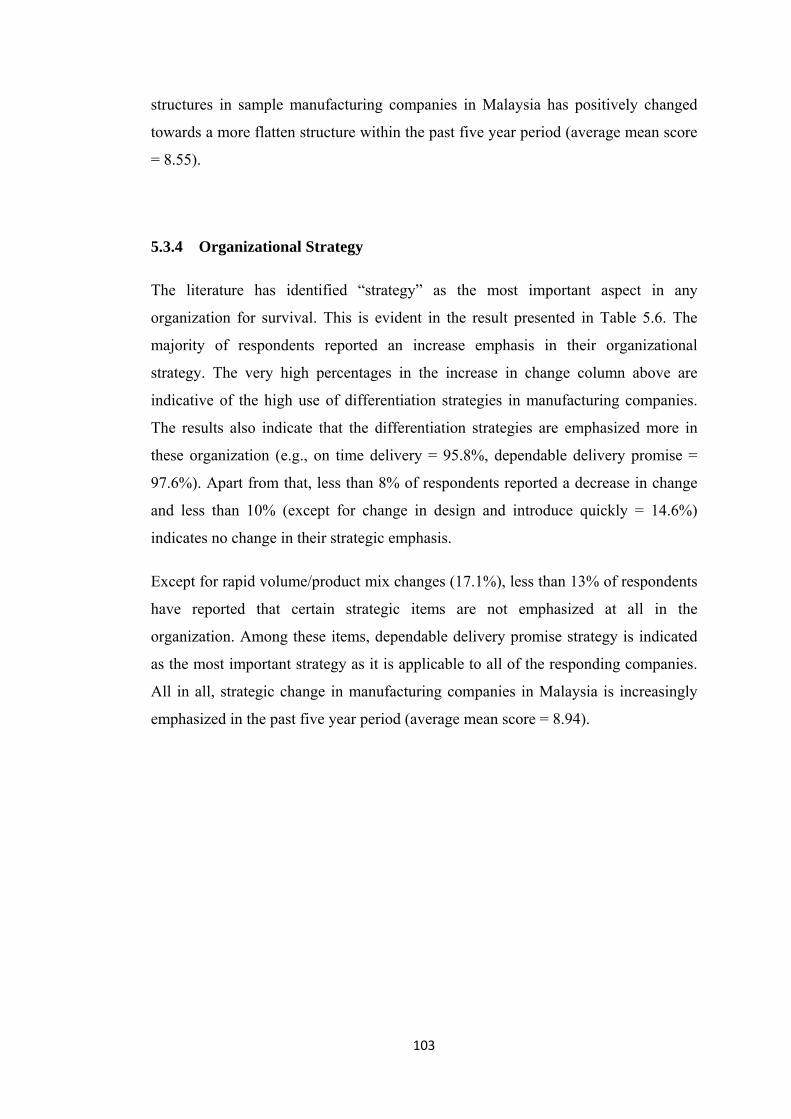
103
structures in sample manufacturing companies in Malaysia has positively changed
towards a more flatten structure within the past five year period (average mean score
= 8.55).
5.3.4 Organizational Strategy
The literature has identified “strategy” as the most important aspect in any
organization for survival. This is evident in the result presented in Table 5.6. The
majority of respondents reported an increase emphasis in their organizational
strategy. The very high percentages in the increase in change column above are
indicative of the high use of differentiation strategies in manufacturing companies.
The results also indicate that the differentiation strategies are emphasized more in
these organization (e.g., on time delivery = 95.8%, dependable delivery promise =
97.6%). Apart from that, less than 8% of respondents reported a decrease in change
and less than 10% (except for change in design and introduce quickly = 14.6%)
indicates no change in their strategic emphasis.
Except for rapid volume/product mix changes (17.1%), less than 13% of respondents
have reported that certain strategic items are not emphasized at all in the
organization. Among these items, dependable delivery promise strategy is indicated
as the most important strategy as it is applicable to all of the responding companies.
All in all, strategic change in manufacturing companies in Malaysia is increasingly
emphasized in the past five year period (average mean score = 8.94).
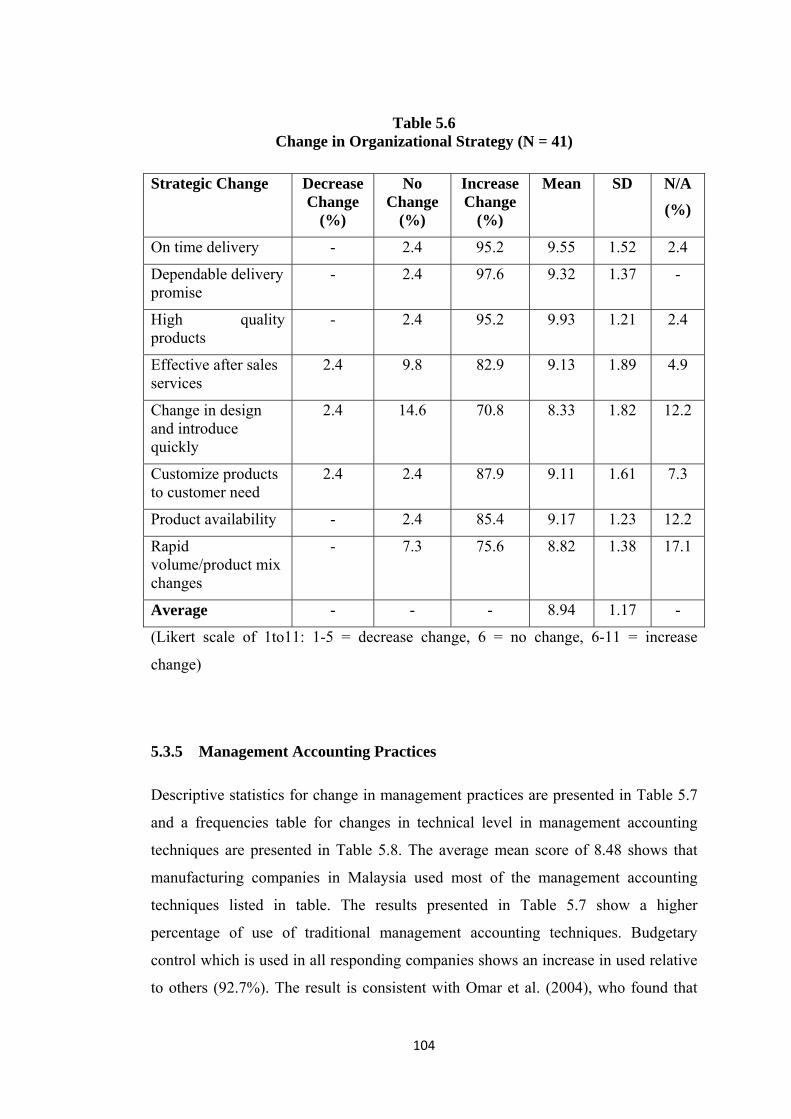
104
Table 5.6
Change in Organizational Strategy (N = 41)
(Likert scale of 1to11: 1-5 = decrease change, 6 = no change, 6-11 = increase
change)
5.3.5 Management Accounting Practices
Descriptive statistics for change in management practices are presented in Table 5.7
and a frequencies table for changes in technical level in management accounting
techniques are presented in Table 5.8. The average mean score of 8.48 shows that
manufacturing companies in Malaysia used most of the management accounting
techniques listed in table. The results presented in Table 5.7 show a higher
percentage of use of traditional management accounting techniques. Budgetary
control which is used in all responding companies shows an increase in used relative
to others (92.7%). The result is consistent with Omar et al. (2004), who found that
Strategic Change Decrease Change
(%)
No Change
(%)
Increase Change
(%)
Mean SD N/A
(%)
On time delivery - 2.4 95.2 9.55 1.52 2.4
Dependable delivery promise
- 2.4 97.6 9.32 1.37 -
High quality products
- 2.4 95.2 9.93 1.21 2.4
Effective after sales services
2.4 9.8 82.9 9.13 1.89 4.9
Change in design and introduce quickly
2.4 14.6 70.8 8.33 1.82 12.2
Customize products to customer need
2.4 2.4 87.9 9.11 1.61 7.3
Product availability - 2.4 85.4 9.17 1.23 12.2
Rapid volume/product mix changes
- 7.3 75.6 8.82 1.38 17.1
Average - - - 8.94 1.17 -

105
manufacturing companies in Malaysia, especially local companies, are still largely
focused on the use of traditional management accounting techniques.
Table 5.7 Change in MAP (N = 41)
(Likert scale of 1to11: 1-5 = decrease change, 6 = no change, 6-11 = increase change)
Change in MAP Decrease Change
(%)
No Change
(%)
Increase Change
(%)
Mean SD N/A
(%)
Budgetary control 2.4 4.9 92.7 9.17 1.58 -
Full/absorption costing
2.4 9.8 65.8 8.84 1.74 22.0
CVP analysis 2.4 7.3 78.1 8.47 1.54 12.2
Variable/marginal costing
4.9 4.9 73.1 8.82 1.66 17.1
Standard costing - 14.6 80.5 8.79 1.66 4.9
TQM 2.4 9.8 63.4 8.81 1.85 24.4
Target costing 2.4 9.8 61.0 8.17 1.53 26.8
ABC 12.2 14.6 46.4 7.47 2.14 26.8
ABM 12.2 12.2 36.6 7.24 1.98 39
Value chain analysis 2.4 17.1 53.7 7.70 1.46 26.8
Product life cycle analysis
2.4 17.1 48.8 7.86 1.67 31.7
Benchmarking - 7.3 80.5 8.75 1.57 12.2
Product profitability analysis
- 2.4 95.2 9.50 1.15 2.4
Customer profitability analysis
2.4 9.8 70.7 8.91 1.67 17.1
Shareholder value analysis
- 9.8 73.1 8.68 1.53 17.1
Average - - - 8.48 1.01 -

106
Furthermore, the result also shows that, the most popular traditional management
accounting techniques used are standard costing (N/A=4.9%) and variable/ marginal
costing (N/A=17.1%), where as full/ absorption costing indicates a contra result (N/A
= 22%). The most popular advanced management accounting techniques used is
product profitability analysis and benchmarking. 95.2% and 80.5% of the
respondents respectively, reported an increase used in these two techniques.
Interestingly, ABC and ABM show a highest decrease in change with 12.2%. Only
46.4% of responding companies report an increase used in ABC. This is contradict
with the literature, where ABC is found as an important accounting innovations in a
changing organization (for example, Chenhall & Langfield-Smith, 1998a; Gosselin,
1997).
Table 5.8 below presents frequencies for management accounting change dimensions
in respondents’ company. The result shows that a majority of the responding
companies have not changed in their use of management accounting techniques
(42.9%). Excluding this group, the most commonly occurring change is as a
replacement (18.3%) and as information output modification (18%). This result is
consistent with Sulaiman and Mitchell (2005). The fourth rank is introduction of new
techniques (11.3%). Changes occurring in modification of technical operation and
removal with no replacement show the lowest percentages (5.3% and 4.2%
respectively).
Table 5.8 Management Accounting Change Dimensions (N = 41)
Dimensions of Change Responses (%)
Rank
No change 42.9 1
Introduction of new techniques 11.3 4
Introduction of new techniques as replacements 18.3 2
Modification of the information/output of the MAS 18.0 3
Modification of technical operation of the MAS 5.3 5
Removal with no replacement (abandonment) 4.2 6
Total 100.0

107
5.3.6 Organizational Performance
Details of the changes in organizational performance variables are presented in Table
5.9.
Table 5.9
Change in Organizational Performance
(Likert scale of 1to11: 1-5 = decrease change, 6 = no change, 6-11 = increase change)
The result show that financial and non-financial performance measurement are both
employed by sample companies (range of positive change from 73% to 78%, except
for R&D=63.4%). This result is consistent with the arguments that multiple
performance measures are needed because the use of traditional (financial)
performance measures alone not enough to measure performance for organizations
operating in highly competitive and advanced technology environments (Hoque et
al., 2001). Only 2% to 5% of the responding companies indicate that a certain
performance measurement is not being used in the organization. Interestingly, 19.5%
Change in Performance
Decrease Change
(%)
No Change
(%)
Increase Change
(%)
Mean SD N/A (%)
Operating income 19.5 4.9 73.2 7.83 2.42 2.4
Sales growth 12.1 7.3 78.2 8.30 2.13 2.4
ROI 14.7 7.3 73.1 7.59 1.84 4.9
CF from operations 17.1 9.8 68.2 7.69 2.18 4.9
Market share 12.2 12.2 70.7 8.08 2.18 4.9
Market development
9.7 9.8 78.1 8.02 1.76 2.4
New product development
9.7 12.2 75.7 7.75 1.96 2.4
R&D 9.7 22.0 63.4 7.72 2.08 4.9
Cost reduction program
9.7 9.8 78.1 8.00 2.01 2.4
Personnel development
2.4 4.9 87.8 8.18 1.39 4.9
Workplace relations 2.4 12.2 80.5 8.26 1.55 4.9
Employee health - 9.8 85.3 8.54 1.45 4.9
Average - - - 8.00 1.57 -

108
of the respondents reported a decrease in the use of operating income as one of their
performance measurement indicator. This might be due to the reduced relevance of
this measurement in a highly competitive environment. Overall, respondents
indicated that their performance has increased as compared to their competitors over
the past five year period (average mean score = 8.00).
Other than descriptive statistics, correlation coefficients are used to measure the
potential association among the variables within the conceptual model (second
objective). Moreover, this analysis is conducted to support the hypotheses developed
in this study (see Chapter 4).
5.3.7 Correlation Matrix for Operational Measures
Pearson correlation coefficients for pairs of operational variables are presented in
Table 5.10. As can be seen from the table, changes in organizational structure,
strategy and management accounting practices are positively and significantly
associated with the changed competitive environment (r = 0.55, p<0.01; r = 0.72,
p<0.01; r = 0.47, p<0.01). These three variables also have a positive significant
association with changes in manufacturing technology (r = 0.53, p<0.01; r = 0.58,
p<0.01, r = 0.59, p<0.01). Furthermore, changes in organizational structure and
strategy are positively and significantly associated with changes in management
accounting practices (r = 0.58, p<0.01; r = 0.73, p<0.01).
The correlation coefficients for changes in organizational strategy and organizational
performance showed a positive significant association (r = 0.41, p<0.01).
Additionally, changes in organizational structure and management accounting
practices are marginally significant and related with organizational performance (r =
0.33, p<0.05; r = 0.36; p<0.05). The correlations between changes in competition and
manufacturing technology with performance are positive but not significant.
These results are consistent with the literature review presented in Chapter Two. In
response to the changes in competitive environment and manufacturing technology,
organizations are tending to change their design, strategy and MAP in maintaining
and/or improving performance. Thus, the alignments between these three

109
organizational factors (structure, strategy and MAP) are essential in order to achieve
a superior outcome.
Table 5.10 Correlation Matrix (N = 41)
Variables COMP AMT STRUC STRAT MAP PERF
COMP 1
AMT 0.32* 1
STRUC 0.55** 0.53** 1
STRAT 0.72** 0.58** 0.68** 1
MAP 0.47** 0.59** 0.58** 0.73** 1
PERF 0.14 0.18 0.33* 0.41** 0.36* 1
*Significant level at p<0.05 (1-tailed).
**Significant level at p<0.01 (1-tailed).
Definitions of Variables:
COMP = change in competitive environment; AMT = change in advanced manufacturing
technology; STRUC = change in organizational structure; STRAT = change in
organizational strategy; MAP = change in management accounting practices; PERF =
change in organizational performance.
5.4 Conclusions and Implications for the Main Study
The findings from this pilot study shed light on the intensity of management
accounting and organizational change in Malaysian manufacturing industries. The
descriptive analysis shows that a majority of the responding companies had reacted
positively to changes in competitive business environment and advanced
manufacturing technology. The results also show positive changes in MAP,
organizational structure and strategy. The results from the analysis of correlation
coefficients show that associations among MAP, structure and strategy are both
positive and significant. Positive significant relationships are also found among
MAP, structure and strategy with competitive environment, AMT as well as
performance.
Besides the changes in MAP, this study has also analysed the dimensions of change
in MAP. It is found that most of the responding companies have not changed in the

110
way they use their management accounting techniques. The majority of respondents,
who had made the changes, choose to replace the existing techniques, modify the
information output and introduce new techniques. Few of them reported changes in
technical operations leading to abandonment. This result supports a finding by
Sulaiman and Mitchell (2005), where they found that replacement of existing
techniques and information output modifications have a relatively high frequency
and importance in Malaysian manufacturing companies.
The results obtained in this study are consistent with the previous studies which
suggest that competitive environment and technology are determinants of
organizational and management accounting change (for example, Baines &
Langfield-Smith, 2003; Hoque et al., 2001). This study also provides evidence that
even though the variables used in this study are adopted from studies conducted in
developed countries they are also applicable to the Malaysian manufacturing
environment. Indirectly this result supports an argument that, although Malaysia is a
developing country, its manufacturing industries are more concentrated than those of
most of other developed countries (Bhattacharya, 2002). Hence, the instruments used
in this pilot study are further used for the main research survey. The positive and
significant results from the correlation coefficients analysis also provide support for
the structural model presented in Chapter One, as well as the hypotheses
development.

111
CHAPTER SIX
DATA ANALYSIS AND HYPOTHESES TESTING
6.1 Introduction
The research framework and methodology developed to meet the objectives of this
study have been presented in the previous chapters. The main objective is to
investigate how the alignment of the changes in management accounting practices,
with the changes in internal organizational factors (namely strategy and structure), in
changing business environment, and the impact on performance. As mentioned in the
earlier chapters, variables used in this study originate from the various studies
conducted in developed countries. Thus the pilot test had been carried out in order to
ensure that these variables can be applied in the Malaysian manufacturing
environment. The pilot study was also conducted in order to explore the potential
association among the variables in the conceptual framework. Results from the pilot
test presented in the previous chapter permit further analysis for the variables.
This chapter presents the work on data analysis. The structural equation modelling
(SEM) using LISREL Version 8.80 was used to analyse the hypothesized model in
this study. The data were also analysed using descriptive statistics and correlation
coefficients using SPSS Version 17.0. This chapter comprises eight sections: Section
two below presents the analysis on response and non-response bias, followed by the
profile of the responding companies using the descriptive statistics in section three.

112
Analysis on reliability and validity of measurements is presented in section four.
Section five describes the correlation matrix among the hypothesized variables, and
the analysis for structural model and hypotheses testing are discussed in section six.
Section seven presents an analysis of the subsidiary hypotheses. A summary of the
key findings is highlighted in the last section.
6.2 Response and Non-Response Bias
Data were collected using a mail survey. If respondents cooperate and give truthful
answers, the survey is likely to accomplish its goal. However, if this condition is not
met, two problems might arise, i.e. response and non-response bias. It is important to
make sure that the data are free from these types of error in order to ensure that the
analysed data will produce valid and reliable results.
Response bias is a survey error that occurs when respondents tend to answer
questions in a certain direction which causes them to misrepresent the truth
(Zikmund, 2003). Non-response error is the statistical difference between a survey
that includes only those who responded and a perfect survey that would also include
those who failed to respond (Zikmund, 2003). To utilize the result, researcher must
be sure that those who responded to the questionnaire were representative of those
who did not.
Even though sample bias did not appear to be problematic (Zikmund, 2003), a
procedure was utilized to check this error. The sample was divided into two groups
according to early and late responses. Completed questionnaires received after the
initial posting were considered as early responses and those which were received
after the second reminder, were considered as late responses. As shown in Table 6.1,
results on descriptive statistics show no significant differences between the two
groups of respondents. It indicated that the samples are representative and
respondents’ error is not an issue in this research.

113
Table 6.1 Descriptive Statistics
Early (n=62) and Late (n=65) Respondents
Variables Mean Standard Deviation
Range Min Max
Number of Employees Early Respondents Late Respondents Changes in Market Competition Early Respondents Late Respondents Changes in AMT Early Respondents Late Respondents Changes in organization structure Early Respondents Late Respondents Changes in organization strategy Early Respondents Late Respondents Changes in MAP Early Respondents Late Respondents Changes in organization performance Early Respondents Late Respondents
100-500 100-500
8.9 9.0
6.8 7.2
8.3 8.5
8.8 8.7
8.4 8.2
7.9 7.9
<100 <100
1.2 1.1
2.0 2.3
1.0 1.3
1.1 1.2
1.1 1.2
1.6 1.8
<100 <100
6.7 6.3
3.8 1.5
6.4 6.3
6.0 6.5
6.0 5.8
4.3 3.4
>1000 >1000
11.0 11.0
10.0 10.1
9.5 10.3
10.0 11.0
10.3 10.0
10.1 10.8
6.3 Profile of Responding Companies
A profile of the participating organizations is presented in Table 6.2 and Figures 6.1.
Detailed descriptive statistics for demographic information are presented in
Appendix B.

114
6.3.1 Industry classification
As can be seen from Table 6.2, the majority of the respondents are from the electrical
and electronics industry (26.9 percent); followed by basic metal products (10.8
percent), food processing (9.4 percent), machinery and equipment (7.1 percent),
petrochemical and rubber products (both are 6.6 percent). Companies from other
industries are ranged between 1.4 to 4.2 percent in terms of their level of responses.
Table 6.2
Industry Classification
Frequency Percent Valid Percent
Cumulative Percent
Electrical and electronics 57 26.89 26.89 26.89
Engineering Supporting 3 1.42 1.42 28.3
Food Processing 20 9.43 9.43 37.74
Life Sciences 3 1.42 1.42 39.15
Machinery and equipment 15 7.08 7.08 46.23
Petrochemical and polymer
14 6.6 6.6 52.83
Rubber products 14 6.6 6.6 59.43
Transport equipment 3 1.42 1.42 60.85
Basic metal products 23 10.85 10.85 71.7
Wood based 2 0.94 0.94 72.64
Publishing 3 1.42 1.42 74.06
Shipping 3 1.42 1.42 75.47
Information technology 8 3.77 3.77 79.25
Automotive 9 4.25 4.25 83.49
Paints & coatings 6 2.83 2.83 86.32
Fertilizers 6 2.83 2.83 89.15
Stationery 3 1.42 1.42 90.57
Plastic 6 2.83 2.83 93.4
Yachts builders 3 1.42 1.42 94.81
Cosmetics and toiletries products
6 2.83 2.83 97.64
Chemicals 5 2.36 2.36 100
Total 212 100 100

115
Out of various industries engaged in this study, 68 percent of them are local
companies, only 32 percent of the respondents are foreign companies operated in
Malaysia. Out of 212 companies participated in this research, 51 percent of them
produce their products mainly for industrial supply, 40 percent produce consumer
products, and another 9 percent of the respondents produce their products for both
consumer and the industries supplies. Detail of the sample distribution by sectors is
presented in appendix B-1.
6.3.2 Company Size
The sample in this study embraces from small and large companies. The Small and
Medium Enterprise Corporation Malaysia (SME Corp. Malaysia) defines small
companies as the companies having employees of equal to or less than 50, whereas
the companies which have employees of between 51 to 150 are designated as
medium size. Companies having more than 150 employees are considered as big
companies.
Figure 6.1 Company Size

116
According to Figure 6.1, the number of employees for these participating companies
ranged from as low as less than 50 to in excess of 1,000 employees. The majority (48
percent) indicated that the total number of employees was ranged from 50 to 150,
which are designated as medium-sized organizations. 12 percent of the responding
companies were small companies (less than 50 employees), and the balance are
considered as big companies, with 14 percent of them have more than 1,000
employees. Detailed of demographic statistics is presented in appendix B-2.
6.4 Exploratory Data Analysis and Reliability and Validity of the
Measurements
The main objective of this study is to utilize Structural Equation Modelling (SEM) to
examine whether the alignment among the environmental factors with the
management accounting and organizational change have an impact on performance.
Before proceeding with the analysis using SEM, the exploratory data analysis and
validity and reliability tests were conducted. This is to ensure that the data fulfilled
the requirements for SEM analysis.
Exploratory data screening (EDS) is important in order to purify data prior to the
SEM analysis. EDS was conducted using descriptive statistics to ensure that the data
had been entered correctly, and that any missing values had been replaced using
mean substitution. However, any response which has missing items of more than
40% is considered as incomplete, and is thus excluded from the analysis (refer Table
3.1, page 70). This is essential because SEM requires that there be no missing values
in the input data. SEM assumptions are similar to multiple linear regression analysis;
the important assumptions are linearity, normal distribution of the variables and low
multicollinerity.
Internal consistency for each construct is identified based on Cronbach’s alpha.
Results from the analysis show that all of the constructs have a Cronbach’s alpha
value of more than 0.80, which is deemed satisfactory (see Table 6.3 to 6.8). Since
there are many variables for each construct, exploratory factor analysis (EFA) is
conducted. The purpose of EFA is to explore and summarise the underlying

117
correlation structure for the data set as well as to simplify the data by revealing a
smaller number of underlying factors. It helps to eliminate redundant, unclear as well
as irrelevant variables. All items in each construct will be measured as a single
construct for hypotheses testing. Detailed results on the descriptive statistics and
reliability tests of each construct are presented in the following subsections.
6.4.1 Competitive Environment
Table 6.3 below details the descriptive statistics, factor loadings, reliability, and
validity tests for all of the variables in competitive environment.
Table 6.3 Results of Descriptive Statistics and Reliability and Validity
(Competitive Environment)
(Likert scale of 1to11: 1-5 = decrease change; 6 = no change; 7-11 = increase change)
The results show high mean value for all variables (more than 8.0), which shows that
competitive environment in Malaysian manufacturing industries has been
significantly increased over the past five years. The areas of greatest increase in
competitiveness relate to competition for market/ revenue share (mean = 9.39), price
competition (mean = 9.31) and competitors action (mean = 9.17). High mean values
are also an indicator of the uneven data distribution. The skewed data indicated that
the variables were not normally distributed12.
12 Detailed result of the Skewness and Kurtosis test for all items is presented in Appendix C.
List of Constructs and Measures Mean SD Factor Loading
Cronbach’s alpha = 0.81 AVE = 0.50 1. Competitors action 2. Marketing/distribution channels
competition 3. Competition for markets/revenue share 4. No. Of competitors in market segments 5. Price competition 6. Competition for new product development TOTAL
9.17 8.95
9.39 8.90 9.31 8.84
9.09
1.49 1.48
1.24 1.70 1.68 1.84
0.84 0.80
0.79 0.70 0.63 0.59

118
Factor analysis shows that all six items in this variable represent a single factor
loading. High factors loadings (>0.50) with the Cronbach’s alpha of 0.81 and an
average variance extract (AVE) of 0.50, indicated that the measures for competitive
environment were valid and reliable for further analysis.
6.4.2 Advanced Manufacturing Technology (AMT)
Descriptive statistics for AMT in Table 6.4 below indicate a high mean value for
each of the measures (>7.0). It shows a significant increased in the use of AMT in
Malaysian manufacturing industry in the five years period from 2003 to 2007 (mean
= 7.66). The technologies that contribute to the increased in AMT are testing
machines (mean = 8.46) and JIT (mean = 8.31). High mean values, however also
indicate that this variable is not normally distributed. Apart from a violation of the
normality assumption, results from the analysis show that the measures for AMT are
valid and reliable.
Table 6.4 Results of Descriptive Statistics and Reliability and Validity
(AMT)
(Likert scale of 1to11: 1-5 = decrease change; 6 = no change; 7-11 = increase change)
Variables Mean SD Factor Loadings 1 2
Cronbach’s alpha = 0.93 AVE = 0.66 1. Computer aided process planning (CAPP) 2. Computer aided engineering (CAE) 3. Computer aided design (CAD) 4. Computer aided manufacturing system
(CAM) 5. Computer integrated manufacturing (CIM) 6. Testing machines 7. Numerical control 8. Just-in-time 9. Robotics 10. Flexible manufacturing system (FMS) 11. Direct numerical control TOTAL
7.60 7.22 7.66 7.74
7.63 8.46 7.48 8.31 7.44 7.80 7.44
7.66
2.03 1.20 2.18 1.95
1.83 1.97 1.92 1.73 1.81 1.55 1.57
0.89 0.87 0.84 0.75
0.74 0.81 0.78 0.56
0.89 0.84 0.62

119
A high Cronbach’s alpha (0.93) shows reliable measures of the variable, whereas
factor loadings of more than 0.5 and AVE of 0.66 indicate the validity of the
measures. As can be seen from Table 6.4 below, measurement items for AMT were
loaded into two factors. As for the further analysis, all of these items were combined
together in one composite score.
6.4.3 Organizational Structures
Mean values for items in organizational structures were in the ranged of 8.2 to 8.9
(see Table 6.5). It showed that these organizations had changed their design to a
flatter structure during the period of study (mean = 8.50). Worker training is the
highest practices that contribute to the significant increased in flat organization
structure (mean = 8.90). However, the normality test for this variable showed a non-
normal distribution. Despite the non-normal data distribution, this variable was
reliable and valid for further analysis (Cronbach’s alpha = 0.89, AVE=0.56). Factor
analysis showed that the items in this variable were divided into two dimensions,
with high factor loadings (>0.5). These items were merged into a composite variable
for further analysis.
Table 6.5 Results of Descriptive Statistics and Reliability and Validity
(Organizational Structures)
(Likert scale of 1to11: 1-5 = decrease change; 6 = no change; 7-11 = decrease change)
List of Constructs and Measures Mean SD Factor Loadings 1 2
Cronbach’s alpha = 0.89 AVE = 0.56 1. Manufacturing cells 2. Work-based teams 3. Employee empowerment 4. Flattening of formal organizational structures 5. Multi-skilling of workforce 6. Worker training 7. Management training 8. Cross-functional teams 9. Establishing participative culture TOTAL
8.22 8.45 8.58 8.10 8.49 8.90 8.68 8.67 8.62
8.50
1.42 1.50 1.57 1.51 1.61 1.46 1.63 1.40 1.42
0.84 0.81 0.80 0.67
0.85 0.73 0.51 0.73 0.67
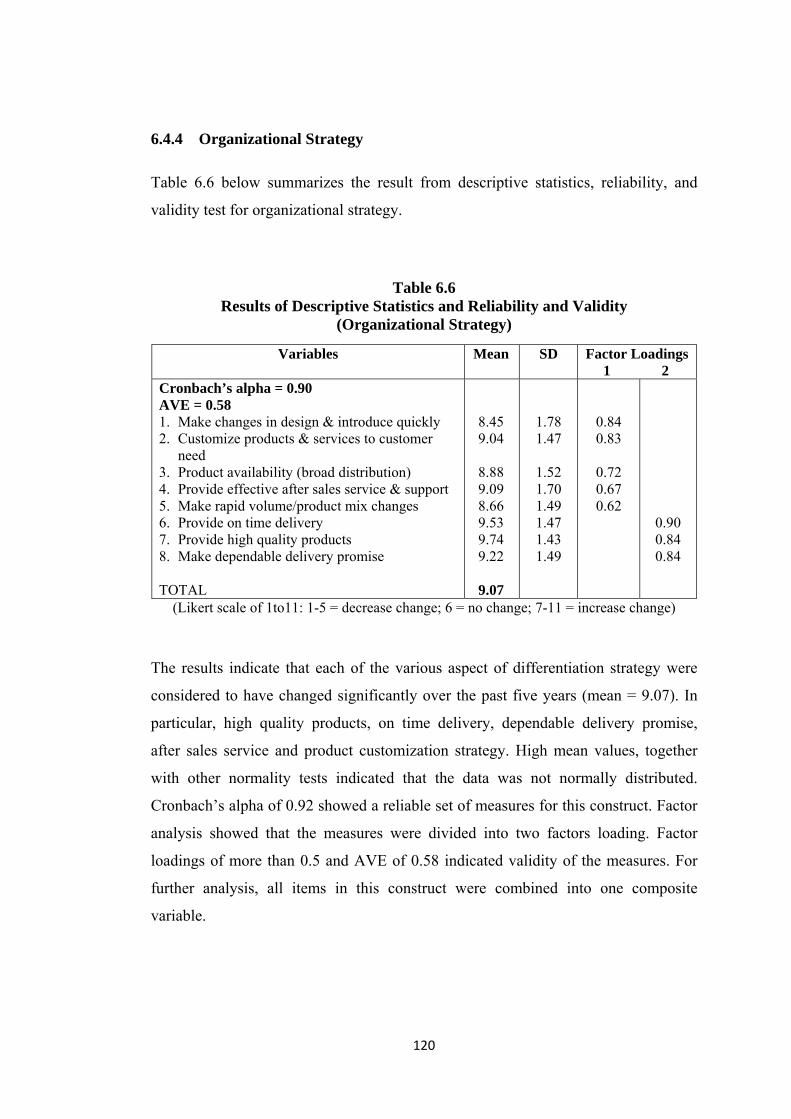
120
6.4.4 Organizational Strategy
Table 6.6 below summarizes the result from descriptive statistics, reliability, and
validity test for organizational strategy.
Table 6.6 Results of Descriptive Statistics and Reliability and Validity
(Organizational Strategy)
(Likert scale of 1to11: 1-5 = decrease change; 6 = no change; 7-11 = increase change)
The results indicate that each of the various aspect of differentiation strategy were
considered to have changed significantly over the past five years (mean = 9.07). In
particular, high quality products, on time delivery, dependable delivery promise,
after sales service and product customization strategy. High mean values, together
with other normality tests indicated that the data was not normally distributed.
Cronbach’s alpha of 0.92 showed a reliable set of measures for this construct. Factor
analysis showed that the measures were divided into two factors loading. Factor
loadings of more than 0.5 and AVE of 0.58 indicated validity of the measures. For
further analysis, all items in this construct were combined into one composite
variable.
Variables Mean SD Factor Loadings 1 2
Cronbach’s alpha = 0.90 AVE = 0.58 1. Make changes in design & introduce quickly 2. Customize products & services to customer
need 3. Product availability (broad distribution) 4. Provide effective after sales service & support 5. Make rapid volume/product mix changes 6. Provide on time delivery 7. Provide high quality products 8. Make dependable delivery promise TOTAL
8.45 9.04
8.88 9.09 8.66 9.53 9.74 9.22
9.07
1.78 1.47
1.52 1.70 1.49 1.47 1.43 1.49
0.84 0.83
0.72 0.67 0.62
0.90 0.84 0.84

121
6.4.5 Management Accounting Practices
Table 6.7 summarizes 15 measures for changes in management accounting practices
from year 2003 to 2007. The results from the descriptive statistics showed high mean
scores for all of the items (>7.0). This result indicated that the sample companies had
significantly changed its management accounting practices during the mentioned
period. Product profitability analysis and budgetary control is the highly used MAP
in Malaysian manufacturing companies.
The normality test for the items in this variable indicated that the data was not
normally distributed. Factor analysis provided three factor loadings with a loading
value of more than 0.5. These values, together with the AVE of 0.58 showed the
valid measures for MAP. Cronbach’s alpha of 0.92 indicated a reliable set of
measures for MAP. Average mean score for all of the 15 items in this variable was
calculated as a composite score for further analysis.
Table 6.7 Results of Descriptive Statistics and Reliability and Validity
(MAP)
(Likert scale of 1to11: 1-5 = negative change; 6 = no change; 7-11 = positive change)
Variables Mean SD Factor Loadings 1 2 3
Cronbach’s alpha = 0.92 AVE = 0.58 1. Standard costing 2. Product life cycle analysis 3. Value chain analysis 4. Target Costing 5. Benchmarking 6. TQM 7. Full/Absorption Costing 8. Product profitability analysis 9. Budgetary control 10. Shareholder value analysis 11. Customer profitability analysis 12. CVP analysis 13. Activity Based Costing (ABC) 14. Activity Based Management (ABM) 15. Variable/marginal costing TOTAL
8.64 7.82 7.94 8.19 8.52 8.69 8.60 9.36 9.10 8.38 8.77 8.39 7.59 7.45 8.47
8.30
1.78 1.65 1.62 1.63 1.52 1.81 1.81 1.23 1.55 1.73 1.70 1.70 2.01 1.88 1.77
0.74 0.72 0.66 0.67 0.58 0.57
0.88 0.61 0.56 0.56 0.55 0.54
0.85 0.83 0.56

122
6.4.6 Organizational Performance
As explained in Chapter Three, the score for organizational performance was
calculated by multiplying the respective ‘organizational performance’ (11-point
Likert scale) and ‘importance’ scores (5-point Likert scale). Therefore, the maximum
final score is 55. Results in Table 6.8 show that, the mean score for all of the items in
organizational performance was more than 30. This result indicated that the sample
organizations had a positive change in its performance and they perceived their
performance as an important aspect of the organization.
Table 6.8
Results of Descriptive Statistics and Reliability and Validity (Performance)
Since the final score of this variable was not derived directly from the observed
measure, the Cronbach’s alpha was not applicable. However, the Cronbach’s alpha
for the measurement of ‘changes in organizational performance’ was obtained in
order to test the reliability of the measures for organizational performance. The value
of 0.93 for Cronbach’s alpha indicated reliable measures.
Variables Mean SD Factor Loadings 1 2 3
Cronbach’s alpha =0.93 AVE = 0.70 1. Operating income 2. Cash flow from operations 3. Sales growth 4. Market share 5. Return on investment 6. Personnel development 7. Employee health and safety 8. Workplace relations 9. Cost reduction programs/ cost control 10. Research and development (R&D) 11. New product development 12. Market development TOTAL
35.82 35.32 37.85 33.09 30.97 33.34 36.31 33.75 35.62 30.36 32.45 33.50
33.81
12.04 10.18 11.03 11.47 10.80 10.82 11.08 11.21 10.36 12.46 11.00 10.29
0.84 0.83 0.82 0.79 0.74
0.88 0.86 0.82 0.56
0.89 0.87 0.59

123
Analysis on EFA results in three factors loading for items in organizational
performance with a value of more than 0.5. The high value of factors loading
together with AVE of 0.70 signified the validity of the measures.
6.4.7 Implications for SEM
Tables 6.3 to 6.8 showed the results of factor loadings, AVE and Cronbach’s alpha
for all constructs. All indicators loaded well (>0.5) and values of reliability measures
and AVE were all over the threshold value (Cronbach’s alpha > 0.70, AVE > 0.50).
High value of reliability measures indicated internal consistencies among the
construct and provide confidence that the items in each variable were measuring a
single construct (Baines & Langfield-Smith, 2003). High AVE and loadings on the
predicted factors indicated convergent validity, whereas low correlation between
factors (<0.80), demonstrated discriminant validity. Large correlations between
constructs (greater than 0.80 or 0.90) suggested a lack of discriminant validity.
Results from the correlation matrix showed correlations among the constructs of not
more than 0.70, which signified discriminant validity of the measures. Therefore it
can be concluded that all measures were statistically valid and reliable for further
analysis. Hence, they were retained for structural model analysis.
Multicollinearity tests also show that none of the variables are highly correlated with
each other, with VIF of less than 0.5 for all the variables (the threshold for VIF is <
0.4; lenient cut off is <0.5). The correlation matrix between two or more variables of
less than 0.80 is also an indicator of low multicollinearity (see Table 6.9). It means
that none of the variables are too highly correlated with each other. In order to
proceed with the assessment of the structural model, composite scores for each
construct were computed. These composite variables were used to develop the
structural model in SEM analysis.
Results presented in this section show that the data in this study met all the
assumptions except for normality. Even though the data do not meet the normality
requirement, analysis using SEM can still proceed due to several reasons, as
discussed in Chapter 4. Moreover, the measurement model (using confirmatory
factor analysis) which requires normal data distribution was not tested in this study

124
because the composite scores from directly observed variables were used to test the
models. However, since SEM offered alternative methods for the non-normal data
distribution, analysis had been carried out using both methods for normal and non-
normal data distributions. This is to gather evidence on whether multivariate
normality has actually affected the choice of estimation techniques to be used in
SEM. Therefore, the analysis had been carried out using both MLE and WLS
techniques. Results from these analyses showed that there is no significant difference
between the results in both methods. Detail of the analysis is explained in the next
subsection.
Table 6.9 Correlation Matrix among the Constructs
Variables Competition AMT Structure Strategy MAP Performance
Competition 1.00 AMT (VIF)
0.22* (0.48)
1.00
Structure (VIF)
0.45* (0.47)
0.31* (0.48)
1.00
Strategy (VIF)
0.55* (0.07)
0.26* (0.08)
0.68* (0.06)
1.00
MAP (VIF)
0.39* (0.45)
0.25* (0.46)
0.59* (0.47)
0.70* (0.07)
1.00
Performance (VIF)
0.30* (0.48)
0.20* (0.46)
0.53* (0.49)
0.56* (0.49)
0.52* (0.40)
1.00
*Correlation is significant at the P < 0.01 (one-tailed)
6.5 Correlations among the Hypothesized Variables
Before the data were analysed using SEM, the correlations among the hypothesized
variables were studied in order to ensure that the relationships between them actually
existed. Based on the correlation matrix in Table 6.9, the correlation matrix for each
of the hypothesis is analysed. Table 6.10 summarizes the correlation coefficients
among the hypothesized variables.
From the table, it can be seen that all the hypothesized variables were significantly
correlated in the predicted direction (p < 0.01). However, these results did not
provide enough evidence on how the changes in one variable could cause the
changes in other variables. Therefore, the analysis using SEM was carried out in
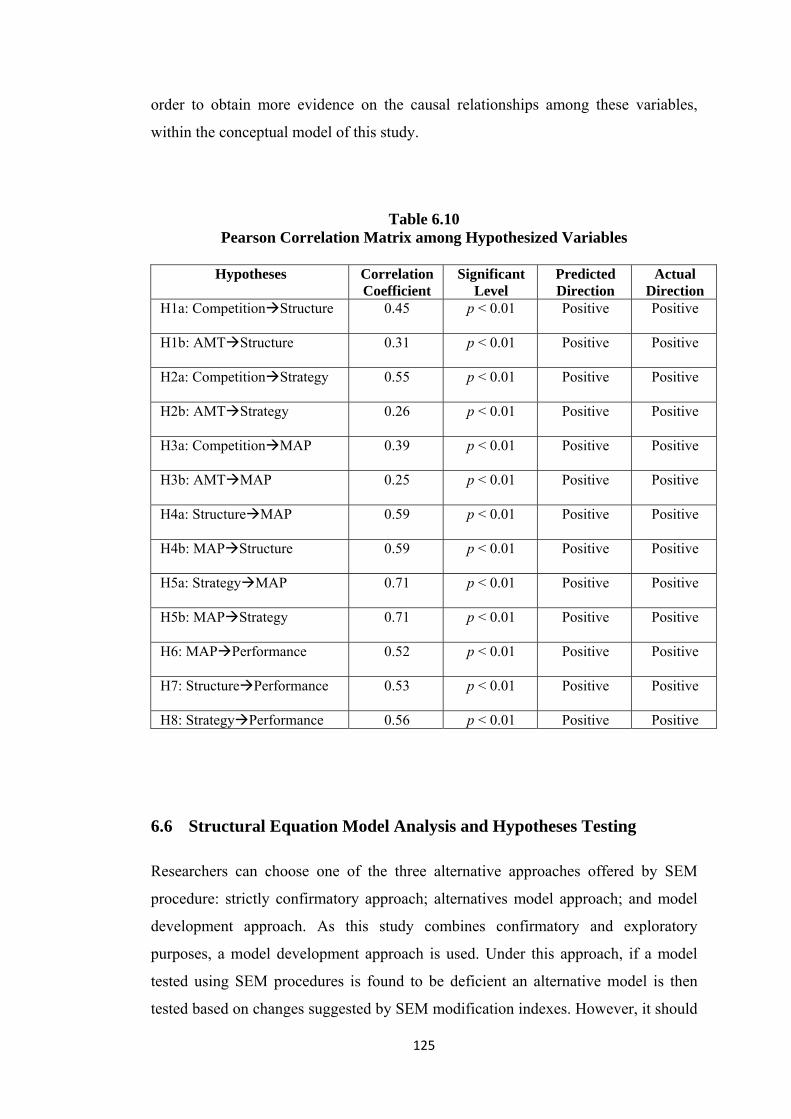
125
order to obtain more evidence on the causal relationships among these variables,
within the conceptual model of this study.
Table 6.10 Pearson Correlation Matrix among Hypothesized Variables
Hypotheses Correlation
Coefficient Significant
Level Predicted Direction
Actual Direction
H1a: CompetitionStructure
0.45 p < 0.01 Positive Positive
H1b: AMTStructure
0.31 p < 0.01 Positive Positive
H2a: CompetitionStrategy
0.55 p < 0.01 Positive Positive
H2b: AMTStrategy
0.26 p < 0.01 Positive Positive
H3a: CompetitionMAP
0.39 p < 0.01 Positive Positive
H3b: AMTMAP
0.25 p < 0.01 Positive Positive
H4a: StructureMAP
0.59 p < 0.01 Positive Positive
H4b: MAPStructure
0.59 p < 0.01 Positive Positive
H5a: StrategyMAP
0.71 p < 0.01 Positive Positive
H5b: MAPStrategy
0.71 p < 0.01 Positive Positive
H6: MAPPerformance
0.52 p < 0.01 Positive Positive
H7: StructurePerformance
0.53 p < 0.01 Positive Positive
H8: StrategyPerformance 0.56 p < 0.01 Positive Positive
6.6 Structural Equation Model Analysis and Hypotheses Testing
Researchers can choose one of the three alternative approaches offered by SEM
procedure: strictly confirmatory approach; alternatives model approach; and model
development approach. As this study combines confirmatory and exploratory
purposes, a model development approach is used. Under this approach, if a model
tested using SEM procedures is found to be deficient an alternative model is then
tested based on changes suggested by SEM modification indexes. However, it should

126
be noted that SEM cannot itself resolve causal ambiguities, thus theoretical insight
and judgement by the researcher is extremely important (Garson, 2009).
This section discusses stage five (specifying the structural model) and six (assessing
the structural model validity) of SEM procedures. Stage one to three had been
discussed in Chapter Three, stage four (assessing measurement model) is not
applicable as there is only one measure (composite variables) used for each of the
constructs. Scores for each variable were calculated by averaging the items in each
construct following factor analysis.
Table 6.11 lists the descriptive statistics for each variable in the study. The structural
model was specified using path analysis. In path analysis, constructs are frequently
modelled as composite variables derived from summing items in the construct
domain. Once composite variables have been computed, it is possible to build
structural equation models, provided that the internal consistency reliabilities are
known. The reliability measures (Cronbach’s alpha) ranged from 0.81 to 0.93, and
exceed the minimum value of 0.70, which is usually considered acceptable
(Nunnally, 1978). High reliability measures also provide confidence that the items in
each variable were measuring a single construct (Baines & Langfield-Smith, 2003).
Therefore, the models were tested using directly observed variables as shown by
Holmes-Smith (2005). Data were analysed using LISREL for Windows Version
8.80.
Table 6.11 Descriptive Statistics for Final Variables
Variable Theoretical range
Actual range Mean Standard deviation
Change in competitive environment
Change in AMT Change in Strategy Change in structure Change in MAP Performance
1-11
1-11 1-11 1-11 1-11 1-55
6.31-11.00
1.52-9.96 5.88-11.00 6.00-10.90 5.72-13.21
13.21-54.58
9.09
7.66 9.07 8.50 8.30
33.81
1.13
1.25 1.14 1.06 1.11 8.32

127
6.6.1 Hypothesized Model
The structural model was tested based on the hypotheses of the study (refer to
Chapter Four; Figure 4.1 for hypothesized model). In this stage, relationships from
one construct to another were assigned based on the proposed theoretical model
using path analysis. As explained earlier, since the data of this study did not meet the
multivariate normality requirement, analysis was carried out using both methods for
non-normal and normal data distribution, to see if there was any difference in the
result. First data were run using the MLE (for normal data), then using WLS
estimation technique (for non-normal data), as suggested by Garson (2009). The
outputs of both results are presented in Figure 6.2 and Figure 6.3 below.
0.38
0.19 0.20 0.21
0.02
0.20
0.04
0.53 0.56 0.27
0.14
Chi-Square = 53.83; df = 3; P-Value = 0.00; RMSEA = 0.285
Figure 6.2 Hypothesized Model (WLS)
Changes in competitive environment
Changes in AMT
Changes in MAP
Changes in structure
Changes in Strategy
Changes in Performance

128
0.40
0.23 0.20 0.21
0.03
0.05 0.20
0.61
0.51 0.27
0.15
Chi-Square = 67.84; df = 3; P-Value = 0.00; RMSEA = 0.322
Figure 6.3 Hypothesized Model (MLE)
From the above results, it was found that there was no significant difference in
structural estimates value for each parameter in either method. Very little difference
is apparent for chi-square value (WLS=53.83; MLE=67.84) and RMSEA value
(WLS=0.285; MLE=0.322). Despite these small differences, both methods showed
that the structural models did not meet the criteria of a fit model. The chi-square
values for both methods were too high with the p-value of less than 0.05 and
RMSEA of more than 0.05. Since there was no difference in the results from both
estimation techniques, the output from MLE was used in order to obtain a more
accurate and reliable result. Following suggestions by Garson (2009), if the results
from both methods are similar, the MLE output should be used because it provides
more information. This is because MLE makes estimates based on maximizing the
likelihood that the observed covariances are drawn from a population assumed to be
the same as that reflected in the coefficients estimation estimates. This suggestion
had been supported by Anderson and Young (1999). They had used more than one
estimation technique and they indicated that their results were not affected by the
estimation method used. Thus it provides evidence that the choice of the estimation
Changes in competitive environment
Changes in AMT
Changes in structure
Changes in MAP
Changes in Strategy
Changes in Performance

129
technique used in SEM does not appear to depend on the multivariate normality
assumption. This result also supports most of the research in this area which had a
non-normal data distribution, but still used the normal method to assess their model
(for a review see, Henri, 2007, p. 90).
As explained above, the output for the hypothesized structural model showed a
deviation from the fit model. Goodness of fit (GOF) statistics in Table 6.12 shows
that, the p-value of 0.00 for χ2 was far lower than the threshold level (which should
be more than 0.05). The normed χ2 (χ2/df) was 22.6, which was much too high
relative to the acceptable values from one (1) to two (2). RMSEA of more than 0.05
(=0.32) was also an indicator that the model was not a fit model. In order to generate
a good fit model, LISREL provided a few suggestions to improve these indices.
Based on the goodness of fit (GOF) statistics in Table 6.12, the modification indices
suggested paths to be added in the model to increase the fit indices. The hypothesized
model was then re-specified based on these suggestions.

130
Table 6.12 Goodness of Fit Statistics for Hypothesized Model (MLE)
Degrees of Freedom = 3 Minimum Fit Function Chi-Square = 81.66 (P = 0.0)
Normal Theory Weighted Least Squares Chi-Square = 67.84 (P = 0.0) Estimated Non-centrality Parameter (NCP) = 64.84
90 Percent Confidence Interval for NCP = (41.66 ; 95.45) Minimum Fit Function Value = 0.39
Population Discrepancy Function Value (F0) = 0.31 90 Percent Confidence Interval for F0 = (0.20 ; 0.46)
Root Mean Square Error of Approximation (RMSEA) = 0.32 90 Percent Confidence Interval for RMSEA = (0.26 ; 0.39)
P-Value for Test of Close Fit (RMSEA < 0.05) = 0.00 Expected Cross-Validation Index (ECVI) = 0.50
90 Percent Confidence Interval for ECVI = (0.39 ; 0.64) ECVI for Saturated Model = 0.20
ECVI for Independence Model = 3.32 Chi-Square for Independence Model with 15 Degrees of Freedom = 681.62
Independence AIC = 693.62 Model AIC = 103.84
Saturated AIC = 42.00 Independence CAIC = 719.76
Model CAIC = 182.26 Saturated CAIC = 133.49
Normed Fit Index (NFI) = 0.90 Non-Normed Fit Index (NNFI) = 0.51
Parsimony Normed Fit Index (PNFI) = 0.18 Comparative Fit Index (CFI) = 0.90 Incremental Fit Index (IFI) = 0.90
Relative Fit Index (RFI) = 0.50 Critical N (CN) = 36.29
Root Mean Square Residual (RMR) = 1.31 Standardized RMR = 0.12
Goodness of Fit Index (GFI) = 0.90 Adjusted Goodness of Fit Index (AGFI) = 0.32
Parsimony Goodness of Fit Index (PGFI) = 0.13
The Modification Indices Suggest to Add the Path to from Decrease in Chi-Square New Estimate
STRUCTUR STRATEGY 67.5 0.54 STRUCTUR MAP 67.5 0.98 STRUCTUR PERFORMA 32.6 0.09 STRATEGY STRUCTUR 67.5 0.59 STRATEGY MAP 67.5 2.96 STRATEGY PERFORMA 19.9 0.08
The Modification Indices Suggest to Add an Error Covariance
Between and Decrease in Chi-Square New Estimate STRATEGY STRUCTUR 67.5 0.50 STRATEGY STRUCTUR 62.2 0.47 COMPETIT STRUCTUR 49.5 -0.72 COMPETIT STRATEGY 39.5 -0.81 COMPETIT COMPETIT 67.5 2.50 AMT STRUCTUR 23.4 -1.17 AMT STRATEGY 33.1 -1.23 AMT COMPETIT 67.5 3.21 AMT AMT 67.5 18.28

131
6.6.2 Model Re-Specification
SEM output in Table 6.12 suggests the addition of paths from strategy to structure,
structure to strategy, MAP to structure and MAP to strategy (which reduced χ2 by
67.5 respectively), performance to strategy (which reduced χ2 by 19.9), or
performance to structure (which reduced χ2 by 32.6). Before any decision on which
path should be added to the model, it should be noted that, SEM requires that any
decision to add any new parameter to the model must be supported by the theory.
Thus, paths from MAP to structure as well as MAP to strategy are more admissible
as they are part of the hypotheses in this study (H4b and H5b) and had already been
identified as having sufficient underpinning theory. However LISREL did not permit
both paths to be added to the model because of the lower degree of freedom (df =
3)13. Due to this constraint, only one path, i.e., path from MAP to structure was
added to the model14. The new model is presented in Figure 6.4 below:
0.10
0.08 0.23
0.77 0.82
0.06
0.17 0.21
0.95
0.51 0.26
0.15
Chi-Square = 0.34; df = 2; P-Value = 0.843; RMSEA = 0.000
Figure 6.4 Modified Model (Overfit)
13 This is also the reason for not including H4b and H5b in the hypothesized model in the first place. 14 There is no specific criterion for deciding which path should be added, as both paths have the same effect on the model (reduced χ2 by 67.5 respectively). Therefore the decision was based on trial and error, to see which one provides the best model.
Changes in competitive environment
Changes in AMT
Changes in structure
Changes in MAP
Changes in Strategy
Changes in Performance

132
From Figure 6.4, it can be seen that the new model was a fit model. However, the
normed χ2 (χ2/df) was less than 1 (=0.17), which indicated that the model is
overfitted. Table 6.13 also shows that one of the GOF indices, i.e. NNFI has a value
of more than 1.00 (= 1.02), with other fit indices equal to one (1.00). This is also an
indication of an overfitted model, which also shows that the model is less
parsimonious. In order to rectify this problem, the model was modified once again.
This time all insignificant paths (i.e., Environment Structure, Environment
MAP, and AMTStructure) were removed from the model in order to increase the
value of df, so that a new path from MAP to strategy (H5b) could be added to the new
model. This re-modification resulted in a more appropriate model fit (see Figure 6.5).
Table 6.13 Goodness of Fit Statistics for Modified Model
Degrees of Freedom = 2 Minimum Fit Function Chi-Square = 0.34 (P = 0.84)
Normal Theory Weighted Least Squares Chi-Square = 0.34 (P = 0.84) Estimated Non-centrality Parameter (NCP) = 0.0
90 Percent Confidence Interval for NCP = (0.0 ; 2.49) Minimum Fit Function Value = 0.0016
Population Discrepancy Function Value (F0) = 0.0 90 Percent Confidence Interval for F0 = (0.0 ; 0.012)
Root Mean Square Error of Approximation (RMSEA) = 0.0 90 Percent Confidence Interval for RMSEA = (0.0 ; 0.077)
P-Value for Test of Close Fit (RMSEA < 0.05) = 0.90 Expected Cross-Validation Index (ECVI) = 0.19
90 Percent Confidence Interval for ECVI = (0.19 ; 0.20) ECVI for Saturated Model = 0.20
ECVI for Independence Model = 3.32 Chi-Square for Independence Model with 15 Degrees of Freedom = 681.62
Independence AIC = 693.62 Model AIC = 38.34
Saturated AIC = 42.00 Independence CAIC = 719.76
Model CAIC = 121.12 Saturated CAIC = 133.49
Normed Fit Index (NFI) = 1.00 Non-Normed Fit Index (NNFI) = 1.02
Parsimony Normed Fit Index (PNFI) = 0.13 Comparative Fit Index (CFI) = 1.00 Incremental Fit Index (IFI) = 1.00
Relative Fit Index (RFI) = 1.00 Critical N (CN) = 5690.78
Root Mean Square Residual (RMR) = 0.056 Standardized RMR = 0.0058
Goodness of Fit Index (GFI) = 1.00 Adjusted Goodness of Fit Index (AGFI) = 0.99
Parsimony Goodness of Fit Index (PGFI) = 0.095

133
0.90
0.23 0.93
0.14 0.97 0.08 0.21 0.23
0.48 0.25
Chi-Square = 4.15; df = 4; P-Value = 0.39; RMSEA = 0.014
Figure 6.5 Re-Modified Model (Good Fit)
In order to examine GOF for the structural model, three important GOF indices were
highlighted. They were the absolute fit indices (χ2, normed χ2, GFI, AGFI, RMR and
RMSEA), incremental fit indices (CFI, NFI, NNFI), and indices of model
parsimony15. Figure 6.5 above shows the good fit model. The P-value of the χ2 was
more than the threshold value of 0.05 (p = 0.39) and a normed χ2 falls within the
accepted range of 1 to 2 (χ2/df = 1.04). Thus, it is concluded that there was less than
5% likelihood that there is a difference between SEM estimated covariance matrix
and observed sample covariance matrix. With such a small discrepancy between
estimated and observed covariance matrix, it can be said that the specified model is a
feasible representation of the data it purports to portray, which means the data were
not significantly different from those expected on a given theory.
Table 6.14 shows that all of the important fit indices were above the threshold value.
RMSEA and RMR values were less than the threshold value of 0.08. These showed
that the discrepancy per degree of freedom (df) was small (RMSEA=0.014) and also
a smaller difference between estimated and observed covariance matrix per element
(RMR=0.037). The value of GFI of 0.99 and AGFI of 0.97 provide more evidence
15 Refer to threshold value in Chapter 3, Table 3.3, and column 1 (m ≤ 12).
Changes in AMT
Changes in MAP
Changes in Strategy
Changes in Performance
Changes in competitive environment
Changes in structure

134
for a well fitting model. AGFI is very similar to GFI except that an adjustment has
been made to take into account the degree of freedom for the model.
Table 6.14 Goodness of Fit Statistics for Re-Modified Model
Degrees of Freedom = 4 Minimum Fit Function Chi-Square = 4.18 (P = 0.38)
Normal Theory Weighted Least Squares Chi-Square = 4.15 (P = 0.39) Estimated Non-centrality Parameter (NCP) = 0.15
90 Percent Confidence Interval for NCP = (0.0 ; 9.42) Minimum Fit Function Value = 0.020
Population Discrepancy Function Value (F0) = 0.00074 90 Percent Confidence Interval for F0 = (0.0 ; 0.045)
Root Mean Square Error of Approximation (RMSEA) = 0.014 90 Percent Confidence Interval for RMSEA = (0.0 ; 0.11)
P-Value for Test of Close Fit (RMSEA < 0.05) = 0.62 Expected Cross-Validation Index (ECVI) = 0.18
90 Percent Confidence Interval for ECVI = (0.18 ; 0.23) ECVI for Saturated Model = 0.20
ECVI for Independence Model = 3.32 Chi-Square for Independence Model with 15 Degrees of Freedom = 681.62
Independence AIC = 693.62 Model AIC = 38.15
Saturated AIC = 42.00 Independence CAIC = 719.76
Model CAIC = 112.22 Saturated CAIC = 133.49
Normed Fit Index (NFI) = 0.99 Non-Normed Fit Index (NNFI) = 1.00
Parsimony Normed Fit Index (PNFI) = 0.27 Comparative Fit Index (CFI) = 1.00 Incremental Fit Index (IFI) = 1.00
Relative Fit Index (RFI) = 0.98 Critical N (CN) = 675.31
Root Mean Square Residual (RMR) = 0.037 Standardized RMR = 0.018
Goodness of Fit Index (GFI) = 0.99 Adjusted Goodness of Fit Index (AGFI) = 0.97
Parsimony Goodness of Fit Index (PGFI) = 0.19
Incremental fit indices lie between zeros to one, with a value of one indicating that
the specified model is a perfect fit. It measures how much better is the model that
assumes at least some relationships, as compared to a model with no relationship.
The value of NFI and GFI were 0.99, which is more than the accepted value of 0.97
for the fit model. The value of CFI equal to 1.00 indicated a perfect model fit.

135
In order to achieve model parsimony, all the insignificants paths had been taken out
from the model. This is to ensure that the parameters added to the model could
support the model. The values of AIC and CAIC for the modified model (see Table
6.13) were equal to 38.34 and 121.12 respectively. However, these values decreased
in the final model (see Table 6.14) when all the insignificant paths were taken out.
The new AIC value was 38.15 and CAIC value was 112.22. It can be seen that the
decrease in CAIC value was more than the decrease in AIC value. This is because
CAIC places a bigger penalty on lack of parsimony than AIC. Therefore, the final
structural model is more parsimonious than the first modified structural model.
6.6.3 Assessment of Structural Model Validity
The final stage involved in SEM is to test the validity of the structural model and its
corresponding hypothesized theoretical relationships (H1 – H8). Particular emphasis
is placed on the estimated parameters for the structural relationships, because they
provide direct empirical evidence relating to the hypothesized relationships depicted
in the structural model (Hair et al., 2006). Holmes-Smith (2005) suggested the use of
a model-based approach to assess validity. The process of establishing the structural
model’s validity is based on the GOF values.
The χ2 value and other fit indices used in testing the overall fit of the structural model
also establish the validity of the model. The results of these measures had been
discussed in the previous subsections. Results showed that the structural model had
achieved a good fit, thus it also provides evidence for the model validity. The other
key criterion to achieve structural model validity is that the estimated parameter be
statistically significant. Details of these results are discussed in the following
subsection.
6.6.4 Hypotheses Testing
Good model fit alone is not sufficient to support a proposed structural theory.
Therefore, the individual parameter estimates that represent each hypothesis were

136
examined. The theoretical model is considered valid to the extent that the parameter
estimates are statistically significant and in the predicted direction (Hair et al., 2006).
The test of the hypothesized structural model includes estimating the path
coefficients and t-values. In addition to t-values provided in SEM analysis, P-values
for each of the parameters were also calculated using the “Free Statistics
Calculators” website developed by Soper (2009), to test the significant level of the
hypotheses. The fit measures in the final model indicate a good model fit with four
parameters significant at P<0.01, five parameters significant at P<0.05, and only one
not significant. The results of the test are presented in Table 6.15.
Table 6.15
Result of Hypotheses Testing
Hypotheses EstimatesValue
Standardized Value
T-Value P-Value
H1a: CompetitionStructure
0.09 0.10 1.44 0.143
H1b: AMTStructure
0.07 0.08 1.24 0.170
H2a: CompetitionStrategy
0.50 0.48 7.04 0.001**
H2b: AMTStrategy
0.13 0.14 2.25 0.043*
H3a: CompetitionMAP
0.06 0.06 0.78 0.259
H3b: AMTMAP
0.20 0.23 2.47 0.034*
H4a: StructureMAP
1.04 0.90 3.88 0.009**
H4b: MAPStructure
0.98 0.93 8.09 0.001**
H5a: StrategyMAP
1.22 0.97 7.95 0.001**
H5b: MAPStrategy
0.09 0.08 0.64 0.467
H6: MAPPerformance
1.54 0.21 2.61 0.030*
H7: StructurePerformance
1.81 0.63 3.00 0.020*
H8: StrategyPerformance
1.83 0.25 2.91 0.022*
Significant level at ** P < 0.01; *P < 0.05 (one-tailed) (Detail SEM output is presented in Appendix E)

137
From table 6.15 above, it can be seen that no significant relationships have been
found between changes in competitive environment and changes in AMT with
changes in organizational structure. Therefore, Hypotheses 1a and 1b are rejected.
These results show that changes in competitive environment and AMT did not cause
the changes in organizational structure. However, changes in AMT had indirectly
affected the changes in structure, through changes in MAP.
The second group of Hypotheses (2a and 2b) proposing changes in competitive
environment and changes in AMT result in changes in organizational strategy were
both supported at significance levels of P<0.01 and P<0.05 respectively. A strong
positive relationship between changes in competitive environment and strategy
indicated that the organizations had changed their strategy in order to remain
competitive. The rapid manufacturing technology development also caused the
organizations to change their strategy.
While Hypothesis 3b, the relationship between changes in AMT with changes in
MAP, is supported at P<0.05, no significant relationship was found between changes
in competitive environment with changes in MAP. Therefore, Hypothesis 3a is
rejected. Despite the fact that changes in AMT directly cause the changes in MAP, it
can be seen that changes in competitive environment had indirectly affected the
changes in MAP through strategy.
It was posited that there is an interrelationship among changes in MAP with changes
in organizational structure and strategy. Hypotheses 4a, 4b and 5a are all strongly
supported at significant level of P<0.01, however the relationship between changes
in MAP and changes in strategy was not significant, resulting in the rejection of
Hypothesis 5b. These results show evidence that there is interrelationship between
changes in MAP and changes in organizational structure, but not between changes in
MAP and strategy.
Hypotheses 6 to 8 examined the impact of changes in competitive environment and
AMT with changes in organizational factors (MAP, structure, and strategy) on
performance. All of these hypotheses were supported at P<0.05. The changes in
organizational factors gave a positive impact on performance. Therefore it can be
concluded that the organizations reacted to changes in competitive environment and

138
technological advancement in a positive direction, which in turn impacted the
performance in positive direction.
A review of the structural model also reveals an interesting picture of the indirect
relationships between the variables of interest. Rather than hypothesized changes in
AMT having a direct effect on change in organization structure, the effect was
indirect through MAP. Also, rather than changes in competitive environment having
a direct effect on changes in MAP, the effect was indirect through strategy. These
findings will be discussed in greater detail in the next chapter.
6.7 Subsidiary Hypotheses Testing
Since the relationship between the changes in environmental factors with MAP had
been established, this study then examined the types of changes in MAP occurring in
these organizations. The relationships between changes in the environment with the
type of changes in MAP were hypothesized in subsidiary Hypotheses 9 to 12. These
hypotheses were analysed using SPSS version 17.0 for Windows. Given that the
measures for the variables of type of changes in MAP were categorical, a non-
parametric technique was used. In order to examine the relationship among the
hypothesized variables, a Spearman’s rank order correlation test was performed. This
is an alternative non-parametric technique to the parametric bivariate correlation
(Pearson’s r). The results of the analysis are presented in the Table 6.16 below.
Table 6.16 details the correlation coefficients between the type of management
accounting change and changes in manufacturing business environment. The table
indicates a large number of significant relationships between changes in
manufacturing business environment with the different types of changes in
management accounting techniques (MAT). A significant negative association
between the variables in H9 shows that companies had changed their MAT in a
changing manufacturing business environment (r = - 0.17; p = 0.013). Hence, there is
enough evidence to reject the null hypothesis (H9).

139
Table 6.16 Spearman Correlation Coefficients
Types of Changes in
MA Techniques
Change in Business
Environment (Composite Score)
Change in
Competition
Change in
AMT
r p-value r p-value
r p-value
No Changes in MAT (H9)
-0.170 0.013** -0.047
0.495 -0.229 0.001***
Introduction of new MAT in parallel with the existing MAT (H10)
0.115
0.094*
0.046
0.504
0.120
0.082*
Replacement of existing MAT with a new MAT (H11)
0.217
0.001***
0.038
0.586
0.290
0.000**
* Modification of the use of existing MAT (H12)
0.108
0.117
0.057
0.411
0.094
0.174
Significant level at *p<0.1; **p<0.05; ***p<0.01
Table 6.16 shows that in the changing business environment, companies had
introduced new MAT, in addition to their existing technique (r = 0.115; p = 0.094).
Therefore H10 cannot be rejected. However, only change in AMT is significantly
associated with introduction of new MAT (r = 0.12), but not with changes in
competition (r = 0.046). These results indicate that competition did not significantly
associate with changes in the use of management accounting techniques in
manufacturing companies.
A strong significant association between the changes in manufacturing business
environment and the replacement of existing MAT with the new technique is found
(r = 0.217; p = 0.001). Therefore H11 is accepted. However, the results once again
show that the companies only replaced their existing MAT when there is a change in
AMT (r = 0.29). The results show that there is no significant association between
competition and replacement of the MAT. Results in Table 6.16 also show that there
is no significant association between the changes in manufacturing business
environment and the modification of the use of MAT in manufacturing companies (r
= 0.108, p = 0.117). Thus, H12 cannot be accepted.
Results of subsidiary hypotheses testing indicate that the changes in MAT used in
sample companies are associated with the changes in manufacturing business
environment. Nevertheless, only changes in AMT had a significant association with

140
the changes in MAT used in manufacturing companies, but not the changes in
competition16. These results support the results of the main hypotheses, where the
changes in AMT caused the changes in MAP (H3b), but the changes in competitive
business environment did not directly cause the changes in MAP (H3a).
6.8 Summary
In this chapter, descriptive statistics for respondents’ profile and variables of interest
were reported. The structural equation modelling technique was used to test the
hypotheses developed in the study, as well as to identify the model fitness among the
variables. The factor analysis was conducted prior to the SEM analysis. Reliability
and validity of the measurement were identified based on the cut-off values of factor
loadings, AVE and Cronbachs’ alpha. Following this, the hypothesized model was
tested by the structural model using the SEM procedure. Besides the analysis on the
hypothesized model, this study also posited four subsidiary hypotheses to support the
findings from the hypothesized model. These hypotheses were tested using a non-
parametric technique through Spearman correlation coefficients.
The majority of the main hypotheses (9 out of 13) were fully supported. Some of
these hypotheses (two) were not directly supported, but instead showed indirect
relationships; whereas the other two hypotheses were not supported. These results
revealed that a positive alignment exists among the external environmental factors,
organizational factors and that MAP had positively impacted organizational
performance.
As for the subsidiary hypotheses, two of them were supported, while the other two
were rejected. It was found that, with a change in environment, organizations
introduced new MAT in addition to the existing techniques, and also replaced
existing MAT with a new one. Results in subsidiary hypotheses support the result
from the hypothesized model, where the organizations will change their MAP when
there is a change in environment. However, the results from both hypothesized
model and subsidiary hypotheses revealed that only changes in AMT significantly
affected this change.
16 Detailed discussion of these relationships is presented in the next chapter (Chapter 7).

141
This chapter demonstrates that a majority of the hypotheses were supported (or
partially supported), which indicates that the research framework proposed in this
study was generally confirmed. The implications of these results are discussed in the
next chapter.

142
CHAPTER SEVEN
DISCUSSION AND CONCLUSIONS
7.1 Introduction
The previous chapter has examined the outcome of the data and hypotheses testing.
This chapter provides a more detail examination of the finding of this study and to
provide further insight into the relationships between variables that have been
studied. The next section discusses the findings from hypotheses testing and is
followed by the conclusions in Section 3. Section 4 presents some contributions to
the theoretical knowledge, methodological aspects and also contribution to practice.
Section 5 provides some limitations faced by this study and Section 6 suggests some
further research that could be extended from this study. A summary of the chapter is
presented in the final section.

143
Table 7.1 Summary of Hypotheses Testing
Hypotheses Support/
Reject H1a Organizations facing a more competitive environment will change
to a flatter organizational structure. Rejected
H1b Organizations facing changes in manufacturing technology advancement will change to a flatter organizational structure.
Rejected
H2a Organizations facing a more competitive environment will change towards a differentiation strategy.
Supported
H2b Organizations facing manufacturing technology advancement will change towards a differentiation strategy.
Supported
H3a Organizations facing a more competitive environment will change their management accounting practices.
Rejected
H3b Organizations adopting advanced manufacturing technology will change their management accounting practices.
Supported
H4a A change in organization structure will result in changes in management accounting practices.
Supported
H4b A change in management accounting practices will result in changes in organization structure.
Supported
H5a A change in organization strategy will result in changes in management accounting practices.
Supported
H5b A change in management accounting practices will result in changes in organization strategy.
Rejected
H6 A change in management accounting practices will result in improved organizational performance.
Supported
H7 A change in organization structures will result in improved organizational performance.
Supported
H8 A change in organization strategy will result in improved organizational performance.
Supported
H9 Organizations in a changing environment will not change their management accounting techniques.
Rejected
H10 Organizations in a changing environment will introduce new management accounting techniques in parallel with their existing techniques.
Supported
H11 Organizations in a changing environment will replace their existing management accounting techniques with new techniques.
Supported
H12 Organizations in a changing environment will modify the use of their existing management accounting techniques.
Supported

144
7.2 Discussion of Findings
The findings from this study confirm that there has been a significant increase in the
competitive environment faced by Malaysian manufacturing industries over the past
five years. The use of advanced manufacturing technology (AMT) has also increased
significantly. Results also show a significant increase in differentiation strategy, the
use of flat organization structure practices and management accounting practices
(MAP). These outcomes are particularly important for companies wishing to
compete in a globalized environment. The relationships among these variables have
been analysed using SEM techniques. The results of the hypotheses testing
(summarised in Table 7.1) are discussed in this chapter in conjunction with the
literature reviewed.
7.2.1 Changes in Competition, AMT and Structure (H1)
The first group of hypotheses tested the relationship between competitive
environment and AMT with structure. It has been suggested that change in
organizational structure is stimulated by rapid environmental change (Schwarz &
Shulman, 2007). The contingency literature indicates that technology and
competitive environment affect the design and functioning of the organization.
Previous research also shows that firms which operated in a highly competitive
environment increased organizational commitment towards decentralization (e.g.,
Subramaniam & Mia, 2001). However, the structural model indicates no significant
relationship between changes in competitive environment and AMT with the changes
in organizational structure in Malaysian manufacturing companies.
While many other studies suggest a relationship among competitive environment and
AMT with structure (e.g., Choe, 2004; DeLisi, 1990; Harris, 1996), the results in this
study are contradictory. However it supports the findings by Baines and Langfield-
Smith (2003), who found no significant direct relationship between competitive
environment with structure, and AMT with structure. In their study, competitive
environment appears to respond to the change in strategy which later resulted in
changes in structure; meanwhile this study shows an indirect relationship between
AMT and structure through changes in MAP. This result suggests that,
145
manufacturing companies in Malaysia will change their structure when there is a
reaction between AMT and MAP. When the company adopts more advanced
manufacturing technology, it changes the nature of the production process and
prompts the need for better cost management and in some way it will change a
routine and work unit element in an organization (Emmanuel et al., 1990; Haldma &
Laats, 2002; Macy & Arunachalam, 1995). This change will be successful if it takes
place where employee empowerment is exercised in an organization. Empowerment
enables the employees to perform several tasks (Dibrell & Miller, 2002). Hence, a
flatter organization structure is needed to complete this change process.
7.2.2 Changes in Competition, AMT and Strategy (H2)
The second group of hypotheses proposed that a change in competitive environment
and AMT will result in changes towards differentiation strategy. While the findings
show that changes in competitive environment and AMT do not significantly relate
to changes in structure, different findings are obtained for strategy. These hypotheses
support many other studies in this area (for example, Baines & Langfield-Smith,
2003; Chenhall, 2003; DeLisi, 1990; Fuschs et al., 2000; Schroeder & Congden,
2000). It shows that strategy is an important variable in the study of organizations.
It has also been suggested that organizations facing a more competitive environment
and increase use of AMT will change towards a differentiation strategy. Previous
studies have also established that an appropriate matching among these variables can
enhance performance (Baines & Langfield-Smith, 2003; Chenhall & Langfield-
Smith, 2003; Davenport, 2000; Kotha & Swamidass, 2000; Schroeder & Congden,
2000). As Baines and Langfield-Smith (2003) demonstrate, a strong relationship
among competitive environment and AMT with differentiation strategy in Australia
manufacturing companies confirms that in a manufacturing environment, dominated
by demanding customers and advanced technology, a proper link with strategy is
important for the organizations to remain competitive. These findings imply that
competitive environment and the application of effective manufacturing technology
requires organizations to formulate a clear business strategy, in order to differentiate
themselves from their competitors as well as to create value for their customers

146
(Jermias & Gani, 2002; Simons, 1987). Hence, it appears that a proper match among
these variables is essential regardless of how they are operated in developed or less
developed economic settings.
7.2.3 Changes in Competition, AMT and MAP (H3)
Previous contingency-style management accounting research suggested that changes
in MAP are expected to be high for firms operating with advanced technology and in
a competitive environment. Much literature shows a positive significant relationship
between competition and MAP (for example, Hoque et al., 2001; Libby &
Waterhouse, 1996; Mia & Clarke, 1999). To remain competitive, organizations need
to monitor a diverse range of competition factors using MAS that tracks both
financial and non-financial performance. Haldma and Laats (2002) show that
increasing competition affected the MAS. However, the corresponding result in this
study shows that companies in Malaysian manufacturing industry have responded to
the changes in competitive environment in different way. Results show that increases
in competitive environment do not cause changes in MAP in Malaysian
manufacturing companies.
This might be attributable to government policies, which often favour manufacturing
companies in Malaysia. Several incentives, for example tax and financial incentives,
have been introduced, especially to small and medium size companies. It is also
argued that manufacturing industry in Malaysia has not been based on strong
domestic producers but has instead relied on foreign multinationals producing for
export. Globalization not only makes this country open to greater competition, but
also acts as a medium to ‘transfer’ MAS through companies establishing operations
in Malaysia. As foreign companies often use more advanced MAP, local companies
are still largely using traditional methods (Abdul-Rahman et al., 2002). Hence, this
situation means that managers do not need different types of management accounting
information to support their decision needs. This argument is consistent with Ma and
Tayles (2009). The new management accounting techniques would be adopted if it
met the needs of senior management and it would not have taken place without their
support.

147
Apart from the above result, it is found that the increased use of AMT by Malaysian
manufacturing companies has influenced changes in their MAP. This result is
supported by many other studies in this area (for example, Askarany & Smith, 2008;
Choe, 2004; Hoque, 2000). Globalization brings in new technologies to Malaysia;
with the introduction of new technologies, the structure of manufacturing costs will
change; hence it requires MAP to be designed to support, not restrain the
introduction of innovative processes and technologies (Abdel-Kader & Luther,
2008). The contemporary manufacturing technologies such as CAD, CAM and
robotics have significant implications for MAP because traditional system cannot
effectively help managers to manage resources as well as identifying relevant costs
(Askarany & Smith, 2008; Hoque, 2000). Thus, changes in MAP are important to
better align with adopted technology, and help facilitate manufacturing operations to
be more successful (Baines & Langfield-Smith, 2003).
7.2.4 Changes in MAP and Structure (H4)
Hypotheses 4a and 4b proposed an interrelationship between organizational
structures and MAP. Much literature has supported this relationship (for example,
Gerdin, 2005; Luther & Longden, 2001), but none of them had really tested them.
The results in this study have filled this gap. The results show a significant
interrelationship between MAP and structure. It is confirmed that change in the form
of flatter organizational structures has caused changes in MAP, and increased change
in MAP also causes structural change.
These results are also consistent with the formal and informal change dichotomies in
OIE. Formal change occurs through the introduction of new MAP in organizations.
For example MAP such as ABC has lead to new administrative procedures, policies
and organizational structure (Gosselin, 1997). According to Chenhall and Langfield-
Smith (1998a) advanced MAP such as ABC, ABM and TQM are not only restricted
to production processes, but can also provide new approaches as part of restructuring
process.
Haldma and Laats (2002) showed how organizational structure influenced MAP to
change, while J. A. Smith et al. (2005) illustrated how changes in organization

148
affected by outsourcing, causes changes in MAP. Thus, MAP appears to be both an
element of organizational structure and a consequence of the chosen structure
(Luther & Longden, 2001). This finding could be the key to our understanding of the
relationship between MAP and structure, which is not only direct, but also reciprocal.
7.2.5 Changes in MAP and Strategy (H5)
While there was a significant interrelationship between MAP and structure, only a
one-way relationship is found between MAP and strategy. Despite the suggestion
that there could be a reciprocal relationship between MAP and strategy, previous
study in this area had tested this relationship. Findings in this study show that
increased changes in the differentiation strategy caused changes in MAP, but not the
contrary. This finding is consistent with the traditional view that MAS is an outcome
of strategy. In addition, Simons (1987) also suggested that MAP has to be modified
in accordance with the business strategy. This view is supported by Baines and
Langfield-Smith (2003) and Hyvönen (2007), who found significant relationships
between strategy and MAP.
It is likely that differentiation strategy is not only an important factor in the design
and use of MAS but also have direct impact on it. This conclusion is based on the
work of Chenhall and Langfield-Smith (1998b), who showed that high performing
product differentiator strategy firms are associated with MAP. Thus, this study
rejects the suggestion that changes in MAP will also impact on strategy (Kloot, 1997;
Kober et al., 2007; Perera et al., 2003).
7.2.6 Impact of Management Accounting and Organizational Change on
Performance (H6-H8)
As depicted in Figure 7.1, the findings in this study show the evidence that an
alignment among changes in external environment with changes in MAP, structure
and strategy have caused an increase in performance of Malaysian manufacturing
companies. Despite the direct relationship between MAP, structure and strategy with

149
performance, structural equation modelling demonstrates that interaction among
AMT, MAP and structure has improved organizational performance. This
improvement also resulted from the interaction among competitive environment,
strategy and MAP, and among strategy, MAP and structure. These results are
consistent with the suggestion that high organizational performance is dependent on
a good match among the organizational systems (Baines & Langfield-Smith, 2003;
Haldma & Laats, 2002; Hoque, 2004; Langfield-Smith, 1997). Chenhall and
Langfield-Smith (1998b) found a greater use of advanced MAP in a firm that placed
a strong emphasis on differentiation strategies resulting in high performance.
There is well-established empirical evidence for an association between MAP and
performance. Baines and Langfield-Smith (2003) found that firms with a greater
reliance on non-financial accounting information improved their performance. Ittner
and Larcker (1995), Mia and Clarke (1999), and Sim and Killough (1998) found a
positive interaction between management accounting information and performance.
These findings support the suggestion that changes in MAS are associated with good
financial performance (Laitinen, 2006).
Very limited evidence exists to show that changes in structure and strategy would be
directly associated with organizational performance. It is also suggested that clear
strategic priorities alone are not sufficient to ensure high organizational performance;
they must be supported by other organizational systems. Achieving appropriate links
between them is important to performance improvement (Jermias & Gani, 2002).
Some studies show that a combination among the organizational factors will increase
performance. For example Baines and Langfield-Smith (2003) showed that greater
use of team-based structures, driven by changes in strategy, and greater reliance on
non-financial management accounting information, had resulted in improved
organizational performance. Penning (1976; as cited in Dalton et al., 1980) showed
structural change to have little effect on performance, while Pratt (2004) found that
organizations involving employees as part of the company’s mission and strategy
will increase performance. Thus results in this study, which are supported by
previous findings, have proved that an alignment among competitive environment,
AMT, MAP, structure and strategy have a positive impact on organizational
performance.
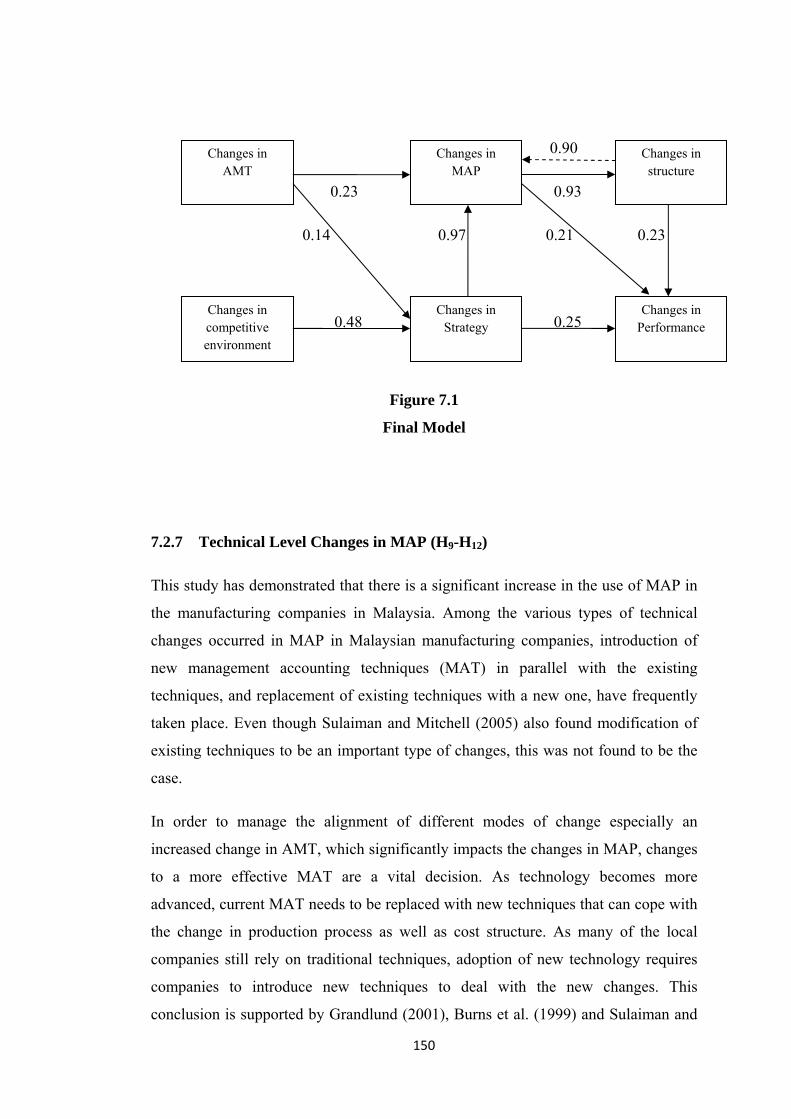
150
0.90
0.23 0.93
0.14 0.97 0.21 0.23
0.48 0.25
Figure 7.1
Final Model
7.2.7 Technical Level Changes in MAP (H9-H12)
This study has demonstrated that there is a significant increase in the use of MAP in
the manufacturing companies in Malaysia. Among the various types of technical
changes occurred in MAP in Malaysian manufacturing companies, introduction of
new management accounting techniques (MAT) in parallel with the existing
techniques, and replacement of existing techniques with a new one, have frequently
taken place. Even though Sulaiman and Mitchell (2005) also found modification of
existing techniques to be an important type of changes, this was not found to be the
case.
In order to manage the alignment of different modes of change especially an
increased change in AMT, which significantly impacts the changes in MAP, changes
to a more effective MAT are a vital decision. As technology becomes more
advanced, current MAT needs to be replaced with new techniques that can cope with
the change in production process as well as cost structure. As many of the local
companies still rely on traditional techniques, adoption of new technology requires
companies to introduce new techniques to deal with the new changes. This
conclusion is supported by Grandlund (2001), Burns et al. (1999) and Sulaiman and
Changes in AMT
Changes in MAP
Changes in Strategy
Changes in Performance
Changes in competitive environment
Changes in structure

151
Mitchell (2005). This means that advanced and traditional MATs can potentially be
perceived as both complements and substitutes for each other.
7.3 Conclusions and Implications
The overall picture emerging from this study is based on the theoretical framework
developed from Western studies, and applied to Malaysian manufacturing
environment. Malaysia is categorised as a developing country, however its
manufacturing industry is identified as more concentrated than most other developed
countries. Focusing on the alignment among competitive environment, AMT, MAP,
structure and strategy, this study addressed empirically the research question
proposed in the first chapter by testing for causal relationships between these
measures and their impacts on organizational performance. The conclusions reached
from the results of this study have profound implications for both theory and
practice.
Based on the findings from a pilot study as well as the main study, it is concluded
that the Western research model adopted is generally applicable to Malaysian
manufacturing industry. The results show a significant increase of changes in all
measures. Globalization has opened manufacturing industry in Malaysia to greater
competition, and application of advanced manufacturing technology in Malaysia has
also increased. Companies have also placed more emphasis on differentiation
strategy and significantly used a flatter organizational structure. An increased use of
MAP is also evident. It has been found that both traditional and advanced
management accounting techniques appeared to be almost equally important. These
findings show that manufacturing companies in Malaysia rely on both techniques in
order to cope with significant changes in their internal as well as external
environmental factors. The increase in organizational performance is also witnessed
in this study. Therefore, it is concluded that the level of changes in competitive
environment, AMT, structure, strategy, MAP and performance are significantly
increased in Malaysian manufacturing companies.
This study has supported numerous conclusions from the existing literature regarding
increases in competitive environment and AMT causing changes in internal

152
organizational factors. However, for reasons discussed in subsection 7.1.1, changes
in competitive environment and AMT do not impact on organizational structure.
Organizations operating in a competitive environment will invest in manufacturing
technology that could help them to reorganize the production process and increase
the level of quality product. In order to achieve maximum effectiveness,
organizational elements like strategy and MAP have to change simultaneously. As
the firms persistently search for new market opportunities, they have to compete
through new products and market development which subsequently impact the
organizations’ learning strategy. Customer oriented aspects such as quality,
flexibility, innovative products and dependability of supply could be achieved
through a greater emphasis on effective differentiation strategy. The implementation
of AMT, MAS should be designed to support the introduction of innovative
processes and technologies. Thus, a better alignment among competition, AMT,
strategy and MAP will facilitate business operations to be more successful and help
the managers to manage resources more effectively.
The results also indicate that proper alignment between changes in external and
internal organizational factors are important in facilitating an effective business
operation. Positive interactions among the internal factors are vital in order to sustain
and/or improve organizational performance. The results in this study show that
changes in organizational structure and strategy caused a change in MAP. However,
the relationship between changes in structure and changes in MAP is not only in one
direction but also reciprocal. The structural model also shows a significant link
among strategy, MAP and structure, which leads to an increase in performance.
The main role of MAS is to provide useful information in helping managers make
effective decisions. Failure to provide appropriate information may contribute to
ineffective resource management and decline in performance. While external
environment factors drive firms to place more emphasis on differentiation strategy to
maintain effectiveness, changes in MAP are required to act as a platform for
managing this change. Therefore, the design of MAS should depend on the context
of the organizational setting. MAS that is tailored to support business strategy will
lead to competitive advantage and superior performance. This is because, the use of
effective MAP can assist employees to focus more easily on achieving differentiation

153
priorities, which could help in maintaining and improving customer expectations
especially in terms of quality and functionality. To make it work, employees should
be given an opportunity to make the best decision in the light of current changing
conditions. This could only be achieved by firms that exercise a decentralized
structure because under this type of structure, power to make decisions is given to the
person who has the knowledge. Empowerment places both authority and
responsibility to make decisions at low levels in an organization. Changing to a
flatter structure with a team-based focus and employee empowerment will result in
an increase access to relevant information, which is a key in such decision making.
Therefore, in decentralized structures, MAP acts as a chain to connect strategies with
various activities across organizations. A significant link among them has been
demonstrated in this study, with a positive impact on performance.
Another unsettled issue in the management accounting literature is the scope of
changes in MAS. It has been questioned whether advanced MAP should be used to
complement or substitute for traditional practices. This issue is important as firms
have to make suitable changes in their MAP to maintain effectiveness. Results in
subsidiary hypotheses testing show two different types of changes of MAP in
manufacturing companies in Malaysia. The changes include both introduction of new
management accounting techniques, in addition to existing techniques; and
replacement of the existing techniques with new ones. These results provide
evidence that advanced and traditional MAS should be used both to complement and
substitute for each other. Where the traditional system is inadequate in providing
sufficient information, but still able to provide useful information, an advanced
system should be adopted in order to assist in providing more information for
decision making purposes. However, once the traditional systems are no longer able
to cope with the changes in information requirements, and fail to provide useful
information, then it should be replaced with the more advanced system.
154
7.4 Contributions to Knowledge
The contributions of this study to the existing body of knowledge in this area are
divided into theoretical, methodological and practical contributions. Each of these
contributions is discussed below.
7.4.1 Theoretical contributions
This study has added new knowledge to the management accounting and
organizational change literature in developing economic settings, especially in
Malaysian manufacturing industry. Although there are other studies have been
conducted in other developing countries such as Africa (Waweru et al., 2004), they
do not specifically test the alignment among the variables using a structural model.
Moreover, different economic and cultural characteristics between Malaysia and
other developing countries mean the findings of this study provide a better
understanding of how management accounting and organizational change take place
in a different developing economic setting.
This study has also filled a gap in the literature concerning the relationships between
MAP, structure and strategy. While many studies have suggested there could be
interrelationships between these variables, it has actually tested in this study. It has
been shown that there is an interrelationship between MAP and structure, but with
only a one-way relationship with strategy. In addition, this study has also contributed
to the arguments as to whether the advanced and traditional MAS should act as a
complement or substitute to each other (or both). This study has filled this gap by
confirming that traditional and advanced management accounting system are both a
substitute and complement to each other.
Apart from the contribution to the existing management accounting change literature,
this study also contributes to the existing OIE and contingency theories. While the
theories advocate that changes in internal organizational factors are contingent upon
the changes in external environment factors, the alignment among them is also
essential in determining organizational success. This study has also identified how
the process of change can be institutionalised through the interaction among the

155
internal factors. This study demonstrates how organization change is institutionalised
through the formal and informal change process.
7.4.2 Methodological contributions
This study has adapted and modified an instrument by Baines and Langfield-Smith
(2003). However, it is noted that the study by Baines and Langfield-Smith (2003)
and many other studies in this area examined the changes over a three year period
only. This study examined the changes over a five year period because this provides
a more detailed opportunity to capture the time lag between various organizational
changes. In addition, this study combined both traditional and advanced management
techniques as indicators of the MAP construct. This method has enabled the
researcher to further analyse how both techniques act as instruments of management
accounting change in organizations, and it has been shown that each acts as a
substitute and complement for the other.
Data in this study had been analysed using SEM. Argument persists over the data
multivariate normality in SEM in many studies. According to Henri (2007) and
Shook et al. (2004), most researchers using SEM to analyse their survey data, do not
discuss the normality issue; a few studies report that their data met the normality
requirement, whereas most demonstrate a violation of multivariate normality. Most
of these reviewed studies have used the MLE technique to analyse their structural
model, while some of them did not disclose the technique used. Since the data in
this study did not meet the normality assumption, analysis has been conducted using
both techniques that require data normality (MLE) and one that does not require
multivariate normality of the data (WLS). This step is carried out to ensure that non-
normal data would not significantly affect the reliability of the final result. The
results show no significant difference between the outcomes from these two
techniques, thus MLE has been chosen over WLS as its selects the estimates which
have the greatest chance of reproducing the observed data. Results of the analysis
showed that MLE has produced a reliable result, by not only showing a well-fitted
model but also one which is strongly supported by the theory. Therefore, it
contributes to our understanding of the seriousness of data normality as a major

156
concern in SEM. It has also shown that the MLE technique is fairly robust to non-
normal data.
7.4.3 Practical contributions
The business environment has changed and will continuously changing. Thus, it is
critical to ensure that appropriate MAS is practiced in organizations. This is
important because an effective MAS can help to better coordinate business activities
as well as to provide useful information for managers to make decisions. This
process will ultimately improve organizational performance. If the MAP does not
properly match with the existing organization’s structure and strategy, the managers
might have been provided with inaccurate information, which consequently might
jeopardize the firm’s performance.
Thus, a proper alignment among organization structure, strategy and MAS is
necessary. If this alignment matches with the changes in environment, superior
performance can be achieved by the organization. Therefore, results in this study
provide helpful insights and useful guidelines to organizations facing these changes,
especially those managers who are responsible in making sure that their companies
move toward in an appropriate direction.
7.5 Limitations
As with any research, the current study is subject to a number of limitations.
Although this study has significantly contributed to our understanding of how the
alignment among the studied variables improved performance; there are also some
limitations that need to be highlighted. First, the sample may not be fully
representative of the population of manufacturing industry in Malaysia. Due to the
relatively small sample size, any generalization of the study’s results to non-
manufacturing organizations or beyond cannot be made without considerable
caution. The relatively low response rate is consistently a major limitation in
accounting research.

157
In addition, each of the variables examined in this study comprises several indicators
which were reduced to constructs, which limit the extent to which the constructs
represent the variables measured. Third, the strategy variable tested in this study only
concentrated on differentiation strategy, which restricted the analysis to provide more
information on the strategic behaviour in the studied organizations. Finally, data was
collected at one point in time rather than longitudinally. Thus, the research could not
account for time-lag effects of changes in external and internal organizational factors
on performance, as the changes in these factors may not influence firm performance
directly after the changes took place.
The limitations addressed above however, do not negate the results and findings in
this study. Despite the limitations addressed above, the results in this study have
extended our understanding of management accounting and organizational change in
Malaysian manufacturing companies. The limitations above are outlined to
acknowledge their existence and to stress the need for further research.
7.6 Future Research
There are several significant issues to be considered for future research. This study
provides a detailed examination on how the external and internal organizational
factors have caused MAS to change. However, the types of MAS that should be
adopted and the circumstances in which change should take place are beyond the
scope of this study. Further examination of this area should be conducted in order to
provide more guidelines to practitioners as well as to produce better theories.
Another area that could be researched relates to the relationship between strategy and
structure. This study has identified strategy as the most important variable in
management accounting and organizational research. It has significantly responded
to the change in external environment and has also significantly influenced change in
MAP. An interaction between strategies and other variables has resulted in
performance improvement. However, this study did not test its relationship with
structure. Therefore, further research might be carried out to test how strategy and
structure are related to each other and if their interaction could also lead to a
performance improvement.

158
Moreover, this study only applied one of the existing strategy typologies (i.e.
differentiation strategy). Further research should be carried out by applying a multi-
dimensional construct covering activities in various functional areas including the
competitive position adopted, for measuring strategic behaviour. This approach will
enhance the quality of information derived from the analysis and will enable the
strategy to be examined from different angles whilst providing a convergent
perspective to strategic orientation.
Findings from this quantitative study do not capture an in-depth understanding of the
subject phenomena, thus a qualitative approach such as case study might be
conducted to shed further light on this issue. A case study among certain
manufacturing companies might reveal the actual change process for detailed
investigation. Moreover, any obstacles or problems associated with failures in the
change process can be easily identified and tested, providing greater understanding
of the subject phenomena.
7.7 Summary
This study has attempted to enhance our understanding of the effect of alignment
among management accounting and organizational change, in Malaysian
manufacturing companies, on performance. It explores the causal relationship
between competitive environment and advanced manufacturing technology; with
MAP, strategy and structure. Interrelationship between MAP with structure and
strategy is also investigated. The research findings confirm that the model developed
mainly from a Western perspective is largely applicable to the Malaysian context.
Moreover, this study presents a number of distinctive findings to add to the existing
literature. It identifies certain important associations, particularly in relation to the
alignment among the organizational factors, i.e., MAP, structure and strategy. As the
business environment is continuously changing, organizations and their managers
will find it is critical to cope with these changes to ensure that institutional factors are
properly matched. Supply of relevant information is essential for managers to make
effective decisions regarding an appropriate alignment.

159
This study had been designed to achieve the research objectives. By employing a
valid and reliable methodology, this study has significantly contributed to the
theoretical and methodological knowledge in this area. The findings from this
research also provide a useful guideline to organizations, especially their managers,
to make decisions in light of the current changing environment. Apart from these
contributions, this research’s outcome has also provided useful guidance for future
research.

160
REFERENCES
Abdel-Kader, M., & Luther, R. (2008). The impact of firm characteristics on
management accounting practices: A UK-based empirical analysis. The
British Accounting Review, 40(1), 2-27.
Abdul-Aziz, Z., Chan, J. F. L., & Metcalfe, A. V. (2000). Quality practices in the
manufacturing industry in the UK and Malaysia. Total Quality Management,
11(8), 1053-1064.
Abdul-Rahman, I. K. (1993). Privatisation in Malaysia with special reference to
changes in accounting system. Unpublished PhD, University of Hull.
Abdul-Rahman, I. K., Omar, N., & Taylor, D. W. (2002). The migration of a
government trading enterprise's accounting system during privatization with
reference to Japanese management accounting. Asian Review of Accounting
10(1), 22-48.
Abernethy, M. A., & Brownell, P. (1999). The role of budgets in organizations
facing strategic change: An exploratory study. Accounting, Organizations
and Society, 24(3), 189-204.
Albright, T. L., & Lee, T. A. (1995). Case study of the organizational effects of
accounting information within a manufacturing environment (110 A).
Advances in Management Accounting, 4, 27-43.
Allen, I. E., & Seaman, C. A. (2007). Likert scales and data analyses. Quality
Progress, 40(7), 64-65.
Anderson, S. W., & Young, S. M. (1999). The impact of contextual and process
factors on the evaluation of activity-based costing systems. Accounting,
Organizations and Society, 24, 525-559.
Anderson, S. W., & Young, S. M. (2001). Implementing management innovations.
Massachusetts: Kluwer Academic Publishers

161
Andon, P., Baxter, J., & Chua, W. F. (2007). Accounting change as relational
drifting: A field study of experiments with performance measurement.
Management Accounting Research, 18(2), 273-308.
Askarany, D., & Smith, M. (2008). Diffusion of innovation and business size: A
longitudinal study of PACIA. Managerial Auditing Journal, 23(9), 900-916.
Baines, A., & Langfield-Smith, K. (2003). Antecedents to management accounting
change: a structural equation approach. Accounting, Organizations and
Society, 28(7,8), 675-698.
Barnett, W. P., & Caroll, G. R. (1995). Modeling internal organizational change.
Annual Review of Sociology, 21, 217-236.
Bhattacharya, M. (2002). Industrial concentration and competition in Malaysian
manufacturing. Applied Economics, 34(17), 2127-2141.
Brownell, P. (1995). Research methods in management accounting. Melbourne:
Coopers and Lybrand.
Bryman, A. (2001). Social research methods. Oxford: Oxford University Press.
Burns, J., Ezzamel, M., & Scapens, R. W. (1999). Management accounting change in
the UK. Management Accounting, 77, 28-30.
Burns, J., & Scapens, R. W. (2000). Conceptualizing management accounting
change: An institutional framework. Management Accounting Research,
11(1), 3-25.
Burns, J., & Vaivio, J. (2001). Management accounting change. Management
Accounting Research, 12(4), 389-402.
Cadez, S., & Guilding, C. (2008a). An exploratory investigation of an integrated
contingency model of strategic management accounting. Accounting,
Organizations and Society, 33(7-8), 836-863.
Cadez, S., & Guilding, C. (2008b). Strategy and strategic management accounting :
An investigation of organizational configurations. Paper presented at the
Manchester Business School Research Seminar.

162
Chenhall, R. H. (1997). Reliance on manufacturing performance measures, total
quality management and organizational performance. Management
Accounting Research, 8(2), 187-206.
Chenhall, R. H. (2003). Management control systems design within its organizational
context: Findings from contingency-based research and directions for the
future. Accounting, Organizations and Society, 28(2,3), 127-168.
Chenhall, R. H. (2007). Theorizing contingencies in management control systems
research. Handbook of Management Accounting Research, 1, 163-205.
Chenhall, R. H. (2008). Accounting for the horizontal organization: A review essay.
Accounting, Organizations and Society, 33(4-5), 517-550.
Chenhall, R. H., & Euske, K. J. (2007). The role of management control systems in
planned organizational change: An analysis of two organizations. Accounting,
Organizations and Society, 32(7/8), 601-637.
Chenhall, R. H., & Langfield-Smith, K. (1998a). Factors influencing the role of
management accounting in the development of performance measures within
organizational change programs. Management Accounting Research, 9(4),
361-386.
Chenhall, R. H., & Langfield-Smith, K. (1998b). The relationship between strategic
priorities, management techniques and management accounting: an empirical
investigation using a systems approach. Accounting, Organizations and
Society, 23(3), 243-264.
Chenhall, R. H., & Langfield-Smith, K. (2003). Performance measurement and
reward systems, trust, and strategic change. Journal of Management
Accounting Research, 15, 117-143.
Chenhall, R. H., & Morris, D. (1986). The impact of structure, environment, and
interdependence on the perceived usefulness of management accounting
systems. The Accounting Review, 61(1), 16-35.
Chin, W. (1998). The partial least squares approach to structural equation
modelling, in modern methods for business research. New Jersey: Lawrence
Erlbaum Associates.

163
Choe, J. (2004). Impact of management accounting information and AMT on
organizational performance. Journal of Information Technology, 19, 203-214.
Chong, V. K., & Chong, K. M. (1997). Strategic choices, environmental uncertainty
and SBU performance: A note on the intervening role of management
accounting systems. Accounting and Business Research, 27(4), 268-276.
Chow, C. W., Shields, M. D., & Wu, A. (1999). The importance of national culture
in the design of and preference for management controls for multi-national
operations. Accounting, Organizations and Society, 24(5-6), 441-461.
Cohen, S. G., & Bailey, D. E. (1997). What makes teams work: Group effectiveness
research from the shop floor to the executive suite. Journal of Management,
23(3), 239-252.
Cooper, D. R., & Schindler, P. S. (2001). Business research methods. (7th ed.).
Singapore: McGraw-Hill.
Dalton, D. R., Todor, W. D., Spendolini, M. J., Fielding, G. J., & Porter, L. W.
(1980). Organization structure and performance: A critical review. Academy
of Management Review, 5(1), 49-64.
Davenport, T. H. (2000). Mission critical: Realising the promise of enterprise
systems. Boston, MA: Harvard Business School Press.
Davila, T. (2000). An empirical study of the drivers of management control systems'
design in new product development. Accounting, Organizations and Society,
25, 383-409.
DeLisi, P. S. (1990). Lessons from the Steel Axe: Culture, technology, and
organizational change. Sloan Management Review, 32(1), 83-93.
Dibrell, C. C., & Miller, T. R. (2002). Organization design: The continuing influence
of information technology. Management Decision, 40(5/6), 620-627.
Dillman, D. (1978). Mail and telephone surveys: the total design method. New York:
John Wiley & Sons.
Donaldson, L. (2001). The contingency theory of organizations. Thousand Oaks, CA:
Sage Publications.

164
Emmanuel, C., Otley, D., & Merchant, K. (1990). Accounting for management
control. (2nd ed.). London: Chapman & Hall.
Feurer, R., & Chaharbaghi, K. (1995). Performance measurement in strategic change.
Benchmarking for Quality Management &Technology, 2(2), 64-83.
FMM. (2008). FMM Directory 2008: Malaysian Industries (39th ed.). Kuala
Lumpur: Federation of Malaysian Manufacturers.
Fuschs, P. H., Mifflin, K. E., Miller, D., & Whitney, J. O. (2000). Strategic
integration: Competing in the age of capabilities. California Management
Review, Spring, 118-147.
Garson, G. D. (2009). Structural equation modeling. Online Article,
http://faculty.chass.ncsu.edu/garson/PA765/structur/htm.
Gerdin, J. (2005). Management accounting system design in manufacturing
departments: an empirical investigation using a multiple contingencies
approach. Accounting, Organizations and Society, 30(2), 99-126.
Gerdin, J., & Greve, J. (2004). Forms of contingency fit in management accounting
research - A critical review. Accounting, Organizations and Society, 29, 303-
326.
Gibbons, J. D. (1993). The use of nonparametric methods in tax research. The
Journal of the American Taxation Association, 15(1), 110-120.
Gomes, C. F., Yasin, M. M., & Lisboa, J. V. (2007). The dimensionality and
utilization of performance measures in a manufacturing operational context:
Organizational change implications. Cross Cultural Management: An
International Journal, 14(4), 286-306.
Gordon, L. A., & Miller, D. (1976). A contingency framework for the design of
accounting information systems. Accounting, Organizations and Society,
1(1), 59-69.
Gordon, L. A., & Narayanan, V. K. (1984). Management accounting systems,
perceived environmental uncertainty and organization structure: An empirical
investigation. Accounting, Organizations and Society, 56-69.

165
Gosselin, M. (1997). The effect of strategy and organizational structure on the
adoption and implementation of activity-based costing. Accounting,
Organizations and Society, 22(2), 105-122.
Govindarajan, V., & Gupta, A. K. (1985). Linking control systems to business unit
strategy: impact on performance. Accounting, Organizations and Society,
10(1), 51-66.
Granlund, M. (2001). Towards explaining stability in and around management
accounting systems. Management Accounting Research, 12, 141-166.
Gurd, B., & Thorne, H. (2003). The transformation of an accounting system during
organisational change: A longitudinal study. Financial Accountability &
Management, 19(1), 21-43.
Hair, J. F., Black, W. C., Babin, B. J., Anderson, R. E., & Tatham, R. L. (2006).
Multivariate data analysis. (6th ed.). New Jersey: Pearson Prentice Hall.
Haldma, T., & Laats, K. (2002). Contingencies influencing the management
accounting practices of Estonian manufacturing companies. Management
Accounting Research, 13(4), 379-400.
Hambrick, D. D. (1980). Operationalizing the concept of business-level strategy in
research. Academy of Management Review, 5, 567-575.
Harris, M. (1996). Organizational politics, strategic change and the evaluation of
CAD. Journal of Information Technology, 11(1), 51-58.
Hassan, M. K. (2005). Management accounting and organizational change: An
institutional perspective. Accounting & Organizational Change, 1(2), 125-
140.
Henri, J. (2007). A quantitative assessment of the reporting of structural equation
modeling information: The case of management accounting research. Journal
of Accounting Literature, 26, 76-115.
Holmes-Smith, P. (2005). Introduction to structural equation modeling using
LISREL. The University of Queensland: School Research, Evaluation and
Measurement Services.

166
Hopwood, A. G. (1987). The archeology of accounting systems. Accounting,
Organizations and Society, 12(3), 207-234.
Hopwood, A. G. (1990). Accounting and organization change. Accounting, Auditing
& Accountability Journal, 3(1), 7-17.
Hoque, Z. (2000). Just-In-Time production, automation, cost allocation practices and
importance of cost information: An empirical investigation in New Zealand-
based manufacturing organizations. The British Accounting Review, 32, 133-
159.
Hoque, Z. (2004). A contingency model of the association between strategy,
environmental uncertainty and performance measurement: Impact on
organizational performance. International Business Review, 13(4), 485-502.
Hoque, Z. (2005). Linking environmental uncertainty to non-financial performance
measures and performance: A research note. The British Accounting Review,
37(4), 471-481.
Hoque, Z., & Hopper, T. (1994). Rationality, accounting and politics: A case study
of management control in a Bangladeshi Jute Mill. Management Accounting
Research, 5(1), 5-30.
Hoque, Z., & James, W. (2000). Linking balance scorecard measures to size and
market factors: Impact on organizational performance. Management
Accounting Research, 12, 1-17.
Hoque, Z., Mia, L., & Alam, M. (2001). Market competition, computer-aided
manufacturing and use of multiple performance measures: An empirical
study. The British Accounting Review, 33(1), 23-45.
Horngren, C. (1995). Management accounting: This century and beyond.
Management Accounting Research, 6, 281-286.
Horngren, C., Sundem, G., Stratton, W., Burgstahler, D., & Schatzberg, J. (2007).
Introduction to management accounting. (14th ed.). New Jersey: Pearson
Prentice Hall.
Hult, G. T., Ketchen Jr., D. J., Cui, A. S., Prud'homme, A. M., Seggie, S. H., Stanko,
M. A., et al. (2006). An assessment of the use of the structural equation

167
modeling in international business research. Research Methodology in
Strategy and Management, 3, 385-415.
Hussain, M., & Hoque, Z. (2002). Understanding non-financial performance
measurement practices in Japanese banks: A new institutional sociology
perspective. Accounting, Auditing & Accountability Journal, 15(2), 162-183.
Huy, Q. N. (2001). Time, temporal capability, and planned change. Academy of
Management. The Academy of Management Review, 26(4), 601-623.
Hyvönen, J. (2007). Strategy, performance measurement techniques and information
technology of the firm and their links to organizational performance.
Management Accounting Research, 18(3), 343-366.
IFAC. (1998). International Management Accounting Practice Statement:
Management Accounting Concepts, New York.
Innes, J., & Mitchell, F. (1990). The process of change in management accounting:
Some field study evidence. Management Accounting Research, 1, 3-19.
Innes, J., & Mitchell, F. (1995). A survey of activity based costing in the UK's large
companies. Management Accounting Research, 6(2), 137-153.
Ittner, C. D., & Larcker, D. F. (1995). Total quality management and the choice of
information and reward systems. Journal of Accounting Research,
33(Supplement), 1-34.
Jarvenpaa, M. (2007). Making business partners: A case study on how management
accounting culture was changed. European Accounting Review, 16(1), 99-
142.
Jermias, J., & Gani, L. (2002, 27-29 Oct 2002). Linking strategic prioroties,
organizational configurations and management accounting systems with
business unit effectiveness: Experience from Indonesian publicly held
companies. Paper presented at the 3rd Conference AAA, Nagoya, Japan.
Johnson, H. T., & Kaplan, R. S. (1987). Relevance lost: the rise and fall of
management accounting. Harvard Business School Press, Cambridge, MA.
Kaplan, R. S. (1989). Management accounting for advanced technological
environments. Science, 245(4920), 819-823.

168
Kaplan, R. S., & Norton, D. P. (1992). The balanced scorecard-measures that drive
performance. Harvard Business Review, 70, 71-79.
Kaplan, R. S., & Norton, D. P. (1996). The balance scorecard: Translating strategy
into action. Boston, MA: Harvard Business School Publishing.
Kassim, M. Y., Md-Mansur, K., & Idris, S. (2003). Globalization and its impact on
Malaysia economy. Reinventing Sabah: Global Challenges and Policy
Responses, 95-111.
Kaynak, H., & Hartley, J. L. (2006). Using replication research for just in time
purchasing construct development. Journal of Operation Management, 24,
868-892.
Keidal, R. W. (1994). Rethinking Organizational Design. Academy of Management
Executive, 8(4), 12-17.
Khandwalla, P. N. (1974). Mass output Orientation of operations technology and
organizational structure. Administrative Science Quarterly, March, 74-97.
Kline, R. B. (1998). Principles and practice of structural equation modeling. New
York: The Guilford Press.
Kloot, L. (1997). Organizational learning and management control systems:
Responding to environmental change. Management Accounting Research,
8(1), 47-73.
Kober, R., Ng, J., & Paul, B. J. (2007). The interrelationship between management
control mechanisms and strategy. Management Accounting Research, 18(4),
425-452.
Kotha, S., & Swamidass, P. M. (2000). Strategy, advanced manufacturing
technology and performance: Empirical evidence from U.S manufacturing
firms. Journal of Operations Management, 18(3), 257-277.
Laitinen, E. K. (2001). Management accounting change in small technology
companies: Towards a mathematical model of the technology firm.
Management Accounting Research, 12(4), 507-541.

169
Laitinen, E. K. (2006). Explaining management accounting change: Evidence from
Finland. International Journal Accounting, Auditing and Performance
Evaluation, 3(2), 252-281.
Langfield-Smith, K. (1997). Management control systems and strategy: A critical
review. Accounting, Organizations and Society, 22(2), 207-232.
Lapsley, I., & Pallot, J. (2000). Accounting management and organizational change:
A comparative study of local government. Management Accounting
Research, 11(2), 213-229.
Li, M., & Ye, L. (1999). Information technology and firm performance: Linking with
environmental, strategic and managerial context. Journal of Information
Management, 35, 43-51.
Libby, T., & Waterhouse, J. H. (1996). Predicting change in management accounting
systems. Journal of Management Accounting Research, 8, 137-150.
Ling-Yee, L., & Ogunmokun, G. O. (2008). An empirical study of manufacturing
flexibility of exporting firms in China: How do strategic and organizational
contexts matter? Industrial Marketing Management, 37(6), 738-751.
Lucas, H. C., & Baroudi, J. (1994). The role of information technology in
organization design. Journal of Management Information Systems, 10(4), 9-
23.
Luft, J. L. (1997). Long-term change in management accounting: Perspectives from
historical research. Journal of Management Accounting Research, 9, 163-
197.
Luther, R., & Longden, S. (2001). Management accounting in companies adapting
structural change and volatility in transition economies: A South African
study. Management Accounting Research, 12, 299-320.
Ma, Y., & Tayles, M. (2009). On the emergence of strategic management
accounting: an institutional perspective. Accounting and Business Research,
39(5), 473-495.
Macy, G., & Arunachalam, V. (1995). Management accounting systems and
contingency theory: In search of effective systems. Advances in Management
Accounting, 4, 63-86.

170
Matejka, M., & De Waegenaere, A. (2000). Organizational design and management
accounting change. Center for Economic Research, Tilburg University,
Netherlands.
Mia, L., & Clarke, B. (1999). Market competition, management accounting systems
and business unit performance. Management Accounting Research, 10, 137-
158.
Michael, J. H., Barsness, Z. I., Lawson, L., & Balkundi, P. (2004). Focus please:
Team coordination and performance at a wood manufacturer. Forest
Products Journal, 54(12), 250-255.
Miles, R. E., & Snow, C. C. (1978). Organizational strategy, structure and process.
New York: McGraw Hill.
Miller, D., & Friesen, P. H. (1982). Structural change and performance: Quantum
versus piecemeal-incremental approaches. Academy of Management Journal
25(4), 867-892.
Moores, K., & Mula, J. (1993). Contextual and strategic impacts on the form of
management accounting system. School of Business Discussion Paper, Bond
University.
Moores, K., & Yuen, S. (2001). Management accounting systems and organization
configuration: A life-cycle perspective. Accounting, Organizations and
Society, 26, 351-389.
Morton, N. A., & Hu, Q. (2008). Implications of the fit between organizational
structure and ERP: A structural contingency theory perspective. International
Journal of Information Management, 28, 391-402.
Naranjo-Gil, D., & Hartmann, F. (2007). Management accounting systems, top
management team heterogeneity and strategic change. Accounting,
Organizations and Society, 32(7/8), 735-756.
Nardi, P. (2006). Doing survey research: A guide to quantitative methods. Boston,
MA: Person Education Inc.
Nor-Aziah, A. K., & Scapens, R. W. (2007). Corporatisation and accounting change:
The role of accounting and accountants in a Malaysian public utility.
Management Accounting Research, 18, 209-247.

171
Nunnally, J. C. (1978). Psychometric theory. (2nd ed.). New York: McGraw Hill.
Omar, N., Abd-Rahman, I. K., & Sulaiman, S. (2004). Management accounting in
Malaysia - Has relevance been lost? Accountants Today, November, 26-28.
Otley, D. (1980). The contingency theory of management accounting: Achievement
and prognosis. Accounting, Organizations and Society, 5(4), 413-428.
Perera, S., Harrison, G. L., & Poole, M. (1997). Customer-focused manufacturing
strategy and the use of operations-based non-financial performance measures:
A research note. Accounting, Organizations and Society, 22, 557-572.
Perera, S., McKinnon, J. L., & Harrison, G. L. (2003). Diffusion of transfer pricing
innovation in the context of commercialization-A longitudinal case study of a
government trading enterprise. Management Accounting Research, 14(2),
140-164.
Pinsonneault, A., & Kraemer, K. L. (1993). Survey research methodology in
management information systems: An assessment. Journal of Information
Management Systems, 10(2), 75-85.
Pitts, R. A. (1980). Toward a Contingency Theory of Multibusiness Organization
Design. Academy of Management. The Academy of Management Review,
5(2), 203-210.
Porter, M. E. (1980). Competitive strategy. New York: The Free Press.
Porter, M. E. (1996). What is strategy? Harvard Business Review, 74(6), 61-78.
Pratt, Z. L. (2004). An investigation of the relationships between external
environment, mission and strategy, leadership, organizational culture, and
performance. Unpublished Ph.D., Michigan State University, United States --
Michigan.
Quattrone, P., & Hopper, T. (2001). What does organizational change mean?
Speculations on a taken for granted category. Management Accounting
Research, 12(4), 403-435.
Rasiah, R. (1995). Foreign capital and industrialization in Malaysia. (Vol. xvi). New
York: St. Martin's Press.
172
Rowe, C., Birnberg, J. G., & Shields, M. D. (2008). Effects of organizational process
change on responsibility accounting and managers' revelations private
knowledge. Accounting, Organizations and Society, 33, 164-198.
Scapens, R. W. (1999). Broadening the Scope of Management Accounting: From a
Micro-economic to a Broader Business Perspective. Unpublished Working
Paper. Working Paper, University of Manchester, Manchester, September.
Schroeder, D. M., & Congden, S. W. (2000). Aligning competitive strategies,
manufacturing technology, and shop floor skills. Production and Inventory
Management Journal 41(4), 40-47.
Schumacker, R. E., & Lomax, R. G. (1996). A beginner's guide to structural
equation modelling.: NJ: Lawrence Erlbaum Associates.
Schwarz, G. M., & Shulman, A. D. (2007). The patterning of limited structural
change. Organizational Change Management, 20(6), 829-846.
Scott, T. W., & Tiessen, P. (1999). Performance measurement and managerial teams.
Accounting, Organizations and Society, 24, 263-285.
Seal, W. (2001). Management accounting and the challenge of strategic focus.
Management Accounting Research, 12(4), 487-506.
Sekaran, U. (2003). Research methods for business: A skill building approach. (4th
ed.). Singapore: Joh Wiley & Sons (Asia) Pte Ltd.
Shields, M. D. (1997). Research in management accounting by North Americans in
the 1990s. Journal of Management Accounting Research, 9, 3-61.
Shook, C. L., Ketchen Jr., D. J., Hult, G. T., & Kacmar, K. M. (2004). An assessment
of the use of structural equation modelling in strategic management research.
Strategic Management Journal, 25, 397-404.
Sim, K. L., & Killough, L. N. (1998). The performance effects of complimentarities
between manufacturing practices and management accounting systems.
Management Accounting Research, 10, 325-346.
Simons, R. (1987). Accounting control systems and business strategy: An empirical
analysis. Accounting, Organizations and Society, 12, 357-374.

173
Sisaye, S. (2003). Process innovation and adaptive institutional change strategies in
management control systems: Activity based costing as administrative
innovation. Advances in Management Accounting, 11, 251-285.
Smith, D., & Langfield-Smith, K. (2004). Structural equation modeling in
management accounting research: Critical analysis and opportunities. Journal
of Accounting Literature, 23, 49-86.
Smith, J. A., Morris, J., & Ezzamel, M. (2005). Organisational change, outsourcing
and the impact on management accounting. The British Accounting Review,
37(4), 415-441.
Smith, M. (2003). Research methods in accounting. London: SAGE Publications Inc.
Smith, M., Abdullah, Z., & Abdul-Razak, R. (2008). The diffusion of technological
and management accounting innovation: Malaysian evidence. Asian Review
of Accounting, 16(3), 197-218.
Soin, K., Seal, W., & Cullen, J. (2002). ABC and organizational change: An
institutional perspective. Management Accounting Research, 13(2), 249-271.
Soper, D. S. (2009). The free statistics calculators website. Önline Software,
http://www.danielsoper.com/statcalc/.
Subramaniam, N., & Mia, L. (2001). The relation between decentralised structure,
budgetary participation and organization commitment. Accounting, Auditing
& Accountability Journal, 14(1), 12-29.
Sulaiman, S., & Mitchell, F. (2005). Utilising a typology of management accounting
change: An empirical analysis. Management Accounting Research, 16(4),
422-437.
The American Heritage Dictionary (2000). The American Heritage Dictionary of the
English Language (4th ed.). Harcourt: Houghton Mifflin.
Tybout, J. R. (2000). Manufacturing firms in developing countries: How well do they
do, and why? Journal of Economic Literature, 108, 11-44.
Vaivio, J. (1999). Exploring a 'non-financial' management change. Management
Accounting Research, 10, 409-437.

174
Vamosi, T. (2003). The role of management in a company transition from command
to market economy Small Business and Enterprise Development, 10(2), 194-
209.
Van der Stede, W. A., Young, S. M., & Chen, C. X. (2007). Doing management
accounting survey research. Handbook of Management Accounting Research,
1, 445-478.
Verbeeten, F. (2010). The impact of business unit strategy, structure and technical
innovativeness on change in management accounting systems. International
Journal of Management, 27(1), 123-143.
Waclawski, J. (1996). Large-scale organizational change and organizational
performance. Unpublished Ph.D., Columbia University, United States -- New
York.
Waldron, M. (2005). Overcoming barriers to change in management accounting
systems. The Journal of American Academy of Business, Cambridge(2), 244-
249.
Waterhouse, J. H., & Tiessen, P. (1978). A contingency framework for management
accounting system research. Accounting, Organizations and Society, 3, 65-76.
Waweru, N. M., Hoque, Z., & Uliana, E. (2004). Management accounting change in
South Africa. Accounting, Auditing & Accountability Journal, 17(5), 675-
704.
Weill, P., & Olson, M. H. (1989). An assessment of the contingency theory of
management information system. The Journal of Management Information
System, 6(1), 59-85.
Wickramasinghe, D., & Alawattage, C. (2007). Management accounting change:
approaches and perspectives. London and New York: Routledge, Taylor &
Francis Group.
Zikmund, W. G. (2003). Business research methods. (7th ed.). Ohio: Thomson
Learning.
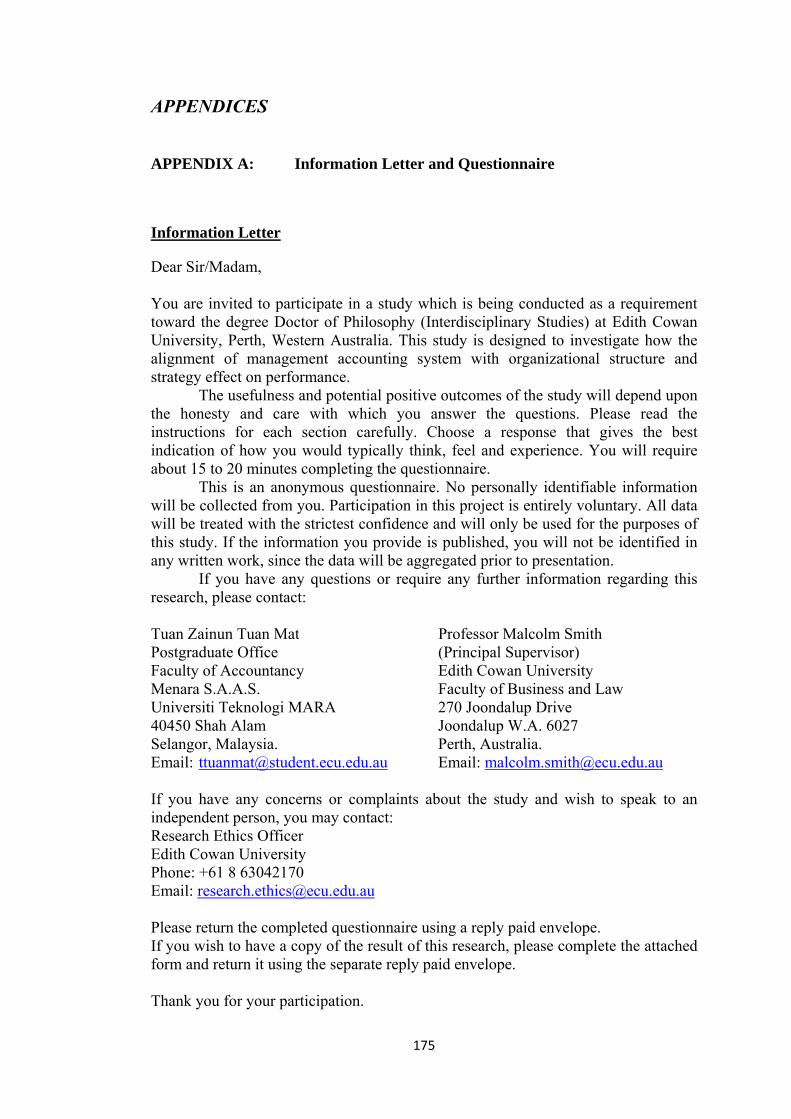
175
APPENDICES
APPENDIX A: Information Letter and Questionnaire
Information Letter
Dear Sir/Madam, You are invited to participate in a study which is being conducted as a requirement toward the degree Doctor of Philosophy (Interdisciplinary Studies) at Edith Cowan University, Perth, Western Australia. This study is designed to investigate how the alignment of management accounting system with organizational structure and strategy effect on performance.
The usefulness and potential positive outcomes of the study will depend upon the honesty and care with which you answer the questions. Please read the instructions for each section carefully. Choose a response that gives the best indication of how you would typically think, feel and experience. You will require about 15 to 20 minutes completing the questionnaire.
This is an anonymous questionnaire. No personally identifiable information will be collected from you. Participation in this project is entirely voluntary. All data will be treated with the strictest confidence and will only be used for the purposes of this study. If the information you provide is published, you will not be identified in any written work, since the data will be aggregated prior to presentation.
If you have any questions or require any further information regarding this research, please contact:
Tuan Zainun Tuan Mat Professor Malcolm Smith Postgraduate Office (Principal Supervisor) Faculty of Accountancy Edith Cowan University Menara S.A.A.S. Faculty of Business and Law Universiti Teknologi MARA 270 Joondalup Drive 40450 Shah Alam Joondalup W.A. 6027 Selangor, Malaysia. Perth, Australia. Email: [email protected] Email: [email protected] If you have any concerns or complaints about the study and wish to speak to an independent person, you may contact: Research Ethics Officer Edith Cowan University Phone: +61 8 63042170 Email: [email protected] Please return the completed questionnaire using a reply paid envelope. If you wish to have a copy of the result of this research, please complete the attached form and return it using the separate reply paid envelope. Thank you for your participation.

176
Questionnaire Survey on: Management Accounting and Organizational Change: Impact on Organizational Performance.
This is an anonymous questionnaire. Please read the Information Letter carefully as it provides details of the project. By completing the questionnaire, you are consenting to take part in this survey. You are not required to provide your name as part of the survey. Your reply to the survey will be strictly confidential. You have a chance to give any comments or suggestions at the end of this questionnaire. Should you be interested in the results of this survey please fill your name and contact details using separate form attach here, or email to me directly, in order to maintain confidentiality. Thank you. (Email: [email protected] or [email protected])
This questionnaire has five sections (Section A to E). Please answer all the
questions.
SECTION A
This section seeks general information about your organization.
Please choose a relevant box.
1) Industry Classification: Electrical and electronics
Engineering supporting
Food processing
Life sciences
Machinery and equipment
Petrochemical and polymer
Rubber products
Textiles and apparel
Transport equipment
Basic metal products
Wood-based
Other (please specify: )

177
2) Type of Company:
Local company
Foreign company 3) Type of Product:
Consumer product
Industrial product
Other (please specify: ) 4) Total number of employees:
Less than 50
50 - 150
151 - 500
501 – 1,000
Over 1,000
SECTION B This section seeks information on environmental and technological changes in your company over the past five years (2003-2007 inclusive). 5) Please indicate the extent to which you believe the competitive environment of
your business unit has changed over the past 5 years. Please choose your response on a scale of -5 to +5, or N/A if the items are not applicable in your organization.
Competitive Environment: Significantly less Significantly more competitive competitive -5 -4 -3 -2 -1 0 1 2 3 4 5 N/A
a) Price competition b) Competition for new product
development c) Marketing/distribution channels
competition d) Competition for markets/revenue
share
e) Competitors’ action f) No. of competitors in your market
segments

178
6) Please indicate the extent to which the use of particular advanced technologies
has changed in your business unit over the past 5 years. Please choose your response on a scale of -5 to +5, or N/A if the items are not applicable in your organization.
Advanced Manufacturing Technology (AMT): Used significantly Used significantly
less more
-5 -4 -3 -2 -1 0 1 2 3 4 5 N/A
a) Robotics b) Flexible manufacturing system
(FMS) c) Computer aided manufacturing
(CAM)
d) Computer aided design (CAD)
e) Computer aided engineering (CAE) f) Computer aided process planning
(CAPP)
g) Testing machines
h) Just-in-time (JIT)
i) Direct numerical control j) Computer integrated manufacturing
(CIM)
k) Numerical control (NC)

179
SECTION C This section seeks information on organizational changes in your company over the past five years (2003-2007 inclusive). 7) Please indicate the extent to which the use of a range of organizational design
practices below had changed over the past 5 years. Please choose your response on a scale of -5 to +5, or N/A if the items are not applicable in your organization.
Organizational Design Practices: Used significantly Used significantly less more
-5 -4 -3 -2 -1 0 1 2 3 4 5 N/A
a) Multi-skilling of workforce
b) Worker training
c) Cross-functional teams
d) Establishing participative culture
e) Management training f) Flattening of formal organizational
structures
g) Work-based teams
h) Employee empowerment
i) Manufacturing cells
8) Please indicate the extent to which your business unit has changed its strategic emphasis for the following differentiation aspects, during the past 5 years. Please choose your response on a scale of -5 to +5, or N/A if the items are not applicable in your organization.
Organizational Strategy: Emphasized Emphasized significantly less significantly more
-5 -4 -3 -2 -1 0 1 2 3 4 5 N/A
a) Provide on time delivery
b) Make dependable delivery promises
c) Provide high quality products d) Provide effective after sales service
& support e) Make changes in design &
introduce quickly

180
f) Customize products & services
to customer need g) Product availability
(broad distribution) h) Make rapid volume/product
mix changes
SECTION D This section seeks information on changes in management accounting practices in your company over the past five years (2003-2007 inclusive). 9) Please indicate the extent to which the use of a range of management
accounting techniques has changed over the past 5 years Please choose your response on a scale of -5 to +5, or N/A if the items are not applicable in your organization.
Management Accounting Techniques: Used significantly Used significantly Less more
-5 -4 -3 -2 -1 0 1 2 3 4 5 N/A
a) Budgetary control
b) Full/ Absorption costing
c) Cost-volume-profit (CVP) analysis
d) Variable/ Marginal costing
e) Standard costing
f) Total Quality Management (TQM)
g) Target costing
h) Activity Based Costing (ABC)
i) Activity Based Management (ABM)
j) Value chain analysis
k) Product life cycle analysis
l) Benchmarking
m) Product profitability analysis
n) Customer profitability analysis
o) Shareholder value analysis / EVA
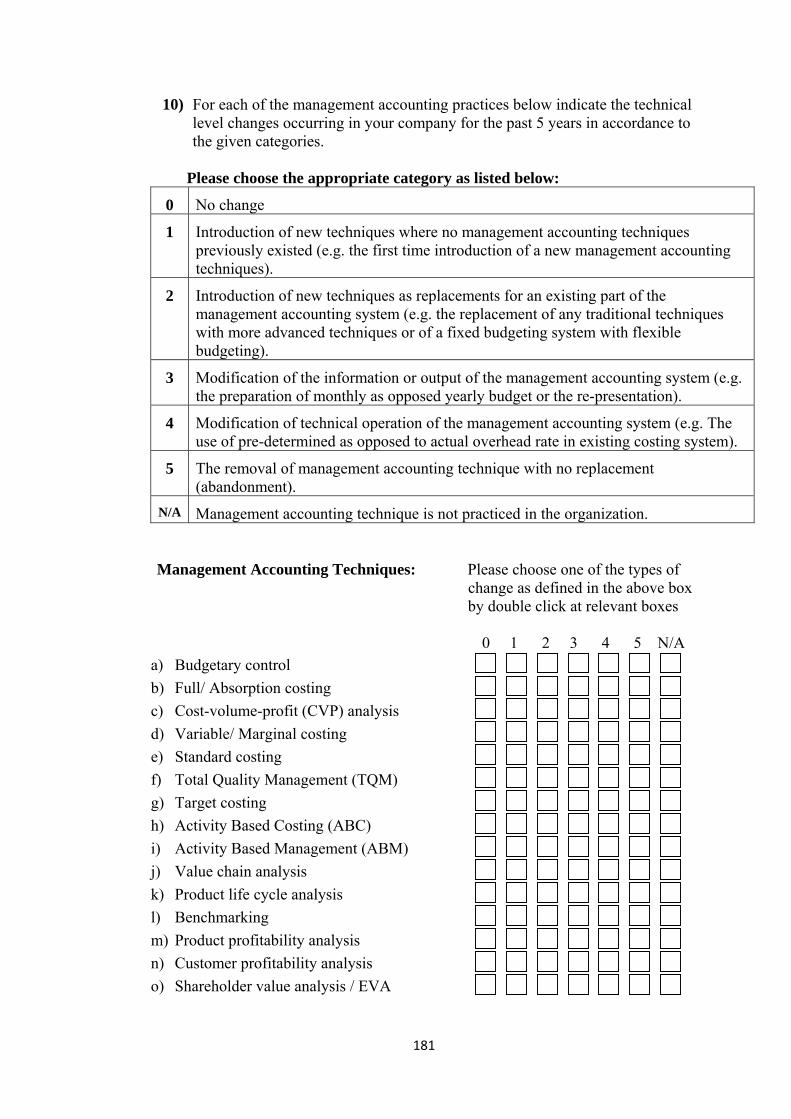
181
10) For each of the management accounting practices below indicate the technical level changes occurring in your company for the past 5 years in accordance to the given categories.
Please choose the appropriate category as listed below:
0 No change
1 Introduction of new techniques where no management accounting techniques previously existed (e.g. the first time introduction of a new management accounting techniques).
2 Introduction of new techniques as replacements for an existing part of the management accounting system (e.g. the replacement of any traditional techniques with more advanced techniques or of a fixed budgeting system with flexible budgeting).
3 Modification of the information or output of the management accounting system (e.g. the preparation of monthly as opposed yearly budget or the re-presentation).
4 Modification of technical operation of the management accounting system (e.g. The use of pre-determined as opposed to actual overhead rate in existing costing system).
5 The removal of management accounting technique with no replacement (abandonment).
N/A Management accounting technique is not practiced in the organization. Management Accounting Techniques: Please choose one of the types of change as defined in the above box by double click at relevant boxes
0 1 2 3 4 5 N/A
a) Budgetary control
b) Full/ Absorption costing
c) Cost-volume-profit (CVP) analysis
d) Variable/ Marginal costing
e) Standard costing
f) Total Quality Management (TQM)
g) Target costing
h) Activity Based Costing (ABC)
i) Activity Based Management (ABM)
j) Value chain analysis
k) Product life cycle analysis
l) Benchmarking
m) Product profitability analysis
n) Customer profitability analysis
o) Shareholder value analysis / EVA

182
SECTION E This section seeks information on changes in your company’s performance over the past five years (2003-2007 inclusive). 11) Please compare the change of your business unit's performance with that of its
competitors over the past 5 years. Please choose your response on a scale of -5 to +5, or N/A if the items are not applicable in your organization.
Organizational Performance: Significantly lower Significantly higher performance than performance than competitors competitors
-5 -4 -3 -2 -1 0 1 2 3 4 5 N/A
a) Operating income
b) Sales growth
c) Return on investment
d) Cash flow from operations
e) Market share
f) Market development
g) New product development
h) Research and development (R&D)
i) Cost reduction programs/cost control
j) Personnel development
k) Workplace relations
l) Employee health and safety

183
12) Please indicate the extent to which the following performance indicators are important to your business unit. Please choose your response on a scale of 1 to 5, or N/A if the items are not applicable in your organization.
Organizational Performance: No Extremely Importance important
1 2 3 4 5 N/A
a) Operating income
b) Sales growth
c) Return on investment
d) Cash flow from operations
e) Market share
f) Market development
g) New product development
h) Research and development (R&D)
i) Cost reduction programs/ cost control
j) Personnel development
k) Workplace relations
l) Employee health and safety
If you have any comments or suggestion on the questionnaire, please provide it on the space below: COMMENTS/SUGGESTIONS:
1)
2)
3)
4)
5)
“End of questionnaire”
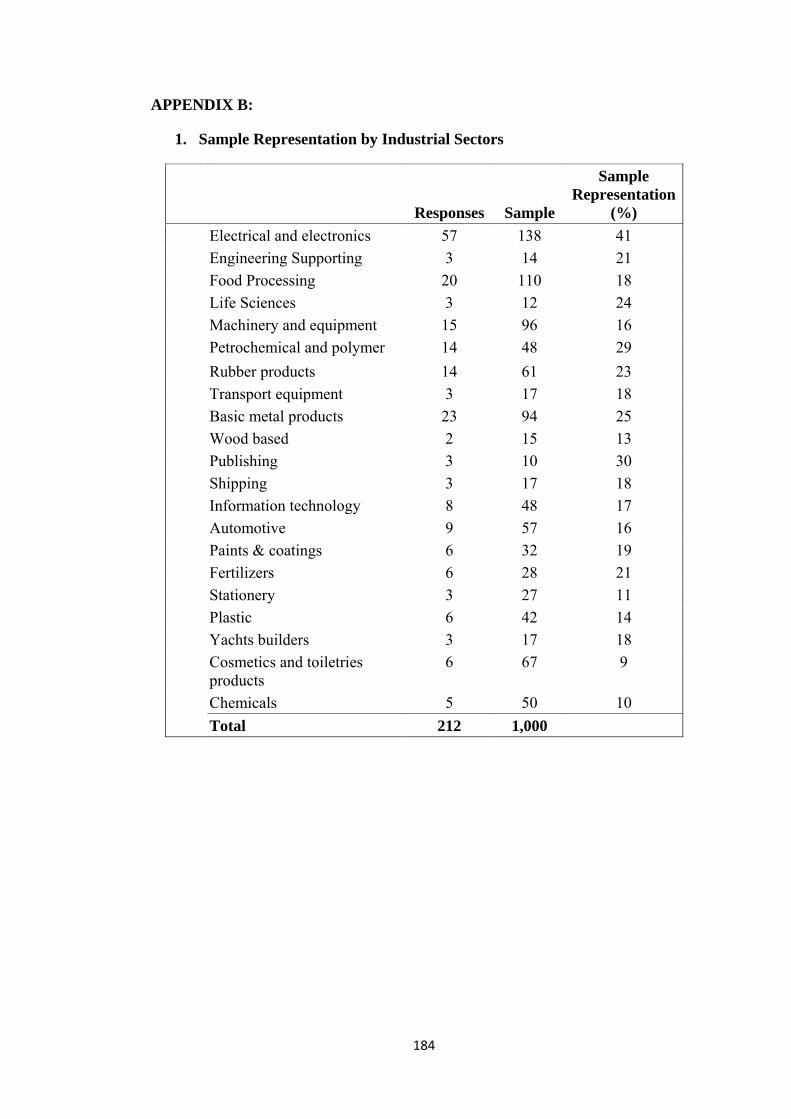
184
APPENDIX B:
1. Sample Representation by Industrial Sectors
Responses Sample
Sample Representation
(%)
Electrical and electronics 57 138 41
Engineering Supporting 3 14 21
Food Processing 20 110 18
Life Sciences 3 12 24
Machinery and equipment 15 96 16
Petrochemical and polymer 14 48 29
Rubber products 14 61 23
Transport equipment 3 17 18
Basic metal products 23 94 25
Wood based 2 15 13
Publishing 3 10 30
Shipping 3 17 18
Information technology 8 48 17
Automotive 9 57 16
Paints & coatings 6 32 19
Fertilizers 6 28 21
Stationery 3 27 11
Plastic 6 42 14
Yachts builders 3 17 18
Cosmetics and toiletries products
6 67 9
Chemicals 5 50 10
Total 212 1,000

185
2. Demographic Statistics
Frequency Percentage Type of Companies:
Local Foreign Total
139 73 212
68 32 100
Type of Product: Consumer Industrial Both Total
84 108 20 212
40 51 9
100
Number of Employees: Less than 50 50 – 150 151 – 500 501 – 1,000 More than 1,000 Total
25 102 34 21 30 212
12 48 16 10 14 100

186
APPENDIX C: Normality Test for Main Variables
(Skewness and Kurtosis)
Competitive Environment
Advanced Manufacturing Technologies
Organizational Structures
List of Constructs and Measures Skewness Kurtosis 7. Competitors action 8. Marketing/distribution channels
competition 9. Competition for markets/revenue share 10. No. Of competitors in market segments 11. Price competition 12. Competition for new product
development
-0.83 -0.32
-0.90 -1.21 -1.56 -1.75
0.30 -0.74
0.54 2.39 0.86 5.32
Variables Skewness Kurtosis 12. Computer aided process planning (CAPP) 13. Computer aided engineering (CAE) 14. Computer aided design (CAD) 15. Computer aided manufacturing system
(CAM) 16. Computer integrated manufacturing
(CIM) 17. Testing machines 18. Numerical control 19. Just-in-time 20. Robotics 21. Flexible manufacturing system (FMS) 22. Direct numerical control
-1.13 -0.99 -1.01 -0.87
-1.05
-0.57 -0.77 -0.53 -1.05 -0.41 -0.19
2.29 2.56 1.80 1.50
2.19
0.04 2.00 1.31 3.22 1.16 1.82
List of Constructs and Measures Skewness Kurtosis 10. Manufacturing cells 11. Work-based teams 12. Employee empowerment 13. Flattening of formal organizational
structures 14. Multi-skilling of workforce 15. Worker training 16. Management training 17. Cross-functional teams 18. Establishing participative culture
0.04 -0.31 -1.17 -0.16
-1.26 -1.08 -0.96 -0.67 -0.14
-0.55 -0.68 2.99 -0.81
3.71 1.32 1.22 0.05 -0.57

187
Organizational Strategy
Management Accounting Practices
Performance
Variables Skewness Kurtosis 9. Make changes in design & introduce
quickly 10. Customize products & services to
customer need 11. Product availability (broad distribution) 12. Provide effective after sales service &
support 13. Make rapid volume/product mix changes 14. Provide on time delivery 15. Provide high quality products 16. Make dependable delivery promise
-0.93
-0.77
-0.76 -1.47
-0.41 -0.85 -1.08 -0.82
1.85
1.02
1.41 3.67
-0.13 -0.24 0.39 0.05
Variables Skewness Kurtosis 16. Standard costing 17. Product life cycle analysis 18. Value chain analysis 19. Target Costing 20. Benchmarking 21. TQM 22. Full/Absorption Costing 23. Product profitability analysis 24. Budgetary control 25. Shareholder value analysis 26. Customer profitability analysis 27. CVP analysis 28. Activity Based Costing (ABC) 29. Activity Based Management (ABM) 30. Variable/marginal costing
-0.42 -0.37 -0.26 -0.27 -0.08 -0.49 -0.65 -0.87 -1.01 -1.35 -0.84 -0.71 -0.20 -0.06 -0.66
-0.70 0.69 -0.21 0.42 -0.69 -0.24 1.45 1.03 -0.13 4.79 0.30 0.72 0.14 0.22 0.07
Variables Skewness Kurtosis 13. Operating income 14. Cash flow from operations 15. Sales growth 16. Market share 17. Return on investment 18. Personnel development 19. Employee health and safety 20. Workplace relations 21. Cost reduction programs/ cost control 22. Research and development (R&D) 23. New product development 24. Market development
-0.41 -0.32 -0.31 0.04 0.32 -0.23 -0.03 -0.07 -0.28 -0.08 -0.11 -0.06
-0.33 -0.09 -0.70 -0.63 -0.32 -0.25 -0.74 -0.55 -0.60 -0.75 -0.32 -0.55

188
APPENDIX D: SEM Output Number of Input Variables = 6 Number of Y-Variables = 4 Number of X-Variables = 2 Number of ETA-Variables = 4 Number of KSI-Variables = 2 Number of Observations = 212 Covariance Matrix Structure Strategy MAP Performance Competition AMT Structure Strategy MAP Performance Competitive AMT
1.13 0.84 0.70 4.66 0.54 0.42
1.35 0.92 5.40 0.71 0.38
1.24 5.40 0.48 0.35
69.23 2.81 2.14
1.27 0.31
1.57
Parameter Specifications: BETA
Structure Strategy MAP Performance Structure Strategy MAP Performance
0 0 3 5
0 0 4 6
1 2 0 7
0 0 0 0
GAMMA
Competition AMT Structure Strategy MAP Performance
0 8 0 0
0 9 10 0
PHI
Competition AMT Competition AMT
11 12
13
PSI
Structure Strategy MAP Performance 14 15 16 17

189
LISREL Estimates (Maximum Likelihood): BETA Structure Strategy MAP Performance Structure Strategy MAP Performance
- -
1.04 (0.27) 3.88
1.81
(0.60) 3.00
- -
1.22 (0.15) 7.95
1.83
(0.63) 2.91
0.98 (0.12) 8.09
0.09
(0.13) 0.64
-
1.54 (0.59) 2.61
- - - -
GAMMA
Competition AMT Structure Strategy MAP Performance
-
0.50 (0.07) 7.04
- -
-
0.13 (0.06) 2.25
0.20
(0.08) 2.47
-
PHI
Competition AMT Competition AMT
1.27 (0.12) 10.22
0.31
(0.10) 3.07
-
1.57 (0.15) 10.22
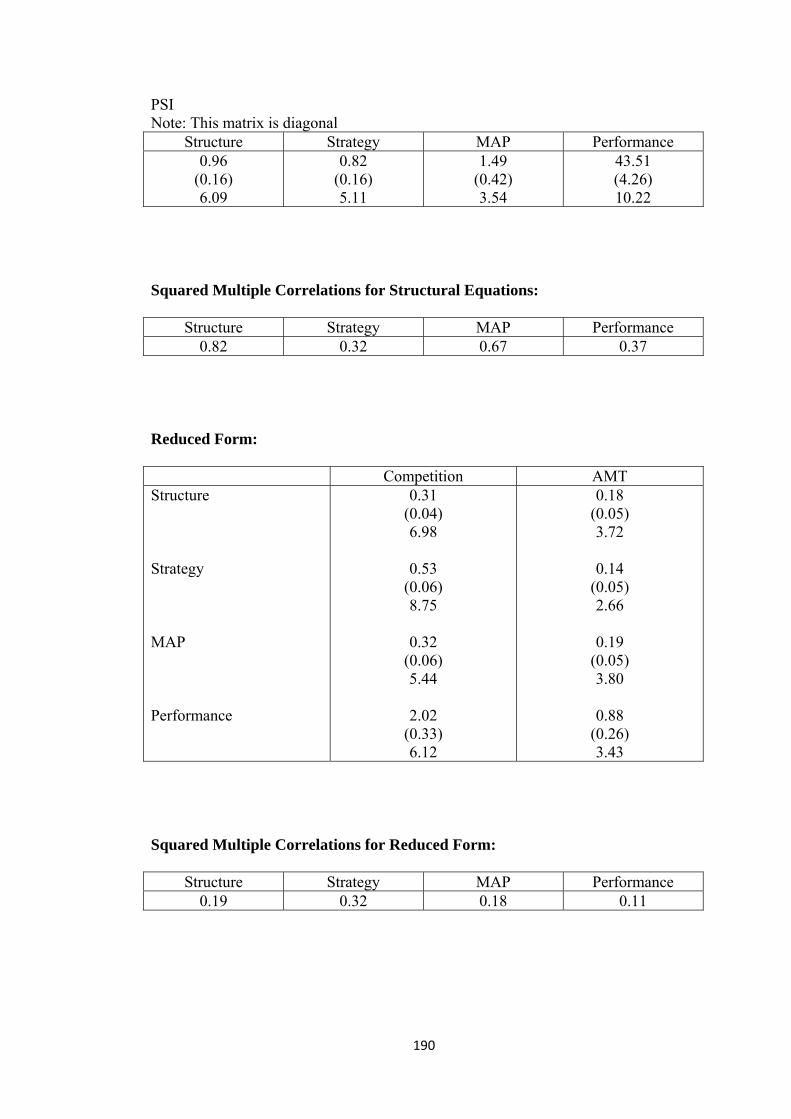
190
PSI Note: This matrix is diagonal
Structure Strategy MAP Performance 0.96
(0.16) 6.09
0.82 (0.16) 5.11
1.49 (0.42) 3.54
43.51 (4.26) 10.22
Squared Multiple Correlations for Structural Equations:
Structure Strategy MAP Performance 0.82 0.32 0.67 0.37
Reduced Form:
Competition AMT Structure Strategy MAP Performance
0.31 (0.04) 6.98
0.53
(0.06) 8.75
0.32
(0.06) 5.44
2.02
(0.33) 6.12
0.18 (0.05) 3.72
0.14
(0.05) 2.66
0.19
(0.05) 3.80
0.88
(0.26) 3.43
Squared Multiple Correlations for Reduced Form:
Structure Strategy MAP Performance 0.19 0.32 0.18 0.11