management’s discussion & analysis of financial condition ...€¦ · 1 management’s...
TRANSCRIPT

1
Management’s Discussion & Analysis of Financial Condition and Results of Operations For the fiscal year ended March 31, 2007 Dated May 16, 2007 The following is our discussion and analysis of the financial condition and results of operations for British Columbia Ferry Services Inc. as of May 16, 2007. This should be read in conjunction with our audited consolidated financial statements and related notes for the years ended March 31, 2007 (fiscal 2007) and March 31, 2006 (fiscal 2006). This management’s discussion and analysis has been prepared based on information available at May 16, 2007, except where otherwise indicated. These documents are available on SEDAR at www.sedar.com. Except where indicated, all financial information herein is expressed in Canadian dollars and determined on the basis of Canadian generally accepted accounting principles. BUSINESS OVERVIEW British Columbia Ferry Services Inc. is an independent company providing ferry services on the west coast of British Columbia. We operate one of the largest and most complex ferry systems in the world, providing frequent year-round transportation service on 25 routes, supported by 36 vessels and 47 terminals. Our service is an integral part of British Columbia’s coastal transportation system, and has been designated by the Province of British Columbia (the “Province”) as an essential service for purposes of the provincial Labour Relations Code. This designation means our services are considered necessary for the protection of the health, safety and welfare of the residents of BC. We are a versatile company, providing a wide range of ferry services for our customers. In fiscal 2007, we provided over 188,000 sailings, carrying over 21 million passengers and 8 million vehicles. Significant events during or subsequent to fiscal 2007: New Vessels (See “Investing in our Capital Assets” below for more detail) • In April 2007, the first of three Super C-class vessels, the Coastal Renaissance, was
launched. Construction of the Coastal Inspiration commenced in November 2006 while construction of the Coastal Celebration began in April 2007. These vessels will be the largest double-ended ferries in the world, with each vessel measuring 160-metres in length and having a capacity of 1,650 passengers and 370 vehicles. These new ships will replace aging vessels which currently provide service on our major routes. The Coastal Renaissance is expected to be in service in early 2008 while delivery of the other two Super C-class vessels is expected in early and mid 2008, respectively. The total project budget for the three vessels is $542 million.
• In March 2007 a new addition to our fleet, the Kuper, went into service on our smaller island routes. The total cost of this 32-vehicle ferry was $12 million.
• In March 2007, the Northern Adventure went into service on our northern routes. This vessel, measuring 117-metres in length, has 74 state rooms and will accommodate over 600 passengers and 101 vehicles. The total project budget for the acquisition and modification of the Northern Adventure is $102 million.
• In December 2006, the keel was laid for a new intermediate class ferry. This new vessel will allow for the retirement of the 47-year-old Queen of Tsawwassen. Once complete, the vessel will measure 100-metres in length and have a capacity of 600 passengers and 125 vehicles. The total project budget for this new vessel is $57 million. The vessel is expected to be in service by the summer of 2008.
2
• In August 2006, we signed a $133 million contract with Flensburger Schiffbau-Gesellschaft (“FSG”) of Germany to build the Northern Expedition to replace the 41-year-old Queen of Prince Rupert, operating on our northern routes. This 150-metre vessel, which is expected to be in service in the spring of 2009, will have 55 staterooms and will accommodate 130 vehicles and 600 passengers. The total project budget for this vessel is $200 million.
Other items: • In March 2007 and after more than three years of negotiation, mediation and finally,
arbitration, a new collective agreement with our employees was finalized and the term extended. The final award included a $1,000 lump sum payment to employees and wage increases for the next three years, and provides a basis for enhanced operational flexibility. See “Expenses – Year to Year Comparison of Expenses 2007-2006” below for more detail.
• In March 2007, the Commissioner released the preliminary price caps for the second performance term. In his preliminary decision, the Commissioner indicated that the price cap increase on April 1, 2008 will be 5.4% on the major routes and 3.6% on the other routes. See “Corporate Structure – Coastal Ferry Services Contract” for more detail.
• In March 2007, we closed a $250 million senior secured bond issue by private placement. The net proceeds will be used primarily to repay our credit facility, to fund capital expenditures and for general corporate purposes. See “Long-Term Debt” below for more detail.
• In March 2007, a fiscal 2007 ferry service fee reduction of $0.9 million was negotiated with the Province relating to the summer replacement service on our northern routes following the loss of the Queen of the North. In addition, the Province committed to a one-time $7.0 million additional service fee to be applied to fuel cost deferral accounts as at March 31, 2007.
• In January 2007, we received the final report from the independent review of our safety policies, procedures and practices. The report makes 41 recommendations on safety enhancements which we are implementing. See “Risk Management” below for more detail.
• In March 2006, the Queen of the North, operating on its regular route from Prince Rupert to Port Hardy, ran aground on Gil Island in Wright Sound and subsequently sank in 425 metres of water. Our divisional inquiry, released March 26, 2007, concluded that human factors were the primary cause of the incident but noted that the activities on the bridge during the last fourteen minutes before the grounding were unknown. Subsequently, additional information has been obtained and our divisional inquiry has been reconvened. The Transportation Safety Board and the RCMP investigations are ongoing. See “Northern Service” below for further detail.
CORPORATE STRUCTURE Coastal Ferry Services Contract We operate ferry services under a regulatory regime as defined by the Coastal Ferry Act, and under the terms set out in the Coastal Ferry Services Contract. This 60-year services contract with the Province, which commenced April 1, 2003, stipulates the number of round trips that must be provided for each regulated ferry service route in exchange for specified fees. In anticipation of the deployment of new vessels on our northern routes, higher ferry service fees have been negotiated with the Province for fiscal 2008, the final year of the first performance term of the contract. See “Northern Service” below for further detail. The Coastal Ferry Services Contract also includes fees for the provision of specific social program services delivered on behalf of the Province.

3
In March 2007, the Commissioner released the preliminary price caps for the second performance term covering fiscal 2009 through fiscal 2012. In his preliminary decision, the Commissioner indicated that the price cap increases on April 1, 2008, will be 5.4% on the major routes and 3.6% on the other routes. Subsequent annual changes in the price caps will depend on inflation. On each April 1 for the subsequent three years, the increase would be 2.0% plus CPI times .5 on the major routes and 5.2% plus CPI times .73 on all other designated routes. We are currently in negotiations with the Province on revisions to the Coastal Ferry Services Contract for the second performance term. The results of these negotiations will be provided to the Commissioner by June 30, 2007. The Commissioner will then provide the final decision on price caps for the second performance term by September 30, 2007. Under the terms of the Coastal Ferry Services Contract, we also receive an annual amount from the Province based on its agreement with the Government of Canada to fulfill the obligation of providing ferry services to coastal British Columbia. The amount of this payment is adjusted annually based on the Vancouver Consumer Price Index. Economic Regulatory Environment The office of the British Columbia Ferries Commissioner (the “Commissioner”) was created under the Coastal Ferry Act, enacted by the Province on April 1, 2003. The Commissioner regulates price caps for designated ferry route groups which, to the end of the first performance term, are specified in the Coastal Ferry Act. The Commissioner is also responsible for regulating the reduction of service, discontinuance of routes and certain other matters. The Coastal Ferry Act requires the Commissioner to undertake regulation in accordance with several principles, including placing priority on the financial sustainability of ferry operators, encouraging ferry operators to adopt a commercial approach to ferry service delivery and moving over time to a greater reliance on a user pay system. FINANCIAL AND OPERATIONAL OVERVIEW This section provides an overview of our financial and operational performance over the past three fiscal years.
Year ended March 31 ($millions) 2007 2006 2005
Total revenue 596.3 579.2 564.5 % Growth 3.0% 2.6% 5.8% Expenses (528.4) (504.1) (499.5) Earnings from operations 67.9 75.1 65.0 Interest and other (19.1) (25.2) (25.2) Net earnings before extraordinary gain 48.8 49.9 39.8 Extraordinary gain 61.3 - - Net earnings 110.1 49.9 39.8
As at March 31 2007 2006 2005 Total assets 1,215.8 833.7 763.4 Total long-term financial liabilities 766.3 516.5 516.6 Cash dividends 6.0 6.0 6.0
Our consolidated net earnings before extraordinary gain in fiscal 2007 were $1.1 million or 2.2% lower than the previous fiscal year. Our earnings in fiscal 2006 grew $10.1 million or 25.4% from fiscal 2005.
The extraordinary gain of $61.3 million in fiscal 2007 is as a result of insurance proceeds resulting from the loss of the Queen of the North as described below.

4
Northern Service On March 22, 2006 the Queen of the North, operating on its regular route from Prince Rupert to Port Hardy, ran aground on Gil Island in Wright Sound and subsequently sank. Two passengers remain unaccounted for and are presumed to have perished. An emergency environmental plan was implemented in conjunction with external authorities, including members of the Regional Environmental Emergency Team (“REET”). Burrard Clean Operations, under contract to us, led the containment activities at the incident site using 1,800 metres of barrier boom to protect sensitive areas. We have been monitoring the incident site for leakage of oil and, in consultation with REET, completed an extensive monitoring program. This has determined that the level of contaminants is very low in edible organisms, including shellfish, in the area of the wreck and that there is no risk for human consumption. In conjunction with our commercial insurer, we have investigated the feasibility and risk of recovering any fuel and lubricants that may remain in the vessel. We have provided the results of these investigations, along with various environmental studies, to the Canadian Coast Guard (“CCG”), which has engaged additional experts to extend its analysis of the issues. The CCG conclusions are that a significant amount of the fuel and lubricants were released following the incident, that a recovery operation would be exploratory at best, and it is probable that there is no recoverable fuel remaining on the vessel. As a result, we have determined not to pursue fuel and lubricant recovery from the incident site. We will continue to monitor the site for leakage of oil. The Transportation Safety Board, as the lead investigation agency, along with Transport Canada and the RCMP, are conducting independent investigations related to the sinking. Our divisional inquiry, released March 26, 2007, concluded that human factors were the primary cause of the incident but noted that the activities on the bridge during the last fourteen minutes before the grounding were unknown. The divisional inquiry report also made 31 recommendations on equipment, bridge team, and emergency and evacuation procedures. Some of these recommendations have already been implemented and the remainder are in progress. Subsequently, additional information has been obtained and our divisional inquiry has been reconvened. The Transportation Safety Board and the RCMP investigations are ongoing. A tug and barge service, as well as air service, was used as an interim measure to ensure that supplies reached the Queen Charlotte Islands and passengers requiring passage were accommodated. For the busy summer period, we augmented service provided by the Queen of Prince Rupert with additional tug and barge and air service. We maintain commercial insurance coverage for incidents of this nature. Insurance proceeds, net of deductible, of $67.9 million were received in May 2006 in settlement of the claim under the hull and machinery policy. In accordance with generally accepted accounting principles, $6.6 million of the insurance proceeds were recorded as a receivable to offset insurable losses in fiscal 2006. We reported an extraordinary gain of $61.3 million for this event in the first quarter of fiscal 2007. These funds are being utilized to partially fund the acquisition of the Northern Adventure. Claims for personal belongings of passengers and passenger automobiles are substantially complete. Other types of claims are still in progress. We expect that substantially all passenger claims, claims from other parties and costs incurred for environmental containment or cleanup will be paid by our liability insurer. Our hull and machinery insurance policies were subsequently renewed with an increase in annual premium costs of approximately $1.5 million. This was more than offset this year by $3.2 million of interest income earned and avoided interest costs on invested insurance proceeds. We have recorded a liability at March 31, 2007 to reflect the requirement to repay the Province $0.9 million representing the negotiated reduction in ferry service fees regarding the lower level of summer replacement service we provided.

5
In March 2007, the Northern Adventure, a replacement for the Queen of the North, went into service on our northern routes. The two-year-old vessel was purchased in October 2006 and underwent significant modifications to update safety and security equipment, modify the stern to be compatible with our existing berths, upgrade electrical, heating and lighting systems and upgrade customer amenities. This 117-metre vessel has 74 state rooms and will accommodate over 600 passengers and 101 vehicles. See “Investing in our Capital Assets” below for more detail. In August 2006, we signed a $133 million contract with FSG to build the Northern Expedition to replace the 41-year-old Queen of Prince Rupert, operating on our northern routes. This 150-metre vessel, which is expected to be in service in the spring of 2009, will have 55 staterooms and will accommodate 130 vehicles and 600 passengers. See “Investing in our Capital Assets” below for more detail. Negotiations with the Province have concluded, resulting in increases to future service fees to support the deployment of these two vessels on the northern routes. Service fees will increase by approximately $13 million commencing in fiscal 2008, with a further increase of approximately $22 million annually upon the entry into service of the Northern Expedition. We anticipate a third replacement vessel for the northern service will be acquired and commence operating during our next performance term. Negotiations with the Provincial government for increased service fees with respect to this vessel are ongoing. Revenue Our total revenues have increased steadily over the past three fiscal years, as shown in the table below.
Revenue ($millions) Year ended March 31 2007 2006 2005 Direct Route Revenue Tariff - vehicles 227.3 221.5 216.5 Tariff - passengers 135.9 132.1 129.4 Social program fees 16.0 14.7 13.4 Catering & on-board 71.0 66.9 65.9 Other revenue 23.5 21.0 17.2 Total Direct Route Revenue 473.7 456.2 442.4 Indirect Route Revenue Ferry services fees 92.4 93.5 93.6 Federal-Provincial subsidy 25.3 24.9 24.3 Total Route Revenue 591.4 574.6 560.3 Other general revenue 4.9 4.6 4.2 Total Revenue 596.3 579.2 564.5
Our largest revenue source is vehicle and passenger tariffs. The annual average tariff rate increase was 2.8% on our three major routes and 4.4% on the remaining routes, as permitted by the Coastal Ferry Act. From time to time we utilize promotional fare reductions designed to stimulate growth in traffic levels or shift traffic away from our busiest sailings.

6
The greatest portion of our revenues, 61%, is earned on our three major routes connecting Vancouver Island to the lower mainland and Vancouver and is entirely direct revenue from customers and related social program fees. The revenue from the other routes makes up 38% while other general revenue consisting of marketing rights, advertising revenues, interest earned and net foreign exchange gains, is only 1% of the total revenue. The revenue from our other routes consists of 19% from customers and related social program fees, 15% from ferry service fees and 4% from payments under the Federal-Provincial subsidy agreement. Year to year changes for the past two fiscal years for major and other routes are discussed separately below. Year to Year Comparison of Revenues 2007 – 2006 Major Routes
Direct Route Revenue Fiscal year ended March 31 ($000's) 2007 2006 Increase (Decrease) Vehicle traffic (volume) 3,826,459 3,790,368 36,091 1.0% Vehicle tariff 171,998 167,451 4,547 2.7% Passenger traffic (volume) 11,146,311 11,055,858 90,453 0.8% Passenger tariff 101,300 97,029 4,271 4.4%
Social program fees 8,284 7,789 495 6.4% Catering & on-board 59,009 54,516 4,493 8.2% Reservation fees 12,389 11,581 808 7.0% Parking 2,864 2,621 243 9.3% Assured loading 2,075 1,544 531 34.4% Other revenue 4,058 2,728 1,330 48.8% Total Direct Route Revenue 361,977 345,259 16,718 4.8%
Retail gross margin 35,536 32,415 3,121 9.6%
Vehicle traffic and passenger traffic increased marginally. The increase in average tariff per vehicle was $0.77 while the increase in average tariff per passenger was $0.31. The increased traffic and higher average fares resulted in a total increase of $8.8 million in tariff revenue. Social program fees are reimbursements from the Province of discounts provided on fares for BC seniors, students traveling to and from school, persons with disabilities and persons traveling under the medical Travel Assistance Program. These fees have increased as a result of higher program usage and higher fares.
61%
1%
4%
19%
15%
38%

7
All of our vessels that provide service on our major routes have a gift shop and options for food service. Food sales increased $3.1 million as a result of higher spending per passenger and the higher number of passengers carried. Gift shop sales increased $0.9 million with significant improvements in sales of books, clothing and giftware. Eighty percent of the book titles we carry are BC related. We introduced new apparel and gift products which have met with success. We have been able to achieve higher sales while increasing margins. Fees for reservations, parking commissions and surcharges from assured loading ticket sales are also showing a marked increase as a result of both increased prices and increased usage. In May 2005 we ceased sales of paper assured loading tickets and implemented the Coast Card1. A $3.1 million reduction of our deferred revenue liability relating to historical sales of paper tickets was made in fiscal 2007 ($2.0 million in fiscal 2006) and is included in other customer revenue in the above table. Other Routes
Direct Route Revenue Fiscal year ended March 31
($000's) 2007 2006 Increase (Decrease) Vehicle traffic (volume) 4,695,456 4,752,901 (57,445) (1.2%) Vehicle tariff 55,313 54,035 1,278 2.4%
Passenger traffic (volume) 10,518,642 10,673,745 (155,103) (1.5%) Passenger tariff 34,617 35,110 (493) (1.4%)
Social program fees 7,683 6,885 798 11.6% Catering & on-board 11,997 12,442 (445) (3.6%) Reservation fees 1,257 1,062 195 18.4% Stateroom rental 367 1,024 (657) (64.2%) Parking 217 174 43 24.7% Other revenue 302 276 26 9.4%
Total Direct Route Revenue 111,753 111,008 745 0.7%
Indirect Route Revenue Ferry service fees 92,429 93,549 (1,120) (1.2%) Federal-Provincial subsidy 25,309 24,890 419 1.7%
Total Route Revenue 229,491 229,447 44 0.0%
Retail gross margin 7,244 7,566 (322) (4.3%)
Our other routes consist of 22 regulated northern service and inter-island routes, and eight small non-regulated routes. One of the regulated routes, as well as all of the non-regulated routes, are operated under contract by alternative service providers. We receive fees from the Province for the provision of service on the non-regulated routes, which are included in the ferry service fees in the above table.
1 A plastic stored-value card with a magnetic strip, similar to a bank card. Assured loading tickets are offered on the card. In the future other services may be available through this card.

8
Twenty-one percent of the vehicle traffic decrease and 26.7% of the passenger traffic decrease is directly related to the loss of the Queen of the North. The negative effect on tariff revenue resulting from this incident is approximately $2.2 million in vehicle tariff revenue and $2.5 million in passenger tariff revenue.
The increase in average tariff per vehicle was $0.41 while the average passenger tariff did not change. The increased average vehicle fare, partially offset by the reduction in traffic levels on the northern and other routes limited the total tariff revenue increase to $0.8 million.
We receive ferry service fees for these routes under the Coastal Ferry Services Contract. The drop in fees reflects the negotiated reduction of $0.9 million resulting from the modified summer service we provided as a result of the loss of the Queen of the North.
Reimbursements from the Province for social program fees increased as a result of higher program usage and higher fares.
The loss of the regular northern service throughout the summer months resulted in a decrease in retail sales of approximately $1.2 million. This was partially offset by higher food sales per passenger on other routes and additional sales from an expanded gift shop on the Queen of Surrey, which operates between Horseshoe Bay and Langdale.
The drop in stateroom rental is also as a result of the modified service on the northern routes over the summer months. Gross margin is 4.3% lower mainly due to higher costs on our northern routes.
Fees for reservations, parking commissions and other revenue have shown a marked percentage increase, despite the limited northern service during the summer months.
Year to Year Comparison of Revenues 2006 – 2005 Major Routes
Direct Route Revenue Fiscal year ended March 31 ($000's) 2006 2005 Increase (Decrease) Vehicle traffic (volume) 3,790,368 3,808,843 (18,475) (0.5%) Vehicle tariff 167,451 164,043 3,408 2.1%
Passenger traffic (volume) 11,055,858 11,222,356 (166,498) (1.5%) Passenger tariff 97,029 95,558 1,471 1.5%
Social program fees 7,789 7,259 530 7.3% Catering & on-board 54,516 54,098 418 0.8% Reservation fees 11,581 10,349 1,232 11.9% Parking 2,621 2,477 144 5.8% Assured loading 1,544 1,103 441 40.0% Other revenue 2,728 992 1,736 175.0% Total Direct Route Revenue 345,259 335,879 9,380 2.8%
Retail gross margin 32,415 32,255 163 0.5%
Vehicle and passenger traffic both decreased marginally. A portion of the decrease is a result of timing of the Easter weekend. In fiscal 2005, we experienced two Easter weekends while fiscal 2006 did not include any. We also witnessed a decrease in the number of tour buses which we believe was related to a decline in tourism. This is more evident on our major routes which experience the greatest volatility from changes in tourism. The increase in average tariff per vehicle was $1.11 while the increase in average tariff per passenger was $0.26. Despite lower traffic levels, tariff revenues increased $4.9 million.

9
Reimbursements from the Province for social program fees increased as a result of higher program usage and higher fares. Retail revenue, which includes food and other retail merchandise sales, experienced growth which was partly attributed to the addition of the new Seawest Lounge on the Spirit of British Columbia. The increase in reservations fees reflects a higher number of reservations placed and a higher fee for booking within the week of travelling implemented in the third quarter of fiscal 2006. The increase in revenue from assured loading sales reflects both higher usage and higher fees. With the implementation of the Coast Card in May 2005, we ceased sales of paper assured loading tickets. A $2.0 million adjustment was made in fiscal 2006 reflecting the reassessment of the deferred revenue liability relating to historical sales of paper tickets and is included in other revenue in the above table. Other Routes
Direct Route Revenue Fiscal year ended March 31 ($000's) 2006 2005 Increase (Decrease) Vehicle traffic (volume) 4,752,901 4,748,539 4,362 0.1% Vehicle tariff 54,035 52,440 1,595 3.0%
Passenger traffic (volume) 10,673,745 10,804,187 (130,442) (1.2%) Passenger tariff 35,110 33,811 1,299 3.8%
Social program fees 6,885 6,154 731 11.9% Catering & on-board 12,442 11,814 628 5.3% Reservation fees 1,062 845 217 25.7% Stateroom rental 1,024 1,040 (16) (1.5%) Parking 174 172 2 1.2% Other revenue 276 205 71 34.6%
Total Direct Route Revenue 111,008 106,481 4,527 4.3%
Indirect Route Revenue Ferry service fees 93,549 93,558 (9) (0.0%) Federal-Provincial subsidy 24,890 24,343 547 2.2%
Total Route Revenue 229,447 224,382 5,065 2.3%
Retail gross margin 7,566 7,201 365 5.1%
Passenger traffic decreased marginally while vehicle traffic remained steady. The average increase in tariff per vehicle was $0.33 while the average passenger tariff increased $0.16 per passenger. The increased average fares, partially offset by the reduction in passenger traffic levels resulted in a total tariff revenue increase of $2.9 million. Reimbursements from the Province for social program fees increased as a result of higher tariffs and higher program usage. Retail sales increased mainly as a result of higher food sales per customer, partially offset by lower passenger traffic. The increase in reservations fees reflects higher usage and a higher fee for booking within the week of travelling implemented in the third quarter of fiscal 2006.

10
Expenses Expenses for the past three fiscal years are summarized in the table below.
Year ended March 31 Expenses ($millions) 2007 2006 2005 Operations 309.1 291.7 294.0 Maintenance 84.9 81.1 86.8 Administration 50.6 51.2 44.5
Total operations, maintenance & administration 444.6 424.0 425.3
% Increase (decrease) 4.9% (0.3%) 3.5% Cost of retail goods sold 28.3 27.0 26.5 Amortization 55.5 53.1 47.7
Total expenses 528.4 504.1 499.5 % Increase 4.8% 0.9% 3.7%
Interest and other (Gain) loss on foreign exchange (0.4) (0.2) 0.1 Interest expense 19.3 25.1 24.5 Loss on disposal of capital assets 0.2 0.3 0.6
Total interest and other 19.1 25.2 25.2
Fuel Deferral and Related Surcharge In September 2004, the British Columbia Ferries Commissioner issued an order authorizing us to maintain deferred fuel cost accounts to mitigate the effect on our earnings of volatility in fuel oil prices. The Commissioner established set prices for fuel oil for each of the years until March 31, 2008. At the start of each fiscal year in the first performance term, the set prices increase by the Consumer Price Index (Vancouver). The first such increase, effective April 1, 2005, was 2.0%. The Commissioner ordered an additional 5% increase in the set price per route group effective July 24, 2005. On April 1, 2006 our set prices increased a further 1.9%. On March 30, 2007, the Commissioner proposed the continued use of set prices for fuel oil for the second performance term. Differences in fuel costs arising from our actual price paid per litre being higher or lower than the unit set price are charged or credited to the deferred fuel cost accounts. Continuing high fuel costs have caused increases in the balances of the deferred fuel cost accounts. We filed applications with the British Columbia Ferries Commissioner under Section 42 of the Coastal Ferry Act requesting extraordinary price cap increases to allow for fuel surcharges in order to reduce or eliminate these balances. After receiving approval, we implemented fuel surcharges on July 25, 2005, February 1, 2006 and June 22, 2006. Proceeds from the fuel surcharges are credited against balances in the deferred fuel cost accounts. Under an agreement reached in March 2007, the Province made a one-time $7.0 million ferry service fee payment for fiscal 2007, that was applied against the deferred fuel cost accounts in accordance with the agreement. As a result, the balances in our deferred fuel cost accounts totalled $18.8 million at March 31, 2007 ($22.7 million at March 31, 2006). In the absence of this one-time payment, the balance of the deferred fuel cost accounts would have grown to $25.8 million.
11
The Commissioner has also set an efficiency target requiring us to reduce fuel consumption by 1% in fiscal 2007 and by an additional 1% in fiscal 2008. We filed our fuel savings plan with the Commissioner in June 2006. This plan is available on our website at www.bcferries.com.
During the year ended March 31, 2007, and after removing the impact of the loss of the Queen of the North, we bettered the fuel consumption target set by the Commissioner. We have decreased our annual consumption by over six million litres (5.1%) from the level of fuel consumed three years prior. We are continuing to implement a wide variety of fuel saving measures ranging from operating our vessels more efficiently to installing new, more fuel-efficient engines on some of our vessels and fuel monitoring systems on others. All of the Commissioner’s Orders can be viewed on the Commissioner’s website at www.bcferrycommission.com. Year to Year Comparison of Expenses 2007 – 2006 The $17.4 million increase in operations expenses reflecting: • $8.5 million increase in wages and benefits, including lump sum payments to employees
totalling $3.4 million, as a result of the arbitration award; $1.2 million in additional training costs (an increase in operational training from approximately 8,000 to approximately 11,000 person days); and wage rate increases of $6.7 million, partially offset by improved labour scheduling practices and as a result of reduced service on northern routes.
• $3.8 million increase in property tax expense. In fiscal 2006 we received a refund of $8.2 million in settlement of terminal property tax assessment appeals for 2004 and 2005;
• $2.6 million increase reflecting our renewed uniform program; and • $1.6 million net increase in marine insurance premiums. Maintenance expenses, which include expenditures for vessel refit and maintenance as well as terminal maintenance activities, were $3.8 million higher, reflecting our commitment to safety. Administration expenses decreased $0.6 million mainly as a result of a $2.2 million reduction in severance and restructuring costs, partially offset by a $1.5 million increase in data communications and telecommunication costs. Amortization increased a total of $2.4 million as a result of additional assets coming into service including $1.8 million reflecting the Queen of Surrey $37.2 million upgrade; Interest expenses decreased $5.8 million due to: • $4.0 million of additional interest capitalized reflecting our investment in fleet and
terminal revitalization plans; • $2.7 million increase in interest rate support recorded under the Structured Financing
Facility Program offered by the Government of Canada. A total of $9.9 million in support for the Queen of Oak Bay, Queen of Nanaimo and Queen of Surrey mid-life upgrades has been granted of which we have reflected $4.7 million ($2.0 million in fiscal 2006) as a decrease in bond interest costs and $0.5 million ($0.6 million in fiscal 2006) to offset interest costs previously capitalized on the upgrades. The remaining $2.1 million will be applied against future bond interest costs.
These decreases in interest expense were partially offset by an overall increase in our average level of debt and the effect of interest rates payable on the debt instruments issued and in place as described in the “Liquidity and Capital Resources” section below.
12
Year to Year Comparison of Expenses 2006 – 2005 The $2.3 million decrease in operations expenses reflects a $7.7 million net decrease in property tax expense primarily as a result of the settlement of our 2004 and 2005 terminal property assessment appeals. This reduction in property tax expense was partially offset by increases of:
• $3.6 million in wages and benefits; • $0.7 million in the total fuel costs due to a 7% increase in the set price as approved
by the British Columbia Ferries Commissioner, partially offset by efficiency savings; • $1.3 million in marine insurance; and • $1.2 million of costs not covered by third party insurance relating to the grounding
of the Queen of Oak Bay. In June 2005, the Queen of Oak Bay, which sails between Departure Bay and Horseshoe Bay, ran aground on its approach to Horseshoe Bay terminal.
Maintenance expenses were $5.7 million lower, mainly due to the higher maintenance costs incurred in fiscal 2005 for one-time costs required to meet Transport Canada requirements. Administration expenses increased $6.7 million, including: • $3.7 million for corporate information technology support for our many new initiatives
and upgrades to our computer systems; • $2.1 million resulting from our internal control certification project to document and test
the effectiveness of internal controls on which management is relying to support certifications required by the Canadian Securities Administrators; and
• $2.1 million costs for severance and restructuring. These increases were partially offset by administrative efficiencies. Amortization increased a total of $5.4 million as a result of additional assets coming into service including: • $1.7 million reflecting the Queen of Oak Bay $35.1 million upgrade; • $1.7 million reflecting new information technology including our Coast Card, our new
point of sale system, crew scheduling system and enterprise resource planning projects. Interest expenses increased $0.6 million reflecting the overall increase in our average level of debt and the effect of interest rates payable on the debt instruments issued and in place. Increases in debt costs were partially offset by interest rate support totalling $2.0 million recorded under the Structured Financing Facility Program for the Queen of Oak Bay and Queen of Nanaimo mid-life upgrades.
Liquidity and Capital Resources We fund our operations and capital acquisitions with cash flow generated from operations, as well as bank financing and debt issues. We expect operating cash flows to fund approximately one half of the capital expenditures over the next five years, with the balance funded by borrowings. Long-Term Debt In May 2004 we entered into a master trust indenture. This indenture established common security and a set of common covenants by us for the benefit of our lenders. Our financing plan encompasses an ongoing program capable of accommodating a variety of corporate debt instruments and borrowings ranking pari passu. We do not currently view common share equity as a potential source of capital and have no present intention of offering common shares to the public or other investors.
Under this indenture we completed two $250 million public offerings in fiscal 2005: a 5.74% Senior Secured Bonds, Series 04-1, due May 27, 2014 and a 6.25% Senior Secured Bonds, Series 04-4, due October 13, 2034. The net proceeds were used primarily to repay a portion of our indebtedness to the Province, to fund reserves required in connection with these bonds and for general corporate purposes. Interest on these bonds is payable semi-annually.

13
We also entered into a credit agreement with a syndicate of Canadian banks which is secured under the indenture. Under this agreement, we have available a five year revolving facility in the amount of $155 million which expires May 12, 2012, but is renewable annually under certain conditions. This replaced a one-year and a three-year revolving credit facility of $77.5 million each that we held at March 31, 2006. The revolving term facility is available for working capital purposes, to fund the upgrade and acquisition of vessels and terminal upgrades and other general corporate purposes. In fiscal 2006 we finalized two loan agreements with KfW, a German export credit bank. These agreements are secured under the Master Trust Indenture. The agreements allow us to borrow up to $90 million per loan, with the net proceeds to be used to finance the purchase of two of the three Super C-class vessels currently being built. These funds will not be advanced until the date upon which we accept delivery of the applicable vessel from the ship builder. The principal amount of each loan will be repaid over the twelve year term of the loan. In March 2007 we closed a $250 million senior secured bond issue, Series 07-1, due March 20, 2037. These private placement bonds will bear interest at 5.021%, payable semi-annually. The net proceeds will be used primarily to repay our credit facility, to fund capital expenditures and for general corporate purposes. Terminal Leases We entered into a master agreement with the British Columbia Transportation Financing Authority (“BCTFA”) effective March 31, 2003, as part of the restructuring of our Company. In return for the transfer of ownership interest in all ferry terminals from the former British Columbia Ferry Corporation to the BCTFA at the time of the corporate restructuring, we received recognition of prepayment of rent under terminal leases. The leases grant us exclusive access and use of ferry terminal properties for a period of 60 years commencing April 1, 2003. The leases are renewable for an additional period of 20 years at a total cost of $20 per lease if the Coastal Ferry Services Contract is renewed. We must manage, maintain and develop the terminals at our own cost. Since the original transfer, $5.1 million of additional lands at Horseshoe Bay and Swartz Bay were added to the existing terminal leases in exchange for highway improvements. If we fail to meet our obligations under the terminal leases or default under the Coastal Ferry Services Contract, the BCTFA may at its option re-enter and take possession of the ferry terminal properties and at its option terminate the leases. The BCTFA has entered into an acknowledgement agreement with the Bondholders’ Trustee which sets out certain limitations of the use of this option. In addition to the above, we have entered into a 40-year lease agreement with the Town of Sidney, BC to manage and develop an existing ferry terminal owned by the town. This terminal is the western end of a ferry route connecting Vancouver Island with Anacortes, WA. The route is operated by Washington State Ferries. Other Long-Term Liabilities Other long-term liabilities consist primarily of accrued post-retirement and post-employment benefits. Sources & Uses of Cash Our liquidity needs are met through a variety of sources, including cash generated from operations and borrowings under our credit facility. Our primary uses of funds are operational expenses, capital asset acquisitions and upgrades and interest payments on our long-term debt.

14
Sources and uses of cash and cash equivalents for fiscal years 2007 and 2006 are summarized in the table below. Year ended March 31 ($ millions) 2007 2006
Net income before extraordinary gain 48.8 49.9 Extraordinary gain 61.3 - Items not involving cash: Amortization 55.5 53.1 Other non-cash charges (1.9) 1.1 Regulatory costs deferred 3.9 (14.8) Change in operating working capital (7.1) 9.5 Cash provided by operating activities 160.5 98.8 Cash provided (used) by financing activities 266.7 (6.7) Cash used in investing activities (249.4) (131.3)
Total increase (decrease) in cash 177.8 (39.2)
In fiscal 2007, cash provided by operating activities includes a decrease in regulatory costs deferred of $3.9 million. This reduction is a result of $3.1 million net increase in deferred fuel costs being more than offset by the $7.0 million ferry service fee payment which was applied to the deferred fuel cost accounts. Cash provided by operating activities also includes an increase in non-cash working capital of $7.1 million. This increase was primarily due to: • $6.1 million decrease in GST payable reflecting an April 2006 payment of denied ITC
claims. Effective April 2, 2003, we became subject to GST but are limited in our ability to obtain input tax credits (“ITCs”) because certain of our services are exempt under the Excise Tax Act. In fiscal 2006, we reviewed the options available to us and filed an amended ITC claim for the period April 2, 2003 through June 30, 2005. Canada Revenue Agency (“CRA”) has completed an audit of our GST filings, including review of our amended claims. Although CRA determined the methods used in our revised filings to be generally fair and reasonable, they have denied us the ability to file the amended claim which totalled $3.2 million. In addition, CRA has taken the position that vessel fuel and lubricants used for propulsion supports only GST exempt lines of business resulting in denial of ITC claims of approximately $2.2 million for the period April 2, 2003 through March 31, 2006. In April 2006, we paid all amounts related to the denied ITC claims. However, we disagree with CRA’s interpretation of the law in this instance and are pursuing recovery through the appeal process;
• $5.7 million decrease in payables and accrued liabilities relating to refit and maintenance and other operating activities;
• $2.0 million decrease in deferred revenue resulting from a $3.1 million writedown of liability relating to historical sales of paper assured loading tickets, partially offset by an increase due to fiscal 2007 ticket sales;
15
The working capital increase was partially offset by: • $2.6 million increase in accrued employee liabilities, mainly related to time banks; • $2.2 million net decrease in accounts receivable consisting of receipt of $6.6 million
insurance proceeds resulting from the loss of the Queen of the North and $5.5 million in property tax refunds, partially offset by increases of:
o $6.2 million ferry service fee receivable; o $1.1 million GST receivable; o $1.0 million interest rate support receivable; o $0.9 million insurance claims receivable;
• $1.4 million decrease in inventory due to inventory level adjustments and strategic sourcing initiatives; and
• $0.5 million net change in other current assets and liabilities. Cash provided from financing activities reflects our new $250 million, Series 07-1 bond issue described above and the net change in short-term financing. Cash used in investing activities was primarily due to capital expenditures. The significant capital transactions during fiscal 2007 are described below in “Investing in Our Capital Assets”. Investing in our Capital Assets Capital expenditures in fiscal 2007 totalled $262.6 million. This level of expenditure reflects significant investments in our fleet, terminals and information systems to increase customer service and operating efficiency. Expenditures included: • $206.0 million in new vessels, vessel upgrades and modifications including:
• $99.1 million of a total budget of $102 million for the purchase and modification of the Northern Adventure;
• $25.4 million of the $38 million mid-life upgrade which includes safety, structural and mechanical improvements to the Queen of Alberni;
• $21.5 million of the $542 million Super C-class new vessel construction project; • $13.0 million of the $57 million project for the construction of a new intermediate
class vessel to replace the Queen of Tsawwassen; • $10.9 million of the completed $37 million mid-life upgrade which included safety,
structural and mechanical improvements to the Queen of Surrey; • $9.2 million of the $12 million completed reconstruction of the Kuper; • $8.7 million of the budgeted total of $24 million for the upgrade and replacement of
propulsion and safety equipment on the Quinsam, the Quinitsa and the Queen of Capilano;
• $7.4 million of the $200 million project for the construction of the new Northern Expedition;
• $38.0 million in marine structures at many of our terminals, including: • $11.4 million of a $16 million project to upgrade the berths at Departure Bay
terminal; • $7.0 million of a $12 million project to upgrade the berths at Horseshoe Bay
terminal; • $6.2 million of a $24 million completed project to construct a new berth at Swartz
Bay terminal; and • $3.7 million of the completed terminal modifications to accommodate the new
Northern Adventure; • $11.6 million in terminal and building upgrades and equipment, including $5.2 million at
Swartz Bay, $1.8 million at Departure Bay and $1.2 million at Alert Bay terminals. Over the next five years, we plan to invest $237 million in our terminals for building and marine structure upgrades; and
• $6.9 million in computer hardware and software development which will improve communications technology and enhance customer service in areas such as automated ticketing, retail and food service management and security of customer credit card information.
16
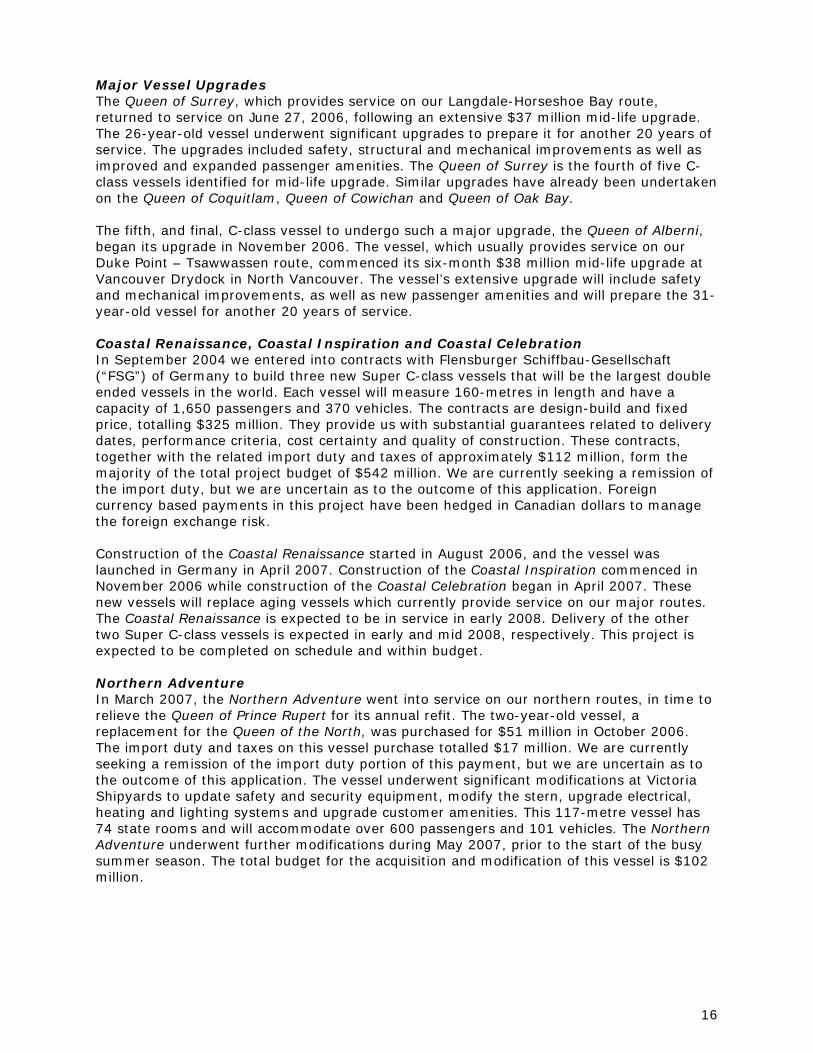
Major Vessel Upgrades The Queen of Surrey, which provides service on our Langdale-Horseshoe Bay route, returned to service on June 27, 2006, following an extensive $37 million mid-life upgrade. The 26-year-old vessel underwent significant upgrades to prepare it for another 20 years of service. The upgrades included safety, structural and mechanical improvements as well as improved and expanded passenger amenities. The Queen of Surrey is the fourth of five C-class vessels identified for mid-life upgrade. Similar upgrades have already been undertaken on the Queen of Coquitlam, Queen of Cowichan and Queen of Oak Bay. The fifth, and final, C-class vessel to undergo such a major upgrade, the Queen of Alberni, began its upgrade in November 2006. The vessel, which usually provides service on our Duke Point – Tsawwassen route, commenced its six-month $38 million mid-life upgrade at Vancouver Drydock in North Vancouver. The vessel’s extensive upgrade will include safety and mechanical improvements, as well as new passenger amenities and will prepare the 31-year-old vessel for another 20 years of service. Coastal Renaissance, Coastal Inspiration and Coastal Celebration In September 2004 we entered into contracts with Flensburger Schiffbau-Gesellschaft (“FSG”) of Germany to build three new Super C-class vessels that will be the largest double ended vessels in the world. Each vessel will measure 160-metres in length and have a capacity of 1,650 passengers and 370 vehicles. The contracts are design-build and fixed price, totalling $325 million. They provide us with substantial guarantees related to delivery dates, performance criteria, cost certainty and quality of construction. These contracts, together with the related import duty and taxes of approximately $112 million, form the majority of the total project budget of $542 million. We are currently seeking a remission of the import duty, but we are uncertain as to the outcome of this application. Foreign currency based payments in this project have been hedged in Canadian dollars to manage the foreign exchange risk. Construction of the Coastal Renaissance started in August 2006, and the vessel was launched in Germany in April 2007. Construction of the Coastal Inspiration commenced in November 2006 while construction of the Coastal Celebration began in April 2007. These new vessels will replace aging vessels which currently provide service on our major routes. The Coastal Renaissance is expected to be in service in early 2008. Delivery of the other two Super C-class vessels is expected in early and mid 2008, respectively. This project is expected to be completed on schedule and within budget. Northern Adventure In March 2007, the Northern Adventure went into service on our northern routes, in time to relieve the Queen of Prince Rupert for its annual refit. The two-year-old vessel, a replacement for the Queen of the North, was purchased for $51 million in October 2006. The import duty and taxes on this vessel purchase totalled $17 million. We are currently seeking a remission of the import duty portion of this payment, but we are uncertain as to the outcome of this application. The vessel underwent significant modifications at Victoria Shipyards to update safety and security equipment, modify the stern, upgrade electrical, heating and lighting systems and upgrade customer amenities. This 117-metre vessel has 74 state rooms and will accommodate over 600 passengers and 101 vehicles. The Northern Adventure underwent further modifications during May 2007, prior to the start of the busy summer season. The total budget for the acquisition and modification of this vessel is $102 million.

17
Northern Expedition Following a rigorous competitive bidding process, we signed a $133 million contract with Flensburger Schiffbau-Gesellschaft (“FSG”) of Germany to build a new vessel to replace the 41-year-old Queen of Prince Rupert, operating on our northern routes. The import duty and taxes on this contract will total approximately $43 million. We will be seeking a remission of the import duty, but we are uncertain as to the outcome of our future application. This design-build, fixed price contract (the majority of the total project budget of $200 million) provides us with substantial guarantees for delivery dates, performance criteria, cost certainty and quality of construction. Foreign currency based payments in this project have been hedged in Canadian dollars to manage the foreign exchange risk. This 150-metre vessel, which is expected to be in service in the spring of 2009, will have 55 staterooms and will accommodate 130 vehicles and 600 passengers.
New Intermediate Vessel In December 2006, the keel was laid for a new intermediate class ferry at Vancouver Shipyards in North Vancouver. The $45.5 million contract with Vancouver Shipyards constitutes the majority of the total project budget of $57 million. The new intermediate vessel will allow for the retirement of the 47-year-old Queen of Tsawwassen. Once complete, the vessel will measure 100-metres in length and have a capacity of 600 passengers and 125 vehicles. It will feature a new state-of-the-art lifesaving system as well as a variety of amenities including a comfortable lounge and snack bar for passengers to enjoy. The vessel is expected to be in service by the summer of 2008.
Kuper In March 2007 a new addition to our fleet, the Kuper, went into service on our smaller island routes. The hull of the new vessel is built from the original structure of the John Atlantic Burr, which we purchased in August 2005 from the State of Utah Transportation Department. The vessel was disassembled in Utah and rebuilt with significant upgrades at Allied Shipbuilders in North Vancouver. During the construction period, a new 11-foot wide longitudinal section was inserted into the hull to provide an additional lane on the vehicle deck. The project also included new lifesaving equipment, navigational equipment, piping and electrical system. The total cost of this 32-vehicle ferry was $12 million. The Kuper is the fourth and largest of our “K-class” vessels, joining the Kahloke, the Klitsa and the Kwuna.
Terminal Marine Structures As we reinvest in our terminal infrastructure and prepare for the arrival of the new Super C-class vessels, significant upgrades are underway at many of our terminals. In October 2006 we officially opened a new state-of-the-art berth at Swartz Bay terminal on Vancouver Island. This $24 million project was undertaken to replace the outdated counter-weighted ramp lift system and certain old marine structures and brings a new level of technology to our berthing arrangements for our largest vessels. The improved design of this new floating berth will speed up the loading and unloading process with fewer ramp adjustments as the ramp rises and falls with the tide. This berth is now able to accommodate our Spirit-class vessels and will also be able to service the new Super C-class vessels.
Modifications of marine structures are currently underway at Departure Bay and Horseshoe Bay terminals to accommodate the new Super-C vessels. These berth upgrades, expected to be complete in the fall of 2007, include new trestles, dolphins2 and catwalks.
Modifications were completed in March 2007 at Prince Rupert, Port Hardy, McLoughlin Bay and Skidegate terminals to accommodate the new Northern Adventure. The Northern Adventure is wider at the stern than our other northern service vessels. To enable stern loading and unloading, modifications to the terminal marine structures were necessary for access to berths for safe docking.
2 A cluster of pilings firmly fixed to the sea bed and used to assist vessels during docking.

18
Information Technology
In September 2006, we implemented an automated ticketing pilot project at our Tsawwassen and Swartz Bay terminals on our major routes. Foot passengers at these terminals now have the option of using the automated ticketing kiosks or a staffed ticket booth to purchase tickets. Passengers have the option to pay with either a debit or credit card at the kiosks. This project has been well received by our customers. In fiscal 2007 we incurred $0.5 million of the $1.3 million total project costs. We expect to proceed with implementing this technology at other locations in the near future.
We have also completed $3.0 million ($1.8 million in fiscal 2007) of a $4.5 million project to improve communication technology services, replace obsolete technology, reduce costs and manage growth as our business demands change. This project is expected to improve ship-to-shore data communications and provide a more stable, secure and faster network.
Other ongoing projects include a new time collection system, enhanced reporting initiatives, enhanced crew scheduling system, and security projects. These projects focus on obtaining efficiencies, improving safety and security and providing better service to our customers. FOURTH QUARTER RESULTS This section provides an overview of our financial performance for the three months ended March 31, 2007 compared to the three months ended March 31, 2006.
The fourth quarter reflects a seasonal reduction in traffic levels which we utilize to perform upgrades and major maintenance and refit programs as well as to undertake mandatory inspections on the majority of our vessels. Three Months Ended March 31 Variance ($ millions) 2007 2006 $ %
Total revenue 119.0 109.7 9.3 8.5% Expenses 146.7 128.4 (18.3) (14.3%) Loss from operations (27.7) (18.7) (9.0) (48.1%) Interest and other 5.5 6.1 0.6 9.8% Net loss (33.2) (24.8) (8.4) (33.9%)
Revenue Our total revenues have increased as shown in the following table.
Revenue ($millions) Year ended March 31 Increase(Decrease) 2007 2006 $ % Direct Route Revenue Vehicle traffic (volume) 1,707,063 1,714,872 (7,809) (0.5%) Vehicle tariff 43.7 39.3 4.4 11.2%
Passenger traffic (volume) 4,034,986 4,060,218 (25,232) (0.6%) Passenger tariff 23.7 21.5 2.2 10.2% Social program fees 3.7 3.0 0.7 23.3% Catering & on-board 13.0 11.9 1.1 9.2% Other revenue 6.3 5.1 1.2 23.5% Total Direct Route Revenue 90.4 80.8 9.6 11.9% Indirect Route Revenue Ferry services fees 20.2 21.1 (0.9) (4.3%) Federal-Provincial subsidy 6.3 6.2 0.1 1.6% Total Route Revenue 116.9 108.1 8.8 8.1% Other general revenue 2.1 1.6 0.5 31.3% Total Revenue 119.0 109.7 9.3 8.5%

19
Higher average tariff rates and higher traffic volume on our major routes are partly offset by lower traffic volume on our other routes. Ferry service fees have been reduced to reflect a negotiated agreement to repay the Province $0.9 million in ferry service fees regarding the modified summer service we provided on our northern routes as a result of the loss of the Queen of the North. Other direct revenue has increased due to the inclusion of a $3.1 million ($2.0 million in fiscal 2006) write down of the deferred revenue liability relating to historical sales of paper assured loading tickets (“ALTs”). Sales of paper ALTs ceased in May, 2005 upon introduction of the Coast Card. Expenses Expenses are shown in the following table. Three months ended March 31 (Increase)Decrease ($ millions) 2007 2006 $ %
Operations 77.6 62.4 (15.2) (24.4%) Maintenance 31.8 28.1 (3.7) (13.2%) Administration 16.7 18.7 2.0 10.7% Cost of retail goods sold 5.4 5.0 (0.4) (8.0%) Amortization 15.2 14.2 (1.0) (7.0%) 146.7 128.4 (18.3) (14.3%) Interest & other 5.5 6.1 0.6 9.8% Total expense 152.2 134.5 (17.7) (13.2%)
The increase in operations reflects an $8.0 million increase in property tax expense. In fiscal 2006 we received a refund of $8.2 million in settlement of terminal property assessment appeals for fiscal years 2004 and 2005. Other increases include wages and benefits for lump sum payments to employees totalling $3.4 million, as a result of the arbitration award and additional training costs. Maintenance costs reflect increased maintenance requirements of our fleet and terminals and a decision to bring forward vessel refit and maintenance activities originally planned for fiscal 2008. Lower administration costs reflect the additional costs of restructuring and additional pension costs due to past service purchases experienced in fiscal 2006. Amortization increases reflect the vessel, terminal and other projects that came into service during fiscal 2007.

20
SUMMARY OF QUARTERLY RESULTS The table below compares earnings by quarter for the most recent eight quarters.
Quarter Ended (unaudited) ($millions) Mar 07 Dec 06 Sep 06 Jun 06 Mar 06 Dec 05 Sep 05 Jun 05
Total revenue 119.0 128.4 202.7 146.2 109.7 126.0 198.3 145.2 (Loss) earnings from operations (27.7) 2.5 73.0 20.2 (18.7) 5.4 67.3 21.1 Net (loss) earnings before extraordinary gain (33.2) (1.8) 68.9 14.9 (24.8) (0.9) 61.2 14.4 Extraordinary gain 0.0 0.0 0.0 61.3 0.0 0.0 0.0 0.0 Net (loss) earnings (33.2) (1.8) 68.9 76.2 (24.8) (0.9) 61.2 14.4
Maintenance expense 31.8 21.9 13.4 17.9 28.1 21.8 13.1 18.1 Maintenance as % of total operating expense 22% 17% 10% 14% 22% 18% 10% 15%
Quarterly results are affected by the seasonality of leisure travel patterns. The second quarter, covering the summer period, experiences the highest traffic levels and the highest net earnings. The third and fourth quarters reflect a seasonal downturn in traffic. We utilize these periods to perform upgrades and major maintenance and refit programs as well as to undertake mandatory inspections on the majority of our vessels. The following graph demonstrates the seasonality of our revenue and shows the relationship of traffic volume and tariff revenue over the most recent eight quarters.
0.010.020.030.040.050.060.070.080.090.0
Mar07
Dec06
Sep06
Jun06
Mar06
Dec05
Sep05
Jun05
Quarter Ending
Tarif
f ($m
illio
n)
0.01.02.03.04.05.06.07.08.0
Traf
fic V
olum
e (m
illio
n's)
Vehicle tariff Passenger tariffVehicle traffic Passenger traffic

21
OUTLOOK Safety The safety of the public, our employees and the protection of the environment are our highest priorities. In July 2006, we commissioned former BC Auditor General, George L. Morfitt to conduct an independent review of our safety policies, procedures and practices. The report resulting from this comprehensive safety review was received in January 2007. The report, which makes 41 recommendations on safety enhancements, states the following conclusion in its summary overview: “We concluded from our review that, overall, the company is operating a safe coastal ferry transportation system. The company directors, management and staff are highly committed to operational safety, both for the travelling public and for BC Ferries personnel. Nevertheless, there are a number of areas identified in this report where safety and related administrative processes and procedures should be strengthened.” We are implementing all of the various recommendations in the report. Some recommendations have already been put into practice and some will be incorporated into our new safety program. During fiscal 2008 we plan to increase the level of operational training we conduct from approximately 11,000 to approximately 14, 000 person days. This increase in training, together with other planned safety initiatives, will increase our safety related expenditures by over $4 million next year. We also plan to conduct a similar comprehensive operational safety review at a minimum of every five years as part of our ongoing commitment to ensuring the safety of our passengers and employees. A copy of the report is available on our website at: http://www.bcferries.com/news/files/07-008morfitt_safety_review.pdf Traffic Ferry traffic levels are affected by a number of factors including transportation costs, the value of the Canadian dollar, weather, global security, levels of tourism, disposable personal income, the local economy and population growth. We experienced a moderate decrease in both total passenger and total vehicle traffic in the last two fiscal years, however over the past five years they are both trending upwards.
During the last two fiscal years some events that negatively affected traffic levels were the implementation of three fuel surcharges, the loss of capacity on our Northern routes and an unprecedented number of severe wind and snow storms in November and December, 2006. With the introduction of the new Northern Adventure into service in March 2007, we anticipate traffic on our northern routes to return to former levels. Over the next few years, we anticipate modest traffic volume increases on all our routes. Vehicle Traffic by fiscal year (thousands) 2007 2006 2005 2004 2003 Major routes 3,826.5 3,790.4 3,808.8 3,688.1 3,734.4 Other routes 4,695.4 4,752.9 4,748.6 4,604.1 4,587.1 Total 8,521.9 8,543.3 8,557.4 8,292.2 8,321.5
Annual % increase(decrease) (0.3%) (0.2%) 3.2% (0.4%) 2.7%
Five year % increase 2.4%
Passenger Traffic by fiscal year (thousands) 2007 2006 2005 2004 2003 Major routes 11,146.3 11,055.9 11,222.4 10,824.7 11,104.2 Other routes 10,518.7 10,673.7 10,804.1 10,542.7 10,520.0 Total 21,665.0 21,729.6 22,026.5 21,367.4 21,624.2
Annual % increase(decrease) (0.3%) (1.3%) 3.1% (1.2%) 1.8%
Five year % increase 0.2%

22
Market Growth Notwithstanding the pressure on traffic volumes, we see opportunities for growth. Container traffic to Vancouver Island is expected to expand as overseas container movements to the Vancouver Gateway increase and large “big box” retailers continue to locate on Vancouver Island.
We have experienced a steady growth in ancillary revenues. We see continuing opportunities to improve the revenue from our ancillary services including reservations, food and retail and assured loading.
In February 2007 we signed a 40 year lease with the Town of Sidney on Vancouver Island under which we will manage and develop the town’s international ferry terminal. The lease recognizes Washington State Ferries as a priority user and promotes use by other operators. This provides us with an opportunity to support the community and to develop innovative new business strategies. Asset Renewal Program Although we have one of the largest fleets in the world, the average age of our assets is currently among the oldest of major ferry operators worldwide. To address this we will continue with our fleet and asset renewal program. We added two new vessels to our fleet this fiscal year, the Northern Adventure and the Kuper. Over the five year period ending March 2012, we expect to spend approximately $1.2 billion, which includes bringing six new vessels into service. Upgrading and replacing a large share of our fleet through new vessel acquisitions and our revitalization program will assist in maintaining operational reliability. We continue to reinvest our retained earnings into our asset renewal program. As the capital projects are completed and come into service, amortization and financing costs will increase. We expect that this will cause a decrease in our future earnings in the near term. Regulation Transport Canada regulates safety on our vessels by authority of the Canada Shipping Act. It is expected that a revised Act with more stringent regulations will be introduced in the near future. At present, the impact of the revised regulations on the useful life of some of our vessels and/or the requirement for vessel upgrades is not well defined. We will address this changing regulatory environment through our planning processes and asset renewal initiatives as information becomes available. As always, the safety and security of our customers and employees remains our highest priority. In 2001, the federal government enacted the Marine Transportation Security Act. Initially the legislation and the associated regulations were limited to international ports and vessels. These regulations have been extended to include domestic marine services, including domestic ferries. We will be required to satisfy a specific level of security on our vessels and at our terminals servicing our major routes by November 2009. Considerable security investments will be required in the areas of fencing, cameras, closed circuit TV, better access controls and screening. We are in the process of defining the capital and operating requirements necessary for us to comply with the upcoming regulations. Through the Marine Security Contribution Program, we are eligible for reimbursement of $3.8 million of federal funding to help offset the costs of perimeter security, access control measures and training. Our tariffs are regulated and our service levels are monitored by the British Columbia Ferries Commissioner. The Commissioner regulates our tariffs by establishing price caps over a performance term. Our first performance term ends March 31, 2008 and our second performance term ends March 31, 2012. In March 2007 the Commissioner set preliminary price caps for the second performance term.

23
Competition New competitors have emerged in both the passenger only market as well as the commercial traffic market in the past few years. To date, passenger only competitors have not been successful at sustaining operations. Competition may increase in these markets with the potential emergence of alternate vehicle and passenger ferry services. We remain mindful of these potential changes in the market, and we are constantly seeking ways to improve operational efficiency and customer service. We are also exploring opportunities with additional or alternative service providers, in an effort to reduce costs and provide services on our regulated routes, as mandated by the Coastal Ferry Act. While we maintain responsibility for the long-term delivery of ferry services, we are required to test the market to determine if another operator, under contract to us, can provide a more cost-effective service offering. In February 2007, we issued a Request for Proposal on the Brentwood Bay-Mill Bay route to two proponents. The closing date is June 15, 2007 and we expect to make a decision whether to proceed with an alternative service provided on this route by the end of December 2007. We are also currently working with a potential alternate service provider regarding a possible pilot project for the Buckley Bay to Denman Island and Hornby Island to Denman Island routes. Additionally, we expect to issue a Request for Proposals regarding the operation of our four routes north of Port Hardy however, the timing of this request is uncertain. FINANCIAL INSTRUMENTS Fair market value estimates are made at a specific point in time, based on relevant market information and information about the financial instrument. These estimates cannot be determined with precision as they are subjective in nature and involve uncertainties and matters of judgment. Derivatives We hedge our exposure to fluctuations in fuel prices and foreign currency exchange rates through the use of derivative instruments. The table below indicates the change in valuation of the derivative instruments for the year ended March 31, 2007.
March 31, 2007 March 31, 2006
($ millions) Carrying
Value Fair
Value Carrying
Value Fair
Value
Number of
swaps
Term to maturity (years) Asset (Liability)
($ millions) Asset (Liability)
($ millions) Commodity Fixed Price Swaps 3 Up to .5 0.7 0.7 0.9 0.9 Foreign Exchange Forward Transactions (Super C-class vessels) 23 Up to 1.5 0.0 (18.7) 0.0 (45.3) Foreign Exchange Forward Transactions (Northern Adventure) 6 Up to 2.0 (2.8) 8.6 0.0 0.0
The commodity derivatives fair value reflects only the value of the commodity derivatives and not the offsetting change in value of the underlying future purchase of fuel. These fair values reflect the estimated amounts that we would receive or pay should the derivative contracts be terminated at the stated dates. Any gains or losses related to fuel commodity swaps are charged to our deferred fuel cost accounts. At March 31, 2007 we have recorded a receivable of $0.7 million as the estimated gain to terminate the contracts as at this date.

24
The foreign exchange derivative fair value reflects only the value of the foreign exchange derivatives and not the offsetting change in value of the underlying future purchase of currency. These fair values reflect the estimated amounts we would receive or pay to terminate the derivative contracts at the stated dates. The derivatives relating to the Super C-class vessels contract are accounted for using hedge accounting and therefore estimated gains and losses are not recorded in our financial statements. The derivatives relating to the Northern Expedition were entered into in August 2006. These are accounted for using hedge accounting commencing October 16, 2006 when appropriate documentation was completed. Any gains or losses related to these foreign exchange forward contracts are charged to our regulatory asset accounts. At March 31, 2007 we have recorded a payable of $2.8 million as the estimated market value of the loss to terminate the contracts as at October 16, 2006, after which time hedge accounting was applied. We are exposed to credit risk in the event of non-performance by counterparties to derivative instruments. Because we deal with high credit quality institutions in accordance with established credit approval practices, we believe it to be unlikely that any counterparties will fail to meet their obligations. RISK MANAGEMENT Understanding and managing risk are important parts of our business. We have processes in place throughout our company to manage risks that inevitably arise in the normal course of business. We are working towards the completion of an Enterprise Risk Management program which will address risk management from an organization-wide perspective and will complement existing strengths. This is a comprehensive approach that incorporates organization-wide awareness, prioritized risk identification and risk mitigation strategies that target the highest risk areas. Our immediate emphasis is on implementing the recommendations included in the Morfitt operational safety review performed this fiscal year (see “Safety” below). The following are some of the risk factors that we have considered during the risk identification process. Accident/Casualty Loss The occurrence of a vessel related accident or mishap could have a material adverse effect on our business prospects, financial condition or results of operations, and could result in a default under the Coastal Ferry Services Contract unless such accident or mishap qualified as an event of force majeure. Due to the nature of our business, we may be subject to liability claims arising out of accidents or disasters, including claims for serious personal injury or death. Apart from well established safety programs, we have a sound conventional insurance program to insure both our physical assets and legal liability for injuries and damage. This is designed to mitigate the financial impact of serious incidents. There can be no guarantee, however, that the insurance coverage will be sufficient to cover all such accidents or disasters. In addition to conventional insurance, we have our own wholly owned insurance subsidiary, BCF Captive Insurance Company Ltd. Its prime purpose is to absorb a large proportion of the deductibles payable under our commercial insurance programs. The objective is to optimize conventional insurance programs, spread the cost of random events among all routes and protect direct route financial results from unnecessary volatility.

25
Asset Risk We operate in a capital-intensive industry and have an aging infrastructure that requires substantial investment. We plan to spend approximately $1.2 billion in capital expenditures over the next five years, with approximately 75% related to new vessel acquisitions, vessel upgrades and component replacement. Our plan includes the replacement of six of our oldest vessels before the end of fiscal 2012. At March 31, 2007, we have total long-term debt of $750 million. Future indebtedness is subject to certain limitations. The level of indebtedness could increase our vulnerability to general adverse economic and industry conditions, and limit our flexibility in planning for, or reacting to, changes in business. Also, there can be no guarantee that we will have access to sufficient resources or will be able to maintain our fleet by extending the economic life of existing vessels through major refurbishment. Regulatory Risk Our operations are subject to a wide variety of national and local laws and regulations, all of which may change at any time. There is the potential that the introduction of new safety or other regulations, including new taxes, or the interpretation of existing regulations, may impose a new, unexpected and significant cost burden. There can be no guarantee that regulatory changes in the future will not have an adverse effect on us. We cannot predict how the British Columbia Ferries Commissioner’s interpretation, administration and enforcement of the Coastal Ferry Act will change over time. Such changes may impact our ability to sustain or increase profitability. Traffic Level and Tariff Revenue Risk Future vehicle and passenger traffic on our vessels will be affected by, among other things, population levels and economic conditions in British Columbia and also by tariff rates. No assurance can be given as to the level of traffic on our system and the tariff revenue that will result. There is a risk that over the long term a general decline in travel (or a reduction in the growth rate) may occur as a result of compounding increases in tariffs. Under the Coastal Ferry Act, we are permitted to increase tariffs on major routes by 2.8% and on the remaining routes by 4.4% each year during the first performance term. In addition to these permitted annual increases, we have applied and may again apply to the Commissioner for other tariff increases, the need for which results from extraordinary situations. In fiscal 2006 and 2007, the British Columbia Ferries Commissioner approved three extraordinary price cap increases to allow for the implementation of fuel surcharges.
To date, the price increases we have implemented have not caused an obvious decrease in demand. Significant increases in fares may occur during the second performance term. Demand elasticity could change as prices increase, thereby resulting in a negative impact on tariff revenue. We believe that a significant number of our customers travel for leisure purposes. Traffic on our vessels may decline, or fail to increase as expected, if world or local events have a negative effect on tourism or other leisure travel.

26
Environmental Risk Our operations are subject to various environmental laws and regulations dealing with the transportation, storage, presence, use, disposal and handling of hazardous materials and hazardous wastes, discharge of storm water and vessel fuel delivery. If we were to be involved in an environmental accident or be found in material violation of applicable law and regulations, we could be responsible for material clean-up costs, property damage, and fines or other penalties, any of which could have a material adverse effect. Although we believe we maintain adequate environmental insurance, there can be no guarantee that the insurance coverage will be sufficient to cover all such losses. Security Risk Deliberate, malicious acts could cause death, injury or property damage. The occurrence of a major incident could also negatively affect the propensity for the public to travel, reducing our ferry traffic levels. The effect could vary depending on whether it was a domestic or international incident and whether or not it was in the marine transportation industry. It could also lead to a substantial increase in insurance and security costs. Any resulting reduction in tariff revenues and/or increases in costs could have a material adverse impact on our business, results from operations and financial condition. Human Resources The majority of our employees are members of the BC Ferry and Marine Workers’ Union. On March 8, 2007, a final award was released by arbitrator Vince Ready, building on the October 2004 interim award. This is expected to provide us with labour stability until the end of the term on October 31, 2012 and provide a unique and innovative dispute resolution process to facilitate future collective bargaining. However, there can be no guarantee that other labour disturbances will not occur and have a material adverse effect on our operations. We are also dependent on maintaining our ability to attract, train and retain employees with the requisite skill and capabilities to operate in the marine industry. Shortages of critical skills are emerging in some areas in which we operate. Income Tax Risk We received an advance income tax ruling from Canada Revenue Agency (“CRA”) that, provided the facts and other statements set out therein are accurate, we are a “Tax Exempt Corporation” described in paragraph 149(1)(d.1) of the Income Tax Act. This ruling is subject to a proposed amendment to subsection 149(1.3) of the Income Tax Act announced by the Department of Finance on December 20, 2002, the essential elements of which are now included in a February 27, 2004 release from the Department of Finance of draft amendments to the Income Tax Act. We have received a non-binding opinion from CRA that proposes subsection 149(1.3), if amended as proposed on December 20, 2002, will not cause us to cease to be a Tax Exempt Corporation. There can be no assurance that subsection 149(1.3) of the Income Tax Act will be amended as proposed, or that we are and will continue to be a Tax Exempt Corporation. Performance Risk There is a risk that we will default under the Coastal Ferry Services Contract or the Terminal Leases. The consequences of such default could include, among other things, an adjustment to service fees from the Province or the forced sale of our vessels to the Province for net book value and termination of the Terminal Leases.

27
Treaty Negotiations: Aboriginal Rights and Title Canadian courts have recognized that aboriginal peoples may possess rights at law in respect of land used or occupied by their ancestors where treaties have not been concluded to deal with these rights and where treaties between aboriginal peoples and the Crown set out express rights. These rights may vary from limited rights of use for traditional purposes to a right of aboriginal title and will depend upon, among other things, the nature and extent of the prior aboriginal use and occupation of lands. The courts have encouraged the Canadian federal and provincial governments and aboriginal peoples to resolve rights claims through the negotiation of treaties. Aboriginal groups have claimed substantial portions of land in British Columbia over which they assert aboriginal title or in which they have a traditional interest. A process is now in place within British Columbia to deal with aboriginal land claims under the British Columbia treaty process. These negotiations have been and will likely remain ongoing for a number of years, depending on the commitment of the parties involved and the precedents set by the outcomes of the first settlement agreements. Under evolving jurisprudence, Canadian governments have a duty to consult and accommodate aboriginal peoples where Crown approvals or licences are required in respect of existing or new terminal facilities or operations at such facilities and could affect or impact aboriginal interests. Under the master agreement, the Province retains its liability, to the extent any exists, for the acts and omissions of the Province that occurred prior to our possession of the ferry terminal properties leased under the Terminal Leases and will reimburse us for any damages we suffer as a result. In addition, the Province will reimburse us for damages suffered if there is a final court decision or a treaty settlement that recognizes or confers upon aboriginal peoples a proprietary or other interest in the ferry terminal properties which right or interest interferes with our quiet enjoyment of the ferry terminal properties as set out in the Terminal Leases. ACCOUNTING PRACTICES Critical Accounting Policies and Estimates Our discussion and analysis of our financial condition and results of operations is based upon our consolidated financial statements, which have been prepared in accordance with Canadian generally accepted accounting principles. Our significant accounting policies are contained in note 1 to our consolidated financial statements. Certain of these policies involve critical accounting estimates because they require us to make particularly subjective or complex judgments about matters that are inherently uncertain and because of the likelihood that materially different amounts could be reported under different conditions or using different assumptions. These estimates and assumptions are subject to change as new events occur, as more experience is acquired, as additional information is obtained and as the general operating environment changes. We believe the following are the most critical accounting policies and estimates that we have used in the preparation of our financial statements.

28
Workers’ Compensation Claims Liability Our financial statements include an estimate of residual liability for workers’ compensation claims arising from the Workers’ Compensation Board (“WCB”) deposit class coverage system, in which our predecessor entity participated on or prior to March 31, 2003. The WCB provided our predecessor company with an actuarial valuation of the unfinalized claims remaining to be paid that relate to incidents on or prior to March 31, 2003. This estimate totalled $9.3 million at March 31, 2003 and is drawn down as claims are paid out. In fiscal 2007 we received an actuarial valuation estimating that the unfinalized claims remaining to be paid at March 31, 2006 totalled $4.7 million. As a result we reduced the current unfinalized claims liability and decreased expenses by $1.8 million during fiscal 2007. The remaining balance at March 31, 2007 of $3.6 million ($6.5 million at March 31, 2006) is included in accrued employee future benefits in our financial statements. Public Service Pension Plan Our employees are members of the Public Service Pension Plan (the “Plan”), a defined benefit and multiemployer pension plan. In April 2003, we were converted from a Crown corporation into an independent company incorporated under the provincial Company Act, and we now validly exist under the Business Corporations Act (British Columbia). In February 2004, our company and the union representing our employees jointly submitted a formal application for all our employees and our company to remain within the Plan. In March 2004, the Public Service Pension Board of Trustees agreed to the proposal. The Plan is exempt from the requirements under the provincial Pension Benefits Standards Act to use the “solvency” method in conjunction with the “going concern” method for valuation purposes. As such, the Plan is currently valued solely by the going concern method. The most recent valuation of the total Plan, as at March 31, 2005, indicated an unfunded liability in the Basic Account of $767 million. Effective April 1, 2006, the Public Service Pension Board of Trustees increased contribution rates for plan members and employers by 1.88% each, effectively eliminating the unfunded actuarial liability. Retirement Bonus Liability We sponsor a plan that provides a post-retirement benefit for long service employees. The valuation of this plan is estimated based on complex actuarial calculations using several assumptions. These assumptions are determined by management with significant input from our actuary. The valuation of the obligation depends on such assumptions as discount rate, projected salary increases, retirement age and termination rates. An actuarial valuation was obtained in March 2005 and the accrued benefit obligation estimated at $10 million. The liability included in accrued employee future benefits in our financial statements at March 31, 2007 was $9.9 million ($9.8 million at March 31, 2006). We have adopted the corridor method of recognizing actuarial gains and losses. Any gains and losses in excess of 10% of the obligation balance will be amortized over the average remaining service period of employees expected to receive benefits under this plan. Rate Regulation We follow generally accepted accounting principles which, as we are a regulated entity, may differ from those otherwise expected in non-regulated businesses. These differences occur when the regulator issues orders and generally involve the timing of revenue and expense recognition. The principles we follow ensure that the actions of the regulator, which create assets and liabilities, have been reflected in the financial statements.

29
The accounting for these items is based on an expectation of the future actions of the regulator. As of March 31, 2007, we have four regulatory assets or liabilities: • Deferred fuel costs: the difference between amounts allowed by the regulator in
operating expense and those actually incurred with recovery expected through future tariffs or surcharges;
• Performance term submission costs: costs for incremental contracted services relating to our second performance term submission based on the expectation that our regulator will approve the recovery of these costs over our second performance term that begins April 1, 2008;
• Tariffs in excess of price caps: the amount by which average annual tariffs collected at a specific date exceed established price caps set under the terms of the Coastal Ferry Act. The excess amounts collected will be returned to customers through future tariffs;
• Hedge losses – vessel construction contracts: unrealized losses on financial derivative instruments not designated for hedge accounting purposes relating to the construction of our new northern vessel. These losses will ultimately form part of the capital cost of the new vessel.
If the regulator’s future actions are different from our expectations, the timing and amount of the recovery of deferred costs could be substantially different from that reflected in our financial statements. Amortization Expense Our capital assets, including assets under capital leases, are amortized on a straight-line basis at varying rates. Amortization rates require the use of estimates of the useful lives of the assets and of salvage to be realized upon asset retirement. We periodically review asset lives in conjunction with our longer term asset deployment, replacement and upgrade strategies. When we determine that asset lives do not reflect the expected remaining period of benefit, we make prospective changes to the remaining period over which they are amortized. There are a number of uncertainties inherent in estimating our asset lives and changes in these assumptions could result in material adjustments to our financial statements. As disclosed in note 1 to our financial statements, we review and evaluate our long-lived assets for impairment when events or changes in circumstances indicate that the related amounts may not be recoverable. Hedging Relationships In April 2005 the Canadian Institute of Chartered Accountants (“CICA”) issued Handbook Section 3865, replacing Accounting Guideline 13 which we had adopted on April 1, 2004. The new standard addresses the identification, designation, documentation and effectiveness of hedging transactions for the purpose of applying hedge accounting. It also identifies situations where hedge accounting is to be discontinued. Under this guideline, we are required to prepare formal documentation for each individual derivative in order to apply hedge accounting for positions hedged with derivatives. During fiscal 2005, we elected to apply hedge accounting on the currency derivatives relating to the three new Super C-class vessels. During fiscal 2007 we elected to apply hedge accounting on the currency derivatives for the new Northern Expedition commencing October 16, 2006, the date at which formal documentation requirements were met. At March 31, 2007 we have recorded the $2.8 million fair market value of foreign currency derivatives (nil at March 31, 2006) at October 16, 2006 relating to the Northern Expedition. We have elected not to apply hedge accounting on fuel commodity derivatives, and therefore, we have recorded the $0.7 million fair market value of commodity derivatives in our balance sheet at March 31, 2007 ($0.9 million at March 31, 2006).

30
Asset Retirement Obligations On April 1, 2004, we adopted the CICA new standard for recognition, measurement and disclosure of liabilities for asset retirement obligations and the associated asset retirement costs. Under the new standard the fair value of a liability for an asset retirement obligation must be recognized in the period in which it is incurred if a reasonable estimate of fair value can be made. The fair value is added to the carrying amount of the associated asset, which is then expensed over the asset’s estimated useful life. The liability is accreted over the estimated useful life of the asset through charges to expenses. As we are not aware of any future liabilities associated with the retirement of our assets, the adoption of this policy does not result in the recording of an asset retirement liability and therefore our financial statements have not been impacted by this standard. In addition, as our operations are regulated, there is a reasonable expectation that any significant asset retirement costs would be recoverable through future tariffs. Future Accounting Changes Financial Instruments, Comprehensive Income and Hedges The CICA has issued new accounting standards relating to comprehensive income, equity, financial instruments and hedges. Under the new guidance all financial instruments, including derivatives, will be included on the balance sheet and measured, in most cases, at fair value. Certain gains and losses arising from changes in fair value will be temporarily recorded outside the income statement in comprehensive income. These gains and losses will be shown in the equity section under accumulated other comprehensive income. The new CICA Handbook sections also extend the requirements for hedge accounting. We will adopt these new standards for the first quarter of fiscal 2008. We are currently assessing the impact of adoption of these new requirements on our consolidated financial statements. Rate Regulation In May 2005, the CICA issued Accounting Guideline 19 to establish financial statement guidelines for entities subject to rate regulation. This guideline requires disclosure of general information regarding the nature and economic effects of rate regulation, as well as additional information on how rate regulation has affected the financial statements. The guideline did not address recognition and measurement issues associated with the accounting for rate-regulated operations. In March 2007, the Accounting Standards Board of the CICA released an exposure draft, “Rate-Regulated Operations” proposing revisions to the CICA Handbook. The exposure draft proposes removal of all Handbook recognition and measurement guidance relating specifically to rate-regulated operations. Under these proposed changes and once the Handbook is amended, the US standard SFAS 713 would provide guidance for recognition and measurement. We believe that this will not have a material effect on our consolidated results of operations, financial position or cash flow statements. SYSTEMS, PROCEDURES AND CONTROLS We are responsible for establishing and maintaining disclosure controls and procedures to ensure that material information is recorded, processed, summarized and reported as required by applicable Canadian securities legislation. We have carried out an evaluation of the effectiveness as of March 31, 2007 of the design and operation of the disclosure controls and procedures. Based on this evaluation, the Chief Executive Officer (“CEO”) and Chief Financial Officer (“CFO”) concluded that the disclosure controls and procedures are effective in recording, processing, summarizing and reporting, on a timely basis, information required to be disclosed to satisfy continuous disclosure obligations and are effective in ensuring that information required to be disclosed is accumulated and communicated as appropriate to allow timely decisions regarding required disclosure.
3 Statement of Financial Accounting Standards No. 71, “Accounting for the Effects of Certain Types of Regulation” (SFAS 71), of the US Financial Accounting Standards Board.

31
We are responsible for designing and implementing internal controls over financial reporting to provide reasonable assurance regarding the reliability of the reporting and the preparation of financial statements for external purposes in accordance with Canadian generally accepted accounting principles. We have carried out a review of our internal controls over financial reporting as of March 31, 2007. Based on this evaluation, the CEO and CFO concluded that such internal controls have been designed to provide reasonable assurance regarding the reliability of the reporting and the preparation of financial statements for external purposes. There were no changes in internal control over financial reporting that occurred during the last quarter of fiscal 2007 that have materially affected, or are reasonably likely to materially affect, internal control over financial reporting. CORPORATE STRUCTURE AND GOVERNANCE Our Board of Directors and Management consider good corporate governance to be central to the effective, efficient and prudent operation of the Company. Both Management and the Board have monitored and, where appropriate, responded to regulatory developments aimed at improving corporate governance practices, increasing corporate accountability and enhancing the transparency of public company disclosure and will continue to monitor the developments in corporate governance practices. In 2005, National Instrument 58-101 Disclosure of Corporate Governance Practices (the “Instrument”) and a related National Policy 58-201 Corporate Governance Guidelines (the “Guidelines”) issued by the Canadian Securities Administrators came into effect. The Guidelines and Instrument require reporting issuers to disclose annually their approach to corporate governance with reference to specific matters. See Schedule A for the disclosure in accordance with this Instrument. FORWARD LOOKING STATEMENTS This management’s discussion and analysis contains certain “forward looking statements”. These statements relate to future events or future performance and reflect management’s expectations regarding our growth, results of operations, performance, business prospects and opportunities and industry performance and trends. They reflect management’s current internal projections, expectations or beliefs and are based on information currently available to management. In some cases, forward looking statements can be identified by terminology such as “may”, “will”, “should”, “expect”, “plan”, “anticipate”, “believe”, “estimate”, “predict”, “potential”, “continue” or the negative of these terms or other comparable terminology. A number of factors could cause actual events or results to differ materially from the results discussed in the forward looking statements. In evaluating these statements, prospective investors should specifically consider various factors including, but not limited to, the risks and uncertainties associated with traffic volume and tariff revenue risk, the impact of competition, asset risk, accident/casualty loss risk, tax risk, environmental risk, regulatory risk, labour disruption risk, risk of default under material contracts and aboriginal land claims. Actual results may differ materially from any forward looking statement. Although management believes that the forward looking statements contained in this management’s discussion and analysis are based upon reasonable assumptions, investors cannot be assured that actual results will be consistent with these forward looking statements. These forward looking statements are made as of the date of this management’s discussion and analysis, and British Columbia Ferry Services Inc. assumes no obligation to update or revise them to reflect new events or circumstances.
32
Schedule A CORPORATE STRUCTURE AND GOVERNANCE Board of Directors The Board has assumed responsibility for the stewardship of the Company by overseeing the conduct of the business, supervising Management, which is responsible for the day-to-day conduct of the business and endeavoring to ensure that all major issues affecting the business and affairs of the Company are given proper consideration. At March 31, 2007, the Board was comprised of the following Directors:
Chair: Elizabeth J. Harrison Q.C. Vice Chair: Thomas W. Harris Members: Douglas E. Allen, Peter R.B. Armstrong, Sandy M. Fulton, David L. Hahn, John R. Henderson, Doreen J. Hewitt, Maureen V. Macarenko, Robert W. McCaskill, G. Raymond Whitehead, Graham M. Wilson
Effective April 1, 2007 Peter R.B. Armstrong ceased to be a Director and effective May 15, 2007 A. Daniel Miller became a Director. The Board Governance Manual articulates the governance framework under which the Board fulfills its stewardship responsibilities. The Manual assembles in one document the essential elements for providing an appropriate level of governance for the organization. It includes, among other things, terms of reference for the Board, Chair, Directors, Committees and Committee Chairs and serves as a practical guide for the Board and Management in fulfilling their respective duties and responsibilities. The governance framework is a product and responsibility of the Board. The Board is committed to the principles of independence and accountability. The Board has adopted policies and practices that ensure it has the capacity, independent of Management, to fulfill the Board’s responsibilities, make objective assessments of Management and assess the merits of Management initiatives. The Governance and Human Resources Committee has an ongoing responsibility to ensure that the governance structures and processes continue to enable the Board to function independently. The Board and Management recognize that there is a regular need for the Board to meet without Management in attendance. It is general practice to conduct a portion of every Board meeting with only independent directors present. The Board and its Committees each have the authority to retain any outside advisor, at the Company’s expense, that it determines to be necessary to permit it to carry out its duties. The recruitment of directors is undertaken with the objective of ensuring the Board is composed of a majority of strong, qualified independent directors. The Board supports the concept that the role of the Board Chair is separate from that of the President & CEO and that the Board Chair should be an independent Director. These principles are reflected in the Board Governance Manual. The Board has adopted a definition of an independent Director for members of the Audit and Finance Committee consistent with the definition of independence in Multilateral Instrument 52-110. This definition, with some modification that is consistent with Multilateral Instrument 52-110, also applies to determining the independence of other members of the Board.
33
The Board is responsible for determining whether directors are independent pursuant to the definition of independence adopted by the Board. To do this the Board requires members to disclose their relationships with the Company and its subsidiaries. These disclosures are reviewed by the General Counsel, the Corporate Secretary, the Chair of the Board and the Chair of the Governance and Human Resources Committee. Any director who is deemed independent and whose circumstances change such that he or she might be considered to no longer be an independent director is required to promptly advise the Board of the change in circumstances. Directors are required annually to attest to their independence in writing. Mr. David L. Hahn, President & CEO, is the only director who is a member of Management of the Company. By virtue of his being a member of Management, Mr. Hahn is not independent. The other directors of the Company, including the Chair of the Board, have been determined by the Board to be independent pursuant to the definition of independence adopted by the Board. Directorships The following were directors of another issuer, other than British Columbia Ferry Services Inc. (“BCFS”), which is a reporting issuer (or the equivalent) in Canada or a foreign jurisdiction: Elizabeth J. Harrison, Q.C.: Director, Unilens Vision Inc. Graham M. Wilson: Director, ITRON Inc. Director, Naikun Wind Group Trustee and Director, Hardwoods Distribution Trust Trustee, Daylight Resources Trust. Orientation and Continuing Education The Company has a variety of orientation and education programs in place for directors. These programs are aimed at increasing the directors’ familiarity with the operation of the Company and its governance practices. All new directors are provided with the opportunity to participate in an orientation program. The orientation program is tailored to the individual director’s needs and areas of interest. The program generally involves a full day session, held prior to a new director attending his/her first BCFS Board meeting, during which the new director is briefed by members of senior management and receives written information about the business and operations of BCFS and Board governance practices, including the duties and obligations of directors. All new directors receive a copy of the Board Governance Manual. This provides a comprehensive overview of the roles and responsibilities of the Board, its Committees and the contributions expected by each director. The Board recognizes the importance of ongoing director education and the need for each Director to take personal responsibility for this process. To facilitate ongoing education, the Board Chair and the Chair of the Governance and Human Resources Committee periodically canvas the directors to determine their training and education needs and interests; arrange ongoing visits by directors to the Company’s facilities and operations; arrange for the attendance of directors at seminars or conferences of interest and relevance to their position as a director of the Company; and encourage and facilitate presentations by outside experts to the Board or Committees on matters of particular import or emerging significance. Directors are also provided with memberships in the Institute of Corporate Directors which provides them with opportunities to attend programs and courses relevant to corporate governance. Responsibility for ensuring that orientation and ongoing education are provided to directors rests with the Chair of the Board. The Governance and Human Resources Committee has responsibility for reviewing the orientation and education programs to ensure they are effective and meet the needs of directors.

34
Ethical Business Conduct The Board of Directors approved and adopted a Code of Business Conduct and Ethics (“Code”) on November 10, 2004. Notice of adoption of the Code as Company policy was communicated to the Company's personnel by intra-Company information bulletin widely distributed throughout the Company. In addition, the Code has been posted on the Company's intranet website for Company personnel, and on the Company's internet site. The Code was filed on SEDAR on March 1, 2006. The Board has also adopted a Corporate Disclosure and Securities Trading Policy, which is also posted on the Company’s intranet and internet sites. As part of the Company’s disclosure controls process, in conjunction with quarter-end financial reporting, appropriate Managers are required to make representations regarding compliance with the Code and the Corporate Disclosure and Securities Trading Policy. As part of the communication process for the reporting of questionable accounting and auditing matters, a secure telephone line and a secure email address, each monitored by the Executive Director of Internal Audit, have been established and this has been communicated to Company employees by intra-Company information bulletin. The contact particulars are also posted with the Code on the Company's intranet site. The Board, through the Audit and Finance Committee, monitors compliance with the Code through review of compliance reports received quarterly from Management, the External Auditors, and the Internal Auditors. Directors and officers review the Code and acknowledge their support and understanding of the policy by signing an annual disclosure statement. The Code requires that directors and officers disclose potential conflicts of interest at the time of their appointment and immediately upon a situation of a conflict of interest or potential conflict of interest arising. Such disclosures are communicated to and reviewed by the General Counsel, the Corporate Secretary, the Chair of the Board and the Chair of the Governance and Human Resources Committee. Nomination of Directors The B.C. Ferry Authority (the “BCFA”), through its Board of Directors, selects the Board of Directors of British Columbia Ferry Services Inc. (“BCFS”) by March 31 each year. While not a requirement, it is current practice that the directors of BCFA will also be directors of BCFS. The Articles of Incorporation of BCFS permit a total of 20 directors of BCFS, hence directors may be appointed to the Board of BCFS in addition to those who are also directors of BCFA. It is viewed as desirable to maintain consistency between the two Boards so that the interests of BCFA and BCFS are properly aligned. However, the ability to appoint additional directors to the Board of BCFS gives flexibility in ensuring adequate skill sets and experience are available within the members of the Board of BCFS. The BCFS Board has established a Nominating Committee to lead the director nomination processes for BCFS. The Nominating Committee is composed entirely of directors who are independent, pursuant to the definition of independence adopted by the Board of BCFS. The Chair of the Board of BCFS is the Chair of the Nominating Committee. Descriptions of the Nominating Committee’s responsibilities, powers and operations are included in the Board Governance Manual. Each year the skill sets and experience of the incumbents and any retiring directors of BCFS are reviewed by the Nominating Committee in the context of the skills and experience profile adopted by the BCFS Board and the ongoing governance needs of BCFS. Any gaps are identified. Potential conflicts of interest and other extenuating circumstances are also identified.

35
The skill sets and experience of the candidates for the BCFA Board that are put forward by the nominating entities and the Province are reviewed by the Nominating Committee to ascertain if there will be any gaps in the skill sets and experience of the Board of BCFS, assuming BCFA directors also become BCFS directors. If gaps are identified, the Nominating Committee, in consultation with the President & CEO, seeks out suitable candidates for nomination as directors of BCFS to fill such gaps. The Nominating Committee makes recommendations to the BCFS Board of Directors on suitable candidates for appointment to the BCFS Board. These recommendations take into account the talents of the existing BCFS Board, and the talents of all nominees (including BCFA Board nominees and appointees who may become BCFS Board members, if applicable), taking the skills and experience profile established for BCFS directors into account. The BCFS Board makes its decision on prospective directors and forwards its recommendations to the BCFA Board. The BCFA Board then determines the directors of BCFS and causes BCFA, as the sole holder of the single voting share of BCFS, to appoint such directors to the Board of BCFS. Compensation The Governance and Human Resources Committee reviews the compensation of directors and the President & CEO annually. The Committee is composed entirely of independent directors and operates under terms of reference adopted by the Board. The Committee engages an external compensation advisor to research and provide independent advice to the Committee on the level and types of compensation for directors and the President & CEO. In making its recommendations to the Board, the Committee takes into account the types of compensation and the amounts paid by other comparable companies. Board Committees Audit and Finance Committee (at March 31, 2007): Chair: Graham M. Wilson Members: Douglas E. Allen; Thomas W. Harris; John R. Henderson, Maureen V. Macarenko Effective April 1, 2007, Maureen V. Macarenko ceased to be a member of the Audit and Finance Committee and Robert W. McCaskill became a member of the Committee. The Audit and Finance Committee (“Committee”) is appointed by the Board of Directors to assist the Board in fulfilling its oversight responsibilities. The Committee has the mandate to: • Review the financial reports and other financial information provided by the Company to
its security holders; • Review the annual operating and capital budgets, modifications thereto, and details of
any proposed financing; • Monitor the integrity of the financial reporting process and the system of internal
controls that the Board and our management have established; • Monitor the management of the principal risks that could impact the financial reporting
of the Company, and the Company’s compliance with legal and regulatory requirements as they relate to the Company’s financial statements;
• Review and approve the audit plan, process, results, and performance of the Company’s external auditors and the internal audit department (“the internal auditor”) while providing an open avenue of communication between the Board, management, external auditors, and the internal auditor;

36
• Assess the qualifications and independence of the external auditors, and recommend to the Board the nominations of the external auditors and the compensation to be paid to the external auditors.
The Committee has the authority to conduct any investigation appropriate to fulfilling its responsibilities, and it has direct access to the external auditors as well as anyone in the organization. The Committee has the authority to retain special legal, accounting, and other advisors or experts it deems necessary in the performance of its duties. Each of the members of the Committee has been determined by the Board of Directors to be independent, that is, without any direct or indirect relationship with the Company that could reasonably interfere with the exercise of the member’s independent judgment. Douglas E. Allen acted as interim Chief Executive Officer of the Company from October 16, 2002 until May 5, 2003. All members of the Committee are financially literate within the meaning of Multilateral Instrument 52-110, that is, each has the ability to read and understand a set of financial statements that present a breadth and level of complexity of accounting issues that are generally comparable to the breadth and complexity of the issues that can reasonably be expected to be raised by the Company’s financial statements. Since April 1, 2005, all recommendations of the Committee to nominate or compensate an external auditor have been adopted by the Board. The aggregate fees billed by our external auditor in each of the last two fiscal years were:
Year ended March 31 External Auditor Billings ($thousands) 2007 2006
Audit and audit related 172.8 121.8 Tax services 3.0 10.4 All other fees
Advisory services (internal control certification) 7.5 14.8
Enterprise Risk Management project - 151.4 183.3 298.4
Pursuant to its terms of reference, the Committee must pre-approve retaining the external auditors for any non-audit service to be provided to the Company or its subsidiaries, provided that no approval shall be provided for any service that is prohibited under the rules of the Canadian Public Accountability Board or the Public Company Accounting Oversight Board, or the Independence Standards of the Canadian Institute of Chartered Accountants. Before retaining the external auditors for any non-audit service, the Committee must consider the compatibility of the service with the external auditors’ independence. The Committee may pre-approve retaining of the external auditors for the engagement of any non-audit services by establishing policies and procedures to be followed prior to the appointment of the external auditors for the provision of such services. To date no such policies and procedures have been established. In addition, the Committee may delegate to one or more members the authority to pre-approve retaining of the external auditors for any non-audit services to the extent permitted by applicable law. In addition to the Audit and Finance Committee, the Board has appointed the following three Committees, all of which are composed entirely of independent directors:

37
Governance and Human Resources Committee (at March 31, 2007): Chair: Douglas E. Allen Members: John R. Henderson, Doreen J. Hewitt, Robert W. McCaskill, Graham M. Wilson
Effective April 1, 2007, Robert W. McCaskill ceased to be a member of the Governance and Human Resources Committee and Sandy M. Fulton, Maureen V. Macarenko and G. Raymond Whitehead became members of the Committee.
The Governance and Human Resources Committee is appointed by the Board of Directors to assist the Board in fulfilling its oversight responsibilities. The Committee has the mandate to: • review the policies and practices of the Board; • ensure the Board’s continuing ability to fulfill its legislative mandate; • implement effective due diligence over the operations of the Company; • review the human resources strategies of the Company, including management recruitment,
development, retention, compensation, and succession planning; • review and recommend to the Board the appointment of Officers of the Company; and • review and recommend to the Board appropriate compensation for directors, the President
& CEO and senior executive, and otherwise fulfill the responsibilities of a compensation committee.
Safety, Health, Environment and Security Committee (at March 31, 2007): Chair: G. Raymond Whitehead Members: Sandy M. Fulton, Maureen V. Macarenko, Robert W. McCaskill, Peter R. B. Armstrong
Effective April 1, 2007, G. Raymond Whitehead ceased to be Chair of the Safety, Health, Environment and Security Committee and Sandy M. Fulton became Chair of the Committee. Also effective April 1, 2007, Peter R. B. Armstrong ceased to be a Director and member of the Committee and Doreen J. Hewitt became a member of the Committee.
The Safety, Health, Environment and Security Committee is appointed by the Board of Directors to assist the Board in fulfilling its oversight responsibilities. The Committee has the mandate to: • exercise due diligence over the safety, health, environmental and security operations of
the Company; • develop, review, and make recommendations, as required, on matters related to the
Company’s safety, health, environmental and security policies and practices; and • monitor compliance with Government regulations and with the Company’s commitment
to these issues.
Nominating Committee (at March 31, 2007): Chair: Elizabeth J. Harrison, Q.C. Members: Douglas E. Allen, Sandy M. Fulton, Graham M. Wilson The Nominating Committee is appointed by the Board of Directors and has a mandate to: • assist the Board in ensuring that Board members collectively and individually have the
skills, experience and backgrounds to appropriately lead the organization; • establish and implement effective processes for identifying suitable candidates for
appointment as Directors of BCFS; and • recommend to the Board suitable candidates for appointment as Directors of BCFS.

38
Assessments As part of its dedication to best governance practices, the Board is committed to regular assessments of the effectiveness of the Board, the Board Chair, Committees, Committee Chairs and individual directors.
The Governance and Human Resources Committee annually reviews and makes recommendations to the Board on the method and content for annual evaluations.
The evaluation method varies from year to year. In the previous three years, the board has engaged an independent governance consultant to coordinate the evaluation. The consultant has collected information on individual director’s assessments of the performance of the board against its terms of reference, the Board Chair against the Board Chair’s terms of reference, and each Committee, including the Committee Chair, against its terms of reference. The assessment undertaken in the year ended March 31, 2007 involved individual discussions between each director and the independent consultant on matters related to Board effectiveness. The consultant presented the results of the evaluation to the Governance and Human Resources Committee and the Board and has prepared recommendations for action. Considering the consultant’s report and recommendations, the Governance and Human Resources Committee will prepare and implemented an action plan for the upcoming year. This action plan will be reviewed and approved by the Board.
The Board also undertakes an assessment of individual director performance annually. This occurs through in-depth discussions between individual directors and the Board Chair.