managers’ less favourable attitude towards bottom of the
TRANSCRIPT

Research Report
Managers’ less favourable attitude towards bottom of the
pyramid (BOP) customers
Daniël Louis Nel
23289971
A research project submitted to the Gordon Institute of Business Science,
University of Pretoria, in partial fulfilment of the requirements for the degree of
Master of Business Administration.
9 November 2011
Copyright © 2012, University of Pretoria. All rights reserved. The copyright in this work vests in the University of Pretoria. No part of this work may be reproduced or transmitted in any form or by any means, without the prior written permission of the University of Pretoria.
©© UUnniivveerrssiittyy ooff PPrreettoorriiaa

i
Abstract
Investment in low income markets is increasing so too is a sense of controversy
regarding poor markets. With BOP investment becoming many a firms’ strategy
towards achieving growth, it is not clear to what extent managers’ attitudes to
poor customers differ towards their attitudes towards middle-class customers. It
is, however, well described that attitudes to poor people in a social context is
negative and in some cases less favourable.
It is postulated that business' mindset may be a barrier towards engaging with
BOP markets despite the incentives and benefits that literature puts forward for
marketing to the poor. Whether this attitude is negative, neutral, less favourable
or similar is not well understood. The findings of this research project, can with
a high level of confidence, report that the attitudes of a sample of managers do
display a less favourable attitude towards a poor customer than is the case with
a similar sample that is exposed to a wealthier customer.

ii
Keywords
(BOP) bottom of the pyramid; general attitude;
the poor; managers

iii
Declaration
I declare that this research project is my own work. It is submitted in partial
fulfilment of the requirements for the degree of Master of Business
Administration at the Gordon Institute of Business Science, University of
Pretoria. It has not been submitted before for any degree or examination at any
other University. I further declare that I have obtained the necessary
authorisation and consent to carry out this research.
The name and the original signature of the student and the date should follow
the declaration.
Danie Nel: …………………………… Date: …………………….

iv
Acknowledgements
The following entities are acknowledged, for without them this project would
have achieved only to disappoint!
- Gavin Price, thank you for the direction and assistance with supervising the
research project. Your insights were invaluable.
- Ben Waldeck, thank you for endless assistance and your calming influence.
Thanks in particular for your willingness to assist with computing the data.
- To the team of programme managers Sazile Mshengu, Adele Bekker,
Kerry-Lee Durant, Tshidi Dludlu and Joanne Laubscher for their assistance
in the data collection process.
- Mimi Greyling, thank you for editing the document.

v
Dedications
- I dedicate this work to my Creator and Lord. Had I not been blessed with
strength and good health, I would have not completed this project... Baruch
haba b’shem Adonai
- My family, who have endured much alongside me. Thanks to you all – I love
you.

vi
Contents
List of Tables .............................................................................................................................................. viii
List of Figures ............................................................................................................................................. viii
Chapter 1 Introduction to the research problem ............................................................................... 9
1.1 Research title .............................................................................................................................. 9
1.2 Research Scope .......................................................................................................................... 9
1.3 Research motivation ................................................................................................................ 10
1.4 Research problem .................................................................................................................... 12
1.5 Relevance and importance to South Africa and business ........................................................ 13
Chapter 2 Literature review ............................................................................................................. 14
2.1 Defining BOP and the recent focus of firms towards this segment ......................................... 15
2.2 Defining attitude and mainstream attitudes towards the poor ............................................... 18
2.2.1 A case for marketing to BOP customers .......................................................................... 21
2.2.2 Financial motivators ........................................................................................................ 22
2.2.3 Ethical and moral motivators .......................................................................................... 22
2.2.4 Barriers towards engaging with BOP customers ............................................................. 23
2.2.5 The market model’s challenges for sustainable development ........................................ 24
2.3 Necessary conditions for marketing to the poor ..................................................................... 25
2.4 Towards refining a hypothesis ................................................................................................. 26
Chapter 3 Hypothesis ....................................................................................................................... 27
Chapter 4 Research methodology .................................................................................................... 29
4.1 Design ....................................................................................................................................... 29
4.2 The Pilot Study ......................................................................................................................... 34
4.3 Population and sample ............................................................................................................. 36
4.4 Data measurement and analysis .............................................................................................. 38
4.4.1 Analytical statistics section .............................................................................................. 39
4.4.2 Descriptive statistics section ........................................................................................... 40
Chapter 5 Results ............................................................................................................................. 41
5.1 Response .................................................................................................................................. 41

vii
5.2 Descriptive statistics ................................................................................................................. 43
5.3 5.3 Analytical Statistics ............................................................................................................. 45
Chapter 6 Discussion of results ........................................................................................................ 47
6.1 Was the response indicative of differing attitudes of managers when faced with a potential
BOP customer? ...................................................................................................................................... 47
6.2 Was the response reflective of the theoretical basis of this project? ...................................... 48
6.3 Validity of the respondent’s attitudinal scores ........................................................................ 50
6.3.1 External validity ............................................................................................................... 50
6.3.2 Internal validity ................................................................................................................ 51
6.4 Validity of the instrument ........................................................................................................ 53
6.5 Inferences from the descriptive statistical output ................................................................... 54
6.6 Inferences form the analytical statistics................................................................................... 56
6.7 The response as indicative of managers’ generally less favourable opposed to unfavourable
attitudes towards BOP customers ......................................................................................................... 56
6.8 Design: Limitations and assumptions ....................................................................................... 58
Chapter 7 Conclusion ....................................................................................................................... 60
7.1 Did the research deliver on the scope it set out to achieve? ................................................... 60
7.2 Limitations and concerns ......................................................................................................... 64
7.3 Possible scope for follow-on research ..................................................................................... 64
Reference List .......................................................................................................................................... 65
Appendix A The instrument ................................................................................................................ 69
Appendix B Summarised collected data ............................................................................................. 72
Appendix C R STUDIO output sheet .................................................................................................... 73

viii
List of Tables
Table 1: Normative Theory Framework and elements of An Integrative Justice: A model for engaging
impoverished market segments (Santos & Laczniak, 2009) ...................................................................... 25
Table 2: Design rationale for the instrument ............................................................................................. 32
Table 3: Response value ...................................................................................................................... 38
Table 4: Comparing the average response (score) per question .............................................................. 41
Table 5:Comparing instances of certain option choices to determine popularity-proportionately .......... 42
Table 6: Descriptive Statistical Tests output .............................................................................................. 45
Table 7: Analytical Statistical Output ......................................................................................................... 46
Table 8: Evaluation of internal validity – adopted from (Struwig & Stead, 2001, p. 137) ......................... 52
Table 9: Evaluation of the instrument’s validity – adopted from (Struwig & Stead, 2001, pp. 139-142) .. 53
Table 10: Data extracted from Survey Monkey ......................................................................................... 72
List of Figures
Figure 1: A graphic illustration of how this chapter is organised towards justifying the central research
question ..................................................................................................................................................... 14
Figure 2: The Economic Pyramid adapted from (Prahalad & Hart, 2002) ................................................. 16
Figure 3: Histogram Group A ..................................................................................................................... 43
Figure 4: Histogram of Group B ................................................................................................................. 44
Figure 5: Boxplot comparing distribution of attitudinal scores of group A and group B ........................... 44

9
Chapter 1 Introduction to the research
problem
1.1 Research title
Managers’ less favourable attitude towards bottom of the pyramid (BOP)
customers.
1.2 Research Scope
This research set out to establish whether managers’ attitude towards BOP
(bottom- or base-of-the-pyramid) customers as described by Santos & Laczniak
(2009) is less favourable relative to managers’ attitude to middle class
customers. This research intends to create awareness of attitudinal differences
towards poor customers, and with an appeal to managers to guard against their
propensity towards negative attitudes.

10
1.3 Research motivation
The world today seems to view the developing world as increasingly important.
Foundations exist that investment decisions should consciously be directed at
addressing global poverty versus the more traditional approach of large firms
that access wealthy markets. Kirchgeorg & Winn (2006) note this shift in
business strategy discourse that increasingly focuses on BOP and motivate
their work as a call on researchers and practitioners towards greater
engagement with the poor.
Whilst the body of knowledge surrounding attitudes having already peaked with
the likes of Thurstone and later Likert from the 1950’s through to the early
1970’s the body of knowledge regarding BOP is relatively new, with Prahalad
introducing the term in the early 2000’s. This research project is particularly
concerned with better understanding the still reasonably unclear manifestation
of attitudes towards BOP.
The Economist (2009) reported that investment in low income markets is
increasing and cites financial services as a prominent example of this. This
particular article, however, also pointed out that as the idea of BOP grows, so
does the controversy surrounding it. An article in the Financial Times by Murray
(2010), supported this notion by postulating that investment towards marketing
to BOP has become many companies’ strategy to achieve the Millennium
Development Goals which includes poverty reduction and environmental
sustainability.

11
Amongst these goals is the development of socially useful goods at affordable
pricing. What is of particular interest is how this article articulates the business
case for marketing to the world’s poor as a low-margin-high-volume strategy
with an opportunity of scale, given the size of this market.
In Landrum (2007), literature in favour of BOP as a profitable customer base, is
cited in stating the size of the global poor customer as being roughly between
2.7 and 5 billion people. Given the size and therefore relative importance of
BOP as a business stakeholder, the rationale behind this research stems from
the question: given the fact that certain firms choose to market to BOP and
others do not are there other forces at play that influence these decisions?
Fishhein & Ajzen (1975) discussed the correlation between behaviour and
attitudes where attitudes are proposed as a driver of behaviour. Should it then
be inferred that those firms that do manage to successfully trade with the poor,
are headed up by managers that display more favourable attitudes towards
BOP customers? It would seem so when reviewing how Stephan & Finlay
(1999) postulate that low levels of empathy are a contributor to physiological
distance and that high levels of empathy contribute to improved and beneficial
intergroup interaction and that empathy contributes to positive attitudinal and
behavioural change. Santos & Laczniak (2009) also hint that favourable
attitudes towards customers tend to manifest in behaviour that engages
customers actively and explicitly through ongoing dialogue.

12
1.4 Research problem
With a compelling argument that business should engage in poor markets, why
is it that some firms attempt this and succeed as put forward by Prahalad
(2005), whilst other firms fail to succeed or fail to attempt? Is a question posed
by Karnani (2007). The question becomes even more compelling given that
recent arguments about business strategy propose that the poor is indeed a
viable option for business venture, and that business venture is a viable option
towards solving poverty. Whilst negative attitudes towards the poor seem to
retard this interaction as postulated by Prahalad (2005).
Is the attitude of business managers different to BOP customers than business
managers’ attitude to middle class customers? This research report set out to
determine whether less favourable attitudes towards poor customers are
observable, given that less favourable attitudes towards poor customers are
cited as a barrier towards investment into poor markets. Prahalad (2002)
suggests that a shift in mindset is required: from viewing the poor as a problem,
to viewing the poor as an opportunity to innovate.
In the light of negative mainstream attitudes towards the poor as found with
students in Cozzarelli, Tagler, & Wilkinson (2002) and suggested of business
managers in Olsen & Boxenbaum (2009), this research poses the question
whether attitudes held by managers in business towards customers differ,
based on the economic characteristics of the customer.

13
1.5 Relevance and importance to South Africa and
business
This project has particular relevance to South African business as well as the
greater Africa in that a large portion of its potential target markets may well be
classified as BOP.
The prediction regarding mobile technology penetration in Africa, is an example
of this and according to Cooper & Boye (2005), mobile technology, more
specifically mobile connections was predicted to increase by 1.5 billion over the
last four years with 78% of that increase bound to happen in emerging markets.
In Kirchgeorg & Winn (2006) this trend is underlined in when the concept of
emerging markets is described as an attractive growth opportunity combined
with the simultaneous benefit of aleviating poverty.
This report has particular reference to academics and business firms in South
Africa, firstly, due to the sample which was made up of managers,
approximated by business school students that either live or work in South
Africa. Secondly, South Africa is part of Africa and as such, firms in South
Africa, in many instances, plan to market or are already marketing their goods
and services to BOP customers. A third relevant intersection with South Africa,
but also relevant to other dynamic economies, is the known high occurrence of
unemployed and poor citizens and the resulting higher probability that a firm in
South Africa is likely to transact with poor customers.
14
Chapter 2 Literature review
Taking guidance from Blumberg, Cooper, & Schindler (2008), the literature
review for this project will aim to contextualise the research question (including
relative prominence) as well as discuss the construct: BOP.
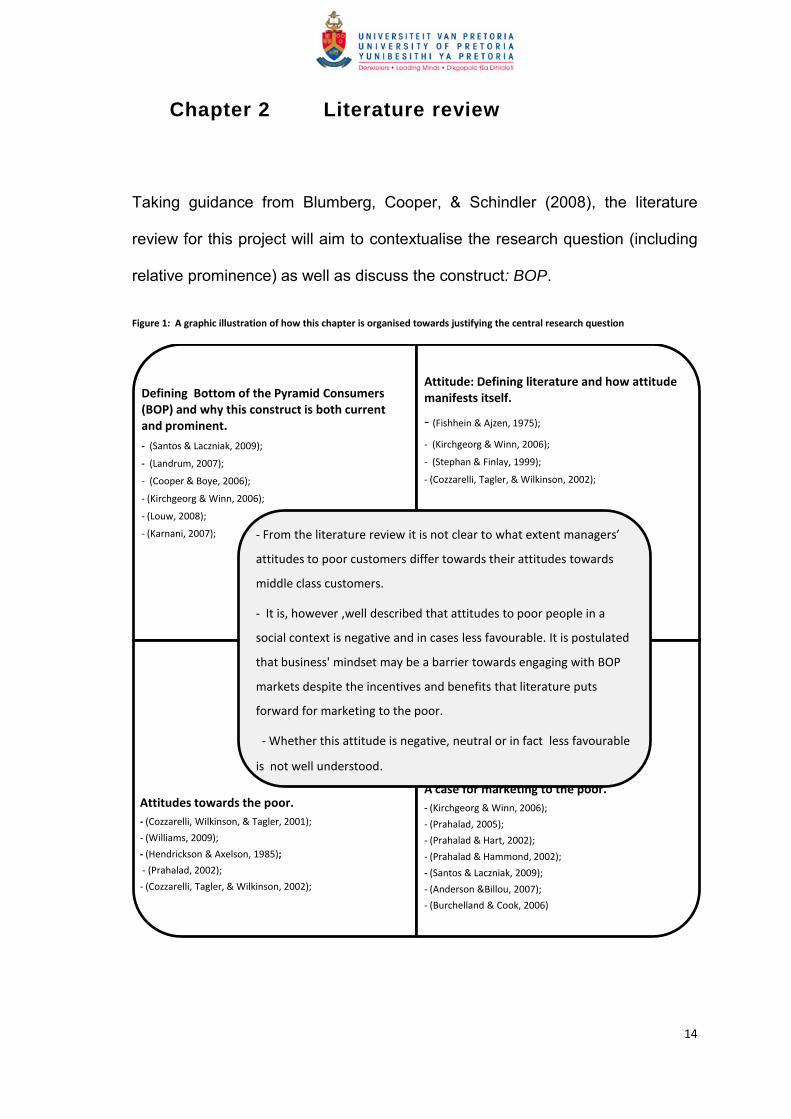
Figure 1: A graphic illustration of how this chapter is organised towards justifying the central research question
Defining Bottom of the Pyramid Consumers (BOP) and why this construct is both current and prominent.
- (Santos & Laczniak, 2009);
- (Landrum, 2007);
- (Cooper & Boye, 2006);
- (Kirchgeorg & Winn, 2006);
- (Louw, 2008);
- (Karnani, 2007);
Attitude: Defining literature and how attitude manifests itself.
- (Fishhein & Ajzen, 1975);
- (Kirchgeorg & Winn, 2006);
- (Stephan & Finlay, 1999);
- (Cozzarelli, Tagler, & Wilkinson, 2002);
Attitudes towards the poor.
- (Cozzarelli, Wilkinson, & Tagler, 2001);
- (Williams, 2009);
- (Hendrickson & Axelson, 1985);
- (Prahalad, 2002);
- (Cozzarelli, Tagler, & Wilkinson, 2002);
A case for marketing to the poor.
- (Kirchgeorg & Winn, 2006);
- (Prahalad, 2005);
- (Prahalad & Hart, 2002);
- (Prahalad & Hammond, 2002);
- (Santos & Laczniak, 2009);
- (Anderson &Billou, 2007);
- (Burchelland & Cook, 2006)
- From the literature review it is not clear to what extent managers’
attitudes to poor customers differ towards their attitudes towards
middle class customers.
- It is, however ,well described that attitudes to poor people in a
social context is negative and in cases less favourable. It is postulated
that business' mindset may be a barrier towards engaging with BOP
markets despite the incentives and benefits that literature puts
forward for marketing to the poor.
- Whether this attitude is negative, neutral or in fact less favourable
is not well understood.

15
2.1 Defining BOP and the recent focus of firms towards
this segment
It is generally accepted that the term “poor” predates the term “BOP”. The
relevance of both these terms and the manner in which it is used in literature is
the reason that this report used the term BOP and poor customers
interchangeably. The research title particularly referred to BOP due to its use in
the commercial context as in (Karnani, 2007; Louw, 2008; Olsen & Boxenbaum,
2009; Prahalad, 2002), and Although BOP is a key construct in this research,
literature describing mainstream attitudes towards “the poor” have been used as
the term “the poor” predates the term “BOP” and effectively includes as well as
serves as a proxy and also the described BOP segment of the market.
In recent years, multinational corporations (MNCs) have shown an increased
interest in low-income market segments; this target market is also sometimes
characterised as the bottom- or base-of-the-pyramid market (BOP) as found in
Santos & Laczniak (2009). Kirchgeorg & Winn (2006) suggest that the term
“bottom” is negative and insulting; more recent work therefore uses the more
neutral term “base of the pyramid” (BOP).
Santos & Laczniak (2009) describe this market segment as being made up of
people that are “constrained by income”, or lacking in wealth opportunity,
literacy, market access and political factors. Louw (2008) describes a BOP
person as poor, possibly sick, wearing creased and possibly dirty clothing. This
person may be confused with a beggar, is constantly hungry and shows signs of
malnutrition.

16
For the purposes of this study, we exclude the “extreme poor”, a term used by
the World Bank as cited in Santos & Laczniak (2009), which refers to, for
example, refugees, and denotes persons without any economic resources and
therefore not in the sights of commercial engagement but rather dependent on
aid. The term “poverty” is explained by Kirchgeorg & Winn (2006) as a situation
where a people lack the skills and entitlements to satisfy their basic needs and
aspirations
Figure 2: The Economic Pyramid adapted from (Prahalad & Hart, 2002)
Tier 1: With a population of around100 million people living off morethan 20 000 US dollars per year
The Economic Pyramid of the World Tier 2: With a population of near two
billion people living off between1500 and 20 000 US dollars per year
Tier 3 (BOP): People who live offroughly 1500 US dollars per year.Combined with tier 4, the size of thismarket exceeds 4 billion people.
Tier 4 (BOP): People who live off lessthan 1500 US dollars per year.Combined with tier 3, the size of thismarket exceeds four billion people.

17
Prahalad (2005) affirms that poor market segments have historically been
perceived as unprofitable due to low purchasing power. However, poorer
markets seem more attractive today, in part due to the notion that traditional
developed economies are perceived as saturated and in part due to multiple
analyses which demonstrates earnings potential in BOP markets as described
in Santos & Laczniak (2009). According to the World Bank, as cited in
Kirchgeorg & Winn (2006), more than four billion people live on less than $1500
a year, three billion people live on less than $2 per day and over one billion on
less than $1 per day.
Secondary data on BOP theory can thus be divided into four schools of thought:
1. The recent increase in awareness and definition of the so-called BOP as
proposed by Louw (2008);
2. The notion that the BOP market is indeed a profitable one and a business
case exists for marketing to BOP: as postulated by Prahalad (2005);
3. The criticism of point 2, the notion that BOP is neither a significant market
nor a profitable one as argued by Karnani (2007);
4. Literature that suggests challenges or barriers towards engaging with BOP
as found in the work of Prahalad & Hart (2002);

18
2.2 Defining attitude and mainstream attitudes towards
the poor
Fishhein & Ajzen (1975) define attitude as a “learned predisposition to respond
in a consistently favourable or unfavourable manner with respect to a given
object” (p. 6). Similarly, attitude as described in Cozzarelli, Wilkinson, & Tagler
(2001), p.208 is defined as “a psychological tendency that is expressed by
evaluating a particular entity with some degree of favour or disfavour”.
More specifically, Fishhein & Ajzen (1975) describe the predisposition as “an
enduring organisation of motivation, perceptual cognitive processes with
respect to some aspect of an individuals world” (p. 9). In the context of this
study, attitude and what distuiguises the concept from other phsycological
concepts, is its affective charracteristic as discussed by Fishhein & Ajzen
(1975). They note that the amout of affect for or affect against some object is a
conceptualisation of the general attitude concept.
Cozzarelli, Tagler, & Wilkinson (2002) propose that a mainstream attitude, one
that embodies a negative stereotypic view of the poor, as well as the belief that
the poor is personally responsible for their situation was prevalent amongst
middle-class students, and that this attitude is an obstacle to reducing poverty.
Williams (2009) explains how stigmatised individuals are believed to possess
some attribute or characteristic that is devalued in a particular context. “Low-
income people are stigmatized in a number of ways, including being negatively
stereotyped and discriminated against both interpersonally and institutionally”
(Williams, 2009, p. 37).

19
In assessing the works of Cozzarelli, Wilkinson, & Tagler (2001) & Williams
(2009), three tendencies were prominent when attitudes of students towards
the poor were measured: a) participants may realise that they are exposed to
members of an “out-group” and are likely to reflect a prejudice against an out-
group member, b) stereotypes about the poor were found to be significantly
more negative than stereotypes about the middle class and c) a sense of
blaming the poor for being poor in defence of the status quo. This notion is also
referred to as achieved as opposed to ascribed.
A further indication of dominant attitudes as found in Hendrickson & Axelson
(1985) refers to the dominant ideology in the United States as one that believes
each individual should work hard and try to succeed in competition with others.
Proponents of these dominant attitudes believe that those who work hard
should be rewarded with success based on the notion that opportunity is in fact
widespread and not scarce.
Dominant ideology is further described by Hendrickson & Axelson (1985) as
being an attitude based on the notion that those who work hard will in fact be
rewarded with success and that those who are not economically successful
have only themselves to blame, as their failure to succeed is as a result of their
own lack of character.
In Prahalad (2002), it is suggested that a shift in mindset is required: from
viewing the poor as a problem, to viewing the poor as an opportunity to
innovate. A position is postulated that attitudes should change from viewing the
poor as wards of the state, to viewing the poor as potential customers and
markets.

20
In critique to Prahalad, Karnani (2007) argues that not many firms manage to
serve the poor market successfully due to the simple fact that these customers
are too poor and that firms should rather buy from these markets as opposed to
marketing to them.
Prahalad (2002) built an argument that business’ management still focuses on
the middle and upper tiers of the customer market and not the bottom or poorer
customers. An open-ended question is offered to explain this statement in the
following quotation: “Is it the poor at the bottom of the pyramid who are not
ready to innovate or the elites who are unwilling to change their beliefs?”
(Prahalad, 2002, p. 8). This indicates the significance of beliefs in this debate
although this article does not elaborate on the attitudinal assumptions of this
statement.
Another suggestion that attitudes should be considered when examining
interaction between firms and markets was observed in research that involved
evaluating the sustainability strategy of a firm by Olsen & Boxenbaum (2009).
They found that a trade-off mentality was a barrier to marketing to the poor and
they quoted an employee in what illustrates this mentality: “A sustainability
case is typically something that will involve a huge amount of work, an
extensive amount of resources, and a long time horizon before anything at all
happens. And part of what does happen is the creation of goodwill and a good
feeling and that’s just not…that’s not a financial thing (p. 110).”

21
2.2.1 A case for marketing to BOP customers
Anderson & Billou (2007) noted instances of successful entry into BOP by
practising the principles of availability, affordability, acceptability and
awareness. This said, a view has developed that concerns itself more with the
stakeholder view of the firm. This links closely to what Burchelland & Cook
(2006), calls Corporate Social Investment (SCI).
In Santos & Laczniak (2009) it was noted that firms are increasingly being
encouraged to report on the so-called Triple Bottom Line approach. This is the
notion that business should not only serve the interests of its shareholders but
consider all the stakeholders in the community in which it operates as well as
the environment in which it operates.
This day and age sees firms entering into poor markets where part of the goal is
to eradicate poverty, enabling the poor to benefit from economic activity and
engagement with the poor and revealing a more inclusive capitalism alongside
the profit outcome.
Following on from the above, literature regarding current incentives and barriers
towards engaging with BOP will be investigated for further evidence that
attitudes are consistently referred to as a barrier for engaging with BOP and
verifying that research has not yet specifically assessed managerial attitudes
towards BOP.
22
2.2.2 Financial motivators
Kirchgeorg & Winn (2006) propose that from a financial perspective the
following three factors motivate this recent focus of firms towards BOP.
1. They noted the significant size of the BOP market with the entrance into
global trade by the likes of China and India and their large but relatively
poor populations.
2. Global firms are positioned to unlock the BOP-market’s potential. MNCs
and their substantial resources, political influence, mass-production
capacity and technological competencies were listed as potential
ingredients to launch high volume products at low cost to a large
consumer base.
3. Bringing the poor into the market solves the global poverty problem. This
was presented as an alternative to donor-based models based on the
argument that when these programmes are entered into in co-operation
with other institutions, relational blockages can be overcome when
market principles are applied to BOP.
2.2.3 Ethical and moral motivators
Santos & Laczniak (2009) promote two principles as a means to reach a mutual
value situation that is born from collaboration between the customer and firm.
“Always treat the humanity in a person as an end and never as a means
merely” and “So act as if you were a member of an ideal kingdom of ends in
which you were both subject and sovereign at the same time”. (Santos &
Laczniak, 2009, p. 9).

23
Santos & Laczniak (2009) argue that the basis for ethical behaviour is when
marketers consult their inner conscience and to do good when the opportunity
arises. This is further argued to produce actions that result in the happiness of
others. Santos & Laczniak (2009) promote the use of “Inherent Fairness” in
marketing transactions: To explain this concept, they refer to the concepts of
“Veil of Ignorance” and “Original Position” that will enable decision making
where self-interest is served whilst minimising social risk due to the fact that the
person making the decisions is unaware of his/her position in society.
Santos & Laczniak (2009) deduct two guidelines from their above position:
“Each person is to have an equal right to the most extensive total system of
equal basic liberties compatible with a similar system of liberty for all” and
“Social and economic inequalities are to be arranged so that they are both (a) to
the greatest benefit of the least advantaged and (b) attached to offices and
positions open to all under conditions of fair equality of opportunity” (p. 8).
2.2.4 Barriers towards engaging with BOP customers
Kirchgeorg & Winn (2006) explain four barriers towards engaging with the BOP
markets:
1. The absence of pro-poor policies is illustrated by poor customers’ lack of
voice and representation, information flow and incentives that do not
facilitate policy makers’ increased attention to the poor.
2. Policies without resources and services often do not reach the poor due to
limited information by government about the needs of the poor, negative
attitudes toward the poor, corruption and lacking systems.

24
3. Lack of demand is a further barrier that renders services useless.
4. Lastly low levels of buying power do not facilitate acquisition of goods and
services.
Kirchgeorg & Winn (2006) propose a market model as a possible solution to
low levels of engagement with BOP customers; however, challenges to such a
model are noted.
2.2.5 The market model’s challenges for sustainable
development
Kirchgeorg & Winn (2006) postulate that a market driven solution to the poor will
necessitate higer levels of: competition, regulation and governance. A second
challenge was raised that pertained to the question of how it would be at all
possible to raise the consumption levels of two thirds of the world’s population
to that of levels in developed countries without triggering a catastrophic
ecological impact.
Gardetti (2007) argues that organisational culture and more specifically
resistance to change are major challenges towards the “divergent thinking”
necessary to innovatively serve the BOP. According to Gardetti (2007)
organisations do not only find it difficult to view stakeholders as a source of
information, but mutual distrust and ignorance are attitudinal barriers that
prevent successful engagement with BOP. These attitudinal barriers tend to be
more prominent in an environment of institutional weakness such as the
absence of market-driven regulations and education that does not address
sustainability effectively.

25
2.3 Necessary conditions for marketing to the poor
Table 1: Normative Theory Framework and elements of An Integrative Justice: A model for engaging impoverished market
segments (Santos & Laczniak, 2009)
Values •Authentic engagement with impoverished customers
•Co-creation of value with customers
•Investment in future consumption
•Interest representation of all stakeholders
•Long-term profit management
Grounds •Fairness and equity
•Sustainable business enterprise
•Moral philosophy and management frameworks
Decision
principles •Same as values
Agents
•Business executives and decision makers of organisations that engage
impoverished segments
Scope
•Extends to all stakeholders of the organisation, particularly impoverished
customers
Context
•Applicable to all marketplace transactions involving impoverished
customers,
whether in the developing or developed world
Structure •Assumes the legal and regulatory structures of the capitalist system

26
2.4 Towards refining a hypothesis
Kirchgeorg & Winn (2006) assert certain challenges towards engaging with the
poor. Gardetti (2007) advances some of these bariers. Necessary conditions
for engaging with the poor as found in Santos & Laczniak (2009) were
examined for indications that a more positive attitude towards the poor will
facilitate engagement with them.
From the literature review it is not clear to what extent managers’ attitudes to
poor customers differ from their attitudes towards middle class customers.
It is, however, well described that attitudes to poor people in a social context is
negative and in cases less favourable.
It is postulated that business' mindset may be a barrier towards engaging with
BOP markets despite the incentives and benefits that literature puts forward for
marketing to the poor. Whether this attitude is negative, neutral or indeed less
favourable seemed not to be well understood.

27
Chapter 3 Hypothesis
From the literature review instances of negative and less favourable attitudes
towards poor people have been observed. The available research seemed to
suggest that academics consistently considered less favourable attitudes
towards a prominent, but poor consumer-segment, as a barrier towards
engagement despite the well documented argument for engaging with this
segment.
The research project postulates that:
- given the literature review wherein negative and less favourable attitudes to
poor people in a general-social setting have been observed;
- subsequently a manager in business may hold a similarly negative or less
favourable attitude towards a BOP customer;
- despite the incentives for engaging with the BOP market segment;
if managers in a business context have a particular attitude towards a person
with middle-class-like economic characteristics (let us call this group A) is at a
certain level, and this attitudinal score is compared to that of if managers in a
business context who have a particular attitude towards a person with economic
characteristics similar to that of a poor person (let us call this group B);
this study hypothesises that a statistically significant difference between the
mean attitudinal scores of this samples A & B will be observed.

28
The null hypothesis states that the sample means of participants A will not differ
significantly from that of participants B. The alternate hypothesis will be where a
statistically significant difference between the sample mean of participants A
and that of participants B is observed where the mean of sample A will be
greater than the mean of sample B.
For: BA
BA
H
H
:
:
1
0

29
Chapter 4 Research methodology
4.1 Design
The research method took the form of an experimental design. The unit of
analysis was the attitudinal score of a sample. The sample’s attitude towards a
hypothetical potential customer was measured and compared to an
independent sample. Blumberg, Cooper, & Schindler (2008) explain how
experiments are the manner in which to test if certain phenomena occur under
certain conditions and not under others. The dependant variable relates to the
attitudinal score that is the unit of analysis of this research.
Also referred to as dependant and independent variables, the independent
variable in this study referred to the economic context of the vignette (an
illustration of a hypothetical customer) which was presented to participants prior
to the completion of an attitude measurement instrument.
Data were collected using a questionnaire that was adapted from the market
orientation section of the Psychometric Risk Attitude Scale as used in Pennings
& Smidts (2000) and literature on scale construction in (Likert, 1974): refer to
appendix A for the questionnaire.

30
The population, in this case business school students, was be targeted via
SURVEY MONKEY (Survey Monkey, 2011), a web based survey tool.
A “Vignette” as used in Sniderman & GrobSource (1996) is a short story in
which a fictional actor, in this case a potential customer, is described in terms of
economic characteristics and a brief situation that the actor experiences: refer
to appendix A for the vignettes used for sample groups A and B.
In Fishhein & Ajzen (1975), examples of similar attitudinal measurement
designs by amongst others Likert and Thurstone are noted where attitudes
where measured in terms of a sample’s evaluations of unambiguous favourable,
neutral and unfavorable objects.
Blumberg, Cooper, & Schindler (2008) describe Lickert type scale as the most
frequently used instruments to assess attitudes. This is typically achieved
through rating statements that express attitudes as favourable or unfavourable
towards a particular object. The design of this project bears close resemblance
to the above mentioned methodology with the object in the case of this project
being the vignette-type “hypothetical customer”.
The instrument relied on the vignette not displaying any age, racial or gender-
related characteristics or as described in Welman & Kruger (2001), nuisance
variables that could influence the dependant variable. The aim of this design
was to differentiate between sample groups only in terms of their exposure to
the independent variable which will focus on the economic characteristic of the
portrayed customer for priming or stimuli purposes.

31
Broadly defined by Welman & Kruger (2001), priming is an intervention by the
researcher, towards exposing a sample to something to which they otherwise
would not have been exposed to. The exposure to vignettes becomes the basis
of separating between the three tests groups, with group A being the
participants who received a vignette where the actor has middle-class economic
characteristics and group B being the participants who received a vignette
where the actor has the economic characteristics of a poor person.
In an effort to mitigate nuisance variables such as age, gender and racial bias
of the sample, instruments were at random assigned to the sample where each
respondent had a known chance to be exposed to either vignette A or B.
Blumberg, Cooper, & Schindler (2008) call this process random assignment
with respondents having an equal chance of exposure to each level of the
independent variable.
Fishhein & Ajzen (1975) note that more than 500 differing opperations for the
measurement of attitude exists. No evidence was found of a standardised
instrument for the intents and purposes of this research. Having said this, the
following guidelines from (Likert, 1974) were implemented towards achieving a
useful instrument:
1) prior testing of the questionnaire and vignettes was done to narrow down
questionnaire items towards isolating only useful items;
2) statements were kept concise and straightforward;
3) statements related to desired behaviour were used.

32
In Struwig & Stead (2001), steps for ensuring reliability in internet research are
proposed and the following steps were implemented through conducting a pilot
study. Respondents in the pilot study were asked to comment on the design,
language use, instructions and perceptions of the vignette and make
recommendations towards its improvement.
The instrument as seen in appendix A was designed based on inference from
the accompanying literature, as illustrated in the table below, whereby certain
constructs are proposed as defining of attitudes. With these in mind, the
instrument was designed.
Table 2: Design rationale for the instrument
Question Literature concepts that link to the question construction:
1. WHAT IS THE
LIKELIHOOD OF YOU
SPENDING MONEY
TOWARDS
MARKETING THE
FIRM’S PRODUCTS TO
THIS PERSON?
- Viewing the poor as an opportunity to innovate (Prahalad, 2002); - Negatively stereotyping and discriminating against the poor (Williams,
2009); - Having a trade-off mentality towards poor consumers (Olsen &
Boxenbaum, 2009); - To view stakeholders as a source of information, not with ignorance but
within a market- driven mindset (Gardetti, 2007); - Propensity towards affect for or affect against particular object (Fishhein &
Ajzen, 1975); - Viewing poor persons as potential customers (Prahalad, 2002);
2. WHAT IS THE
LIKELIHOOD OF YOU
MARKETING YOUR
SERVICES TO THIS
PERSON?
- Viewing the poor as part of an out-group with a measure of prejudice and deserving of their circumstance (Cozzarelli, Tagler, & Wilkinson, 2002);
- With particular favour or disfavour (Hendrickson & Axelson, 1985); - Negatively stereotyping and discriminating against the poor (Williams,
2009); - Having a trade-off mentality towards poor consumers (Olsen & Boxenbaum,
2009); - Viewing the poor as an opportunity to innovate (Prahalad, 2002); - To view stakeholders as a source of information, not with ignorance but
within a market-driven mindset (Gardetti, 2007);
3. WHAT IS THE
LIKELIHOOD OF YOU
MODIFYING YOUR
OFFERING TO BETTER
SUIT THIS PERSON’S
TASTES AND NEEDS?
- To view stakeholders as a source of information, not with ignorance but within a market-driven mindset (Gardetti, 2007);
- A sense that the poor has a lack of voice (Kirchgeorg & Winn, 2006); - Collaborating with the poor (Santos & Laczniak, 2009); - Viewing the poor as an opportunity to innovate (Prahalad, 2002); - Engaging with customers in a manner that is explicit through active
dialogue (Santos & Laczniak, 2009);

33
4. WOULD YOU
WORK LATE TO
ENSURE THAT
COMPLAINTS, FROM
THIS PERSON AND
SIMILAR CUSTOMERS
GET RESOLVED?
- Propensity towards affect for or affect against particular object (Fishhein & Ajzen, 1975);
- To view stakeholders as a source of information, not with ignorance but within a market-driven mindset (Gardetti, 2007);
- With particular favour or disfavour (Hendrickson & Axelson, 1985); - Collaborating with the poor (Santos & Laczniak, 2009); - Viewing the poor as part of an out-group with a measure of prejudice and
deserving of their circumstance (Cozzarelli, Tagler, & Wilkinson, 2002); - Propensity towards empathy and the extent to which physiological distance
is prevalent (Stephan & Finlay, 1999); - Engaging with customers in a manner that is explicit through active
dialogue (Santos & Laczniak, 2009); - Ethicality or a sense of inner conscience (Santos & Laczniak, 2009);
5. DO YOU ASPIRE TO
HAVE THIS PERSON AS
A CUSTOMER?
- Viewing poor persons as potential customers (Prahalad, 2002); - Propensity towards affect for or affect against particular object (Fishhein &
Ajzen, 1975); - Having a trade-off mentality towards poor consumers (Olsen & Boxenbaum,
2009); - Viewing the poor as part of an out-group with a measure of prejudice and
deserving of their circumstance (Cozzarelli, Tagler, & Wilkinson, 2002); - Viewing the poor as an opportunity to innovate (Prahalad, 2002);
6. DO YOU REGARD
THIS PERSON AS
DESERVING OF YOUR
TIME?
- Viewing the poor as an opportunity to innovate (Prahalad, 2002); - Viewing poor persons as potential customers (Prahalad, 2002); - A sense that the poor has a lack of voice (Kirchgeorg & Winn, 2006); - Negatively stereotyping and discriminating against the poor (Williams,
2009); - Engaging with customers in a manner that is explicit through active
dialogue (Santos & Laczniak, 2009);
7. WOULD YOU
DESCRIBE YOUR
ATTITUDE TOWARDS
THIS PERSON AS
FAVOURABLE?
- Negatively stereotyping and discriminating against the poor (Williams, 2009);
- Propensity towards affect for or affect against particular object (Fishhein & Ajzen, 1975);
8. WOULD YOU
VALUE THE OPINION
OF THIS POTENTIAL
CUSTOMER
REGARDING YOUR
PRODUCT & SERVICE?
- To view stakeholders as a source of information, not with ignorance but within a market-driven mindset (Gardetti, 2007);
- A sense that the poor has a lack of voice (Kirchgeorg & Winn, 2006); - Collaborating with the poor (Santos & Laczniak, 2009); - Having a trade-off mentality towards poor consumers (Olsen & Boxenbaum,
2009);
9. DO YOU FEEL THAT
IT WOULD BE IN THE
BEST INTEREST OF THE
FIRM TO TARGET THIS
PERSON AS A
CUSTOMER?
- Viewing poor persons as potential customers (Prahalad, 2002); - Having a trade-off mentality towards poor consumers (Olsen & Boxenbaum,
2009); - Collaborating with the poor (Santos & Laczniak, 2009); - Engaging with customers in a manner that is explicit through active
dialogue (Santos & Laczniak, 2009);
10. WOULD YOU
WANT TO BE
ASSOCIATED WITH
THIS CUSTOMER?
- Propensity towards affect for or affect against particular object (Fishhein & Ajzen, 1975);
- Negatively stereotyping and discriminating against the poor (Williams, 2009);
- Viewing the poor as part of an out-group with a measure of prejudice and deserving of their circumstance (Cozzarelli, Tagler, & Wilkinson, 2002);

34
Having illustrated that the final item selection for the questionnaire has visible
ties to literature, prior testing of a larger, broader-based questionnaire was
conducted. The 24 questions used, were narrowed down to ten, based on the
strength of the attitudinal difference between the average score of Group A and
group B after the pilot study response data had been analysed. Only questions
that delivered a marked difference in scores were selected for the final
instrument. The next section describes the nature and motivation behind the
pilot study.
4.2 The Pilot Study
As outlined in Welman & Kruger (2001), the reasoning behind a pilot test of the
intended instrument is to detect flaws in the measurement procedure such as
ambiguity in the instructions, inadequate time limits and test whether the
independent variable primes the sample effectively. A second argument for
conducting a pilot study is in the case where an instrument was purposefully
designed for this study, where a non-standardised questionnaire will be used.
This is over and above the face validity of the design that was achieved through
asking for feedback from experienced researchers. The pilot study targeted a
population of roughly 20 full time MBA students in a class environment where a
brief introduction regarding the research was given to the class. The class was
asked to complete the instrument and comment on any uncertainty or difficulties
they experienced with understanding the instructions.

35
This was done taking guidance from Struwig & Stead (2001) when they
describe a pilot study as a process to help eliminate comprehension and
response problems on the side of the respondents. The pilot study achieved a
sample size of 8 respondents for group A and 7 respondents for group B. A
group C was also included in the pilot study and a sample size of 5 was
achieved. The motivation behind including a third group was to expose the
population to an economically neutral hypothetical customer, taking guidance
from Fishhein & Ajzen (1975) and establishing how this group’s attitudes would
compare to that of group B.
Independent variable C was not used in the actual data collection phase due to
two reasons: a) that the low response rates of targeting the population through
e-mail and directing them to the web-based instrument a third sample group
would have risked the sample sizes A and B being too small (<30) and would
have limited the normal distribution of data points. A second reason for not
including group C data, was that the pilot data collection suggested that scores
related to group C were significantly lower than even that of group B, possibly
suggesting that a totally neutral vignette seemed unrealistic to the respondents,
possibly to the point of irritation or lack of seriousness in participation, both of
which may explain the low attitudinal scores achieved with pilot group C.

36
The pilot questionnaire contained 25 question items that included questions
directly enquiring how the respondent perceived the hypothetical customer as
illustrated in the relevant vignette in terms of demographics. This was done to
determine whether the vignette construction satisfied the gender and race
neutrality it set out to display. An outcome of the pilot questionnaire was to
select a reduced number of questions that a) reduced the fatigue and non-
response / completion error; and b) produce a set of items that consistently
produced response means where group A’s average score per question
exceeded that of group B.
Vignettes were mixed in the order a,b,c,a,b,c and so on, and were attached to
the instrument. The batch of questionnaires was cut and shuffled and
distributed to the sample at random. This approach related closely to the
Randomised Group Design Method as mentioned in Welman & Kruger (2001),
as most suitable and the simplest organisation of an experiment.
4.3 Population and sample
The population of the study referred to business managers in general. The
population frame can be defined as GIBS business school students, all of whom
have registered for postgraduate studies in 2010 and 2011. The sampling frame
is class lists. The sample was drawn with no regard to unit or frame from the
entire population.

37
The sample was drawn from business school students consisting of 1st and 2nd
year MBAs (Masters of Business Administration) and 1st year PDBAs
(Postgraduate Diploma in Business Administration). The rationale behind the
population was two-fold.
Firstly, inferences from this research were to be expressed in terms of the
attitudes of managers and were not limited to any particular grouping of
manager due to the prevalent use of business school students as a popular
approximation of business managers. Due to the relative certainty that these
students were in fact part-time students but full-time senior personnel at
organisations as per the admission requirements of business schools.
Secondly, the availability of business school students and the convenient nature
of this sample option was a driver of the choice of population and whilst given
that the convenience of targeting a population of business school students as a
proxy for managers outweighs the possible limited generalisation to a general
and universal population of managers. Convenience sampling methodology is
described by Struwig & Stead (2001) as suitable when the researcher is
constrained for time and resources.
The universe, in this case managers approximated by business school
students, is sufficiently homogeneous on the basis of their participation at that
firm at a management level, at a particular firm, as such. This design is
described by Blumberg, Cooper, & Schindler (2008) as useful when testing
relatively new and non-researched hypotheses, as is the case with this research
project.

38
Other studies using similar samples defend their sample selection, such as
Zgheib (2005) and Phau & Kea (2007) who have used similar samples and
argue that even if they are not managers yet, they are likely to become
managers and practitioners in future.
Approximately 500 students that included six MBA classes and two PDBA
classes were targeted to complete the instrument. A sample size exceeding 30
per vignette was aimed for, based on the Central Limit Theorem (CLT). CLT as
described in Levine, Krehbiel, & Berenson (2010), argues that when a sample
size exceeds 30, the mean distribution of that sample is approximately normal.
4.4 Data measurement and analysis
The response of respondents was converted into numerical data by assigning a
numerical value to each response. The sum of responses, per respondent,
became the attitudinal score of a particular respondent.
Table 3: Response value
Response Option Response Value
Not at all 1
Unlikely 2
Maybe 3
Probably 4
Absolutely 5

39
4.4.1 Analytical statistics section
The measurement of the responses was analysed through descriptive and
analytical statistical computations. The analytical statistics entailed that a one-
tailed t-test was computed to analyse the variance between two independent
sample means.
The one-tailed nature of the test was set to test for directionality in the test for
variance in that sample A’s mean distribution was to be significantly greater
than that of sample B. Levine, Krehbiel, & Berenson (2010) describe this test as
suitable for testing for hypotheses that test for “particular direction” with the
rejection region being location in the lower tail of the distribution.
Rejecting the H0 in H1 would demonstrate a significant statistical difference
between the mean sample scores of samples A & B and indicate that attitudinal
scores of the sample was in fact different to that of a middle class customer
than that of BOP customers.
In Welch (1947) the Welch t-test is proposed where unequal variance may
exist. The F-statistic output, as necessitated to determine distribution variance
between two populations as described in Levine, Krehbiel, & Berenson, (2010)
was used to assist in using the correct t-test statistic.
The confidence interval for rejecting the Null hypothesis or H0 was set at 95%
resulting in an alpha (α) at 0.05. This setting was based on the two sample
sizes exceeding 30 and therefore satisfying the CLT.

40
Descriptive statistics were used to indicate the direction of the difference, in
other words, which were greater: group A or group B in terms of attitudinal
mean, 1st quadrant, median, 3rd quadrant, minimum and maximum scores.
4.4.2 Descriptive statistics section
Albright, Winston, & Zappe (2009), describe histograms as a visual display of
the distribution of the sample around a mean. Histograms were computed as a
first step in visually assessing for difference and to assess whether a normal or
“symmetric” distribution was the case with the respective samples as mentioned
by Albright, Winston, & Zappe, (2009).
Boxplots were used to better illustrate the difference in mean distribution.
Levine, Krehbiel, & Berenson (2010) discuss a five number summary that
includes, minimum, 1st quadrant, mean, 3rd quadrant and maximum value as the
foundation of the boxplot. These five numbers, when applied to groups A and B
and subsequently compared in table form made for ready comparison of the
descriptive data.
The last quantitative analysis was concerned with comparing the per question
average responses. This was intended to compare a) the consistency of
responses as primed by the vignette and b) the effectiveness of the instrument
in delivering responses that differed per sample group.
Finally individual responses for question-options (1) and (2) were compared in
terms of the number of respondents who opted for these responses; these were
compared as absolute numbers, also as a proportion of total responses.

41
Chapter 5 Results
5.1 Response
Response for group A was 56 responses with completed questionnaires
totalling 89% of the response resulting in n = 50. See appendix D.
Response for group B were 50 responses with completed questionnaires
totaling 90% of the response resulting in n = 45. See appendix D.
Table 4: Comparing the average response (score) per question
Question
Number
Group A -
Average per
question scores
Group B -
Average per
question scores
Difference in
average scores per
question (ranked
from high to low)
2 3.84 2.62 1.22
1 3.62 2.62 1.00
5 4.12 3.16 0.96
9 4.00 3.09 0.91
10 3.96 3.24 0.71
4 4.14 3.76 0.38
7 4.04 3.71 0.33
8 4.18 3.89 0.29
3 3.56 3.36 0.20
6 4.12 3.98 0.14

42
The significance of the table on the previous page is the strong link in how
Fishhein & Ajzen (1975) define attitude as a “learned predisposition to respond
in a consistently favourable or unfavourable manner with respect to a given
object”(p. 6). The reponses are without exeption, less favourable per question
with respect to group B when compared to group A.
Table 5:Comparing instances of certain option choices to determine popularity-proportionately
Comparing instances of certain option choices to determine popularity of and the proportion of the total responses.
Group A (N= 50) Group B (N= 45)
Nr of As % of response
Nr of As % of response
Respondents selecting at least one option ( 1 ) 5 10.0%
12 26.7%
Total ( 1 ) responses 6 1.2%
23 5.1%
Respondents selecting at least one option ( 2 ) 17 34.0%
29 64.4%
Total ( 2 ) responses 35 7.0%
96 21.3%
The above table illustrates the higher occurrence and number of group B
respondents selecting option (1) and/or option (2) when compared to group A.
This differece is further underlined when comparing the two groups in terms of
proportion (%) of total response.

43
5.2 Descriptive statistics
The statistical package RStudio (RStudio™, 2011) was used to compute the
descriptive statistics section of this chapter.
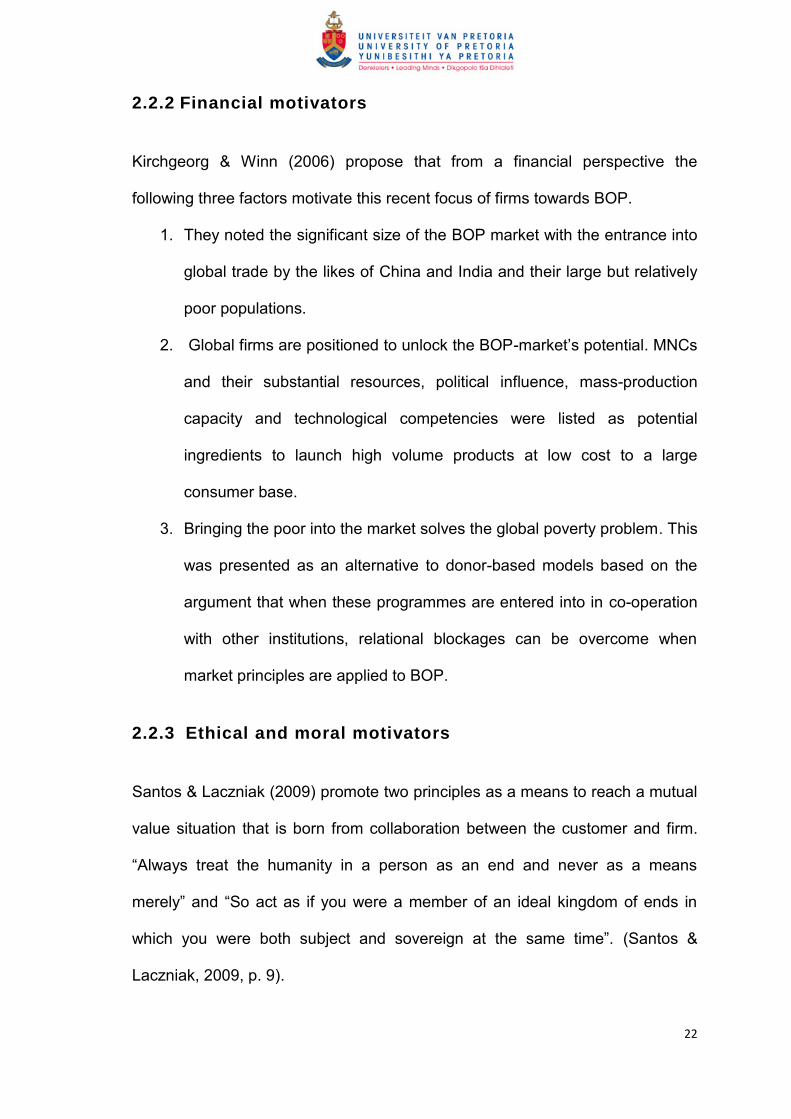
Histograms (figures 3 and 4) illustrate the distribution of attitudinal scores that
were calculated based on responses from sample groups A and B. These
scores tend towards normality according to the central limit theorem, given that
the sample sizes of both group A and group B exceed 30.
Figure 3: Histogram Group A
44
Figure 4: Histogram of Group B
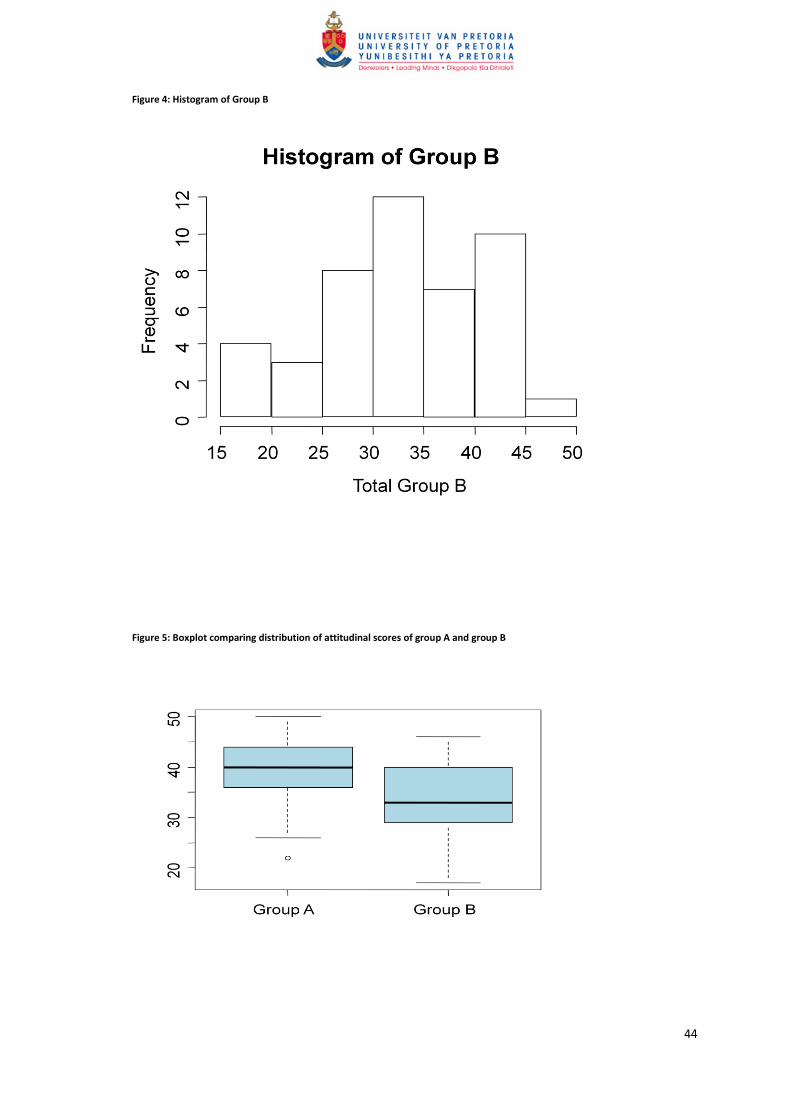
Figure 5: Boxplot comparing distribution of attitudinal scores of group A and group B

45
Table 6: Descriptive Statistical Tests output
Statistical Tests Group A Group B
Minimum 22 17
1st quartile 36 29
Median 40 33
Mean 39.51 33.42
3rd quartile 44 40
Maximum 50 46
Number of Outliers 1
Std. Deviation 6.5451 7.9786
Range 22.5 17.46
Variance 42.838 63.659
5.3 5.3 Analytical Statistics
FOR
F Test to compare two variances: Sample A and Sample B.
F STAT = 0.6729; numerator degrees of freedom = 48; denominator degrees of
freedom = 44; p-value = 0.9096;
Alternative hypothesis: true ratio of variances is greater than 1 at 95 percent
confidence interval: 0.4107808
BA
BA
H
H
:
:
1
0

46
Therefore the F STAT > F Distribution of α/2 results in rejecting H0 thus accepting H1
which states that there is a significant difference in the variability of the
distribution of the attitudinal scores of Sample A and Sample B.
Table 7: Analytical Statistical Output
WELCH T Test ( one-tailed) output: Testing for Statistical
Significant Differences in Sample Mean A and Sample
Mean B.
P-Value 0.00006166
Confidence Interval set at 95% YES
α = 0.05
YES
P Value > α YES
Reject Null Hypothesis
YES
Directional and significant statistical
difference by accepting alternate hypothesis. YES

47
Chapter 6 Discussion of results
This chapter will aim to illustrate that the design, instrument construction,
response and analysis hereof links to the hypothesis as described in chapter
three of this research project and that the design aligns with the literature study
as found in chapter two of this project. This chapter will critically evaluate the
data in terms of validity and interpret the data-analysis as outlined in chapter
five of this project and give insight into the meaning of the findings. This process
as a whole will also be critically evaluated in terms of limitations.
6.1 Was the response indicative of differing attitudes of
managers when faced with a potential BOP
customer?
From the initial collection of pilot data the aggregation hereof suggested that
managers achieved a higher attitudinal score when answering questions
pertaining to their attitude to a potential consumer who displays characteristics
that are similar to that of the middle-class, when compared to the attitudinal
scores of managers faced with a potential consumer who displays
characteristics that reflects that of BOP.
This difference is further signified when the larger population of the actual study
was exposed to the research instrument. The boxplot (Figure 5) on page 44 of
this research report illustrates this difference.
48
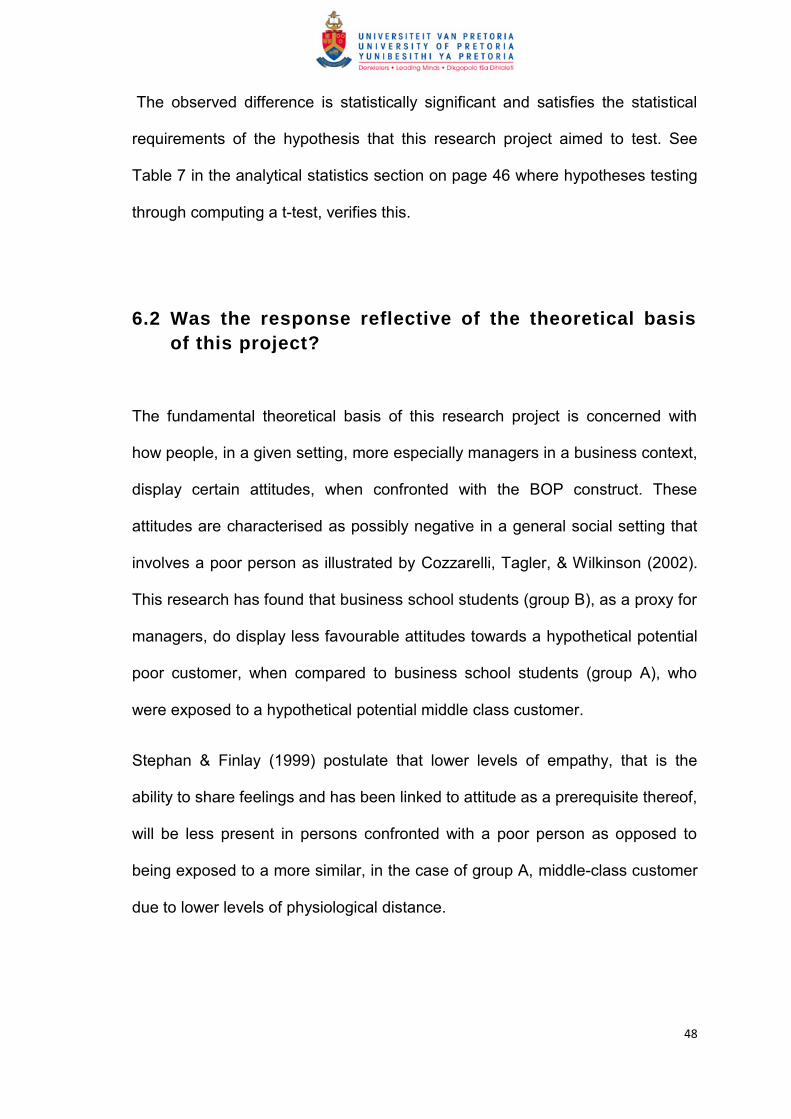
The observed difference is statistically significant and satisfies the statistical
requirements of the hypothesis that this research project aimed to test. See
Table 7 in the analytical statistics section on page 46 where hypotheses testing
through computing a t-test, verifies this.
6.2 Was the response reflective of the theoretical basis
of this project?
The fundamental theoretical basis of this research project is concerned with
how people, in a given setting, more especially managers in a business context,
display certain attitudes, when confronted with the BOP construct. These
attitudes are characterised as possibly negative in a general social setting that
involves a poor person as illustrated by Cozzarelli, Tagler, & Wilkinson (2002).
This research has found that business school students (group B), as a proxy for
managers, do display less favourable attitudes towards a hypothetical potential
poor customer, when compared to business school students (group A), who
were exposed to a hypothetical potential middle class customer.
Stephan & Finlay (1999) postulate that lower levels of empathy, that is the
ability to share feelings and has been linked to attitude as a prerequisite thereof,
will be less present in persons confronted with a poor person as opposed to
being exposed to a more similar, in the case of group A, middle-class customer
due to lower levels of physiological distance.

49
This research found that the differences between group A and group B is
illustrated by consistently lower means, minimum and maximum test statistics,
overall range, 1st and 3rd quartile statistics and medians, of group B when
compared to group A, refer to Table 4 in the descriptive statistics section on
page 41.
In Fishhein & Ajzen (1975), a direct link is drawn between attitude and
behaviour. The instrument that was used in this research proposes certain
behaviours and the propensity of the respondent towards these behaviours
whilst also enquiring from the respondents to rate themselves on certain
attitudinal feelings. The fact that aggregated responses per question, refer to
Table 4 on page41, in all cases, display higher scores for group A when
compared to group B corroborates this link.
The final evidence that is obtained refers to the data in Table 5 on page 42,
where the occurrences where respondents chose options (1) and/or (2). The
significance of this section highlights the less favourable attitude of group B
compared to that of group A in the following manner. In group B there were 12
respondents (representing 26.7% of the sample) that chose (1) as an option to
indicate their attitude, compared to the 5 respondents (representing 10% of the
sample) that chose option (1) in group A. Option (1) represented an “absolutely
not” in response to a “what is the likelihood of you…” type question. When
comparing the total occurrence of option (1) in the response of group B to that
of group A, it was observed that group B had selected the (1) option 23 times
(representing 5,1% of the total response) compared to group A, who had opted
for option (1) 6 times (representing 1,2% of the total response).

50
With respect to the similarly higher occurrence of option (2) both as an absolute
value as well as in proportion to the total response of that group the following
comparison was made:
Choosing option (2) as an option to indicate their attitude occurred 17 times
(representing 34% of the sample) compared to the 29 times (representing 64,
4% to the sample) in group B. When comparing the total occurrence of option
(2) in the responses of group B to that of group A, it was observed that group B
had selected the (2) option 96 times (representing 21,3% of the total responses)
compared to group A, who had opted for option (2) 35 times (representing 7%
of the total responses).
This comparison may be used to illustrate that managers are more likely to
respond in a less favourable way more of the time when confronted with a BOP
customer as opposed to how managers may respond to a middle class
customer.
6.3 Validity of the respondent’s attitudinal scores
6.3.1 External validity
In Struwig & Stead (2001) external validity entails the extent to which the results
of this study can be applied to other “external” populations. A particular strength
of the sample is that business students present a broad representation of senior
staff. A further strength of this sample is that the population from which this
sample was drawn comprises business school students between the ages 25 –
52, both males and females and is generally diverse in terms of culture and
language.

51
6.3.2 Internal validity
Struwig & Stead (2001) describe the concept internal validity as being
concerned with the manner in which the dependant variable (in this case the
attitudinal scores of samples A and B), is affected by the dependant variable (in
this case the economic context of the vignette).
Internal validity could be compromised by other externalities or “confounding
variables” as noted by Struwig & Stead (2001). These variables interfere with
the dependant variable to the extent as to cause variance over and above the
intended variance via the vignette as priming mechanism.
Table 8 on page 52 describes measures to enhance internal validity.

52
Table 8: Evaluation of internal validity – adopted from (Struwig & Stead, 2001, p. 137)
Extraneous variables and its influence on validity?
Design precaution Verdict on Validity
Maturation: Does the test scores change over time due to the natural growth of the person tested?
The research and was conducted on a once-off basis per respondent. Resulting in the unit of analysis representing an attitudinal score at a single point in time.
Valid
History: Were there changes in the independent variable due to events that are unrelated to the independent variable?
Due to the sample not being demographically analysed no inferences can be made in terms of history. The random allocation to a diverse population mitigates this validity risk somewhat.
Arguably Valid
Testing: Are changes in the participants test scores due to influence of prior testing?
Participants where only tested once. The population (as a popular sample) has, however been exposed to other tests (related to other research) recently which may or may not influence their responses.
Arguably Valid
Instrumentation: Changes in the questionnaire during data collection.
The instrument was at no time altered during the data collection phase. Valid
Regression to the mean: If samples are selected to high of low test scores convergence of scores towards a mean may occur regardless of the influence of an independent variable.
The whole sample, excluding incomplete responses, where used for statistical analysis.
Valid
Selection: The groups are not equivalent to key variables at the start of the study.
Highly equivalent groups were targeted at random, in such a manner that each respondent had a known chance to participate in either group -test A or B.
Valid
Attrition: Participants drop out during the research.
Approximately 90% of participants completed the survey. Only completed questionnaires were used to calculate attitudinal scores. The omission of 10% of the respondents due to their non-completion of the instrument could be argued as non-significant.
Arguably Valid
Diffusion of treatment: Participants communicate information of the research to other participants prior to testing which may influence their responses.
The population was targeted through a web-based instrument. Assuming that they completed the instrument reasonably secluded from other participants makes a case that low diffusion occurred.
Arguably Valid

53
6.4 Validity of the instrument
Struwig & Stead (2001) note that an instrument is deemed valid if it measures
what is intended for. The following criteria were used to assess the validity of
the instrument.
Table 9: Evaluation of the instrument’s validity – adopted from (Struwig & Stead, 2001, pp. 139-142)
Validity of the instrument Comment Verdict
Face Validity: Does the instrument measure what it claims to measure.
The face validity of the instrument was established at the pilot phase of this project. A critique of the instrument may be that part of the design is modified from a risk attitude scale and not a general attitude scale.
Arguably Valid
Content Validity: Does the test's items reflect the theoretical constructs that constitute, in this case attitude.
In chapter 4 the key literature that informs the instrument design is discussed and evidence of building constructs is presented. However, a critique of the design may be that the instrument was not sufficiently presented to experts in the field of attitude measurement, towards evaluating internal consistency of the items contained in the instrument.
Arguably Valid
Criterion-related Validity: Does the instrument correlate with other tests that purport to measure attitude.
Need to compare this instrument to similar tests - Limitations in this regard are that another instrument was never used on the population towards determining whether the output of this instrument correlates with another similar instrument's output. Similarly, no attempt was made to test whether concurrent use of a similar instrument that purports to measure a similar construct obtains similar test scores.
TEST NOT DONE
Construct Validity: Does the construct being tested bear relation to other related variables (as identified in the literature review).
In chapter 4 the key literature that informs the instrument design is discussed and evidence of building constructs is presented. Arguably
Valid
Convergent and discriminate Validity: The test score should correlate with similar tests and should have low correlation with tests measuring a different construct.
Need to compare this instrument to similar tests
TEST NOT DONE

54
A last measure employed to assess whether the instrument displayed internal
reliability was to compute Cronbach’s Coefficient Alpha with the two data sets –
pertaining to group A and B.
Blumberg, Cooper, & Schindler (2008) describe Cronbach’s test statistic as a
manner in which to test whether correlation exists between the individual test
items. Consistency here indicates that the test is reliable and would be useful
for replication.
The instrument when subjected to Cronbach in terms of group A delivered an
alpha value where α = 0.8864911; in terms of group B, α = 0.9110575.
At these levels the instrument’s validity and consistency may be considered
good to excellent.
6.5 Inferences from the descriptive statistical output
A point of departure for this section entails a comparison of the two histograms
as found on pages 43 and 44 of this chapter. What seemed prominent when
comparing figure 3 (Histogram of Group A) to figure 4 (Histogram of Group B) is
the lower frequency of Group B’s attitudinal scores in the area greater than 35
and the higher occurrence of Group B’s attitudinal scores in the area lesser than
35.

55
A second observation is concerned with individually comparing the average
score per question of the instrument. Of significance is the fact that in all ten
questions used to test for attitude, the average score of group B respondents
was less than the average score of group A respondents for each question.
The above observation is corroborated by the boxplot figure 5 on page 44
where a difference between the distributions of A scores and B scores and the
concurrent mean scores of the respective groups were observed with group B
markedly lower than that of group A.
A fourth and compounding observation relates to Table 6 on page 45 in which
the cases of comparing the mean, minimum, maximum median, 1st quartile and
3rd quartile scores of group A and group B, group B scores decidedly lower than
the corresponding score in group A.
In chapter three, it was hypothesised that when faced with a potential poor
customer, attitudes of managers towards this construct will be less favourable
than their counterparts who are faced with a potential middle-class customer.
The above four observations all satisfy the above hypothesis.
The second consideration towards testing the hypothesis and essentially
accepting the alternative hypothesis H1 relied on testing whether the difference
between the attitudinal mean scores of group A and group B were a statistically
significant difference.

56
The corroborating nature of these descriptive test and statistics infer that the
statistically significant difference is indeed basis to infer that the difference
between managers’ attitudes, illustrated through attitudinal scores, notably differ
when faced with potential customers of differing economical capacity.
These observations also clearly illustrate a directional difference with managers’
attitudinal scores (group B) towards poorer customers being less favourable
than their counterparts in group A.
6.6 Inferences form the analytical statistics
At a confidence interval of 95% where α = 0.05, the probability that the mean of
A was equal to the mean of B (H0), or otherwise known as the P Value, was
computed to be 0.00006166, which is notably less than the 0.05 confidence
level. This resulted in us rejecting H0 accepting H1 which states that a statistical
significant difference between the mean scores of group A and group B was
observed. The relative power of this test statistic infers that the statistically
significant difference is indeed basis to infer that the difference between
managers’ attitudes, illustrated through attitudinal scores, notably differ when
faced with potential customers of differing economical capacity.
6.7 The response as indicative of managers’ generally
less favourable opposed to unfavourable attitudes
towards BOP customers
This research project set out to establish through an experimental design,
whether managers’ attitudes to poor customers is different when compared to
managers’ attitudes towards middle-class customers.

57
The literature review for this project suggested that generally unfavourable
attitudes have been observed to poor persons in a social context with reference
to less favourable attitudes to poor persons a second feature of the secondary
data.
The instrument that was used in this experiment tested for attitude based on a
five-point scale that had on the least favourable or negative end of the scale,
answers that constituted “not at all” whilst the most favourable or positive end of
the scale had “absolutely” as the answer option.
The mean of group B centred slightly more favourable than the “maybe” option
whilst the mean of group A centred slightly below the “probably” answer on the
scale. This infers that group A, with more than 50% of respondents scored at a
higher level than “probably”, could be described as a favourable attitude score,
group B’s attitudinal score, although significantly lower than that of group A,
cannot convincingly be labelled as negative. To further qualify this statement, it
was found that only 32% of the respondents in group B scored lower than the
“maybe” level. What can, however, be inferred from the data is that group B did
appear to score at a less favourable level.
Whilst the research title specifically refers to managers’ attitudes, the population
of this study was business school students as a proxy for managers. The use of
this popular sample, despite its merits, has particular weaknesses and
limitations which limit the extent to which inferences to a more universal
population could be made. The following section is concerned with critically
evaluating the design and response.

58
6.8 Design: Limitations and assumptions
Disadvantages and limitations to the experimental design, as described in
Blumberg, Cooper, & Schindler (2008), state that experimental designs are not
a clear reflection of the real world, in that data are in fact collected from an
artificial environment.
This research assumes that due to the admission requirements of business
schools, particularly that of the GIBS part-time MBA programme, a large
proportion of the students are at a fairly advanced level in their respective
organisations. In terms of this project, how well the participant can view the
dilemma from a manager’s perspective, is questionable and limits the extent to
which results from this study may be generalised to the universal business
world which may result in business’ interest in this particular topic to be limited
also. In terms of questionnaire design the following may have been improved
upon if we take the following by Struwig & Stead (2001) into consideration:
a) start with general to specific questions;
b) have a specific order that will ensure that participants are sufficiently
interested in the topic as this will minimise non-response error (including non-
completion of instrument);
c) consider what effect one question will have on another.

59
The work of Likert (1974) could be critical of the scale construction in this
project, with the principle that scales should be purposely constructed towards
neutrality. This is done with designing a scale of two halves: one that generates
a right-tailed response and one that generates a left-tailed response. Items
should then be randomised.
The above limitations are to an extent downplayed given the following two
factors:
1) The relative strength of the Cronbach’s test statistic output when
subjected to data from group A and Group B. The instrument designed
for this study achieved α = 0.8864911 with group A’s response and α =
0.9110575 with group B.
In Hair, Black, Babin, & Anderson (2010), test staticstics between .60
and .70 is described as being at the lowest acceptible level with test
statistics ranging between .80 and .90 being desribed as indicative of a
reliable instrument.
2) The observed consistently lower attitudinal scores, per instrument item,
that group B achieved relative to group A.

60
Chapter 7 Conclusion
7.1 Did the research deliver on the scope it set out to
achieve?
This research set out to establish whether managers’ attitude towards BOP
customers is less favourable, relative to managers’ attitude to middle-class
customers. This research project was undertaken based on how literature that
discusses BOP as a market option suggests that attitudes may be one of many
challenges that firms may experience when marketing to the poor.
Literature also calls for mindsets to change towards a more positive view of
poor consumers. Kirchgeorg & Winn (2006) note the shift in business strategy
discourse towards BOP and motivate their work by calling on researchers and
practitioners to motivate a greater engagement with the poor.
From the literature review it was not clear to what extent managers’ attitudes to
poor customers differed towards their attitudes towards middle-class customers.
It was, however, well described that attitudes to poor people in a social context
were less favourable and in some cases even negative. It was postulated that
business' mindset may be a barrier towards engaging with BOP markets
despite the incentives and benefits that literature puts forward for marketing to
the poor. Whether this attitude is negative, neutral, less favourable or similar
was not well understood.

61
Despite current arguments on business strategy that propose the poor is
indeed a viable option for business ventures, and that business ventures are a
viable option towards solving poverty, negative attitudes towards the poor were
presented as a barrier to these ventures in (Prahalad, 2005). This research
report set out to explore if other factors causes firms to engage with poor
markets, other than the known size and ability of this market to consume.
This report found that a sample exposed to a potential poor customer achieved
a lower attitudinal mean score compared to a sample exposed to a middle-class
customer. This report therefore argues that other factors, despite market size,
may be at work in driving a decision whether to engage with poorer markets.
This notion is supported by the manner in which respondents’ answers
consistently centred on and around a “likely propensity” towards positive actions
when confronted with the wealthier customer scenario. This was true also for
the average score of all ten questionnaire answers. In line with this when
confronted with the poor customer, respondents consistently chose less
favourable responses that centred on and around the “maybe-propensity” on
the instrument.
Whilst this does not conclusively signal negative attitudes towards poor
customers as held by managers, the more frequent occurrence of responses in
the “unlikely” and “absolutely not” section of the instrument signal negativity.
This finding is supported by the similarly higher proportion of responses in the
“unlikely” and “absolutely not” section of the instrument.

62
Having said this, the findings of this research project, can with a high level of
confidence, report that attitudes of a sample of managers display a less
favourable attitude towards a poor customer than is the case with a similar
sample exposed to a wealthier customer and tentatively suggests that instances
of negative attitudes to poor customers may be observed.
The report positions itself as relevant to business globally and also to the South
African business community. Due to the global interest in emerging economies
as a destination for investment, South African firms can expect to engage with
on average poorer consumers, more so than those in the management ranks of
a firm that follow the more traditional investment choice of developed
economies.
This report cautions these firms to be conscious of the fact that their
management complement at all levels may hold less positive views toward new
and existing poorer customers. Firms that have expansion or acquisition goals
into dynamic markets on their agenda are cautioned that non-financial and
operational factors should not be the only elements that are examined prior to
making the investment decision.
This report refers particularly to academics and firms in South Africa firstly due
to the sample which is made up of managers, approximated by business school
students that either live or work in South Africa. Secondly, South Africa is part of
Africa and as such, firms in South Africa in many instances plan to market or
already market their goods and services to BOP customers.

63
A third relevant intersection with South Africa, but also relevant to other
dynamic-economies, is the known high occurrence of unemployed and poor
citizens and the resulting higher probability that a firm in South Africa is likely to
transact with poor customers.
Whilst this report does not actively explore the effects of less favourable
attitudes towards poor customers, this report is concerned with creating
awareness of this notion amongst practitioners and academia. Given the fact
that this study concerns managers, enrolled at a business school, this study
claims to be forward thinking, in that tomorrow’s academic and business leaders
may well be represented in the sample that was drawn.
Whilst this report does not present an opinion on whether negative or less
favourable attitudes are in fact ethical or productive, this report is concerned
with illustrating that due to noted instances of such attitudes, firms may find it
more difficult to innovate, engage and collaborate with the poorer market
segments that they target.
And lastly, whilst this report does not claim to describe a correct or appropriate
scenario with regard to the attitudes or behaviour of managers, this report does
attempt to describe that firms may be less market-driven given the observed
instances of managers’ less favourable attitudes to BOP.

64
7.2 Limitations and concerns
Limitations to this study relate mostly to the design trade-off. Given the
population, sample and experimental design of this study, despite well
motivated, limits the extent to which inferences may be drawn to the real word.
The use of vignettes as opposed to real life customers is an example hereof.
Having said this, the relative strength of the results mitigates some of the design
trade-off. The seeming scarcity of literature that explicitly deals with the
particular research topic, leaves certain questions unanswered, such as why
less-favourable attitudes to poor customers manifest? This research aimed to
spark interest in this area.
7.3 Possible scope for follow-on research
An indication that attitudes are present in decision-making is found in Allphin
(2005) and in Elm and Nichols (1993). Ethical attitude is defined in Allphin
(2005) as a person’s inner-authority and it is noted that it is not clearly defined,
but manifests in doubt and uncertainty, which further links with the formal codes
of ethics, but is more complex than simply following the rules. In so far as a
definition of moral reasoning is concerned, Elm & Nichols (1993) explain this
construct as the cognitive skills a manager uses to reason about a moral
problem. Research concerned with exploring the links between ethical theories
as causal to less favourable attitudes may better explain this phenomenon.

65
Reference List
Albright, S. C., Winston, W. L., & Zappe, C. J. (2009). Data analysis & decision
making. Mason: Cenage.
Allphin, C. (2005). An ethical attitude in the analytic relationship. Journal of
Analytical Psychology ,50, 451–468.
Anderson, J., & Billou, N. (2007). Serving the world’s poor: Innovation at the
base of the economic pyramid. Journal of Business Strategy, 28 (2), 14-21.
Blumberg, B., Cooper, D. R., & Schindler, P.S. (2008). Business research
methods. New York: McGraw-Hill.
Burchelland, J., & Cook, J. (2006). It’s good to talk? Examining attitudes
towards corporate social responsibility dialogue and engagement processes.
Business Ethics: A European Review ,15 (2), 154-170.
Cooper, R., & Boye, A. (2005). The scramble for bop penetration in
tellecommunications. UK: Cactel Communications. Retrieved from
http://cactel.net/pdf/gmi51coop%5B1%5D.pdf.
Cozzarelli, C., Tagler, M. J., & Wilkinson, A. V. (2002). Do middle-class
students perceive poor women and poor men differently? Sex Roles , 519-529.
doi: 10.1023/A:1022038200071.
Cozzarelli, C., Wilkinson, A. V., & Tagler, M. J. (2001). Attitudes toward the poor
and attributions for poverty. Journal of Social Issues, 27 (2), 207-227.
doi: 10.1111/0022-4537.00209.
Elm, D., & Nichols, M. (1993). An investigation of the Moral Reasoning of
Managers. Journal of Business Ethics , 12 (11), 817-833. doi:
10.1007/BF00871663.

66
Fishhein, M., & Ajzen, I. (1975). Belief, attitude, intention and behaviour. An
introduction to theory and research. Massachusetts: Addison-Wesley.
Gardetti, M. A. 2007. A base-of-the-pyramid approach in Argentina: Preliminary
findings for a bop lab. Greener Management International, 51, 65-77.
Hair, J. F., Black, W. C., Babin, B. J., & Anderson, R. (2010). Multivariate data
analysis. New Jersey: Pearson.
Hendrickson, R. M., & Axelson, L. J. (1985, June). Middle-Class Attitudes Toward the Poor: Are They Changing? The Social Service Review , 59.(2), 295-304. Karnani, A. (2007). Misfortune at the bottom of the pyramid. Greener
Management International, 51, 99-110.
Kirchgeorg, M., & Winn, M. (2006). Sustainability Marketing for the Poorest of
the Poor. Business Strategy and the Environment, 15 (3), 171–184.
Landrum, N. E. (2007). Advancing the “base of the pyramid” debate. Strategic
Management Review, 1 (1). Retrieved from
http://www.strategicmanagementreview.com/ojs/index.php/smr/article/viewArticl
e/12/18
Levine, D. M., Krehbiel, T. C., & Berenson, M. L. (2010). Business Statistics.
New Jersey: Pearson.
Likert, R. (1974). The method of constructing and an attitude scale. In Maranell,
G. M. (Eds.), Scaling a sourcebook for behavioral scientists, (pp. 233-237). New
Jersey: New Brunswick.
Louw, A. I. (2008). Redefining BOP: In pursuit of sustainable opportunity at the
base of the economic pyramid (Master’s Thesis). Retrieved from UPeTD:
http://upetd.up.ac.za/thesis/available/etd-03122010-162623/
Murray, S. (2010, June). Millennium development goals: Profit has a place at
the base of the pyramid. Financial Times. Retrieved from

67
http://www.ft.com/intl/cms/s/0/1f9efd00-6f76-11df-9f43-
00144feabdc0.html#axzz1cg6KYSEn
Olsen, M., & Boxenbaum, E. (2009). Bottom-of-the-Pyramid: Organisational
barriers to implimentation. California Management Review, 51 (4), 110-125.
Pennings, J. M. E., & Smidts, A. (2000). Assessing the construct validity of risk
attitude. Management Science , 46 (10), 1337-1348.
Phau, I., & Kea, G. (2007). Attitudes of university students toward business
ethics: A cross-national investigation of australia, singapore and Hong Kong.
Journal of Business Ethics , 72 (1), 61-75. doi: 10.1007/s10551-006-9156-8.
Prahalad, C. K. (2002). Strategies for the bottom of the economic pyramid: India
as a source of innovation. Society for Organizational Learning, 3 (4), 6-17. doi:
10.1162/152417302760127192.
Prahalad, C. K. (2005). The fortune at the bottom of the pyramid: Eradicating
poverty through profits. New Jersey: Wharton School Publishing.
Prahalad, C. K., & Hammond, A. (2002). Serving the world’s poor, profitably.
Harvard Business Review, 80(9), 48–58.
Prahalad, C., & Hart, S. L. (2002). The fortune at the bottom of the pyramid.
Strategy + Business, (26), 1-11.
RStudio™. (2011). Introducing RStudio. Retrieved from R: http://rstudio.org/
Santos, N. J. C., & Laczniak, G. R. (2009). Marketing to the poor: An integrative
justice model for engaging impoverished market segments. Journal of Public
Policy & Marketing, 28 (1), 3–15.
Sniderman, P.M., & GrobSource, D. (1996). Innovations in experimental design
in attitude surveys. Annual Review of Sociology, 22, 377-399.

68
Stephan, W. G., & Finlay, K. (1999). The role of Empathy in Improving
Intergroup relations. Journal of Social Issues , 729-743.
Struwig, F.W., & Stead, G. B. (2001). Planning, designing and reporting
research. Cape Town: Pearson Education South Africa.
SurveyMonkey. (2011). LOGIN. Retrieved September 1, 2011, from Survey
Monkey: http://www.surveymonkey.com/
Froth at the bottom of the pyramid. (2009, August). The Economist. Retrieved
from http://www.economist.com/node/14298996.
Welch, B. L. (1947). The Generalization of `student's' problem when several
different population variances are involved. Biometrika, 34 (1/2), 28-35 .
Welman, J. C., & Kruger, S. J. (2001). Research Methodology. Cape Town:
Oxford University Press.
Williams, W. R. (2009). Struggling with poverty: Implications for theory and
policy of increasing research on social class-based stigma. Analyses of Social
Issues and Public Policy, 9 (1), 37-56. doi: 10.1111/j.1530-2415.2009.01184.x
Zgheib, P. W. (2005). Managerial Ethics: An Empirical Study of Business
Students in the America n University of Beirut. Journal of Business Ethics, 61
(1), 69-78. DOI: 10.1007/s10551-004-6394-5

69
Appendix A The instrument
Consent Section:
I am doing research on Business Managers’ attitudes. To that end you are asked to respond to
a number of questions regarding your propensity toward certain hypothetical actions. You will
receive a brief illustration of a customer that is to be read prior to completing the questionnaire.
Your response will assist researchers to better understand causality factors in attitudes towards
customers. The reading of the illustration & completing of the questionnaire should take no
more than 10 minutes to complete.
Your participation is voluntary and you may withdraw at any time without penalty. All data will be
kept confidential and no identifiable information regarding your person will be collected.
Please be as honest and accurate as possible. Consider your responses carefully.
Any concerns and questions pertaining to this research may be directed to me or my supervisor
- our contact details are enclosed.
Researcher: Danie Nel Supervisor: Gavin Price
Email: [email protected] Email: [email protected]
Phone: 084 747 0122 Phone: +27 11 771 4136

70
Please consider the following potential customer.
VIGNETTE (GROUP A)
Alex is planning to host a birthday for a sibling. Roughly 30 friends & family will be invited to this party.
Alex owns a property in Johannesburg, and is planning to host the party at home. Arrangements are
made with a firm that specializes in function hire – payment to them was made in advance using a
personal credit card. A DJ who, will be paid in cash, is arranged and entertainment for the kids of some of
the people invited to this party is also arranged. Alex will take the next two days off from work, on the
basis that some time-off is due to Alex because of some business travelling that Alex was involved in off
late. During this time-off final arrangements relating to the following has to be done:
- Finalise arrangements and menu planning with a small local catering business.
- Do weekly maintenance of the pool and garden.
- Pick up a pair of double-tickets to a concert by a famous international artist (this would be the gift to
the sibling).
- Visit the bank to finalise a small personal loan towards the renovating of the bathrooms that Alex was
going to do in any case, but thought that it might as well happen prior to the party, and make the decent
looking house that Alex calls home look a touch nicer for when the friends and family arrive.
VIGNETTE (GROUP B)
Alex spent a large part of childhood in and out of school. Due to the financial burden of being
raised in a single parent home this was the norm in Alex's neighbourhood. Alex has many
brothers and sisters and must lend hand where possible, even if it means going into town to ask
passing motorists for spare change, in return for possibly washing or keeping an eye out for
their cars in a nearby car park.
Alex is now faced with the difficult task, yet again, of finding meaningful employment.
However, this will have to wait a day as Alex must accompany a frail, elderly family member to
the queue to collect a social grant.
Despite the frustration of this trip, the long queues, long walk and endless forms to be filled in,
the money they will receive today is of vital importance to the family of six.

71
Assume that you are you are a manager in a firm that
sells “widgets” (a universal term for a manufactured device) and after sales services and upgrades for
this widget and similar widgets.
Consider now the potential customer and answer the questions that follow. Answers were required in
the below manner.
Not at all Unlikely Maybe Probably Absolutely
Mark an option.
1. WHAT IS THE LIKELIHOOD OF YOU SPENDING MONEY TOWARDS MARKETING THE FIRM’S PRODUCTS TO THIS PERSON?
2. WHAT IS THE LIKELIHOOD OF YOU MARKETING YOUR SERVICES TO THIS PERSON?
3. WHAT IS THE LIKELIHOOD OF YOU MODIFYING YOUR OFFERING TO BETTER SUIT THIS PERSONS’ TASTES AND NEEDS?
4. WOULD YOU WORK LATE TO ENSURE THAT COMPLAINTS, FROM THIS PERSON AND SIMILAR CUSTOMERS GET RESOLVED?
5. DO YOU ASPIRE TO HAVE THIS PERSON AS A CUSTOMER?
6. DO YOU REGARD THIS PERSON AS DESERVING OF YOUR TIME?
7. WOULD YOU DESCRIBE YOUR ATTITUDE TOWARDS THIS PERSON AS FAVOURABLE?
8. WOULD YOU VALUE THE OPINION OF THIS POTENTIAL CUSTOMER REGARDING YOUR PRODUCT & SERVICE?
9. DO YOU FEEL THAT IT WOULD BE IN THE BEST INTEREST OF THE FIRM TO TARGET THIS PERSON AS A CUSTOMER?
10. WOULD YOU WANT TO BE ASSOCIATED WITH THIS CUSTOMER?
.

72
Appendix B Summarised collected data
Table 10: Data extracted from Survey Monkey
q1 q2 q3 q4 q5 q6 q7 q8 q9 q10 SC OR E q1 q2 q3 q4 q 5 q6 q7 q 8 q9 q10 SC OR E
1 5 4 5 3 4 5 4 5 4 4 4 3 1 1 2 3 4 5 6 7 8 9 10 55
2 2 2 2 4 4 5 4 5 2 3 3 3 2 1 1 2 2 2 2 3 2 3 1 19
3 2 2 2 3 2 2 1 3 2 3 2 2 3 2 2 2 1 1 3 2 3 2 2 2 0
4 5 4 4 5 3 4 5 5 5 4 4 4 4 4 4 4 5 5 5 5 5 4 4 4 5
5 3 4 4 4 5 3 4 5 3 3 3 8 5 2 3 4 1 1 2 2 2 2 2 2 1
6 4 4 5 5 4 4 4 5 4 4 4 3 6 4 2 4 5 5 5 5 5 4 3 4 2
7 3 3 2 3 4 2 3 2 4 4 3 0 7 2 2 2 2 2 2 3 3 2 2 2 2
8 2 3 3 3 4 3 4 4 4 4 3 4 8 2 2 3 2 3 4 2 3 3 2 2 6
9 2 3 2 3 3 3 3 2 2 3 2 6 9 2 2 2 4 4 4 5 4 3 4 3 4
10 4 4 2 3 3 4 4 1 3 3 3 1 10 5 5 4 4 5 5 4 5 4 3 4 4
11 5 5 5 5 5 5 5 5 5 5 50 11 2 2 2 2 2 2 2 2 2 2 2 0
12 Incomplete response 12 Incomplete response
13 Incomplete response 13 1 1 1 2 1 2 3 3 1 2 17
14 5 5 5 2 5 5 5 3 4 3 4 2 14 3 3 4 4 3 4 4 4 3 3 3 5
15 Incomplete response 15 Incomplete response
16 2 3 4 5 4 3 4 5 4 4 3 8 16 4 3 5 4 4 5 5 5 4 4 4 3
17 3 3 3 3 3 3 3 3 3 3 3 0 17 Incomplete response
18 3 4 5 5 5 5 5 5 5 5 4 7 18 2 3 4 2 2 4 5 5 2 2 3 1
19 4 4 5 5 5 5 4 4 5 4 4 5 19 Incomplete response
2 0 2 3 4 4 3 4 2 4 3 3 3 2 2 0 5 4 3 5 5 5 5 5 4 3 4 4
2 1 3 4 2 3 3 4 4 2 3 3 3 1 2 1 2 2 4 5 3 4 4 5 3 5 3 7
2 2 Incomplete response 2 2 2 2 3 3 3 4 4 4 3 4 3 2
2 3 4 3 4 4 4 4 4 4 4 4 3 9 2 3 3 2 4 4 2 4 4 3 3 2 3 1
2 4 4 4 3 4 4 4 3 4 4 4 3 8 2 4 4 4 5 3 4 5 5 5 4 5 4 4
2 5 4 5 4 5 4 4 5 5 4 4 4 4 2 5 2 2 3 5 4 5 4 4 5 4 3 8
2 6 3 4 3 5 4 4 4 5 4 5 4 1 2 6 4 4 5 5 3 4 4 5 3 3 4 0
2 7 5 4 3 2 1 2 3 4 5 4 3 3 2 7 3 4 4 5 3 4 4 5 3 4 3 9
2 8 3 3 4 4 5 5 4 4 4 4 4 0 2 8 3 3 2 4 3 4 3 2 3 3 3 0
2 9 3 4 4 5 5 4 4 5 4 4 4 2 2 9 2 2 2 2 2 4 4 3 2 3 2 6
3 0 4 2 4 5 4 5 5 4 4 4 4 1 3 0 2 2 3 3 3 3 3 3 3 3 2 8
3 1 4 4 4 5 5 5 2 5 5 5 4 4 3 1 4 4 5 3 4 5 5 4 2 3 3 9
3 2 5 5 3 5 5 5 5 5 5 5 4 8 3 2 2 4 2 4 3 4 2 2 2 2 2 7
3 3 3 3 3 3 4 4 4 4 4 4 3 6 3 3 3 2 3 3 3 4 4 4 3 3 3 2
3 4 4 4 4 4 4 4 4 4 4 4 4 0 3 4 2 2 3 4 4 4 3 3 4 4 3 3
3 5 3 4 3 4 4 4 4 5 4 4 3 9 3 5 2 2 2 4 3 4 2 4 3 3 2 9
3 6 5 5 4 5 5 5 5 5 5 4 4 8 3 6 3 3 3 5 1 3 4 3 4 2 3 1
3 7 5 5 5 5 5 4 3 4 5 4 4 5 3 7 3 3 5 5 4 5 4 5 3 4 4 1
3 8 3 3 4 5 5 4 4 4 3 3 3 8 3 8 1 3 4 5 2 3 4 5 2 4 3 3
3 9 4 4 4 5 5 5 5 5 5 5 4 7 3 9 3 3 4 5 5 4 4 4 4 4 4 0
4 0 4 4 2 4 4 4 4 4 4 4 3 8 4 0 2 2 3 5 2 5 4 4 1 3 3 1
4 1 2 3 1 2 1 3 4 4 3 3 2 6 4 1 Incomplete response
4 2 4 4 3 4 5 4 4 5 4 2 3 9 4 2 3 3 5 5 5 5 5 5 4 5 4 5
4 3 Incomplete response 4 3 3 3 4 3 3 3 3 4 3 3 3 2
4 4 3 4 4 4 5 5 4 4 5 4 4 2 4 4 4 4 5 5 3 5 3 5 3 4 4 1
4 5 5 5 5 5 5 5 5 5 5 5 50 4 5 3 3 4 4 3 4 4 3 3 4 3 5
4 6 3 3 4 4 4 4 4 3 4 4 3 7 4 6 4 1 3 5 4 5 5 4 5 5 4 1
4 7 5 5 2 4 5 4 5 4 5 5 4 4 4 7 1 2 3 5 4 5 4 4 5 5 3 8
4 8 4 4 4 4 4 4 4 4 4 4 4 0 4 8 1 2 3 2 1 3 2 4 3 3 2 4
4 9 3 4 1 5 4 4 4 3 4 4 3 6 4 9 1 1 2 4 4 4 3 4 3 3 2 9
50 4 4 4 5 5 4 4 5 4 5 4 4 50 1 1 2 4 4 4 3 4 3 3 2 9
51 4 4 4 5 5 4 4 5 4 5 4 4 51 4 4 5 5 5 5 5 5 4 4 4 6
52 4 5 4 4 5 5 5 4 5 5 4 6
53 4 5 5 4 5 5 5 5 4 4 4 6
54 Incomplete response
55 4 4 5 5 5 5 5 5 5 5 4 8
56 3 4 3 5 2 5 5 5 2 4 3 8
R espondent N r ( g roup B )R espondent N r ( g roup A )

73
Appendix C R STUDIO output sheet
R version 2.13.1 (2011-07-08); Copyright (C) 2011 The R Foundation for Statistical Computing ISBN 3-900051-07-0 Platform: i386-pc-mingw32/i386 (32-bit); R is free software and comes with ABSOLUTELY NO WARRANTY. Type 'license()' or 'licence()' for distribution details. R is a collaborative project with many contributors. Type 'contributors()' for more information and 'citation()' on how to cite R or R packages in publications.
Descriptive statistics
Summary(totalNewA): Min. 1st Qu. Median Mean 3rd Qu. Max. NA's; 22.0, 36.00, 40.00, 39.51, 44.00, 50.00 1.00
> summary(totalNewB): Min. 1st Qu. Median Mean 3rd Qu. Max. 17.00 29.00 33.00 33.42 40.00 46.00
> sd(na.exclude(totalNewA)): [1] 6.545108; > sd(na.exclude(totalNewB)): [1] 7.978633
> var(na.exclude(totalNewA)): [1] 42.83844; > var(na.exclude(totalNewB)): [1] 63.65859
> range(na.exclude(totalNewA)): [1] 22 50; > range(na.exclude(totalNewB)): [1] 17 46
> boxplot(totalNewA, totalNewB, col="lightblue", names=c("Group A","Group B"))
Analytical statistics
> Tests for equal variance > var.test(totalNewA, totalNewB,alternative="greater")
F test to compare two variances data: totalNewA and totalNewB
F = 0.6729, num df = 48, denom df = 44, p-value = 0.9096
alternative hypothesis: true ratio of variances is greater than 1; 95 percent confidence interval: 0.4107808
Inf sample estimates: ratio of variances 0.6729404;
> t.test(na.exclude(totalNewA), na.exclude(totalNewB), alternative="greater",var.equal=FALSE,conf.level=0.95)
Welch Two Sample t-test data: na.exclude(totalNewA) and na.exclude(totalNewB);
t = 4.024, df = 85.319, p-value = 6.166e-05 (0.00006166)
alternative hypothesis: true difference in means is greater than 0; 95 percent confidence interval: 3.572153

74
Inf sample estimates: mean of x mean of y 39.51020 33.42222
Tests for normality
> ad.test(totalNewA) Anderson-Darling normality test; data: totalNewA; A = 0.5425, p-value = 0.1555
> ad.test(totalNewB) Anderson-Darling normality test; data: totalNewB;
A = 0.4684, p-value = 0.2379
> wilcox.test(na.exclude(totalNewA),na.exclude(totalNewB),alternative="greater",paired=FALSE,conf.level=0.95)
Wilcoxon rank sum test with continuity correction; data: na.exclude(totalNewA) and na.exclude(totalNewB)
W = 1576, p-value = 0.0001689
alternative hypothesis: true location shift is greater than 0
Test for Instrument Reliability: Cronbach’s Alpha
cronbach(NEWA) $Alpha; [1] 0.8864911; $N [1] 50
cronbach(NEWB) $Alpha; [1] 0.9110575; $N [1] 45