managing for growth - taking hsbc to the next level
TRANSCRIPT
Managing for growthTaking HSBC to the next levelPrepared for
Merrill Lynch Conference – London – October 2006
Michael GeogheganGroup Chief Executive Officer

Forward-looking statements
This presentation and subsequent discussion may contain certain forward-looking statements with respect to the financial condition, results of operations and business of the Group. These forward-looking statements represent the Group’s expectations or beliefs concerning future events and involve known and unknown risks and uncertainty that could cause actual results, performance or events to differ materially from those expressed or implied in such statements. Additional detailed information concerning important factors that could cause actual results to differ materially is available in our Annual Report.

Story so far… does it tell all?

0
500
1,000
1,500
2,000
2,500
3,000
Jun-91 Jun-94 Jun-97 Jun-00 Jun-03 Jun-06
Total shareholder return
90
100
110
120
130
140
Jul-04 Nov-04 Apr-05 Aug-05 Jan-06 Jun-06
HSBC TSR – two years, 13% CAGRHSBC TSR – 15 years, 25% CAGR

HSBC – record of growthDividends per share/earnings per share
0
20
40
60
80
100
120
140
1995 1996 1997 1998 1999 2000 2001 2002 2003 2004 2005
DPS EPS
(US cents)
UK GAAP (excl goodwill amortisation) IFRS
Asian crisis Argentinean crisis
EPS + 25% CAGR
EPS + 15%
DPS1
16% CAGR 1995-2005
(1) DPS are in respect of periods shown above

HSBC half year results
9.48.7Tier 1 ratio (%)
+70.300.28Dividends per share (US$), first and second interim dividends
+130.780.69Earnings per share (US$)
+158,7297,596Profit attributable to shareholders
+1812,51710,640Profit before tax
+12(16,139)(14,420)Total operating expenses
+1428,29524,752Net operating income
+1532,18528,029Net operating income before loan impairment charges
% changeH106H105US$m

Has HSBC got too much capital and should it be returned to shareholders?

US$93bn
US$97bn
US$102bn
70
80
90
100
110
H104 H204 H105 H205 H1065
10
15
20
Average invested capital employed (US$bn) Return on invested capital (%) Tier 1 ratio (%)
24% annualised return fromadditional US$9bn of capital
(US$bn)
Improving capital efficiency
(%)
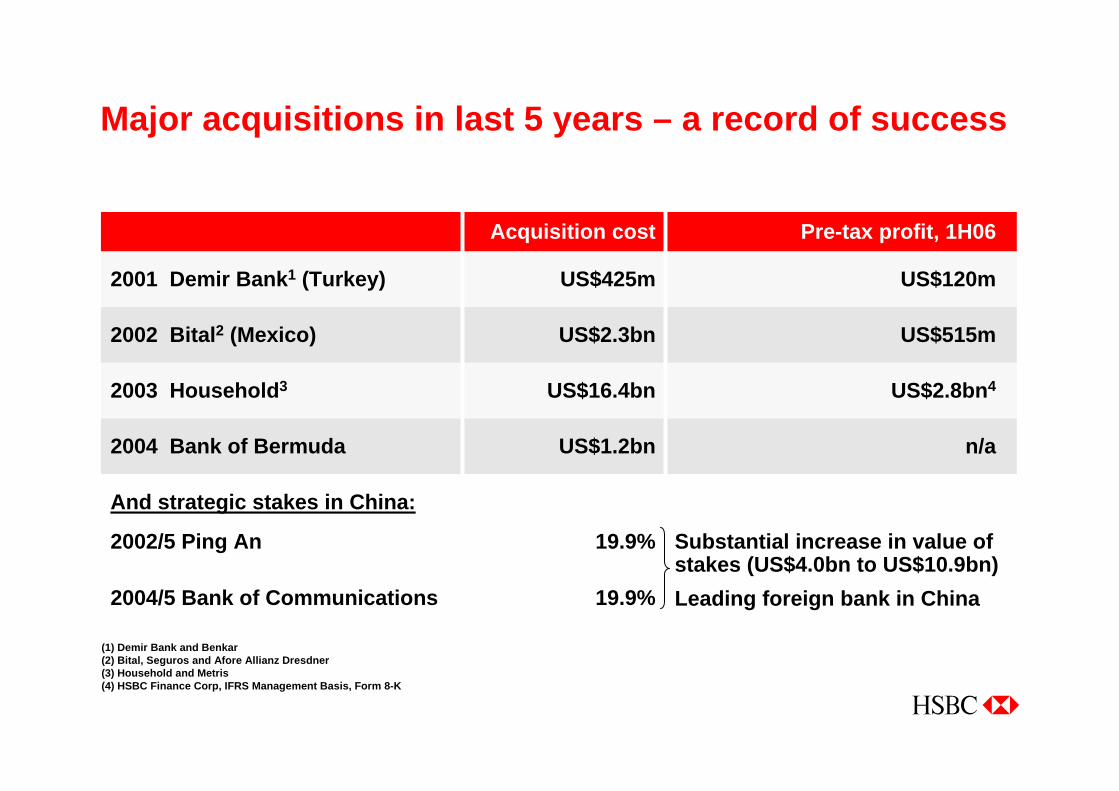
Major acquisitions in last 5 years – a record of success
n/aUS$1.2bn2004 Bank of Bermuda
US$2.8bn4US$16.4bn2003 Household3
US$515mUS$2.3bn2002 Bital2 (Mexico)
US$120mUS$425m2001 Demir Bank1 (Turkey)
Leading foreign bank in China19.9%2004/5 Bank of Communications
Substantial increase in value of stakes (US$4.0bn to US$10.9bn)
19.9%2002/5 Ping An
And strategic stakes in China:
Pre-tax profit, 1H06Acquisition cost
(1) Demir Bank and Benkar(2) Bital, Seguros and Afore Allianz Dresdner(3) Household and Metris(4) HSBC Finance Corp, IFRS Management Basis, Form 8-K

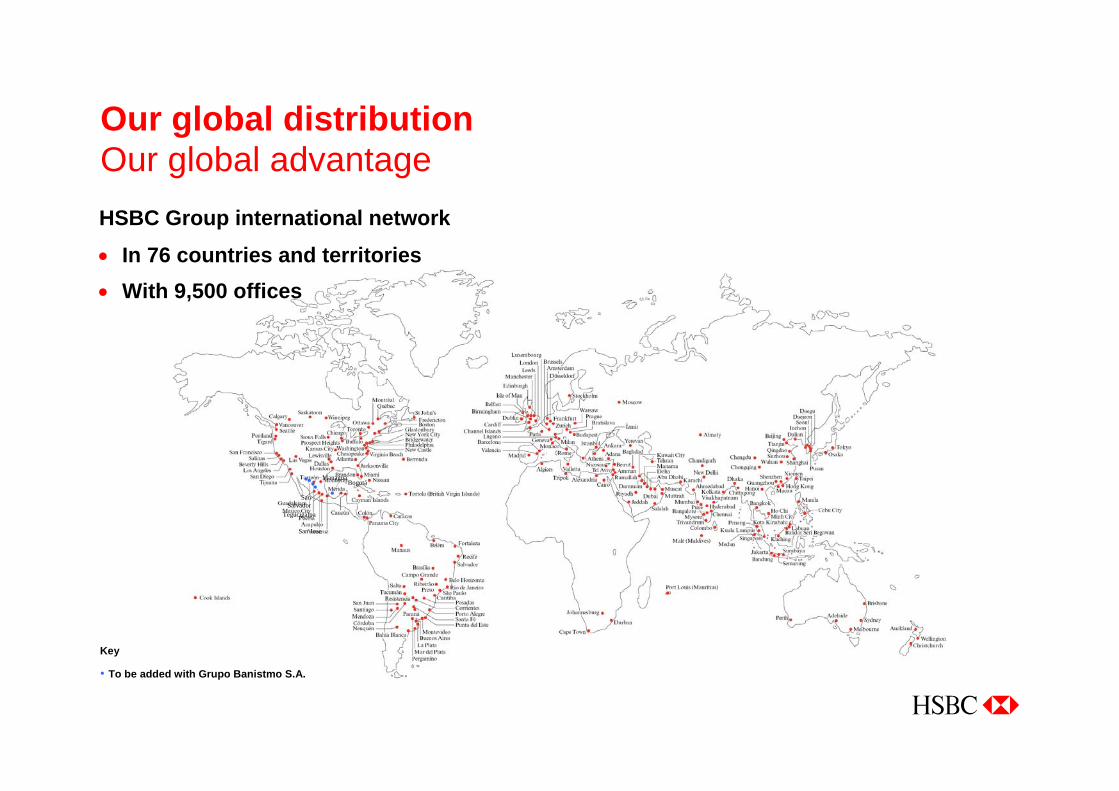
Has HSBC become too big to manage?
Tegucigalpa
Bogotá
SanSalvador
San Jose
Managua
To be added with Grupo Banistmo S.A.
Our global distributionOur global advantageHSBC Group international network
• In 76 countries and territories• With 9,500 offices
Key
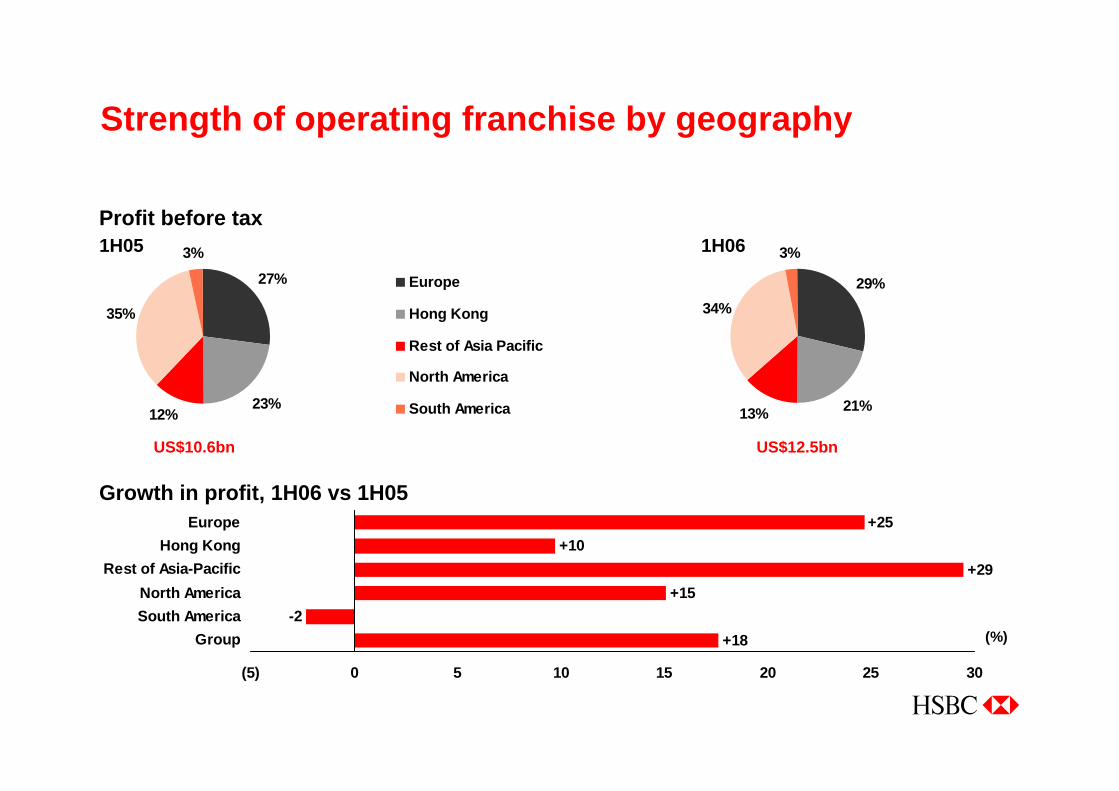
27%
23%12%
35%
3%
Europe
Hong Kong
Rest of Asia Pacific
North America
South America
Strength of operating franchise by geography
29%
21%13%
34%
3%
US$12.5bn
1H06
US$10.6bn
1H05Profit before tax
+18-2
+15+29
+10+25
(5) 0 5 10 15 20 25 30
GroupSouth AmericaNorth America
Rest of Asia-PacificHong Kong
Europe
(%)
Growth in profit, 1H06 vs 1H05

Strength of operating franchise by customer group
22%
22%
4% 3%
49%
Personal Financial Services
Corporate, Investment Banking and Markets
Commercial Banking
Private Banking
Other
US$10.6bn
1H05
47%
25%
23%
5%
US$12.5bn
1H06Pre-tax profits
Growth in profit, 1H06 vs 1H05
+18+33
+21+37
+13
0 5 10 15 20 25 30 35 40
GroupPrivate Banking
Commercial BankingCorporate, Investment Banking and Markets
Personal Financial Services
(%)
Why invest in HSBC rather than good regional players?

0
20
40
60
80
100(40) (20) 0 20 40 60 80
Cos
t effi
cien
cy ra
tio
Revenue growth
Prioritisation of Investment
50.1%
14.8%
US
UK
HongKong
Mainland ChinaFrance
Argentina
Brazil
UAE
India
MexicoMalaysia
Malta
Germany
SingaporeBermuda
Turkey
Canada
Re-engineer
Harvest
Invest
Grow
Our businesses – building for sustained growth
Europe Private Banking

What are the next things to look for from HSBC?
The Brand
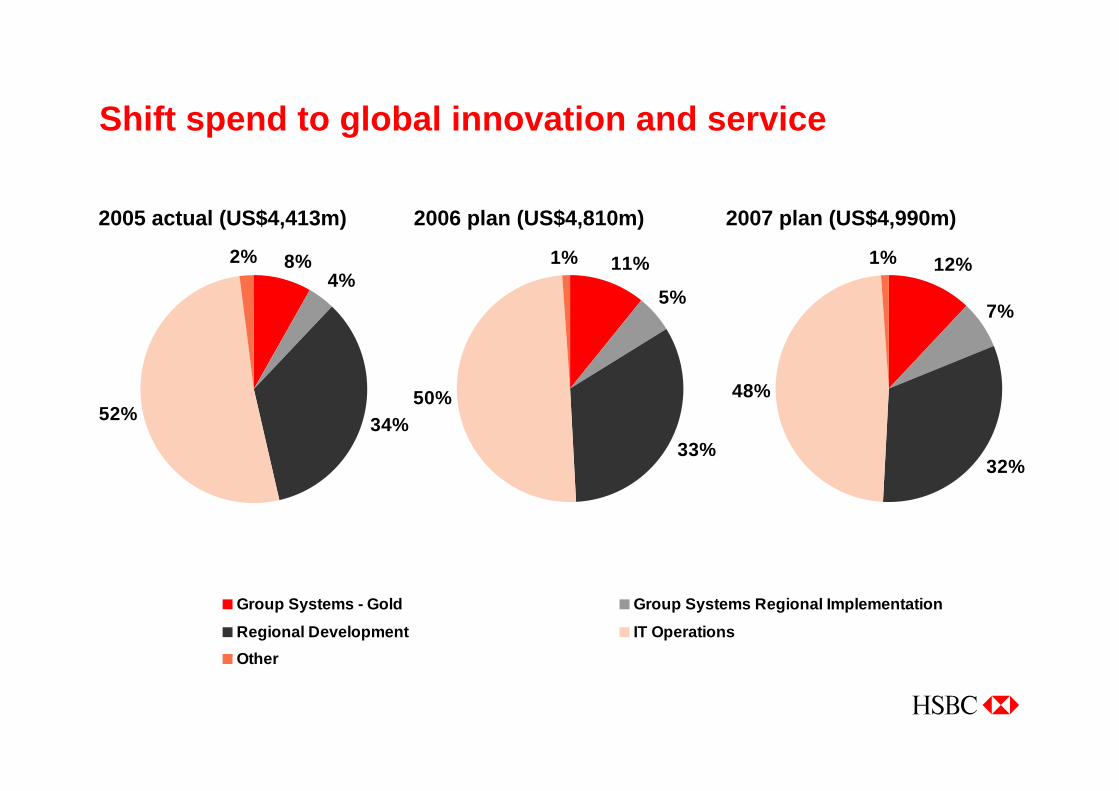
Shift spend to global innovation and service
2005 actual (US$4,413m) 2006 plan (US$4,810m) 2007 plan (US$4,990m)
8%4%
34%52%
2% 11%
5%
33%
50%
1% 12%
7%
32%
48%
1%
Group Systems - Gold Group Systems Regional Implementation
Regional Development IT OperationsOther
Our people, our culture – the best place to work

Insurance and retirement businessThe opportunityPeople aged 60 years and over: 1950–2050 (millions)
Source: United Nations World Population Prospects, 2004 Revision
2,000
1,500
1,000
500
0 1950 1980 2000 2025 2050

What are the potential challenges?

HSBC exposure to US residential lending
112118
126
100105110115120125130
1H05 2H05 1H06
US residential mortgages (US$bn)
US consumer finance (1H06)
82%
18%
First lien
Second lien
73%
27%
Fixed rate
ARMs
US$89bn US$89bn
US$73bn
US$16bn US$24bn
US$65bn
(1)
(1)
(1) 1st mortgage and 2nd lien lending

HSBC exposure to UK consumer
36%
64%
Residential mortgages
Other personalunsecured
26%
74%
UK
Rest ofGroup
UK Personal Lending (US$118bn)
HSBC Group Personal Lending (US$448bn)

Distrib
ution
TechnologyBrand
Businesses
Cultur
e
Organisation
Our main focusJoining up the company for our customers
Now you know
Who is Michael Geoghegan?