managing complexity - investors – rbs/media/files/r/rbs-ir/archived... · managing complexity...
TRANSCRIPT

Managing ComplexityManaging ComplexityManaging Complexity
Sir Fred GoodwinSir Fred GoodwinGroup Chief ExecutiveGroup Chief Executive

Slide 2
Managing Complexity
1 Step Process
▮ Reduce complexity

Slide 3
Managing Complexity
Reduce Complexity
Step 1.i Limit business activity tocontiguous/complementary areas
▮ We haven’t diversified into– Equity trading and sales
– Mergers and acquisitions advisory services
– Institutional fund management
– Life assurance manufacturing

Slide 4
Managing Complexity
Reduce Complexity
Step 1.i Limit business activity to contiguous/complementary areas
▮ We have diversified– geographically:
Mellon, Charter One, other Citizens acquisitions, Bank vonErnst, First Active, People’s Bank, BIBIT, Lynk Systems
– Green Flag, Dixon Motors

Slide 5
Managing Complexity
Reduce Complexity
Step 1.ii Establish appropriate organisation structure
▮ Group similar activities together, creating– Centres of excellence
– Specialisation
– Economies of scale
▮ Maintain consistency

Slide 6
Group Structure
• Large Corporates - RBS• Mid Corporates and
Commercials-RBS/NW• Treasury - RBS• Greenwich Capital (US)• Lombard• Angel Trains• Specialist Businesses
WealthManagement
MANUFACTURING
CUSTOMERSCUSTOMERS
CitizensRBSInsurance
RetailDirect
RBS CBFMNatWest UlsterBank
• Coutts• Adam• NatWest Offshore• RBSI
• Direct Line• Churchill• NIG• International
• Personal• Small Business• RSA
• Personal• Small Business• NW Life
• Ulster Bank• First Active• Personal• Business• Corporate
• Personal• Business• Commercial
Technology Operations Services
• RBS Cards• NatWest Cards• MINT• One Account• Tesco PF• Lombard Direct• DLFS• International

Slide 7
Managing Complexity
Reduce Complexity
Step 1.iii Create appropriate operating model
▮ Featuring– Clear delegation of responsibility
– Clear reporting requirements
– Clear performance management regime
– Effective communication (bi-directional)
– Appropriate ‘clock speed’
▮ Must maintain consistency

Slide 8
Managing Complexity
Reduce Complexity
Step 1.iv Create clarity of objectives
▮ What are we trying to do?Objectives should be– Group wide– Aspirational– Achieveable– Not too detailed
▮ High level objective“We aim to deliver superior sustainable value for ourshareholders, customers and staff”

Slide 9
Managing Complexity
Reduce Complexity
Step 1.iv Create clarity of objectives
▮ More specific objectives– Achieve superior income growth
– Improve cost:income ratio
– Maintain/improve credit quality
– Increase customer numbers and satisfaction
– Improve employee opinion survey scores
▮ Must maintain consistency

Slide 10
Managing Complexity
Reduce Complexity
Step 1.v Create clarity of required outcome
▮ Disciplined approach to– Budgets– Action plans– Cost recharging (not favoured)– Project/transaction investment hurdles– Incentives and rewards
▮ Must maintain consistency

Slide 11
Managing Complexity
We have maintained consistency of our model since 1999
▮ But has it enabled us to cope with increasing complexity?

Slide 12
The Royal Bank of Scotland Group
Complexity Context 1999 2003 2004(pre-NatWest)
Employees 32,670 120,900 133,500
Income (£m) 4,138 19,229
US income (£m) 549 2,792
Operating profit (£m) 1,211 7,151
▮ Transformation of scope and scale of Group,through combination of
– Acquisitions
– Organic growth
– New businesses

Slide 13
Acquisitions 1999 – 2004
Date Acquisition Division Consideration (m)
1999 Oct State Street (commercial banking) Citizens $350Nov Green Flag Direct Line £223
2000 Jan UST Corporation Citizens $1,400Mar NatWest RBS £21,000
2001 Jul Balance of Virgin One Retail Direct £100Aug International Aviation Management CBFM £16Sep Euro Sales Finance CBFM £70Sep Allstate Corporation (motor insurance, Germany/Italy) Direct Line $20Dec Mellon Regional Franchise Citizens $2,200
2002 Jan Royal Insurance (motor insurance, Italy) Direct Line €20May Dixon Motors CBFM £118Oct Medford Bancorp Citizens $273
2003 Jan Commonwealth Bancorp Citizens $450Jun Nordisk Renting CBFM €104Jul Port Financial Corporation Citizens $285Jul Santander Direkt Bank (credit cards, personal loans) Retail Direct €486Sep Churchill Insurance Group Direct Line £1,100Oct Community Bancorp Citizens $116Nov Bank von Ernst Wealth Management Swfr 500
2004 Jan Roxborough Manayunk Bank Citizens $136Jan First Active Ulster Bank €887Mar People’s Bank (credit cards) Retail Direct $360May Bibit Retail Direct €93Sep Charter One Citizens $10,500Sep Lynk Systems Inc Retail Direct $525

Slide 14
Income Growth 2000 – 2003
Pro forma1999 2003 Change over 4 Yrs
£m £m £m %
Total income 11,065 19,229 8,164 +74%
Components of Income Growth £m % Total
NatWest transaction benefits 872 11%
Other acquisitions 1,865 23%
Organic growth 5,427 66%
Total 8,164 100%

Slide 15
UK Financial Services New Entrants
Commenced Profit/(Loss) 2003
Scottish Widows Bank 1995 £17mGoldfish 1996 (£30m)The One account 1997 £27mSainsbury’s Bank 1997 £22mTesco Personal Finance 1997 £160mEgg 1998 (£34m)Standard Life Bank 1998 £5mDirect Line Rescue 1998 £31mMarbles 1999 not reportedSmile 1999 not reportedCahoot 2000 (£15m)Intelligent Finance 2000 (£53m)Zurich Bank 2001-03 closed Mar 03Profit/(loss) before exceptional items

Slide 16
Managing Complexity
Model has had to cope with increasing complexity
▮ But has it delivered results in line with our objectives?

Slide 17
Creating Value for Shareholders
▮ Grow income
▮ Improve efficiency
▮ Maintain credit quality

Slide 18
Grow Income
0
5
10
15
20
1999 2000 2001 2002 2003
RBS Income 1999 – 2003£bn
Pro forma

Slide 19
Grow Income
0 20 40 60 80 100
HSBC
RBS
Wells Fargo
Citigroup
Bank of America
JPM Chase
Income Growth 1999 – 2003
%Income as reported in US$, except RBS which reports in sterling

Slide 20
Grow Income
-20
0
20
40
60
80
100
1999 2000 2001 2002 2003
Percentage Growth in Income 1999 – 2003
Income as reported in US$, except RBS which reports in sterling
%
Wells Fargo
RBS
HSBC
Citigroup
Bank of America
JPM Chase

Slide 21
Grow Income
0 10 20 30 40
RBS
HSBC
Bank of America
Citigroup
Wells Fargo
JPM Chase
Half year income as reported in US$, except RBS whose sterling income has been converted into US$
%
Income Growth 1H03 - 1H04 in US Dollars
Slide 22
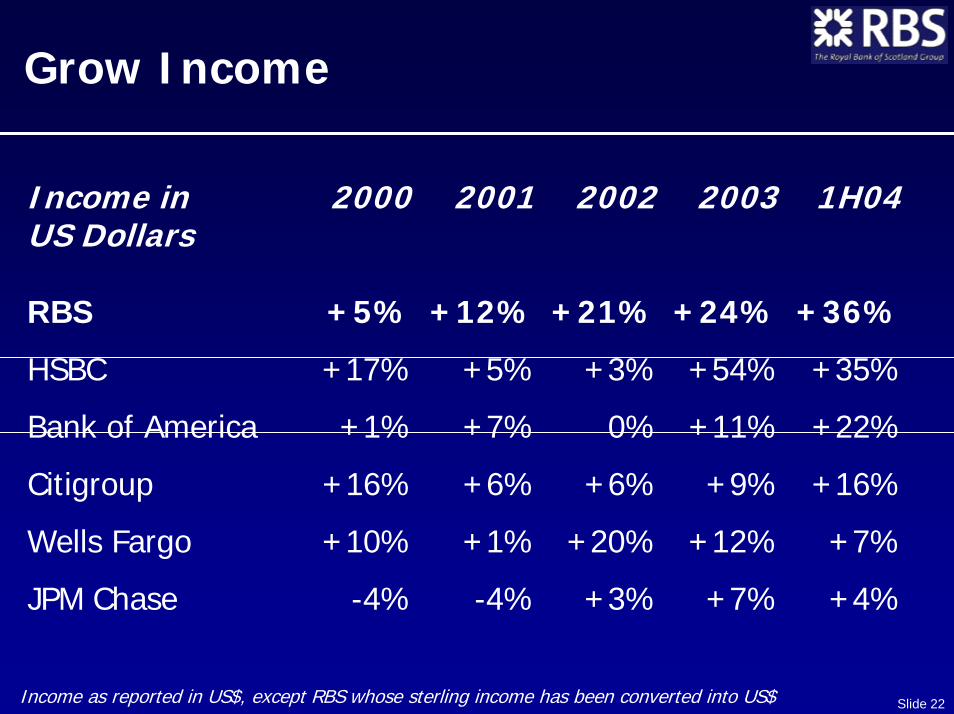
Grow Income
Income in 2000 2001 2002 2003 1H04US Dollars
RBS +5% +12% +21% +24% +36%
HSBC +17% +5% +3% +54% +35%
Bank of America +1% +7% 0% +11% +22%
Citigroup +16% +6% +6% +9% +16%
Wells Fargo +10% +1% +20% +12% +7%
JPM Chase -4% -4% +3% +7% +4%
Income as reported in US$, except RBS whose sterling income has been converted into US$

Slide 23
Improve Efficiency
35
40
45
50
55
60
65
70
1999 2000 2001 2002 2003 1H04
RBS Cost:Income Ratio 1999 – 1H04%
RBS: netting operating lease depreciation against rental income

Slide 24
Improve Efficiency
35
40
45
50
55
60
65
70
Citigroup B of A HSBC JPM Chase Wells Fargo RBSCost:income ratios as reported by banks, or based on income and costs reported by banksRBS: netting operating lease depreciation against rental income
Cost:Income Ratios 1999 – 1H04%
99 00 01 02 03 1H04
99 00 01 02 03 1H04
99 00 01 02 03 1H04
99 00 01 02 03 1H04
99 00 01 02 03 1H04
99 00 01 02 03 1H04

Slide 25
Maintain Credit Quality
0.0
0.5
1.0
1.5
2.0
2.5
3.0
Citigroup B of A HBSC JPM Chase Wells Fargo RBS
%
99 00 0102 03 1H04
99 00 01 02 03 1H04
99 00 01 02 03 1H04
99 00 01 02 03 1H04
99 00 01 02 03 1H04
99 00 01 02 03 1H04
P&L Account Provisions:Customer Loans + Advances

Slide 26
Maintain Credit Quality
0
20
40
60
80
100
1999 2000 2001 2002 2003 1H04
RBS Balance Sheet Provisions as a Percentage ofRisk Elements in Lending and Potential Problem Loans%

Slide 27
Creating Value for Shareholders
▮ Grow income
▮ Improve efficiency
▮ Maintain credit quality

Slide 28
Strategy
What is our goal?
▮ Generating superior sustainable value forour shareholders
▮ To achieve this we need to add value for– Our customers
– Our people

Slide 29
Our Customers
1999 – 2003 Increase Increase000s %
Retail BankingPersonal customers 1,900 +16%
Retail DirectUK credit card accounts 3,600 +55%
RBS InsuranceUK motor in-force policies 5,400 +203%
Ulster BankPersonal customers 500 +68%
CitizensPersonal customers 1,400 +136%

Slide 30
CBFMCustomer Satisfaction
Service Quality Index
Impo
rtan
t B
ank
Overall Relationship Performance
RBS
0%
15%
30%
45%
60%
75%
350 500 650

Slide 31
Retail BankingCustomer Satisfaction
50 60 70 80
RBS
NatWest
GB Q2 average, extremely and very satisfiedSource: NOP FRS, quarterly rolling
Telephony Satisfaction
%

Slide 32
RBS InsuranceCustomer Satisfaction
Direct Line Motor
Motor quotes
Motor renewers
Motor purchasers
Source: RBS Insurance, August 2004
0 20 40 60 80 100
Extremely/very satisfied
%

Slide 33
Tesco Personal FinanceCustomer Satisfaction
Customer Satisfaction – Motor Insurance%
0102030405060708090
TPF
% customers very satisfied% customers extremely satisfied
Source: NOP FRSBase: 6 months to end of June 2004
Other Providers

Slide 34
CitizensCustomer Satisfaction
Customer Satisfaction Ratings%
70
75
80
85
90
Q202 Q302 Q403 Q103 Q203 Q303 Q403 Q104 Q204
Source: Citizens
New England
Mid Atlantic
Completely or very satisfied
Slide 35
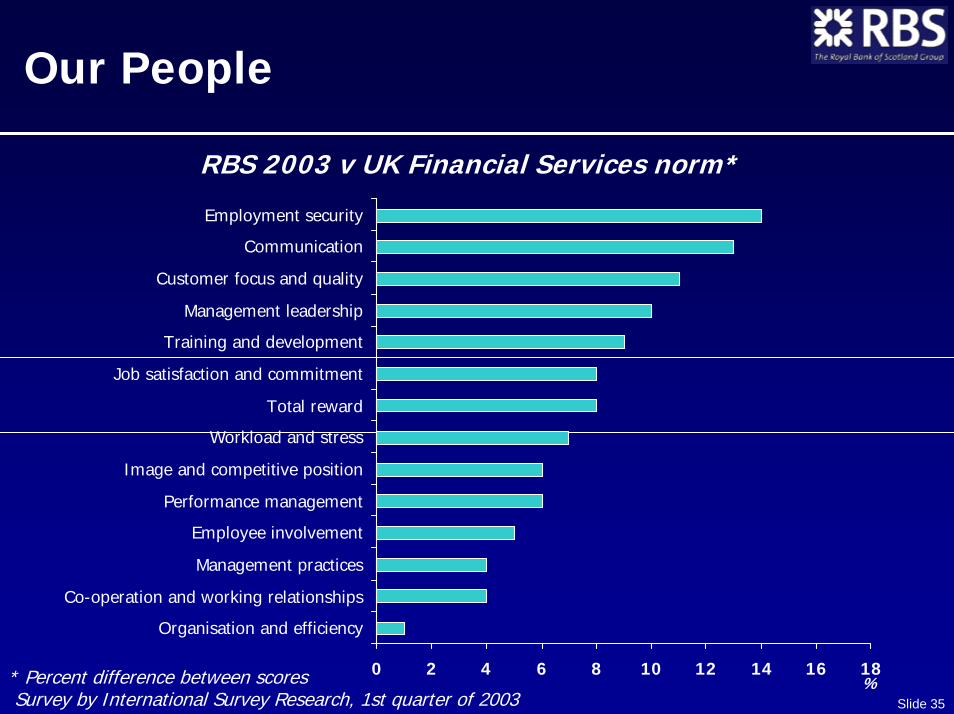
Our People
RBS 2003 v UK Financial Services norm*
* Percent difference between scores Survey by International Survey Research, 1st quarter of 2003
%0 2 4 6 8 10 12 14 16 18
Organisation and efficiency
Co-operation and working relationships
Management practices
Employee involvement
Performance management
Image and competitive position
Workload and stress
Total reward
Job satisfaction and commitment
Training and development
Management leadership
Customer focus and quality
Communication
Employment security

Slide 36
Our People
2003 Employee Opinion Survey
I have a clear understanding of the goalsand objectives of our business 86%

Slide 37
Our Shareholders
-40 -20 0 20 40 60 80 100 120 140
Bank of America
RBS
Wells Fargo
HSBC
Citigroup
JPM Chase
Source: Merrill Lynch
Total Shareholder Return 6 Mar 2000 – 1 Oct 2004
%

Slide 38
Strategy
What is our goal?
▮ Generating superior sustainable value forour shareholders
▮ To achieve this we need to add value for:– Our customers
– Our people

Slide 39
Managing Complexity
Conclusion
▮ RBS model works
▮ Has helped to reduce complexity
▮ Remains relevant and viable

Slide 40
Charter One Update
▮ Transaction completed 1 September 2004,ahead of schedule
▮ Management transition completed
▮ Balance sheet positioning implemented
▮ Integration underway
▮ So far, so good

Slide 41
Other Recent Acquisitions
▮ Churchill integration fully on track
▮ First Active integration fully on track
▮ IT migration completed for– People’s Bank credit card business
– Bank von Ernst

Managing ComplexityManaging ComplexityManaging Complexity
Sir Fred GoodwinSir Fred GoodwinGroup Chief ExecutiveGroup Chief Executive