managing resources in health service delivery · pdf filemanaging resources in health service...
TRANSCRIPT

Managing resources in health service delivery organizations
National Health Leaders ConferenceVancouver, BC, June 12-13, 2017
Howard Waldner, Duncan Campbell and Craig Mitton
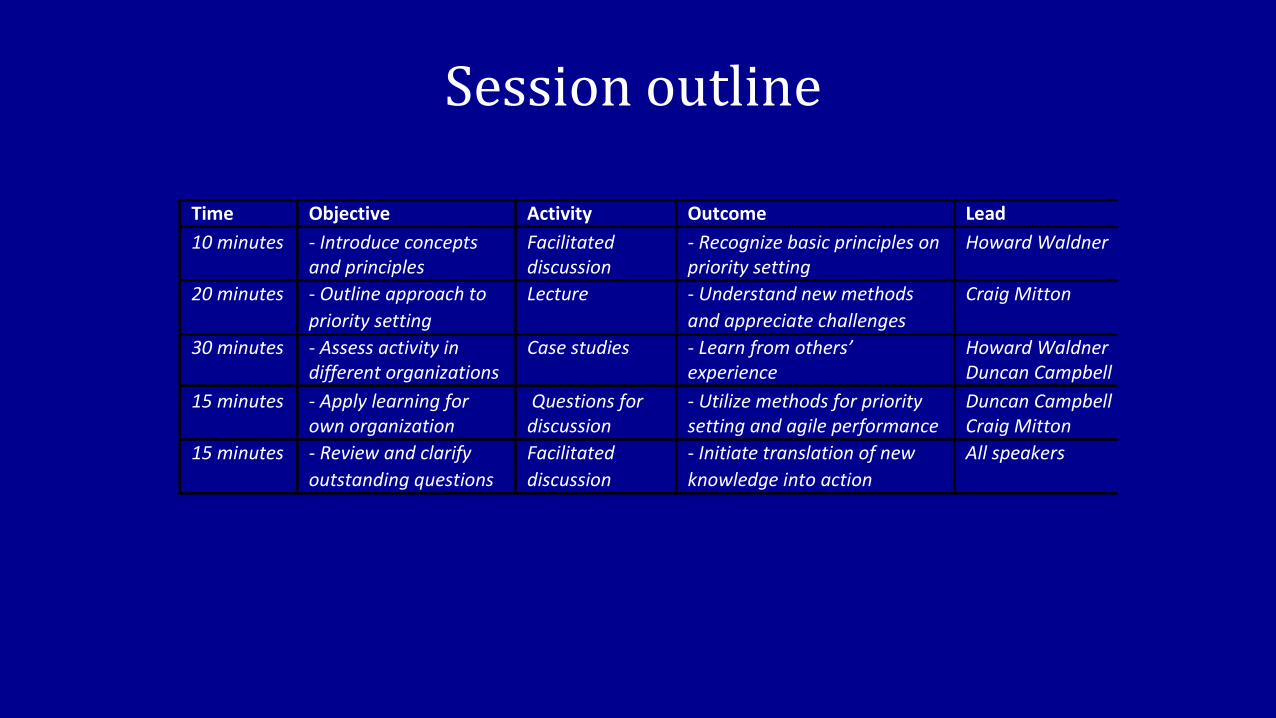
Session outline
Time Objective Activity Outcome Lead
10minutes -Introduceconceptsandprinciples
Facilitateddiscussion
-Recognizebasicprinciplesonprioritysetting
HowardWaldner
20minutes -Outlineapproachto
prioritysetting
Lecture -Understandnewmethods
andappreciatechallenges
CraigMitton
30minutes -Assessactivityindifferentorganizations
Casestudies -Learnfromothers’experience
HowardWaldnerDuncanCampbell
15minutes -Applylearningforownorganization
Questionsfordiscussion
-Utilizemethodsforprioritysettingandagileperformance
DuncanCampbellCraigMitton
15minutes -Reviewandclarify
outstandingquestions
Facilitated
discussion
-Initiatetranslationofnew
knowledgeintoaction
Allspeakers

INTRODUCTION -- HOWARD

Global trends
• OECD countries range in total health expenditure from between 7-18% GDP
• After decades of growth over 4% per year, as of 2009 growth in public expenditure has declined in most OECD countries– Lower prices on medical products and drugs
– Hospital budget constraints
– Negotiations on wages
– Cost shifting to private insurance or out of pocket
• Diminishing access for health prevention/ promotion services; raises equity issues

Reform vs. management
• There is no health care system that performs systematically better in delivering cost-effective health care. It may thus be less the type of system that matters but rather how it is managed. [OECD Economics Department Policy Notes, No. 2, 2010]
• Talk of crisis and calls for more funds obscure the fact that scarcity is a normal condition in publicly funded health care. Resources devoted to one service provided by a hospital or doctor are of necessity not available for other services. [Donaldson et
al. 2002]

What is priority setting?
• Given that we can’t do everything, choices must
be made about what to fund and what not to fund
• Priority setting is about making these choices:
– Health authorities
– Hospitals
– Program areas
– Individual services
Mitton and Donaldson CERA 2004

Explicit trade-offs
Trade-offs have to be made, important to weigh out both costs and benefits and apply knowledge within broader framework

APPROACHES -- CRAIG
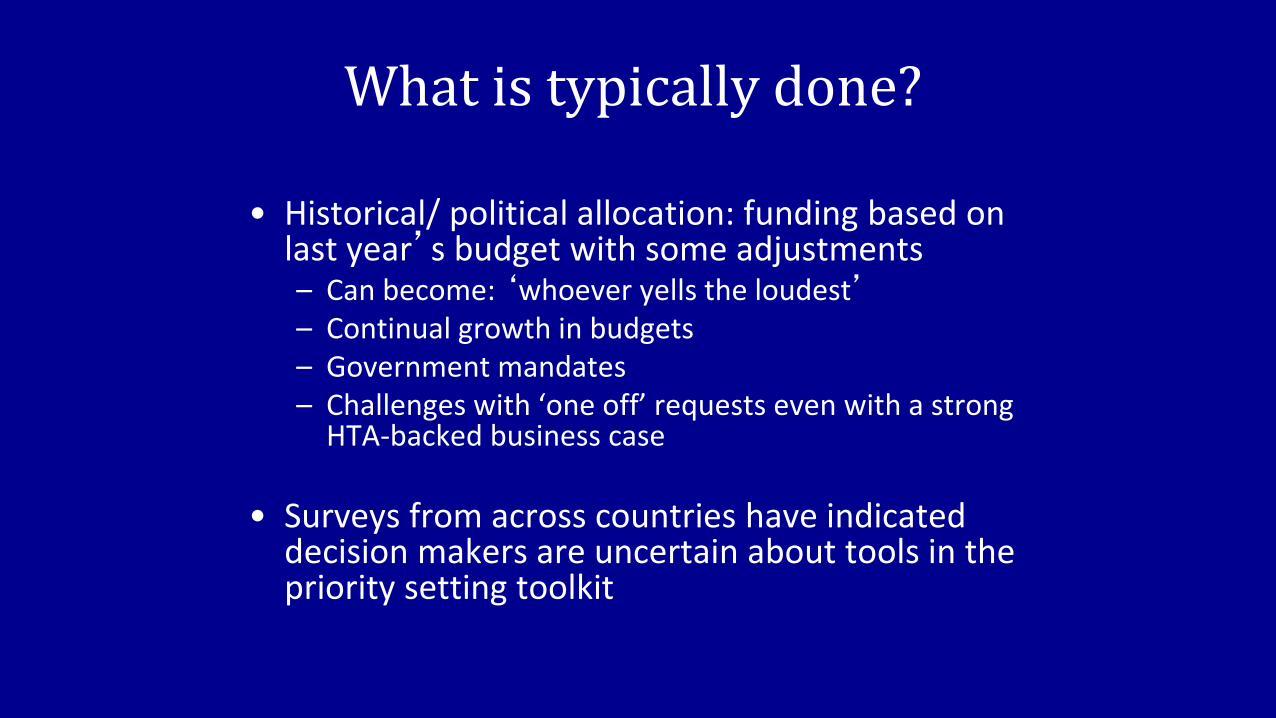
What is typically done?
• Historical/ political allocation: funding based on last year’s budget with some adjustments– Can become: ‘whoever yells the loudest’– Continual growth in budgets– Government mandates– Challenges with ‘one off’ requests even with a strong
HTA-backed business case
• Surveys from across countries have indicated decision makers are uncertain about tools in the priority setting toolkit

Historical vs. formal process
Poor or very Poor
Fair Good or very Good
Historical or Political Process 18% 50% 32%
Formal/Rational Process 2% 25% 73%
Canadian survey - executives who stated their
organization used a formal/rational process
tended to be more satisfied with the priority
setting process than those without.
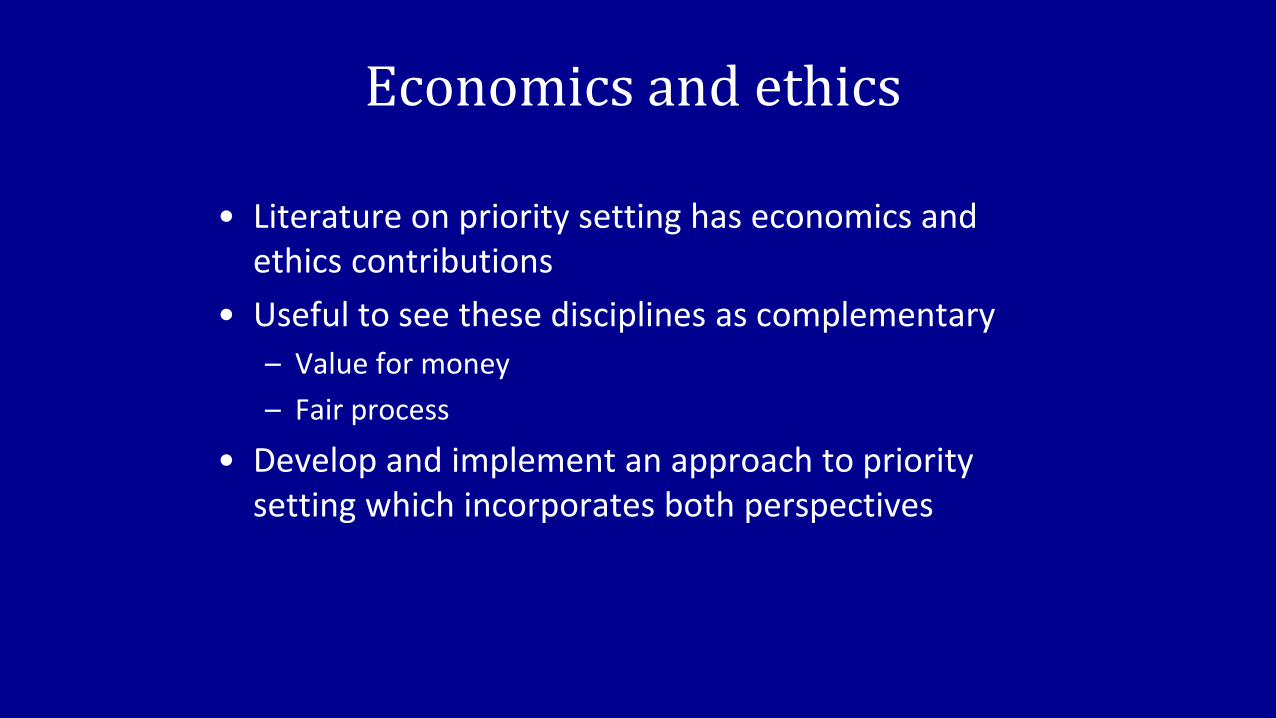
Economics and ethics
• Literature on priority setting has economics and ethics contributions
• Useful to see these disciplines as complementary
– Value for money
– Fair process
• Develop and implement an approach to priority setting which incorporates both perspectives

• Identify stakeholder values
• Use this to construct decision criteria
• Determine costs and ‘benefits’ of options
• Explicitly assess trade-offs
• Validate and communicate
• Accept winners and losers


Define aim and scope
Form “Advisory
Panel”
Establish program budget
Develop decision criteria
Identify and rank options
Decisions and rationale
Decision review process
Evaluate and improve
PBMA/ A4R
Economics and ethicsin practice
[Mitton and Donaldson 2004]
MCDA

Key Concepts
• Shifting or re-allocating resources based on
comparison against pre-defined criteria
• Incentives to encourage participation
• Clinicians and managers working together
• Ethical conditions built in
• Tool that supports decision making
Peacock et al. BMJ 2006

Criteria
• Operationalize organizational objectives
• Linked to strategic priorities
• Clearly defined at the outset
• Mutually exclusive
• Weight to reflect relative importance
• Involvement of relevant stakeholders
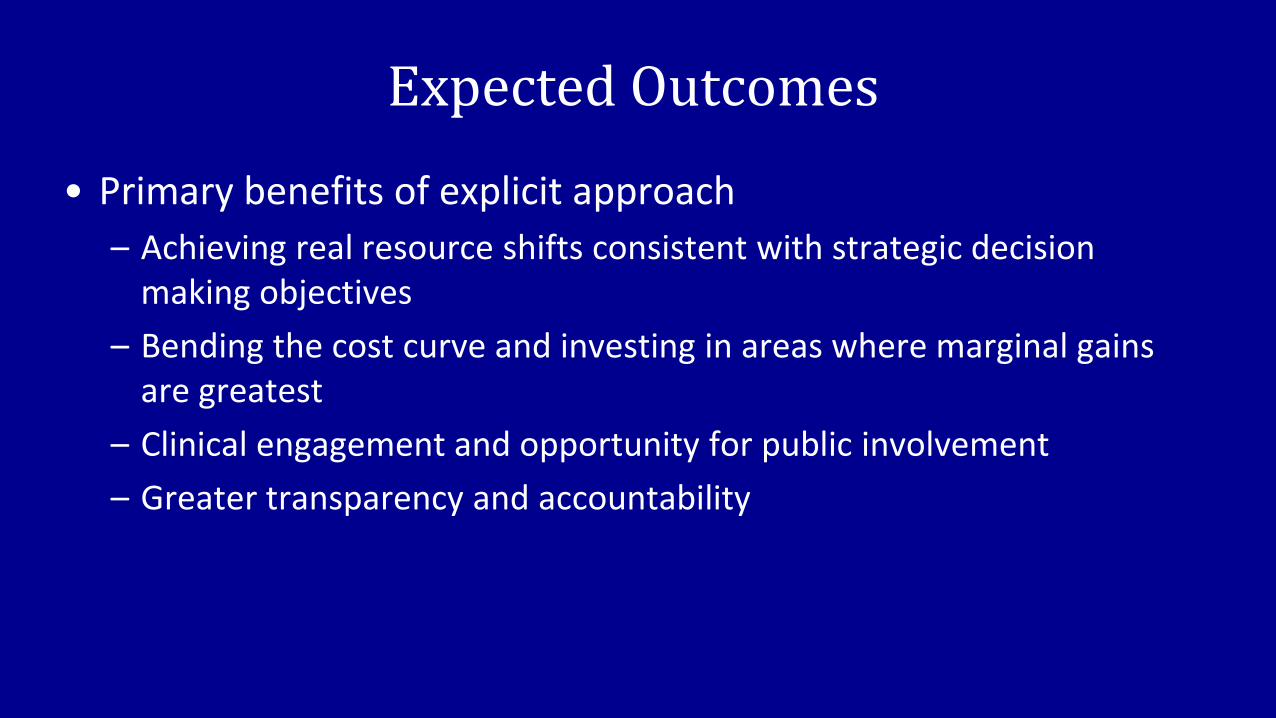
Expected Outcomes
• Primary benefits of explicit approach
– Achieving real resource shifts consistent with strategic decision making objectives
– Bending the cost curve and investing in areas where marginal gains are greatest
– Clinical engagement and opportunity for public involvement
– Greater transparency and accountability

International applications
Wide range of program areas, majority at micro/ meso levels; more recently macro level applications
200+ exercises primarily in UK, NZ, Australia, Canada
Distinct shift from focus on ‘efficiency’ to a management process aimed at meeting organizational objectives
Majority of organizations that institute process tend to continue with it and see positive impact:– new way of thinking– re-allocation to better meet system objectives

Lessons learned
• Committed and supportive leadership
• External support and strong project management
• Explicit criteria and formal proposal scoring tool
• Importance of transparency of process and decisions
• Physician engagement in all aspects of the process
• Credible commitment takes time - organizational trust
• Recognition of political overlay
• Elements of high performance (process, structure, behavior)

Challenge of disinvestment
• Canadian experience: over 50 organizations with disinvestment ranging from $200K to $120M
– Examples include investment which acts as an incentive
– Not just about stopping ineffective services
– Apply same rigorous methodology as for investments
– Should be ongoing, not just to meet a deficit

Common Steps to Manage Resources
1. Generate revenue
2. Cost reduction activities
3. Outsource services
4. Re-engineering – LEAN, six sigma
5. Non-clinical integration, consolidation, standardization
6. Clinical integration, consolidation, standardization
7. Disinvestment
Common steps to meet fiscal constraints
Removal of ineffective services
Reduction of lower value services

Software tool
www.prioritizesoftware.com

Summary
• Substantial literature on implementation and evaluation of formal approaches (i.e., PBMA/ A4R)
• Key success factor - strong leadership
• Process can be viewed as ‘vehicle’ for getting evidence in to decision making
• Software tool to support implementation – process efficiency and stakeholder engagement

Identify need for refining existing processes
Obtain leadership commitment to proceed
Determine aim and scope of activity
Decide on project structure
Develop decision criteria
Generate proposals using standard template
Provide recommendations for action
Validation and communication
Evaluation and project tracking
Practical application
4-6 month process, building internal capacity
and stakeholder engagement -- leading to resource
re-allocation to better achieve organizational objectives

Case studies – howard & duncan
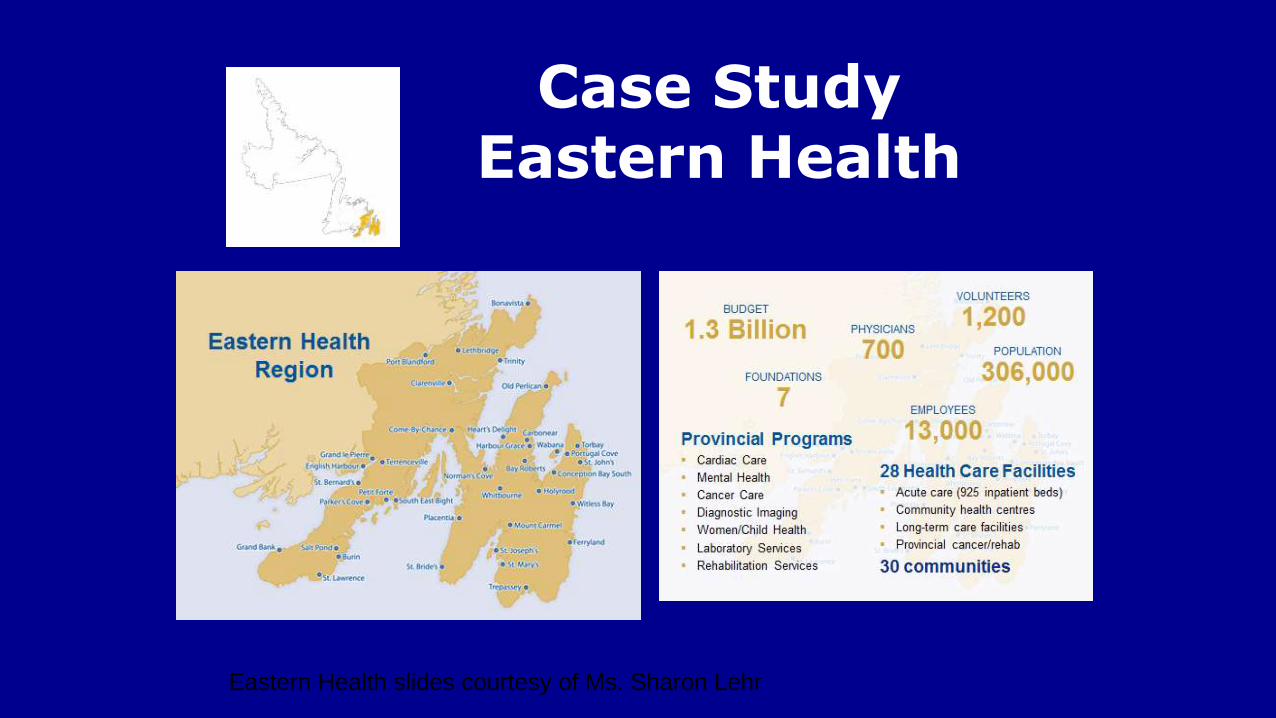
Case StudyEastern Health
Eastern Health slides courtesy of Ms. Sharon Lehr

Expectations–more please…

Common Solutions

Eastern Health
• Recurring budget deficit – $20M
• Unique Population – aging demographic/urban-rural
• Increased demand in emergency departments
• Capacity challenges in medical/surgical beds with ALC issues
• Capital investment requirements
• Efficiency versus Transformation

Eastern Health Process
• A New Participative Approach
• Executive/Board support
• Senior management/clinical leader participation
• All clinical, corporate and support services
• Business cases developed for investment & disinvestment options (weighted criteria)

EH–PBMA Approach
• Operating Budget planning
• Capital planning

EH PBMA Outcomes
• Team engagement and empowerment
• Innovative ideas
• “Team” selection of operating and capital priorities
• Bottom Up versus Top Down
• $40M prioritized list of potential disinvestments
• $ Ranked capital priorities

Evaluation
• Excellent engagement overall
– Long time clinician: “This is the best management process I have ever seen in this organization.”
• Staying the course, using the process for deficit reduction and ongoing re-allocation
• Strong support from leadership team and Board of Directors – mitigating political interference

Agile Health Systems – Aligning
Financial And Operating Processes To
Support High Quality Care

Background
• How often have you heard how financially stressed are Canadian and other international healthcare systems are?– “If only there was more money, then the healthcare system would
improve”
Yet…• There is no direct correlation between health spending and health
outcomes
• Agile financial performance is a multi-billion dollar opportunity for Canada

Background
• Canada performs poorly on most international comparisons
• Siloes and special interests keep the health system “stuck” and makes it difficult to operate effectively
• Agile Financial Performance Model provides a significant opportunity for Canada -$1.1bn to $1.9bn
• In times of economic uncertainty, more agile performance management needed

Background
• Predictive and real-time analytics are the cornerstone for agile performance management
• Integrated Operations Centre's– Key enablers to break down siloes
– Harnessing predictive analytics, team based trade-offs and decision making
• Funding reform is the most effective way to break down siloes, and incentivize the right behaviour
• Need a process to improve ethical disinvest and reinvest decisions – Program Budgeting
Marginal Analysis (PBMA)

Funding“Rules of the
game”(“Nudging”)
Strategic imperativesand targets
Predictive Model
Scenario plan
Disinvest/ reinvest
RevenueP4P
StaffingWait-times
VolumesQuality metrics OR and supplies
ForecastWeekly
Based on real-time Predictive
model
MonthlyFinancial ME +1
Disinvest/ reinvest
Non Case-Mix Funding
Admin and Overhead
Other Revenue/ Costs/Innovation
Agile Financial Performance (Model Tested by Project)

Main messages1) Ethical Allocation of Resources 2) Predictive and Real-Time Analytics
• Allocation of funds are skewed to acute hospitals and treating illness
• Need to align with key behavioural factors that drive health costs
• Budgeting is generally incremental• No evidence of zero based budgeting
seen• Continues the skewing of healthcare
towards hospitals
• Findings from Priorities 2015 conference
• Program Budgeting Marginal Analysis (PBMA)is widely used in Canada and internationally
• There is increased use in citizen panels in decision making
• New Zealand uses criteria based decision making (PBMA) to invest/ disinvest pharmaceuticals and other resources
•New Zealand leads the world in healthcare predictive analytics
•CapPlan by McKesson is currently the only predictive and real-time analytics software that uses historical data & algorithms to accurately forecast current/future demand, by ward by time of day, estimate discharges by time of day
•Many companies working on a competitive product
•3/4 District Health Boards in New Zealand use McKesson’s CapPlan software for real-time capacity planning and matching staffing to number of patients
•VCH was an early adopter, and implemented CapPlan and the Operating Room module in 2010 onward
•Currently the only Canadian healthcare organization to adopt as part of its resource optimization approach
•Need timekeeping and scheduling software, such as Kronos, ANSOS One-Staff to get full impact

Average Variable Staffing
GFS Rehab Medicine
Oct 03-Nov 13, 2008
0
5
10
15
20
25
30
35
40
F S S M T W T F S S M T W T F S S M T W T F S S M T W T F S S M T W T F S S M T W T
3 4 5 6 7 8 9 10 11 12 13 14 15 16 17 18 19 20 21 22 23 24 25 26 27 28 29 30 31 1 2 3 4 5 6 7 8 9 10 11 12 13
Av
era
ge
Nu
mb
er
of
Sta
ff
52
54
56
58
60
62
64
66
68
70
72
Ce
ns
us
RN LPN
Aide Census
Budget
Staff Forecasting and Staff Scheduling
• Lower fixed levels of staffing and increase flexibility of variable staffing
Average Variable Staffing
Staff Forecasting
Solution will allow the
ability to forecast
demand & the
associated staff
requirements
Optimizing Variable
Staffing LevelsStaff Scheduling
Efficient & effective
deployment of staff
to match expected
activity patterns

Pre-Cap Plan: Decision in real time
24
1 2 3 4 5 6 7
6
*
Overtime
Day
Open additional beds
7
28
Beds FTEs
24
6

Utilizing Cap Plan to make decision 3 days in advance
1 2 3 4 5 6 7
*
Straight time
Open additional beds28
7
Beds FTEs
Day
6
24 *Decision
24
6

Utilizing Cap Plan to Create Capacity and plan ahead to exceed discharge targets
1 2 3 4 5 6 7
24
6
Baseline staffing
No additional beds28
7
Beds FTEs
Day
28
7

CapPlan Dashboard
• Updated every 15 minutes
• Provides web-based real-time daily visibility
• Worm graph shows 3 days of information –retrospectively, today and tomorrow
• Displays key metrics with applicable traffic light on the current status within the hospital
• Can display the details of each nursing unit under each planning group

Predictive Analytics are 99% Accurate & Avoid Over And Under Staffing
waste
Safely issue
The Goal Is To Have The Right Staffing For The Right Census And Acuity… Not Elevated (Waste)
And Not Insufficient (Safety)
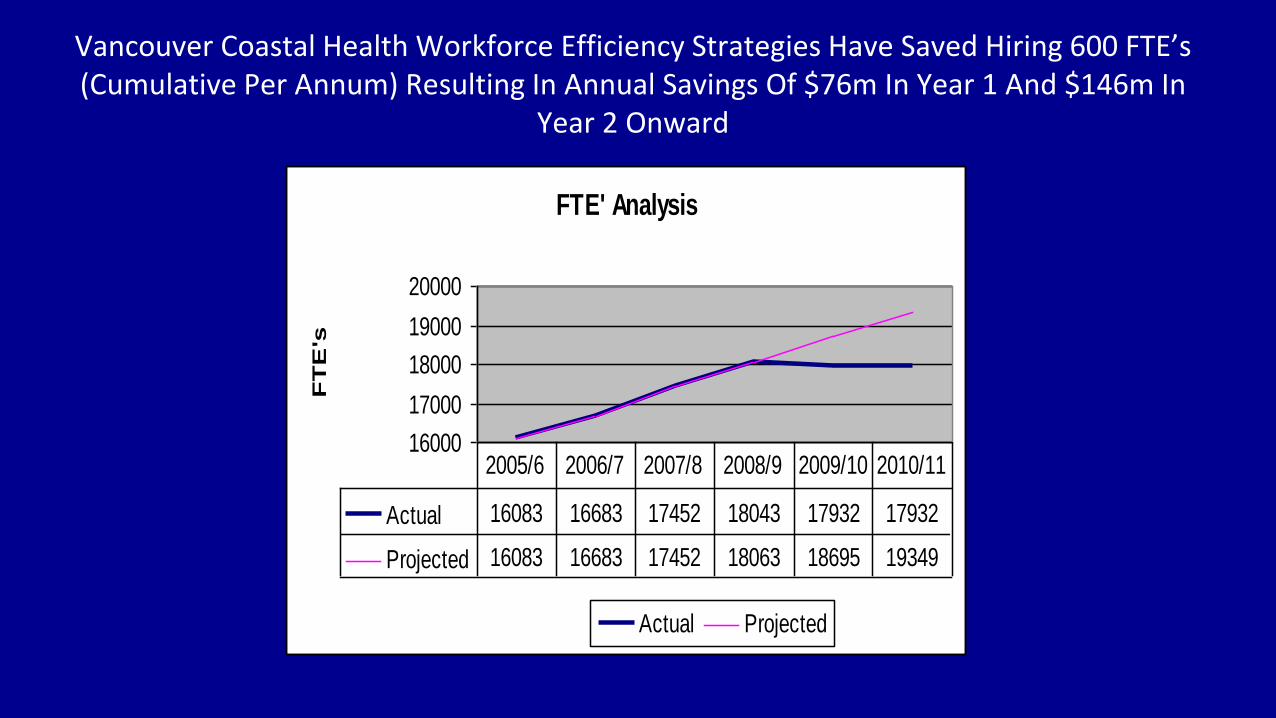
Vancouver Coastal Health Workforce Efficiency Strategies Have Saved Hiring 600 FTE’s (Cumulative Per Annum) Resulting In Annual Savings Of $76m In Year 1 And $146m In
Year 2 Onward
FTE' Analysis
16000
17000
18000
19000
20000F
TE
's
Actual Projected
Actual 16083 16683 17452 18043 17932 17932
Projected 16083 16683 17452 18063 18695 19349
2005/6 2006/7 2007/8 2008/9 2009/10 2010/11

Actual Impact: Vancouver Coastal Health
3. Health Economics• Cost-Benefit Analysis
•Return-on-Investment
• Cost Avoidance
• Reduced staffing needs
•Ability to shift resources where needed
•Improves dischange planning
1. Quality Outcomes• Patient/Employee Satisfaction and
Experiences
•Safe Quality scheduling improved by 10%
• Staff satisfaction improved as improvedcertainty that call-backs reduced
• Data driven decision-making moved tofront line staff
4. Program Costs / Investments• $10m to roll out Kronos staff scheduling
and timekeeping
•$2m to roll out Emendo CapPlan (nowMckesson) at 3 sites
• Training and Education - $200, 000
•Maintenance and Consultancy Support -$100,000
2. Productivity & Efficiency•Zero growth in staffing
•Volume growth increased by 1.9%
•Previously staffing grew at 3% pa
•Impact 4.9 % improvement
•$76m savings in year 1
•$141m in year 2
• Reduction in overtime from 5% to 3.0%
Making “Cents“

Developing Budgets Using Predictive Analytics
• Use predictive analytics to develop annual budget plan
– Model will estimate volumes, staffing and other direct resources
• This will account for 70% to 80% of the budget
• No bottom up budgets required
– Use normal budget process for the remaining budget process
• Run constraint based scenarios to optimize budget plan against strategic and wait-
time targets
• Review budget against strategic goals quarterly, or monthly (if financial or operating
performance intervention required)
• Revise budget and repeat quarterly/ monthly

Implementation Success Factors
• Need a culture of innovation and collaboration
• Leadership and executive support
• Change management support
• Commitment to accountability and transparency
• Need to share and reinvest all or part of savings in care
• Embedding technology in daily work processes
• Need financial and operating constraints

SMALL GROUP QUESTIONS --DUNCAN & CRAIG

Questions
• How agile is your health system?
– What method of priority setting does your system employ currently?
– Has your considered predictive analytics?
• What opportunities presented have the greatest benefit to your system?
• What are the barriers to change and how can they be overcome?

FACILITATED DISCUSSION