manchester rail ridership report jw 9-2-08
TRANSCRIPT

DRAFT
RIDERSHIP ESTIMATES FOR CAPITAL CORRIDOR PASSENGER RAIL SERVICE
BOSTON, MA TO MANCHESTER, NH
PREPARED FOR: SOUTHERN NEW HAMPSHIRE PLANNING COMMISSION
PREPARED BY: PB AMERICAS, INC. MANCHESTER, NH
SEPTEMBER 2008
Photograph by: Haydnseek some rights reserved, see:flickr.com/photos/haydnseek/2562111591/sizes/o/in/set-592748/
PB Americas, Inc. September 4, 2008
Page 2
SUMMARY The Southern New Hampshire Planning Commission, working with the New Hampshire Rail Transit Authority is proposing a new passenger rail service along the rail line between Boston, MA and Manchester, NH passing thorough Lowell, MA and Nashua, NH. It is proposed that the Massachusetts Bay Transportation Authority (MBTA) will operate the service running out of North Station in Boston. As part of this effort Parsons Brinckerhoff has been asked to develop ridership estimates for the proposed new service utilizing the travel demand model that was previously developed and utilized for other rail planning efforts in New Hampshire. The purpose of the ridership forecasting component of this effort is to develop estimates of future year station boardings reflective of the various service configurations under consideration. These service configurations included variations in frequency of service, travel times (express vs. local) and stations served. It is anticipated that proposed services will be primarily used by commuters who work and live in the corridor between Manchester and Boston, and to a lesser extent by air passengers traveling to or from the Manchester airport and people using the service for non-commute purposes. The future horizon year for the forecasts is 2030, though 2010 estimates were also prepared base on interpolating between the year 2000 and year 2030 forecasts. Five alternatives have been developed to estimate the range of ridership that could be anticipated for the rail service to Manchester. The alternatives for which ridership was estimated were:
Alternative No. 1 - A low frequency service plan (3 peak period trains) – Minimum required per MBTA Standards,
Alternative No. 2 - A medium frequency service plan (4/5 peak period trains) – Extension of previously planned Nashua Extension Service,
Alternative No. 3 - A high frequency service plan (6 peak period trains) – Extension of all Lowell Line trains,
Alternative No. 4 - An express service using the medium frequency service plan – Runs express stopping at New Hampshire stations plus Chelmsford, Lowell, Anderson and North Station, and
Alternative No. 5 - An express service using the low frequency service plan – Runs express stopping at New Hampshire stations plus Chelmsford, Lowell, Anderson and North Station.
For this effort a travel demand model has been utilized that was developed to comply with accepted Federal Transit Administration methodology. This methodology is conservative in nature and does not take into account changes to travel patterns and volumes that may occur due to the existence of the service (i.e. new development or induced demand) or from outside factors (i.e. gas price inflation). However, even in light of those limitations, in most instances ridership estimates developed using the FTA modeling methodology have been relatively consistent with the actual ridership realized by new or expanding services. It is estimated that MBTA Lowell Line service will increase by 3,500 between 2000 to 2030, or approximately 30% even without the implementation of the Capital Corridor Passenger Rail Service. The three additional New Hampshire stations, plus the new Chelmsford station, are

PB Americas, Inc. September 4, 2008
Page 3
expected to attract between 4,620 (Alt 1) and 5,280 (Alt 3) new daily trip, though approximately 840 of these boardings are expected to be diversions from the Lowell station.
Table S-1 – Range of Estimated Daily Trips by Station STATION 2010 2030 Manchester 630-780 800-980 Airport/Bedford* 880-980 1,380-1,580 Nashua 1,280-1,380 1,520-1,700 Chelmsford 780-920 920-1,080
*Includes Manchester-Boston Regional Airport passengers

PB Americas, Inc. September 4, 2008
Page 4
INTRODUCTION The Southern New Hampshire Planning Commission, working with the New Hampshire Rail Transit Authority is proposing a new passenger rail service along the rail line between Boston, MA and Manchester, NH passing thorough Lowell, MA and Nashua, NH. Segments of this corridor, termed the Capital Corridor in New Hampshire, are owned by Pan Am Railways and the Massachusetts Bay Transportation Authority (MBTA). It is proposed that MBTA will operate the service running out of North Station in Boston. As part of this effort Parsons Brinckerhoff has been asked to develop ridership estimates for the proposed new service utilizing the travel demand model that was previously developed and utilized for other rail planning efforts in New Hampshire. This effort has focused on two separate modeling methodologies. These methodologies include one that uses the regional travel demand model to estimate home-based work trips (commuter ridership), and one that augments that model with information specific to airport passengers (Airport Station Ridership). PROJECT PURPOSE The purpose of the ridership forecasting component of this effort is to develop estimates of future year station boardings reflective of the various service configurations under consideration. These service configurations include variations in frequency of service, travel times (express vs. local) and stations served. It is anticipated that proposed services will be primarily used by commuters who work and live in the corridor between Manchester and Boston, and to a lesser extent by air passengers traveling to or from the Manchester airport. The future horizon year for the forecasts is 2030, though 2010 estimates were also prepared based on interpolating between the year 2000 and year 2030 forecasts. RIDERSHIP FORECASTING METHODOLOGY Forecasts of commute travel were prepared using the I-93 corridor model, a state-of-the-practice “four-step” travel demand forecast model that has been used to support a number of transit studies in New Hampshire, (See Figure 1 for flow of four-step process). Forecasts of air passenger travel were produced by a simpler spreadsheet model. The following sections describe in greater detail the models used to prepare the forecasts.
I-93 CORRIDOR MODEL The I-93 corridor model is a hybrid of the Massachusetts Statewide Model and the Central Transportation Planning Staff (CTPS) regional model. The Massachusetts Statewide Model is the only calibrated local travel demand forecast model that incorporates the majority of the project study area and has up-to-date network, land use and socioeconomic assumptions. In the I-93 corridor model approach, a geographically expanded version of the Massachusetts Statewide

PB Americas, Inc. September 4, 2008
Page 5
Model is used to provide estimates of trip generation, trip distribution, and time-of-day estimates. These trips are then assigned, and the I-93 corridor subarea extracted. Highway and transit “skims” are prepared for the subarea, and the recently updated CTPS mode choice component, which has been successfully used to support FTA New Starts applications for the Boston MPO, is applied to the subarea trips. These mode choice outputs are then assigned to subarea highway and transit networks. Figure 2 shows the geographic extent of the I-93 corridor model and the towns that are included in the corridor model.
Figure 1. Four-Step Model Process Flow Diagram
GENERATION - Predicts trips productions and
attractions by zone and purpose- Uses Mass Hwy Model
DISTRIBUTION - Connects trip productions and
attractions - Uses Mass Hwy Model
MODE CHOICE - Predicts trip mode (auto,
transit, walk, etc) - Based on CTPS Model
ASSIGNMENT - Predicts volumes on roads and
transit routes - Based on CTPS Model and Mass
Hwy Model

PB Americas, Inc. September 4, 2008
Page 6
Figure 2. Geographic Area of I-93 Corridor Model
PB Americas, Inc. September 4, 2008
Page 7
MODEL TAZS AND NETWORKS The I-93 Corridor Model Traffic Analysis Zones (TAZs) are consistent with the zones used in the Massachusetts and New Hampshire statewide models. These TAZs are approximately equivalent in size to a Census tract. However, as the geographic area of the I-93 corridor model was expanded north of the Manchester area, it was necessary to augment the Massachusetts statewide model with additional TAZs to the north and east of Manchester. The boundaries of these additional TAZs were based on the New Hampshire Model TAZs as of early 2007. As previously mentioned, the New Hampshire Model TAZs were subsequently revised, but these new TAZs are not incorporated into the I-93 Corridor Model.
TRAVEL ANALYSIS ZONES (TAZS) There are a total of 773 TAZs in the I-93 Corridor Model l, totaling approximately 1,600 square miles in area. Figure 3 illustrates the TAZs used in the model. Each TAZ is associated with estimates of population and employment. These population and employment estimates reflected the most recent base year (2000) and future year (2030) socioeconomic and employment forecasts available in the spring of 2007. For Massachusetts TAZs, these forecasts were based on data from CTPS’s detailed 2727-zone system, though this data was transformed in order to associate it with the TAZ definitions used in the I-93 Corridor Model. For New Hampshire TAZs, these forecasts were based on New Hampshire Department of Transportation data, also transformed for use in the model. In total, the I-93 corridor incorporates 776,096 households, a population of 2,011,911, and 1,420,195 jobs.
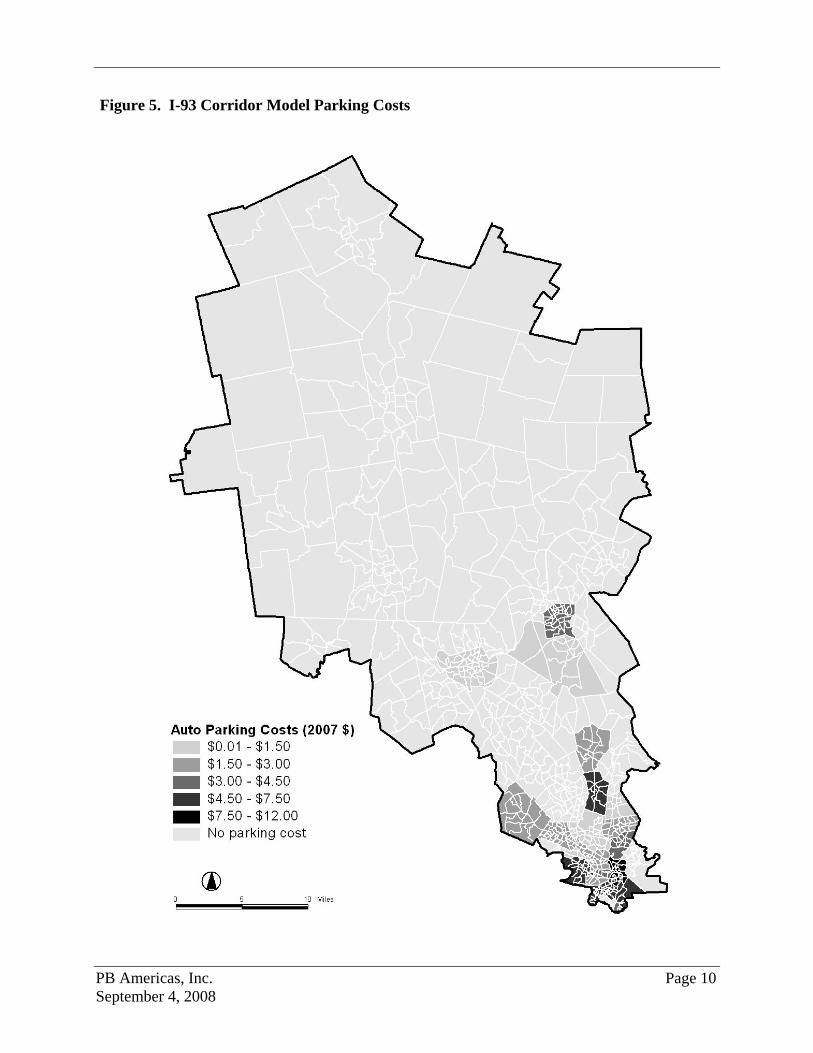
HIGHWAY NETWORKS The highway networks include all major roadways, and many secondary roadways. For those portions of the I-93 corridor present in the Massachusetts statewide model, the networks are based on the Massachusetts Statewide Model. In the expanded portions of the corridor, the networks are based on the New Hampshire Statewide Model as available in the spring of 2007. In the regions core, the highway networks are highly geographically detailed. Highway facility types, default speeds, default capacities and other network input assumptions are based on the Massachusetts Statewide Model. The input assumptions for new links in the expanded modeled area that are based on the New Hampshire Model links were adapted to be compatible with the Massachusetts Statewide Model. Figure 4 illustrates the I-93 corridor model highway network. Consistent with CTPS practice, per mile auto operating costs are assumed to be $0.156 per mile (in 2008 $), and auto parking costs are based on TAZ-level parking costs provided by CTPS. Figure 4 illustrates the TAZ-level parking costs. Roadway networks were developed for two forecast years: 2000 and 2030. Auto operating costs and parking costs are held constant between 2000 and 2030 in that they are assumed to increase with the rate of inflation. The 2030 networks reflect major improvements planned in both Massachusetts and New Hampshire, including: - I-93/I-95 interchange improvements (MA) - I-93 Widening from Exit 41 to NH state
line (MA) - I-93/Route 129 interchange improvements
(MA) - Airport Access Road (NH)
- I-93 Widening (NH) - I-293 Widening (NH) - I-293 Additional Exits (NH) - I-93 Additional Exits (NH)

PB Americas, Inc. September 4, 2008
Page 8
Figure 3. I-93 Corridor Model Traffic Analysis Zones (TAZs)

PB Americas, Inc. September 4, 2008
Page 9
Figure 4. I-93 Corridor Model Roadway Network
PB Americas, Inc. September 4, 2008
Page 10
Figure 5. I-93 Corridor Model Parking Costs

PB Americas, Inc. September 4, 2008
Page 11
TRANSIT NETWORKS The transit network includes all major transit routes in the corridor. At the southern end of the corridor the transit network includes portions of the Boston subway system, as well as bus routes present in the corridor. The transit network includes the Lowell and Haverhill commuter rail routes, the local bus systems in Lowell, Lawrence, Haverhill, Nashua and Manchester, and the private long distance bus routes serving Boston from New Hampshire. The transit network also includes the proposed bus services from park and ride lots at I-93 Exits 2, 3, 4 and 5 that are being planned by the State of New Hampshire to begin in November 2008. Figure 6 illustrates the transit network in the corridor. In order to support application of the CTPS mode choice model, the transit network incorporates operating assumptions for four time periods: AM Peak, Midday, PM Peak, and Evening. Route headways are adjusted using CTPS’s strategy, which adjusts the average wait time depending on the headway duration. Transit vehicles that operate in mixed flow conditions are based on congested roadway travel times, while exclusive guideway transit service travel times are “hard coded.” In addition, to the greatest extent possible, all transit pathbuilding weights are consistent with CTPS practice. The transit network procedures incorporate both flat fare and zone fares and park and ride parking and drive access out-of-pocket costs, as they existed in the year 2000. These fares and costs have been scaled to 1991 dollars, in order to be consistent with CTPS mode choice model application. In addition to park-and-ride parking costs, out-of-pocket drive costs are calculated at $0.156 per mile (in 2008 $). These cost assumptions are held constant between the base and future years. The 2030 transit networks reflect major improvements planned in both Massachusetts and New Hampshire, including:
Silver Line Phase III Orange Line station at Assembly Square Green Line extension to Medford

PB Americas, Inc. September 4, 2008
Page 12
Figure 6. I-93 Corridor Model Transit Network

PB Americas, Inc. September 4, 2008
Page 13
TRIP GENERATION The trip generation component of the I-93 corridor model relies directly on the generation component of the Massachusetts Statewide Model. This model predicts the number of trip productions for each zone by purpose using household level cross-classification models estimated from the 1995 Nationwide Personal Transportation Survey (NPTS) - Massachusetts oversample. Separate trip rates were developed for different geographic subareas to account for area type differences and different levels of network accessibility. Trip attraction models were formulated as zone-level multiple regression models based on employment by zone. They were also estimated with the NPTS data and year 2000 zone level employment data. Trip productions and attractions are then balanced to the total number of productions both for the whole model area and for a few large subareas.
TRIP DISTRIBUTION The trip distribution component of the I-93 corridor model is also based directly on the Massachusetts Statewide Model and is comprised of a set of purpose-specific gravity models. The gravity models were calibrated using the NPTS data and initial estimates of daily congested travel times based on free flow travel times and BPR volume delay functions. For each purpose, an initial trip distribution is performed based on the free-flow speeds. Outputs from this step are then used to estimate a daily trip table that is assigned to the network to produce estimated congested link speeds. These congested speeds are then used as inputs into the gravity models to estimate the final person trip tables. K-factors were used in trip distribution calculations to adjust origin and destination trip interchanges not well replicated in the gravity modeling process. For the work purpose, the gravity model was calibrated at a district level to better match observed flows in the corridor reported in the year 2000 Census Transportation Planning Package. The non-work purpose models were left as calibrated by the Massachusetts state highway department. This analysis is primarily focused on the effect of proposed transportation network improvements on work travel, though air passenger travel is also addressed using a separate spreadsheet-based model. As a result, the focus of the trip distribution model calibration was also on work travel. The main source of observed data on work travel in the corridor is the Census “Journey to Work” data.
TIME OF DAY The allocation of distributed trips to the four time periods used in the Massachusetts Model is accomplished by the application of a set of purposes-specific time of day and directional factors. These factors were derived from the NPTS trip database. After trip distribution, the analysis has produced an interzonal trip table for each trip purpose. In the following steps, the tables are rearranged to create new trip tables to represent each time period using time-of-day (TOD) factors developed by trip purpose and time period from the travel survey data. Time period and purpose specific travel mode factors are then applied to produce vehicle trips. The Mass Statewide Model currently allocates daily trips for the a.m. peak, p.m. peak, mid-day and night time periods.

PB Americas, Inc. September 4, 2008
Page 14
SUBAREA EXTRACTION In order to implement the CTPS mode choice model in the I-93 corridor subarea, it is necessary to first extract the trips with both trip ends inside the I-93 corridor. All trips with at least one end outside of the corridor are considered external trips, and though they are preserved in the model system, no mode choice is applied. This approach is intended to address concerns about the reasonability of applying urban mode choice model structures and parameters at a statewide level. The subarea extraction process creates matrices of trips between all corridor zones and external stations by assigning these trips to the roadway network. A unique feature of the I-93 corridor model subarea extraction process is that this assignment is performed simultaneously by purpose. Preserving the purpose information allows the demand matrices produced by the subarea extraction process to be converted back from origin-destination format to production-attraction format, for proper input into the mode choice model, which is adapted from the CTPS mode choice model.
MODE CHOICE For the I-93 and Nashua modeling efforts, the mode choice structures and coefficient values from the CTPS mode choice model were borrowed and, as well as the pathbuilding parameters and assumptions. Most significantly, the mode choice model is applied to internal-internal corridor trips only, rather than at the statewide level. In addition to the concern regarding use of the urban mode choice model at the statewide level, this approach facilitates greater model calibration in the I-93 project corridor. For the work purpose, the mode choice model was calibrated to better match mode shares derived from the 2000 Census Transportation Planning Package. The calibration was performed by iteratively reviewing the roadway and transit networks and associated skims, and by making adjustments to the mode choice constants, which are stratified by destination ring. TRIP ASSIGNMENT After the mode choice models have been applied by time period, the roadway and transit trips are assigned to time period-specific networks. The roadway assignment procedures are based on the Massachusetts Statewide Model, in order to use the facility and area type network link assumptions present in the Statewide Model networks, and also to be consistent with the earlier model steps, such as trip distribution. The transit assignment procedures are based on the CTPS model procedures, though adjustments to the assignment parameters are made as part of the calibration process. The transit assignment validation was focused primarily on the existing Lowell commuter rail route in the corridor. AIRPORT PASSENGER TRANSIT RIDERSHIP MODEL The travel demand model developed to support the analysis of transit service alternatives is a typical “four-step” travel demand forecast model, which predicts trip generation, trip distribution, trip mode choice, and trip assignment for “typical weekday” travel. The model does not forecast travel demand associated with special generators such as airports. The trips associated with airport travel are different than typical weekday travel in their generation, timing,

PB Americas, Inc. September 4, 2008
Page 15
distribution and mode choice due to the constraints associated with the limited number of airport locations, airline schedules, baggage, and other factors. All the alternatives under consideration as part of this study include a station near the Manchester-Boston Regional Airport. While the corridor model captures the effect of this airport station/stop location on workers traveling to and from airport work destinations, as well as workers using the airport station to commute to other locations in the corridor, it was necessary to develop a separate “off-model” approach to forecasting the use of the airport station by airport travelers. A simplified version of the four-step approach was implemented in a spreadsheet. The trip generation was based on estimates of year 2000 daily trips associated with the Manchester airport provided by the Southern New Hampshire Planning Commission, and on an assumed annual growth rate of 2.8% provided by the Manchester Airport. SNHPC assumes approximately 13,300 daily airport passenger trips in 2000, which increase to 30,500 daily airport trips in 2030. It was then determined how many of those daily airport passenger trips could be served by the proposed rail service (identified as possible transit trips). This was done through an analysis of airport passenger travel time of day and the travel origins and destinations (within New England) of airport passengers. Airport passenger time of day analysis was based on the airport arrival and departure information included in Figure 7. From the identification of the Possible Transit Trips, an assumed transit “mode share” was identified that is typical of airport passengers. The assumed transit mode share of 5% was based on a review mode shares observed at other US airports with comparable transit services. Table 1 shows the result of this analysis, with a forecast of 301 air passenger trips in 2030 to and from the Manchester-Boston Regional Airport using the proposed transit services. Table 1. Manchester Air Passenger Trips Using Transit Total Trips Possible Transit Transit Trips Year 2000 Daily Trips 13,318 2,625 131 Year 2030 Daily Trips 30,495 6,012 301
The estimated airport passenger transit ridership is based on the existing distribution of ground access trips that are currently experienced at the airport. It is highly likely that with the implementation of rail service the volumes of airport passengers that would use the airport from areas that could be served by the service would increase. The extent of that increase would be determined by numerous factors including but not limited to, the draw of airlines serving Manchester-Boston vs. other nearby airports (namely Boston’s Logan International), ease of access to the airports within the region, and the potential for travel packages to utilize the rail service for travel bookings. Due to the variability of future conditions that could be experienced at the Manchester-Boston the ridership estimates were based on the existing conditions and did not take into account the potential market changes at the airport.

PB Americas, Inc. September 4, 2008
Page 16
Figure 7. Manchester-Boston Regional Airport Flight Arrival and Departure Distribution
0
2
4
6
8
10
12
14
0000
-005
9
0100
-015
9
0200
-025
9
0300
-035
9
0400
-045
9
0500
-055
9
0600
-065
9
0700
-075
9
0800
-085
9
0900
-095
9
1000
-105
9
1100
-115
9
1200
-125
9
1300
-135
9
1400
-145
9
1500
-155
9
1600
-165
9
1700
-175
9
1800
-185
9
1900
-195
9
2000
-205
9
2100
-215
9
2200
-225
9
2300
-235
9
Hour
# o
f Flig
hts
ARRIVALS
DEPARTURES
Source: Manchester Airport Authority
SERVICE ASSUMPTIONS FOR PROPOSED MANCHESTER RAIL SERVICE The effort to identify potential ridership for the proposed rail service between Boston and Manchester requires a number of inputs to define the proposed service. This includes assumptions for each of the following components:
Route alignments Transit route travel times Station locations Transit service frequencies Transit hours of operations Transit service fares Parking fees Links to supporting transit services
Five alternatives have been developed to estimate the range of ridership that could be anticipated for the rail service to Manchester. The alternatives for which ridership was estimated were:
Alternative No. 1 - A low frequency service plan (3 peak period trains) – Minimum required per MBTA Standards,
Alternative No. 2 - A medium frequency service plan (4/5 peak period trains) – Extension of previously planned Nashua Extension Service,
Alternative No. 3 - A high frequency service plan (6 peak period trains) – Extension of all Lowell Line trains,

PB Americas, Inc. September 4, 2008
Page 17
Alternative No. 4 - An express service using the medium frequency service plan – Runs express stopping at New Hampshire stations plus Chelmsford, Lowell, Anderson and North Station, and
Alternative No. 5 - An express service using the low frequency service plan – Runs express stopping at New Hampshire stations plus Chelmsford, Lowell, Anderson and North Station.
The following describes the assumptions that have been coded into the model for each of the above listed alternatives. The first set of assumptions (including Route Alignment, Locations of Stations, Transit Service Fares, Parking Fees, and links to supporting transit services are consistent for all alternatives.
ROUTE ALIGNMENT The route of all alternatives will operate between Boston-North Station and Manchester, NH utilizing the New Hampshire Main Line (also known as the Lowell Line) for the entire trip. See Figure 8 for route alignment and station locations. LOCATIONS OF NEW STATIONS Manchester Station – Although multiple sites could be considered for the Manchester station site, for the purposes of this study the station site is identified as being located near Granite Street in downtown Manchester. Airport/Bedford Station – It is assumed for this study that the Airport/Bedford station will be located adjacent to the new Manchester Airport Access Road Interchange. Nashua Station – For this study the assumed location of the Nashua Station is on the former site of Hampshire Chemical off of East Spit Brook Road. Chelmsford Station – Based on the results of the North Chelmsford Commuter Rail Station Feasibility Study (CTPS 2000), the location of the station is assumed to be on the north side of the tracks off of Wotton St. TRANSIT SERVICE FARES The fares established for this effort are based on the MBTA fare structure of 2000, the calibration year of the travel demand model. Table 2 shows the fares in both 2000 dollars and 2008 dollars.
Table 2 – Fare Structure for New Commuter Rail Stations
Origin Daily One-way Adult Fares ($2000 dollars)
Daily One-way Adult Fares (escalated to $2008 dollars)
Manchester $5.75 $7.42 Bedford/Airport $5.75 $7.42 Nashua $5.00 $6.45 Chelmsford $4.50 $5.80

PB Americas, Inc. September 4, 2008
Page 18
Figure 8 – Route Alignment and Station Locations
Not to Scale

PB Americas, Inc. September 4, 2008
Page 19
PARKING FEES No parking fees are assumed at the new stations. Parking fees in effect in 2000 at existing stations are assumed. Although parking fees may be a prudent and necessary component of project funding. The elimination of parking fees from the ridership modeling will identify the level of demand for the trip without the influence of parking fees. LINKS TO SUPPORTING TRANSIT SERVICES It is assumed that through the implementation of this service no other transit services will be modified. Therefore, existing supporting services, (i.e. Manchester Transit Authority bus routes) remain as currently configured. Although it is highly likely that MTA service routes would be reconfigured to provide enhanced connection to the rail service, the since the type and extent of those changes are not known at this time, it was considered a conservative assumption that no changes are made. Any modifications to MTA routes are not anticipated to substantially impact ridership estimates for the rail services.
The following describes the assumptions that have been coded into the model that are specific for each alternative. These alternative specific assumptions include, Route Station Stops, Travel Times, Service Frequencies, and Hours of Operation.
ROUTE STATION STOPS – Assumptions for the typical station stops that the service will make are provided for each alternative. Alternative No. 1 - (Low Frequency) – This alternative is assumed to make stops at all stations on the existing Lowell Line and all New Hampshire Stations. This includes the following list of stations.
Manchester Airport/Bedford Nashua Chelmsford Lowell Wilmington Anderson/Woburn Winchester Center Wedgemere West Medford North Station
Alternative No. 2 – (Medium Frequency) – This alternative is assumed to make stops at all stations on the existing Lowell Line and all New Hampshire Stations. This includes the same stations included in Alternative No. 1 (Low Frequency). Alternative No. 3 – (High Frequency) – This alternative is assumed to make stops at all stations on the existing Lowell Line and all New Hampshire Stations. This includes the same stations included in Alternative No. 1 (Low Frequency).

PB Americas, Inc. September 4, 2008
Page 20
Alternative No. 4 – (Medium Frequency Express) – This alternative will only stop at a select number of stations. This will include all stations in New Hampshire and major Massachusetts stations. The includes the following list of stations.
Manchester Airport/Bedford Nashua Lowell Anderson/Woburn North Station
Alternative No. 5 – (Low Frequency Express) - This alternative will only stop at a select number of stations. This will include all stations in New Hampshire and major Massachusetts stations. The station list is the same as in Alternative No. 4. TRAVEL TIMES Alternative No. 1 (Low Frequency) – The travel times between stations are assumed as included in Table 3 – Local Rail Service Travel Times.
Table 3 - Local Rail Service Travel Times
From Station To Station Travel Time Manchester Airport/Bedford 6 minutes Airport/Bedford Nashua 19 minutes Nashua Chelmsford 8 minutes Chelmsford Lowell 6 minutes Lowell North Station Same as existing
MBTA Lowell Line Service
The estimated travel time from Manchester to North Station – Boston (with 30 second average dwell times) is 88 minutes. Alternative No. 2 – (Medium Frequency) – The travel times between stations are assumed to be the same as in Alternative No. 1. Alternative No. 3 – (High Frequency) – The travel times between stations are assumed to be the same as in Alternative No. 1. Alternative No. 4 – (Medium Frequency Express) – The travel times between stations are assumed as follows:

PB Americas, Inc. September 4, 2008
Page 21
Table 4 - Express Rail Service Travel Times
From Station To Station Travel Time Manchester Airport/Bedford 6 minutes Airport/Bedford Nashua 19 minutes Nashua Lowell 13 minutes Lowell Anderson/Woburn 18 minutes Anderson/Woburn North Station 21 minutes
The estimated travel time from Manchester to North Station – Boston (with 30 second average dwell times) is 79 minutes. Alternative No. 5 – (Low Frequency Express) - The travel times between stations are assumed to be the same as in Alternative No. 4. SERVICE FREQUENCIES The following average service frequencies are provided in terms that match the time periods included in the model (AM Peak, 6AM to 9AM, Mid-Day 9AM to 4PM, PM-Peak 4PM to 7PM, and Evening 7PM plus) Alternative No. 1 (Low Frequency) – The service frequencies that are assumed for this alternative represent a minimum build alternative. The frequencies match the minimum frequency of service standard for the MBTA.
AM Peak – 60 minute headways Mid-Day – 180 minute headways PM-Peak - 60 minute headways Evening - 180 minute headways
This alternative would have a total of 12 trains operating in each direction each weekday. Alternative No. 2 – (Medium Frequency) – The service frequencies that are assumed for this alternative match those that were proposed for the Lowell-Nashua service and are comparable to many of the routes on the MBTA’s commuter rail system.
AM Peak – 45 minute headways Mid-Day – 90 minute headways PM-Peak - 45 minute headways Evening - 90 minute headways
This alternative would have a total of 18 trains operating in each direction each weekday. Alternative No. 3 – (High Frequency) – The service frequencies that are assumed for this alternative are an extension of the existing MBTA service that currently serves Lowell.

PB Americas, Inc. September 4, 2008
Page 22
AM Peak – 30 minute headways Mid-Day – 60 minute headways PM-Peak - 30 minute headways Evening - 60 minute headways
This alternative would have a total of 22 trains operating in each direction each weekday. Alternative No. 4 – (Medium Frequency Express) – The service frequencies that are assumed for this alternative match those in Alternative No. 2. Alternative No. 5 – (Low Frequency Express) - The service frequencies that are assumed for this alternative match those in Alternative No. 3. HOURS OF OPERATION Alternative No. 1 (Low Frequency) - The core hours of operation for this service are assumed to operate from 6 AM to midnight. It is assumed that two additional trains will be operated in the Early AM to serve early airport flights. One would depart Boston at approximately 3:45 AM for passengers to arrive at the Manchester-Boston Regional Airport at 5 AM. The other would leave at 4:30 AM for passengers to arrive at the airport at 5:45 AM. Alternative No. 2 – (Medium Frequency) – The hours of operation for this service are assumed to operate from 6 AM to midnight. The early AM trips to accommodate airport passengers will also be operated. Alternative No. 3 – (High Frequency) – The hours of operation for this service are assumed to operate from 6 AM to midnight. The early AM trips to accommodate airport passengers will also be operated. Alternative No. 4 – (Medium Frequency Express) – T The hours of operation for this service are assumed to operate from 6 AM to midnight. The early AM trips to accommodate airport passengers will also be operated. Alternative No. 5 – (Low Frequency Express) - The hours of operation for this service are assumed to operate from 6 AM to midnight. The early AM trips to accommodate airport passengers will also be operated.

PB Americas, Inc. September 4, 2008
Page 23
RIDERSHIP ESTIMATES Table 5 shows the 2000 observed ridership by station in 2000 as well as the 2010 station ridership estimates associated with a “no build” condition and each of the five alternatives described above. The “No Build” shows the anticipated growth in ridership along the Lowell Line between 2000 and 2010. Also indicated are the total number of new transit trips that are estimated for each alternative. Table 6 illustrates this same information for the year 2030. Table 5 – Estimated 2010 Daily Trips
Boarding/Alighting Station
2000 Base 2010 No-Build
Alt 1 Alt 2 Alt 3 Alt 4 Alt 5
MANCHESTER 630 700 740 780 740 AIRPORT* / BEDFORD 880 900 960 980 960
NASHUA 1,280 1,320 1,380 1,380 1,340 CHELMSFORD 780 860 920 820 800
LOWELL 2,960 3,240 2,620 2,580 2,560 3,540 3,520 NORTH BILLERICA 2,100 2,280 2,220 2,220 2,220 2,060 2,060
WILMINGTON 1,100 1,200 1,200 1,180 1,180 1,080 1,080 ANDERSON / WOBURN 1,760 1,860 1,760 1,740 1,740 2,880 2,860 WINCHESTER CENTER 1,300 1,420 1,400 1,400 1,400 1,380 1,380
WEDGEMERE 980 1,080 1,080 1,080 1,080 1,060 1,060 WEST MEDFORD 840 1,060 1,300 1,300 1,300 1,300 1,300
LINE TOTAL 11,040 12,140 15,150 15,280 15,480 17,260 17,100 New Transit Trips
(Compared to No-Build) 3,010 3,140 3,340 5,120 4,960 Source: PB Americas, Inc. Table 6 - Estimated 2030 Daily Trips 2000 Base 2030
No-Build Alt 1 Alt 2 Alt 3 Alt 4 Alt 5
MANCHESTER 800 900 980 980 960
AIRPORT* / BEDFORD 1,380 1,460 1,520 1,580 1,520
NASHUA 1,520 1,620 1,700 1,680 1,620
CHELMSFORD 920 1,000 1,080 980 940
LOWELL 2,960 4,000 3,220 3,180 3,160 4,340 4,300
NORTH BILLERICA 2,100 2,620 2,620 2,620 2,620 2,420 2,420
WILMINGTON 1,100 1,400 1,420 1,400 1,400 1,280 1,280
ANDERSON / WOBURN 1,760 2,060 2,080 2,060 2,060 3,340 3,340
WINCHESTER CENTER 1,300 1,660 1,660 1,660 1,660 1,620 1,620
WEDGEMERE 980 1,280 1,280 1,280 1,280 1,240 1,240
WEST MEDFORD 840 1,520 1,540 1,520 1,520 1,520 1,520 LINE TOTAL 11,040 14,540 18,440 18,700 18,980 20,980 20,760
New Transit Trips (Compared to No-Build) 6,300 6,560 6,840 8,840 8,620
Source: PB Americas, Inc.

PB Americas, Inc. September 4, 2008
Page 24
These tables indicate that baseline Lowell line trips are expected to increase by 3,500 by 2030, or approximately 30%. The three additional New Hampshire stations plus the new Chelmsford station are expected to attract between 4,620(Alt 1) and 5,280 (Alt 3) new trips, though approximately 840 of these trips are expected to be diversions from the Lowell station. Alternative 1 assumes the lowest level of service - one hour frequencies to the New Hampshire during the peak, and no express service. Alternatives 2 and 3 also assume no express service, but include higher peak service frequencies of 45 minutes and 30 minutes, respectively. Table 6 indicates that increased frequencies do increase transit trips, but not significantly – typically on the order of 5% to 20%, depending on the station. Alternatives 4 and 5 are qualitatively different than Alternatives 1 through 3. Alternatives 4 and 5 include new express service from New Hampshire at frequencies comparable to alternatives 1 and 2, but with slightly faster travel times. Accordingly, the ridership estimates for Alternative 4 is slightly higher than Alternative 2 (with which it shares service frequencies) and the ridership estimates for Alternative 5 are slightly higher than Alternative 1 (which it shares service frequencies). Most significantly, ridership at Lowell and Anderson increase substantially due to the expansion of service (the New Hampshire express trains), and the faster travel times associated with these trains. Thus, the primary benefits of the New Hampshire express alternatives accrue in Massachusetts, not New Hampshire. For this effort a travel demand model has been utilized that was developed to comply with accepted Federal Transit Administration methodology. This methodology is conservative in nature and does not take into account changes to travel patterns and volumes that may occur due to the existence of the service (i.e. new development or induced demand) or from outside factors (i.e. gas price inflation). The potential for new development to occur around each rail station exists. This increased development in the station area would have the potential of increasing ridership at the station, especially when the development is residentially based. Sensitivity analyses conducted for other rail projects in New Hampshire have indicated a potential for an increase in station boarding of 15% to 20% due to development in the station area. Additionally there has been extensive discussion regarding the impact of gas prices on transit ridership. Although there is no conclusive answer regarding the long-term impact of increase fuel costs, it does appear certain that increased travel costs will change the way and volume of peoples travel as compared to the past. Although there is a high level of confidence in the ridership estimates based on the assumptions included in the model, some of the unknowns (as identified above) could impact the accuracy of the ridership estimates as the project is implemented.

PB Americas, Inc. September 4, 2008
Page 25
APPENDIX
Revenue Projections

Memorandum
PB Americas, Inc. 75 Arlington Street Boston, Massachusetts 02116 (617) 426-7330 FAX (617) 482-8487
Date: September 04, 2008
to: David Preece
from: John Weston
subject: Capital Corridor Passenger Rail Service: Annual Revenue Estimates
The purpose of this memo is to identify the estimated new revenue to be generated by the implementation of the Capital Corridor Passenger Rail Service.
The estimated revenue projections are based on a number of variables that have also been used in the travel demand model to estimate ridership. The two primary variables the revenues are based on incude the estimated new inbound boardings at each station and the fare structure. The fare structure used for was based on the MBTA fare structe in 2000, the calibration year of the travel demand model. The fares, in 2000 dollars are included in the Table 1.
Table 1 – Fare Structure for New I-93 Stations
Origin Daily One-way Adult Fares ($2000 dollars)
Manchester $5.75 Londonderry $5.75 Derry $5.75 Windham $5.00 Salem $4.50 Lawrence/ Methuen $4.25
By utilizing the fare structure, the estimated new transit boardings developed from the travel demand model and an estimate of alighting locations, a potential total daily revenue was estimated in 2000 dollars. This was then escalated to 2008 dollars, annualized (using an annualization factor of 294, consistent with MBTA annualization factors) and discounted consistent with the factors used by CTPS to account for monthly passes and discounted fares (seniors, students, etc.). The estimated revenue for each of the alternatives are included in Table 2.
Table 2 – Estimated 2030 Revenue for New Transit Trips
Alternative Annual Revenue ($2008 dollars) Alternative 1 $4,000,000 Alternative 2 $4,300,000 Alternative 3 $4,600,000 Alternative 4 $6,000,000 Alternative 5 $5,800,000