mandatory ifrs adoption and institutional investment decisions
TRANSCRIPT

THE ACCOUNTING REVIEW American Accounting AssociationVol. 87, No. 6 DOI: 10.2308/accr-502252012pp. 1993–2025
Mandatory IFRS Adoption and InstitutionalInvestment Decisions
Annita Florou
King’s College London
Peter F. Pope
City University London
ABSTRACT: We examine whether the mandatory introduction of International Financial
Reporting Standards leads to an increase in institutional investor demand for equities.
Using a large ownership database covering all types of institutional investors from
around the world, we find that institutional holdings increase for mandatory IFRS
adopters. Changes in holdings are concentrated around first-time annual reporting
events. Second, we document that the positive IFRS effects on institutional holdings are
concentrated among investors whose orientation and styles suggest they are most likely
to benefit from higher quality financial statements, including active, value, and growth
investors. These results are consistent with holdings changes being associated with the
financial reporting regime change. Finally, we show that increased institutional holdings
are concentrated in countries in which enforcement and reporting incentives are
strongest, and where the differences between local GAAP and IFRS are relatively high.
Overall, our study helps shed new light on the channels by which IFRS information
becomes impounded in market outcomes.
Keywords: accounting regulation; IFRS; standard-setting; accounting quality; compa-rability; institutional investment decisions.
JEL Classifications: G11; K22; M41; M42.
Data Availability: The data used in this study are available from the commercial
sources identified in the paper.
We thank Paulo Alves and Ulf Bruggeman for excellent research assistance. We are grateful to Wayne Thomas (editor)and John Harry Evans III (senior editor) and to two anonymous referees for their invaluable suggestions. We also thankHans Christensen, Mark DeFond, Miles Gietzmann, Fani Kalogirou, Sonia Konstantinidi, Scott Richardson, DanThornton, Stephen Young, Peter Wysocki, and participants at the 8th London Business School Accounting Symposiumand the 2009 AS-GAABR/IAAER Conference for their helpful comments on earlier drafts.
Editor’s note: Accepted by John Harry Evans III, with thanks to Wayne Thomas for serving as editor on a previousversion.
Submitted: March 2010Accepted: May 2012
Published Online: June 2012
1993

I. INTRODUCTION
Regulators have claimed that investors and issuers of securities will benefit from the
mandatory adoption of International Financial Reporting Standards (IFRS). They claim
that for many countries IFRS require higher quality measurement and recognition rules;
they are more transparent than local GAAP; and that common IFRS financial reporting across
countries will enhance comparability (EC Regulation No. 1606/2002, European Council 2002).
Theory predicts that the mandated introduction of higher quality financial reporting can improve
stock market liquidity and reduce the cost of capital (Leuz and Wysocki 2008), and empirical
evidence on the market outcomes of mandatory IFRS adoption generally supports these predictions
(Daske et al. 2008; Li 2010). An indirect implication of such findings is that market participants
find IFRS reporting to be incrementally informative. In this paper we test directly whether
mandated IFRS adoption affects institutional investor decisions. Institutional investors are an
interesting group of financial statement users because they are economically important and because
they are often regarded as sophisticated users who have the time, resources, and expertise to process
the information in complex financial statements. Establishing a causal link between mandatory
IFRS reporting and institutional investor decision outcomes helps to shed new light on the channels
by which IFRS information becomes impounded in market outcomes.
Using a global sample of 10,852 unique firms from 45 countries over the 2003–2006 period,
we report a number of results that are new to the literature. First, after controlling for standard
economic determinants of institutional holdings, we show that over the two-year period 2005–2006
institutional ownership increases by more than 4 percent and the number of institutional investors
increases by almost ten for mandatory IFRS adopters, relative to non-adopters. Results are
consistent for different analyses based on annual firm-level as well as quarterly firm-level and
country-level changes in institutional holdings. Second, we document that the positive IFRS effects
on institutional holdings are concentrated among investors whose orientation and styles suggest
they are most likely to benefit from higher quality financial statements. For example, institutional
holdings in mandatory IFRS adopters increase significantly for active investors, but changes are
much lower or insignificant for passive investors. Similarly, IFRS-related holdings increases are
substantially higher for value and growth investors than for index and income investors. Finally, we
document that the increases in institutional holdings associated with IFRS are not homogeneous
across countries. Our findings indicate that institutional holdings increase for first-time mandatory
adopters primarily in countries in which enforcement and reporting incentives are strongest, and
where the differences between local GAAP and IFRS are relatively high. Inferences are unaffected
by various sensitivity tests, including different sample definitions and additional control variables.
Our paper is most closely related to Bradshaw et al. (2004) and Covrig et al. (2007). Bradshaw
et al. (2004) is the first study to show that institutional stock ownership is related to firm-level
accounting choices, although they do not consider the role of accounting standards. Covrig et al.
(2007) show that stock ownership by foreign mutual funds increases with the voluntary adoption of
International Accounting Standards (IAS) by non-U.S. firms. Our paper extends this line of research
by investigating the effects of mandatory IFRS adoption on institutional holdings. Our paper is also
related to two concurrent studies reporting that foreign mutual fund ownership increases following
mandatory IFRS introduction (Yu 2010; DeFond et al. 2011). However, both of those studies focus
on the mechanisms through which IFRS attracts foreign investors. Yu (2010) examines the IFRS
effects of lower information asymmetry, measured primarily by the accounting distance between
the investees’ and investors’ accounting standards. DeFond et al. (2011) examine the IFRS effects
of increased comparability based on the similarity of accounting standards of investee firms within
industries and across different countries.
1994 Florou and Pope
The Accounting ReviewNovember 2012

We contribute to the literature in several ways. First, we provide evidence that institutional
investor decisions respond to IFRS reporting. This helps to explain the mechanism through which
the IFRS-related capital market outcomes reported in Daske et al. (2008) and Li (2010) occur.
Second, we employ a research design that enhances our ability to link the observed ownership
effects to the financial reporting regime change and helps rule out alternative explanations (Daske et
al. 2008, 1132) as follows: (1) we identify the timing of changes in institutional holdings relative to
first-time IFRS reporting events; (2) we examine the institutional holdings effects of mandatory
IFRS adoption with reference to differences in the predicted demand for and use of financial
reporting information by different investors; and (3) we focus on changes in holdings rather than
levels of holdings, thereby helping to control for firm- and country-level characteristics that
determine holdings independently of the financial reporting regime. Our focus on mandatory IFRS
adoption helps to mitigate potential issues of selection bias and omitted correlated factors in
voluntary adoption studies (Leuz and Wysocki 2008).
Finally, we introduce a new research design in examining the institutional context of IFRS
reporting effects. Our approach is different from that of prior work (Daske et al. 2008; Li 2010)
because we test the impact of complementary institutional features by using a single model based
on institutional ‘‘bundles’’ rather than several models focusing on different institutional
characteristics. Our findings on the role of institutions contribute to a growing literature
highlighting that the introduction of higher quality accounting standards is necessary, but not
sufficient, for higher quality financial reporting and associated benefits (Li 2010).
The remainder of the paper is organized as follows. In the next section we discuss prior related
studies and elaborate on the motivation of our study. In Section III we describe in detail the research
design and data. We discuss our findings in Section IV. Finally, in Section V we present our conclusions.
II. THEORETICAL BACKGROUND AND MOTIVATION
Proponents of IFRS claim that IFRS have advantages over local accounting standards in many
countries for several reasons. First, IFRS may be more capital-oriented and, therefore, more useful
to investors (Hail et al. 2010). Second, IFRS can reduce the choice of accounting methods, thus
constraining managerial discretion (International Accounting Standards Board [IASB] 1989;
Ashbaugh and Pincus 2001; Barth et al. 2008). Third, IFRS require accounting measurements and
recognition that better reflect a firm’s underlying economic position, hence providing more relevant
information for investment decisions (IASB 1989; Barth et al. 2008). Fourth, IFRS increase
required disclosures, thereby mitigating information asymmetries between firms and their
shareholders (Leuz and Verrecchia 2000; Ashbaugh and Pincus 2001). Aside from the higher
financial reporting quality argument, proponents of IFRS also claim that harmonization around
IFRS increases comparability of firms across markets and countries, hence facilitating cross-border
investment and integration of capital markets (Armstrong et al. 2010; DeFond et al. 2011).
In light of these potential advantages, advocates of IFRS often argue that they can be beneficial
for investors, issuers, and economies because enhanced financial reporting can result in increased
investor demand for equities and lower cost of capital (European Council 2002). Theory suggests
that these outcomes will follow if (1) market liquidity increases and price protection falls due to
lower information asymmetries among investors (Baiman and Verrecchia 1996; Verrecchia 2001);
(2) risk sharing improves due to increased awareness of investment opportunities by investors
(Merton 1987; Easley and O’Hara 2004); or (3) the estimation risk facing investors falls (Jorgensen
and Kirschenheiter 2003; Lambert et al. 2007; Hughes et al. 2007). In each case investment and
portfolio decisions depend on financial reporting, and a change to a higher quality and
homogeneous financial reporting regime is predicted to result in an increase in demand for equities
and investment holdings.
Mandatory IFRS Adoption and Institutional Investment Decisions 1995
The Accounting ReviewNovember 2012

On the other hand, there are several reasons why the expected benefits of IFRS can be
questioned. First, reducing accounting alternatives may result in a less true and faithful
representation of the firm’s underlying economics (Barth et al. 2008). Second, increasing
managerial flexibility, because of the principles-based nature of IFRS, may augment the opportunity
for earnings management (Barth et al. 2008). Third, and perhaps most importantly, an increasing
number of scholars emphasize that dysfunctional reporting incentives combined with weak
enforcement mechanisms can reduce financial reporting quality, even when high-quality accounting
standards are implemented (Ball et al. 2003; Burgstahler et al. 2006; Ball 2006).
To the extent that financial reporting under IFRS enhances the quality and comparability of
accounting information provided by issuers, we predict that mandatory IFRS adoption is associated
with an increase in the demand for equity in IFRS adopting firms. We also predict that IFRS-related
changes in holdings are more likely to be observed for investors whose investment orientations and
styles rely most heavily on firm-specific financial information (Bushee and Goodman 2007).
The expected effects of mandatory IFRS adoption are likely to depend on the institutions of the
adopting country (Hail et al. 2010). In line with this argument, Daske et al. (2008) and Li (2010)
document that the capital market effects of IFRS are more pronounced in countries with stricter
enforcement regimes and therefore better IFRS implementation; stronger reporting incentives and
therefore higher quality financial reporting; and higher divergence between IFRS and local GAAP
and therefore a larger change of domestic accounting rules.1 Accordingly, we predict that the
IFRS-related effects on institutional holdings for first-time mandatory adopters are likely to be
greater in countries with higher quality institutions and countries with less conformity between
domestic GAAP and IFRS.
III. RESEARCH DESIGN AND DATA DESCRIPTION
Identification Strategies
An important concern in studies of the impact of institutional change is to provide evidence that
observed effects reflect causality and rule out alternative explanations. Our baseline results, using a
difference-in-differences research design similar to Daske et al. (2008), document increases in
institutional holdings after mandatory IFRS adoption. Our main challenge is to develop convincing
evidence that increases in institutional holdings result directly from the financial reporting regime
change and are not due to other contemporaneous regulatory or market changes affecting IFRS
countries. Our research design includes two strategies designed to address this challenge.
Our first strategy uses information on the timing of firm-specific IFRS reporting to infer
whether causality runs from financial reporting to institutional holdings changes. Therefore, we
examine changes in holdings for annual and quarterly periods relative to first-time IFRS reporting
events. Our tests include both firm-level as well as country-quarter analysis similar to the country-
month analysis of Daske et al. (2008).2
In the second set of tests, we use investor type and investor style as instruments reflecting
investor demand for, and use of, financial reporting information. Investor type is defined as active
or passive. Active investors often use firm-specific information, including financial reporting
1 We note, however, that Francis et al. (2009) provide evidence suggesting that an improved informationenvironment enhances asset allocation, irrespective of a country’s legal regime and enforcement mechanisms.Also, in a related study Daske et al. (2011) document that ‘‘serious’’ mandatory IFRS adopters experience higherliquidity and lower cost of capital compared to ‘‘label’’ adopters, providing evidence on the firm-levelheterogeneity in the capital market effects of IFRS adoption.
2 We conduct country-quarter analysis rather than country-month analysis because our institutional ownership datais published at the end of each calendar quarter.
1996 Florou and Pope
The Accounting ReviewNovember 2012

numbers and disclosures, to determine the portfolio weights of individual stocks. In contrast,
passive investors do not seek to take security-specific views and rely on decision rules that do not
depend on financial reporting information. Thus, we predict that institutional holdings changes will
be more significant for active investors than for passive investors if institutional holdings changes
are causally linked to the financial reporting regime change.
Similarly, within the subset of active investors, some investors have investment styles that are
more dependent on accounting numbers than others (Bushee and Goodman 2007). Our holdings
data allow us to identify several common stock-oriented investment styles including value, growth,
index, and income investing. Value investors seek to determine whether stock market values are
fairly priced relative to fundamental values estimated using firm-specific accounting numbers, and
take long (short) positions relative to their benchmark in under-valued (over-valued) stocks. Growth
investors seek to forecast future value-relevant outcomes that will determine future capital gains, for
example by identifying stocks with above-average earnings growth potential. Financial statements
and forward-looking disclosures are important inputs to the decision models of many such
investors. In contrast, income investors usually focus on short-term dividends and dividend yield,
while index investors invest in proportion to stock index weights. In the latter two investment
styles, financial statement information is less important in investment decisions. Therefore, we
predict that changes in institutional holdings attributable to the IFRS regime change are more likely
to be observed for value and growth investors than for income and index investors.
Our empirical tests progressively build evidence consistent with causality running from IFRS
adoption to changes in institutional holdings. First, we conduct firm-level analysis based on different
annual measurement periods relative to first-time IFRS reporting events. Then, we perform additional
firm-level analysis using quarterly changes in institutional holdings. Next, we conduct analysis at the
country-quarter level. Finally, we examine how annual changes in institutional holdings depend on
investor demand for financial reporting information, reflected in investor orientation and style.
Firm-Level Annual and Quarterly Analyses
The firm-level analyses employ a difference-in-differences design similar to Daske et al.
(2008), utilizing data on both voluntary and mandatory adopters of IFRS in countries where IFRS
are mandated (treatment sample firms) and non-IFRS adopters in other countries (benchmark
sample firms), and using versions of the following model:
DInstitutional Holdings ¼ d0 þ d1First-Time Mandatoryþ d2Voluntaryþ d3Voluntary�Mandatoryþ RcjDControlsj þ e: ð1Þ
For the annual firm-level analysis DInstitutional Holdings is the change in an institutional holdings
proxy over a year. The marginal effects of IFRS reporting on institutional holdings are captured by
three binary indicator variables First-Time Mandatory, Voluntary, and Mandatory � Voluntary,
coded based on the reporting standards used in each firm-year (Worldscope code WS07536). First-Time Mandatory refers to observations for firms that never reported under IFRS before mandatory
adoption and equals 1 for all firm-years with IFRS reporting periods ending on or after the local
mandated IFRS adoption date (i.e., December 31, 2005), and 0 otherwise. It captures the extent to
which institutional holdings of first-time mandatory adopters are different after IFRS adoption.
Voluntary relates to observations for firms that voluntarily switched to IFRS reporting before it was
mandated and equals 1 for all firm-years with IFRS reporting by voluntary adopters, and 0
otherwise. It captures the extent to which institutional holdings are different for firms that
voluntarily adopt IFRS. Voluntary �Mandatory equals 1 for all voluntary adopter firm-years ending
on or after the mandated local IFRS adoption date, and 0 otherwise. It captures the extent to which
institutional holdings of voluntary IFRS adopters are different in the mandatory IFRS period.
Mandatory IFRS Adoption and Institutional Investment Decisions 1997
The Accounting ReviewNovember 2012

Focusing on changes in institutional holdings in Equation (1) enables us to develop insights
about the timing of any changes in institutional ownership relative to firm-level IFRS adoption
events, as discussed below. The changes model also provides more powerful tests, given that a firm
serves as its own control because both current-year and prior-year levels data are required to be
included in the changes sample. This requirement helps alleviate concerns that unmodeled factors
other than IFRS adoption, including possible database selection biases, could explain differences in
the levels of institutional holdings between treatment and benchmark samples, and across time, thus
increasing confidence that documented results reflect causality running from the IFRS reporting
regime change.
Our baseline analysis of Equation (1) involves measuring changes in institutional holdings over
calendar-year intervals. In this case the IFRS indicator coefficient estimates capture the average
annual IFRS effects over the two-year period 2005–2006. Since holdings changes are measured
over identical periods for both treatment and benchmark samples, the calendar-year approach
controls effectively for unmodeled factors affecting both treatment and benchmark samples.
However, to ensure that our inferences are not sensitive to the measurement interval for holdings
changes, we also report results based on two alternative annual windows spanning firms’ fiscal
year-ends. The window labeled �2/þ2 measures holdings changes over the last two quarters of a
fiscal year and the first two quarters of the next fiscal year, while the annual window labeled�1/þ3
measures changes over the last quarter of a fiscal year and the first three quarters of the next fiscal
year. A possible advantage of examining changes over these alternative windows is that IFRS
information contained in annual financial statements becomes available to investors during the
measurement interval. However, a significant disadvantage of the alternative windows is that
heterogeneity in fiscal year-end dates within and across the treatment and benchmark samples may
lead to weaker control for unmodeled factors. Hence, our baseline calendar-year results could be
viewed as more conservative estimates of overall IFRS effects that better control for unmodeled
global factors underlying holdings changes.
Having established our baseline results using annual windows, we use versions of Equation (1)
to address the identification problem by allowing the coefficients on First-Time Mandatory and
Voluntary � Mandatory to depend on the arrival of firm-specific IFRS information within the
mandated IFRS adoption period. Specifically, we conduct firm-quarter analysis by re-estimating
Equation (1) using institutional holdings changes measured over quarterly intervals. We supplement
Equation (1) by adding indicator variables that capture incremental reporting-time effects during the
mandated IFRS period 2005–2006. Incremental holdings changes for first-time mandatory adopters
are captured by indicator variables First-Time Mandatoryq (q¼�2,�1,þ1,þ2,þ3) set equal to 1 in
quarter q and 0 in other quarters, using the convention that q¼�1 is the quarter of the fiscal year-
end and q ¼ þ1 is the quarter following the fiscal year-end.3 The coefficients on Voluntary �Mandatoryq capture incremental reporting-time holdings changes for voluntary adopters in the
mandatory IFRS period in a similar manner.
While financial reporting lags vary across countries, we believe that it is reasonable to expect
that financial statements will usually be released late in quarter þ1 or early in quarter þ2.4
Therefore, we predict incremental investor reaction to financial statement information in quarterþ2
and significantly positive coefficients of First-Time Mandatoryþ2. Delayed response to financial
statement information will be indicated if the coefficients on First-Time Mandatoryþ3 are
3 For example, for firms where the first-time IFRS fiscal period ends in December 2005, First-Time Mandatoryþ1 isset equal to 1 for the first quarter of 2006, while First-Time Mandatory�1 equals 1 in the fourth quarter of 2005.
4 DeFond et al. (2007) report considerable variation in earnings announcement dates, with the median of country-level median earnings reporting lags being 83.25 days. Annual reports containing full financial statements arelikely to follow at least several weeks later, depending on statutory reporting rules.
1998 Florou and Pope
The Accounting ReviewNovember 2012
significant. We predict that incremental holdings changes in quarter þ3 (if any) will be lower in
magnitude than those in quarter þ2. If firms report earlier and investors react to information in
annual financial statements within quarterþ1, then First-Time Mandatoryþ1 will also be positive. If
firms do not report sufficiently early in quarter þ1 for investors to react in the same quarter, then
First-Time Mandatoryþ1 will capture any anticipation effects, as will the coefficients on First-TimeMandatoryq (q ¼ �2,�1). The interpretation of the coefficients on the reporting-time indicator
variables Voluntary � Mandatoryq is similar, with Voluntary � Mandatoryþ2 being most likely to
capture investor reaction to financial statement information.
Country-Quarter Analysis
We also conduct country-level analysis relating aggregate changes in institutional holdings to
changes in an index tracking the actual rate of reporting under IFRS in each country. The research
design follows closely the country-month analysis of Daske et al. (2008). We estimate the following
regression pooled over countries and quarters:
DInstitutional Holdings ¼ d0 þ d1DIFRS Adoption Rateþ RcjControlsj þ l: ð2Þ
In Equation (2) DInstitutional Holdings is the change in the median institutional holdings in a
country-quarter and DIFRS Adoption Rate is the change in an index of cumulative IFRS adoption
within a country based on the publication of mandatory IFRS financial statements and measured in
two ways described below. Consistent with the firm-quarter analysis, we predict that DIFRSAdoption Rate will be associated with changes in institutional holdings with a one-quarter lag,
reflecting the time taken for institutional investors to process information and rebalance portfolios.
We construct the IFRS adoption rate index for a country in two ways. First, we define IFRS
adoption with reference only to the reporting of first-time IFRS annual financial statements. In this
case and in line with the firm-quarter analysis, we assume that financial statement publication
occurs in the quarter following the fiscal year-end. We assign a firm-level adoption counter a value
of 1 starting in the quarter following the first-time IFRS fiscal year-end. In each calendar-quarter
IFRS Adoption Rate is the average value of the firm-level adoption counter for the set of mandatory
adopters in the country. The index has a maximum value of 1 in the quarter when the final firm in a
country reports under IFRS for the first time. Similar to Daske et al. (2008), we label the index
based on annual financial reporting as IFRS Adoption RateFYE.
If IFRS information arrives as a result of quarterly or interim announcements during the IFRS
adoption year, then IFRS Adoption RateFYE may understate the true rate of cumulative IFRS
information arrival in the first-time adoption year and overstate the true rate in the following year.
To address this possibility we also construct the IFRS Adoption Rate index with reference to
quarterly, interim, and annual earnings announcement dates (Worldscope item WS05905),
assuming that quarterly or interim financial reporting is under IFRS in the mandatory adoption year.
Under this definition of the IFRS Adoption Rate index, in the quarter of an announcement we
increase the firm-level adoption counter value by 1/n, where n equals 4, 2, or 1 for quarterly, semi-
annual interim, and annual announcements, respectively.5 In each calendar-quarter IFRS AdoptionRate is the average value of the firm-level adoption counter for the set of mandatory adopters in the
country. The index has a maximum value of 2 in the quarter when the final firm in a country reports
annual financial statements under IFRS for the first time, having previously reported quarterly or
5 In some countries firms vary in the frequency of reporting. For example, some U.K. firms voluntarily reportquarterly while being required to report semi-annual interim financial statements. Therefore, we define the firm-level reporting frequency for a given year (n) by counting the actual number of announcements reported by eachfirm in the year.
Mandatory IFRS Adoption and Institutional Investment Decisions 1999
The Accounting ReviewNovember 2012

interim statements. Similar to Daske et al. (2008), we label this variable IFRS AdoptionRATEINTERIM.
The Role of Institutions
We analyze the institutional context of IFRS financial reporting effects using a new approach.
Our approach is similar to Daske et al. (2008) and Li (2010) in that we model IFRS effects
conditional on proxies for the likelihood of high-quality enforcement and application of IFRS, and
measures of accounting difference between local GAAP and IFRS. Our approach is different
because we estimate the impact of complementary institutional features in a single model; we also
use measures of accounting difference capturing the changes in accounting that can be expected
when moving from an issuer’s local GAAP to IFRS.
Collinearity between institutional proxies may arise because different institutions in a country
do not develop independently and they can complement one another. This perspective predicts that
institutional ‘‘bundles’’ will emerge (Wysocki 2011). This is confirmed by Leuz et al. (2003) and
Leuz (2010) who apply cluster analysis to institutional proxies that capture the strength of securities
regulation, legal enforcement, investor protection, disclosure, and transparency of reporting
practices. We classify countries into three clusters defined in Leuz (2010) and characterized as
outsider economies with strong outsider protection and legal enforcement (Cluster 1); insider
economies with stronger rule enforcement (Cluster 2); and insider economies with weaker rule
enforcement (Cluster 3).6 We then allow the IFRS effects captured by First-Time Mandatory,
Voluntary, and Voluntary � Mandatory to vary across clusters. We predict that IFRS-related
holdings changes for first-time mandatory adopters are likely to be more pronounced in the cases of
Clusters 1 and 2 because reporting incentives and enforcement are predicted to lead to higher
quality reporting.
We consider whether IFRS-related changes in institutional holdings depend on the extent of
accounting change involved in moving from local GAAP to IFRS reporting. We do not model the
dependence of institutional holdings on country-pair differences between an investor’s home
country GAAP and an issuer’s home country GAAP (Yu 2010). Rather we examine how the
differences between local GAAP and IFRS influence changes in institutional holdings generally.
Holding reporting incentives and enforcement constant, the mandatory switch to IFRS in countries
with large differences between domestic accounting standards and IFRS should result in larger
improvements in financial reporting quality and in comparability, to the benefit of all institutional
investors irrespective of their location.
We estimate accounting differences using the two distinct measures proposed by Ding et al.
(2005, 2007), who analyze a comprehensive set of 111 accounting items reported in the GAAP2001 survey of national accounting rules conducted by seven large auditing firms. Absence captures
missing local GAAP financial reporting rules relative to IFRS. Divergence captures inconsistencies
between local GAAP and IFRS treatments. Ding et al. (2007) show that these two dimensions are
uncorrelated and argue that they cannot be considered as substitutes or complements. Absenceimplies an accounting issue is not important enough in a specific jurisdiction and/or is beyond the
standard-setter’s competence, while Divergence means the issue is important in the country and the
standard-setter is competent and confident enough to adopt a non-IAS approach (Ding et al. 2009,
160).7 We believe that the Ding et al. (2005, 2007) measures are appropriate in our research setting
for four main reasons. First, our focus is on the IFRS-related ownership effects across institutional
6 Consistent with institutions being associated with financial reporting quality, Leuz (2010) reports higherdisclosure and more informative earnings in Cluster 1 relative to Cluster 2, and in Cluster 2 relative to Cluster 3.
7 Divergence may also indicate that the national GAAP covered a particular issue before it was covered by IAS.
2000 Florou and Pope
The Accounting ReviewNovember 2012

investors irrespective of their location. The Absence and Divergence measures capture the potential
accounting changes that can benefit investors generally. Second, the Ding et al. (2005, 2007)
measures are based on a comprehensive list of potential discrepancies. Third, the distinction
between absence and divergence could be important.8 Fourth, empirical evidence in Garcia Osma
and Pope (2011) indicates that Divergence explains country-level adjustments to local GAAP
numbers on first-time IFRS adoption, whereas alternative measures of accounting difference do not
or they have the wrong sign.
We predict that IFRS-related changes in institutional holdings for first-time mandatory adopters
will be positively related to Divergence and Absence if differences between alternative accounting
regimes are important to investors. To implement these measures in empirical tests we generate
binary indicators from the Divergence and Absence continuous variables using the medians across
IFRS adoption countries as the classification cut-off.
Empirical Proxies
Institutional Holdings
In contrast to previous and concurrent research that focuses on the ownership of mutual funds
(Covrig et al. 2007; Yu 2010; DeFond et al. 2011), this is the first study to examine the links
between IFRS reporting and global institutional ownership including investors other than mutual
funds. Our institutional holdings data are drawn from the Thomson Financial Ownership (TFO)
quarterly data feed and include domestic and foreign holdings of mutual funds, pension funds,
insurance companies, hedge funds, private equity funds, and venture capital funds from 45
countries.9 An advantage of our data is that the data capture a much higher proportion of total
institutional ownership. For example, we document average ownership of almost 22 percent, in
contrast to Covrig et al. (2007), Yu (2010), and DeFond et al. (2011) who report a mean value of
mutual fund ownership between 2 percent and 10 percent. Under the assumption that decisions by
non-mutual fund institutional owners reflect informed investor opinion, the expanded scope of
8 Based on the same data source, Bae et al. (2008) propose two measures (gaapdif1 and gaapdif2) of differences inaccounting standards at the country-pair level. Moreover, these measures are a blend of absence of local GAAPrules and divergence between local GAAP and IAS and they are not intended to provide a comprehensivecatalogue of country-level differences from IAS. Bae et al. (2008) construct country scores based on differencesrelating to 21 (gaapdiff1) or 52 (gaapdiff2) ‘‘key’’ accounting items, selected because they appear in the pastresearch literature (gaapdiff1) and because they appear frequently in the survey. The focus on country-pairsrestricts the set of accounting rules considered because countries that differ from IFRS are also required to havesimilar GAAP. As a consequence, relative to Absence and Divergence, the Bae et al. (2008) measures areexpected to be noisy measures of the distance between local GAAP and IAS for two reasons. First, they excludesome important sources of differences. For example, gaapdiff1excludes 12 standards in IAS, 11 of which affectrecognition and measurement, including IAS 39 (Financial Instruments), where Divergence is often high andaccounts for 6 out of the 111 items considered by Ding et al. (2005, 2007). Second, gaapdiff1 also covers twostandards (IAS 1, Presentation of Financial Statements, and IAS 24, Related Party Disclosures) where there is ahigh degree of local GAAP conformity with IAS (81 percent and 73 percent, respectively). The gaapdiff1measure with respect to these two items captures Absence only. We thank an anonymous reviewer for helpfulcomments on the relative merits of the alternative measures of accounting difference.
9 Thomson Reuters state that the database includes holdings on more than 44,000 global equity issues. The sourceof the data depends on the region. Specifically, in the case of Europe, Middle East, Africa, South/CentralAmerica, and Asia, information on equity holdings is processed primarily from Shareholder, Trade, and MutualFund Portfolio Reports, which gather data from annual and interim reports, stock exchanges, regulatory bodies,investor relations departments, and third-party vendors. In the case of U.K. and Ireland holdings, data above a0.015 percent threshold is sourced from inspection of firms’ registers of shareholders. In the case of the U.S.,security information is gathered from SEC 13D, 13G, 10K, 20F, and 13F filings and from mutual fund andpension fund portfolio reports.
Mandatory IFRS Adoption and Institutional Investment Decisions 2001
The Accounting ReviewNovember 2012

our institutional investor universe enhances the power of our tests to detect IFRS-related
effects.10
To obtain our holdings proxies we employ the following procedures. First, we retrieve
disaggregated holdings data on the number and value of institutional shares from the Historical
Holdings Files for each quarter in the period 2003–2007. Second, using the Historical Security File
we identify all types of common and registered equity securities owned by institutional investors for
each firm. ADR holdings are converted to the equivalent number of shares of the underlying equity
class by multiplying ADR holdings by the ADR-underlying conversion ratio. From this file we also
collect data on various items including share price, outstanding shares, and security identifiers.
Finally, we retrieve data on investor orientation (active or passive) and investor style (value,
growth, income, and index) from the Historical Owner File.
In line with prior studies of institutional ownership we consider the aggregate percentage
ownership of institutional shareholders (Covrig et al. 2007; DeFond et al. 2011) and the total
number of institutional investors (O’Brien and Bhushan 1990; Walther 1997; Bradshaw et al.
2004). Percentage ownership is calculated as the total market value of shares owned by institutional
investors (or investors having particular orientations or style) divided by the total market value of
the firm at the end of a quarter. The number of institutional investors is the count of investors with
recorded holdings at the end of a quarter.
Control Variables
Following prior literature (Leuz et al. 2010; DeFond et al. 2011), we include control variables
documented to be associated with institutional holdings: Nanalysts (the number of analysts at the
fiscal year-end from I/B/E/S) to proxy for richness of the information environment; Market Index
(Worldscope item WS05661), a dummy variable that equals 1 if the firm is included in any national
stock market index and MSCI Index, a binary variable set equal to 1 if the firm is included in the
MSCI World Index, to control for the firm’s visibility to investors;11 ADR (WS11496), a dummy
that takes the value of 1 if the firm has an ADR listed on a U.S. exchange, to proxy for the degree of
visibility and information environment richness of non-U.S. firms; Big4 (WS07800), a
dichotomous variable equal to 1 if the firm is audited by a Big 4 firm or their predecessors, to
control for investor preferences for auditors with a strong reputation; Size (WS07210), defined as
the natural logarithm of market value of equity in U.S. dollars at year-end, to proxy for liquidity,
information environment, and fiduciary concerns; ROE, measured as net income before
extraordinary items (WS01551) divided by total assets at the beginning of the year (WS02999),
to control for accounting performance; RET, calculated as log of (RItþ1/RIt), where RI is the
DataStream Total Return Index on first January, to capture the effect of stock market performance
over the fiscal year; RetVar, measured as the standard deviation of monthly stock returns over the
fiscal year, to control for firm risk.
In addition, we include in our set of controls a number of proxies for firm fundamentals that are
potentially related to institutional holdings, namely Dividend Yield, computed as total dividends
10 Further, mutual fund investment decisions are partially driven by (retail) customer funds flows and, therefore,mutual fund ownership changes reflect effects related to private investor sentiment and liquidity needs. Incontrast, many of the non-mutual fund investors in our database are longer-term investors, e.g., pension fundsand insurance companies, whose investment decisions are less susceptible to swings in private investor sentimentand liquidity.
11 Market Index is available as a Worldscope data item, but is time-invariant and available for the most recent yearof our study, i.e., 2006. MSCI Index is available on a time-varying basis. We thank Old Mutual AssetManagement for providing these data.
2002 Florou and Pope
The Accounting ReviewNovember 2012

(WS05376) divided by market value of equity at year-end (WS08001); Book-Market, defined as
book value of equity (WS03501) divided by market value of equity at year-end (WS08001);
Earnings-Price, calculated as net income (WS01551) divided by market value of equity at year-end
(WS08001); and Leverage, defined as total liabilities (WS03351) divided by total assets at year-end
(WS02999). Following Daske et al. (2008), we also include US GAAP (WS07536), a dummy
variable equal to 1 if a non-U.S. firm prepares its financial statements according to U.S. financial
reporting rules, and Market Benchmark, calculated as the yearly mean of the dependent variable
from all observations in the benchmark sample. The latter variable is used to help us disentangle the
IFRS effects from effects due to changes in the general economic conditions or changes in
institutional holdings unrelated to IFRS reporting. All continuous variables are winsorized at the
extreme 1 percentiles.
To perform the firm-quarter analysis, we incorporate in Equation (1) only those control
variables that can be measured at the end of a quarter, i.e., Size, Ret, RetVar, and Market
Benchmark. In the country-quarter analysis based on Equation (2) we include the natural logarithm
of Market Value (WS08001), measured as stock price times the number of shares outstanding (in
U.S. dollars) at the end of quarter q�3; Return Variability, defined as the standard deviation of the
previous 12 monthly stock returns measured at time q�3; Market Benchmark, defined as the mean
dependent value from all observations in the benchmark sample; and the level and the change in the
dependent variables measured at time q�3.
Sample and Descriptive Statistics
We include all listed firms in the Worldscope database in the period 2003–2006 with
complete data for the independent variables and for which ownership data are available in the
TFO database.12 For firms that adopt IFRS for fiscal years ending December 2005, this sample
period allows us to compare changes in institutional holdings in the year prior to mandatory
IFRS adoption, the transition year, and the year after first-time adoption. Applying these criteria
yields a sample of 35,160 firm-years for 10,852 unique firms and 45 countries. Table 1 describes
the sample composition across years and countries. Panel A indicates that 9.61 percent (4.92
percent) of firm-years in the overall sample are mandatory (voluntary) IFRS adopters.
Mandatory IFRS reporters represent 14.15 percent (21.93 percent) of sample observations for
fiscal years ending in 2005 (2006), indicating that a substantial number of firms adopt IFRS for
the first time for fiscal years ending in 2006 rather than 2005. Panel B of Table 1 shows the
country composition of the IFRS treatment sample, which includes 11,926 observations from
3,865 firms and 24 countries, and the benchmark sample, which comprises 23,234 firm-year
observations from 6,987 firms and 21 countries.13 As in prior studies adopting a similar
sampling frame, the U.S. accounts for approximately 43 percent of benchmark sample
observations. We test whether our main results are sensitive to the weight of the U.S. in the
benchmark sample in robustness checks.
Table 2 describes the institutional holdings variables. Panel A reveals that over the full
12 We constrain the sample to end in 2006 because extending the sample period beyond 2006 would increase therisk that any observed changes in institutional holdings in treatment firms relative to benchmark firms are due tofactors other than IFRS adoption.
13 The apparent discrepancy between the 3,380 total IFRS mandatory adopters reported in Panel A and the 3,865total treatment firms reported in Panel B is due to some treatment countries not requiring IFRS reporting by alllisted companies, e.g., because, the firms do not report consolidated financial statements. Singapore is excludedfrom our sample because it mandated adoption of IFRS in 2003, in contrast to all other countries in our treatmentsample where the adoption date was 2005.
Mandatory IFRS Adoption and Institutional Investment Decisions 2003
The Accounting ReviewNovember 2012

TABLE 1
IFRS Adoption by Year and Sample Composition by Country
Panel A: IFRS Adoption for Full Sample by Year
Year Total Firm-Years
First-Time Mandatory Adopters Voluntary Adopters
Firm-Years Percent Firm-Years Percent
2003 8,385 0 0.00 458 5.46
2004 8,364 0 0.00 468 5.60
2005 8,450 1,196 14.15 399 4.72
2006 9,961 2,184 21.93 406 4.08
Total 35,160 3,380 9.61 1,731 4.92
Panel B: Sample Composition by Country
Treatment Firms Firm-Years Benchmark Firms Firm-Years
Australia 482 1,271 Argentina 36 121
Austria 42 138 Bermuda 10 26
Belgium 63 226 Brazil 76 240
Czech Republic 9 26 Canada 459 1,530
Denmark 99 300 Chile 72 145
Finland 90 304 China 33 95
France 395 1,377 Colombia 10 22
Germany 282 953 Egypt 15 40
Greece 94 262 India 64 175
Hong Kong 529 1,451 Indonesia 95 261
Hungary 19 61 Israel 62 197
Ireland 41 143 Japan 2,097 6,838
Italy 160 546 Korea (South) 246 602
Luxemburg 14 53 Malaysia 372 1,018
The Netherlands 95 316 Mexico 50 142
Norway 72 235 New Zealand 27 72
Philippines 66 163 Russia 12 34
Poland 72 215 Taiwan 418 1,141
Portugal 27 101 Thailand 133 357
South Africa 113 405 Turkey 41 77
Spain 96 342 United States 2,659 10,101
Sweden 112 238
Switzerland 150 376
U.K. 743 2,424
Total 3,865 11,926 Total 6,987 23,234
The complete sample consists of a maximum 35,160 firm-year observations from 45 countries during the period 2003–2006 with sufficient institutional holdings data from TFO and financial data from Worldscope to perform the regressionanalysis. We exclude countries with less than 20 firm-year observations.Panel A reports descriptive information for the following indicators: (1) First-Time Mandatory that refers to observationsof firms that never reported under IFRS before mandatory adoption and equals 1 for all firm-years with IFRS reportingperiods ending on or after the local mandated IFRS adoption date (i.e., December 31, 2005), and 0 otherwise; and (2)Voluntary that relates to observations of firms that voluntarily switched to IFRS reporting before it was mandated andequals 1 for all firm-years with IFRS reporting by voluntary adopters, and 0 otherwise.Panel B reports the number of firms and firm-years for: (1) the treatment sample, i.e., countries that mandated IFRSreporting and (2) the benchmark sample, i.e., countries that do not allow or do not require IFRS reporting.
2004 Florou and Pope
The Accounting ReviewNovember 2012

sample mean (median) institutional ownership is 21.69 percent (6.93 percent) of issued equity
and the mean (median) number of institutional shareholders is 74.88 (18.00). The changes in
both institutional holdings proxies are, on average, positive over the sample period. Panels B and
C provide insights to the importance of different investor types in our data. Most firms have
active institutional investors—on average there are 63.72 active investors owning 18.62 percent
of equity. In contrast, passive investors have lower overall equity stakes than active investors
and are fewer in number—on average 11.16 passive investors own equity stakes totaling 3.22
percent of equity. Analysis of investment styles reveals that growth and value investors hold
stakes in a large proportion of sample firm-years and holdings are economically significant. For
example, value investors hold mean equity stakes of 5.94 percent.
TABLE 2
Descriptive Statistics for Institutional Holdings
Panel A: Full Sample
Variable Obs. Mean Median Std. Dev.
Percentage Ownership 33,131 21.69 6.93 0.291
DPercentage Ownership 21,726 2.67 0.87 0.079
Number of Investors 34,330 74.88 18.00 150.100
DNumber of Investors 22,826 10.38 3.00 28.130
Panel B: Percentage Ownership for Full Sample by Investor Type
Investor Type Obs. Mean Median Std. Dev.
Active 33,131 18.62 6.63 0.245
Passive 33,131 3.22 0.00 0.062
Growth 33,131 5.40 1.75 0.083
Value 33,131 5.94 1.22 0.095
Income 33,131 0.55 0.00 0.019
Index 33,131 2.67 0.00 0.052
Panel C: Number of Investors for Full Sample by Investor Type
Investor Obs. Mean Median Std. Dev.
Active 34,330 63.72 16.00 133.47
Passive 34,330 11.16 1.00 19.77
Growth 34,330 23.35 7.00 49.32
Value 34,330 18.30 4.00 39.44
Income 34,330 2.38 0.00 7.67
Index 34,330 6.53 0.00 11.03
The complete sample consists of a maximum 35,160 firm-year observations from 45 countries during the period 2003–2006 with sufficient institutional holdings data from TFO and financial data from Worldscope to perform the regressionanalysis. Percentage Ownership is defined as the total market value of shares owned by institutions divided by the totalmarket value of the firm at year-end, where both items are measured in U.S. dollars. Number of Investors refers to thetotal number of institutional investors of the firm at year-end. D denotes changes in variables computed over year t�1 to t.Additional descriptive information is provided conditioning on: (1) Investment Orientation, i.e., active versus passiveinvestors and (2) Investment Style, i.e., value/growth versus index/income investors.
Mandatory IFRS Adoption and Institutional Investment Decisions 2005
The Accounting ReviewNovember 2012

Table 3 describes the control variables used in our regression tests and Table 4 shows the
correlations between the independent variables. Descriptive statistics are pooled over the full
sample. The data do not suggest any unusual behavior.14
IV. EMPIRICAL RESULTS
In this section we discuss our empirical findings. First, we report univariate difference-
in-differences results, followed by baseline regression results capturing the average effects of
TABLE 3
Descriptive Statistics of Independent Variables
Variable (n = 35,160) Mean Median Std. Dev.
Size 5.99 5.86 1.853
ROE (%) 6.34 9.68 0.414
RET (%) 19.38 18.29 0.429
RetVar 0.102 0.086 0.062
Leverage 0.521 0.515 0.262
Dividend Yield 0.016 0.009 0.022
Book-Market 0.669 0.539 0.608
Earnings-Price 0.004 0.047 0.219
Nanalysts 4.426 2.000 6.064
Big4 0.855 1.000 0.351
MSCI Index 0.103 0.000 0.304
Market Index 0.527 1.000 4.999
ADR 0.067 0.000 0.251
US GAAP 0.018 0.000 0.133
The complete sample consists of a maximum 35,160 firm-year observations from 45 countries during the period 2003–2006 with sufficient institutional holdings data from TFO and financial data from Worldscope to perform the regressionanalysis.All financial variables are winsorized at the 1st and 99th percentiles.
Variable Definitions:Size¼ the natural logarithm of market value of equity in U.S. dollars;ROE ¼ net income before extraordinary items divided by total assets at the beginning of the year;RET ¼ log of (RItþ1/RIt), where RI stands for Return Index on January 1st;RetVar ¼ standard deviation of monthly stock returns over the fiscal year;Leverage ¼ total liabilities divided by total assets;Dividend Yield ¼ total dividends divided by market value of equity;Book-Market ¼ book value of equity divided by market value of equity;Earnings-Price ¼ net income divided by market value of equity;Nanalysts ¼ number of analysts;Big4 ¼ dichotomous variable equal to 1 if the firm is audited by a Big 4 auditing firm or their predecessors, and 0
otherwise;MSCI Index ¼ binary variable equals 1 if the firm is included in the MSCI World Index, and 0 otherwise;Market Index ¼ dummy variable equals 1 if the firm is part of any stock market index, and 0 otherwise;ADR ¼ dummy that takes the value of 1 if the firm has an ADR listed on a U.S. exchange, and 0 otherwise; andUS GAAP¼dummy variable equal to 1 if a non-U.S. firm prepares its financial statements according to the U.S. financial
reporting rules, and 0 otherwise.
14 Untabulated findings document low correlations among the institutional factors employed in our cross-sectionanalysis, Absence, Divergence, and Cluster 1 and Cluster 2 indicators.
2006 Florou and Pope
The Accounting ReviewNovember 2012

IFRS adoption on holdings changes measured over different annual windows. Second, we
provide further analysis showing that changes in institutional holdings are concentrated in the first
quarter after first-time mandatory IFRS reporting. Third, we present results of the country-quarter
analysis. Fourth, we report additional findings on the IFRS-related ownership effects across
different types of investors. Fifth, we discuss results on the dependence between IFRS-related
holdings changes and country-level institutional factors capturing reporting incentives,
compliance, and accounting differences. Finally, we describe a series of additional tests and
robustness checks.
TABLE 4
Correlations between Independent Variables
Panel A: Correlations of Variables First-Time Mandatory to Book-Market
First-TimeMandatory Voluntary RET ROE Leverage
DividendYield
Book-Market
Voluntary �0.074
RET 0.034 0.013
ROE 0.045 �0.001 0.135
Leverage 0.051 0.045 �0.009 �0.001
Dividend Yield 0.063 0.002 �0.028 0.147 0.023
Book-Market �0.070 �0.008 �0.053 �0.019 �0.190 0.139
Price-Earnings 0.028 �0.004 0.220 0.394 �0.152 0.177 0.084
Size 0.013 0.047 0.144 0.216 0.130 0.063 �0.246
RetVar �0.069 �0.053 0.104 �0.237 �0.042 �0.270 �0.106
Nanalysts 0.034 0.077 �0.005 0.120 0.065 0.002 �0.227
Market Index �0.005 �0.000 0.032 0.107 0.109 0.070 �0.017
Big5 �0.068 0.010 0.011 0.035 0.039 0.046 �0.057
ADR 0.061 0.065 0.021 0.024 0.036 0.064 �0.026
MSCI Index 0.041 0.033 �0.000 0.058 0.071 0.018 �0.090
US GAAP �0.044 �0.013 �0.002 �0.008 �0.024 �0.029 �0.017
Panel B: Correlations of Variables Price-Earnings to MSCI Index
Price-Earnings Size RetVar Nanalysts
MarketIndex Big5 ADR
MSCIIndex
Size 0.270
RetVar �0.351 �0.354
Nanalysts 0.101 0.701 �0.197
Market Index 0.125 0.532 �0.230 0.359
Big5 0.060 0.264 �0.080 0.179 0.139
ADR 0.018 0.251 �0.051 0.245 0.132 0.068
MSCI Index 0.049 0.413 �0.146 0.403 0.252 0.065 0.166
US GAAP �0.021 0.074 0.025 0.099 �0.009 0.029 0.195 0.067
The complete sample consists of a maximum 35,160 firm-year observations from 45 countries during the period 2003–2006 with sufficient institutional holdings data from TFO and financial data from Worldscope to perform the regressionanalysis.Pearson’s correlation coefficients between independent variables are reported. All financial variables are winsorized atthe 1st and 99th percentiles. For variable definitions see Tables 1 and 3.
Mandatory IFRS Adoption and Institutional Investment Decisions 2007
The Accounting ReviewNovember 2012

Difference-in-Differences Analysis
Table 5 presents difference-in-differences analyses showing the contrast between institutional
holdings changes for the treatment and benchmark samples over the pre-IFRS period (2004), the
IFRS adoption year (2005) and the post-IFRS period (2006). We report results for changes in our
two institutional holdings proxies, Percentage Ownership and Number of Investors.
The differences between treatment sample and benchmark sample holdings changes in the
bottom row of each panel indicate that changes in institutional holdings are significantly higher in
the benchmark sample in the pre-IFRS year and the transition year for both holdings proxies. In
contrast, institutional holdings changes in the post-IFRS year are significantly higher in the
treatment sample. Both panels reveal that institutional holdings grow over the sample period for
TABLE 5
Difference-in-Differences Analyses of Ownership
Panel A: Difference-in-Differences Analysis for DPercentage Ownership
SamplePre-IFRS
(a)
TransitionPeriod
(b)Post-IFRS
(c) (b) � (a) (c) � (a)
Benchmark (i ) 2.14 2.20 3.95 0.06 1.81
(n ¼ 4,614) (n ¼ 4,759) (n ¼ 5,050) (0.699) (0.000)
Treatment (ii ) 0.27 0.30 6.31 0.03 6.04
(n ¼ 2,358) (n ¼ 2,339) (n ¼ 2,606) (0.845) (0.000)
(ii ) � (i ) �1.87 �1.90 2.36 �0.03 4.23
(0.000) (0.000) (0.000) (0.647) (0.000)
Panel B: Difference-in-Differences Analysis for DNumber of Investors
SamplePre-IFRS
(a)
TransitionPeriod
(b)Post-IFRS
(c) (b) � (a) (c) � (a)
Benchmark (i ) 7.21 7.17 18.53 �0.04 11.32
(n ¼ 5,017) (n ¼ 5,043) (n ¼ 5,294) (0.936) (0.000)
Treatment (ii ) 0.64 1.81 23.10 1.17 22.46
(n ¼ 2,459) (n ¼ 2,393) (n ¼ 2,620) (0.001) (0.000)
(ii ) � (i ) �6.57 �5.36 4.57 1.21 11.14
(0.000) (0.000) (0.000) (0.038) (0.000)
The complete sample consists of a maximum 35,160 firm-year observations from 45 countries during the period 2003–2006 with sufficient institutional holdings data from TFO and financial data from Worldscope to perform the regressionanalysis.Panels A and B report results from difference-in-differences analysis of the IFRS-related ownership effects; p-values inparentheses.Percentage Ownership is defined as the total market value of shares owned by institutions divided by the total marketvalue of the firm at year-end, where both items are measured in U.S. dollars. Number of Investors refers to the totalnumber of institutional investors of the firm at year-end. D denotes changes in variables computed over year t�1 to t. Thetreatment sample consists of countries that mandated IFRS reporting and the benchmark sample includes countries thatdo not allow or do not require IFRS reporting. The pre-IFRS period refers to changes in 2004, while the transition periodand the post-IFRS period relate to changes over 2005 and 2006, respectively.
2008 Florou and Pope
The Accounting ReviewNovember 2012
both the treatment and the benchmark samples. Mean changes in percentage ownership and
number of investors are uniformly positive for all sample periods. However, the final two
columns indicate that differences in percentage ownership changes are significant only in the
post-IFRS period. Results for the change in the number of investors indicate relatively large
increases in the post-IFRS period and a small increase in the IFRS implementation year relative to
the pre-IFRS year. The observation that benchmark sample holdings also increase in the post-
IFRS period emphasizes the importance of controlling for common global factors underpinning
institutional holdings changes.
The difference-in-differences results at the bottom right-hand side of each panel indicate that
treatment sample firms have statistically and economically significantly higher holdings changes in
the post-IFRS period compared to benchmark sample firms. These results provide the first evidence
that mandatory IFRS reporting has a positive impact on institutional holdings. We now examine
whether coincident changes in other determinants of institutional holdings can explain the IFRS
reporting effects.
Baseline Findings
Table 6 presents the results of estimating Equation (1) for the full sample. These and
subsequent regression results are estimated with industry-year fixed effects captured by indicator
variables using the industry classifications in Campbell (1996), country dummy variables based on
Worldscope nation code (WS06027), and White standard errors adjusted to account for correlation
within firm clusters (Rogers 1994; Petersen 2009).
In Table 6, Panel A the changes in institutional holdings proxies are measured over calendar-
year intervals, where the mandatory IFRS period is defined as 2005 and 2006. Hence, the estimated
coefficients on First-Time Mandatory and Voluntary � Mandatory capture average effects over the
two-year period. Empirical findings indicate that there is an increase in average institutional
ownership of 2.2 percent per annum for first-time mandatory IFRS adopters, after controlling for
global changes affecting benchmark sample firms and changes in other firm-level determinants of
institutional ownership. Similarly, the number of investors in mandatory IFRS adopters increases by
nearly five relative to benchmark firms in the IFRS adoption period. The positive coefficient on
Voluntary � Mandatory suggests that voluntary adopters also experience an increase in institutional
holdings at the time of mandated adoption. This result is in line with Yu (2010) and with the
liquidity effects for voluntary adopters at the time of mandated adoption reported by Daske et al.
(2008). A possible explanation is that voluntary adopters also benefit from increased comparability
when IFRS is mandated (Daske et al. 2008; DeFond et al. 2011).
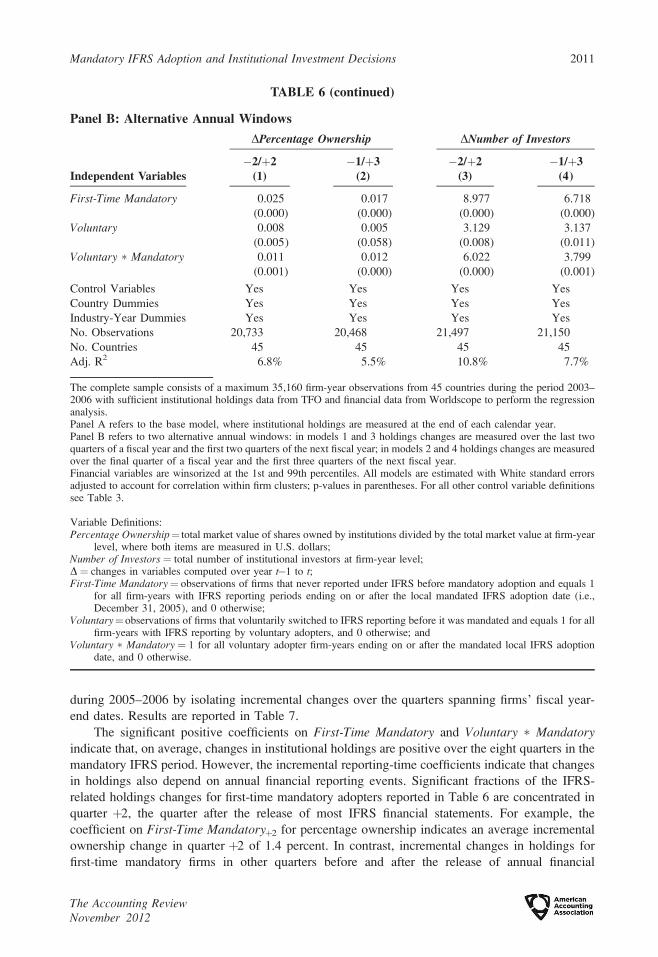
In Table 6, Panel B the changes in institutional holdings are measured over different annual
intervals ordered relative to the fiscal year-end of each firm. Results for both alternative windows
�2/þ2 and �1/þ3 are consistent with those in Panel A, indicating statistically and economically
significant ownership effects for first-time mandatory IFRS adopters. First-Time Mandatory and
Voluntary � Mandatory coefficient estimates for both holdings proxies are higher for the �2/þ2
interval than for the calendar-year intervals. However, the R2 statistics are considerably lower for
both alternative windows, suggesting that this research design does not control as effectively for
unmodeled factors.
Firm-Quarter Analysis
The results in Table 6 capture the average institutional holdings effects associated with IFRS
reporting measured over annual intervals. To alleviate concerns that these results could reflect
factors other than IFRS reporting, we now examine the timing of institutional ownership changes
Mandatory IFRS Adoption and Institutional Investment Decisions 2009
The Accounting ReviewNovember 2012

TABLE 6
Changes in Institutional Holdings and IFRS Mandatory AdoptionFirm-Annual Analysis
Panel A: Base Model
Independent Variables
DPercentageOwnership
(1)
DNumber ofInvestors
(2)
First-Time Mandatory 0.022 4.938
(0.000) (0.000)
Voluntary 0.008 1.970
(0.002) (0.091)
Voluntary � Mandatory 0.006 4.027
(0.034) (0.003)
DSize 0.046 18.38
(0.000) (0.000)
DROE �0.002 0.134
(0.162) (0.718)
DRET �0.013 �3.929
(0.000) (0.000)
DRetVar �0.051 �0.087
(0.000) (0.976)
DLeverage �0.013 �6.636
(0.079) (0.000)
DDividend Yield �0.039 0.658
(0.224) (0.934)
DBook-Market 0.006 1.753
(0.001) (0.000)
DEarnings-Price 0.000 �3.352
(0.925) (0.000)
DNanalysts 0.002 1.623
(0.000) (0.000)
DBig4 �0.042 5.112
(0.000) (0.000)
DMSCI Index �0.008 0.304
(0.000) (0.683)
DUS GAAP 0.004 2.094
(0.450) (0.475)
DMarket Benchmark 2.327 1.760
(0.000) (0.000)
Intercept �0.088 �31.22
(0.000) (0.000)
Country Dummies Yes Yes
Industry-Year Dummies Yes Yes
No. Observations 21,726 22,826
No. Countries 45 45
Adj. R2 12.5% 18.5%
(continued on next page)
2010 Florou and Pope
The Accounting ReviewNovember 2012
during 2005–2006 by isolating incremental changes over the quarters spanning firms’ fiscal year-
end dates. Results are reported in Table 7.
The significant positive coefficients on First-Time Mandatory and Voluntary � Mandatoryindicate that, on average, changes in institutional holdings are positive over the eight quarters in the
mandatory IFRS period. However, the incremental reporting-time coefficients indicate that changes
in holdings also depend on annual financial reporting events. Significant fractions of the IFRS-
related holdings changes for first-time mandatory adopters reported in Table 6 are concentrated in
quarter þ2, the quarter after the release of most IFRS financial statements. For example, the
coefficient on First-Time Mandatoryþ2 for percentage ownership indicates an average incremental
ownership change in quarter þ2 of 1.4 percent. In contrast, incremental changes in holdings for
first-time mandatory firms in other quarters before and after the release of annual financial
TABLE 6 (continued)
Panel B: Alternative Annual Windows
Independent Variables
DPercentage Ownership DNumber of Investors
�2/þ2(1)
�1/þ3(2)
�2/þ2(3)
�1/þ3(4)
First-Time Mandatory 0.025 0.017 8.977 6.718
(0.000) (0.000) (0.000) (0.000)
Voluntary 0.008 0.005 3.129 3.137
(0.005) (0.058) (0.008) (0.011)
Voluntary � Mandatory 0.011 0.012 6.022 3.799
(0.001) (0.000) (0.000) (0.001)
Control Variables Yes Yes Yes Yes
Country Dummies Yes Yes Yes Yes
Industry-Year Dummies Yes Yes Yes Yes
No. Observations 20,733 20,468 21,497 21,150
No. Countries 45 45 45 45
Adj. R2 6.8% 5.5% 10.8% 7.7%
The complete sample consists of a maximum 35,160 firm-year observations from 45 countries during the period 2003–2006 with sufficient institutional holdings data from TFO and financial data from Worldscope to perform the regressionanalysis.Panel A refers to the base model, where institutional holdings are measured at the end of each calendar year.Panel B refers to two alternative annual windows: in models 1 and 3 holdings changes are measured over the last twoquarters of a fiscal year and the first two quarters of the next fiscal year; in models 2 and 4 holdings changes are measuredover the final quarter of a fiscal year and the first three quarters of the next fiscal year.Financial variables are winsorized at the 1st and 99th percentiles. All models are estimated with White standard errorsadjusted to account for correlation within firm clusters; p-values in parentheses. For all other control variable definitionssee Table 3.
Variable Definitions:Percentage Ownership¼ total market value of shares owned by institutions divided by the total market value at firm-year
level, where both items are measured in U.S. dollars;Number of Investors ¼ total number of institutional investors at firm-year level;D¼ changes in variables computed over year t�1 to t;First-Time Mandatory¼ observations of firms that never reported under IFRS before mandatory adoption and equals 1
for all firm-years with IFRS reporting periods ending on or after the local mandated IFRS adoption date (i.e.,December 31, 2005), and 0 otherwise;
Voluntary¼observations of firms that voluntarily switched to IFRS reporting before it was mandated and equals 1 for allfirm-years with IFRS reporting by voluntary adopters, and 0 otherwise; and
Voluntary � Mandatory ¼ 1 for all voluntary adopter firm-years ending on or after the mandated local IFRS adoptiondate, and 0 otherwise.
Mandatory IFRS Adoption and Institutional Investment Decisions 2011
The Accounting ReviewNovember 2012

TABLE 7
Changes in Institutional Holdings and IFRS Mandatory AdoptionFirm-Quarter Analysis
Independent Variables
DPercentageOwnership
(1)
DNumber ofInvestors
(2)
First-Time Mandatory 0.003 0.535
(0.000) (0.000)
Voluntary 0.002 0.435
(0.006) (0.021)
Voluntary � Mandatory 0.002 0.501
(0.025) (0.013)
First-Time Mandatory�2 �0.000 �0.322
(0.914) (0.057)
First-Time Mandatory�1 0.001 0.544
(0.358) (0.007)
First-Time Mandatoryþ1 �0.000 0.188
(0.886) (0.347)
First-Time Mandatoryþ2 0.014 4.302
(0.000) (0.000)
First-Time Mandatoryþ3 �0.002 1.081
(0.001) (0.000)
Voluntary � Mandatory�2 �0.003 �1.128
(0.004) (0.000)
Voluntary � Mandatory�1 �0.003 �0.437
(0.005) (0.104)
Voluntary � Mandatoryþ1 �0.004 �1.062
(0.001) (0.000)
Voluntary � Mandatoryþ2 0.017 6.850
(0.000) (0.000)
Voluntary � Mandatoryþ3 0.000 1.238
(0.903) (0.000)
DSize 0.015 8.696
(0.000) (0.000)
DRET �0.009 �6.328
(0.000) (0.000)
DRetVar �0.023 �2.590
(0.000) (0.013)
DMarket Benchmark 1.390 1.112
(0.000) (0.000)
Intercept �0.012 �3.484
(0.000) (0.000)
Country Dummies Yes Yes
Industry-Year Dummies Yes Yes
No. Observations 85,741 89,368
No. Countries 45 45
Adj. R2 9.5% 15.5%
The sample in models 1 and 2 consists of a maximum 85,741 and 89,368 firm-quarter observations, respectively, from 45countries during the period 2003–2006 with sufficient institutional holdings data from TFO and financial data fromWorldscope to perform the regression analysis.
(continued on next page)
2012 Florou and Pope
The Accounting ReviewNovember 2012

statements are generally small in economic terms, and with three exceptions, statistically
insignificant.15
The coefficients on Voluntary � Mandatoryþ2 indicate that the incremental holding changes for
voluntary adopters in quarter þ2 are also positive and significant in economic terms, again
accounting for a large fraction of the overall change documented for voluntary adopters in the
mandated IFRS period. However, in contrast to the results for mandatory adopters, incremental
holdings changes for voluntary adopters in the three prior quarters�2,�1, andþ1 are significantly
negative, implying that institutional holdings in these firms fall in the quarters leading up to the
mandating of IFRS for other firms and suggesting that holdings changes follow different dynamics
for voluntary compared to first-time adopters. Overall, the results in Table 7 provide reassurance
that the main results reported in Table 6 are associated with financial reporting events in the
mandatory IFRS period.
Country-Quarter Analysis
We now report the results of the country-quarter analysis, based on Equation (2). In this
analysis we run regressions of the quarterly aggregate change in median institutional holdings in a
country on the change in the adoption rate in that country in the previous quarter. In the first
analysis we estimate the adoption rate index assuming that first-time adoption occurs by the end of
the quarter following the fiscal year-end of first-time adoption (IFRS Adoption RateFYE). We can
measure changes in this variable over five quarters (four quarters in 2006 and the first quarter in
2007), yielding 120 country-quarter observations over the 24 treatment countries. In the second
analysis we base the adoption rate index on actual annual, interim, and quarterly announcement
dates (IFRS Adoption RateINTERIM). We can measure changes in this variable over nine quarters
(four quarters in each of 2005 and 2006 and the first quarter of 2007) yielding 216 country-quarter
observations over the 24 treatment countries. Panel A of Table 8 reports descriptive statistics for
TABLE 7 (continued)
Financial variables are winsorized at the 1st and 99th percentiles. All models are estimated with White standard errorsadjusted to account for correlation within firm clusters; p-values in parentheses. For all other control variable definitionssee Table 3.
Variable Definitions:Percentage Ownership¼ total market value of shares owned by institutions divided by the total market value of the firm
at the end of a quarter, where both items are measured in U.S. dollars;Number of Investors ¼ total number of institutional investors at firm-quarter level;D¼ changes in variables computed over quarter q�1 to q;First-Time Mandatory¼ observations of firms that never reported under IFRS before mandatory adoption and equals 1
for all firm-years with IFRS reporting periods ending on or after the local mandated IFRS adoption date (i.e.,December 31, 2005), and 0 otherwise;
Voluntary¼observations of firms that voluntarily switched to IFRS reporting before it was mandated and equals 1 for allfirm-years with IFRS reporting by voluntary adopters, and 0 otherwise;
Voluntary � Mandatory ¼ 1 for all voluntary adopter firm-years ending on or after the mandated local IFRS adoptiondate, and 0 otherwise; and
First-Time Mandatoryq (q¼�2,�1,þ1,þ2,þ3)¼1 in quarter q and 0 in other quarters, using the convention that q¼�1is the quarter of the fiscal year-end and q¼þ1 is the quarter following the fiscal year-end. The indicator variablesVoluntary � Mandatoryq are defined in an exactly analogous manner to First-Time Mandatoryq.
15 The sum of the First-Time Mandatoryq coefficients in Table 7 closely reconcile with the First-Time Mandatorycoefficient in Table 6. From Table 7 the estimated total holdings change over the two-year period 2005–2006 is 83 First-Time MandatoryþRqFirst-Time Mandatoryq, giving 0.037 (10.07) for percentage ownership (number ofinvestors). The equivalent estimated changes from Table 6 over the two years equal to 2 3 First-TimeMandatory, giving 0.044 (9.876) for the above two holdings proxies, respectively.
Mandatory IFRS Adoption and Institutional Investment Decisions 2013
The Accounting ReviewNovember 2012

TABLE 8
Country-Quarter Analysis of the Effects of Mandatory IFRS Adoption on InstitutionalHoldings
Panel A: Descriptive Statistics of Dependent and Independent Variables Used in theCountry-Quarter Analysis
Variable Obs. Mean Median Std. Dev
DPercentage Ownership 120 0.42 0.00 0.038
216 0.25 �0.00 0.031
DNumber of Investors 120 0.85 0.00 5.732
216 0.53 0.00 5.254
DIFRS Adoption RateFYE (%) 120 18.13 6.76 0.253
DIFRS Adoption RateINTERIM (%) 216 19.66 14.14 0.168
Market Value 120 592.2 377.2 900.700
216 517.6 329.1 779.000
Return Variability 120 0.076 0.075 0.016
216 0.078 0.076 0.017
DMarket BenchmarkPercentageOwnership 120 �0.21 0.00 0.008
216 0.07 0.02 0.012
DMarket BenchmarkNumber of Investors 120 �0.03 0.03 1.466
216 0.16 0.03 2.352
Panel B: Regression Analysis
Independent Variables
DPercentage OwnershipQþ1 DNumber of InvestorsQþ1
AnnualReports
(1)
Interim andAnnualReports
(2)
AnnualReports
(3)
Interim andAnnualReports
(4)
DIFRS Adoption RateFYE,Q 0.042 — 7.354 —
(0.002) (0.002)
DIFRS Adoption RATEINTERIM,Q — 0.050 — 12.58
(0.002) (0.000)
Log (Market ValueQ�3) �0.025 �0.010 �6.332 1.345
(0.309) (0.154) (0.222) (0.579)
Return VariabilityQ�3 0.075 �0.327 9.750 �34.49
(0.889) (0.117) (0.927) (0.376)
Dependent VariableQ�3 �2.040 �1.048 0.070 �0.343
(0.000) (0.000) (0.907) (0.455)
DDependent VariableQ�3 2.111 1.326 �0.106 0.056
(0.000) (0.000) (0.808) (0.866)
DMarket BenchmarkQþ1 �0.032 0.080 �0.273 0.021
(0.771) (0.288) (0.176) (0.807)
Country Dummies Yes Yes Yes Yes
No. Observations 120 216 120 216
Adj. R2 55.6% 39.2% 15.4% 7.3%
The sample in models 1 and 3 consist of a maximum 120 country-quarter observations from 24 treatment samplecountries during a five-quarter period, where mandatory IFRS annual reports become initially available (i.e., fromJanuary 2006 to March 2007). The sample in models 2 and 4 consists of a maximum 216 country-quarter observations
(continued on next page)
2014 Florou and Pope
The Accounting ReviewNovember 2012

both country-quarter samples for the aggregate changes in percentage ownership and number of
investors, for changes in adoption rates and for control variables.
Inferences from the two adoption rate estimation methodologies are identical. Table 8, Panel B
shows that both changes in aggregate percentage ownership and changes in aggregate numbers of
investors are positively and significantly related to changes in IFRS adoption rates occurring in the
previous quarter. For example, in the case of percentage ownership the coefficient of IFRS AdoptionRateFYE is 0.042 and has a p-value of 0.002, and in the case of the number of investors the estimate
of IFRS Adoption RateINTERIM is 12.58 and has a p-value of 0.000 (see models 1 and 4,
respectively). The results suggest that investors respond in their portfolio investment decisions to
IFRS financial statement information as it becomes available.
It might appear from Panel B that IFRS Adoption RateFYE is more powerful at capturing
variation in aggregate holdings changes than IFRS Adoption RateINTERIM because the R2 statistics
are higher. However, results in models 1 and 3 are not directly comparable with those in models 2
and 4 because IFRS Adoption RateINTERIM is estimated over four additional quarters in 2005. In
untabulated tests we also estimate models 2 and 4 over the shorter five-quarter period with 120
observations. When we do this, R2 statistics increase to 52.4 percent and 14.7 percent and the
coefficients on the change in the adoption rate are 0.0421 and 11.27, respectively. Thus, results for
the two adoption rate indices are qualitatively similar.
Overall, these country-quarter results reflect evidence that changes in the information
environment associated with adoption of IFRS within countries are associated with increases in
institutional investor holdings.
Investor Orientation and Style Analysis
Next we examine whether IFRS effects on institutional holdings are concentrated among the
investors most likely to make use of financial statement information in investment decisions. Since
results for the different annual intervals are robust to the selection of measurement interval, we
report results for tests using the calendar-year intervals.
Table 9 presents results partitioned by investment orientation, where we decompose holdings
into active and passive investors; and by investment style where we decompose holdings into
growth, value, index, and income investors. Panel A contains results for changes in percentage
ownership and Panel B for changes in the number of institutional investors. Consistent with our
predictions we find that mandatory IFRS adoption is associated with significant increases in the
TABLE 8 (continued)
during a nine-quarter period (i.e., we extend the above window by four quarters, from January 2006 to March 2008, in orderto allow for interim reporting effects). We include only firms that report under IFRS for the first time in the year IFRSbecome mandatory.Panel A reports descriptive statistics for the dependent and independent variables during the above two periods.Panel B reports the coefficient estimates of regressions of country-level change in institutional holdings on the change inthe country-level IFRS adoption rate.We aggregate all firm-level variables in a given country and quarter by computing medians. All models are estimatedwith White standard errors; p-values in parentheses.
Variable Definitions:DPercentage Ownership (DNumber of Investors) ¼ quarterly change in the median percentage ownership (number of
investors) in a country;DIFRS Adoption Rate¼ quarterly change in the cumulative index of IFRS adoption for a country;Market Value ¼ stock price times the number of shares outstanding (in U.S. dollars) at the end of quarter Q�3;Return Variability ¼ standard deviation of the previous 12 monthly stock returns measured at time Q�3;Market Benchmark¼mean dependent value from all observations in the benchmark sample. We include lagged level and
change in the dependent variable measured at time Q�3; andD¼ changes in variables computed over quarter Q�1 to Q.
Mandatory IFRS Adoption and Institutional Investment Decisions 2015
The Accounting ReviewNovember 2012

TABLE 9
Changes in Institutional Holdings and IFRS Mandatory Adoption Partitioning byInvestment Orientation and Investment Style
Panel A: DPercentage Ownership
Independent VariablesActive
(1)Passive
(2)Growth
(3)Value
(4)Index
(5)Income
(6)
First-Time Mandatory 0.023 �0.001 0.010 0.010 0.000 0.000
(0.000) (0.001) (0.000) (0.000) (0.311) (0.419)
Voluntary 0.009 0.000 0.004 0.004 �0.000 �0.000
(0.001) (0.788) (0.003) (0.008) (0.984) (0.345)
Voluntary � Mandatory 0.008 �0.002 0.000 0.004 0.000 0.000
(0.011) (0.000) (0.763) (0.010) (0.081) (0.970)
Control Variables Yes Yes Yes Yes Yes Yes
Country Dummies Yes Yes Yes Yes Yes Yes
Industry-Year Dummies Yes Yes Yes Yes Yes Yes
No. Observations 21,726 21,726 21,726 21,726 21,726 21,726
No. Countries 45 45 45 45 45 45
Adj. R2 10.2% 7.7% 7.2% 2.9% 6.0% 3.4%
Panel B: DNumber of Investors
Independent VariablesActive
(1)Passive
(2)Growth
(3)Value
(4)Index
(5)Income
(6)
First-Time Mandatory 4.185 0.758 1.978 1.775 0.714 0.023
(0.000) (0.000) (0.000) (0.000) (0.000) (0.541)
Voluntary 1.909 0.060 0.835 0.395 0.007 0.098
(0.071) (0.710) (0.089) (0.223) (0.947) (0.098)
Voluntary � Mandatory 3.238 0.795 1.262 1.668 0.932 0.038
(0.008) (0.000) (0.025) (0.000) (0.000) (0.570)
Control Variables Yes Yes Yes Yes Yes Yes
Country Dummies Yes Yes Yes Yes Yes Yes
Industry-Year Dummies Yes Yes Yes Yes Yes Yes
No. Observations 22,826 22,826 22,826 22,826 22,826 22,826
No. Countries 45 45 45 45 45 45
Adj. R2 17.6% 16.8% 16.7% 13.0% 19.8% 7.0%
The complete sample consists of a maximum 35,160 firm-year observations from 45 countries during the period 2003–2006 with sufficient institutional holdings data from TFO and financial data from Worldscope to perform the regressionanalysis. The sample is partitioned by investment orientation, i.e., active versus passive investors and by investmentstyle, i.e., growth/value versus index/income investors.All models are estimated with White standard errors adjusted to account for correlation within firm clusters; p-values inparentheses. Financial variables are winsorized at the 1st and 99th percentiles. For all other control variable definitionssee Table 3.
Variable Definitions:Percentage Ownership¼ total market value of shares owned by institutions divided by the total market value of the firm
at year-end, where both items are measured in U.S. dollars;Number of Investors ¼ total number of institutional investors of the firm at year-end;D¼ changes in variables computed over year t�1 to t;First-Time Mandatory¼ observations of firms that never reported under IFRS before mandatory adoption and equals 1
for all firm-years with IFRS reporting periods ending on or after the local mandated IFRS adoption date (i.e.,December 31, 2005), and 0 otherwise;
(continued on next page)
2016 Florou and Pope
The Accounting ReviewNovember 2012

percentage ownership of active investors, but not of passive investors. The coefficient on First-Time
Mandatory for ownership of active investors (0.023) is almost identical to the coefficient obtained
for overall ownership in Panel A of Table 6, while the coefficient in the model for passive investor
is close to zero. These results suggest that IFRS-related ownership increases are attributable to
active investors. The First-Time Mandatory results for investor style are also consistent with
predictions. They indicate that ownership changes are very similar and significant for value and
growth investors, who are predicted to make more use of financial statements in their investment
decision processes. In contrast, changes in ownership by index and income investors do not appear
to be related to first-time mandatory adoption.
Results for changes in the number of investors in Table 9, Panel B are consistent with our
findings for percentage ownership in indicating strong IFRS first-time adoption effects for active
investors, and value and growth investors. The main difference between results in Panel B is that
the average number of passive investors also increases with mandatory IFRS adoption. However,
while the coefficient on First-Time Mandatory in the case of passive investors is 0.758, the average
first-time adoption increase for active investors is almost six times as high, with a coefficient of
4.185. Similarly, the investor style results show that the average first-time mandatory adoption
increase in the number of index investors is less than half the increase for growth and value
investors, while the corresponding increase in the average number of income investors is
statistically insignificant. Empirical findings are similar for voluntary adopters.
Overall, we document that the positive institutional holdings effects associated with mandatory
IFRS adoption are not present across all types of investors. Specifically, we find that the ownership
effects are considerably stronger for active and, in particular, value and growth investors, i.e., for
investors who depend to a greater extent on financial statement information. These results are
consistent with institutional holdings responding to common and higher quality financial reporting
when financial statement numbers are important in investment decision making.
Cross-Country Analysis
We now examine whether changes in institutional holdings in response to mandatory IFRS
adoption depend on enforcement and financial reporting incentives as well as on differences
between local GAAP and IFRS. Our empirical tests condition the estimated IFRS effects on
indicator variables representing the country clusters of Leuz et al. (2003) and Leuz (2010) and on
the two measures of accounting difference in Ding et al. (2005, 2007), namely Divergence and
Absence.
Panel A in Table 10 describes the institutional variables. Note that four (eight) treatment
(benchmark) countries are dropped from this analysis because the institutional data are not
available, but the overall number of observations lost is low because they are not large countries.
Panel B shows the results of paired t-tests of differences in the means of institutional clusters and
accounting divergence measures across the 20 treatment sample countries and the 13 benchmark
sample countries, revealing no significant differences in institutional characteristics between the
two samples.
TABLE 9 (continued)
Voluntary¼observations of firms that voluntarily switched to IFRS reporting before it was mandated and equals 1 for all
firm-years with IFRS reporting by voluntary adopters, and 0 otherwise; andVoluntary � Mandatory ¼ 1 for all voluntary adopter firm-years ending on or after the mandated local IFRS adoption
date, and 0 otherwise.
Mandatory IFRS Adoption and Institutional Investment Decisions 2017
The Accounting ReviewNovember 2012

TABLE 10
Changes in Institutional Holdings and IFRS Mandatory Adoption Conditioning onInstitutional Country Characteristics
Panel A: Institutional Factor Scores
TreatmentCountries Cluster Absence Divergence
BenchmarkCountries Cluster Absence Divergence
Australia 1 22 21 Argentina 3 47 33
(0) (0) (1) (1)
Austria 2 34 36 Bermuda NA NA NA
(1) (1)
Belgium 2 22 32 Brazil 3 36 23
(0) (1) (1) (0)
Czech Republic NA 44 20 Canada 1 4 25
(1) (0) (0) (0)
Denmark 2 31 21 Chile 2 31 28
(1) (0) (1) (1)
Finland 2 22 31 China NA 23 19
(0) (1) (1) (0)
France 2 21 34 Colombia 3 NA NA
(0) (1)
Germany 2 18 38 Egypt NA 22 23
(0) (1) (0) (0)
Greece 3 40 28 India 3 18 19
(1) (1) (0) (0)
Hong Kong 1 14 15 Indonesia NA 12 12
(0) (0) (0) (0)
Hungary NA 40 26 Israel 1 15 18
(1) (0) (0) (0)
Ireland 1 0 34 Japan 2 18 22
(0) (1) (0) (0)
Italy 3 27 37 Korea (South) 2 NA NA
(1) (1)
Luxemburg NA 54 17 Malaysia 1 30 13
(1) (0) (1) (0)
The Netherlands 2 10 25 Mexico 3 0 18
(0) (0) (0) (0)
Norway 2 7 17 New Zealand 1 23 20
(0) (0) (1) (0)
Philippines 3 24 14 Russia NA 38 29
(1) (0) (1) (1)
Poland NA 23 30 Taiwan 3 19 23
(1) (1) (0) (0)
Portugal 3 29 22 Thailand 3 29 7
(1) (0) (1) (0)
South Africa 1 7 1 Turkey NA 47 24
(0) (0) (1) (0)
Spain 2 28 29 United States 1 6 23
(1) (1) (0) (0)
(continued on next page)
2018 Florou and Pope
The Accounting ReviewNovember 2012

TABLE 10 (continued)
TreatmentCountries Cluster Absence Divergence
BenchmarkCountries Cluster Absence Divergence
Sweden 2 10 26
(0) (0)
Switzerland 2 42 22
(1) (0)
United Kingdom 1 0 35
(0) (1)
Average 1.95 23.71 25.46 Average 2.13 23.22 21.06
Panel B: Differences between Benchmark and Treatment Sample
Cluster Absence Divergence
Benchmark (i ) 2.08 21.23 20.92
(n ¼ 13) (n ¼ 13) (n ¼ 13)
Treatment (ii ) 1.95 20.40 25.90
(n ¼ 20) (n ¼ 20) (n ¼ 20)
(ii ) � (i ) �0.13 �0.83 4.98
(0.659) (0.855) (0.107)
Panel C: Cross-Country Regression Analysis
Independent Variables
DPercentageOwnership
(1)
DNumber ofInvestors
(2)
First-Time Mandatory �0.044 �9.348
(0.000) (0.007)
First-Time Mandatory � Cluster 1 0.064 12.85
(0.000) (0.000)
First-Time Mandatory � Cluster 2 0.020 4.101
(0.003) (0.146)
First-Time Mandatory � Absence 0.008 4.829
(0.206) (0.044)
First-Time Mandatory � Divergence 0.035 7.987
(0.000) (0.000)
Voluntary �0.016 �7.208
(0.413) (0.315)
Voluntary � Cluster 1 0.028 10.55
(0.186) (0.147)
Voluntary � Cluster 2 �0.006 0.727
(0.602) (0.880)
Voluntary � Absence 0.000 2.107
(0.989) (0.635)
Voluntary � Divergence 0.023 5.946
(0.022) (0.114)
Voluntary � Mandatory � Cluster 1 0.041 �5.698
(0.043) (0.480)
(continued on next page)
Mandatory IFRS Adoption and Institutional Investment Decisions 2019
The Accounting ReviewNovember 2012

TABLE 10 (continued)
Independent Variables
DPercentageOwnership
(1)
DNumber ofInvestors
(2)
Voluntary � Mandatory � Cluster 2 0.026 3.085
(0.002) (0.432)
Voluntary � Mandatory � Absence 0.007 �5.551
(0.414) (0.188)
Voluntary � Mandatory � Divergence 0.009 �10.88
(0.352) (0.016)
Cluster 1 0.006 1.389
(0.624) (0.551)
Cluster 2 0.002 2.220
(0.815) (0.204)
Absence �0.009 �3.366
(0.211) (0.124)
Divergence 0.004 �3.634
(0.553) (0.124)
Control Variables Yes Yes
Country Dummies Yes Yes
Industry-Year Dummies Yes Yes
No. Observations 20,924 22,020
No. Countries 33 33
R2 13.1% 18.7%
The complete sample consists of a maximum 35,160 firm-year observations from 45 countries during the period 2003–2006 with sufficient institutional holdings data from TFO and financial data from Worldscope to perform the regressionanalysis.Panel A reports raw values of the institutional factor scores for the treatment and benchmark sample countries,respectively. The treatment sample consists of countries that mandated IFRS reporting and the benchmark sampleincludes countries that do not allow or do not require IFRS reporting. Cluster classification is based on legal regulationquality, enforcement, and reporting practices variables and is taken from Leuz (2010), characterized as outsidereconomies with strong outsider protection and legal enforcement (Cluster 1); insider economies with stronger ruleenforcement (Cluster 2); and insider economies with weaker rule enforcement (Cluster 3). Absence and Divergence aredrawn from Ding et al. (2007); higher values represent more missing rules/disclosures from local GAAP and moredifferences between IFRS and local GAAP, respectively. We transform continuous values of Divergence and Absenceinto binary variables (in parentheses) splitting by the median of treatment sample countries; coded 1¼ above median, and0 otherwise.Panel B shows differences in mean institutional factor scores between benchmark and treatment countries (only forcountries with all available scores); p-values in parentheses for (ii )� (i ).Panel C reports coefficient estimates of the cross-country regression analysis; p-values in parentheses.All models are estimated with White standard errors adjusted to account for correlation within firm clusters. Financialvariables are winsorized at the 1st and 99th percentiles. For all other control variable definitions see Table 3.
Variable Definitions:Percentage Ownership¼ total market value of shares owned by institutions divided by the total market value of the firm
at year-end, where both items are measured in U.S. dollars;Number of Investors ¼ total number of institutional investors of the firm at year-end;D¼ changes in variables computed over year t�1 to t;First-Time Mandatory¼ observations of firms that never reported under IFRS before mandatory adoption and equals 1
for all firm-years with IFRS reporting periods ending on or after the local mandated IFRS adoption date (i.e.,December 31, 2005), and 0 otherwise;
Voluntary¼ observations of firms that voluntarily switched to IFRS reporting before it was mandated and equals 1 for allfirm-years with IFRS reporting by voluntary adopters, and 0 otherwise; and
Voluntary � Mandatory ¼ 1 for all voluntary adopter firm-years ending on or after the mandated local IFRS adoptiondate, and 0 otherwise.
2020 Florou and Pope
The Accounting ReviewNovember 2012

Empirical findings in Panel C of Table 10 are very consistent across the two institutional
holdings change proxies.16 They reveal large differences in the marginal IFRS effects across
country clusters and between countries with high accounting divergence. The First-TimeMandatory main effect coefficient is significantly negative for both changes in ownership
(�0.044) and changes in the number of investors (�9.348), indicating that Cluster 3 first-time
adoption firms with small accounting differences experience a relative decline in institutional
holdings. The incremental coefficients of first-time mandatory adoption are positive for both
Cluster 1 and Cluster 2 countries. The marginal first-time mandatory effects of accounting
differences, as measured by Divergence, on institutional holdings are also significantly positive,
suggesting that IFRS-induced changes in financial statement numbers are larger for firms in
countries where accounting divergence is greater. In contrast, Absence is insignificant when
interacted with First-Time Mandatory, in line with arguments that the absence of rules might imply
that some accounting issues are not important in some jurisdictions. While we do not have
predictions for the conditioning effects of institutional variables on Voluntary � Mandatory, results
also reveal differences in effects across clusters for changes in ownership percentage, but not in the
number of investors. Absence and Divergence are less relevant for these firms, probably because
they already report under IFRS.17
To sum up, results suggest that the impact of the mandatory introduction of IFRS on the
investment decisions of institutions varies significantly across countries. In particular, in line with
our predictions and consistent with capital market outcomes documented in prior studies (Daske et
al. 2008; Li 2010), results indicate that the positive effects of mandatory IFRS adoption on
institutional holdings are found primarily in countries with strong institutions.18 Moreover, where
there is high divergence between domestic GAAP and IFRS, the impact of mandatory IFRS
introduction on institutional holdings is even higher.
Additional Analysis
We expand our empirical analysis by performing two additional tests. First, we repeat the
analysis in Table 6 separately for emerging and developed market countries. This analysis can
provide further reassurance that earlier results are not driven by flows of funds into developed
markets due to unmodeled factors, e.g., other institutional features that affect market microstructure
across sample countries.19 Second, current research indicates that other recent EU market
16 We also include main effects for the institutional variables to allow for the possibility that institutional holdingschanges depend directly on the country context in which investment takes place. The First-Time Mandatory,Voluntary, and Voluntary �Mandatory main effects can be interpreted as the IFRS effects applicable to countriesbelonging to Cluster 3 when accounting Divergence and Absence are low.
17 We note that the coefficient on Voluntary � Mandatory � Divergence is negative in the case of changes in thenumber of investors. As discussed in the context of Table 7 results, the dynamics of holdings changes forvoluntary adopters appear to be complex.
18 Covrig et al. (2007) find that institutional ownership increases on voluntary IFRS adoption for firms with low-quality information environments. If Clusters 1 and 2 are regarded as conducive to higher quality informationenvironments, then our results on institutional effects might appear to contradict Covrig et al. (2007). However,analysis reveals that the institutional variables underlying the clusters are not significantly correlated with thefirm-level proxy for information environment quality employed by Covrig et al. (2007), i.e., Number of Analysts� Size. We interpret this as indicating that the institutional clusters capture different characteristics of firms’environments. When we repeat the Covrig et al. (2007) analysis using their firm-level proxy, we confirm theirresult.
19 To identify emerging markets we use the Standard & Poor’s and International Finance Corporation of WorldBank (S&P/IFC) emerging market index (Li and Hoyer-Ellefsen 2008). Accordingly, our sample includes 20emerging and 21 developed countries; four countries (Hong Kong, Luxemburg, Bermuda, and Taiwan) are notclassified.
Mandatory IFRS Adoption and Institutional Investment Decisions 2021
The Accounting ReviewNovember 2012

regulations affect market liquidity and the cost of capital (Christensen et al. 2011). To address
concerns that positive institutional holdings effects are driven by other EU regulatory changes we
estimate all models in Table 6 after excluding EU members. Untabulated results indicate that when
institutional holdings change proxies are measured over calendar-year intervals, mandatory
financial reporting under IFRS is associated with increased ownership only for developed countries.
However, when we employ alternative annual measurement windows as in Panel B of Table 6, we
find evidence of positive and significant mandatory IFRS effects for both emerging and developed
countries. Similarly, we document positive and significant IFRS effects on institutional ownership
for the�1/þ3 and�2/þ2 intervals but not for the calendar-year interval when focusing on non-EU
countries.20
Sensitivity Tests
To test the robustness of the baseline empirical findings reported in Table 6 we perform a
number of sensitivity tests. First, we employ alternative samples, as follows: (1) we limit the sample
to IFRS adoption countries only; (2) we define a benchmark sample to include a maximum of 150
randomly selected firms per country; (3) we exclude U.S. firms from the benchmark sample; (4) we
limit the benchmark sample to U.S. firms; (5) we hold sample composition constant over time; (6)
we exclude from the treatment sample firms that did not switch to IFRS in the sample period; and
(7) we limit the treatment sample to EU countries. We also include the following additional control
variables: (1) the total number of shares outstanding at year-end (WS05301) to proxy for new
equity issuance (Bradshaw et al. 2004); (2) the ADR indicator in levels rather than in changes,
given that the latter variable is dropped from the regressions due to lack of variability; and (3) the
percentage of closely held shares (WS08021) to capture the effect of ownership structure and free
float (Leuz et al. 2010).
We then examine the possibility that the changes in institutional holdings we observe are
driven by the IFRS-related changes in liquidity documented by Daske et al. (2008). We test whether
liquidity changes account for changes in investor holdings by introducing exogenous controls for
liquidity changes, defining liquidity as the Amihud (2002) illiquidity measure, the bid-ask spread,
and the frequency of zero returns, and by modeling the liquidity controls as endogenously
determined, using market value, share turnover, return variability, a binary indicator controlling for
U.S. GAAP reporting, and a market benchmark as first-stage instruments for liquidity.
To provide reassurance that our results are not driven by growth in the number of institutional
investors and their holdings over time, we also restrict the analysis to holdings by institutional
investors for whom we observe data in both the pre- and post-IFRS periods.
Since some of our control variables depend on accounting measurement rules, their use in the
pre- and post-IFRS periods could introduce noise or bias into the analysis. Noise will reduce the
likelihood of finding statistically significant results, but bias threatens the conclusions drawn from
the analysis if any bias is correlated with the IFRS indicators and institutional investment in the pre-
mandatory adoption period. To help address this concern, we interact the three IFRS indicators with
all accounting-based control variables (i.e., ROE, Leverage, Dividend Yield, Book-Market, and
Earnings-Price).
20 The sensitivity of annual window results is likely driven by heterogeneity in the timing of the annual financialreporting cycles across sample firms. For example, in the case of developed countries, the percentage of thetreatment sample firm-years having a December fiscal year-end is considerably higher than for the benchmarksample (i.e., 68 percent compared to 46 percent). However, this relation is reversed in the case of emergingmarket countries where the proportion of treatment (benchmark) sample firm-years having December fiscal year-ends is 61 percent (80 percent).
2022 Florou and Pope
The Accounting ReviewNovember 2012

Finally, we repeat our cross-country analysis after incorporating Divergence in continuous
form. This helps mitigate concerns regarding the clustering of this dummy variable where a number
of countries with only slightly different divergence scores are coded differently.21
When we implement each of these sensitivity tests we find that all the main empirical findings
and inferences in Table 6 are qualitatively identical to those reported in the paper.
V. CONCLUSIONS
Based on annual and quarterly firm-level analyses and quarterly country-level tests we report
evidence of economically significant increases in institutional holdings in mandatory IFRS
adopters. After first-time IFRS reporting, institutional ownership and the number of investors
increase for mandatory IFRS adopters relative to a benchmark sample of non-adopters. We also
show that increases in institutional holdings are concentrated among investors whose investment
orientation and styles rely more heavily on financial statement information. This raises confidence
that the holdings effects we observe are driven by the financial reporting regime change, and not by
changes in unmodeled factors that might also determine institutional investment. In further analysis
we document that the positive impact of mandatory IFRS adoption on institutional holdings is
restricted to countries where enforcement and reporting incentives are strong and where divergence
between local accounting standards and IFRS is relatively high.
Our study is subject to several caveats that might suggest avenues for future research. First,
while our research is designed to address the identification problem, we cannot rule out entirely the
possibility that other concurrent regulatory or economic changes affect IFRS adoption countries,
but they would have to be related to the financial reporting cycle and affect only certain investor
types within those countries. Second, our findings suggest that voluntary adopters also experience
an increase in institutional holdings following the mandating of IFRS. Moreover, there are
potentially interesting differences in patterns of holdings changes for first-time mandatory and
voluntary adopters in relation to both the financial reporting cycle and the role of accounting
differences. It is possible that our results for voluntary adopters reflect comparability externalities
after mandatory IFRS adoption by other peers. However, our evidence does not shed direct light on
the validity of this conjecture. Future work could address the challenge of identifying comparability
effects in international settings. Finally, we do not investigate the supply side of the increase in
institutional holdings in first-time IFRS adopters. Further work might investigate the extent to
which institutional ownership changes are associated with reductions in holdings of investors who
are not captured by our data, e.g., insiders and family block-holders, and with secondary equity
offerings and capital restructuring programs that increase the supply of equity.
Overall, our study helps shed new light on the channels underpinning the capital market effects
of IFRS adoption reported in Daske et al. (2008) and Li (2010). The evidence supports the
argument that IFRS adoption is beneficial for institutional investors and issuers of securities.
REFERENCES
Amihud, Y. 2002. Illiquidity and stock returns. Journal of Financial Markets 5 (1): 31–56.
Armstrong, C., M. E. Barth, A. Jagolizer, and E. J. Riedl. 2010. Market reaction to the adoption of IFRS in
Europe. The Accounting Review 85 (1): 31–62.
Ashbaugh, H., and M. Pincus. 2001. Domestic accounting standards, international accounting standards,
and the predictability of earnings. Journal of Accounting Research 39 (3): 417–434.
21 We do not transform the Absence indicator into a continuous variable because it is highly correlated with theCluster 1 dummy (correlation coefficient equals �0.65).
Mandatory IFRS Adoption and Institutional Investment Decisions 2023
The Accounting ReviewNovember 2012

Bae, K. H., H. Tan, and M. Welker. 2008. International GAAP differences: The impact on foreign analysts.
The Accounting Review 83 (3): 593–628.
Baiman, S., and R. Verrecchia. 1996. The relation among capital markets, financial disclosure, production
efficiency, and insider trading. Journal of Accounting Research 34 (1): 1–22.
Ball, R. 2006. IFRS: Pros and cons for investors. Accounting and Business Research (International
Accounting Policy Forum): 5–27.
Ball, R., A. Robin, and J. S. Wu. 2003. Incentives versus standards: Properties of accounting income in four
East Asian countries. Journal of Accounting and Economics 39 (1–3): 235–270.
Barth, M., W. R. Landsman, and M. H. Lang. 2008. International accounting standards and accounting
quality. Journal of Accounting Research 46 (3): 467–498.
Bradshaw, M. T., B. J. Bushee, and G. S. Miller. 2004. Accounting choice, home bias, and US investment
in non-US firms. Journal of Accounting Research 42 (5): 795–841.
Burgstahler, D. C., L. Hail, and C. Leuz. 2006. The importance of reporting incentives: Earnings
management in European private and public firms. The Accounting Review 81 (5): 983–1017.
Bushee, B. J., and T. H. Goodman. 2007. Which institutional investors trade based on private information
about earnings and returns? Journal of Accounting Research 45 (2): 289–321.
Campbell, J. 1996. Understanding risk and return. Journal of Political Economy 104 (2): 298–345.
Christensen, H. B., L. Hail, and C. Leuz. 2011. Capital-market effects of securities regulation: Hysteresis,
implementation, and enforcement. Available at: http://papers.ssrn.com/sol3/papers.cfm?abstract_
id¼1745105
Covrig, V. M., M. L. DeFond, and M. Hung. 2007. Home bias, foreign mutual fund holdings, and the voluntary
adoption of international accounting standards. Journal of Accounting Research 45 (1): 41–70.
Daske, H., L. Hail, C. Leuz, and R. Verdi. 2008. Mandatory IFRS reporting around the world: Early
evidence on the economic consequences. Journal of Accounting Research 46 (5): 1085–1142.
Daske, H., L. Hail, C. Leuz, and R. Verdi. 2011. Adopting a label: Heterogeneity in the economic
consequences around voluntary IAS/IFRS adoptions. Available at: http://papers.ssrn.com/sol3/
papers.cfm?abstract_id¼1864771
DeFond, M., X. Hu, M. Hung, and S. Li. 2011. The impact of mandatory IFRS adoption on foreign mutual
fund ownership: The role of comparability. Journal of Accounting and Economics 51 (3): 240–258.
DeFond, M. L., M. Hung, and R. Trezevant. 2007. Investor protection and the information content of annual
earnings announcements: International evidence. Journal of Accounting and Economics 43 (1): 37–67.
Ding, Y., O. K. Hope, T. Jeanjean, and H. Stolowy. 2007. Differences between domestic accounting
standards and IAS: Measurements, determinants and implications. Journal of Accounting and PublicPolicy 26 (1): 1–38.
Ding, Y., T. Jeanjean, and H. Stolowy. 2005. Why do national GAAP differ from IAS? The role of culture.
International Journal of Accounting 40 (4): 325–350.
Ding, Y., T. Jeanjean, and H. Stolowy. 2009. Observations on measuring the difference between domestic
accounting standards and IAS: A reply. Journal of Accounting and Public Policy 28 (2): 154–161.
Easley, D., and M. O’Hara. 2004. Information and the cost of capital. Journal of Finance 59 (4): 1553–
1583.
European Council. 2002. Regulation EC No. 1606/2002 of the European Parliament and of the Council.Available at: http://www.esma.europa.eu/system/files/Reg_1606_02.pdf
Francis, J. R., S. Huang, I. K. Khurana, and R. Pereira. 2009. Does corporate transparency contribute to
efficient resource allocation? Journal of Accounting Research 47 (4): 943–989.
Garcıa Osma, B., and P. F. Pope. 2011. Strategic balance sheet adjustments under first-time IFRS adoption
and the consequences for earnings quality. Available at: http://papers.ssrn.com/sol3/papers.cfm?
abstract_id¼1735009
Hail, L., C. Leuz, and P. Wysocki. 2010. Global accounting convergence and the potential adoption of IFRS
by the U.S., Part I: Conceptual underpinnings and economic analysis. Accounting Horizons 24 (3):
355–394.
Hughes, J., J. Liu, and J. Liu. 2007. Information asymmetry, diversification, and cost of capital. TheAccounting Review 82 (3): 705–730.
2024 Florou and Pope
The Accounting ReviewNovember 2012

International Accounting Standards Committee (IASB). 1989. Framework for the Preparation andPresentation of Financial Statements. London, U.K.: IASB.
Jorgensen, B., and M. Kirschenheiter. 2003. Discretionary risk disclosures. The Accounting Review 78 (2):
449–469.
Lambert, R., C. Leuz, and R. Verrecchia. 2007. Accounting information, disclosure, and the cost of capital.
Journal of Accounting Research 45 (2): 385–420.
Leuz, C. 2010. Different approaches to corporate reporting regulation: How jurisdictions differ and why.
Accounting and Business Research 40 (3): 229–258.
Leuz, C., K. V. Lins, and F. E. Warnock. 2010. Do foreigners invest less in poorly governed firms? Reviewof Financial Studies 23 (3): 3245–3285.
Leuz, C., D. Nanda, and P. D. Wysocki. 2003. Earnings management and investor protection: An
international comparison. Journal of Financial Economics 69 (3): 505–527.
Leuz, C., and R. E. Verrecchia. 2000. The economic consequences of increased disclosure. Journal ofAccounting Research 38 (Supplement): 91–124.
Leuz, C., and P. Wysocki. 2008. Economic consequences of financial reporting and disclosure regulation: A
review and suggestions for future research. Available at: http://ssrn.com/abstract¼1105398.
Li, S. 2010. Does mandatory adoption of International Financial Reporting Standards in the European
Union reduce the cost of equity capital? The Accounting Review 85 (2): 607–636.
Li, W., and R. Hoyer-Ellefsen. 2008. The characteristics of emerging markets. Available at: http://papers.
ssrn.com/sol3/papers.cfm?abstract_id¼909890
Merton, R. 1987. A simple model of capital market equilibrium with incomplete information. Journal ofFinance 42 (3): 483–510.
O’Brien, P., and R. Bhushan. 1990. Analyst following and institutional ownership. Journal of AccountingResearch 28 (Supplement): 55–76.
Petersen, M. A. 2009. Estimating standard errors in finance panel data sets: Comparing approaches. Reviewof Financial Studies 22 (1): 435–480.
Rogers, W. 1994. Regression standard errors in clustered samples. Stata Technical Bulletin 13 (3): 19–23.
Verrecchia, R. 2001. Essays on disclosure. Journal of Accounting and Economics 32 (1–3): 97–180.
Walther, B. 1997. Investor sophistication and market earnings expectations. Journal of AccountingResearch 35 (2): 157–179.
Wysocki, P. 2011. New institutional accounting and IFRS. Accounting and Business Research 41 (3): 309–
328.
Yu, G. 2010. Accounting standards and international portfolio holdings: Analysis of cross-border holdings
following mandatory adoption of IFRS. Available at: http://ssrn.com/abstract¼1430572
Mandatory IFRS Adoption and Institutional Investment Decisions 2025
The Accounting ReviewNovember 2012