mangafodipir trisodium-enhanced mr imaging of
TRANSCRIPT
Mangafodipir trisodium-enhanced MR imaging
of hepatocellular carcinoma:
correlation with histologic characteristics
Joo Hee Kim
The Graduate School
Yonsei University
Department of Medicine
Mangafodipir trisodium-enhanced MR imaging
of hepatocellular carcinoma:
correlation with histologic characteristics
Directed by Professor Myeong-Jin Kim
The Doctoral Dissertation submitted to the Department of Medicine and
the Graduate School of Yonsei University in partial fulfillment of the
requirements for the degree of Doctor of Philosophy
Joo Hee Kim
December 2005
This certifies that the Doctoral Dissertation of
Joo Hee Kim is approved.
--------------------------------------------------------------------- Myeong-Jin Kim : Thesis Supervisor
--------------------------------------------------------------------- Jong Tae Lee : Thesis Committee Member
--------------------------------------------------------------------- Byong Ro Kim : Thesis Committee Member
--------------------------------------------------------------------- Jae Bock Chung : Thesis Committee Member
--------------------------------------------------------------------- Young Nyun Park : Thesis Committee Member
The Graduate School
Yonsei University
December 2005

ACKNOWLEDGEMENTS
There have been a number of people without whom this thesis could not
be completed. I would like to express my deepest gratitude to my thesis
supervisor and mentor Professor Myeong-Jin Kim. He always gave many
academic guidance and discipline as a professor not to be downed to an error,
and sometimes gave me a big smile and encouragement as a senior whenever I
suffer hardship during my work.
I would like to thank Dr. Jong Tae Lee, Dr. Byong Ro Kim, Dr. Jae Bock
Chung and especially Dr. Young Nyun Park for their perceptive comments,
and ongoing and persistent efforts to help me make good thesis.
I would like to express my infinite gratitude to my dear husband who
gave me unchanged applause and encouragement. I am deeply indebted to my
parents and parents-in-law, who always provided a solid foundation for me to
spread my wings.
December 2005
Joo Hee Kim
TABLE OF CONTENTS
Abstract …………………………………………………………………………… 1
I. Introduction …………………………………………………………………… .. 4
II. Materials and Methods ……………………………………………………….. 7
1. Patients ……………………………………………………………….. 7
2. MR Imaging ………………………………………………………….. 7
3. Image Analysis ……………………………………………………….. 9
4. Pathologic Analysis …………………………………………………. 10
5. Statistics ……………………………………………………………... 12
III. Results ……………………………………………………………………….. 13
1. Qualitative and quantitative enhancement of MnDPDP ………… 13
2. MnDPDP enhancement and pathomorphology of HCCs ………... 13
3. MnDPDP enhancement and the histologic grades ……………….. 15
4. MnDPDP enhancement and the cell density ratio ………………... 20
5. MnDPDP enhancement and immunohistologic evaluation ……… 21
6. The histologic grades, cell density ratio and Hep Par 1 positivity … 23
IV. Discussion ……………………………………………………………………. 26
V. Conclusion ……………………………………………………………………. 33
References ………………………………………………………………………... 34
Abstract (in Korean) ……………………………………………………………. 39
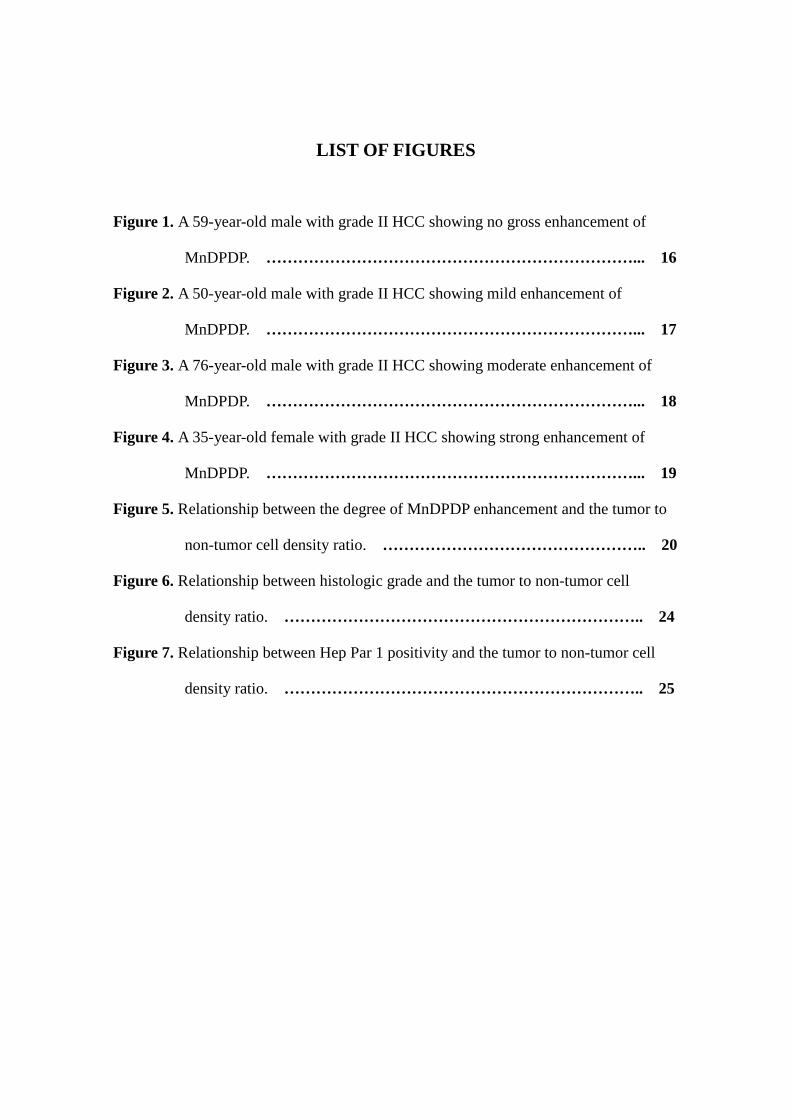
LIST OF FIGURES
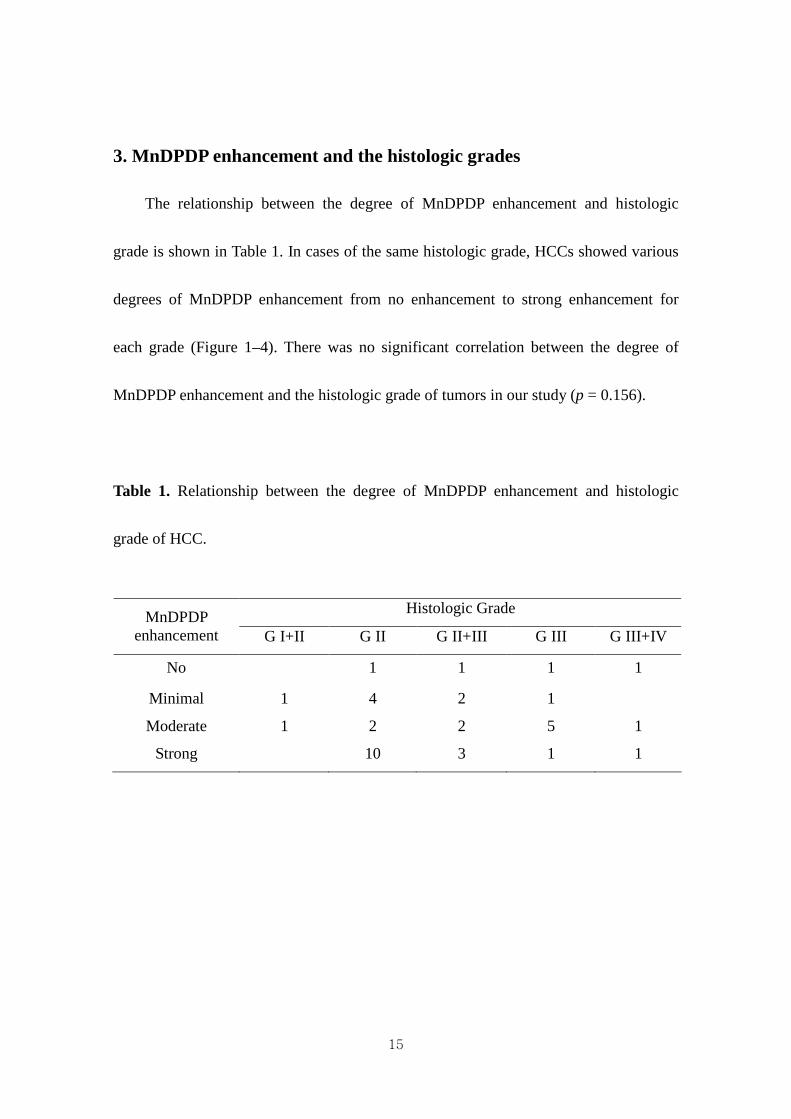
Figure 1. A 59-year-old male with grade II HCC showing no gross enhancement of
MnDPDP. ……………………………………………………………... 16
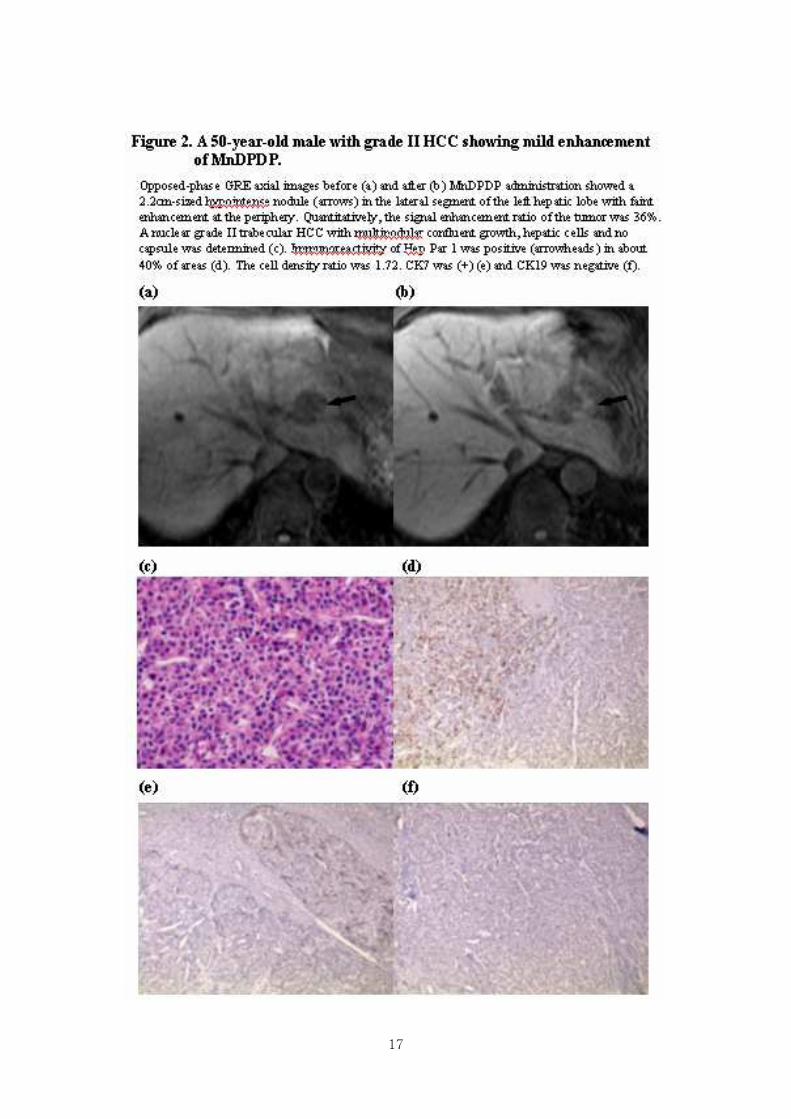
Figure 2. A 50-year-old male with grade II HCC showing mild enhancement of
MnDPDP. ……………………………………………………………... 17
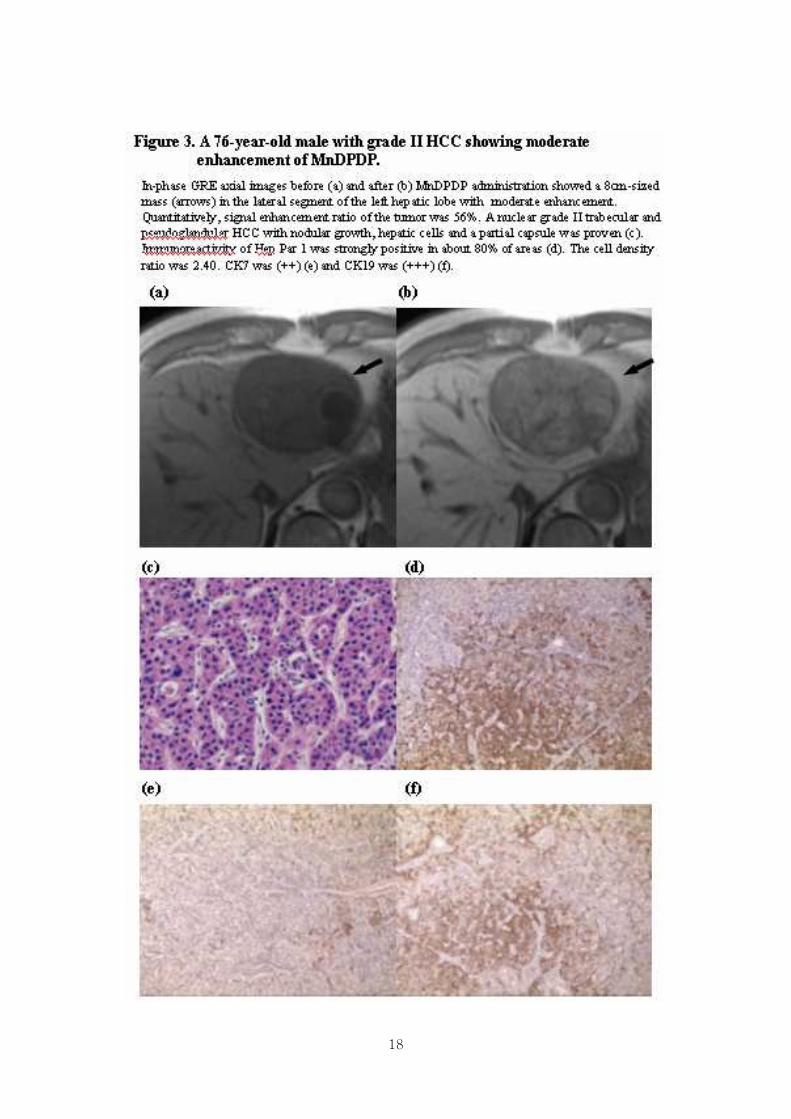
Figure 3. A 76-year-old male with grade II HCC showing moderate enhancement of
MnDPDP. ……………………………………………………………... 18
Figure 4. A 35-year-old female with grade II HCC showing strong enhancement of
MnDPDP. ……………………………………………………………... 19
Figure 5. Relationship between the degree of MnDPDP enhancement and the tumor to
non-tumor cell density ratio. ………………………………………….. 20
Figure 6. Relationship between histologic grade and the tumor to non-tumor cell
density ratio. ………………………………………………………….. 24
Figure 7. Relationship between Hep Par 1 positivity and the tumor to non-tumor cell
density ratio. ………………………………………………………….. 25
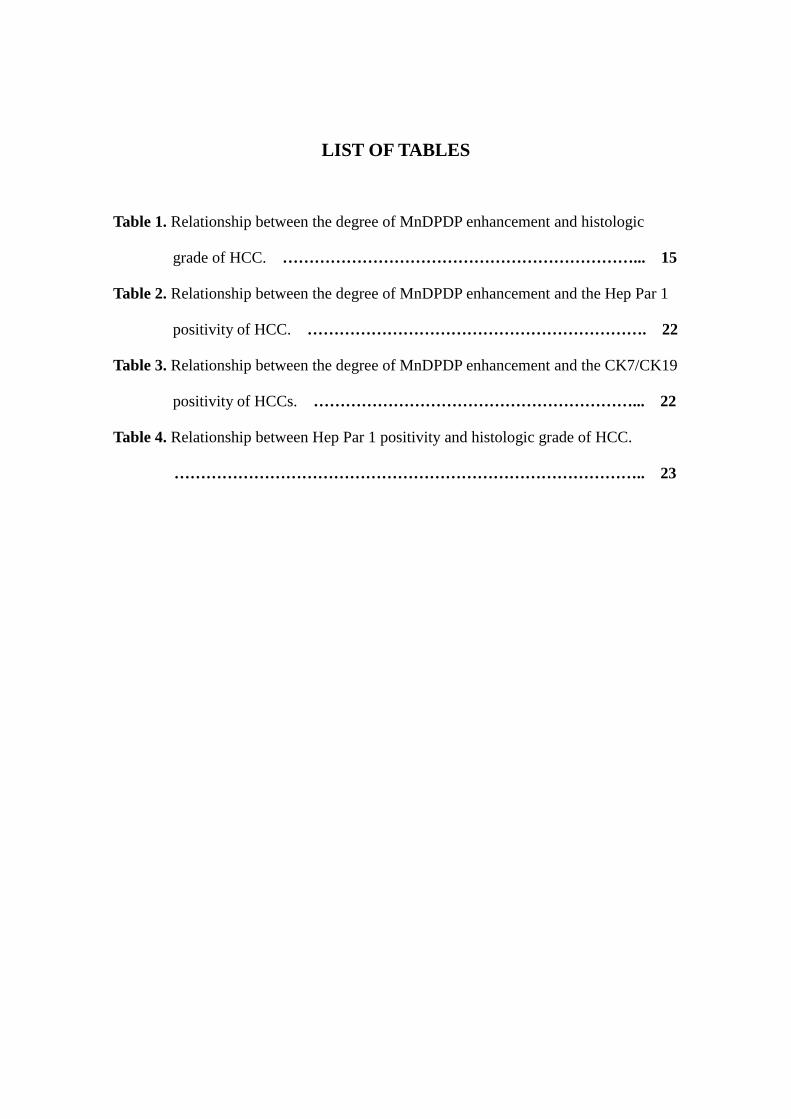
LIST OF TABLES
Table 1. Relationship between the degree of MnDPDP enhancement and histologic
grade of HCC. …………………………………………………………... 15
Table 2. Relationship between the degree of MnDPDP enhancement and the Hep Par 1
positivity of HCC. ………………………………………………………. 22
Table 3. Relationship between the degree of MnDPDP enhancement and the CK7/CK19
positivity of HCCs. ……………………………………………………... 22
Table 4. Relationship between Hep Par 1 positivity and histologic grade of HCC.
…………………………………………………………………………….. 23
1
ABSTRACT
Mangafodipir trisodium-enhanced MR imaging of hepatocellular
carcinoma: correlation with histologic characteristics
Joo Hee Kim
Department of Medicine
The Graduate Scholl, Yonsei University
(Directed by Professor Myeong-Jin Kim)
Purpose: To define histopathologic factors related with the degree of mangafodipir
trisodium (MnDPDP) uptake in hepatocellular carcinomas (HCCs) on magnetic
resonance (MR) imaging.
Materials and Methods: In-phase and opposed-phase gradient echo (GRE) MR images
were obtained preoperatively in 37 patients with 38 HCCs before and 15 – 30 min after
intravenous injection of MnDPDP. Subjective ratings of the enhancement degree, the
signal-to-noise ratio (SNR) of the lesion and the liver before and after MnDPDP
enhancement and the signal enhancement ratios (ER, %) were all correlated with the
2
histopathologic factors; these included the nuclear grade, the size of tumor, growth type,
presence of capsule, histologic type, cell type, the cell density ratio of the tumor to the
adjacent parenchyma (cellular compactness), the percentage of the immunopositive
areas on immunostaining for monoclonal hepatocyte antibody (Hep Par 1), cytokeratin
7 (CK7), and cytokeratin 19 (CK19).
Results: Compared to the precontrast MR images, the mean SNR of HCCs increased
from 59.6 to 95.0 (ER of HCC = 59.5 %) on the MnDPDP-enhanced MR images, while
the mean SNR of the liver increased from 75.1 to 108.7 (ER of the liver = 45.2 %). In
34 HCCs, 8 showed mild enhancement, 11 showed moderate enhancement, and 15
showed strong enhancement. There was no visually perceptible enhancement in the
remaining 4 HCCs (10.3 %). As MnDPDP enhancement increased, the cell density ratio
also increased (p < .05). There was strong correlation between the degree of MnDPDP
enhancement and Hep Par 1 positivity (p < .005). There were no significant correlations
between the degree of MnDPDP enhancement and the nuclear grade, size, growth type,
presence of capsule, cell type, histologic type, CK7, or CK19.
Conclusion: Initial delayed uptake of MnDPDP in HCCs was correlated with
3
hepatocyte antibody expression and cellular density. The histologic differentiation of
HCCs was not directly correlated with the degree of enhancement on MnDPDP-
enhanced MR imaging.
Key words: Hepatocellular carcinoma, Magnetic resonance imaging, MR contrast
agent, mangafodipir trisodium

4
Mangafodipir trisodium-enhanced MR imaging of hepatocellular
carcinoma: correlation with histologic characteristics
Joo Hee Kim
Department of Medicine
The Graduate Scholl, Yonsei University
(Directed by Professor Myeong-Jin Kim)
I. Introduction
Magnetic resonance (MR) imaging of the liver is useful in the detection and
characterization of focal hepatic lesions. Further improvements in MR imaging could be
achieved by extracellular MR contrast, which was non-tissue-specific1. However, this
most widely-used extracellular MR contrast agents, gadolinium-chelates, behave the
same way as iodinized CT contrast agents with regard to contrast distribution and
enhancement patterns for hepatic imaging. Thus, differentiation between hepatocellular
and non-hepatocellular tumors or between benign and malignant hepatic tumors remains
difficult in some cases. In order to obtain this additional benefit of hepatic MR imaging,
5
the need for tissue-specific contrast agents has emerged.
Mangafodipir trisodium (Manganese-dipyridoxal diphosphate, MnDPDP) is an
anionic manganese chelate that dissociates rapidly following administration, yielding a
free Mn++ ion. The free Mn++ is taken up by active hepatocytes and excreted through the
biliary system2, 3. It is well known that not only normal hepatocytes, but also parts of
hepatocyte-derived tumor cells, take up MnDPDP4. Thus, MnDPDP-enhanced liver
MRI has been shown to be valuable for the detection and characterization of hepatic
tumors5-7 and to be useful for distinguishing between hepatocellular and non-
hepatocellular tumors7-11. However, it is still uncertain which factors influence the
degree of enhancement of HCCs during the initial delayed phase of MnDPDP-
enhancing images. Some authors reported that the degree of tumor enhancement by
MnDPDP correlated with the histologic grades of the HCCs12-14, but this assertion was
controversial by other investigators10. These previous studies had several limitations:
insufficient materials, lack of complete surgical correlation, lopsided histologic
differentiation, or lack of statistical significance.
Although MnDPDP can distinguish between hepatocellular and non-hepatocellular
tumors, MnDPDP has not been used effectively in making differentiation the different
types of hepatocellular tumors. Evidence suggests that there are other factors other than
6
tumor grade that influence early enhancement on MnDPDP-enhanced MR imaging.
Finding determinants of the patterns and degrees of MnDPDP uptake may assist in the
detection and characterization of hepatocyte-derived tumors, and also suggest another
prognostic factor for HCC. The aim of this study was to define histopathologic factors
related to the degree of MnDPDP uptake in HCCs on MR imaging.
7
II. Materials and Methods
1. Patients
MnDPDP-enhanced hepatic MR examinations were performed in 74 patients as
preoperative assessment of HCC at the Severance Hospital. Among them, a total of 37
patients with 38 HCCs underwent hepatic resection: these patients were enrolled in this
study (24 male and 13 female; mean age, 53 years; age range, 33–76 years). The criteria
of exclusion were cases of non-surgical treatment (n=24), a history of prior trans-arterial
chemo-embolization (n=6), prior use of other MR contrast agents such as gadolinium-
chelates or superparamagnetic iron oxide (n=5), and mixed-type malignancy
(hepatocellular and cholangiocellular carcinoma) (n=2). All the lesions had complete
surgical pathology.
2. MR Imaging
All MR imaging was performed on 1.5-T MR scanners (Signa Horizon; General
Electric Medical Systems, Milwaukee, WI) using phased-array multicoils. A rectangular
field of view (FOV) of 32 × 24 to 29 × 22 cm, adjusted for each patient was held
constant for all the sequences. In all patients, the unenhanced and MnDPDP-enhanced
8
MR images were obtained.
The pre-contrast MRI was composed of 1) a respiratory-triggered T2-weighted fast
spin-echo (FSE) (effective TR range/effective TE, 3500–10900/96–105; echo train
length, 12–16; two signal averages; a 256 × 256 matrix; superior and inferior spatial
presaturation and chemically selective fat saturation; and a 7- to 8-mm thick slice with a
1- to 2-mm gap), 2) breath-hold T1-weighted fast multi-planar spoiled gradient recalled
echo (GRE) in-phase images (150–200/4.2–4.4) and 3) out-of-phase images (120–
180/1.5–2.2; 90° flip angle; one signal average; a 256 × 128 matrix; 8 mm thick slices,
zero gap; interleaved), and 4) breath-hold T2-weighted single-shot half-Fourier images
(single-shot FSE; effective TE, 180; a 256 × 160 matrix; and 8 mm-thick slices with a
2-mm gap).
For the MnDPDP-enhanced MRI, 5 µmol per kg of body weight (0.5 mL/kg;
maximum dose, 50 mL) of MnDPDP (Teslascan®, Amersham Health, Oslo, Norway)
was slowly administered intravenously by a hand injection over a 1- or 2-minute period,
which was followed by a flush of 10 mL normal saline. The breath-hold T1-weighted
spoiled GRE in-phase and out-of-phase images were obtained 15 minutes after the
intravenous injection of MnDPDP. Pre- and post-contrast pulse sequence parameters
were identical.

9
3. Image Analysis
For qualitative image analysis, two experienced radiologists jointly analyzed
matched unenhanced and MnDPDP-enhanced MR images. Radiologists recorded the
degree of the HCCs’ enhancement with respect to the adjacent hepatic parenchyma.
Relative signal intensity of HCCs compared with that of surrounding liver parenchyma
was recorded as one of four degrees: no gross enhancement, weak enhancement,
moderate enhancement (signal indicated a tumor of hepatocellular origin, but was not
equivalent to the adjacent hepatic parenchyma), strong enhancement (signal equivalent
to adjacent hepatic parenchyma).
For quantitative image analysis, measurement of the signal intensity of the lesions
was obtained using an operator-defined region of interest (ROI). The liver parenchyma
adjacent to the lesion was measured using an ROI that excluded artifacts and blood
vessels. Because the distance from the surface coil may affect measured values, the ROI
of the liver parenchyma adjacent to a hepatic lesion was located, so that the vertical
distances from the ventral side of the surface coils to the ROIs were the same. The
background noise was measured using the largest possible ROI located ventrally to the
patient’s abdomen in the direction of the phase-encoding gradient, in an area without
phase shift artifacts.
10
Signal-to-noise ratios (SNR) of the liver and the lesion on unenhanced and
MnDPDP-enhanced MR images were calculated with the following formulas:
SNR liver = signal intensity (SI) liver / standard deviation of background noise (NSD)
SNR tumor = SI tumor / NSD
The signal enhancement ratios of the tumor and that of the liver were calculated with
the following formula:
Signal enhancement ratio (%) = (SNR post – SNR pre) / (SNR pre) × 100
4. Pathologic Analysis
Whole specimens of HCCs were retrieved and all tissue sections were fixed in 10%
buffered formaldehyde solution and paraffinized. An effort was made to perform the
pathology inspection in the same area where the MRI analysis was carried out.
According to the general rules for the study of primary liver cancer by the KOREAN
LIVER CANCER STUDY GROUP, the histopathologic factors making influence on
MnDPDP uptake were assessed for each tumor; these factors included the nuclear grade,
size of the tumor, growth type, histologic type, cell type, the cell density ratio of the
tumor to the adjacent parenchyma, the percentage of the immunopositive areas on
immunostaining for monoclonal hepatocyte antibody (hepatocyte paraffin 1, Hep Par 1),
11
cytokeratin 7 (CK 7), and cytokeratin 19 (CK 19).
Using the basic hematoxylin-eosin (H&E) technique, tumor grade of the HCCs
was classified according to the nuclear grading scheme by Edmondson-Steiner, as I, I+II,
II, II+III, III, III+IV, and IV. We also defined grades I, I+II, and II as being well
differentiated, grades II+III and III as moderately differentiated, and grade III+IV and
IV as poorly differentiated. Tumor size was defined as the largest diameter of the tumor
specimen. The growth type was defined as either nodular expanding, nodular with
perinodular growth, multinodular-confluent, or infiltrative; histologic type was defined
as either trabecular, pseudoglandular, compact, or scirrhous; cell type was defined as
hepatic, clear, giant, or spindle. The encapsulation was defined as absence, partial, or
complete.
Image Pro Plus 4.0 (Media Cybernetics Inc. Silver Spring, USA) software was
used for image acquisition and for the counting of cell density. Three random areas were
selected from each tumor and from surrounding non-neoplastic liver tissue in high-
power fields (×200). Then, individual nuclei were counted per 120000 ㎛2 using tools
provided by Image Pro. Cell density ratio was calculated with the following formula:
Cell density ratio = mean cell density tumor / mean cell density liver
Immunohistochemical staining was carried out for Hep Par 1 and biliary markers,
12
CK7 and CK19. A commercially available monoclonal antibody, Hep Par 1 (DAKO,
Glostrup, Denmark), was used at a dilution of 1:25. The monoclonal antibodies CK7
(DAKO, Glostrup, Denmark) and CK19 (DAKO, Glostrup, Denmark) were used at
dilutions of 1:50. Immunoreactivity was quantitated as the percent of area positive for
each marker. Immunohistochemical reactivity was also semiquantitatively classified
into four categories; - <5%, + 5–10%, ++ 10–50%, and +++ >50% of tumor cells.
5. Statistics
All collected data were analyzed using the statistical program, SPSS (version 12.0
for Windows). For statistical analysis, a chi-square test was used for nominal variables
and the Kruskal-Wallis test for continuous variables to compare MnDPDP enhancement
with the various histopathologic factors. The post hoc Dunnett’s t-test was used to
determine statistically significant differences between MnDPDP enhancement groups.
All p values were two-tailed and, when less than 0.05, were considered to indicate a
statistically significant difference.
13
III. Results
1. Qualitative and quantitative enhancement of MnDPDP
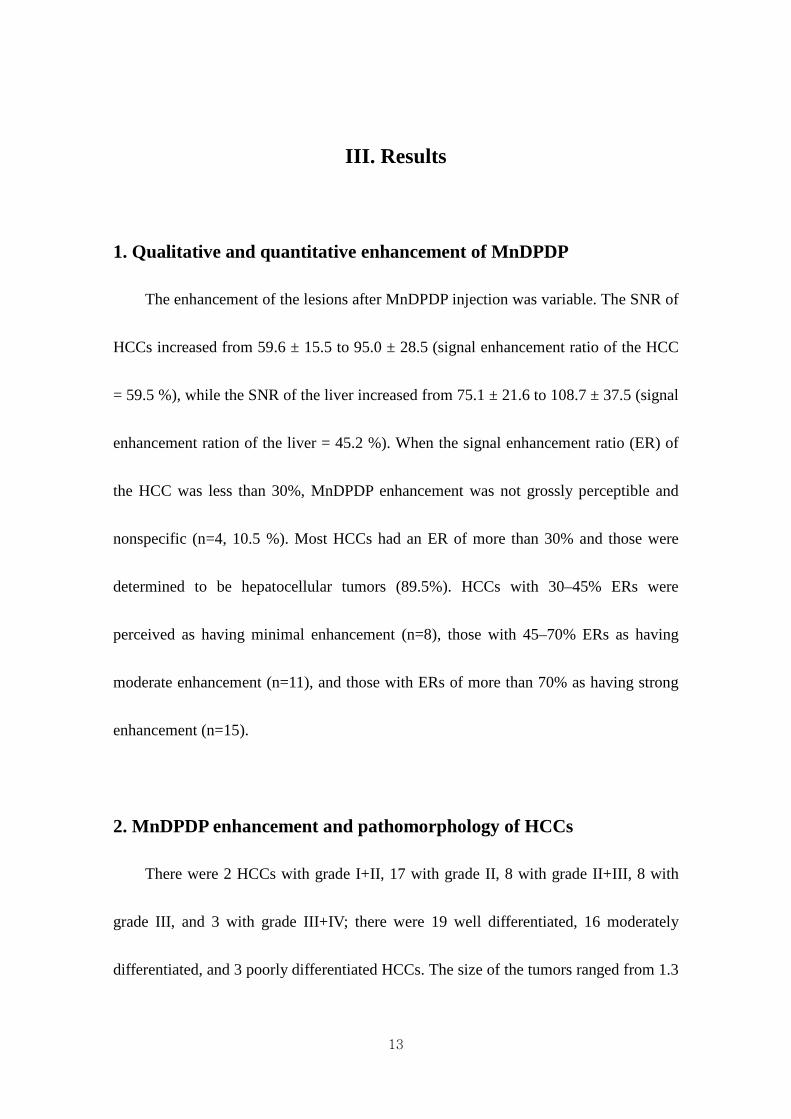
The enhancement of the lesions after MnDPDP injection was variable. The SNR of
HCCs increased from 59.6 ± 15.5 to 95.0 ± 28.5 (signal enhancement ratio of the HCC
= 59.5 %), while the SNR of the liver increased from 75.1 ± 21.6 to 108.7 ± 37.5 (signal
enhancement ration of the liver = 45.2 %). When the signal enhancement ratio (ER) of
the HCC was less than 30%, MnDPDP enhancement was not grossly perceptible and
nonspecific (n=4, 10.5 %). Most HCCs had an ER of more than 30% and those were
determined to be hepatocellular tumors (89.5%). HCCs with 30–45% ERs were
perceived as having minimal enhancement (n=8), those with 45–70% ERs as having
moderate enhancement (n=11), and those with ERs of more than 70% as having strong
enhancement (n=15).
2. MnDPDP enhancement and pathomorphology of HCCs
There were 2 HCCs with grade I+II, 17 with grade II, 8 with grade II+III, 8 with
grade III, and 3 with grade III+IV; there were 19 well differentiated, 16 moderately
differentiated, and 3 poorly differentiated HCCs. The size of the tumors ranged from 1.3
14
to 11.0 cm (mean, 4.6 cm). Sixteen HCCs had nodular expanding growth patterns, 8
were of the nodular type with perinodular growth, and 14 were of the multinodular-
confluent type. The histologic types consisted of 18 trabecular, 2 pseudoglandular, 1
compact, 2 scirrhous, and 15 mixed types (6 trabecular and pseudoglandular, 5
trabecular and compact, 2 trabecular and scirrhous, 2 trabecular, pseudoglandular and
compact). The cell types consisted of 27 hepatic, 3 clear, and 8 mixed types (5 hepatic
and clear, 2 hepatic and giant, and 1 hepatic and spindle). There were no pseudocapsules
in 8 HCCs, partial pseudocapsules in 15 HCCs, and complete pseudocapsules in 15
HCCs.
Nodular expanding HCCs and nodular HCCs with perinodular growth tended to
show stronger enhancement than multinodular confluent HCCs, but the differences were
statistically insignificant. As far as histologic type, trabecular, the most common
histologic type, showed variable MnDPDP enhancements. Compact or scirrhous
histologic type HCCs showed no or minimal enhancement, but results were not
statistically significant because of the small number of cases. There were no significant
correlations between the degree of MnDPDP enhancement and tumor size, the presence
of the capsule, or cell type.
15
3. MnDPDP enhancement and the histologic grades
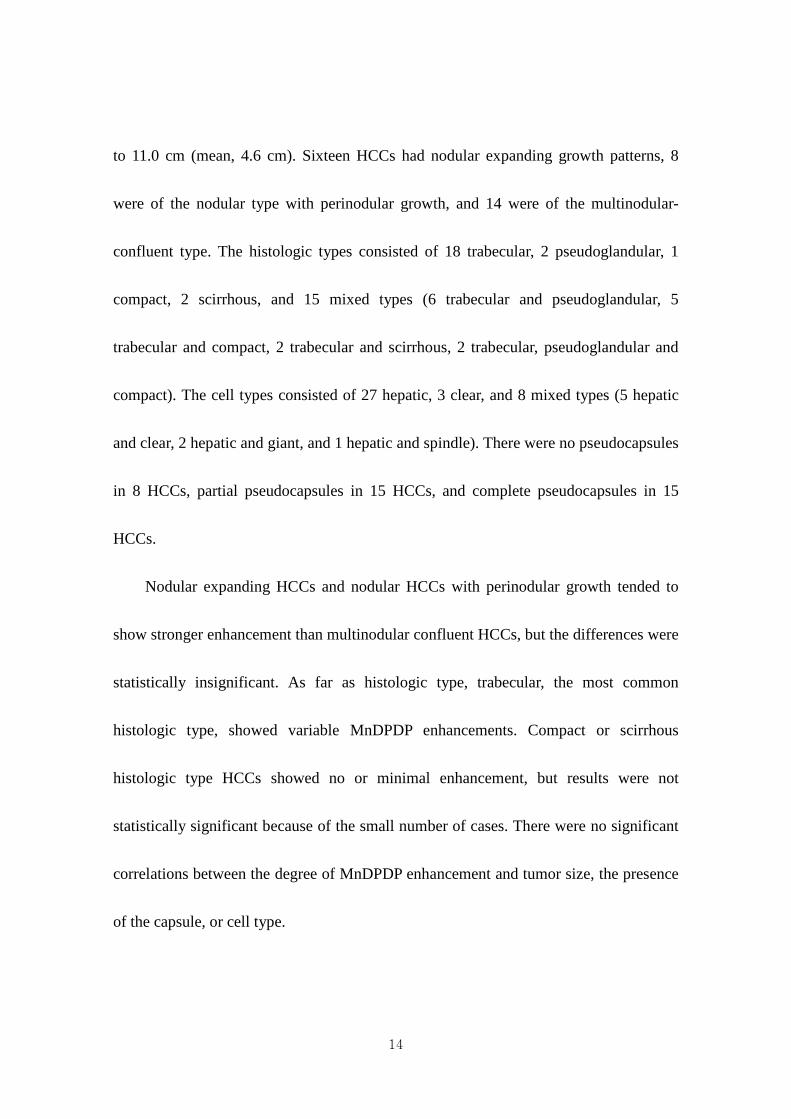
The relationship between the degree of MnDPDP enhancement and histologic
grade is shown in Table 1. In cases of the same histologic grade, HCCs showed various
degrees of MnDPDP enhancement from no enhancement to strong enhancement for
each grade (Figure 1–4). There was no significant correlation between the degree of
MnDPDP enhancement and the histologic grade of tumors in our study (p = 0.156).
Table 1. Relationship between the degree of MnDPDP enhancement and histologic
grade of HCC.
Histologic Grade MnDPDP
enhancement G I+II G II G II+III G III G III+IV
No 1 1 1 1
Minimal 1 4 2 1
Moderate 1 2 2 5 1
Strong 10 3 1 1
16
17
18

19
20
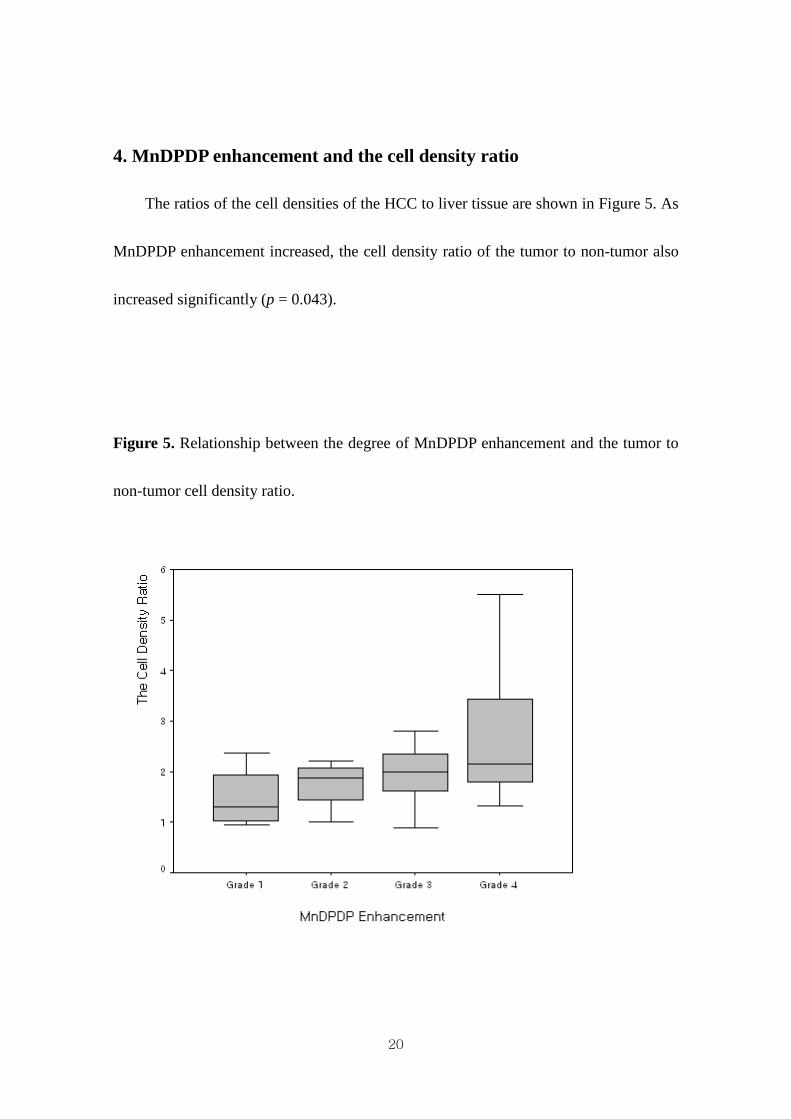
4. MnDPDP enhancement and the cell density ratio
The ratios of the cell densities of the HCC to liver tissue are shown in Figure 5. As
MnDPDP enhancement increased, the cell density ratio of the tumor to non-tumor also
increased significantly (p = 0.043).
Figure 5. Relationship between the degree of MnDPDP enhancement and the tumor to
non-tumor cell density ratio.
21
5. MnDPDP enhancement and immunohistologic evaluation
The relationship between the degree of MnDPDP enhancement and Hep Par 1
positivity is shown in Table 2. There were 6 cases of Hep Par 1 negativity (15.8%). Half
of the HCCs had strong positivity on immunohistochemical staining for Hep Par 1.
There was strong correlation between the degree of MnDPDP enhancement and Hep Par
1 positivity (p < .001) (Figures 1–4). The relationships between degree of MnDPDP
enhancement and positivities of biliary markers are shown in Table 3. CK7 was positive
in 12 HCCs (31.6%) and CK19 was positive in 7 HCCs (18.4%). The correlation
between the degree of MnDPDP enhancement and CK7 or CK19 positivity was not
significantly positive or negative.

22
Table 2. Relationship between the degree of MnDPDP enhancement and the Hep Par 1
positivity of HCCs.
Hep Par 1 MnDPDP
enhancement (-) (+) (++) (+++)
No 3 1
Minimal 1 3 4
Moderate 1 1 3 6
Strong 1 1 13
Table 3. Relationship between the degree of MnDPDP enhancement and the CK7/CK19
positivity of HCCs.
CK7 or CK19 MnDPDP
enhancement (-) (+) (++) (+++)
No 4
Minimal 3 2 2 1
Moderate 7 0 2 2
Strong 10 1 2 2
23
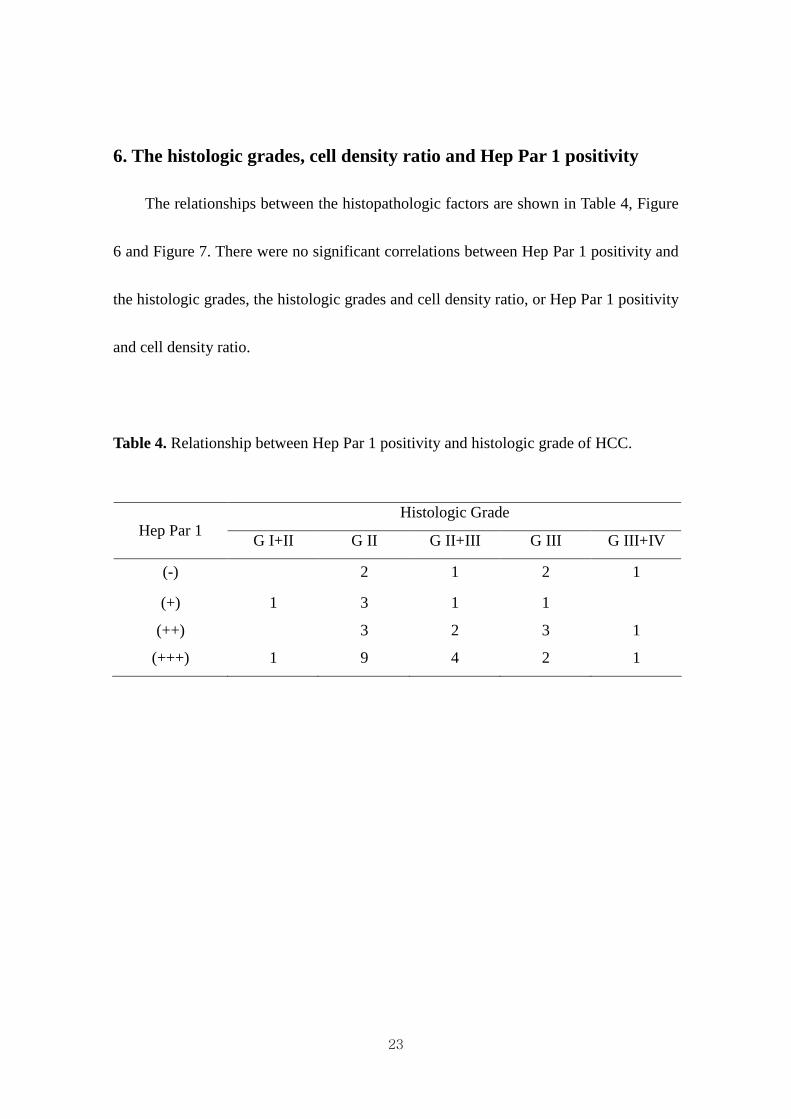
6. The histologic grades, cell density ratio and Hep Par 1 positivity
The relationships between the histopathologic factors are shown in Table 4, Figure
6 and Figure 7. There were no significant correlations between Hep Par 1 positivity and
the histologic grades, the histologic grades and cell density ratio, or Hep Par 1 positivity
and cell density ratio.
Table 4. Relationship between Hep Par 1 positivity and histologic grade of HCC.
Histologic Grade Hep Par 1
G I+II G II G II+III G III G III+IV
(-) 2 1 2 1
(+) 1 3 1 1
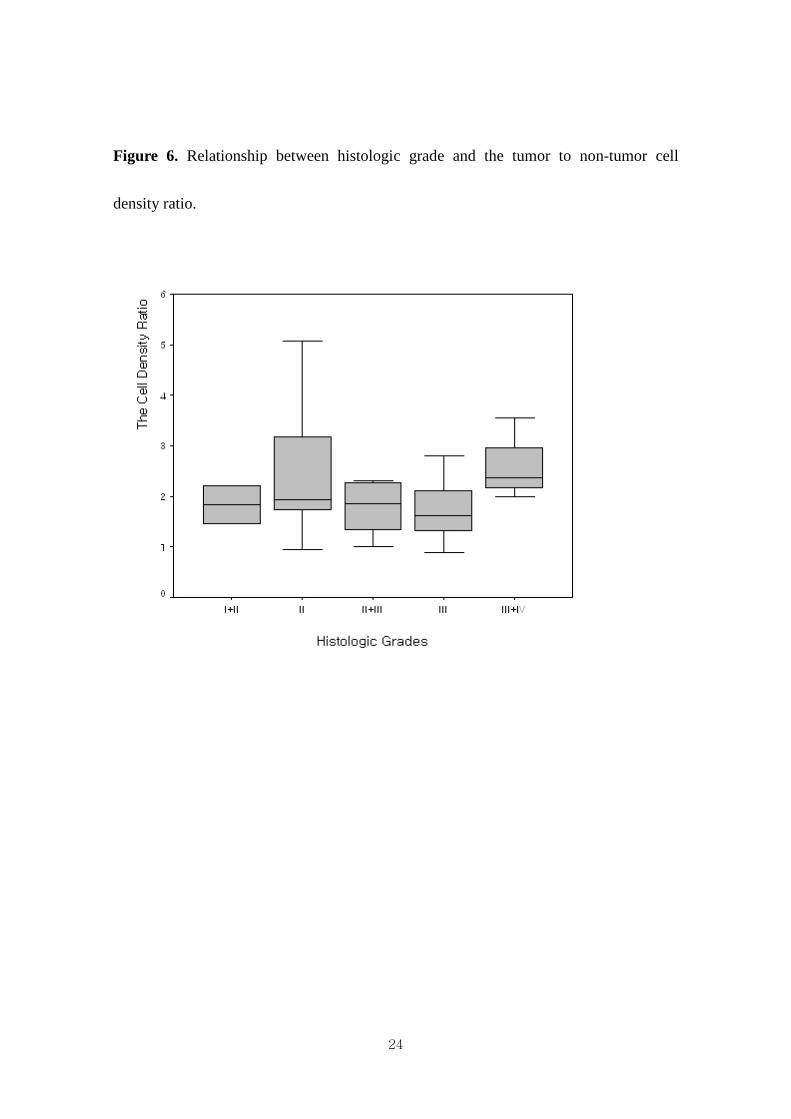
(++) 3 2 3 1
(+++) 1 9 4 2 1
24
Figure 6. Relationship between histologic grade and the tumor to non-tumor cell
density ratio.
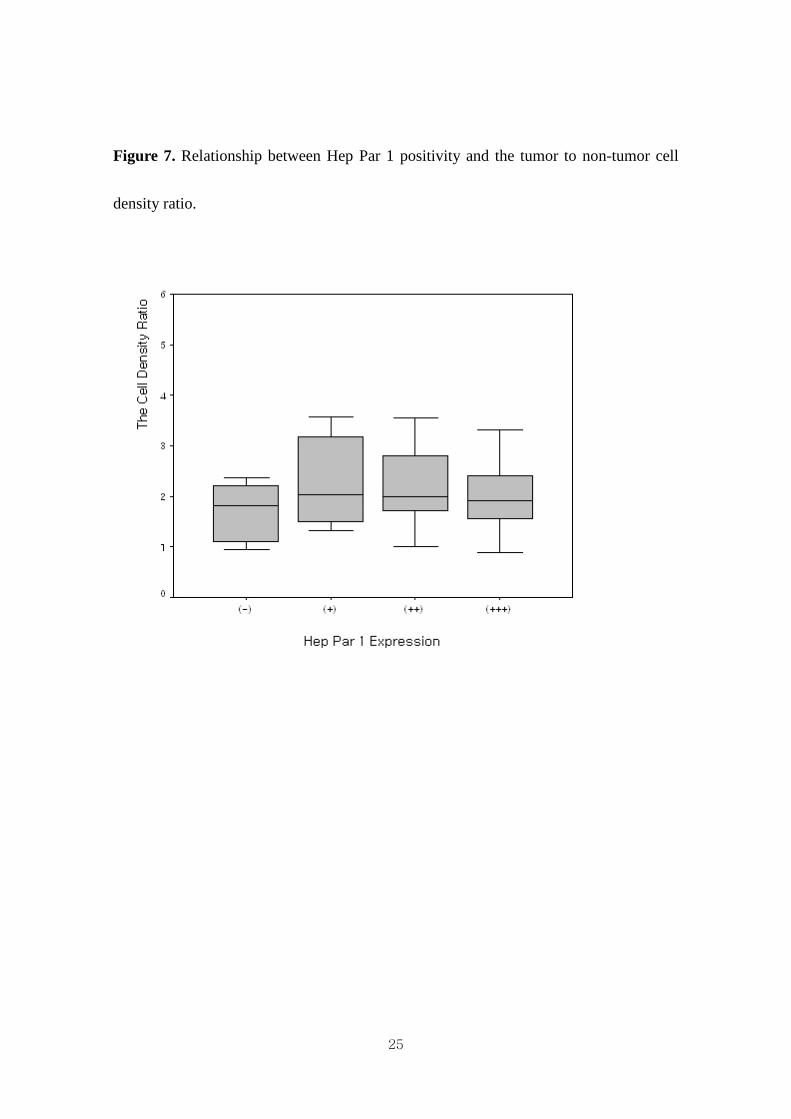
25
Figure 7. Relationship between Hep Par 1 positivity and the tumor to non-tumor cell
density ratio.
26
IV. Discussions
MnDPDP is a manganese chelate derived from vitamin B6. Its full chemical name
is Mn (II)-N,N’-dipyridoxalethylenediamine-N,N’-diacetate-5,5’-bis(phosphate) and its
molecular formula is Cl2H27MnN4Na3O14P2. The active ingredient in MnDPDP is Mn
dipyridoxyl diphosphate, a metal chelate of Mn with two linked pyridoxal 5’-phosphate
groups. The ligand pyridoxal 5’-phosphate is a catalytically active form of vitamin B6.
The mechanisms of the intracellular uptake of MnDPDP in the liver still remain
unknown. Initially, it was suggested that MnDPDP associated with the pyridoxine
complex and that uptake was mediated by the pyridoxine transporter, but this assertion
was refuted by Gallez et al15. Two hypothetical mechanisms of uptake of the complex
are following: passive diffusion of free Mn++ through the membrane or nonspecific
uptake by an anion transporter.
Despite being called a “liver-specific” contrast agents, MnDPDP is not entirely
specific to liver cells. Enhancement of other organs such as the pancreas, the renal
cortex, and adrenal glands has been observed16-18, which are known as mitochondria-
rich tissues. This may be related to their active functional status and their capacity for
manganese uptake. Some authors reported that uptake of MnDPDP might even be seen
27
in cases of liver metastases from endocrine tumors19, 20. These uptakes of MnDPDP
could also be explained by the functional status of endocrine cells, which are
characterized by the presence of numerous mitochondria.
The relationship between the degree of MnDPDP uptake and the nuclear grades of
HCCs has been a controversial issue. In the present study, the MnDPDP uptake into
HCCs was variable even in HCCs of the same histologic grades and no correlation
could be found. On the other hand, the uptake of MnDPDP was strongly correlated with
hepatocyte antibody expression. Hep Par 1 is a monoclonal antibody developed using
tissue from a failed formalin-fixed allograft liver21. The stain has a characteristically
coarse granular quality and is negative in the bile duct and stromal cells. The granular
intracytoplasmic staining pattern suggests organelle localization, possibly mitochondrial,
but the target antigen remains unknown. It reacts to an as yet unidentified cytoplasmic
marker of normal and neoplastic hepatocytes. Initial reports have shown that Hep Par 1
is a highly sensitive and reasonably specific marker of hepatocellular differentiation21-23.
However, Hep Par 1 expression may be very heterogeneous and is often present in other
nonhepatic malignant tumors such as gastrointestinal adenocarinomas, cervix
adenocarinomas, malignant melanomas, neuroendocrine tumors and some lung cancers
24-27.
28
The relationship between Hep Par 1 positivity and HCC differentiation is unclear
because approximately 10–20% of HCC cases are reportedly negative for Hep Par 128.
Recently, Chu et al27 reported that the level of Hep expression in HCCs corresponded to
the nuclear grades and growth patters: expression in 92% of HCCs, including 100% of
nuclear grade 1 and 2 tumors, 84% of nuclear grade 3 tumors, and 50% of nuclear grade
4 tumors. In HCCs with a compact growth pattern, the Hep sensitivity was 81%,
whereas the sensitivity was 98% in HCCs with a trabecular, pseudoglandular, or
scirrhous growth pattern. In another study by Kumagai et al29, well-differentiated and
trabecular type HCC areas showed stronger positivity of Hep Par 1 than poorly
differentiated or undifferentiated areas. In the present study, there were 6 Hep Par 1
negative HCCs and they showed variable nuclear grades and histologic types; there
were 2 grade II trabecular HCCs, one grade II+III scirrhous HCC, one grade III
trabecular HCC, one grade III mixed HCC, and one grade III+IV compact HCC. The
nuclear grades did not correlate with MnDPDP uptake or Hep Par 1 expression in this
study.
The mechanisms of MnDPDP uptake and Hep Par 1 expression have some
commonalities. First, both are specific to normal hepatocytes and hepatocyte-derived
tumors. Second, they are also positive in non-hepatic tumors such as endocrine tumors,
29
with even lower sensitivity and specificity. Third, mitochondria may play an important
role in MnDPDP uptake and Hep Par 1 positivity. At any rate, the clinical significance
of Hep Par 1 expression in HCC should be further investigated, at this would expand the
clinical role of MnDPDP in HCC cases.
The present study showed that the cellularity reflected by the tumor to non-tumor
cell density ratio was also associated with the degree of MnDPDP uptake in the HCCs.
Cell density was described by the International Working Party30 as useful in
distinguishing high-grade dysplastic nodules from HCC. In well-differentiated HCC, a
marked increase of cell density accompanied by a decreased cell size and an increased
nuclear cytoplasm ratio are prominent. Kojiro M31 observed that the nuclear/cytoplasm
ratio increases in well-differentiated HCCs, was almost equal to that of a normal
hepatocyte in moderately differentiated HCCs, and then increased again in poorly
differentiated HCCs because of reduced cytoplasm. In this study, two peaks of cell
density were seen in grade II and grade III+ IV HCCs, and there was a tendency
towards high MnDPDP enhancement in grade II HCCs. However, a high nuclear-
cytoplasmic ratio with a nuclear density greater than twice the normal density was one
of the criteria in favor of HCC, but the cell density itself did not influence the
determination of nuclear differentiation within cases of HCCs. Nonetheless, the high
30
cell density in HCC may reflect rapidly proliferative lesions, even in lesions showing
grossly the same nuclear grade. Also, cell density may increases in cases of HCC of the
small cell type with progenitor cell features which are relatively poorly differentiated.
This will be discussed later.
We investigated the expression of CK7 and CK 19, two markers of biliary
differentiation, which are expressed in the bile duct. Osborn et al32 and Fischer et al33
have reported that hepatocellular carcinoma cells express CK8 and CK 18, but not CK7
or CK19. However, there have been several reports describing the expression of CK17
and CK19 in hepatocellular carcinoma. HCCs with positive biliary markers showed
features of more aggressive disease and poorer prognosis compared with HCCs without
biliary markers34-37. Recently, hepatic progenitor cells have been reported to be strongly
immunoreactive for CK7 and CK19, and intermediate hepatocyte-like cells
immunoreactive for CK738.
There is increasing evidence that stem cells of the liver and the two major cell
types, hepatocytes and biliary epithelial cells, are believed to originate from the same
progenitor cells. Since progenitor cells can differentiate into both hepatocytes and
biliary epithelial cells, progenitor cells can express both hepatocyte differentiation
markers and biliary differentiation markers. Primary liver carcinoma of an intermediate
31
(hepatocyte-bile duct cell) phenotype, named intermediate carcinoma, has been
reported: it consists of small cells with a phenotype intermediate between hepatocytes
and cholangiocytes, and simultaneously expresses hepatocyte and biliary markers39, 40. A
small cell type HCC with progenitor cell features has been also described40. The small
cell type HCC is predominantly composed of small neoplastic cells with slightly more
abundant eosinophilic cytoplasm than in the intermediate carcinomas but less than in
typical HCCs. These two kinds of carcinomas which arise from hepatic progenitor cells
are composed of small, oval shaped cells with relatively compact cellularity and a high
nucleus to cytoplasm ratio41. Therefore, it was expected that these carcinomas might
influence the degree of MnDPDP enhancement because of their high cellular density.
However, immunostaining for Hep Par 1 demonstrated a positive staining of HCC cells
while demonstrating a negative staining of small cells, and there were no positive or
negative correlations between the degree of MnDPDP enhancement and biliary marker
positivity. Therefore, increased cell density caused by small cell features does not seem
to result in increased MnDPDP enhancement.
This study has limitations. First, complete slice by slice pathologic-imaging
matching was not technically feasible. Thus, varieties of histopathologic characteristics
in a single tumor nodule could not be evaluated and so the most representative
32
characteristics of each tumor were used. Second, despite the best efforts to include a
wide variety of HCC histopathologic types, it was not feasible to include all growth and
cell types and both ends of the nuclear grade. However, the histopathologic types
included a range of surgically proven materials sufficiently large to produce results with
statistical significance.
33
V. Conclusion
In conclusion, this study shows that the degree of MnDPDP enhancement was
strongly correlated with hepatocyte monoclonal antibody expression and tumor to non-
tumor cellular density ratio, but it was not related to biliary markers. In this study, no
significant correlation was seen between the uptake of MnDPDP and nuclear grade.
34
V. References
1. Semelka RC, Martin DR, Balci C, Lance T. Focal liver lesions: comparison of dual-
phase CT and multisequence multiplanar MR imaging including dynamic gadolinium
enhancement. J Magn Reson Imaging 2001;13:397-401.
2. Elizondo G, Fretz CJ, Stark DD, Rocklage SM, Quay SC, Worah D, et al. Preclinical
evaluation of MnDPDP: new paramagnetic hepatobiliary contrast agent for MR imaging.
Radiology 1991;178:73-78.
3. Balci NC, Semelka RC. Contrast agents for MR imaging of the liver. Radiol Clin North
Am 2005;43:887-898.
4. Hamm B, Vogl TJ, Branding G, Schnell B, Taupitz M, Wolf KJ, et al. Focal liver
lesions: MR imaging with Mn-DPDP – Initial clinical results in 40 patients. Radiology
1992;182:167-174.
5. Sahani DV, O'Malley ME, Bhat S, Hahn PF, Saini S. Contrast-enhanced MRI of the
liver with mangafodipir trisodium: imaging technique and results. J Comput Assist
Tomogr 2002;26:216-222.
6. Helmberger TK, Laubenberger J, Rummeny E, Jung G, Sievers K, Dohring W, et al.
MRI characteristics in focal hepatic disease before and after administration of
MnDPDP: discriminant analysis as a diagnostic tool. Eur Radiol 2002;12:62-70.
7. Kim MJ, Kim JH, Lim JS, Oh YT, Chung JJ, Choi JS, et al. Detection and
characterization of focal hepatic lesions: mangafodipir vs. superparamagnetic iron
oxide-enhanced magnetic resonance imaging. J Magn Reson Imaging 2004;20:612-621.
8. Rofsky NM, Weinreb JC, Bernardino ME, Young SW, Lee JK, Noz ME. Hepatocellular
tumors: characterization with Mn-DPDP-enhanced MR imaging. Radiology
35
1993;188:53-59.
9. Liou J, Lee JK, Borrello JA, Brown JJ. Differentiation of hepatomas from
nonhepatomatous masses: use of MnDPDP-enhanced MR images. Magn Reson
Imaging 1994;12:71-79.
10. Coffin CM, Diche T, Mahfouz A, Alexandre M, Caseiro-Alves F, Rahmouni A, et al.
Benign and malignant hepatocellular tumors: evaluation of tumoral enhancement after
mangafodipir trisodium injection on MR imaging. Eur Radiol 1999;9:444-449.
11. Oudkerk M, Torres CG, Song B, Konig M, Grimm J, Fernandez-Cuadrado J, et al.
Characterization of liver lesions with mangafodipir trisodium-enhanced MR imaging:
multicenter study comparing MR and dual-phase spiral CT. Radiology 2002;223:517-
524.
12. Ni Y, Marchal G, Zhang X, Van Hecke P, Michiels J, Yu J, et al. The uptake of
manganese dipyridoxal-diphosphate by chemically induced hepatocellular carcinoma in
rats. A correlation between contrast-media-enhanced magnetic resonance imaging,
tumor differentiation, and vascularization. Invest Radiol 1993;28:520-528.
13. Murakami T, Baron RL, Peterson MS, Oliver JH 3rd, Davis PL, Confer SR, et al.
Hepatocellular carcinoma: MR imaging with mangafodipir trisodium (Mn-DPDP).
Radiology 1996;200:69-77.
14. Scharitzer M, Schima W, Schober E, Reimer P, Helmberger TK, Holzknecht N, et al.
Characterization of hepatocellular tumors: value of mangafodipir-enhanced magnetic
resonance imaging. J Comput Assist Tomogr 2005;29:181-190.
15. Gallez B, Baudelet C, Adline J, Charbon V, Lambert DM. The uptake of Mn-DPDP by
hepatocytes is not mediated by the facilitated transport of pyridoxine. Magn Reson
Imaging 1996;14:1191-1195.
36
16. Wang, C. Mangafodipir trisodium (MnDPDP)-enhanced magnetic resonance imaging of
the liver and pancreas. Acta Radiol Suppl 1998;415:1-31.
17. Mitchell DG, Outwater EK, Matteucci T, Rubin DL, Chezmar JL, Saini S. Adrenal
gland enhancement at MR imaging with Mn-DPDP. Radiology, 1995 194:783-787.
18. Hustvedt SO, Grant D, Southon TE, Zech K. Plasma pharmacokinetics, tissue
distribution and excretion of MnDPDP in the rat and dog after intravenous
administration. Acta Radiol 1997;38:690-699.
19. Wang C, Ahlstrom H, Eriksson B, Lonnemark M, McGill S, Hemmingsson A. Uptake
of mangafodipir trisodium in liver metastases from endocrine tumors. J Magn Reson
Imaging 1998;8:682-686.
20. Mathieu D, Coffin C, Kobeiter H, Caseiro-Alves F, Mahfouz A, Rahmouni A, et al.
Unexpected MR-T1 enhancement of endocrine liver metastases with mangafodipir. J
Magn Reson Imaging 1999;10:193-195.
21. Wennerberg AE, Nalesnik MA, Coleman WB. Hepatocyte paraffin 1: a monoclonal
antibody that reacts with hepatocytes and can be used for differential diagnosis of
hepatic tumors. Am J Pathol 1993;143:1050-1054.
22. Leong AS, Sormunen RT, Tsui WM, Liew CT. Hep Par 1 and selected antibodies in the
immunohistological distinction of hepatocellular carcinoma from cholangiocarcinoma,
combined tumours and metastatic carcinoma. Histopathology 1998;33:318-324.
23. Zimmerman RL, Burke MA, Young NA, Solomides CC, Bibbo M. Diagnostic value of
hepatocyte paraffin 1 antibody to discriminate hepatocellular carcinoma from metastatic
carcinoma in fine-needle aspiration biopsies of the liver. Cancer 2001;93:288-291.
24. Lugli A, Tornillo L, Mirlacher M, Bundi M, Sauter G, Terracciano LM. Hepatocyte
paraffin 1 expression in human normal and neoplastic tissues: tissue microarray analysis
37
on 3,940 tissue samples. Am J Clin Pathol 2004;122:721-727.
25. Villari D, Caruso R, Grosso M, Vitarelli E, Righi M, Barresi G. Hep Par 1 in gastric and
bowel carcinomas: an immunohistochemical study. Pathology 2002;34:423-426.
26. Fan Z, van de Rijn M, Montgomery K, Rouse RV. Hep par 1 antibody stain for the
differential diagnosis of hepatocellular carcinoma: 676 tumors tested using tissue
microarrays and conventional tissue sections. Mod Pathol 2003;16:137-144.
27. Chu PG, Ishizawa S, Wu E, Weiss LM. Hepatocyte antigen as a marker of hepatocellular
carcinoma: an immunohistochemical comparison to carcinoembryonic antigen, CD10,
and alpha-fetoprotein. Am J Surg Pathol 2002;26:978-988.
28. Minervini MI, Demetris AJ, Lee RG, Carr BI, Madariaga J, Nalesnik MA. Utilization of
hepatocyte-specific antibody in the immunocytochemical evaluation of liver tumors.
Mod Pathol 1997;10:686-692.
29. Kumagai I, Masuda T, Sato S, Ishikawa K. Immunoreactivity to monoclonal antibody,
Hep Par 1, in human hepatocellular carcinomas according to histopathological grade
and histological pattern. Hepatol Res 2001;20:312-319.
30. Terminology of nodular hepatocellular lesions. International Working Party. Hepatology
1995;22:983-993.
31. Kojiro M. Histopathology of liver cancers. Best Pract Res Clin Gastroenterol
2005;19:39-62.
32. Osborn M, van Lessen G, Weber K, Kloppel G, Altmannsberger M. Differential
diagnosis of gastrointestinal carcinomas by using monoclonal antibodies specific for
individual keratin polypeptides. Lab Invest 1986;55:497-504.
33. Fischer HP, Altmannsberger M, Weber K, Osborn M. Keratin polypeptides in malignant
epithelial liver tumors. Differential diagnostic and histogenetic aspects. Am J Pathol

38
1987;127:530-537.
34. Van Eyken P, Sciot R, Paterson A, Callea F, Kew MC, Desmet VJ. Cytokeratin
expression in hepatocellular carcinoma: an immunohistochemical study. Hum Pathol
1988;19:562-568.
35. Wu PC, Fang JW, Lau VK, Lai CL, Lo CK, Lau JY. Classification of hepatocellular
carcinoma according to hepatocellular and biliary differentiation markers. Clinical and
biological implications. Am J Pathol 1996;149:1167-1175.
36. Uenishi T, Kubo S, Yamamoto T, Shuto T, Ogawa M, Tanaka H, et al. Cytokeratin 19
expression in hepatocellular carcinoma predicts early postoperative recurrence. Cancer
Sci 2003;94:851-857.
37. Ding SJ, Li Y, Tan YX, Jiang MR, Tian B, Liu YK, et al. From proteomic analysis to
clinical significance: overexpression of cytokeratin 19 correlates with hepatocellular
carcinoma metastasis. Mol Cell Proteomics 2004;3:73-81.
38. Libbrecht L, Roskams T. Hepatic progenitor cells in human liver diseases. Semin Cell
Dev Biol 2002;13:389-396.
39. Robrechts C, De Vos R, Van den Heuvel M, Van Cutsem E, Van Damme B, Desmet V,
et al. Primary liver tumour of intermediate (hepatocyte-bile duct cell) phenotype: a
progenitor cell tumour? Liver 1998;18:288-293.
40. Kim H, Park C, Han KH, Choi J, Kim YB, Kim JK, et al. Primary liver carcinoma of
intermediate (hepatocyte-cholangiocyte) phenotype. J Hepatol 2004;40:298-304.
41. Xiao JC, Jin XL, Ruck P, Adam A, Kaiserling E. Hepatic progenitor cells in human liver
cirrhosis: immunohistochemical, electron microscopic and immunofluorencence
confocal microscopic findings. World J Gastroenterol 2004;10:1208-1211.
39
ABSTRACT (in Korean)
간세포암의간세포암의간세포암의간세포암의 Mangafodipir trisodium 조영증강조영증강조영증강조영증강 자기공명자기공명자기공명자기공명 영상영상영상영상:
병리학적병리학적병리학적병리학적 특징과의특징과의특징과의특징과의 비교비교비교비교
지도교수지도교수지도교수지도교수 김김김김 명명명명 진진진진
연세대학교연세대학교연세대학교연세대학교 대학원대학원대학원대학원 의학과의학과의학과의학과
김김김김 주주주주 희희희희
Mangafodipir disodium (MnDPDP)는 간세포 특이 조영제로서, 정상 간세포뿐 아니
라 종양 간세포에도 섭취되어, 간세포기원 종양의 감별에 이용되고 있다. 이러한
MnDPDP을 이용한 자기공명 영상에서는 간세포암에 다양한 조영증강을 보이고 있
는데, 이러한 차이를 보이는 병리학적 특성이 아직 밝혀지지 않았다. 본 연구의 목
적은 간세포암종의 자기공명 영상에서 MnDPDP의 섭취 정도와 관련 있는 조직병리
학적 요인을 알아보고자 하였다.
수술전에 MnDPDP 조영증강 MRI를 시행한 37명의 38개 간세포암을 대상으로
하였다. 이들에서 조영전 및 MnDPDP 주입하고 15-30분 후에 동위상 및 탈위상의
경사에코영상을 획득하였다. 조영증강 정도의 주관적 rating, MnDPDP 조영증강 전후
40
의 병변-간의 신호대잡음비, 신호 조영증강비 (%) 등을 조직병리학적 인자, 즉 핵분
화도, 종양크기, 성장 유형, 조직학적 유형, 세포 유형, 종양 대 주변조직의 세포밀
도비 (세포조밀도) 및 단일클론 간세포항체 (Hep Par 1), 싸이토케라틴 7 (CK7), 싸이
토케라틴 19 (CK19) 등의 면역염색 양성비율 등과 비교하였다.
조영전 자기공명영상과 비교하여 MnDPDP 자기공명영상에서는, 간세포암의 평
균 신호강도가 59.6에서 95.0 (조영증강비 = 59.5%)로 증가하였고, 간실질은 평균
75.1에서 108.7 (조영증강비 = 45.2%)로 증가하였다. 35개의 간세포암 중, 8개에서 약
한 조영증강을, 11개에서 중등도의 조영증강을, 15개에서 강한 조영증강을 보였다.
나머지 4개의 간세포암에서는 육안적으로 식별가능한 정도의 조영증강이 없었다
(10.3%). MnDPDP 조영증강이 증가함에 따라 세포밀도비도 증가하였다 (p < 0.05). 또
한 MnDPDPD 조영증강 정도와 Hep Par 1 양성도 간에 강한 연관성이 있었다 (p <
0.001). MnDPDP 조영증강 정도와 세포분화도, 크기, 성장 유형, 피막의 존재유무, 조
직학적 유형, CK7 및 CK19과는 연관관계가 없었다.
결론적으로 간세포암의 초기지연 섭취는 간세포항체 표현 및 세포밀도와 관련
이 있었다. 간세포암의 조직학적 분화도는 MnDPDP 조영증강 정도와 직접적인 연
관성이 없었다.
핵심되는 말: 간세포암간세포암간세포암간세포암, 자기공명자기공명자기공명자기공명 영상영상영상영상, 자기공명자기공명자기공명자기공명 조영제조영제조영제조영제