manganese nutrition status and resistance in barley ...€¦ · 29'l,ot ers/ manganese...
TRANSCRIPT
29'l,ot
ERS/
Manganese nutrition status and resistance in barley (Hordeum vulgüre L.)
to take-all (Gøeumilnnomyces grøminr's var. rrilicl
Julia M Lloyd
BSc. (Hons)
Flinders University, South Australia
Thesis submitted to Adelaide University for the degree of Doctor of Philosophy
Department of Plant Science
Waite Agricultural Research Institute
Adelaide University
South Australia
July, 2000
by

Declaration
This thesis contains no material which has been accepted for the award of any other degree or
diploma in any other university, and to the best of my knowledge and belief, contains no
material previously published or written by any other person, except where due reference has
been made in the text.
I give consent to the librarian of the Ban-Smith Library, Adelaide University, or his/her
appointed agent to make this thesis freely available for photocopying or loan.
Julia M. Lloyd Date rllTlrn

rl
Acknowledgements
Ms T Fowles, Mr N Robinson and Mr L Palmer for the ICPAES analysis, Dr P
Harvey (CSIRO) for providing the Ggl isolate 17916, Dr P Davies (SARDI) who generated
the doubled haploid population, Dr J Ascher (Adelaide University) and Dr M Ryder (CSIRO)
for additional advice on Ggt,Dr H Wallwork and Mr M Butt (SARDI) for the outdoor take-
all screen, and Dr Kath Cooper (Adelaide University) for the use of her triticale Ggl screen
results. In addition, I would like to thank Ms M Pallotta for providing the seeds, the initial
genetic linkage mapping of the 4HS Mn effrciency locus and the identification of the RFLP
markers which co-segregate with the Mn effrciency trait, and with Ms A M'Casland-Pexton'
for construction of the DH mapping population partial map and help in DNA extraction,
digestion, electrophoresis and Southern transfer. Professor P Langridge provided the RFLP
markers and checked drafts of chapter 6 (Adelaide University). Advice on statistical analysis
was obtained from Ms R Middleberg, (Adelaide University), and Ms M Lorimer and Ms H
Oakley (BiometricsSA.). I would also like to thank Dr J Stangoulis for help in the
determination of the Mn critical levels. Dr M Wallwork (SARDI) gave excellent help with the
light and UV fluorescent microscopy, Dr P Kolesiki for the Confocal microscopy, and Dr M
Henderson (CEMMSA) with the SEM microscopy. This research has been kindly funded by
the Co-operative Research Centre for Molecular Plant Breeding (CRCMPB).
Finally,I would like to sincerely thank my supervisors, Professor Robin Graham, Dr
Chunyuan Huang, and Dr Ken Chalmers. In addition, I offer thanks to Dr Susan Barker
(University of Vy'estern Australia), Professor Peter Langridge and all in the Department of
Plant Science. I have appreciated their friendship and advice, and I am indebted to them'
Finally,I give my sincere thanks to my friend and mother, Stell4 and my friends Val, Anne,
Jen and Hansie, and to my friends in V/ATAC SA.
Publications
Lloyd, J.M., Barker, S.J., Graham, R.D. and Huang, C. (1999). Manganese nutrition status
and take-all Gaeumannomyces graminis var. tritici (Ggl) resistance in barley
(Hordeum vulgare ¿.) 1 lth Australian Plant Breeding Conference Proceedings,
Adelaide, 19-23 April1999 Volume 2, p 188.
Conferences
(Invited speaker)
"Manganese nutrition status and take-all Gaeumannomyces graminis var. tritici (Ggt)
resistance in barley (Hordeum vulgare Z.)". Annual Research Meeting, Co-operative
Research Centre for Molecular Plant Breeding, The University of Adelaide, Adelaide,
July 15th-16th,1999.
lv
A
List of abbreviations
Adenine
Amplihed fragment length polymorphism
Adenosine 5' -triphosphate
Average length of stelar lesion
base pair
Bovine serum albumin
degrees Celsius
Írcrocune
Cytosine
complementary DNA
2' -deoxy adenosine 5' -triphosphate
2'-deoxy cytidine 5'-triphosphate
2',3' -dideoxy adenosine 5' -triphosphate
2',3' -dideoxy cytidine 5'-triphosphate
2',3' -dideoxy guanidine 5' -triphosphate
2'.3' -dideoxy thymidine 5' -triphosphate
4' 5 -diamidino-2-phenylindole dihydrochloride hydrate
Deoxyribonucleic acid
Deoxyribonuclease
2' -deoxy nucleotide 5' -triphosphate
Dry matter
Dithiothreitol
"C
C
AFLP
ATP
Av.LSL
bp
BSA
pci
cDNA
dATP
dCTP
ddATP
ddCTP
ddGTP
ddTTP
DAPI
DNA
DNase
dNTP
DM
DTT
EASEM Elemental analysis scanning electron microscopy
V
EDTA Ethylenediaminetetraacetic acid
microgram
gr¿ìms
Guanine
Inductively coupled plasma atomic emission spectrometry
kilobase
microlitre
log likelihood
micromolar
molar
millilitre
millimolar
messenger ribonucleic acid
nanogram
nanomole
Number of infected roots
Number of roots
Polymerase chairr reaction
Potato dextrose agar
Piperazine-N,N' -bis-(2-ethanesulfonic acid)
Percent of infected roots
Restriction fragment length polymorphism
Ribonucleic acid
ICPAES
trg
ùÞ
G
kb
pl
LOD
pM
M
rnl
mM
mRNA
ng
nM
NIR
NOR
PCR
PDA
PIPES
PIR
RFLP
RNA
rpm revolutions per minute
vl
SDS
SEM
TEM
TLSL
TNSL
Tris
UV
wlv
QTL
YEB
Sodium dodecyl sulphate
Scanning electron microscopy
Transmission electron microscopy
Total length of stelar lesion
Total number of stelar lesions
Tri s(hydroxymetþl)amino methane
Ultraviolet
weight for volume ratio
Quantitative trait locr
Youngest emerged leaf blade
vlr
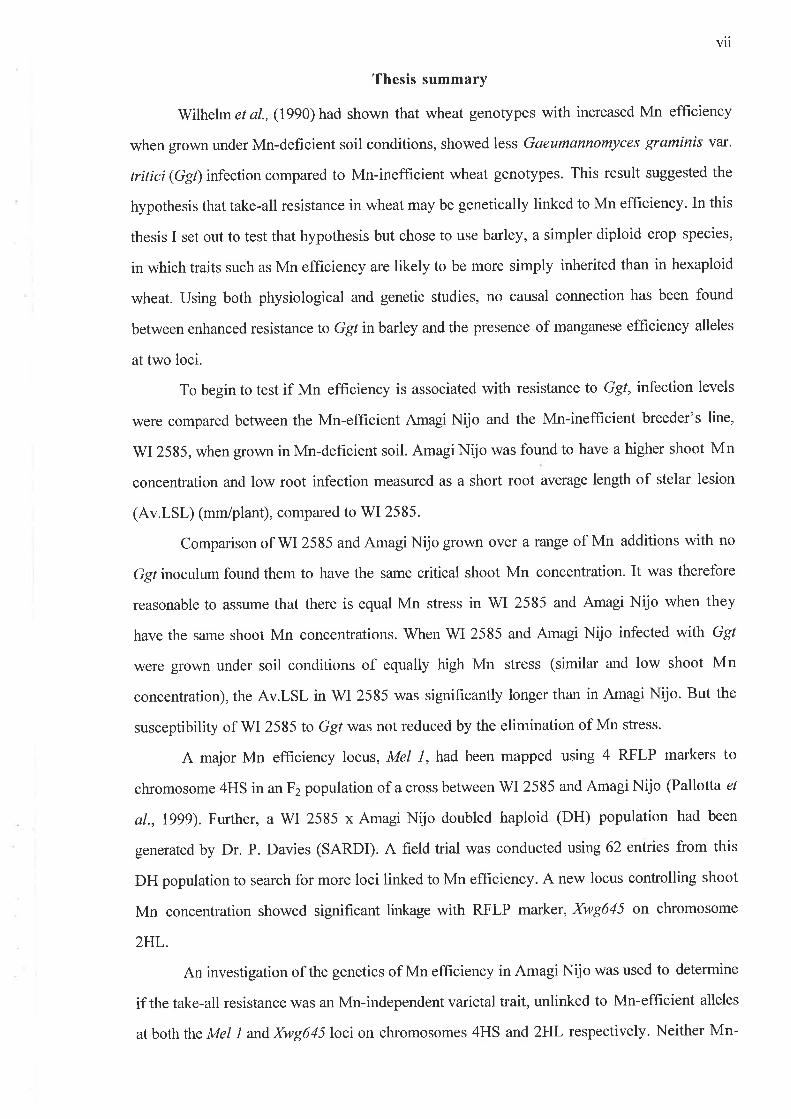
Thesis summary
Wilhelm et at., (1990) had shown that wheat genotypes with increased Mn efficiency
when grown under Mn-deficient soil conditions, showed less Gaeumannomyces graminis var'
tritici (Ggl) infection compared to Mn-inefhcient wheat genotypes. This result suggested the
hypothesis that take-all resistance in wheat may be genetically linked to Mn efficiency. In this
thesis I set out to test that hypothesis but chose to use barley, a simpler diploid crop species,
in which traits such as Mn efficiency are likely to be more simply inherited than in hexaploid
wheat. Using both physiological and genetic studies, no causal connection has been found
between enhanced resistance to Ggt in barley and the presence of manganese efficiency alleles
at two loci.
To begin to test if Mn efficiency is associated with resistance to Ggt, infection levels
were compared between the Mn-efficient Amagi Nijo and the Mn-inefficient breeder's line,
WI2585, when grown in Mn-deficient soil. Amagi Nijo was found to have a higher shoot Mn
concentration and low root infection measured as a short root average length of stelar lesion
(Av.LSL) (mm/plant), compared to WI 2585.
Comparison of V/I 2585 and Amagi Nijo grown over a range of Mn additions with no
Ggf inoculum found them to have the same critical shoot Mn concentration. It was therefore
reasonable to assume that there is equal Mn stress in WI 2585 and Amagi Nijo when they
have the same shoot Mn concentrations. When WI 2585 and Amagi Nijo infected with Ggr
were grown under soil conditions of equally high Mn stress (similar and low shoot Mn
concentration), the Av.LSL in V/I 2585 was significantly longer than in Amagi Nijo. But the
susceptibility of WI 2585 to Ggt was not reduced by the elimination of Mn stress.
A major Mn efficiency locus, Mel l, had been mapped using 4 RFLP markers to
chromosome 4HS in an F2 population of a cross between V/I 2585 and Amagi Nijo (Pallotta e/
at., 1999). Further, a WI 2585 x Amagi Nijo doubled haploid (DH) population had been
generated by Dr. P. Davies (SARDI). A field trial was conducted using 62 entries from this
DH population to search for more loci linked to Mn efhciency. A new locus controlling shoot
Mn concentration showed significant linkage with RFLP marker, Xwg645 on chromosome
2HL.
An investigation of the genetics of Mn efhciency in Amagi Nijo was used to determine
if the take-all resistance \ryas an Mn-independent varietal trait, unlinked to Mn-efficient alleles
at both The Mel t andXwg645loci on chromosomes 4HS and 2HL respectively. Neither Mn-

vlll
eflrcient allele at Mel I or Xwg645 showed linkage with a short Av.LSL in a controlled-
environment experiment on29 DH lines grown in Mn-deficient soil.

1
Chapter I Literature Review.......
I. I Introduction..............l. 1.1 Scope of research...1.1.2 Adding Mn fertiliser to the soil...'.'Ll.3 Mn status and Ggf infectionl.l .4 Aim of this research . .. .
1.1.5 Benefits of this research
1.2 Mn in plants......1.2.1 Symptoms of Mn deficiency in barley1.2.2 Genotypic differences in Mn efficiency in barley.....
1.3 The role of Mn in biosynthetic processes..
1.3.1 Photosynthesis1.3.2 Superoxide dismutase and Mn.'.'.'.1.3.3 Mn and the lignin biosynthetic pathway1.3.4 Mn and auxin biosYnthesis
1.4 Mn in soils........1.4.1 Forms of Mn in soils........'..1.4.2 Factors affecting Mn availability in soil.....1.4.3 Biotic and environmental factors1.4.4 Fertilisers and Mn availability in soil..'.....'
L5 Ptqnt micronulrient uptake, absorption and lrqnslocation1.5.1 Mn efficiency and root system si2e.............1.5.2 Mn efficiency and root Mn uptake....1.5.3 Mn absorption by roots......I .5.4 Vesicular-arbuscular mycorrhiza (VAM). ... . '. .
1.5.5 Mn translocation in Plants
I .6 Molecular studies of Mn efficiency . .. ...... .-..-. ... .. .
1.6.1 Plant Mn status and Mn efficiency.'..1.6.2 Screening for Mn effrciency. .. ..
1.6.3 The identification of genes for plant nutrition.1.6.4 Molecular markers for nutritional traits .. .... . . .
1.6.5 Genetic strategies used.........'.1.6.6 Summary................
1.7 Disease resistance in plants......1.7.1 Host disease resistance1.7.2 Host disease tolerance1.7.3 Host disease resistance or tolerance?
L8 Gaeumannomyces graminis var. tritici (GSt) ........ .....1.8.1 Ggl disease1.8.2 The biology of Ggt.........1.8.3 Pathogenic variation1.8.4 Ggt survival and crop rotationL8.5 Attenuation and restoration of Ggt pathogenicity ...1.8.6 Environmental conditions and take-all disease ......
1.9 Mn plant defence mechanisms against tqke-all . . . . . . .
1.9.1 Micronutrient stress, and disease resistance and tolerance .
1.9 .2 Li gnin biosyntheti c pathw ay and take-all . .
1.9.3 Mn and aminopeptidase........I .9.4 Mn and pectin methylesterase .... '.... .. .. ..
1.9.5 Mn and Pseudomonas fluorescens....'........1.9.6 The role of micronutrients in susceptibiltty to Ggt
l. I 0 Thesis prologue.....
Chapter 2 Pilot studies........
2. I Introduction..............2.1.1 Pilot studies........
2.2 Method..2.2.1 Experiment 1: Ggt tolerance to Mn.
2828
2828

2
2.2.2 Experiment 2 : Increas ed G gt path o geni c ity2.2.3 Experiment 3 : Calculation of sample size, .........2.2.4 Expenment 4: Confirmation of an adequate sample size .. .
2.2.5 Seed Mn.............
.44
.44
.45
47
47
..29
.. 3l
.. 3l
..32
40404l4243
474741
484855
595960
2.3 Results...2.3.1 Experiment l: Ggt tolerance to Mn..........2.3 .2 Experiment 2 : Increas ed G gt pathogenicity2.3.3 Experiment 4: Confirmation of an adequate sample size
3232JJ
34
38
40
40
4040
2.4 Discussion.
Chapter 3 Critical shoot Mn concentration....
3. I Introduction..............
3.2 Method..3.2.1 The critical shoot Mn concentration experiment
3.3 Results...3.3.1 Leaf symptoms3.3.2 Shoot and root DM............3.3.3 Shoot Mn concentration ..........3.3.4 Critical shoot Mn concentration of Amagi Nijo and WI 2585
3.3.5 Determining the rate of soil Mn addition as the basis of comparing the genotypes with equal Mn
status . .. .. ... ..
3.3.6 Shoot Mn content3.3.7 Root Mn concentration...........
3.4 Discussion................3.4.1 Critical shoot Mn concentration
Chapter 4 Physiological studies
4. I ln\roduction....................
4.2 Method..4.2.1 The Ggl experiment...4.2.2 The temporal study ...
4.3 Results...4.3.1 The Ggl experiment...4.3 .2 The temporal study . . .
4. 4 Discussion......................4.4.1 The Ggl experiment...4.4.2 The temporal study ...
Chapter 5 Microscopy investigation......
5. I Introduction..............5.1.1 Lignin and Ggt.......5.1.2 The morphology and pathology of Ggt infected roots5.1.3 SEM and EASEM
5.2 Method..5.2.1 UV fluor"r""n.. -i;;;ö;:..5.2.2 Fluorescent staining for phenols, DNA and proteins.5.2.3 SEM and EASEM
5.3 Results...5.3.1. Control stain for autofluorescence, 80 Yo glycerol.'.5.3.2 Acid fuchsin stain for proteins and micro-organisms......'5.3.3 Ethidium bromide stain for phenols and cell nuclei DNA.5.3.4 DAPI staining for cell nuclei DNA5.3.5 Double staining: DAPI for DNA and ethidium bromide for phenols and DNA5.3.2 SEM EASEM
5.4 D iscussion.................5.4. I UV microscopy....5.4.2 SEM and EASEM
4646
666666
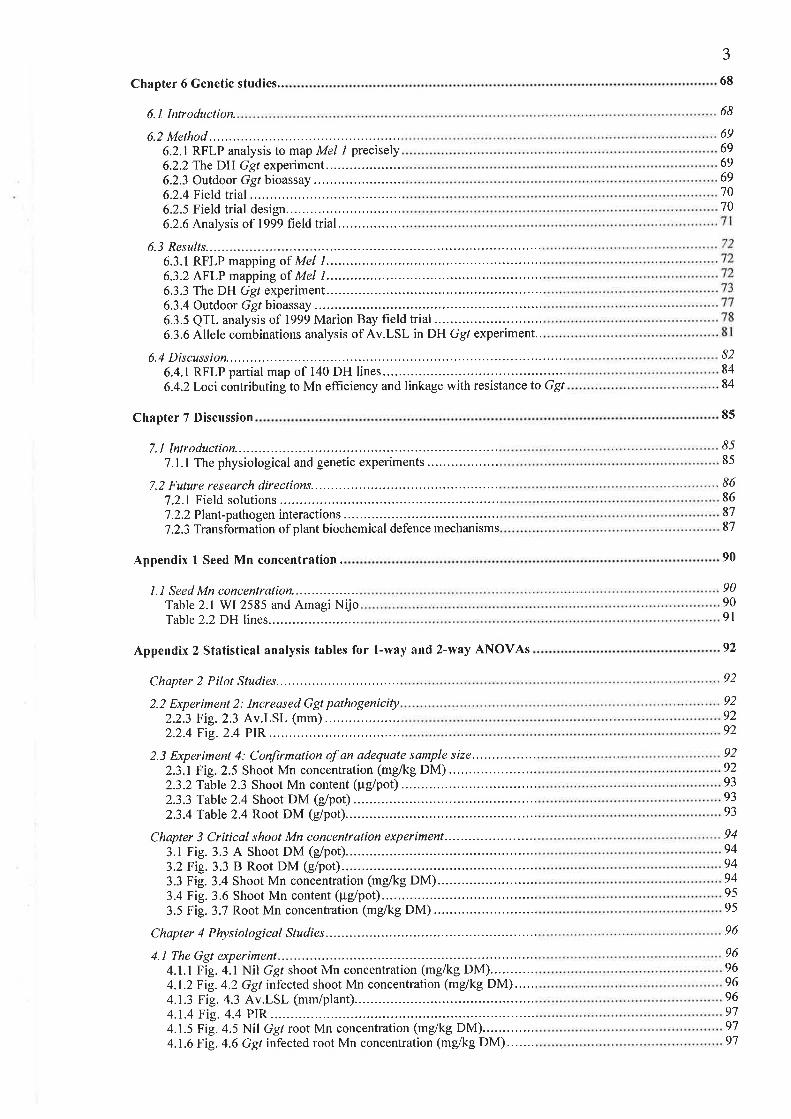
Chapter 6 Genetic studies..
6.L lntroduction.
6.2 Method..6.2.1 RFLP analysis to map Mel I precisely6.2.2 The DH Ggt experiment. .
6.2.3 Outdoor Ggt bioassay6.2.4 Field trial ............6.2.5 Field trial design..6.2.6 Analysis of 1999 field trial.....
6.3 Results...6.3.1 RFLP mapping of Me|1................6.3.2 AFLP mapping of Me|1................6.3.3 The DH Ggt experiment..6.3.4 Outdoor Ggt bioassay6.3.5 QTL analysis of 1999 Marion Bay field trial............6.3.6 Allele combinations analysis of Av.LSL in DH Ggl experiment..
6.4 Discussion................6.4.1 RFLP partial map of 140 DH lines.....6.4.2Loci contributing to Mn efficiency and linkage with resistanceto Ggt
Chapter 7 Discussion
7. I Introduction..............7.1.1 The physiological and genetic experiments
7.2 Future reseqrch directions.....7.2.1 Field solutions7 .2.2 PlanÍ-pathogen interactions . .. . . .. ... .
7.2.3 Transformation of plant biochemical defence mechanisms
Appendix 1 Seed Mn concentration.
I.I Seed Mn concentrationTable 2.1 WI 2585 and Amagi NijoTable 2.2 DH lines......
Appendix 2 Statistical analysis tables for 1-way and 2-way ANOVAS
Chapter 2 Pilot Studies........
2.2 Experiment 2: Increased Ggt pathogenicity2.2.3 Fig.2.3 Av.LSL (mm) ..........2.2.4 Fig.2.4 PIR
2.3 Experiment 4: Confirmation of an adequate sample si2e................2.3.1 Fig.2.5 Shoot Mn concentration (mg/kg DM)...........2.3.2Table 2.3 Shoot Mn content (pglpot)2.3.3 Table 2.4 Shoot DM (g/pot)2.3.4 Table 2.4 Root DM (g/pot)..
Chapter 3 Critical shoot Mn concentration experiment...3.1 Fig. 3.3 A Shoot DM (g/pot)..3.2 Fig.3.3 B Root DM (g/pot)..3.3 Fig. 3.4 Shoot Mn concentration (mg/kg DM)...........3.4 Fig. 3.6 Shoot Mn content (pglpot)......3.5 Fig. 3.7 Root Mn concentration (mg/kg DM)...........
Chapter 4 Physiological Studies...
4. 1 The Ggt experiment...............4.1.1 Fig.4.l Nil Ggl shoot Mn concentration (mg/kg DM)...........4.1.2Fig.4.2 Ggt infected shoot Mn concentration (-g/kg DM).....4.1.3 Fig. 4.3 Av.LSL (mm/plant)...4.1.4 Fig. 4.4 PIR4.1.5 Fig. 4.5 Nil Ggt root Mn concentration (mg/kg DM).............4.1.6 Fig. 4.6 Ggt infected root Mn concentration (mg/kg DM).......
3
68
68
696969697070
828484
85
8585
86868787
90
90909t
92
92
9292939393
949494949595
96
96969696979797
929292
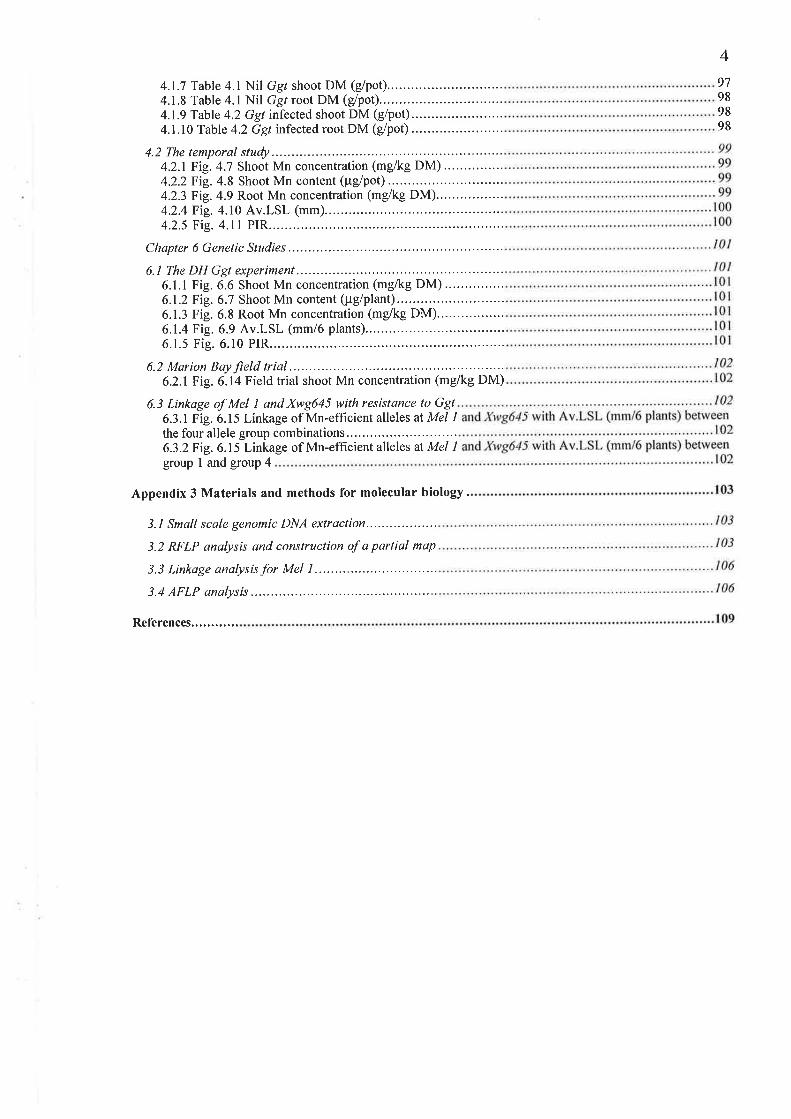
4.1.7 Table 4.1 Nil Ggl shoot DM (g/pot)..4. I .8 Table 4. I Nil Ggt root DM (g/pot). .
4.1.9 Table 4.2 Ggt infected shoot DM (e/pot)........4.1.10 Table 4.2 Ggt infected root DM (g/pot)
4.2 The temporal study..........4.2.1 Fig. 4.7 Shoot Mn concentration (mg/kg DM) ...'.......'.'.4.2.2 Fig.4.8 Shoot Mn content (pglpot)4.2.3 Fig.4.9 Root Mn concentration (mglkg DM)...........'.....4.2.4 Fig. 4. l0 Av.LSL (mm)..........4.2.5 Fig. 4.1I PIR.....
Chapter 6 Genetic Studies
6.1 The DH Ggt experiment...6.1.1 Fig. 6.6 Shoot Mn concentration (mg/kg DM)'.'..'....."..6.1.2 Fig.6.7 Shoot Mn content (¡rg/plant)....6.1.3 Fig. 6.8 Root Mn concentration (mg/kg DM)'.............'.'6.1.4 Fig. 6.9 Av.LSL (mm/6 plants).........6.1.5 Fig. 6.10 PIR.,...
6.2 Marion Bay field tria|...........6.2.1Fig.6.14 Field trial shoot Mn concentration (mg/kg DM)
6.3 Linkage of Mel I and Xwg645 with resistance to Ggt6.3.1 Fig. 6.15 Linkage of Mn-efficient alleles at Mel lthe four allele group combinations6.3.2Fig.6.15 Linkage of Mn-efficient alleles at Mel lgroup I and group 4
Appendix 3 Materials and methods for molecular biology.
3.1 Smail scale genomic DNA extrqction....
3.2 RFLP analysis and construction of a partial map
3.3 Linkage analysis for Mel I ..........
3.4 AFLP analysis
References...
4
97989898
Chapter I Literature Review
1.1 Introduction
This review covers aspects of current knowledge about manganese (Mn) in crop
plants, plant available manganese in the soil, genes for manganese efficiency in barley
(Hordeum vulgare L.) and the possibility that they enhance resistance to root infection by the
fungus Gaeumannomyces graminis vat. tritici (GSt).
1.1.1 Scope of research
Manganese deficiency in wheat occurs when it is grown in soils with low plant
available Mn, resulting in significant grain yield loss (Reuter et al., 1973a), and increased
susceptibility to Ggt (Graham and Rovira,1984 and Wilhelm et al., 1988). Soils with low
plant available Mn are widespread in South Australia and in other winter cereal growing areas
of the world. Wheat plants deficient in Mn have been shown to be susceptible to the soil-
borne fungus disease, Gaeumannomyces graminis var. tritici (Ggr) (Reis et al., 1982; Graham
and Rovira, 1984). The incitant organism, Ggt, is commonly known as take-all or hay-die.
This is because Ggf infection of roots in wheat and other cereals results in stelar lesions on
seminal roots. In severe cases of Ggl infection, there is premature death of the plant (Asher
and Shipton, 1981). Of the winter cereal crops, wheat and barley are the most susceptible to
take-all, for which no major resistance genes are known.
A signif,rcant decrease in Ggt infection has been found, both in the field and in pots,
with the experimental addition of Mn fertiliser to Mn dehcient soils (Graham and Rovira,
1984;Roviraet a1.,1985; Huber and Dorich, 1988; Wilhelrn et al., 1988, 1990). However, in
the field, the availability of soil Mn to the plants is affected by numerous environmental and
soil biotic and abiotic factors (Graham, 1983; Huber and V/ilhelm, 1938). As a result, the
control of take-all in Mn deficient soils has proven to be very diffrcult.
1.1.2 Adding Mn fertiliser to the soil
Soil factors can diminish the amount of available plant Mn soon after the addition of
Mn fertiliser to the soil (Reuter et ol., 1973a; Reuter et al., 1973b; and Marcar atrd Graham'
1936). Severe Ggl infection has been observed in alkaline soils (Cook, 1981). This is because

2
plant available solubl" Mn'* is oxidised in alkaline soil to insoluble MnO, which is
unavailable to the plant. In addition, the presence of Ggt in the soil decreases the availability
of soil Mn to the plants (Wilhelm et al., 1990). The problem of low soil Mn is compounded
by the finding that the application of Mn as a foliar spray to the crops is ineffective in the
control of take-all (Reis er a\.,1982;Wilhelm et ql., 1988; Huber and Wilhelm, 1988).
1.1.3 Mn status and Ggt infection
The critical concentration of Mn in barley below which the plant is Mn deficient is
11.0-l1.6mg/kg dry matter (DM) in the youngest emerged leaf blade (YEB) (Hannam et al.,
1987). As previously discussed (section 1.1.1), the experimental application of Mn to Mn
limiting soils decreased the severity oî Ggt infection (Graham and Rovira, 1984 Rovira et al.,
1985; Huber and Dorich, 1988; Wilhelm et al., 1988, 1990). Pot studies suggested that the Mn
deficiency occurred first in the plants, and predisposed the plants to the Ggt infection, rather
than the root pruning effects of take-all causing reduced uptake of Mn from the soil causing
subsequent development of Mn deficiency as growth occurred (Graham and Rovira, 1984i'
Rovira et al., 1985; Wilhelm et al., 1988).
Besides Mn levels in soil, the genotype of the plant influences tissue Mn levels. Mn
efficiency in plants is defined as the enhanced ability of a genotype to grow and yield well in a
soil too deficient in Mn for a standard genotype (Graham, 1984). Mn-efficient genotypes
have higher Mn levels under Mn limiting conditions than Mn-inefficient genotypes. In wheat,
genotypes that are effrcient in Mn uptake from Mn limiting soil have a lower level of Ggl
infection than Mn-inefficient genotypes (Wilhelm et ql., 1990; Pedlet, 1994). V/heat has a
complex genome because it is hexaploid. Therefore, the genetic basis for Mn nutrition in wheat
has not been studied, and it is not known if the connection of plant Mn status and resistance
to take-all is due to Mn effrciency or other genetic differences between the wheat varieties
tested. This connection has never been investigated in barley, in which the genome is diploid
and where Mn efficiency is known to be relatively simply inherited.
1.1.4 Aim of this research
The availability of soil Mn to the plant appears to be the uniffing factor in resistance
of the plant to infection by Ggt (Graham, l9S3). Major genes have been proven to control

3
nutritional characters (Epstein, 1972; M" Carthy et al., 1988). One gene, which is associated
with the Mn-efficient trait in barley, Mne I, has been identified (Huang, 1996), and the
function is now being investigated. Recent work suggests the presence of another two genetic
loci associated with the expression of Mn-efficient or Mn-inefhcient traits in barley, (Pallotta
et al., 2000), that are unrelatedto Mne 1. One of these loci, Mel.l, has been identified, mapped
to 4HS and several Restriction Fragment Length Polymorphism RFLP molecular markers
found which allow identification between the Mn-efficient allele and the Mn-inefficient allele
(Pallottta, et a1.,2000). Other loci influencing Mn efficiency have not yet been identified.
In this project, physiological and genetic studies will test the hypothesis that barley
genotypes grown in Mn limiting soils with the Mn-efficient allele at Mel l will be genetically
linked to resistance to take-all compared to genotypes with the Mn-inefficient allele at Mel l.
If this hypothesis is proven, studies using Amplified Fragment Length Polymorphism
(AFLP) analysis will be done to identifr a molecular marker which is specific to Mel1. The
AFLP molecular marker is needed to replace the closely linked RFLP molecular marker
Xabg7l4, which is difhcult to use for allele identification because it identifies multiple loci.
Work will also coÍrmence to identiff other loci influencing Mn efficiency and checked to
determine if the loci are linked with resistanceto Ggt infection. This work will be a foundation
for the pyramiding of all alleles for Mn efficiency into elite barley cultivars, and for the
possible transfer of the barley alleles into less Mn-efficient wheat cultivars.
1.1.5 Benefits of this research
The gross value of barley produced inAustralia for 1998-99 was AUS$ 937 million
(ABARE, 1999a).In South Australia, loss in yield from barley growing in Mn-deficient soils
with no Mn fertiliser was found to be between 40-70% (Reuter et al., 1973a). Hence, the
sowing of Mn-efhcientbarley genotypes in the low plant available Mn soils of the southern
cereal belt of Australia will increase yields and eliminate much of this loss. Identification of
barley genotypes expressing the Mn efficiency trait in Mn limiting soils can be done with the
use of specific molecular markers for Mn efficiency.
The gross value of wheat produced in Australia for 1998-99 was over AUS$ 3.5 billion
(ABARE, 1999a). Australian wheat growers lose on average AUS$ 66.1 million annually due
to yield reduction resulting from Ggl infection (ABARE, 1999b). The sowing of Mn-efficient
4
wheat cultivars in Mn limiting soils could be expected to give additional economic returns if
the Mn-efficient trait confers not only greater yield but also greater resistance to take-all
(GSt).As with barley, the identifîcation of Mn-efficient wheat genotypes in Mn limiting soils
can be done with the use of specific molecular markers for Mn efhciency giving considerable
additional economic benefit to the Australian cereal industry.
1.2 Mn in plants
Manganese is an essential micronutrient for growth and development in higher plants
(M'Hargue,1922; SamuelandPiper, 1928). Mn is locatedinthe plant in cell walls and in
vacuoles (Garnham et al., 1992). In the periodic table, Mn is a transition group metal and can
exist in a range of oxidation states. The outer valence shell contains two unpaired electrons, so
Mn can have an oxidation state of t2 as a basic divalent cation, Mrr'* (Leeper, 1970). In
addition, the d orbit of Mn atoms just below the valence shell has 5 unpaired electrons.
Consequently, Mn can have an oxidation state ranging up to *7, as it does in the acidic
permanganate ion MnOa-. Mn shares some common properties with the alkali earth divalent
metals, Ca and Mg, and the transition metals, Zn and Fe. All these cations can activate a
number of enzymes and act as co-factors to enzymes in biosynthetic processes. As a result,
when the Mn concentration in the tissues of plants is below the critical level, plant growth
and development suffer a range of deleterious effects (Bumell, 1988).
1.2.1 Symptoms of Mn deficiency in barley
The critical Mn concentration in barley, below which there is decreasing vegetative
yields, is 11.0-11.6 mg/kg DM in the YEBs under both field and controlled environment
conditions, and 12-12.4 mdkg DM in whole shoots under controlled environment conditions
(Hannam et al., 1937). No visual symptoms of Mn deficiency appear in the plants until the
growth is severely depressed by the Mn deficiency (Rovira et al., 1935). Under controlled
environment conditions, interveinal chlorosis appears in the youngest leaf. Then the more
slowly developing necrosis appears, but is most severe in the second youngest leaf
(Longnecker and Graham, 1990; Webb et al., 1993b). Mn deficiency appears on younger
leaves as grey-brown necrotic spots and streaks (Nable and Loneragan, 1984a; Nable and
Lonergan, 1984b; Marcar and Graham, 1986). Mild Mn deficiency in barley prolongs

5
vegetative growth, delays reproductive growth and decreases the number of tillers produced.
Therefore mild Mn deficiency in barley can result in severe yield loss. Finally, severe Mn
deficiency causes plant death before the onset of the stem elongation stage (Longnecker et al.,
1ee1).
1.2.2 Genotypic differences in Mn efficiency in barley
The level of Mn in plants depends on the efficiency of uptake of Mn from the soil.
This process involves the reduction of insoluble soil Mn oxides to plant available Mn, and
Mn mobilisation and absorption into the root (Graham, 1988; Marschner, 1988). Differences
in Mn uptake efficiency were reported within oat species by Vose and Griffiths (1961). The
expression of Mn efficiency is defined as the ability of a genotype to grow and yield well in
soil too deficient in plant available Mn for a standard genotype (Graham, 1984). Considerable
genotypic variation in Mn effrciency has been observed in barley. Barley genotypes have been
classified into three different classes of Mn efficiency according to yield, tissue Mn status and
chlorosis at tillering (Graham et al., 1983). These classes were found to be associated with
different sources of germplasm. Mn-efficient genotypes originated from the old English line
Plumage Archer. This line grew well on the soils of the Mn deficient Jurassic-Cretaceous
limestone of south-east England. In contrast, the Mn-inefficient genotypes (such as WI 2585)
originated from the line, CI 3576, which grew in highly fertile soils near Alexandria, Egypt
(Graham et a1.,1983).
The Mn efficiency trait seems to be due to one or at the most a very few dominant
genes judging from the data of two crosses, Weeah (Mn-efficient) x WI 2585 (Mn-inefficient)
and Weeah x Galleon (Mn-inefhcient) (M Carthy et al., (1988). Cereal species have been
categorised in order of Mn efficiency: oat > rye > triticale > barley> bread wheats ) durum
wheat (Gallagher and Walsh,1943 Nyborg, 1970; Graham et al., 1983; Marcar, 1986), but
variation may be nearly as great among genotypes of the one species.
1.3 The role of Mn in biosynthetic processes
Manganese is involved in a range of biosynthetic processes in plants. As a result, Mn
dehciency in plant tissue gives a range of deleterious effects to plant growth and development.
6
1.3.1 Photosynthesis
Manganese is involved in the photosystem II phase of photosynthesis. During
photosynthesis, photosystem II results in the evolution of an O, molecule from the splitting
of two HrO molecules (Cheniae,1976). The manganese center, (MnC), which is a component
of photosystem II, is a metalloprotein containing four manganese atoms. MnC binds to two
water molecules, extracts four electrons and Mn sequentially passes through four oxidation
states as the MnC transfers the electrons to the light harvesting reaction center, chlorophyll
p680. The electrons excite the P680 reaction center, which becomes reduced to P680+. The
excited P680+ reaction center pumps four protons from the stroma to the tþlakoid lumen.
As a result, oxygen is released and diffuses from the chloroplast (Cheniae and Martin, 1970;
Cheniae and Martin,lgTl; Cheniae, 1916; Amesz, 1983; Ghanotakis and Yocum, 1990).
Plants suffering mild Mn deficiency have reduced oxygen evolution (Amesz, 1983;
Nable et al., 1984), but chlorophyll concentration and the ultrastructure of the chloroplast
remain the same (Nable et al., 1984). But in plants with severe Mn def,rciency, the lamellar
system inthe chloroplasts breaks down (Mercer et al., 1962). As aresult, some of the light
intercepted by the leaves is not consumed by P680, but is emitted as fluorescence at red
wavelengths (Kriedemattn et al., 1985). Consequently, Mn deficiency can be diagnosed by
estimation of leaf fluorescence (Graham et al., 1985; Hannam et al., 19871, Longnecker and
Graham, 1990).
1.3.2 Superoxide dismutase and Mn
Superoxide dismutase (SOD) protects cells from the highly reactive and potentially
toxic free radical superoxide ion (O2 ). The free radical 02 is generated during photorespiration
(Burnell l98S). Photorespiration is most active in plants that are under environmental stress
as a result of high illumination, high temperature, or CO2 depletion. A metalloenzyme, Mn-
superoxide dismutase (Mn-SOD) has been found in the chloroplast (Bannister et al., 1987).
The action of Mn-SOD is to oxidise one molecule of the toxic free radical 02' to H2O2 while
reducing another 02 molecule to 02. Plants deficient in Mn have low Mn-SOD activity.
Under environmental stress these plants will be more susceptible to cell damage and less able
to survrve

7
1.3.3 Mn and the lignin biosynthetic pathway
Mn deficient plants have a reduced ability to produce lignin. Peroxidases are widely
distributed in plants, and contain Cu, Fe and other metals. Peroxidases also exist as Mn-
peroxidases in cell walls. One of the functions of Mn-peroxidase is to produce H2O2 that
oxidises cinnamyl alcohol analogues. The corresponding cinnamyl alcohol free radicals self
condense into lignin without enzymatic catalyst (Gross, 1930). Deficient Mn in plants will
affect li gnin production.
Lignin is a major constituent of woody tissues in plants. Via the shikimic acid
pathway, four different monophenolic structure analogues of cinnamyl alcohol undergo self-
condensation to form the polyphenolic structure of lignin (Gross, 1980; Graham, 1983;
Bumell, 19SS). The polymerisation is preceded by Mn-peroxidase activation, and results in
random sub-unit sequencing of the monophenolic structures (Gross, 1930). The non-enzymic
polymerisation gives lignin a high level of immunity from enzymic attack, and therefore lignin
is associated with increasing root resistance to invasion by pathogens (Skou, 1981). The
powdery mildew pathogen (Erysiphe graminis f. sp. hordei), has been found to induce the
expression of extracellular peroxidase and lignin production (Scott-Craig et al., 1995). Thus
soil-borne plant pathogens may elicit lignin production as a defence response in barley.
However, invading pathogens may overcome this plant defence mechanism dtring invasion of
the plant root via disruption of the final polymerisation step with the secretion of Mn2*-
oxidising exudate (Wilhelrn et al., 1987).
plants deficient in Mn have reduced phenol and lignin production (Brown et al., 7984),
and so are likely to be more vulnerable to invasion by root pathogens (Huber and Wilhelm,
1988), as discussed above.
1.3.4 Mn and auxin biosYnthesis
Indole-3-acetic acid (IAA) is an auxin (plant growth hormone) that is synthesised via
the shikimic pathway in the apical buds of growing shoots. IAA stimulates growth of the
main shoot, and inhibits lateral shoot development. Cytokinin is a plant hormone produced in
roots, and promotes differentiation in many plant tissues. Auxins and cytokinins work
together, and the ratio of auxin to cytokinin will determine if a plant will grow or differentiate.
8
Manganese is involved both in the synthesis and in the oxidative degradation of IAA (Graham
and Webb, l99l). Mn deficient plants showed an increase in IAA oxidase activity (Morgan ef
al., 1966; Taylor et al., 1968), and exhibited abnormal growth and development (Webb and
Dell, 1990).
1.4 Mn in soils
The level of plant available Mn in soil is a major factor affecting Mn nutritional status
and consequently the growth and development of plants.
1.4.1 Forms of Mn in soils
In the soil, Mn2* (MnII), and perhaps the transient Mn3* (MnIII), are soluble and
available for uptake by plants. Manganese in soil occurs in a range from 20-6000 mg/kg
(Krauskopf, lg/2).Most Mn in soil exists as an insoluble form. Mn occurs over a wide range
of oxidation states:- from Mn3Oa (hausmannite), to MnOOH (manganite), to KMn3O16
(cryptomelane) to the more oxidised forms, pyrolusite (ô-MnO2), lithiophorite and birnessite
(caMno2) :- all with an oxidation state of +4 (MnIV) (Leeper, 1970). MnO2 (MnIV), is
reactive in its forms of ô-MnO2 and B-MnO2, which can be easily reduced to Mn2* (MnII)
(Leeper, t970).
In calcareous soil, most Mn occurs as insoluble manganocalcite, (MnCO3) with an
oxidation state of +2 (MnII). The concentration of soluble Mn2* is very low. This is because
in soils with a pH value above 5.0, the oxidation of Mn2* (MnII), to MnIII, and MnIII to
MnIV is thermodynamically favoured (Leeper, 1970; Norvell, 1988). MnIV occurs as
insoluble oxides that are unavailable for uptake by plants.
l.4.2lactors affecting Mn availability in soil
Calcareous soils have a high buffering and neutralising capacity due to their high
content of free CaCO3. The pH varies from 7.3 to 8.5 (Lindsay, 1979), which
thermodynamically favours the oxidation process to bind up the Mn in the form of plant
unavailable manganese oxides (Jauregui and Reisenauer, 1982a). Calcareous and alkaline soils
predominate on Yorke and Eyre Peninsulas in South Australia, where Mn def,rciency in wheat
and barley crops is a common problem (Reuter, 1972; Graham et al., 1983).
9
In calcareous soils, the addition of soluble MnSOa to the soil as a Mn fertiliser only
temporarily increases the plant available Mn2*. This is because the oxidation of Mn2* can be
autocatalytic (Leeper, 1970; Nealson ef a/., 1988). It is thought that the auto-catalysis of
soluble Mn2* is due to freshly precipitated and reactive MnIII or MnIV oxides (section 1.4.1)
catalysing soluble Mn2n to form sparingly soluble MnIII or MnIV oxides (Uren, 1981;
Nealson et al., 1988). Therefore, added Mn as a fertiliser in the form of soluble MnSOa can be
easily oxidised, and over time becomes trapped as only sparingly soluble MnIII or MnIV
oxides, which are less readily available for uptake by plants.
1.4.3 Biotic and environmental factors
In addition to soil factors, the availability of manganese to plants in the field is
dependent on avariety of seasonal and biotic factors (Samuel and Piper, 1928; Leeper, 1970;
Batey, lgTl). Soil chemical, physical, and biological factors are all linked (Leeper, 1970)' and
influence soil pH and the solubility of Mn as shown in the following reaction:
MnO2 + +H* + 2e- <+ 2H2O + Mn2*
(insoluble) (soluble)
Organic matter such as green manures help create acidic and reducing conditions in
which Mn2* (MnII) becomes available to the plants (Leeper, 1970). The reverse reaction
occurs in non-acid calcareous soils when micro-organisms, including bacteria, actinomycetes,
fungi and algae are present in the soil (Bromfield, 1978). Under these conditions, insoluble
MnIV is formed (Timonin, 1946). Desiccation of the soil over time was found to reduce the
soil population of Mn oxidising micro-organisms, while the Mn reducing micro-organism
population remained the same. Therefore, the soil Mn2* levels were increased over time by the
excess of Mn reducing micro-organisms over Mn oxidising micro-organisms (Leeper, 1970;
V/ebb et al., 1993a). However, because the roots of plants are inactive in dry soils, little Mn2*
is absorbed (Leeper, lg70). Some of the seasonal and soil factors affecting Mn availability to
plants are summarised in the following table (Table 1.1).
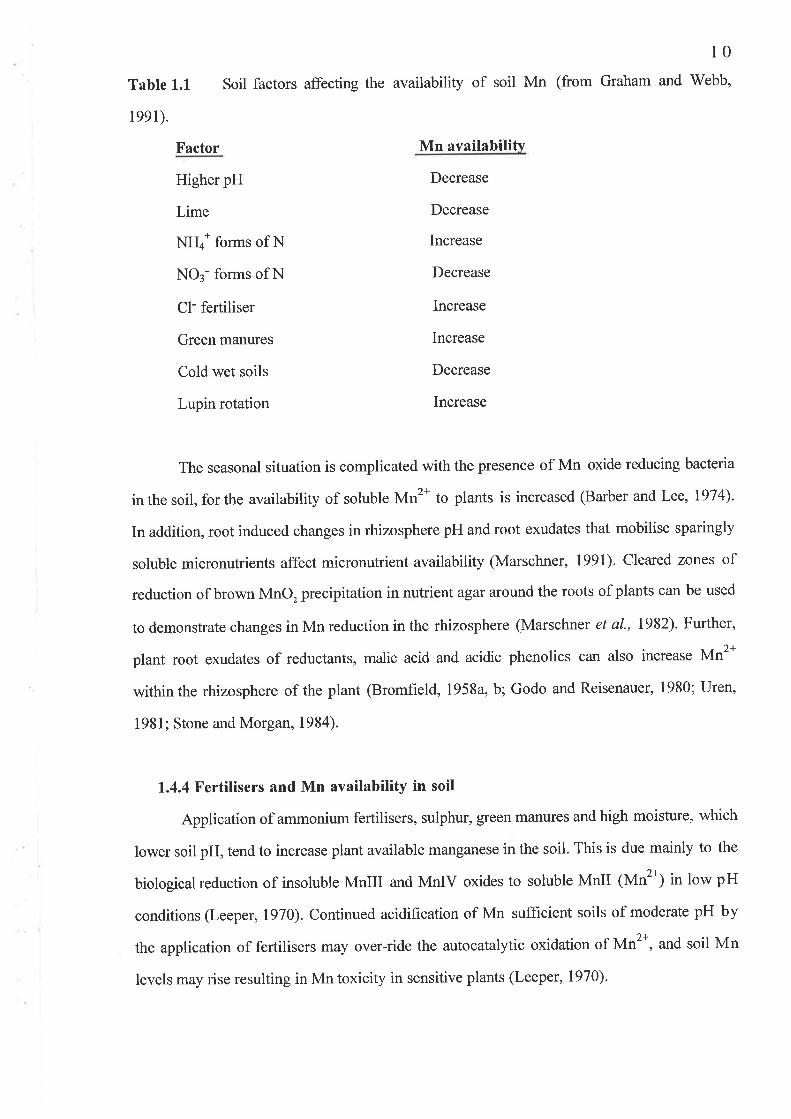
l0Table 1.1
1ee1).
Soil factors affecting the availability of soil Mn (from Graham and Webb,
Mn availabilitvFactor
Higher pH
Lime
NH+* forms of N
NO3- forms ofN
Cl- fertiliser
Green manures
Cold wet soils
Lupin rotation
Decrease
Decrease
Increase
Decrease
Increase
Increase
Decrease
Increase
The seasonal situation is complicated with the presence of Mn oxide reducing bacteria
in the soil, for the availability of soluble Mn2* to plants is increased (Barber and Lee, 1974).
In addition, root induced changes in rhizosphere pH and root exudates that mobilise sparingly
soluble micronutrients affect micronutrient availability (Marschner, 1991). Cleared zones of
reduction of brown MnO, precipitation in nutrient agar around the roots of plants can be used
to demonstrate changes in Mn reduction in the rhizosphere (Marschnet et al., 1982). Further,
plant root exudates of reductants, malic acid and acidic phenolics can also increase Mn2*
withinthe rhizosphere of the plant (Bromfield, 1958a, b; Godo andReisenauer, 1980; uren,
1981; Stone and Morgan, 1984).
1.4.4 Fertilisers and Mn availability in soil
Application of ammonium fertilisers, sulphur, green manures and high moisture, which
lower soil pH, tend to increase plant available manganese in the soil. This is due mainly to the
biological reduction of insoluble MnIII and MnIV oxides to soluble MnII (Mnt*) itt low pH
conditions (Leeper, 1970). Continued acidification of Mn suffrcient soils of moderate pH by
the application of fertilisers may over-ride the autocatalytic oxidation of Mn2*, and soil Mn
levels may rise resulting in Mn toxicity in sensitive plants (Leeper, 1970).

11
1.5 Plant micronutrient uptake, absorption and translocation
Mn absorption and translocation is a major factor conferring healthy growth and
development to the plant. The mechanisms by which these processes occur are known, but
not in sufficient detail. Strategy I plants (both dicots and monocots including cereal species)
take up micronutrients from the soil solution using constitutive reductase in root redox
processes, (which are highly regulated and under genetic control), and acidifu the plant
rhizosphere in response to low iron soil conditions (Kochian, 1991; V/elch, 1995; Marschner,
1991). However strategy II plants (such as cereal species), which have evolved in alkaline
soils use phytometallophore uptake systems to increase iron availability (Rîmheld, 1991;
Marschner and RÌmheld, 1994). Thus, the strategy II mechanism of micronutrient absorption
involves either: a) translocation of micronutrients by phytometallophore (which are produced
by plants and bind to divalent cations of Fe, Cu, Ni, Zn, Co, and to least of all to Mn), or
microbial metallophore chelates, b) absorption of micronutrients by chelate-specific transport
proteins located in the root cell plasma membranes into the cytosol, or c) absorption of
micronutrients via an H* or K* gradient across the root-cell plasma membrane with an amino
acid co-transport system (welch, 1995; Marschner and Rîmheld,1994)-
1.5.1 Mn efficiency and root system size
The Mn efficiency trait seems not to be associated with the size of the plant root
system. Barley is more Mn-effrcient than wheat, and has a more extensive root system to
allow greater uptake of nutrients (Marcar, 1936). But in another study, no significant
difference between barley genotypes differing in Mn efficiency has been found in root
morphology to account for differences in Mn efficiency. Harbard (1992), found a similar root-
shoot ratio f'or Mn-eff,rcient and Mn-inefficient genotypes of barley growing in Mn sufficient
soil. However, in the rate of root growth, the Mn-inefficient genotype was sensitive to low
Mn soil, whereas the rate of root growth of the Mn-efficient genotype was not. Harbard
(lgg2) found that root system size of the Mn-inefficient genotype decreased when grown in
Mn limiting soil, but in contrast, the root system size of the Mn-efficient genotype when
grown in Mn limiting soil was the same as when grown in Mn sufficient soil. Signihcantly, a
larger root system does not confer efficiency for the uptake of specific nutrients like
manganese in Mn limiting soils (Graharn et al., 1983).
l2Further evidence that root system size is not a factor in Mn eff,rciency is derived from
the finding that the heritability of Mn effrciency is by one or a very few genes at the most
(Graham et al., 1983; M' Carthy et al., l9S8). In contrast the heritability of a large root
system is very complex (Zobel, 1975), and many mofe genes are expected to be involved'
Finally, older genotypes of wheat have larger root systems, but have less Mn efficiency when
grown in low Mn soils compared to modern genotypes which have a greater Mn efficiency
but with a smaller root system (Evans and Dunstone 1970; Siddique et al., 1990). For all these
ïeasons, it seems unlikely that the expression of the Mn efficiency trait is associated with the
size of the plant root system.
1.5.2 Mn efflrciency and root Mn uptake
The site in the plant relevant to the expression of Mn efficiency must be the root
system and the root rhizosphere. Soil-grown plant roots detect signals at the root-soil
interface and the mobilisation of nutrients from the rhizosphere. In contrast, solution-grown
plant roots may not have the same properties. Solution-grown plants can only be used to
study characters of nutrient reduction at the root plasma membranes, absorption rate,
translocation and utilisation within the plant (Graham, 1984). Huang et al., (1994) found that
the Mn efficiency trait was not detected in solution culture of barley genotypes, but it was in
soil culture (as determined by the tissue Mn) (Huang et al., t994). The results suggested that
the differences in Mn effrciency is in the ability of genotypes to uptake Mn from the
rhizosphere soil near the root-soil interface, rather than there being differences in the ability of
the genotypes to utilise and accumulate Mn throughout the plant (Huang et al., 1994; Huang
1996). Therefore, the root-soil interface appears to be the site of the expression of the Mn
efficiency trait.
1.5.3 Mn absorption by roots
It is known that Mn2* is absorbed by roots in two phases. The initial uptake is rapid,
reversible and independent of metabolism. The Mn is adsorbed into the root cell wall
apoplastic space. During this phase, which lasts for a few minutes, Mn2* is exchangeable with
Ca2* lPage and Dainty, 1964; Garnham et al., 1992). The second phase of Mn uptake is
slower and proceeds over several hours. During this phase Mn is less readily exchangeable
t3(Maas et al., 1968). However, Mn absorption during the second phase is dependent on
metabolism. Darkness, low temperature and the application of metabolic inhibitors all
decrease Mn absorption during the second phase, in which Mn is transported into the
symplasm (Maas et al., 1968; Garnham et al., 1992). Mn most likely enters the root cell via
carrier or channel proteins (Garnham et ql., 1992; Welch, 1995) like permeable Ca channels
(Piñeros and Tester 1995).
1.5.4 Vesicular-arbuscular mycorrhiza (VAM)
The role of vesicular-arbuscular mycorrhiza (VAM) infection of barley roots in Mn
uptake is not tikely to be major, but it is uncertain if VAM infection plays a minor role. VAM
infection of roots increases the root surface area for plant uptake of micronutrients, and
increases the availability of phosphorus (P) to the plant (Baylis, 1982). VAM infection
appears to be regulated by the plant, and can be expected to be greatest in soils low in P
content. However, the levels of VAM infection of different barley genotypes with similar root
mass growing in soil with no added P was only very low, and ranged from 8.6 - 28.6% (Baon
et al., 1993). Further, although VAM infection increased the effrciency of soil P uptake, the
plant utilisation of P (as measured by P shoot concentration) was decreased (Baon et al.,
1992). VAM infection levels in barley increased when soil temperature was increased from
15oC to 20oC (Baon et al., I994a), but remained at low levels compared to dicotyledons.
Unlike dicotyledons, Graminaceous plants such as barley have an extensive fibrous root
system, which increases their root surface area for micronutrient uptake. Therefore, barley and
other Graminaceous plants are likely to be less dependent on mycorrhizal infection to
increase the root surface area for enhanced micronutrient uptake, compared to dicotyledons.
VAM infection increased the uptake of Zn in citrus (Tinker and Gilden, 1983).
However, there is no evidence that VAM infection increases Mn uptake in barley. Baon et al.
(1992), found that the levels of VAM infection in Mn sufficient soils was greater in wheat
than in barley, while the least VAM infection occurred in rye. However, this is the reverse
order of Mn efhciency in these cereals when grown in Mn limiting soil (section I.2.2). Barley
and rye have a more extensive root system than wheat (Baon et al., 1992). This finding would
explain why wheat may be more dependent on higher levels of VAM infection to increase its
root surface area for micronutrient absorption. But in another study, although the Mn-
T4
effrcient trait in Mn limiting soils was greater in barley than in wheat, the levels of VAM
infection of the roots was similar (Marcar, 1936). These conflicting results suggest that VAM
infection levels may change between sufficient Mn and Mn limiting soils. However, a more
likely explanation is that the conflicting results are due to the two studies using different
methods to quantifu VAM infection levels. In addition, Mn limiting soils are often sufficient
in P supply, which has led to decreased VAM infection (Hall, 1978; Baon et al., 1992). To
summarise, the current evidence suggests that VAM infection is not likely to be associated
with the Mn-efficient trait in low Mn soils in barley.
Conversely, cunent evidence suggests that VAM infection may not increase but in fact
decrease the availability of Mn to plants. The Mn requirement for microbial growth is up to
one hundred times less than that in plant tissues (Bertrand and Javillier, l9I2). Due to the
VAM oxidation of Mn, VAM infection has been found to decrease Mn concentration in roots
and shoots, thus perhaps protecting roots from Mn toxicity (Biermann and Linderman, 1983;
Pacovsky, 1986; Arines et al., 1989; Kothari et al., l99l; Medeiros et al., 1995). Therefore
VAM infection in roots may actually slightly decrease the Mn availability to the plant. In
conclusion, VAM infection of barley root is likely to be insignificant to Mn uptake and the
Mn-eff,rcient trait because of take-all infection, the sufficient P supply in the soil, and the cool
moist conditions that favour the growth of fungi such as take-all, do not favour the growth of
mycorrhizas (Baon et al., 1992 1993;1994a).
1.5.5 Mn translocation in plants
Plants have not evolved efficient mechanisms of Mn translocation within the plant to
ensure survival of plants in Mn limiting soils (Graham, 1983). During vegetative growth, Mn
is readily transported in the xylem but not in the phloem of the plant. Mn absorbed by a plant
root is transported to the xylem, and then via the transpiration stream to the shoots of the
plant. Mn is not re-translocated from the leaves to other parts of the plant (Nable and
Loneragan, 1984a; El-Piaz et al., 1990). Therefore the application of Mn fertiliser in foliar
sprays is likely to overcome Mn deficiency in plants only temporarily until a new leaf
emerges. It is only during grain development that Mn in the roots and stems is translocated to
the ear (Pearson and Rengel,l994;1995b). This is important for the survival of the seed, for
15
high seed Mn levels have been found to be beneficial to early seedling growth (Marcar and
Graham, 1986) and dry weight yield (Longnecker et al., 1988).
There is further evidence that Mn is not transported in the phloem from the results of
a split root experiment. Mn was not translocated from Mn sufficient root system to a Mn
deficient root system in a split root culture of subterranean clover (Nable and Loneragan,
1984b). Therefore, Mn fertiliser applied to one part of the root network will not supply Mn
via phloem translocation to the rest of the Mn deficient root system. Plant available Mn needs
to be mixed throughout the soil to supply all the root system with Mn and to ensure adequate
Mn nutrition for plant growth and development (Graham and Webb, 1991).
1.6 Molecular studies of Mn efficiency
Mn efficiency in plants when growïr in Mn limiting soils is critical to the growth and
development of the plant (sections 1.2 and 1.3). Therefore, the study of the Mn-efficient trait
has the potential to increase significantly the growth and yields of cereal crops.
1.6.1 Plant Mn status and Mn efficiency
A plant has a status of being Mn sufficient if the shoot Mn level is > 12.0-12.4 mg&'g
DM in barley varieties (Hannam et al., 1987). The soil is Mn sufficient for the plant, either
because the soil has adequate plant available Mt'*, or because the plant is expressing the Mn-
effrcient trait in a soil too deficient in plant available Mn for a standard genotype (Graham,
1984). Conversely, a plant is Mn deficient if the soil is too deficient in plant available Mn for
a standard genotype and the plant has expressed a putative Mn-inefficient trait.
1.6.2 Screening for Mn effÎciencY
In a controlled environment, two methods are used to screen barley varieties for the
Mn efficiency trait. As discussed (section 1.5.2), a solution culture method is used to detect
characters operative at the root surface and inwards to the plant interior. This involves loading
of Mn in the cell wall, nutrient reduction at the root plasma membranes, absorption rate,
translocation and efficiency of nutrient utilisation within the plant (Graham, 1984). In
contrast, a soil bioassay is used to detect characters of the Mn-efficient trait operative at the
root-soil interface, such as mobilisation of unavailable nutrients from the rhizosphere (section
16
1.5.2). The expression of the Mn-efficient or Mn-inefficient traits when barley is grown in
Mn limiting soil bioassays has been found to agree reasonably well with results obtained
under field conditions (Graham,1984 Wilhelm et al., 1988; Huang, 1996).
As described in section 1.5.2, the Mn efficiency trait in solution culture was not
expressed as either high dw mass yield or tissue Mn concentration (Huang et al., 1994)' In
solution culture, chelators are uniformly distributed throughout the solution. Consequently,
there are no concentration gradients generated down which there can be co-transport of Mn
towards the root. Hence, this result showed that the mechanism of the Mn-efficient trait is
likely to be due to the ability of the barley plant to mobilise Mn in the plant rhizosphere from
the soil solid phase via the soil solution to the plant root at the root-soil interface.
There is further evidence that no Mn-efficient trait in monocotyledons can be detected
when solution culture is used as a screening method. Barley grown in solution culture under Fe
deficient conditions induced phytosiderophore release, which is likely to be involved in Mn
availability, uptake or mobilisation (section 1.5.2). But no such phytosiderophore release
response from barley was obtained in low Mn solution culture (Gries, et al., 1995)' This
result suggests that only soil culture bioassay screening methods are appropriate for studying
the expression of the Mn-efficient or Mn-inefficient trait in monocotyledons such as barley.
1.6.3 The identification of genes for plant nutrition
There are several strategies available to isolate genes associated with plant nutrition. If
the DNA sequence of the gene encoding for the trait of interest is not known, a DNA based
strategy can be used to isolate and identify the gene. When the amino acid sequence of the
translation product of the gene of interest is known, protein based strategies can be used to
isolate and identiff the DNA fragment encoding for the protein using a synthesised
oligonucleotide probe derived from a unique region of the protein.
Mne-l was identified using a DNA based strategy. Huang et al., (1996b) constructed a
root cDNA library from a Mn-efficient barley genotype Weeah. Using differential screening,
Huang et al., (1996b), found that a clone, later designated Mne-l (492 bp), was in greater
abundance in an RNA gel blot analysis in'Weeah compared to the Mn-inefficient genotype V¡I
2585,when harvested at both 2l and28 days from sowing into a Mn limiting soil.
t7
Mne-l cDNA was sequenced, the amino-acid sequence determined, and shown to be a
zinc fìnger protein, Mne-| (Huang et a1.,1995). Mne-l shows close homology to a human
protein, MpS-l (GenBank and EMBL), which binds to a cAMP response element
(Fernandez-Pol et al., 1994:Xynos et al., 1994). The Mne-1 protein may be a DNA binding
regulatory transcriptional factor expressed as an adaptive response to Mn limiting soil
conditions to regulate genes responsible for the Mn-efficient trait in barley (Huang, 1996).
To check the possible mechanisms of expression of Mne-l, a protein based strategy
was used. The protein transcribed from Mne-l was expressed in E. coli, and polyclonal
antibodies were raised against it (Huang et a1.,1995). These antibodies were used to show that
there was more Mne-l protein inroots of the Mn-efficient variety Weeah compared to the
Mn-inefficient variety WI 2585. This may be consistent with the greater abundance of Mne-l
mRNA found in Weeah. This result suggested that under Mn limiting conditions in soil, there
may be a higher expression of Mne-l,both as mRNA and Mne-l protein, in the Mn-efficient
genotype compared to the Mn-inefficient genotype (Huang et a|.,1996b).
1.6.4 Molecular markers for nutritional traits
Several tools used in molecular biology are available to investigate the genetic basis of
the Mn-efficient or Mn-ineffrcient traits. Restriction Fragment Length Polymorphisms
(RFLPs) are used as genetic markers. RFLPs have been used to identify markers genetically
linkedto the trait of tolerance to low phosphorus stress inmaize plants (Reiter et al., 1991),
and RFLPs have been used to locate a salt tolerance gene in nce (Zhang et al., 1995). RFLP
maps are available for barley (Kleinhofs and Kilian, 1994). As stated in section 1.6.3, Mne-I
has been found to be associated with expression of the Mn efficiency trait (Huang et al.,
1996b). RFLP analysis has been used to detect a genetic locus Mel 1 located on 4HS between
the Mn-efficient Amagi Nijo, and Mn-inefficient WI 2585 (Pallotta et al., 1999).
1.6.5 Genetic strategies used
A cross of the Mn-efficient Amagi Nijo and the Mn-inefficient WI 2585 had resulted
in F2 lines segregating for either the Mn-efficient or the Mn-inefficient trait when grown in
Mn limiting soil (Pallotta et al.,lggg). Amagi Nijo is a Japanese line, (see section l'2.2), and
WI 2585 is derived from the Egyptian line, CI 3516. Seventeen F3 families had been generated

18
from the selfing of selected F2 plants. In progeny testing, ten F3 families showed the lowest
Mn uptake efhciency similar to the WI 2585 parent. Bulk RFLP analysis of these F2 lines to
map the Mn uptake efficiency suggested a possible linkage with the Mn inefhciency trait in
the WI 2585 parent. Seven F3 families with the highest Mn uptake efficiency showed a Mn
uptake effrciency similar to the Amagi Nijo parent in all except one F3 family. In this F3
family, the Mn uptake effrciency levels (shoot Mn concentration) were segÍegating over a
range from 6-12 mg/kg DM. This result suggests that there was more than one loci influencing
the Mn-efficient trait in one of the selected F2lines.
1.6.6 Summary
The 4HS Met l alleles for Mn efficiency and Mn inefficiency can be identified using
RFLP probes wg622, cdo583, abg714 andmwg77 (Pallotta et al., 1999). These probes can be
used to identiry alleles for Mn efflrciency and Mn inefficiency in plants. When plants with the
Mn-efficient allele are grown in soil low in plant available Mn, experiments can be done to
determine if these plants have a higher resistance to infection by Ggt compared to plants with
the Mn-inefhcient allele.
1.7 Disease resistance in plants
Micronutrient deficiency has been found to be a critical for plant resistance to certain
diseases
1.7.1 Host disease resistance
Disease resistance in a host is defined as the ability to limit the penetration,
development, and/or reproduction of invading pathogens (Graham and Webb, 1991; V/allwork,
1996). In resistant crop varieties, less of the disease inoculum survives to infect crops in the
following season (V/allwork, 1996). Resistance can vary with genotype of the host and
pathogen, host age and changes in the environment. Specific resistance is controlled by one or
more major genes. Non-specific resistance is polygenic, and is often degraded by micronutrient
deficiency in the host (V/est ern, I97 l; Graham and Webb, 1 991). Resistance to pathogens like

t9
take-all, which seems to be Mn dependent, is most likely non-specihc resistance (Graham,
1e83).
1.7.2 Host disease tolerance
Tolerance to disease in the plant host is defined as the ability to maintain its own
growth and yield well in spite of infection (Trudgill, 1986; V/allwork, 1996).
1.7.3 Host disease resistance or tolerance?
There is much debate about the definition of plant resistance and tolerance towards
disease. But for the plant, resistance and tolerance are independent of each other. This is
because resistant plants may still suffer large yield losses when the disease is present, while
tolerant plants showing little effects on yield of disease pathogenicity may leave large
amounts of disease inoculum resulting in greater damage to subsequent crops (Wallwork,
1996). Thus, it is ideal to breed plant varieties which have both resistance and tolerance to
disease.
The difference between resistance and tolerance becomes ambiguous when the
pathogen produces toxic substances which inhibit regrowth of the host plant (V/allace, 1987).
The most likely defence mechanism barley has against take-all invasion is thought to be
increased lignin production (Skou 1981; Graham and Webb, 1991). Therefore, because the
plant produces a physical barrier to take-all penetrating the root, the plant exhibits resistance
to the pathogen.
1.8 Gaeumannomyces gramínis var. tríticí (Ggt)
The fungus, Gaeumannomyces graminis var. (Sacc) von Arx & Oliver vat tritici
'Walker, (Ggf) (cf. Walker, 19Sl) has a world-wide distribution and is a serious disease of
crops (Samuel and Piper, 1928; Cook, lgg4). In Australia, the disease occurs across the
southern grain belt, extending from Western Australia, through to South Australia, Victoria
and most of New South Wales (Mac Nish, 1980; Samuel, 1924; Wong, 1983)' Ggt has
mycelium which consists of black-brown thick walled ectopic runner hyphae which grow
along the outside of root systems of crop plants forming a net around the root' From the net-
like structure, hyaline thin-walled hyphae invade the root (Garrett, 1934a). Ggl, when grown
20
in both culture medium and on wheat roots, has been found to secrete cell wall degrading
enzymes to enhance invasion of the root (Dori et al., 1995). The Ggt hyphae effectively
amputate plant roots by penetrating the root cortex, then the endodermis, and finally
penetrating the phloem and blocking the xylem (Asher, 1981).
1.8.1 Ggt disease
Severe Ggl infection leads to plant death due to the cutting off of supplies of
carbohydrates via the phloem to the root tip, and of nutrients and water via the xylem to the
shoots (Graham and Webb, 1991). In less severe infection, stelar lesions of the root are visible
by the naked eye as discolouration of the root vascular system (the phloem and the xylem
together known as the stele) (Asher, 1981). The plant appears normal until hot dry conditions
near harvest cause water stress, reduced head formation, and grain yield loss. Moderate
infection may be sub-clinical even up to harvesting. However, yield is signihcantly reduced
due to the plant redirecting resources to infection defence mechanisms such as growing new
roots rather than shoots (Rovira and Venn, 1985).
The order of susceptibility of cereals to take-all infection is wheat > barley > triticale
> rye > oats (Scott and Hollins, 1985; Scott e/ at., 1985; Hollins et al., 1986; Dewan and
Sivasithamparam, 1990). Significantly, this order of susceptibility to Ggt is the reverse of the
order of the expression of the Mn efficiency trait in many of these cereals except oats (section
I.2.2). The most sensitive measure of infection levels of Ggt isolates in association with the
level of plant Mn has been found to be the average length of stelar lesions in the plant roots
per plant (Wilhelm, 1991; Pedler,1994).
1.8.2 The biology of Ggt
Ggtis a homothallic ascomycete which is haploid drning its vegetative phase (Asher,
19Sl). Ggt also has a diploid zygote phase. In culture the ascospores form conidia which
germinate into mainly uninucleate hyphae. In soil the ascospores form asexual phialidic
conidia which do not germinate (Asher, 19Sl). Therefore, the ascospores formed by Ggt
germinate in culture but not in soil.
2l1.8.3 Pathogenic variation
There are many isolates of Ggt with differing degrees of pathogenicity (as measured by
the amount of Ggt invasiveness of the plant root). The mycelia are heterokaryotic, having
nuclei of several genotypes in the same cell or in a common cytoplasm (Asher, 1981). The
genetically heterogeneous mycelia can respond to selection pressure. More vigorous mycelia
grow faster towards the root in response to root exudates than less vigorous mycelia. Thus,
the more vigorous isolates are selected for survival. The pathogenicity of the isolates has not
been found to be associated with the presence or absence of melanin in the runner hyphae, or
to the rate of growth of the Ggl isolates on agar (Asher, 193l). However, it has been found to
be related to the manganese-oxidising ability of the isolates (section 1.8.6) (Pedler et al, 1996).
1.8.4 Ggt survival and crop rotation
Under Australian field conditions, Ggl survives dormant but viable in the soil as a
saprophyte within the debris of a previous host. As a result, cultivation of "cleaning" or
"break" crops not susceptible to take-all is one strategy used to reduce saprophytic survival
and thus infection of the subsequent take-all susceptible cereal crops. Conversely, cultivation
of cereal crops of greater susceptibility to take-all increases the severity of take-all infection in
subsequent susceptible crops ostensibly because of the higher survival of the saprophyte in
the soil (Brassett and Gilligan, 1990).
However, the strategy of rotating take-all susceptible/non susceptible crops, to reduce
saprophytic survival of Ggt inoculum has given ambiguous results in other studies
(Kollmorgen et al., l9S5b). The strategy of planting crops less susceptible to Ggt in between
Ggl susceptible crops has been found to both decrease (Moore and Cook, 1984; Rovira and
Venn, 1985), and increase (De Boer and Kollmorgen,ISST; Rothrock, 1987) the levels of take-
all infection.
Under field conditions, time, warm weather and moisture decrease the viability of Ggt
inoculum (Garrett, 1938; Kollmorgen, 1985a). The inoculum exists mostly in the upper 10-15
cm of the soil (Kollmorgen et al., 1985a). The presence in the soil of live susceptible roots has
been found to elicit hyphal growth trophically from plant to plant to a distance of 1.5 m over
8 months, (Wehrle and Ogilvie, 1955). In plate culture, hyphae have been found to grow

22
rapidly for a distance of 12 mm, after which the growth rate of the hyphae is slowed because
of depleted ion availability in the media (Gilligan, 1980).
1.8.5 Attenuation and restoration of G{ pathogenicify
Subculturin g of Ggt isolates can lead to attenuation of pathogenicity (Cunningham,
19Sl). Thus, long term storage of Ggt isolates by repeated subculturing on agar crn lead to
loss of pathogenicity (Pedler et al,. 1996). However, pathogenicity of the isolate is restored
by passage through the host plant. As discussed in section 1.8.3, the restoration of
pathogenicity can occur because of selection pressure for potential pathogenic characteristics
within the vegetative mycelium . Ggt hyphae can respond with vigorous growth after contact
with root exudates, and grow throughout the host plant by invasion of the roots (Kollmorgen
et al., 1985b).
1.8.6 Environmental conditions and take-all disease
Take-all disease is severe in cool, moist, alkaline or neutral pH soils (Cook, 1981;
Huber 1981). As discussed (section 1.4), available Mn is low in these soil conditions (Leeper
1970). Fertilisers, due to their influence on soil pH, alter the amount of plant available Mn in
the soil and consequently the severity of Ggt infection (Huber, 1981). The addition of nitrate
nitrogen fertiliser to soil increases soil pH which promotes the oxidation of the plant available
Mn2* to plant unavailable insoluble Mn oxides (Mn IV). When plant available Mn is low in
soil, the severity of Ggt infection is increased (Huber, 19Sl). Conversely, the severity of Ggt
infection is decreased by ammonium based fertilisers because soil pH is lowered, which
promotes the reduction of MnIV to increase the amount of plant available Mn2* (Huber
1981). Soil-borne micro-organisms which are either reducers or oxidisers reveÍse the above
processes, and a variety of linked environmental factors which change soil pH, decrease or
eliminate the microbial influence on the soil Mn2* (section 1.4) (Leeper, 1970).
Isolates of Ggt need Mn for growth, but the available Mn required is only one
hundredth of that needed by higher plants (Bertrand and Javillier,lgl2)' Ggt in plate culture
has been found to oxidise Mn2* to brown MnO2, which was also highly correlated with the
pathogenicity of the isolate (Wilhelm et al., 1990; Schulze et al., 1995; Pedler et al., 1996)-
The Mn oxidising ability of Ggt could be a mechanism by which Ggt can protect itself from
23
Mntoxicity (Graham, 1983), and at the same time deprive the root of the host plant of Mn
and therefore reduce the efficacy of the plant root defence mechanisms involving Mn (section
1.9). However, Mn levels in calcareous soils have not been found to be toxic to Ggt growth
(Wilhelm et al.,1988).
1.9 Mn plant defence mechanisms against take-all
The nature of the plant defence mechanism involving Mn which protects different
crops (section 1.8.1), and genotypes of barley having different susceptibilities to root invasion
by take-all is not clear.
1.9.1 Micronutrient stress, and disease resistance and tolerance
Micronutrient deficiencies can not have been frequent enough before the agrarian
revolution to limit the survival of crop plants through evolutionary time (Graham, 1983). In
addition, crop plants must have co-existed in a delicate balance with their pathogens, without
either the plant host or the pathogen eliminating each other. Changes in soil fertility can shift
this balance as appears to have happened with the use of nitrogen fertilisers. The development
of nitrogen fertilisers have made possible the annual cultivation of crops in previously infertile
soils (Graham, 1983). However, micronutrient deficiencies inthese soils were not changed, so
crops may have suffered more from micronutrient stress such as Mn deficiency after nitrogen
and phosphorus deficiencies were eliminated. Further, the Mn deficiency gave crop plants
increased susceptibilities to pathogens such as take-all (Graham, 1983).
1.9.2 Lignin biosynthetic pathway and take-all
One plant defence mechanism against root invasion by take-all may be related to
increased ligninproduction (Skou, 19S1). Lignin forms a protective ectopic barrier around the
roots of plants. The synthesis of phenols ancl lignin occurs in normal higher-plant growth, and
so is an obligate process. However localised lignin synthesis has been induced by biotic
"elicitors" (Barber and Ride, 198S). The fungus Ggthasbeen observed to induce the formation
of ligneous structures known as lignitubers (Skou, 1981), which may act as a physical barrier
to protect the plant roots from invasion by Ggt.
24
As discussed (section 1.3.3), during biosynthesis of lignin, monophenols are oxidised
by Mn-peroxidase. Because many oxidised phenols are toxic, phenol production has also been
implicated in plant host defences against invading pathogens (Bell, 1981). In addition,
phenolics can reduce Mn oxides (stone and Morgan, 1984), but probably not enough to
release soluble Mn2* to the plant in calcareous soils (pH 5-6) (Godo and Reisenauer, 1980). It
is likely that the same effect of pH in calcareous soils applies to malic acid, which is a MnO2
reducing root exudate of wheat (Jauregui and Reisenauer, 1982b). All of these mechanisms that
Mn participates in are likely to inhibit infection of the roots of plants by take-all' However,
no connection between take-all resistance and production of phenolics and lignin was found in
wheat genotypes with different Mn efficiency (Rengel et al., 1993;1994a).
1.9.3 Mn and aminopePtidase
The role of aminopeptidase is most likely to provide a supply of amino acids for
fr¡rgal growth. Aminopeptidase production in plants is activated by pathogens. However,
aminopeptidase activity is inhibited by the presence of Mn2* (Huber and Keeler, 1977), and
this may be another mechanism by which Mn in the soil and in the plant root rhizosphere
inhibits the growth of pathogens such as take-all.
1.9.4 Mn and pectin methylesterase
Pectin methylesterase is an enzyme which fungi produce in order to break down the
cell walls of the host plant, facilitating invasion of the host plant root. However, like
aminopeptidase, Mn also inhibits the activity of pectin metþlesterase (Sadasivan, 1965), and
Mn2* in the root rhizosphere can be expected to inhibit take-all invasion and infection of plant
roots.
1.9.5 Mn and Pseudomonas fluorescens
Soil-borne micro-organisms inhibit Ggt infection of plant roots. Bacillus cereus has
been found to reduce insoluble manganese oxides to Mn2* ions (Wilhelm et al', 1987: Wilhelm,
et al., 1990). Thus more Mn can be made available to the plant for use in plant defence
mechanisms against pathogen invasion. Pseudomonas fluorescens is a micro-organism
common in soil which suppresses take-all. P. fluorescens produce siderophores, which

25
scavenge free soil Fe3*. Siderophores transport Fe to the root surface and their function is as a
chelator (Nielands and Leong, 1986). Mn uptake in the root is thought to be by a similar
mechanism. Therefore siderophores may enhance Mn uptake in roots.
Strain 2-79 of P. fluorescens has also been found to increase Mn-peroxidase activity
(Albert and Anderson, 1987). The increased Mn-peroxidase activity would result in greater
lignin production in the plant roots to act as a more impenetrable barrier to pathogen invasion'
P. fluorescens also produces an anti-fungal compound, phenazine-1-carboxylate. This
compound is more toxic to wheat than Ggt, but it also reduces the growth of the take-all
fungus (Coghlan, lgg6).The action of all of these factors can inhibit growth and infection by
take-all
1.9.6 The role of micronutrients in susceptibility to Ggt
Mn seems to be the major plant micronutrient affecting susceptibility of the plant to
take-all infection. As discussed (section 1.4.3 and section 1.4.4), the addition of ammonium
fertilisers to the soil increases soil acidity and subsequently the amount of plant available Mn
(Conner, 1932;Leeper, 1970; Reuter et al., l9l3b). Copper, (Cu) and zinc, (Zn) become plant
available in Cu and. Zn deficient soils in a bi-modal acid and alkaline range (Graham and
Nambiar, 1981; Kubota and Allaway , 1972). The pH pattern of soil Fe availability to plants
resembles that of Mn, but Fe has no effect on take-all, while addition of Cu and Zn decreased
take-all infection (Reis e/ al., 1982; V/ood and Robson, 1984). However, the environmental
effects on soil pH and soil plant available Mn deficiency in wheat plants was the only
significant factor conesponding with the predisposition of the plants to take-all infection.
Therefore Mn seems to be the major micronutrient effecting the susceptibility of wheat plants
to take-all infection (Graham, 1983).
1.10 Thesis prologue
The aim of this research is to determine, in barley (Hordeum vulgare L.) grown in Mn-
deficient soil, if there is a causal connection between manganese uptake efficiency and
resistance to root invasion by Gaeumannomyces graminis var. tritici (GSt).My pilot work
found that when the Mn-effrcient Amagi Nijo and the Mn-inefficient V/I 2584 were grown in

26
Mn deficient soil, the Mn-efficient Amagi Nijo had less Ggr infection compared to the Mn-
inefficient WI 2585.
Physiological studies
X'irst Null Hypothesis: There is no physiological connection between the expression of the
Mn efficiency trait in barley and enhanced resistance to Ggt.
1). The aim of the pilot experiments will be to screen different Ggl isolates, select one suitable
for my experiments, and to see if there is a difference in infection between Mn-efficient
genotype Amagi Nijo and Mn-ineff,rcient genotype \VI 2585 when grown in Mn limiting soil
(chapter 2 and chapter 3).
2). The next experiment will screen Amagi Nijo and .WI
2535 in a pot assay to determine if
there is a difference in Ggt infection which correlates with the Mn status of the plants when
grown in soil with levels of Mn fertiliser added that give plants of deficient Mn status and
suffîcient Mn status (chaPter 4).
3). A further time course experiment can show if the Mn-efficient trait and resistance to Ggt
could be associated with a plant defence mechanism within the root (chapter 4).
4). Additional factors, other than Mn uptake efficiency, (eg root lignin synthesis, Ggt ectopic
root growth and Ggl penetration of the root) will be investigated using fluorescent and
Scanning Electron Microscopy (SEM) (chapter 5).
Genetic studies
If the physiological studies suggest a connection between Mn efficiency and resistance to Ggt,
a second hypothesis will be investigated. Second Null Hypothesis: There is no genetic
linkage between the recently identified Met I locus (4HS) Mn-efficient allele and enhanced
resistance to Ggt (chapter 6).
l). Map the Mel l locus for Ggt resistance/Mn efficiency using RFLP analysis of 439 doubled
haploid (DH) lines to a particular locus on chromosome 4HS (chapter 6).
2). Use AFLP analysis to identiff AFLP molecular markers specific to Mel l to replace the
RFLP marker Xabg7l4,which is difficult to use because it identifies multiple loci (chapter 6).
3). Use lines from the DH population where the RFLP and AFLP allele type at Mel t has
been determined to search for linkage between Mn eff,rciency and Ggl infection (chapter 6).

21
4). Identifi loci other than Mel l which influence Mn efhciency and determine if other Mn
efficiency loci are genetically linked with resistanceto Ggt infection (chapter 6).

28
Chapter 2 Pilot studies
2.1 Introduction
previous bioassays in Wangary soil had shown that when Amagi Nijo and WI 2585
were growït in Mn deficient soil supplemented with Mn, the shoot Mn concentration of
Amagi Nijo was above the critical Mn level for barley (11 mg/kg DM), (Hannam et al., 1987),
while the shoot Mn concentration of WI 2585 was below the critical level of barley (see
section 1.6.5 and section 1.6.6) (Pallotta, et. al., 1999). This result showed that Amagi Nijo is
a Mn-efficient genotype while WI 2585 is a Mn-inefficient one. If the expression of Mn
efficiency enhances resistance to Ggt (see section 1.8 and section 1.8.1), a pilot study with the
Ggl fungus added to the pots of both Amagi Nijo and WI 2585 grown in Mn deficient soil
would show more infection in the Mn-inefficient WI 2585 than in the Mn-efficient Amagi
Nrjo.
2.1.1 Pilot studies
Repeated subculturin g of Gg isolates has lead to attenuation of pathogenicity (Pedler
et al.,1996), but the virulence can be restored via one passage through the host plants. The
virulence is maintained by culture of Ggt on seed of the host plants (Wilhelm' 1991)' The
appropriate Ggl isolate will be selected for use in the experiments after one passage through
the host plants, on the basis of a radial growth on 4o/o PDA that is not inhibited by the
addition of increasing concentrations of Mn, and on the basis of showing an increase in
pathogenicity of infection in the roots. Levels of infection by Ggt are known to give high
variability (Wilhelm, 1991, and Pedler, lg94). Therefore, the infection on each genotype will
be checked and the sample size calculated to optimise the possibility of obtaining statistically
significant differences in infection between WI 2585 and Amagi Nijo.
2.2 Method
2.2.lExperiment lz Ggt tolerance to Mn
Mn (as MnSO+) was added at the levels 0,5,'7.5,10, 15, 20,30 and 100 mg MrVL to
4yopDA, (0.156 gPotato DextroseAgar (PDA) and I gDifco Bacto Agar/100 ml milli-Q
29
HzO). After the 4% PDA and added Mn were autoclaved at l20oC and 100 kPa for 15
minutes, three petri dishes of each Mn level were prepared for each Ggt isolate treatment.
Seven Ggl isolates used (provided by Dr P Harvey) were; Ggt 23580, Ggt 23125, Ggt
11916, Ggt 51463, Ggt C 3, Ggt KM 69, and Ggt KS l. From the edge of an actively growing
colony on4¡%opDA, mycelial cubes (4 mm x 4 mm x 4 mm) were cut and used to inoculate
the centre of the petri dishes. Asepsis was used throughout all inoculation procedures. The
inoculated dishes were allowed to grow in the dark at 15-20oC for 5-10 days. The radius of
Ggl growth (mm) was recorded from the average of measurements taken at right angles to
each-other to determine the rate of growth of each isolate over the duration of the experiment.
2.2.2 Experiment 2 : Increase d Ggt patho genicity
Soil treatment and basal nutrients
The soil used was collected from a severely Mn-deficient site, Wangary, Eyre
peninsula, SA. The topsoil (0-10 cm) and sub soil (10-20 cm) were air dried and sieved
through a 2-mm stainless steel sieve, mixed (1:1, w/w), ffid 20Yo wlw milli-Q water
(resistivity, 18.2 MO cm) was added. The mixed soil, a calcareous sand,67Yo CaCO3 pH 8.63,
was sealed in water tight plastic, protected from the light, and incubated at 15'C dayll0"C
night for 2l days. pre-incubation oxidises the plant available Mn which was released during
the drying phase (Uren, et a1.,1988). Before sowing, the following basal nutrients were added
and mixed well into the incubated soil at rates of (mg/kg dry soil): Ca(NO3)2.4HzO' 918;
KH2POa, 179.5; MgSOa.7H2O, 140; H3BO3, 5.6; ZnSOa.7H2O, 17.16:' NaCl' 4.16;
cusoa.5H2 o, 3.9; CoSOa.7H2O, 0.585; H2MoOa.H 20, 0.13; K2soa, 28.4: and FeSOa.7H2O,
n.2
Potting the soil, Ggt inoculation and sowing of seeds
Mn, as MnSOa, was aclcled at 6 levels corresponding to 0, 7 .5, 10, 15, 30, and 100 ng
Mn/kg dry soil. The pots (6.5 cm diameter x 15 cm high) were lined on the outside with
aluminium foil to exclude light and lined with a polythene bag on the inside. The Mn
supplemented soil (a30 g) was added to the pots. Then, an intact agar disk (6 cm in diameter),
either completely covered with a mat of the Ggl isolate tl9l6 or with no fungus (control) was
placed on top of this soil. To germinate the seeds, the seeds were surface sterilised in sodium

30
hypochlorite (l%) for 15 minutes, rinsed 5 times in sterile milli-Q H2O, placed in petri dishes
on moist Whatman No. 42 ashless filter paper and stored 4'C in the dark 48 hours, then
placed at room temperature for 48 hours in the dark. A further 30 g soil of the appropriate
Mn addition was added to the pots, 3 seed of either Amagi Nijo or WI 2585 were sown, and
hnally 30 g more of the Mn supplemented soil was added. There were 6 Mn levels x 2
genotypes x2 Ggt treatments x 3 replicate pots. In all, there were 72 pots.
Growth and harvesting
Plants were grown in a controlled-environment chamber with a cycle of 14 h dayllO h
night and l5"C dayllO'C night. The photon flux density was set at 500 pmol/m2ls 15-cm
above the surface of the pots. The labelled pots were placed on the bench in a completely
randomised design, generated with Microsoft Excel 4.0, and rotated and watered daily to a
water content of 20Yo (1v/w) with milli-Q HzO. Experiments were harvested at 28 days after
sowing. At harvest, the two youngest emerged leaves, the remainder of the shoots (YEBs),
and the roots were separated, the fresh mass taken and recorded, the samples placed into
labelled envelopes, oven dried 80'C for 48 h and weighed. The Mn concentration was
determined by digestion in nitric acid (HNO z l%) and analysis of mineral elements by
Inductively Coupled Plasma Atomic Emission Spectrometry (ICPAES) (Zatcinas et al.,
1987). The shoot Mn content (pg/pot) was calculated from the multiplication of the shoot dry
weight mass (DM) (mg/pot) by the shoot Mn concentration (mg MrVkg DM). The mean and
standard enor (SE) of all data were calculated. Statistical analysis was for a completely
randomised design using a l-way ANOVA or a2-way ANOVA (Microsoft Excel 4'0) (cr :
0.05).
Determination of Ggt infection
After roots were washed, the primary roots were examined. The number of stelar
lesions on each plant (NSL) and the length of each stelar lesion (LSL) (mm) were recorded.
From these data, the average length of stelar lesion per plant (Av.LSL) (mm) was calculated'
Also recorded were the number of primary roots per plant (NOR), and the number of infected
primary roots per plant (NIR). From these data the percent of infected primary roots per
plant (PIR) (%) was calculated. Statistical analysis was for a completely randomised design
3I
using a 1-way ANOVA or az-way ANOVA (Appendix 2) (Microsoft Excel a.0) (ct : 0.05).
To satisfy the assumptions of analysis of variance so that ANOVAs could be used for
determining significant differences, the highly variable infection data was normalised with a log
transformation of the Av.LSL data, and a square root transformation on the PIR data (M'
Lorimer, BiometricsSA). The mean and SE of all data were calculated.
2.2.3 Experiment 3: Calculation of sample size
A check was made to determine if, after one passage through the host plants, the Ggt
isolate 17916 had increased pathogenicity. Compared to the Av.LSL obtained at the first
passage through the host plants, the second passage through the host plants resulted in the
Ggl isolate 17916 giving an increased average length of stelar lesion (Av'LSL), that was
significantly greater in WI 2585 (44.6 + 4.8 mm/3 plants, n:3 pots) than in the Mn-efficient
Amagi Nijo (16.1 + 7.6 mml3plants n : 3 pots) (p : 0.06) (2-way ANOVA with replication)
(section 2.2.2). Thus, the minimum detectable difference expected (ô) was conservatively
estimated to be ô : 15. To enhance the possibility of obtaining statistical significance in the
highly variable infection level results obtained between Amagi Nijo and WI 2585, the chosen
values were cx, : 0.05 with a power þ : 90o/o, ie. 0.90. The sample size equation used for the
sample size calculation was 11.26 (Zar,l984). The number of groups (genotypes) (k: 2), and
using s2: l42.3,with a guessed sample size, (n), and v2 : k(n-l), for n : 6, v2: 10 with Q :
0.48, for î: 12, v2:22 with Q : 0.87, which is close to the required 0.90, and for n : 24, v2:
56 with O > 1.0. Therefore, the sample size of n : 12,with ct: 0.05 and Q : 0.87 was chosen
as the number of replicate pots needed to optimise the possibility of detecting arry
stati stically si gnifi cant difference s in G gt infection level s.
2.2.4 Experiment 4: Confirmation of an adequate sample size
Â. pilot study was conducted in a completely randomised clesign with Mn as MnSOa
added at 15 mg Mn/kg dry soil. There were 3 seed of either WI 2585 or Amagi Nijo grown in
each of 12 pots that were inoculated with either Ggt 17916 or with nil Ggt (control) as in
section 2.2.2 (2 genotypes x 12 pots x2 Ggt treatments). In all there were 48 pots.
32
2.2.5 Seed Mn
Seed Mn concentration affects early seedling growth (Marcar and Graham, 1986) and
dry weight yield (Longnecker et al., 1988). To eliminate the confounding effects differences in
seed Mn concentration may give in the results, the seed sown of each parent genotype or
doubled haploid (DH) line was of similar size, germination stage and Mn concentration
(Appendix 1, Table 2.1 and Table 2.2). The Mn concentration of seeds was determined (see
section 2.2.2).
2.3 Results
The Ggt isolate which met all the selection criteria was Ggt isolate 17916. The results
are given below.
2.3.1 Experiment lz Ggt tolerance to Mn
The tolerance of Ggt isolate 17916 to Mn after one passage through the host plants
was checked to determine if the radial growth of the isolate was slowed by increasing levels of
Mn added to 4yo pDA (Fig. 2.1). The growth radius of Ggt 17916 gave significant differences
between the increasing concentrations of Mn 0-100 added to the 4%PDA (p < 1.0x10⁻³, 1-
way ANOVA, r: 3). But this was due to the growth radius of the Ggt beng consistent at all
levels of Mn except for Mn 100, where the growth radius was significantly slowed (Fig' 2.2).
However Mn 100 is a Mn addition that will not be used when Ggt infection is determined in
Mn-supplemented soil bioassaYs.

it
.bl¡r0
É*rlo f,J
¿t,
lltæ
Èt
. llt tS
'r!:i
Ir'{û Hnlü!. . ,
fr
lra
Fig. 2.1 Growth of Ggt 17916 on 9 levels of Mn added to 47o PDA
over 8 days shows sensitivity to Mn only at Mn 100. Where the Mn as
MnSO¿ had been added to 4Vo PDA, the Mn was oxidised by Ggt 17916
to brown granules of MnOz.
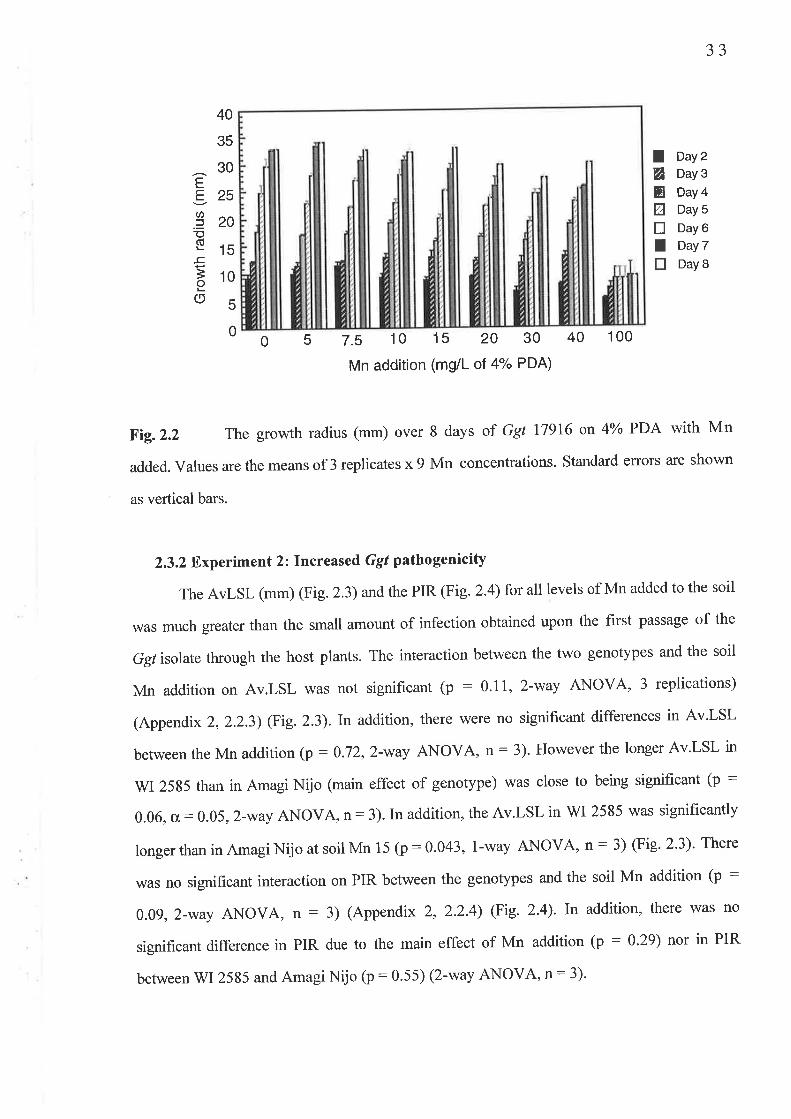
33
Day
Day
Day
Day
Day
Day
Day
IøEEtrItr
40
35
^30E925.3_ 20Þs15-c
ã10o50
2
3
45
67
I
05 7.5 10 15 20 30 40
Mn addition (mg/L of 4"/" PDA)
100
ßig.2.2 The growth radius (mm) over 8 days of Ggt 17916 on 4o/o PDA with Mn
added. Values are the means of 3 replicates x 9 Mn concentrations. Standard eÍrors are shown
as vertical bars.
2.3.2 Experiment 2: Increased' Ggt pathogenicity
The AvLSL (mm) (Fig. 2.3) and the PIR (Fig. 2.4) for all levels of Mn added to the soil
was much greater than the small amount of infection obtained upon the first passage of the
Ggl isolate through the host plants. The interaction between the two genotypes and the soil
Mn addition on Av.LSL was not significant (p : 0'11, 2-way ANOVA, 3 replications)
(Appendix 2,2.2.3) (Fig.2.3). In addition, there were no significant differences in Av.LSL
betweentheMnaddition(p:0.72,2-wayANOVA,n:3).HoweverthelongerAv.LSLin
q¡1 2585 than in Amagi Nijo (main effect of genotype) was close to being signihcant (p :
0.06, a:0.05, 2-way ANOVA, n:3). In addition, the Av.LSL in V/I 2585 was significantly
longer than in Amagi Nijo at soil Mn 15 (p: 0.043, l-way ANOVA, n : 3) (Fig' 2'3)' There
was no significant interaction on PIR between the genotypes and the soil Mn addition (p :
0.09,2-way ANOVA, n : 3) (Appendix 2, 2.2.4) (Fig. 2.Ð' In addition, there was no
significant difference in PIR due to the main effect of Mn addition (p : 0.29) nor in PIR
between WI 2585 and Amagi Nrjo (p : 0'55) (2-way ANOVA, n = 3)'
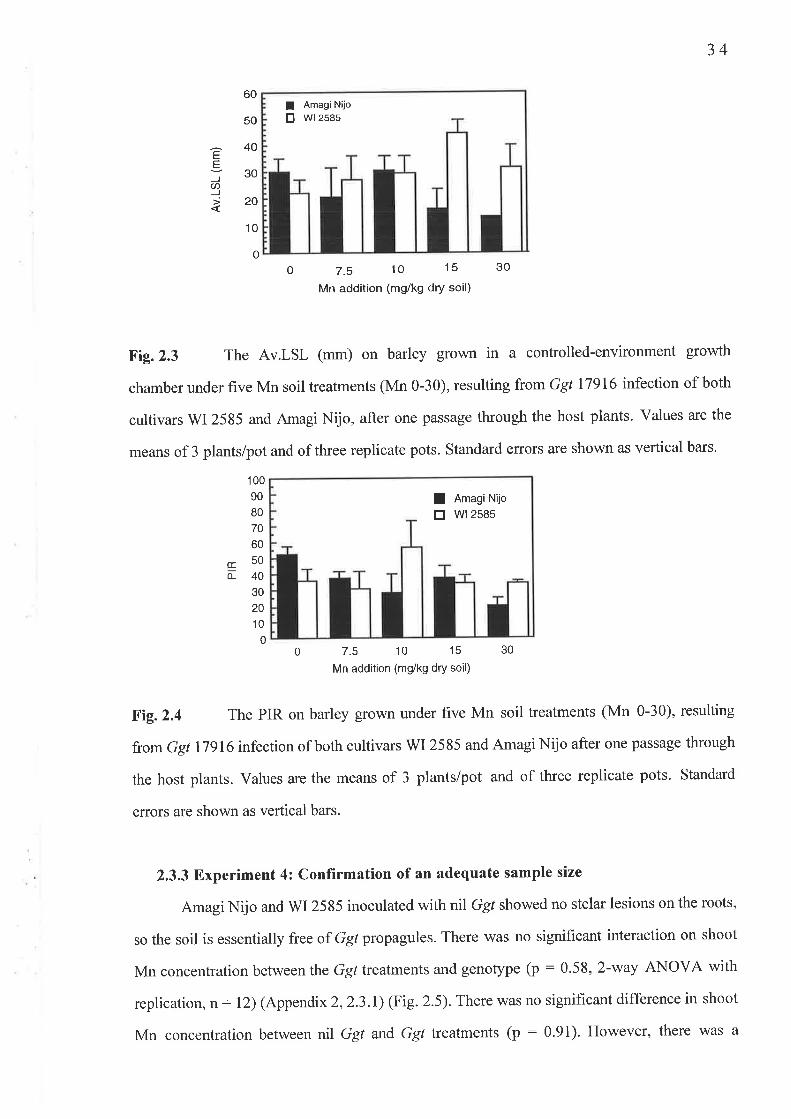
34
EEJ(t)Jt
60
50
40
30
20
10
o
I Amagi Nilo
El wr 2585
0 7.5 10 15
Mn addition (mg/kg dry soil)
7.5 10 15
Mn addition (mg/kg dry soil)
30
30
Fig.2.3 The Av.LSL (mm) on barley gro,wn in a controlled-environment growth
chamber under five Mn soil treatments (Mn 0-30), resulting from Ggt 17916 infection of both
cultivars WI2585 and Amagi Nijo, after one passage through the host plants. Values are the
means of 3 plants/pot and of three replicate pots. Standard errors are shown as vertical bars.
I AmagiNijo
E W12585
100
90
80
70
60
50
40
30
20
10
0
Éo-
0
Fig.2.4 The PIR on barley grown under five Mn soil treatments (Mn 0-30), resulting
from Ggt 17916 infection of both cultivars WI 2585 and Amagi Nijo after one passage through
the host plants. Values are the means of 3 plants/pot and of three replicate pots. Standard
errors are shown as vertical bars.
2.3.3 Experiment 4: Confirmation of an adequate sample size
Amagi Nijo and WI 2585 inoculated with nil Ggf showed no stelar lesions on the roots,
so the soil is essentially free of Ggt propagules. There was no significant interaction on shoot
Mn concentration between the Ggt treatments and genotype (p : 0.58, 2-way ANOVA with
replication, n: 12) (Appendix 2,2.3.1) (Fig. 2.5). There was no significant difference in shoot
Mn concentration between nil Ggt and Ggt treatments (p : 0.91). However, there was a
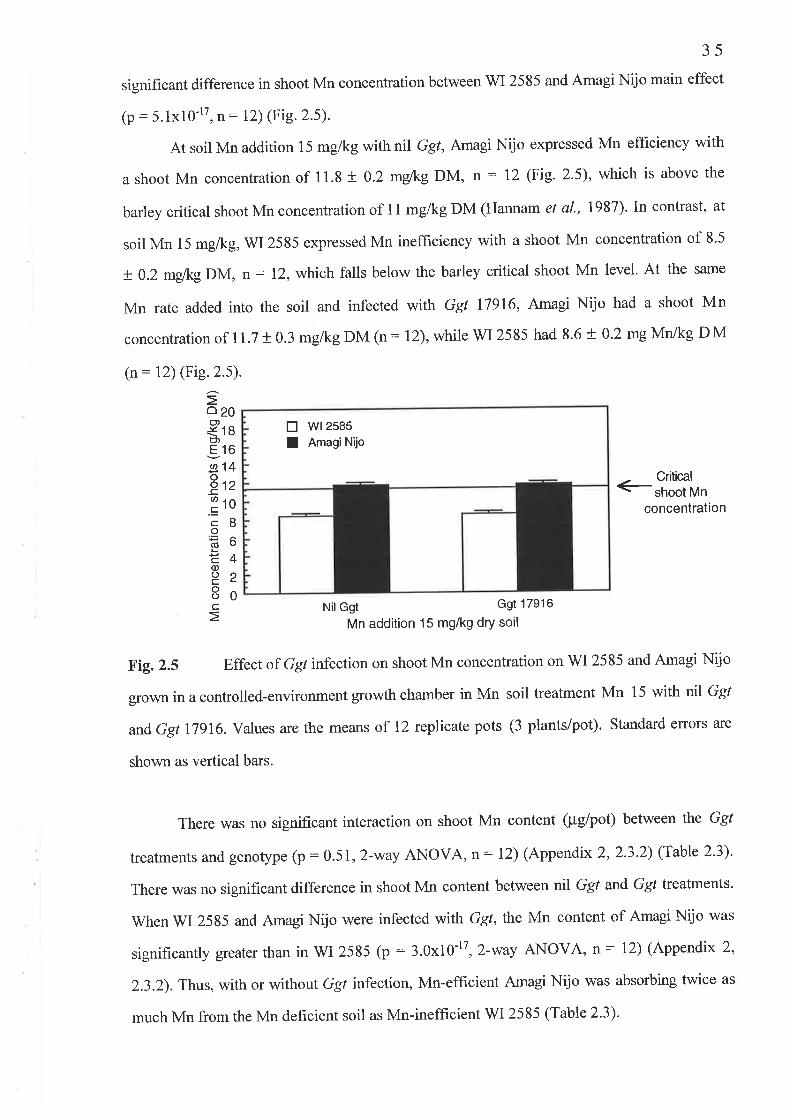
35
significant difference in shoot Mn concentration between WI 2585 and Amagi Nijo main effect
(p: 5.1xl0-r7, n: 12) (Fig.2.5).
At soil Mn addition 15 mg/kg with nil Ggt, Amagi Nijo expressed Mn efficiency with
ashoot Mn concentrationof 11.8 + 0.2 mdkg DM, n : 12 (Fig.2.5), which is above the
barley critical shoot Mn concentration of 11 mg/kg DM (Hannam et al., 1987). In contrast, at
soil Mn 15 mg/kg, WI2585 expressed Mn inefficiency with a shoot Mn concentration of 8.5
t 0.2 mdkg DM, n : 12, which falls below the barley critical shoot Mn level. At the same
Mn rate added into the soil and infected with Ggr 17916, Amagi Nijo had a shoot Mn
concentration of ll.7 t0.3 mg/kg DM (n : lz),while WI2585 had 8.6 + 0.2 mg MrVkg DM
(n: l2) (Fig. 2.s).
20
18
16
14
12
10
8
64
2
0NilGgt Ggt 17916
Mn addition 15 mg/kg dry soil
Fig. 2.5 Effect of Ggt infection on shoot Mn concentration on WI 2585 and Amagi Nijo
gro\^/ïì in a controlled-environment growth chamber in Mn soil treatment Mn 15 with nl Ggt
andGgt 17916. Values are the means of 12 replicate pots (3 plants/pot). Standard errors are
shown as vertical bars.
There was no significant interaction on shoot Mn content (pg/pot) between the Ggt
treatments and genotype (p : 0.51,2-way ANOVA, n: 12) (Appendix 2, 2.3.2) (Table 2.3)'
There was no significant difference in shoot Mn content between nl Ggt and Ggt treatments.
When WI 2585 and Amagi Nijo were infected with Ggt, the Mn content of Amagi Nijo was
significantly greater than in WI 2585 (p : 3'0x1 }-ti ,2-way ANOVA, n: 12) (Appendix 2'
2.3.2). Thus, with or without Ggl infection, Mn-efhcient Amagi Nijo was absorbing twice as
much Mn from the Mn deficient soil as Mn-ineffrcient WI2585 (Table2.3)'
oo)l¿tt,EU'oo-c.U'
.gCo(ú
coC)Co()c
- Critical.z-\ shoot Mnconcentration
E W12585
I AmagiNijo
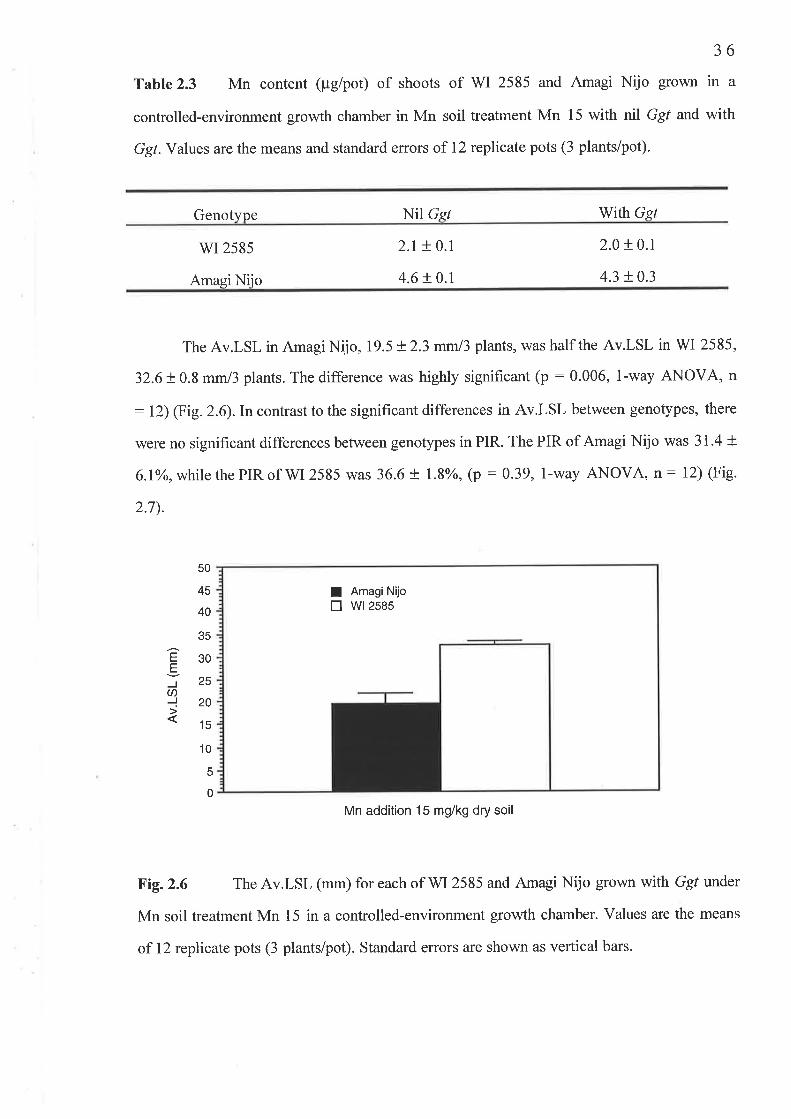
36
Table 2.3 Mn content (pglpot) of shoots of WI 2585 and Amagi Nijo grown in a
controlled-environment growth chamber in Mn soil treatment Mn 15 with nil Ggt and with
Ggl. Values are the means and standard errors of l2 replicate pots (3 plants/pot).
Genotype Nil Gsl With Gsl
wr 2585
Amagi Niio
The Av.LSL in Amagi Nijo, 19.5 + 2.3 mml3 plants, was half the Av.LSL in WI 2585,
32.6+ 0.8 mm/3 plants. The difference was highly significant (p : 0.006, l-way ANOVA, n
: 12) (Fig. 2.6).Incontrast to the signihcant differences in Av.LSL between genotypes, there
were no significant differences between genotypes in PIR. The PIR of Amagi Nijo was 31.4 +
6.Io/o,whilethePIRofWI2535 was 36.6+ l.8o/o, (p:0.39, l-way ANOVA, n: 12) (Fig.
2.7).
10
5
0
Mn addition 15 mg/kg dry soil
ßig.2.6 The Av.LSL (mm) for each of \VI 2585 and Amagi Nijo grown with Ggl under
Mn soil treatment Mn 15 in a controlled-environment growth chamber. Values are the means
of 12 replicate pots (3 plants/pot). Standard errors are shown as vertical bars.
2.r + 0.1
4.6 + 0.t
2.0 + 0.1
4.3 + 0.3
50
45
40
35,=830El2sU)-]20
I AmagiNijoE w12585
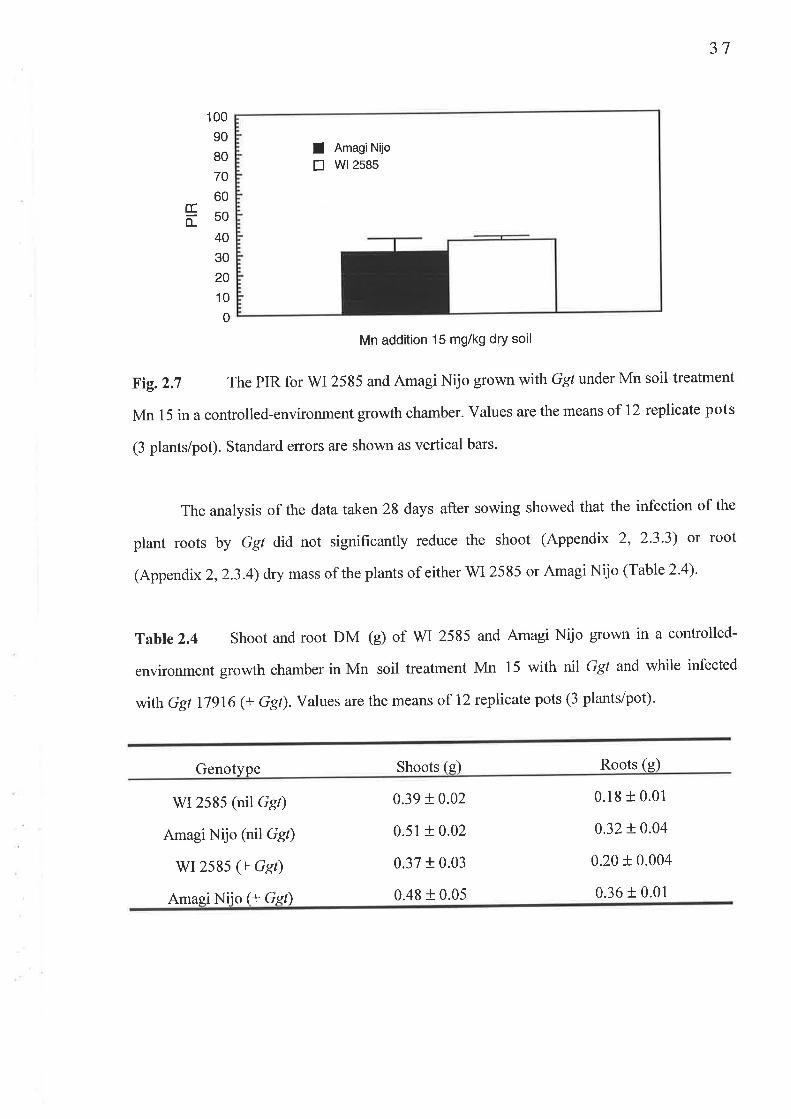
37
I AmagiNijo
E W12585
Mn addition 15 mg/kg dry soil
Fig.2,7 The PIR for WI 2585 and Amagi Nijo grown with Ggt under Mn soil treatment
Mn 15 in a controlled-environment growth chamber. Values are the means of 12 replicate pots
(3 plants/pot). Standard enors are shown as vertical bars.
The analysis of the data taken 28 days after sowing showed that the infection of the
plant roots by Ggt did not significantly reduce the shoot (Appendix 2, 2'3'3) or root
(Appendix 2,2.3.4) dry mass of the plants of either V/I 2585 or Amagi Nijo (Table2.4).
Table2.4 Shoot androot DM (g) of WI 2585 and Amagi Nijo grown in a controlled-
environment growth chamber in Mn soil treatment Mn 15 with nl Ggt and while infected
with Ggl 17916 (+ Ggt).Values are the means of 12 replicate pots (3 plants/pot)'
Genotype Shoots (s) Roots (g)
100
90
80
70
60
trso40
30
20
10
0
WI 2585 (nil Ggr)
Amagi Nijo (nil Ggr)
WI2585 (+ Gst)
Amasi Niio (+ Gef)
0.39 + 0.02
0.51 + 0.02
0.37 r 0.03
0.48 + 0.05
0.18 + 0.01
0.32 + 0.04
0.20 + 0.004
0.36 + 0.01
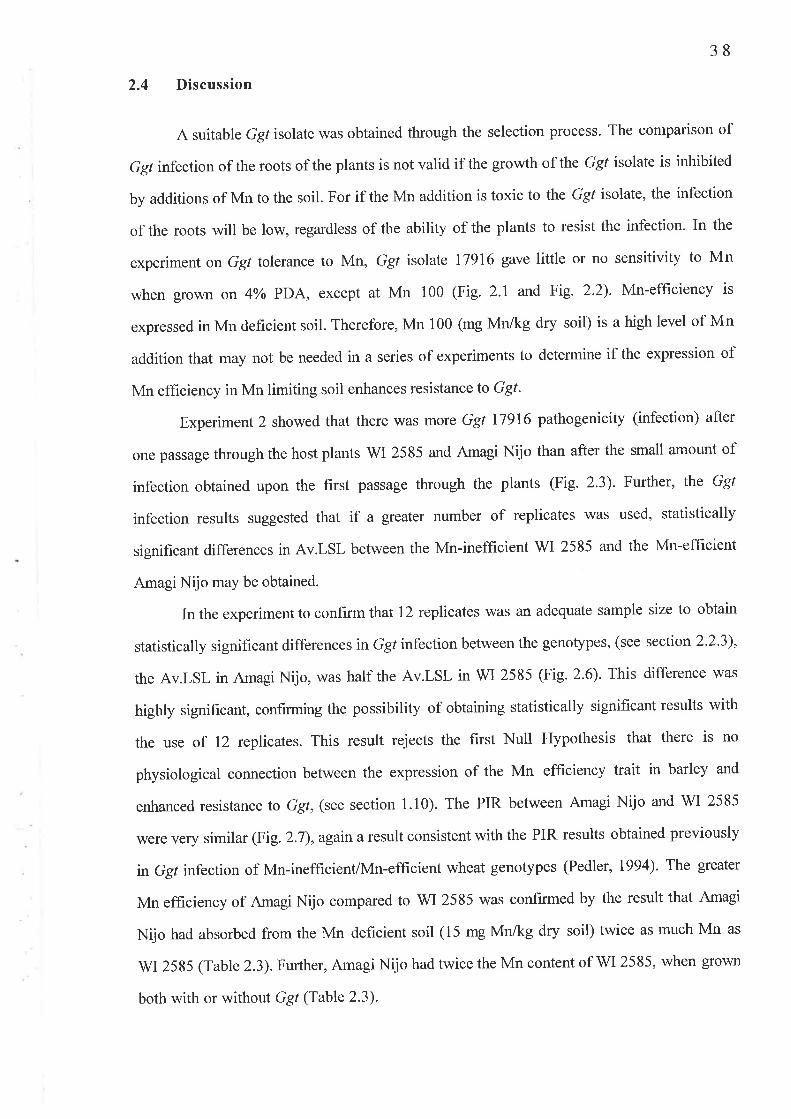
38
2.4 Discussion
A suitable Ggl isolate was obtained through the selection process. The comparison of
Ggt infecion of the roots of the plants is not valid if the growth of the Ggf isolate is inhibited
by additions of Mn to the soil. For if the Mn addition is toxic to the Ggl isolate, the infection
of the roots will be low, regardless of the ability of the plants to resist the infection' In the
experiment on Ggt tolerance to Mn, Ggl isolate 11916 gave little or no sensitivity to Mn
when grown on 4Yo PDA, except at Mn 100 (Fig. 2.1 and Fig. 2.2). Mn-efficiency is
expressed in Mn deficient soil. Therefore, Mn 100 (mg MrVkg dry soil) is a high level of Mn
addition that may not be needed in a series of experiments to determine if the expression of
Mn efficiency in Mn limiting soil enhances resistance to Ggt.
Experiment 2 showed that there was more Ggt 17916 pathogenicity (infection) after
one passage through the host plants \VI 2585 and Amagi Nijo than after the small amount of
infection obtained upon the first passage through the plants (Fig. 2.3). Further' the Ggt
infection results suggested that if a greater number of replicates was used, statistically
significant differences in Av.LSL between the Mn-inefficient WI 2585 and the Mn-efficient
Amagi Nijo may be obtained.
Inthe experimentto confirm thatl2 replicates was an adequate sample size to obtain
statistically significant differences in Ggt infection between the genotypes, (see section 2.2'3),
the Av.LSL in Amagi Nijo, was half the Av.LSL in WI 2585 (Fig. 2.6). This difference was
highly significant, confirming the possibility of obtaining statistically significant results with
the use of 12 replicates. This result rejects the first Null Hypothesis that there is no
physiological connection between the expression of the Mn efficiency trait in barley and
enhanced resistance to Ggt, (see section 1.10). The PIR between Amagi Nijo and WI 2585
were very similar (Fig.2.7),again a result consistent with the PIR results obtained previously
in Ggt infection of Mn-ineffrcienflMn-efficient wheat genotypes (Pedler, 1994). The greater
Mn efficiency of Amagi Nijo compared to WI 2585 was confirmed by the result that Amagi
Nijo had absorbed from the Mn deficient soil (15 mg Mn/kg dry soil) twice as much Mn as
V/I 2585 (Table 2.3). Further, Amagi Nijo had twice the Mn content of WI 2585, when grown
both with or without Ggt (Table 2.3).

39
The Ggt infection 28 days after sowing did not significantly reduce the plant shoot or
root DM (Table 2.4) when compared with uninfected plants. Therefore, 28 days is a suitable
time post inoculation with Ggt to harvest the plants for comparison in Ggr infection to avoid
confounding results due to other effects such as large differences in plant size caused by either
the Ggt infection or by severe Mn deficiency.
40
Chapter 3 Critical shoot Mn concentration
3.1 Introduction
The critical nutrient concentration is that concentration of a particular nutrient in a
specified plant organ when the plant growth or production is 90olo of the maximum growth
(Reuter et a1.,19S6). The critical shoot (YEB) Mn concentration in barley has been found to
be between 11.0-11.6 mg/kg DM (Reuter 1986; Hannam et al., 1937). However, the critical
concentration of Mn for V/I 2585 and Amagi Nijo has not been examined. In addition, the
determination of the critical Mn concentration by addition of a range of Mn to soil, will also
provide the amounts of soil Mn needed to achieve equal Mn plant status in both WI 2585 and
Amagi Nijo.
3.2 Method
3.2.1 The critical shoot Mn concentration experiment
The soil was prepared, incubated, and basal nutrients added as described in section
2.2.2.Mn as MnSOa was added at 9 levels corresponding to 0, 5, J '5, 10, 15' 20, 30,40 and
100 mgikg dry soil, but the pots were not inoculated with Ggr. Three seeds of either Amagi
Nijo or WI2585 were planted/pot (see section 2.2.5) (Appendix 1, Table 2.1). There were 90
pots (2 genotypes x 5 replicate pots x 9 Mn treatments). The pots were placed on the bench
in a completely randomised design. Plants were harvested 28 days after sowing as described in
section 2.2.2. Statistical analysis of all the results was done (see section 2.2.2). The critical
shoot Mn concentrations of Amagi Nijo and WI 2585 were determined from the data.
3.3 Results
3.3.1Leaf symptoms
When the plants were harvested at 28 days, WI 2585 grown at Mn 0 showed severe
symptoms of Mn deficiency (leaf chlorotic streaking, necrosis, and young leaf collapse) (Fig.
3.1). Severe symptoms of Mn deficiency persisted in'WI 2585 when the rate of Mn fertiliser
addition was increased to Mn 5 and Mn 7.5 (Fig.3.2 A). When the rate of Mn addition was
increased to Mn 10, WI 2585 showed moderate symptoms of Mn deficiency (flecking and
necrosis), mild symptoms at Mn 15 (chlorosis), while at Mn 20 WI 2585 showed no
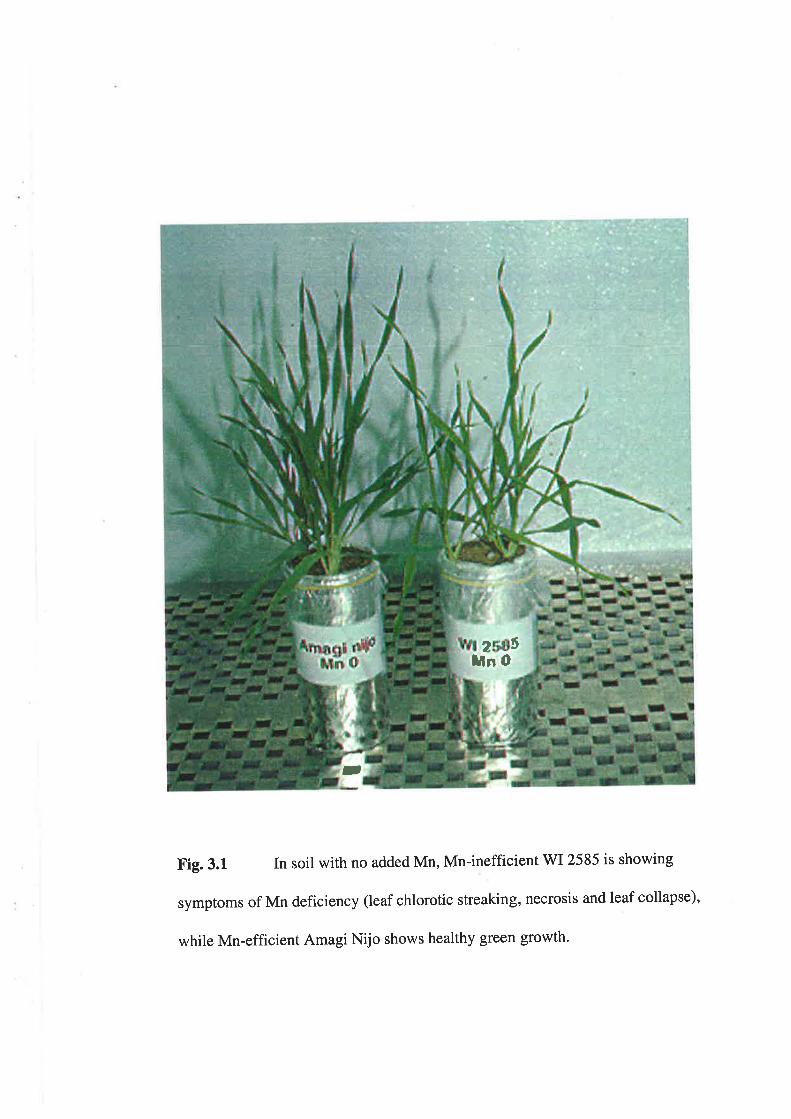
', : it'! .i:'.. '..
\j
!:
:l:
I
:
ìÌ1
4
2Úlitn O
f
Fig. 3.1 In soil with no added Mn, Mn-inefficient WI 2585 is showing
symptoms of Mn deficiency (leaf chlorotic streaking, necrosis and leaf collapse),
while Mn-efficient Amagi Nijo shows healthy green growth'
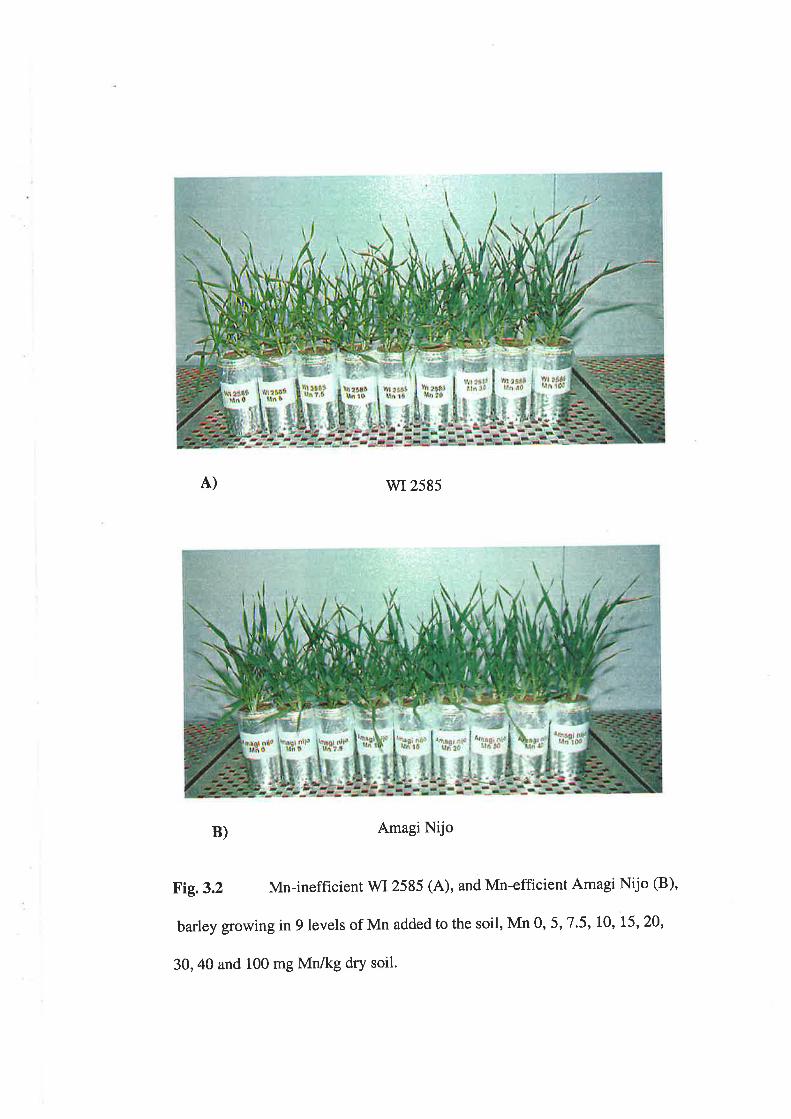
a) wr 2585
B) Amagi Nijo
Fig. 3.2 Mn-inefficienr wI 2585 (A), and Mn-efficient Amagi Nijo (B),
barley growing in 9 levels of Mn added to the soil, Mn 0, 5, 7.5, 10, 15, 20,
30,40 and 100 mg Mn/kg drY soil.
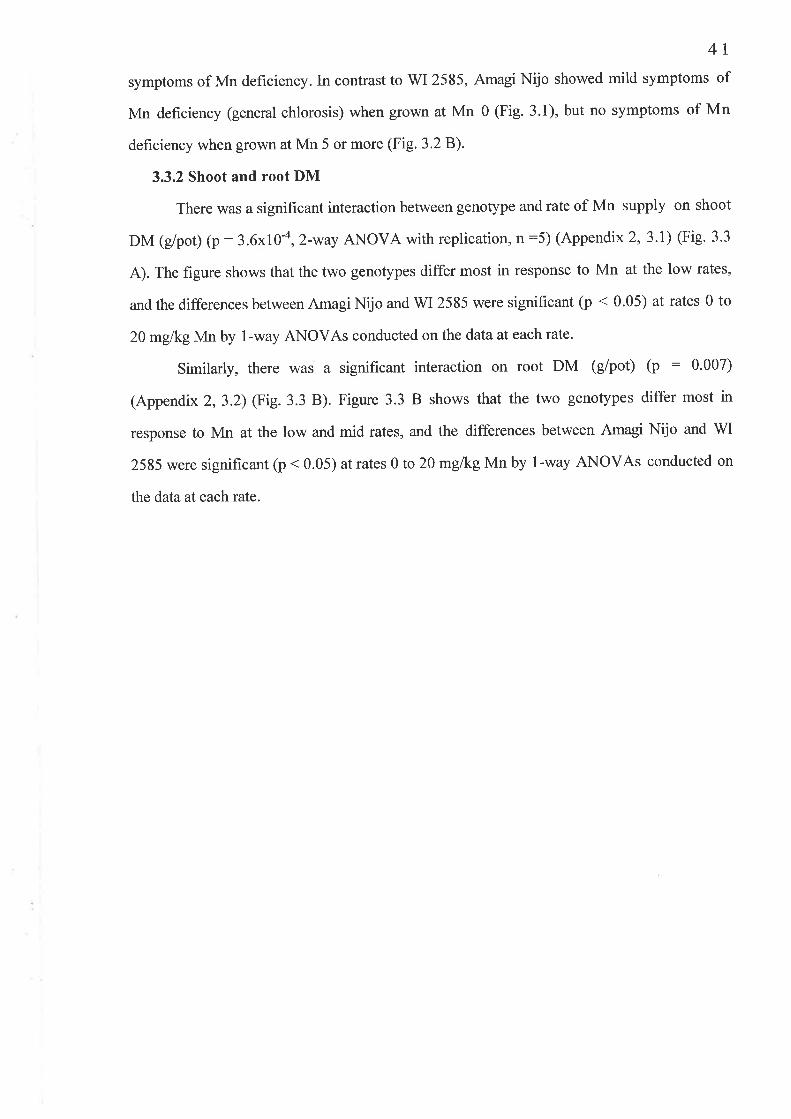
4l
symptoms of Mn deficiency. In contrast to WI 2585, Amagi Nijo showed mild symptoms of
Mn deficiency (general chlorosis) when growTr at Mn 0 (Fig. 3.1), but no symptoms of Mn
deficiency when grown at Mn 5 or more (Fig. 3.2 B).
3.3.2 Shoot and root DM
There was a significant interaction between genotype and rate of Mn supply on shoot
DM (g/pot) (p : 3.6x10-4,2-way ANOVA with replication, n :5) (Appendix 2, 3.1) (Fig. 3.3
A). The figure shows that the two genotypes differ most in response to Mn at the low rates,
and the differences between Amagi Nijo and WI 2585 were significant (p < 0.05) at rates 0 to
20 mglkgMn by l-way ANOVAs conducted on the dataat each rate.
Similarly, there was a significant interaction on root DM (g/pot) (p : 0.007)
(Appendix 2,3.2) (Fig.3.3 B). Figure 3.3 B shows that the two genotypes differ most in
response to Mn at the low and mid rates, and the differences between Amagi Nijo and WI
2585 were significant (p < 0.05) at rates 0 to 20 mg/kg Mn by 1-way ANOVAs conducted on
the data at each rate.
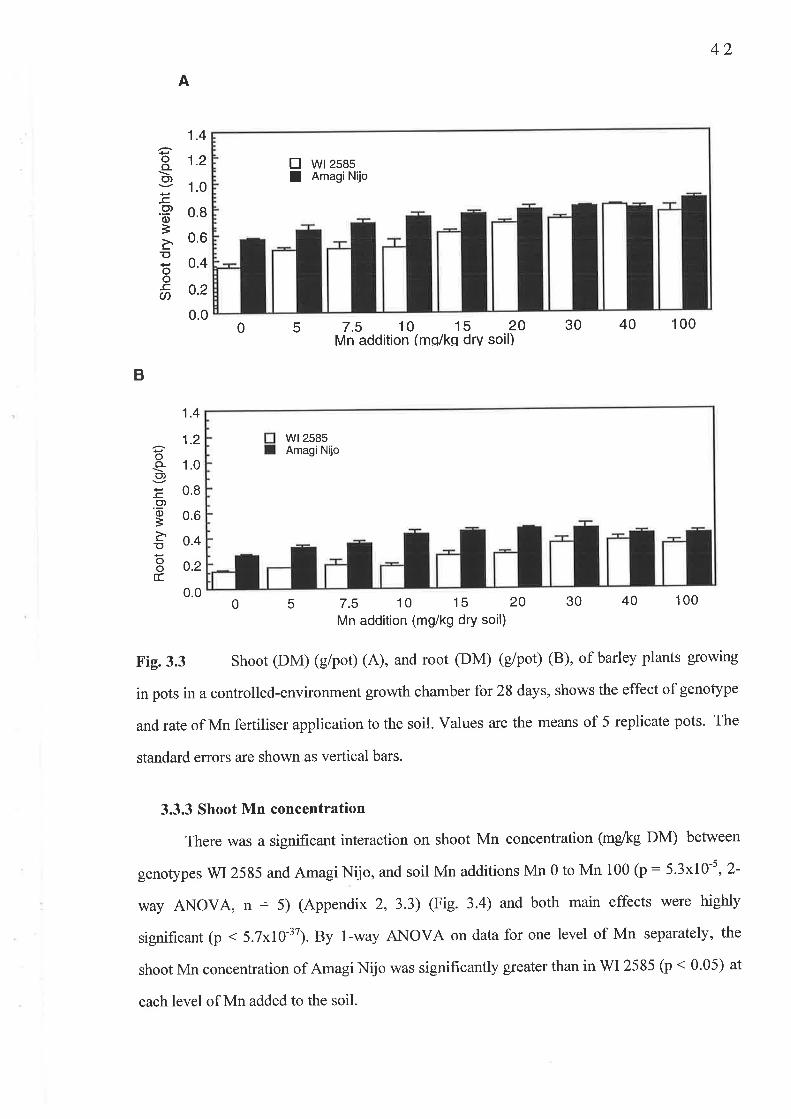
42
A
oo-o)
-c.?o=àoooEØ
1.4
1.2
1.0
0.8
0,6
0.4
0.2
0.0
E wtzsssI AmagiNijo
5 7.5 10 15 20Mn addition (mq/kq drv soil)
30 40 100
wt2585AmagiNijo
5 7.5 10 15 20Mn addition (mg/kg dry soil)
30 40 100
0
B
ooo)
-c'?q)ÈàEooÉ.
1.4
1.2
1.0
0.8
0.6
0.4
0.2
0.00
Fig. 3.3 Shoot (DM) (g/pot) (A), and root (DM) (g/pot) (B), of barley plants growing
in pots in a controlled-environment growth chamber for 28 days, shows the effect of genotype
and rate of Mn fertiliser application to the soil. Values are the means of 5 replicate pots. The
standard errors are shown as vertical bars.
3.3.3 Shoot Mn concentration
There was a significant interaction on shoot Mn concentration (mdkg DM) between
genotypes WI 2585 and Amagi Nijo, and soil Mn additions Mn 0 to Mn 100 (p : 5.3x10-s,2-
way ANOVA, n : 5) (Appendix 2, 3.3) (Fig. 3.a) and both main effects were highly
significant (p < 5.7x10tt). By l-way ANOVA on data for one level of Mn separately, the
shoot Mn concentration of Amagi Nijo was signihcantly greater than in WI 2585 þ < 0.05) at
each level of Mn added to the soil.

osoo){45o)g40P" 3s
€30(,.= 25co tîl
E1sc8rocOÃorCn
43
0 5 30 40 100
Fig. 3.4 The shoot Mn concentrations (mglkg DM) of barley plants growing in pots in
a controlled-environment growth chamber for 28 days, as a function of genotype and rate of
Mn fertiliser application to the soil. Values are the means of 5 replicate pots. The standard
errors are shown as vertical bars.
3.3.4 Critical shoot Mn concentration of Amagi Nijo and \ilI 2585
The relationship between the shoot Mn concentration and the shoot dry weight (DM)
of each genotype across 9 levels of Mn added to the soil give nearly identical curves for Amagi
Nijo and WI 2585 (Fig. 3.5). Calculation of the critical shoot Mn concentration corresponding
to 90o/o of relative yield gives both Amagi Nijo and V/I 2585 similar critical shoot Mn
concentrationsbetweenll-l2mg/kgDM. This result is the same as the critical shoot (YEB)
Mn concentration for barley determined previously in field work (11.0-11.6 mg Mn/kg DM)
(Hannam et a1.,1987).
7.5 10 15 20Mn addition (mg/kg dry soil)
Shoot Mn deficient
Shoot Mn sufficient
Shoot critical Mn concentration
tr wr2585I AmagiNijo
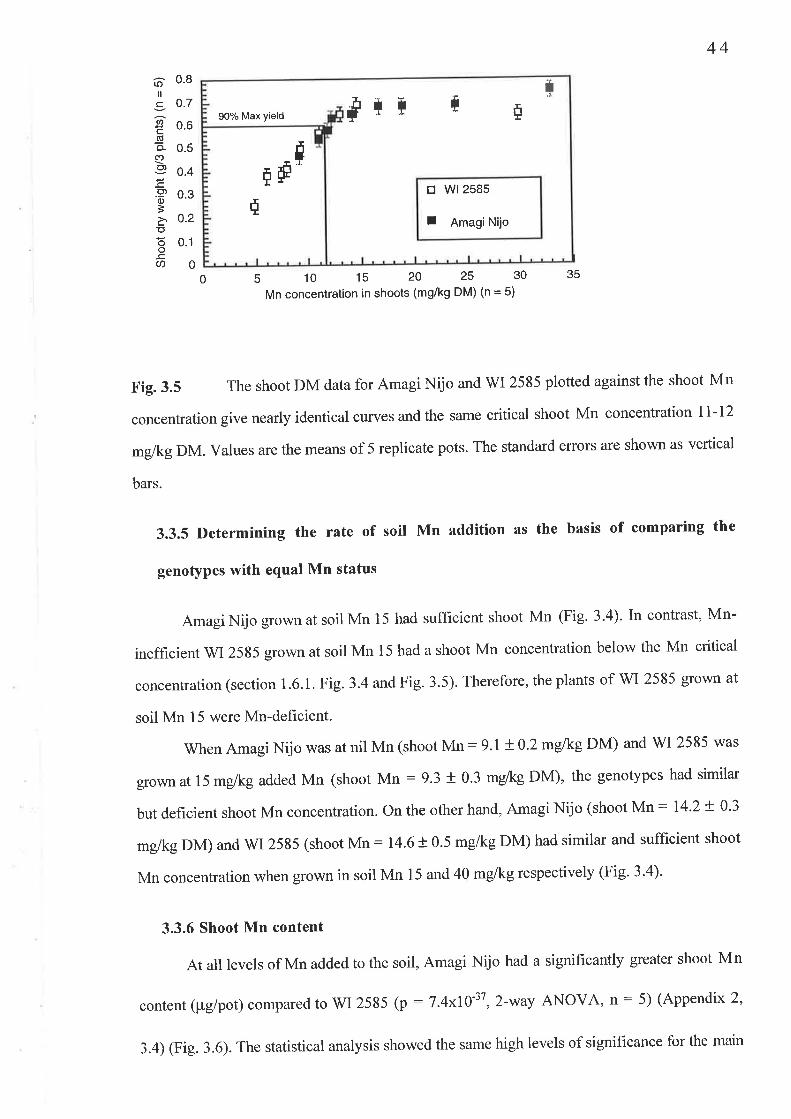
È
$ËÉ tr w|2585
I AmagiNijo
90% Max yield
¡*Ër å Ë
44
51015202530Mn concentration in shoots (mg/kg DM) (n = S)
35
Fig. 3.5 The shoot DM data for Amagi Nijo and V/I 2585 plotted against the shoot Mn
concentration give nearly identical curves and the same critical shoot Mn concentration ll-12
mg/kg DM. Values are the means of 5 replicate pots. The standard errors are shown as vertical
bars.
3.3.5 Determining the rate of soil Mn addition as the basis of comparing the
genotypes with equal Mn status
Amagi Nijo grown at soil Mn l5 had sufficient shoot Mn (Fig. 3.4).In contrast, Mn-
inefficient WI 2585 grown at soil Mn 15 had a shoot Mn concentration below the Mn critical
concentration (section 1.6.1. Fig. 3.4 andFig. 3.5). Therefore, the plants of WI 2585 grown at
soil Mn 15 were Mn-deficient.
when Amagi Nijo was at nil Mn (shoot Mn: 9.1+ 0.2 mglkg DM) and wI 2585 was
grownat 15 mg/kg added Mn (shoot Mn : 9.3 + 0.3 mg/kg DM), the genotypes had similar
but deficient shoot Mn concentration. on the other hand, Amagi Nijo (shoot Mn: l4'2 + 0'3
mglkgDM) and WI 2585 (shoot Mn: 14.6+ 0.5 mg/kg DM) had similar and sufficient shoot
Mn concentration when grown in soil Mn 15 and 40 mg/kg respectively (Fig' 3'a)'
3.3.6 Shoot Mn content
At all levels of Mn added to the soil, Amagi Nijo had a significantly greater shoot Mn
content (pg/pot) compared to WI 2585 (p : 7.4x10'37,2-way ANOVA, n : 5) (Appendix 2,
3.a) fig. 3.6). The statistical analysis showed the same high levels of significance for the main
6' 0.8lt
I 0.7
9 o.u(úo o.se9 o.+
.E 0.3
=¡ 0.2Eõ 0.1oØ0
0

45
effects as for the shoot Mn concentration results. The greater shoot Mn content in Amagi
Nijo compared to WI 2585 demonstrates that Amagi Nijo is more efficient at absorbing Mn
from Mn-deficient soil than WI2585.
30
25
20
15
10
5
0
Fig.3. 6
o 5 7.5 10 15 20 30 40 100
Mn addition (mg/kg dry soil)
The shoot Mn content (pglpot) of barley plants growing in pots in a
oo-o)l
Cq)
cooc
oo-c.U)
controlled-environment growth chamber for 28 days, as a function of genotype and rate of Mn
fertiliser application to the soil. Values are the means of 5 replicate pots. The standard errors
are shown as vertical bars.
3.3.7 Root Mn concentration
There was no significant interaction on root Mn concentration (mg/kg DM) between
genotype and Mn soil additions (Mn 0 to Mn 100 mg/kg) (p : 0.9, 2-way ANOVA, n : 5)
(Appendix 2,3.5) (Fig. 3.7). However the main effect Mn soil additions Mn 0 to Mn 100 was
highly significant (p: 1.0x10'3s,2-way ANOVA, n: 5)' By 1-way ANOVA on data for each
level of Mn separately, there were no significant differences in root Mn between WI 2585 and
Amagi Nijo at each level of Mn added to the soil (p > 0'05) (Fig' 3'7)'
trT
w|2585AmagiNiio
46
1 00
90
80
70
60
50
40
30
20
10
0
E Wr2585
I AmagiNijo
oo)l¿o)EU)
oo
;.9(ú
cooo()
0 5 7.5 10 15
Mn addition (mg/kg dry soil)30 40 10020
Fig. 3.7 The root Mn concentration (mdkg DM) of barley plants growing in pots in a
controlled-environment growth chamber for 28 days, as a function of genotype and rate of Mn
fertiliser application to the soil. Values are the means of 5 replicate pots. The standard errors
are shown as vertical bars.
3.4 Discussion
3.4.1 Critical shoot Mn concentration
Many varieties of the one crop have similar critical shoot Mn concentrations, (Reuter
et al., 1986 and Hannam et al., 1937). However, differences in critical shoot Mn
concentrations have been found in wheat cultivars ranging from 11 mdkg DM in Bayonet to
17 mglkgDM in the Canadian cultivar Red Fife (Marcar, 1986). This soil bioassay found that
WI 2585 and Amagi Nijo have the same critical shoot Mn concentration (ll-12 mg/kg DM)
(Fig. 3.5). Therefore, it is reasonable to assume that similar levels of Mn deficiency stress
exist in V/I 2585 and Amagi Nijo when their shoot Mn concentrations are the same (Fig' 3.4).
However, the greater Mn efficiency in Amagi Nijo compared to WI 2585 was
associated with the greater ability of Amagi Nijo to absorb Mn from deficient soil as
demonstrated by the greater shoot Mn concentration and content in Amagi Nijo (Fig. 3.4 and
Fig. 3.6). The Mn efhciency in Amagi Nijo can be neutralised and made equal in Mn stress to
V/I 25g5 by adding to the soil the amounts of Mn determined in this soil bioassay to achieve
equal Mn plant status in both genotypes.
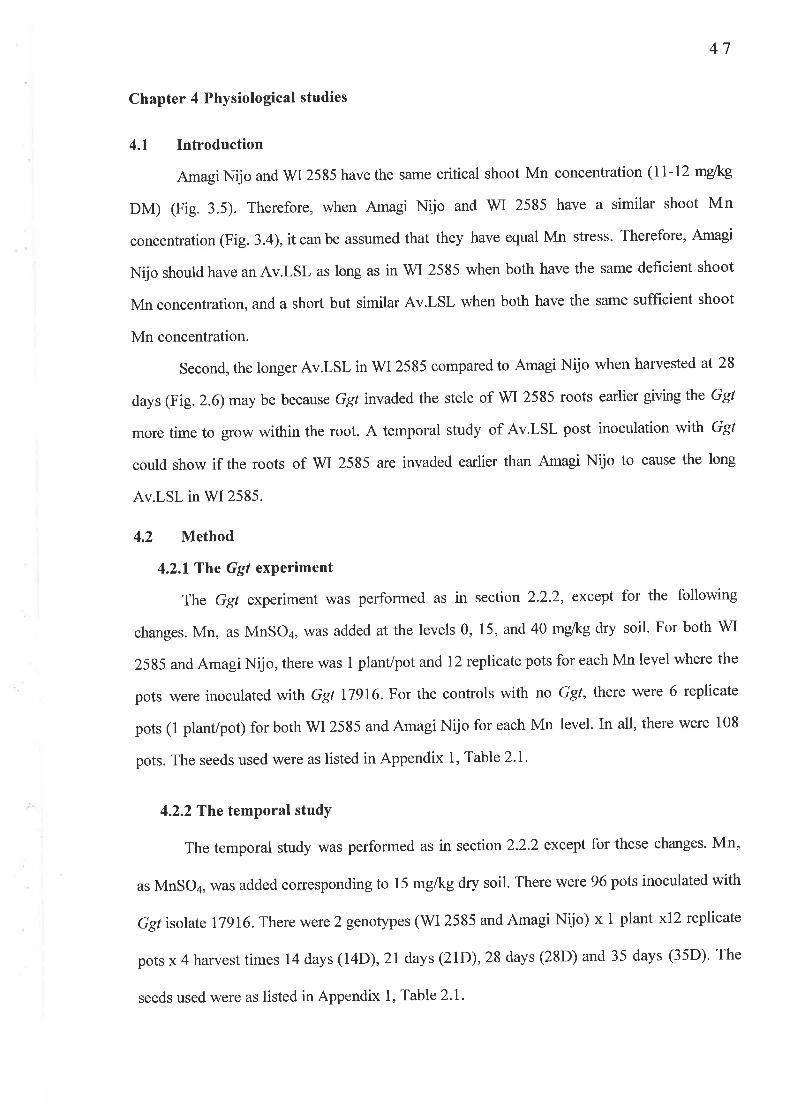
47
Chapter 4 Physiological studies
4.1 Introduction
Amagi Nijo and WI2585 have the same critical shoot Mn concentration (ll-12 mg/kg
DM) (Fig. 3.5). Therefore, when Amagi Nijo and WI 2585 have a similar shoot Mn
concentration(Fig. 3.4),itcanbe assumed that they have equal Mn stress' Therefore, Amagi
Nijo should have an Av.LSL as long as in WI 2585 when both have the same deficient shoot
Mn concentration, and a short but similar Av.LSL when both have the same sufficient shoot
Mn concentration.
Second, the longer Av.LSL in'WI2585 compared to Amagi Nijo when harvested at 28
days(Fig.2.6)may be because Ggtinvadedthe stele of WI 2585 roots earliergiving the Ggt
more time to grow within the root. A temporal study of Av.LSL post inoculation with Ggl
could show if the roots of WI 2585 are invaded earlier than Amagi Nijo to cause the long
Av.LSL in WI2585.
4.2 Method
4.2.1 The Ggt experiment
The Ggt experiment was performed as in section 2.2.2, except for the following
changes. Mn, as MnSOa, was added at the levels 0, 15, and 40 mdkg dry soil. For both WI
2585 and Amagi Nijo, there was 1 plant/pot and 12 replicate pots for each Mn level where the
pots were inoculated with Ggr 17916. For the controls with no Ggt, there were 6 replicate
pots (l plant/pot) for both WI 2585 and Amagi Nijo for each Mn level. In all, there were 108
pots. The seeds used were as listed in Appendix 1, Table 2.1'
4.2.2 Tlne temporal studY
The temporal study was performed as in section 2.2.2 except for these changes. Mn,
as MnSOa, was added corresponcling to 15 mg/kg dry soil. There were 96 pots inoculated with
Ggf isolate l79l6.There were2 genotypes (V/I2585 and Amagi Nijo) x 1 plant x12 replicate
pots x 4 harvest times 14 days (l4D), 21 days (2lD), 28 days (2SD) and 35 days (35D)' The
seeds used were as listed in Appendix 1, Table 2.1.
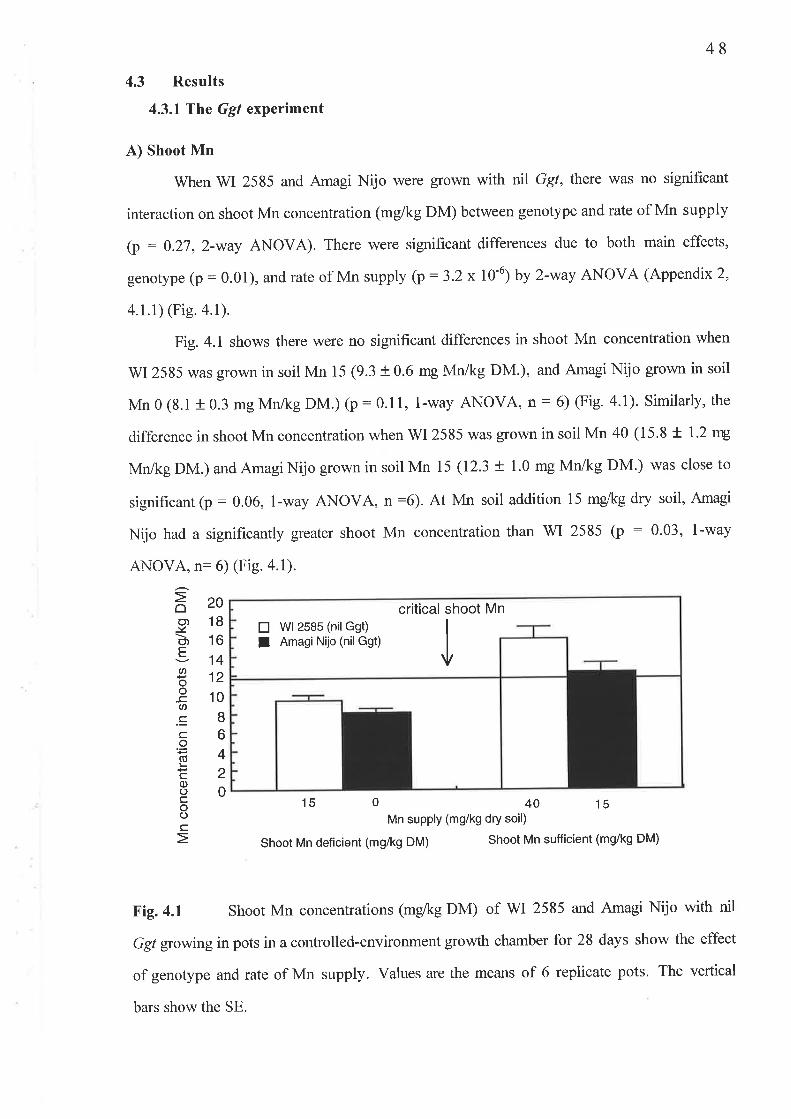
48
4.3 Results
4.3.1 The Ggl experiment
A) Shoot Mn
When WI 2585 and Amagi Nijo were gro\,vn with nil Ggt, there was no significant
interaction on shoot Mn concentration (mg/kg DM) between genotype and rate of Mn supply
(p : 0.27, 2-way ANOVA). There were significant differences due to both main effects,
genotype (p : 0.01), and rate of Mn supply (p: 3.2 x 10-6) by 2-way ANOVA (Appendix 2,
4.1.1) (Fie. a.1).
Fig. 4.1 shows there were no significant differences in shoot Mn concentration when
WI 2585 was grown in soil Mn 15 (9.3 + 0.6 mg Mn/kg DM.), and Amagi Nijo grown in soil
Mn 0 (8.1 + 0.3 mg Mn/kg DM.) (p : 0.11, l-way ANOVA, n : 6) (Fig. a.l). similarly, the
difference in shoot Mn concentration when WI 2585 was grown in soil Mn 40 (15.9 + 1.2 rrry
Mn/kg DM.) and Amagi Nijo grown in soil Mn 15 (12.3 ! 1.0 mg Mn/kg DM.) was close to
significant (p : 0.06, 1-way ANOVA, n :6). At Mn soil addition 15 mg/kg dry soil, Amagi
Nijo had a significantly greater shoot Mn concentration than WI 2585 (p : 0.03, l-way
ANOV n:6) (Fig.4.1).A,
oo)l¿o)EU'oo^can
.Cco(úL
cq)oco()c
2018
16
1412
10
I6
420
critical shoot Mn
tr W|2585 (nilGgt)
I AmagiNijo (nilGgt) I
15 0 40 15Mn suPPlY (mg/kg dry soil)
ShootMndeficient(mg/kgDM)ShootMnsufficient(mg/kgDM)
Fig. 4.1 Shoot Mn concentrations (mdkg DM) of WI 2585 and Amagi Nijo with nil
Ggf growing in pots in a controlled-environment growth chamber for 28 days show the effect
of genotype and rate of Mn supply. Values are the means of 6 replicate pots. The vertical
bars show the SE.
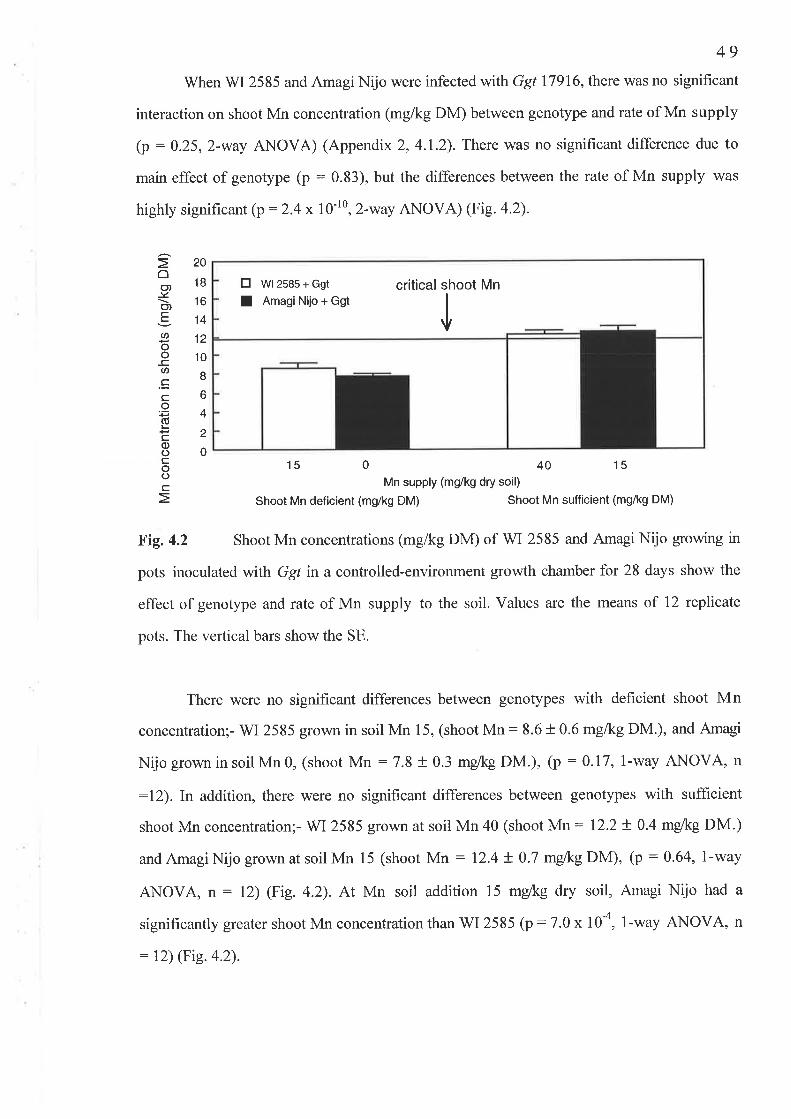
49'When WI 2585 and Amagi Nijo were infected with Ggr 17916, there was no significant
interaction on shoot Mn concentration (mg/kg DM) between genotype and rate of Mn supply
(p : 0.25,2-way ANOVA) (Appendix 2, 4.1.2). There \¡r'as no significant difference due to
main effect of genotype (p : 0.83), but the differences between the rate of Mn supply was
highly significant (p:2.4 x 10-10,2-way ANOVA) (Fig. a.2).
E wt zsas + cgt
I AmagiNijo + Ggtcritical shoot Mn
J
15 0 40 15
Mn supply (mg/kg dry soil)
Shoot Mn deficient (mg/kg DM) Shoot Mn sufficient (mg/kg DM)
Fig.4.2 Shoot Mn concentrations (mg/kg DM) of WI 2585 and Amagi Nijo growing in
pots inoculated with Ggt in a controlled-environment growth chamber for 28 days show the
effect of genotype and rate of Mn supply to the soil. Values are the means of 12 replicate
pots. The vertical bars show the SE.
There were no significant differences between genotypes with deficient shoot Mn
concentration;- V/I 2585 grown in soil Mn 15, (shoot Mn: 8.6 + 0.6 mglkgDM.), and Amagi
Nijo grown in soil Mn 0, (shoot Mn : 7.8 + 0.3 mdkg DM.), (p : 0.17, l-way ANOVA, n
:I2). In addition, there were no significant differences between genotypes with sufficient
shoot Mn concentration;- WI 2585 grown at soil Mn 40 (shoot Mn: I2.2 + 0.4 mg/kg DM.)
and Amagi Nijo grown at soil Mn 15 (shoot Mn : 12.4 + 0.7 mglkg DM), (p : 0.64, l-way
ANOVA, n: 12) (Fig. a.Ð. At Mn soil addition 15 mg/kg clry soil, Arnagi Nijo had a
significantly greater shoot Mn concentration than WI 2585 (p: 7.0 x l0a, l-way ANOVA, n
: 12) (Fig.4.2).
oo,t¿o,E
u,oo-cat
.cco'F(úL
co()cooL
20
18
16
14
12
10
Ib
4
2
0

50
B) Infection (Av.LSL) (mm/Plant)
There \ryere no signs of Ggt infection on the roots of WI 2585 and Amagi Nijo from
uninfected control pots. There was no signihcant interaction on Av.LSL (mmll2 plants)
between genotype andrate of Mn supply interpreted as the level of Mn stress (p:0.72,2-
way ANOVA) (Appen dix2, 4.1.3). There was a signif,rcant difference between WI 2585 and
Amagi Nrjo (p : 0.02), but there was no significant difference due to Mn treatment (that is
Mn concentration) (p : 0.28) by 2-way ANOVA (Fig' a'3)'
Similar to the pilot soil screen with restor ed Ggl 17916 experiment (Fig. 2.6), when the
Mn-inefficient WI 2585 ancl Mn-efficient Amagi Nijo were grown at Mn soil 15, there was a
significantly longer Av.LSL in the Mn-inefficient V/I 2585 (20.6 + 5.1 mm/plant) compared to
the Mn-efficient Amagi Nijo (6.4 t 1.7 mm/plant) (p : 0.01, l-way ANOVA, n: 12) (Fig'
4.3). But at a deficient shoot Mn concentration, WI 2585 had a high Av.LSL (20'6 + 5'1
mm/plant), while Amagi Nijo had a shorter Av.LSL (10.9 t 3.3 mm/plant) (p : 0'1, l-way
ANOVA, n: 12) (Fig. a.3). When both genotypes had a sufficient shoot Mn concentration,
WI 2585 retained a significantly longer Av.LSL (18.5 t 4.6 mmlplant) compared to Amagi
Nijo (Av.LSL : 6.4 + l.l mmlplant), (p :0.02,1-way ANOVA, n: I2).However, wI 2585
and Amagi Nijo did show a slight but an insignificant decrease in Av.LSL between deficient
and sufficient shoot Mn concentration (p: 0.76 and p : 0.23 respectively, 1-way ANOVA,
n:12) (Fig.4.3).
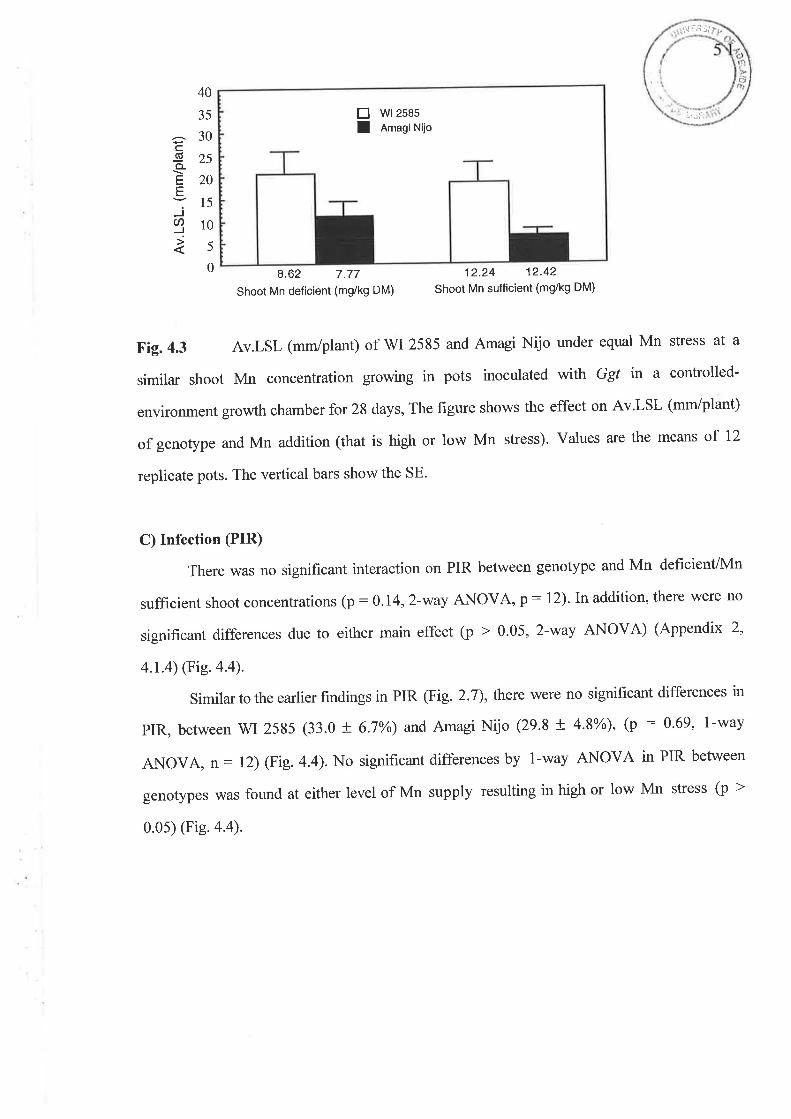
',',ii i
Ì\ flì r'/
40
35
î30C(tt .<o-820EY15J910Ìs
0
El wrzsesI AmagiNilo
8.62 7.77
Shoot Mn deficient (mg/kg DM)
12.24 12.42
Shoot Mn sufficient (mg/kg DM)
Fig. 4.3 Av.LSL (mm/plant) of WI 2585 and Amagi Nijo uncler equal Mn stress at a
similar shoot Mn concentration growing in pots inoculated with Ggl in a controlled-
environment growth chamber for 28 days, The figure shows the effect on Av'LSL (mm/plant)
of genotype and Mn addition (that is high or low Mn stress). Values are the means of 12
replicate pots. The vertical bars show the SE.
C) Infection (PIR)
There was no significant interaction on PIR between genotype and Mn deficient/Mn
suffrcient shoot concentrations (p : 0' 14,2-way ANOVA' p -- l2)' In addition' there were no
significant differences due to either main effect (p > 0.05, 2-way ANOVA) (Appendix 2'
4.r.4) (Fig. a.a).
Similar to the earlier findings in PIR (Fig. 2.7), there were no significant differences in
pIR, between wI 2535 (33.0 t 6.7%) and Amagi Nijo (29.s ! 4.8yo), (p : 0.69, l-way
ANOVA, n: 12) (Fig. a.a). No significant differences by l-way ANOVA in PIR between
genotypes was found at either level of Mn supply resulting in high or low Mn stress (p >
0.0s) (Fig. a.a).
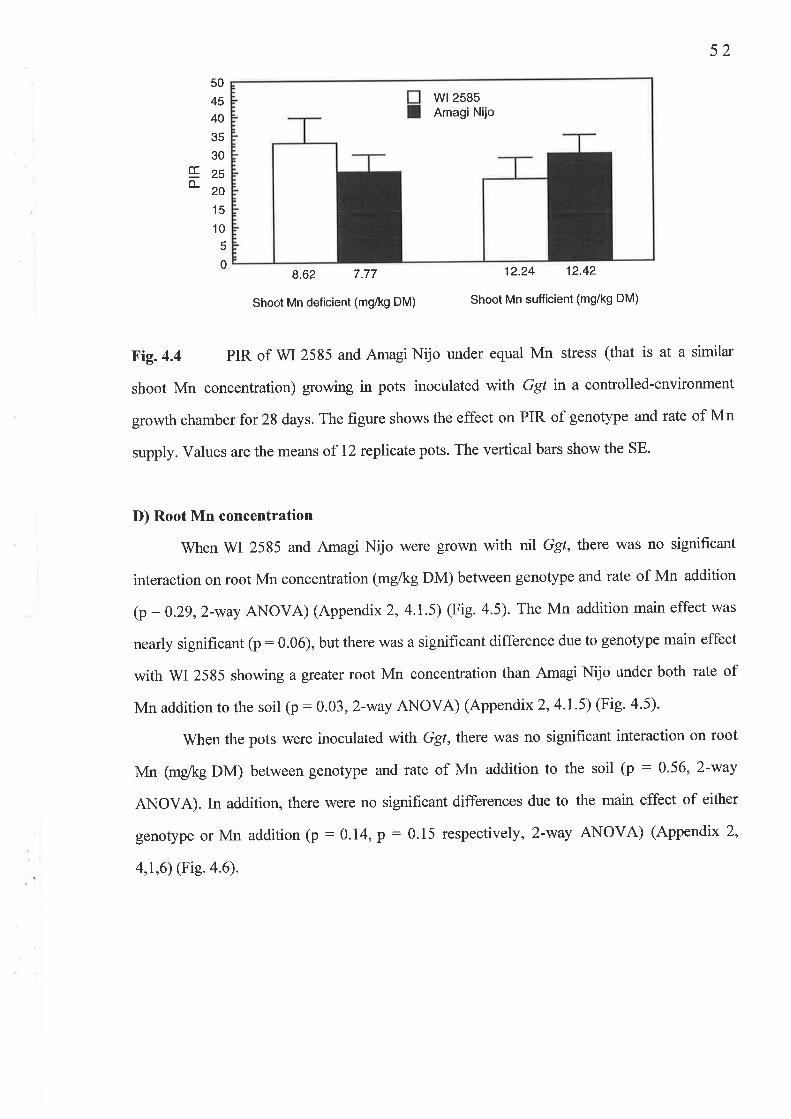
52
50
45
40
35
30rr 2srL
20
15
10
5
0
w|2585AmagiNijo
8.62 7.77
Shoot Mn deficient (mg/kg DM)
12.24 12.42
Shoot Mn sufficient (mg/kg DM)
ßig.4.4 PIR of WI 2585 and Amagi Nijo under equal Mn stress (that is at a similar
shoot Mn concentration) growing in pots inoculated with Ggf in a controlled-environment
growth chamber for 28 days. The figure shows the effect on PIR of genotype and rate of Mn
supply. Values are the means of 12 replicate pots. The vertical bars show the SE.
D) Root Mn concentration
When WI 2585 and Amagi Nijo were grown with nil Ggt, there was no significant
interaction on root Mn concentration (mg/kg DM) between genotype and rate of Mn addition
(p : 0.29,2-way ANOVA) (Appendix 2, 4.1.5) (Fig. 4.5). The Mn addition main effect was
nearly significant (p:0.06), but there was a significant difference due to genotype main effect
with WI 2585 showing a greater root Mn concentration than Amagi Nijo under both rate of
Mn addition to the soil (p : 0.03, 2-way ANOVA) (Appendix 2, 4'l'5) (Fig' a'5)'
When the pots were inoculated with Ggt, there \ /as no significant interaction on root
Mn (mg/kg DM) between genotype and rate of Mn addition to the soil (p : 0.56, 2-way
ANOVA). In addition, there were no significant differences due to the main effect of either
genotype or Mn addition (p : 0.14, p : 0.15 respectively, 2-way ANOVA) (Appendix 2'
4,1,6) (Fig. a.6).
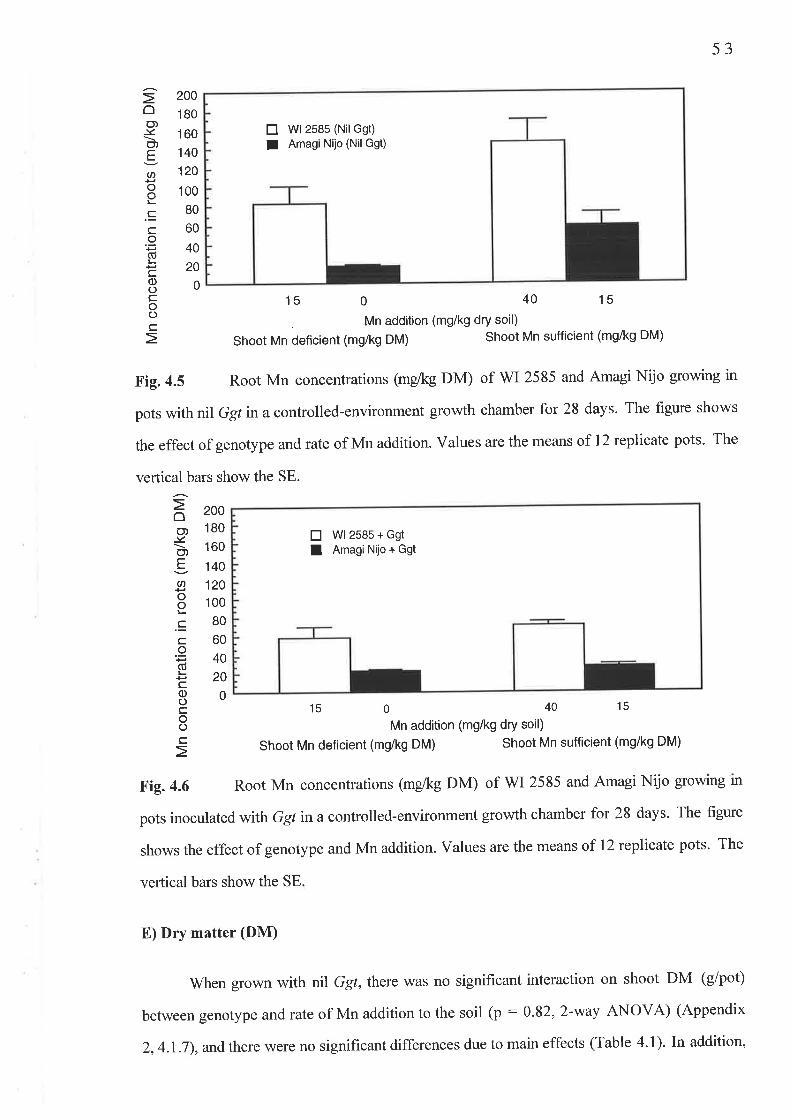
53
oo,l<g)EatooL
.Ec.9(úL
c0)()cooc
200
180
160
140
120
100
80
60
40
20
0
E Wt2585 (NilGst)
I AmasiNijo (NilGgt)
15 0 40 15
Mn addition (mg/kg dry soil)
shoot Mn deficient (mg/kg DM) shoot Mn sufficient (mg/kg DM)
Fig. 4.5 Root Mn concentrations (mg/kg DM) of WI 2585 and Amagi Nijo growing in
pots with nil Ggt in a controlled-environment growth chamber for 28 days. The figure shows
the effect of genotype and rate of Mn addition. Values are the means of 12 replicate pots. The
vertical bars show the SE.
oo,l¿O)EØooL
.cc.o(dL
coot-ooc
200180
160
140
120100
80
60
40
20
0
tr Wl 2585 + Ggt
I Amagi Nijo + Ggt
15 o 40 15
Mn addition (mg/kg dry soil)
shoot Mn deficient (mg/kg DM) shoot Mn sufficient (mg/kg DM)
Fig. 4.6 Root Mn concentrations (mg/kg DM) of V/I 2585 and Amagi Nijo growing in
pots inoculated with Ggt ina controlled-environment growth chamber for 28 days. The figure
shows the effect of genotype and Mn addition. Values are the means of 12 replicate pots' The
vertical bars show the SE
E) Dry matter (DM)
When growït with nil Ggt,there was no signihcant interaction on shoot DM (g/pot)
between genotype and rate of Mn addition to the soil (p : 0-82,2-way ANOVA) (Appendix
2,4.1.7),and there were no significant differences due to main effects (Table 4.1). In addition,
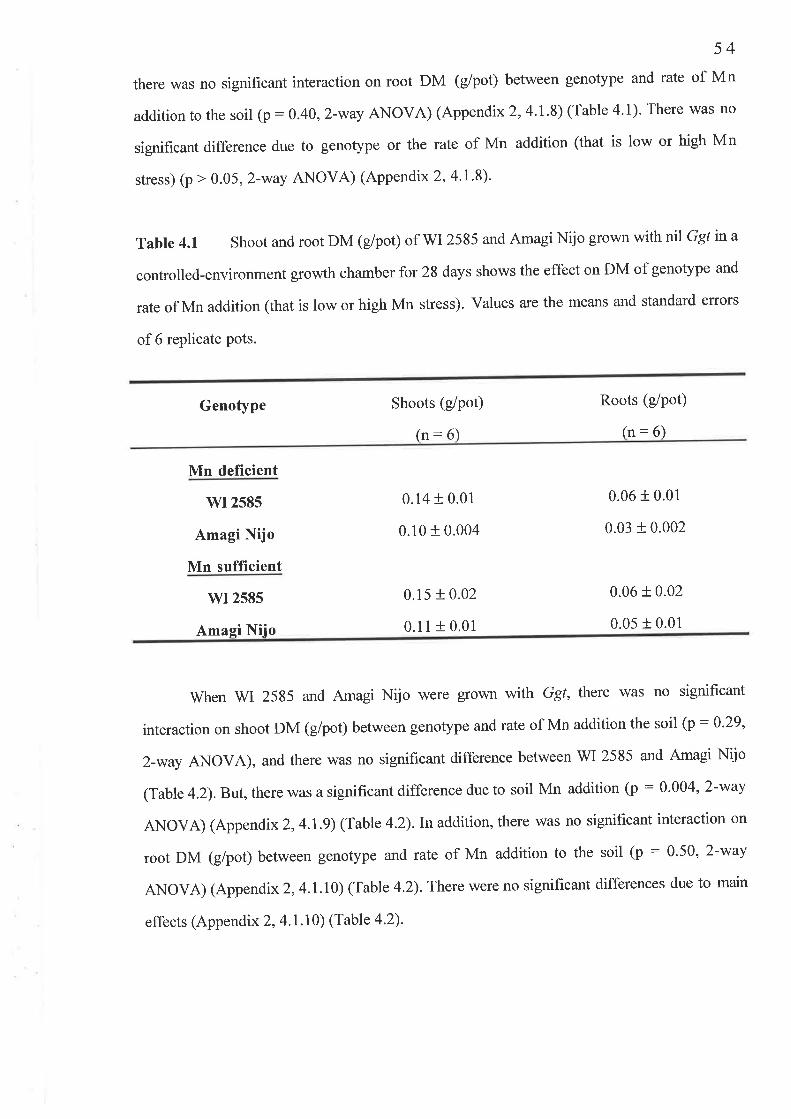
54
there was no significant interaction on root DM (g/pot) between genotype and rate of Mn
addition to the soil þ :0.40,2-way ANOVA) (Appendix 2,4.|.8) (Table 4.1). There was no
significant difference due to genotype or the rate of Mn addition (that is low or high Mn
stress) (p > 0.05, 2-way ANOVA) (Appendix 2,4'I'8)'
Table 4.1. Shoot and root DM (g/pot) of V/I 2585 and Amagi Nijo grown with nil Ggt ina
controlled-environment growth chamber for 28 days shows the effect on DM of genotype and
rate of Mn addition (that is low or high Mn stress). Values are the means and standard errors
of 6 replicate pots.
Genotype Shoots (g/pot) Roots (g/pot)
(n: 6)(n :6)
Mn deficient
wI2s85
Amagi Nijo
Mn suffÏcient
0.14 + 0.01
0.10 t 0.004
0.06 + 0.01
0.03 + 0.002
0.06 r 0.02
0.05 + 0.01
wr 2585
Amasi Niio
0.15 + 0.02
0.11 + 0.01
When WI 2585 and Amagi Nijo were grown with Ggl, there was no significant
interaction on shoot DM (g/pot) between genotype and rate of Mn addition the soil (p:0'29,
2-way ANOVA), and there was no significant difference between WI 2585 and Amagi Nijo
(Table 4.2). But, there was a significant difference due to soil Mn addition (p : 0'004 ' 2-way
ANOVA) (Appendix 2,4.1.9) (Table 4.2).Inaddition, there was no significant interaction on
root DM (g/pot) between genotype and rate of Mn addition to the soil (p : 0'50, 2-way
ANOVA) (Appendix 2,4.1J))(Table 4.2). There were no significant differences due to main
effects (Appendix 2,4.1.10) (Table 4.2)'
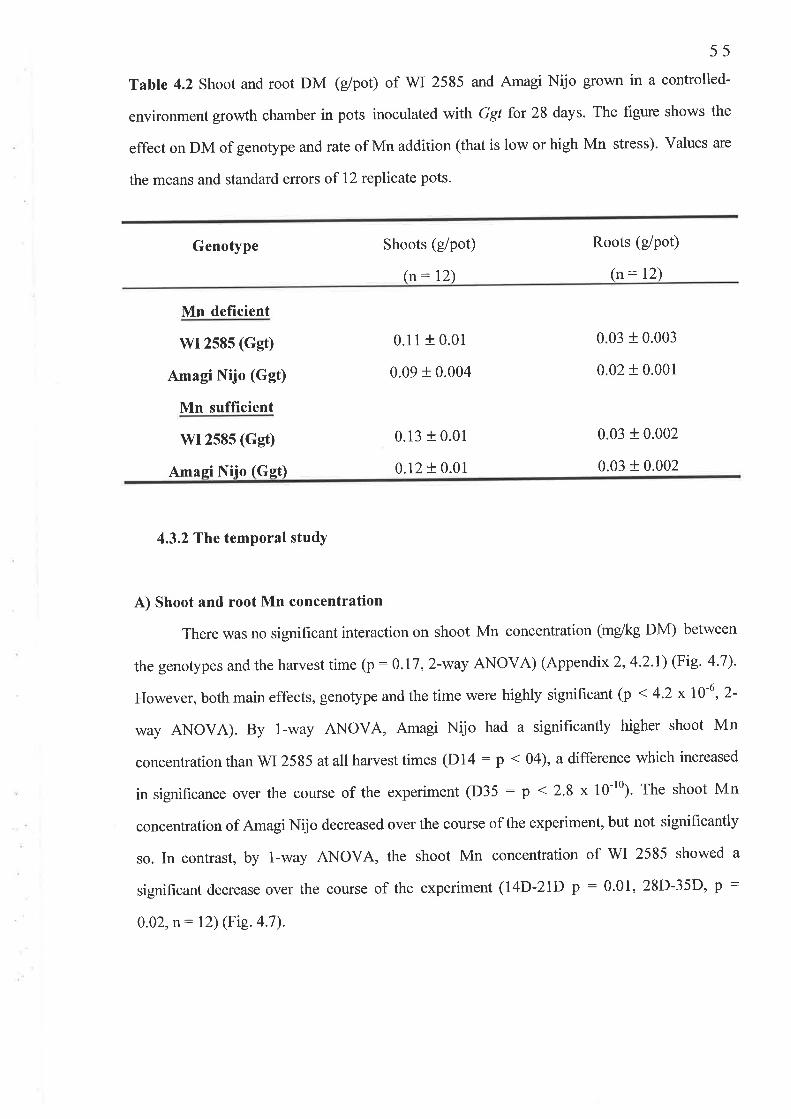
55
Table 4.2 Shoot and root DM (g/pot) of WI 2585 and Amagi Nijo grown in a controlled-
environment growth chamber in pots inoculated with Ggf for 28 days. The figure shows the
effect on DM of genotype and rate of Mn addition (that is low or high Mn stress). Values are
the means and standard errors of 12 replicate pots.
Genotype Shoots (g/pot)
(n: 12)
Roots (g/pot)
(n: 12)
Mn deficient
\ilI2585 (Gst)
Amagi Nijo (Ggt)
Mn sufficient
0.11 + 0.01
0.09 + 0.004
0.13 + 0.01
0.12 + 0.01
\ilI2585 (Gst)
Amasi Niio (Get)
0.03 + 0.003
0.02 + 0.001
0.03 r 0.002
0.03 r 0.002
4.3.2 The temporal study
A) Shoot and root Mn concentration
There was no significant interaction on shoot Mn concentration (mg/kg DM) between
the genotypes and the harvest time (p : 0.17,2-way ANOVA) (Appendix 2, 4.2'I) (Fig' a'7)'
However, both main effects, genotype and the time were highly significant (p < 4.2 x 10-6,2-
way ANOVA). By l-way ANOVA, Amagi Nijo had a significantly higher shoot Mn
concentration than WI 2585 at all harvest times (D14 : p < 04), a difference which increased
in significance over the course of the experiment (D35 : p < 2'8 x 10⁻¹⁰). The shoot Mn
concentration of Amagi Nijo decreased over the course of the experiment, but not significantly
so. In contrast, by l-way ANOVA, the shoot Mn concentration of V/I 2585 showed a
signihcant decrease over the coufse of thc cxperiment (l4D-21D p : 0'01, 28D-35D, p :
0.02,n: 12) (Fig.4.7).
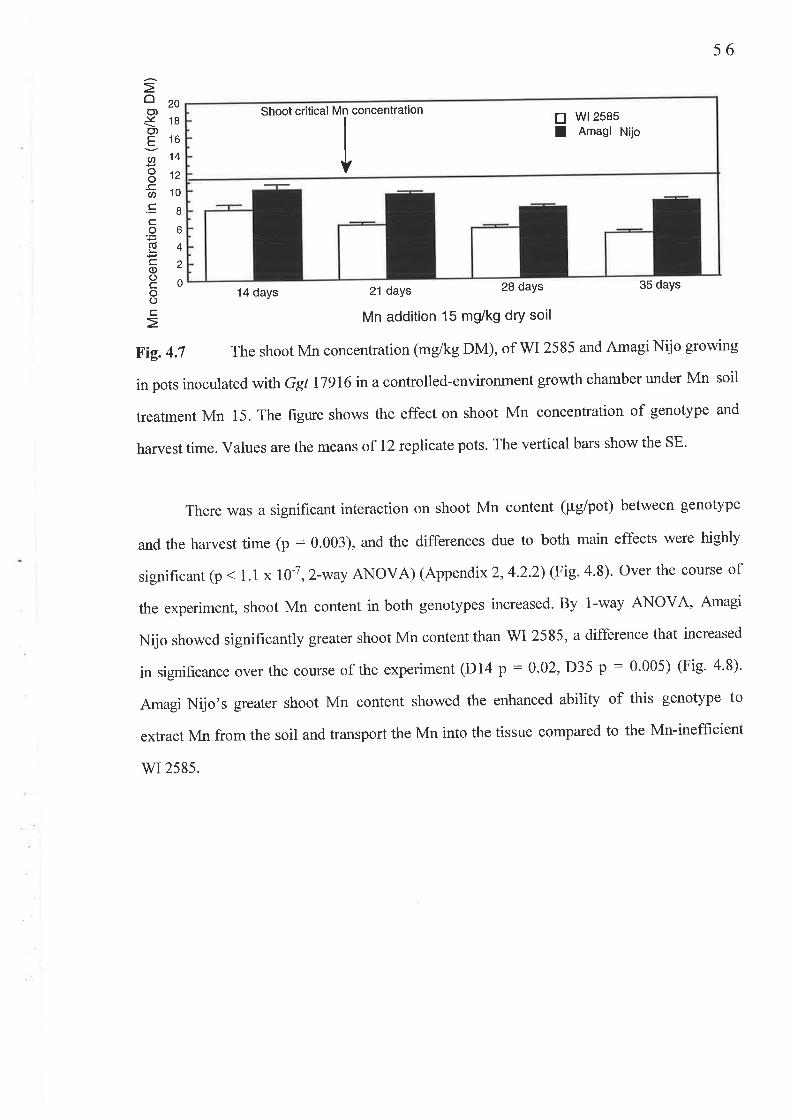
20
18
16
14
12
10
I6
4
2
0
ßig.4.7
oo)l¿o)E
Øoo-cU)
.cco(dL
cooCooC
Shoot critical Mn concentration E W12585I Amagi ¡¡¡6
56
14 days 21 days
Mn addition 15 mg/kg dry soil
'l'he shoot Mn concentration (mgikg DM), of WI 2585 and Amagi Nijo growing
in pots inoculated with Ggr 17916 in a controlled-environment growth chamber under Mn soil
treatment Mn 15. The figure shows the effect on shoot Mn concentration of genotype and
harvest time. Values are the means of 12 replicate pots. The vertical bars show the SE.
There was a significant interaction on shoot Mn content (pglpot) between genotype
and the harvest time (p : 0.003), and the differences due to both main effects were highly
significant (p < 1.1 x 10⁻⁷, 2-way ANOVA) (Appendix 2,4.2.2) (Fig. a.s). over the course of
the experiment, shoot Mn content in both genotypes increased. By l-way ANOVA, Amagi
Nijo showed significantly greater shoot Mn content than WI 2585, a difference that increased
in significance over the course of the experiment @la p :0.02, D35 p : 0'005) (Fig' a'8)'
Amagi Nijo's greater shoot Mn content showed the enhanced ability of this genotype to
extract Mn from the soil and transport the Mn into the tissue compared to the Mn-inefficient
wI2585.
28 days 35 days
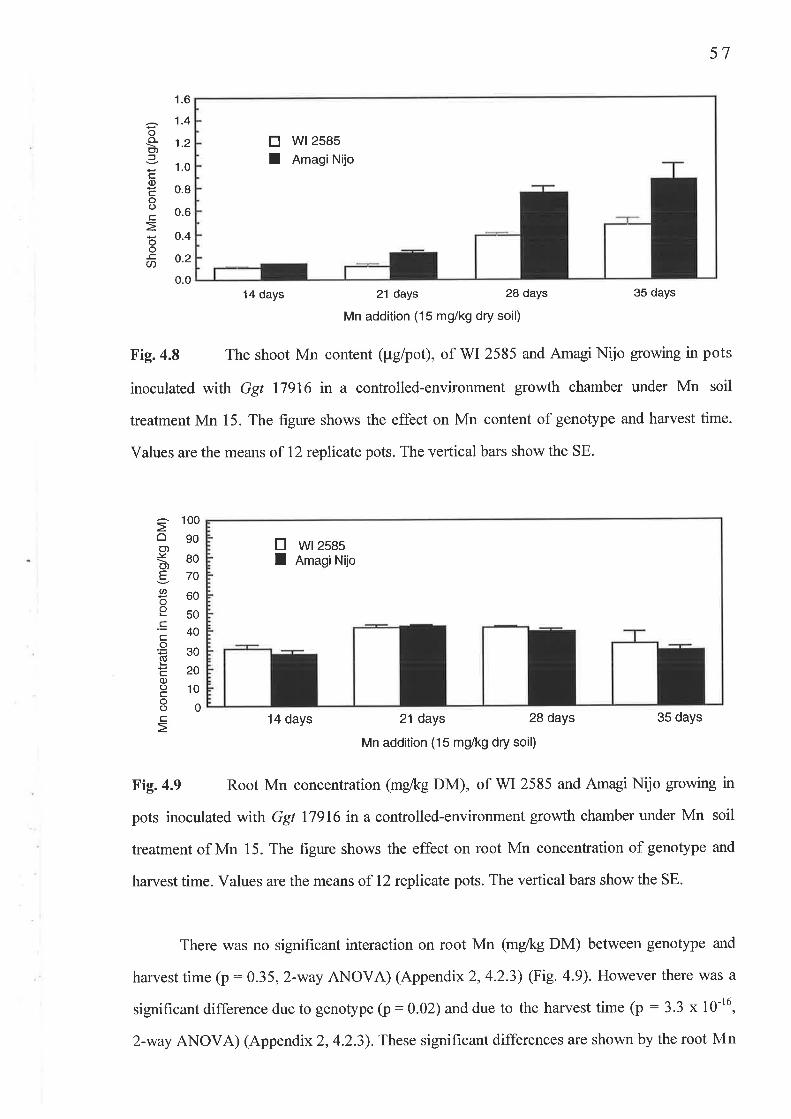
57
tr wr2s85I AmagiNijo
14 days 21 daYs 28 days 35 days
Mn addition (15 mg/kg dry soil)
Fig. 4.8 The shoot Mn content (pglpot), of WI 2585 and Amagi Nijo growing in pots
inoculated with Ggr 17916 in a controlled-environment growth chamber under Mn soil
treatment Mn 15. The figrne shows the effect on Mn content of genotype and harvest time.
Values are the means of 12 replicate pots. The vertical bars show the SE.
ooo)=Eocooc
oo!Ø
1.6
1.4
1.2
1.0
0.8
0.6
o.4
0.2
0.0
o(f)t¿o)EU)
oo.cco(úL
cq)ocooc
100
90
80
70
60
50
40
30
20
10
0
tr wr2s85I AmagiNijo
14 days 21 days 28 daYs
Mn addition (15 mg/kg dry soil)
35 days
Fig. 4.9 Root Mn concentration (mg/kg DM), of WI 2585 and Amagi Nijo growing in
pots inoculated with Ggt 17916 in a controlled-environment growth chamber under Mn soil
treatment of Mn 15. The figwe shows the effect on root Mn concentration of genotype and
harvest time. Values are the means of 12 replicate pots. The vertical bars show the SE.
There was no significant interaction on root Mn (mgikg DM) between genotype and
harvest time (p : 0.35, 2-way ANOVA) (Appendix 2, 4.2.3) (Fig. a.9). However there was a
significant difference due to genotype (p:0.02) and due to the harvest time (p : 3.3 x 10⁻¹⁶,
2-way ANOVA) (Appendix 2,4.2.3). These significant differences are shown by the root Mn
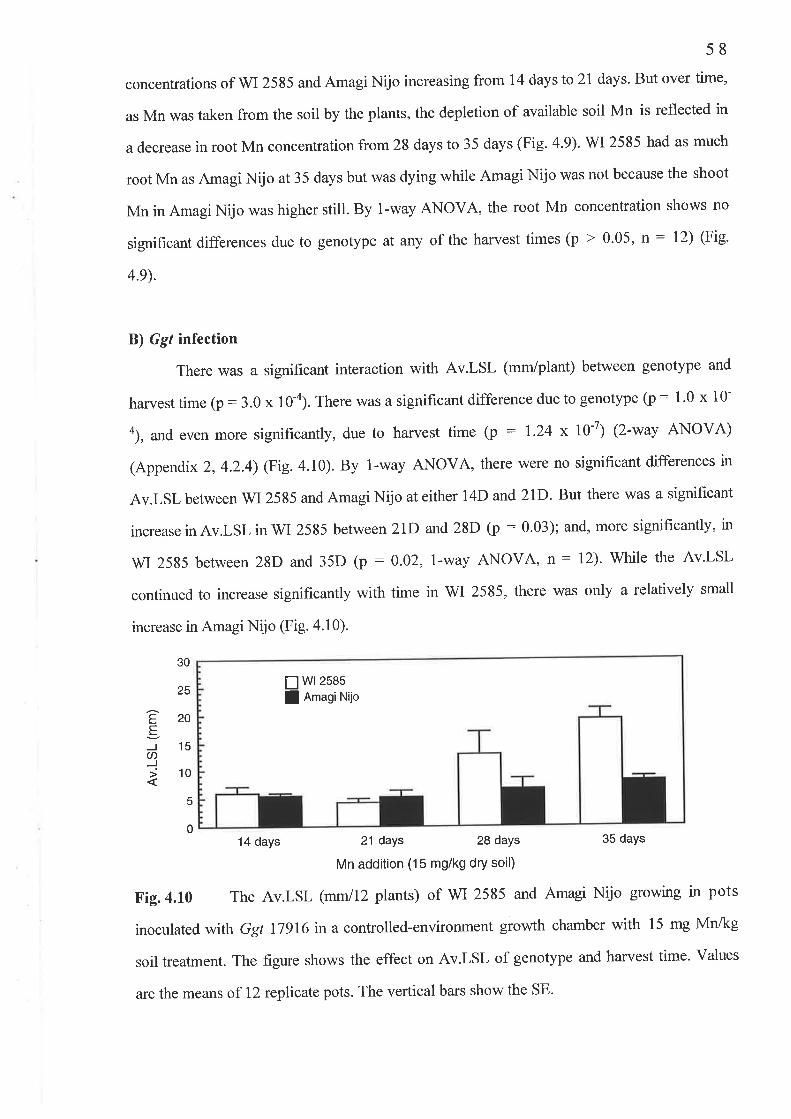
58
concentrations of WI 2585 and Amagi Nijo increasing from 14 days to 21 days. But over time,
as Mn was taken from the soil by the plants, the depletion of available soil Mn is reflected in
a decrease in root Mn concentration from 28 days to 35 days (Fig. a.9). WI 2585 had as much
root Mn as Amagi Nijo at 35 days but was dying while Amagi Nijo was not because the shoot
Mn in Amagi Nijo was higher still. By l-way ANOVA, the root Mn concentration shows no
significant differences due to genotype at any of the harvest times (p > 0'05, n : 12) (Fig'
4.e).
B) Ggt infection
There \ryas a significant interaction with Av.LSL (mm/plant) between genotype and
harvest time (p: 3.0 x 10⁻⁴). There was a significant difference due to genotype (p: 1.0 x 10-
o), *d even more significantly, due to harvest time (p : 1.24 x 10⁻⁷) (2-way ANOVA)
(Appendix 2,4.2.4) (Fig. a.10). By l-way ANOVA, there were no significant differences in
Av.LSL between WI 25g5 and Amagi Nijo at either 14D and 21D. But there was a significant
increase in Av.LSL in WI 2585 between 21D and 28D (p : 0.03); and, more significantly' in
\M 2585 between 28D and 35D (p : 0.02, l-way ANOVA, n: I2). While the Av.LSL
continued to increase significantly with time in 'WI 2585, there was only a relatively small
increase in Amagi Nijo (Fig. 4'10).
eg)U)Jj
30
25
20
15
10
5
0
trIw|2585AmagiNijo
21 days 28 days
Mn addition (15 mg/kg dry soil)
14 days 35 days
Fig. 4.10 The Av.LSL (mmll2 plants) of WI 2585 and Amagi Nijo growing in pots
inoculated with Ggr 17916 in a controlled-environment growth chamber with 15 mg MrVkg
soil treatment. The figure shows the effect on Av.LSL of genotype and harvest time. Values
are the means of 12 replicate pots. The vertical bars show the SE.

59
There \¡/as a signif,rcant interaction with PIR between genotype and harvest time (p :
0.02,2-way ANOVA) (Appendix 2.4.2.5) (Fig. 4.11). By 2-way ANOVA, there was also a
signihcant difference in PIR due to harvest time (p : 0.003), but none due to the genotype
main effect. By l-way ANOVA, there was no significant difference in PIR between \M 2585
and Amagi Nijo at any of the harvest times (p > 0.05, n : l2), but there was a significant
increase in Amagi Nijo PIR between 28D-35D (p : 0.02, l-way ANOVA) (Fig. a.11)'
E wlzsasI AmagiNijo
* p < 0.05 (1-waY ANOVA)
p = 0.02 Amagi Nijo T3/T4.->**
14 days 35 days
Fig.4.11 The PIR of WI 2585 and Amagi Nijo gowing in pots inoculated with Ggl
17916 in a controlled-environment growth chamber with 15 mg MrVkg soil treatment' The
figure shows the effect on PIR of genotype and harvest time. values are the means of 12
replicate pots. The vertical bars show the SE.
4.4 Discussion
4.4.1 The Ggl exPeriment
The addition of Mn fertiliser and the resulting increase in shoot Mn concentration of
WI 2585 to shoot Mn sufficiency concentration did not significantly reduce the Av.LSL in WI
2535 (Fig. 4.3). In addition, the Av.LSL in Amagi Nijo is short with either a shoot Mn
concerrtration below or abovc the critical shoot Mn concentration (Fig. 4.2 and Fig' a'3)'
Further, the Av.LSL in Amagi Nijo was not significantly shortened with an increase in Mn
addition to the soil from 0 to 15 mg Mnlkg dry soil. This result suggests that Amagi Nijo may
have a Mn-independent resistance to Ggt.
00908070
605040
302010
0
frÈ
21 days 28 days
Mn addition (15 mg/kg dry soil)

60
The PIR results show no sensitivity to the rate of Mn application to the soil or to
shoot Mn concentration of the plants (Fig. a.a). WI 2585 gro\ryn with nil Ggt has a
significantly higher root Mn concentration compared to Amagi Nijo (Fig. a.5). When infected
with Ggt, 'q¡¡ 2585 had a higher root Mn concentration compffed to Amagi Nijo, but it was
not significantly higher (Fig. 4.6). This result may be due to Ggt ptecipitating Mn when
growing within the roots of WI2585 (with a longer Av.LSL) more than in Amagi Nijo (with a
shorter Av.LSL) (see section 1.8)'
4.4.2 The temporal study
The Av.LSL in WI 2585 and Amagi Nijo was similar at l4D and 2lD (Fig. a.l0).
Significantþ, the longer Av.LSL in the Mn-inefficient \VI 2585 than in the Mn-efficient
Amagi Nijo occurs only after 2l days, when the rate in the increase of Av.LSL is slower in
Amagi Nijo compared to WI 2585 (Fig. a.10). Thus, a seedling plant biochemical defence
mechanismwhichisactivated after2l daysandby day 28 inthe root of AmagiNijo may be
inhibiting the rate of growth of Ggt within the root stele resulting in the low Av.LSL in Amagi
Nijo compared to WI2585.
The PIR between WI 2585 and Amagi Nijo are similar at all harvest times (Fig. 4.1 l);
however, the finding that the PIR of Amagi Nijo significantly increases between 28D-35D
suggests that this hypothesised pathogen defence mechanism in Amagi Nijo is not sustained
after 28D.
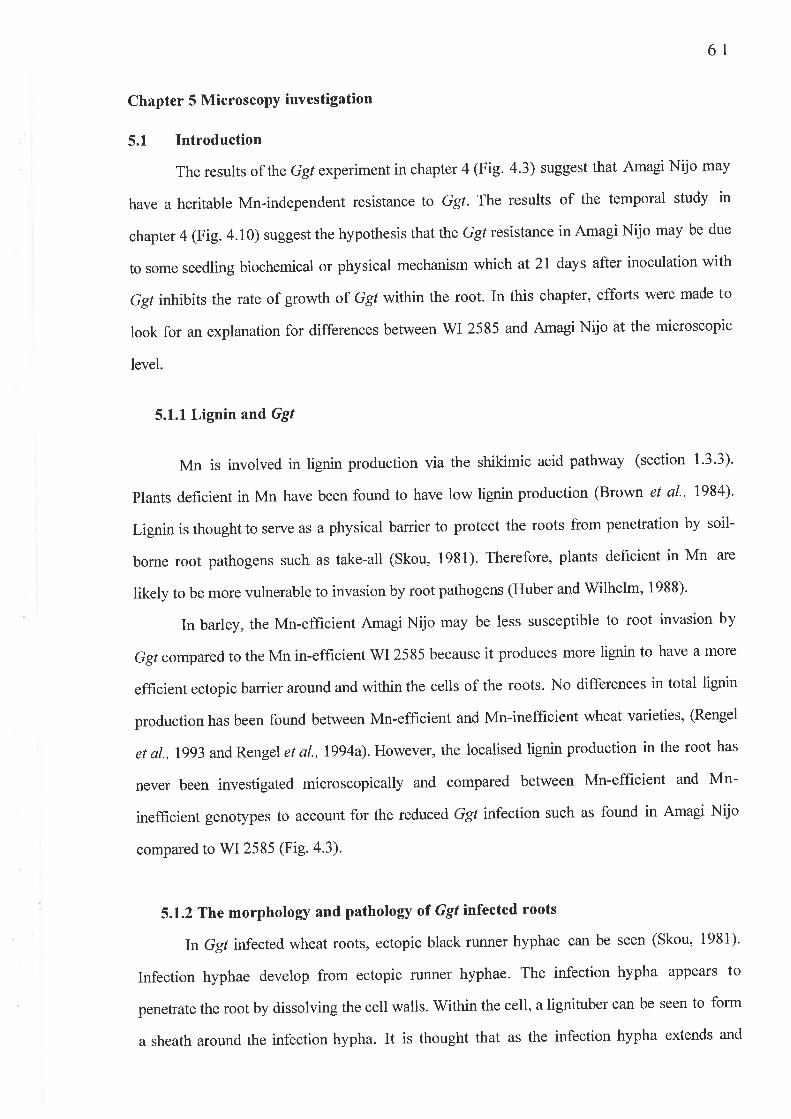
6l
Chapter 5 Microscopy investigation
5.1 Introduction
The results of the Ggl experiment in chapter a @ig. 4.3) suggest that Amagi Nijo may
have a heritable Mn-independent resistance to Ggt. The results of the temporal study in
chapter a Gig. 4.10) suggest the hypothesis that the Ggf resistance in Amagi Nijo may be due
to some seedling biochemical or physical mechanism which at 2l days after inoculation with
Ggl inhibits the rate of growth of Ggt within the root. In this chapter, efforts were made to
look for an explanation for differences between WI 2585 and Amagi Nijo at the microscopic
level
5.1.1 Lignin and Ggl
Mn is involved in lignin production via the shikimic acid pathway (section 1.3.3).
plants deficient in Mn have been found to have low lignin production (Brown et al., 1984)'
Lignin is thought to serve as a physical barrier to protect the roots from penetration by soil-
borne root pathogens such as take-all (Skou, 19Sl). Therefore, plants deficient in Mn are
likely to be more vulnerable to invasion by root pathogens (Huber and Wilhelm, 1988).
In barley, the Mn-efficient Amagi Nijo may be less susceptible to root invasion by
Ggl compared to the Mn in-efficient WI 2585 because it produces more lignin to have a more
efficient ectopic barrier around and within the cells of the roots. No differences in total lignin
production has been found between Mn-efficient and Mn-inefficient wheat varieties, (Rengel
et al., 1993 and Rengel et al., 7994a). However, the localised lignin production in the root has
never been investigated microscopically and compared between Mn-efficient and Mn-
inefficient genotypes to account for the reduced Ggt infection such as found in Amagi Nijo
compared to V/I 2585 (Fig. 4.3).
5.1.2 The morphology and pathology of Ggl infected roots
lnGgt infected wheat roots, ectopic black runner hyphae can be seen (Skou, 1981).
Infection hyphae develop from ectopic runner hyphae' The infection hypha appears to
penetrate the root by dissolving the cell walls. V/ithin the cell, a lignituber can be seen to form
a sheath around the infection hypha. It is thought that as the infection hypha extends and
62
grows in to the cell, it dissolves the end of the lignituber (Skou, I 93 1). The morphology of
Ggf infection in primary roots may be different between the two genotypes. Fluorescent
stains for lignin (condensed phenols), DNA and proteins, visualised under a IJV microscope
may show differences between genotypes in root morphology and Ggt pathology within and
on the infected roots (O' Brien and Mc Cully, 1981).
5.1.3 SEM and EASEM
The Ggt infection can be compared using a temporal investigation of WI 2585 and
Amagi Nijo infected roots using Scanning Electron Microscopy (SEM) and Elemental
Analysis Electron Scanning Microscopy (EASEM) to detect mineral elements in the samples.
The use of these methods may reveal differences between genotypes in the morphology and
density of Gg ectopic rurìner hyphae, root growth morphology, penetration sites of Ggt
infection hyphae on the surface of the root, and growth within the roots.
5.2 Method
5.2.1 UV fluorescence microscoPY
The root samples used were from the Ggl experiment (section 4.2.1)- The roots
selected for UV fluorescence microscopy ìwere the roots of each genotype which were
representative of the mean Av.LSL and PIR for each treatment (n : 12). Samples of root 1-2
cm below the crown were cut into I cm long sections (O' Brien and Mc Cully, 1981) for
analysis as follows:
5.2.2 Fluorescent staining for phenols, DNA and proteins
Auto fluorescence of the root tissue was controlled for by mounting a 1 cm section of
the root on the microscope slide in 80% glycerol. At the excitation wavelength, 500 nm, xylem
fluoresces green (O' Brien and Mc Cully, 1981).
Acid fuchsin is used to visualise fungal infections of tiesh roots. Acid Fuchsin stain in
roots infected with fungi shows up the storage proteins of micro-organisms as a fluorescent
pink using excitation at 540 nm. The 1 cm long section of root is stained by immersion for 2
minutes in acid fuchsin stain at room temperature (acid fuchsin 0.1 g, lactic acid (lab grade),
63
g75 ml, glycerol 63 ml, milli-Q HrO to 1 L.). The sample was rinsed in milli-Q H2O' and
mounted onto the slide (O'Brien and Mc Cully, 1981)'
phenolics in lignified cell walls and cell nuclei were visualised by mounting onto a slide
in 0.01% ethidium bromide. Ethidium bromide penetrates both fresh whole roots and whole
mounts of fungi rapidly. Using excitation at 535 nm, phenolics fluoresce yellow-orange, while
round cell nuclei fluoresce red-orange (o'Brien and Mc cully, 1981).
Cell nuclei in fresh roots were visualised by mounting a I cm section of fresh root on a
slidein4',5-diamidino-2-phenylindoledihydrochloridehydrate (DAPI) (1.5 mgDAPI in 100
ml milli-e HrO). Small bright nuclei shine within the root using excitation at360 nm (O' Brien
and Mc Cully, 1981).
To enhance the contrast between phenols in the cell walls and nuclei within the cells, a
I cm section of fresh root was placed on a slide, stained with DAPI for 10 minutes, and then
ethidium bromide (0.01%) was added. Upon using excitation at 535 nm, the yellow-orange
background from the phenols is reduced so that the small round nuclei shine orange, while the
outline of the lignified cell walls are clearly visible against a black background.
The stained samples were placed on a Sheppard CR 09GP F761 microscope for both
light and UV microscopy and the appropriate light hlters inserted. With both 20x and 40x
magnification, photographs were taken under conditions that most suited features of interest
using Kodak RHC 160 ASA colour film.
5.2.3 SEM and EASEM
The samples used for SEM and EASEM were from the temporal study (section 4'2.2).
At each harvest and immediately following determination of PIR and Av.LSL, 1 cm long tissue
samples of every primary root from each plant of either WI 2585 or Amagi Nijo which
showed a mean Av.LSL Qnrnllz plants) and PIR (12 plants) were placed into SEM/TEM
fixative, and stored 4"C for 4-6 hours. The SEM/TEM fixative (100 rnl) was:
paraformaldehyde 4 g, NaH3 0.13 g, and2.5 ml glutaraldehyde (25Yo solution, EM grade) in
milli-e H2O. The samples were fixed and dehydrated in the following procedure'
1).'Wash 2xl1 mins in phosphate buffered saline (PBS) (for lL mixNaCl 8g, KCI 0'2g,
Na2HPOa 1.44g, KH2PO4 0.249, pH 7 .2), with 4Yo sucrose'
2). Post-fix in2Yo OsOa in PBS for l-2 hour on a rotor'
64
3). Dehydrate in 70o/o acetone 3 x 20 mins
90olo acetone 3 x 20 mins
95Yo acetone 3 x 20 mins
100% acetone 2 x 30 mins
100% acetone 1 x 60 mins
4). The samples were then critical-point dried in a critical point drier (Bal-TEC CPD 030).
5). The dried samples were then mounted onto stubs and cut to reveal the interior of the root.
6) Samples to be used for conventional SEM were coated with carbon/gold and stored at room
temperature in a dry atmosphere with silica gel in a desiccator.
7). Samples to be used for Elemental Analysis were not washed in OsOa, and were coated
with carbon rather than with carborVgold.
The samples were examined under a Phillips XL30 Field Emission Scanning Electron
Microscope. For the samples used for elemental analysis and with carbon coating only, the
Backscattered Electron Detector was put into place. After the image was optimised, labelled
photographs and elemental data charts were made and stored on the Centre for Electron
Microscopy and Microanalysis of South Australia (CEMMSA) server "ruska".
5.3 Results
5.3.1. Control stain for autofluorescence' 80 o glycerol.
Both the control (nil GSr) and Ggt-infected root sections showed green
autofluorescence. Since root samples do not contain chlorophyll, no red autofluorescence \Mas
found. In the Ggl infected root samples, the black runner hyphae of Ggt strain 17916 were
clearly visible. There were no observable differences between genotypes in the morphology
and density of Ggt ectopic runner hyphae, root growth morphology and penetration sites of
Ggl infection hyphae on the surface of the roots.
5.3.2 Acid fuchsin stain for proteins and micro-organisms.
Roots infected with Ggr showed pink hyphae within the roots. When placed under
confocal microscopy to attempt to reveal the interior root morphology of Ggt infection' the
hyphae were black. Therefore, the morphology of Ggt hyphae within the root was not visible
under the confocal mieroscope.
65
5.3.3 Ethidium bromide stain for phenols and cell nuclei DNA
In the infected and uninfected roots, ethidium bromide showed yellow-orange
fluorescence of the phenolics in the lignified square or oblong cell walls of the root. In
addition, orange-red small round nuclei were visible, and clearly distinguishable from the
yellow-orange square or oblong sections of the lignified cell walls. Ggt hyphae do not take up
this stain. Ggl infected roots showed dark ectopic rurìner hyphae and infection hypha root
entry points against the fluorescent yellow-orange background.
In both the uninfected and infected Ggf roots, there were no visible differences in
either location or amount of phenolic lignin synthesis between genotypes at both deficient and
sufficient shoot Mn concentrations. However, an increase in the amount of lignin synthesis in
both genotypes from deficient shoot Mn to sufficient shoot Mn concentrations was suggested
by a more vivid stain in the Mn-sufficient root. The ends of the stelar lesions are visible (Fig.
5.1). However, the detail is not visible at either 20x or 40x magnification to determine any
differences between Ggl infection hypha within WI 2585 and Amagi Nijo roots.
5.3.4 DAPI staining for cell nuclei DNA
DAPI fluorescent stain showed small round nuclei fluorescing brightly within the root
tissue of both genotypes for infected and uninfected roots. While soil grains on the sample
\¡/ere a green colour, black ectopic rurìner hyphae on the outside of the root, dark thick
invasion hypha at the root penetration site, and mycelia growing in the stele and rupturing the
root, all showed clearly against the light blue fluorescence of the DAPI stain taken up by the
root tissue (Fig. 5.2). A grey mycelial mass was also visible around the outside of the root, as
were the brightly shining nuclei in rapidly dividing cells of the growing root hairs. However,
no differences in morphology of root penetration site Ggr infection hypha between the
genotypes and between deficient and sufficient shoot Mn concentrations could be seen.
5.3.5 Double staining: DAPI for DNA and ethidium bromide for phenols and
DNA
Similarly, the double staining showed no observable differences between either
genotype of deficient and sufhcient shoot Mn concentrations. Lignified squared or oblong cell
walls and brightly shining DNA in the small round cell nuclei within the cells of the root were
visible. In infected roots, black runner hyphae could be visualised on the outside of the root.
In addition, the stelar lesions within the root were visible.
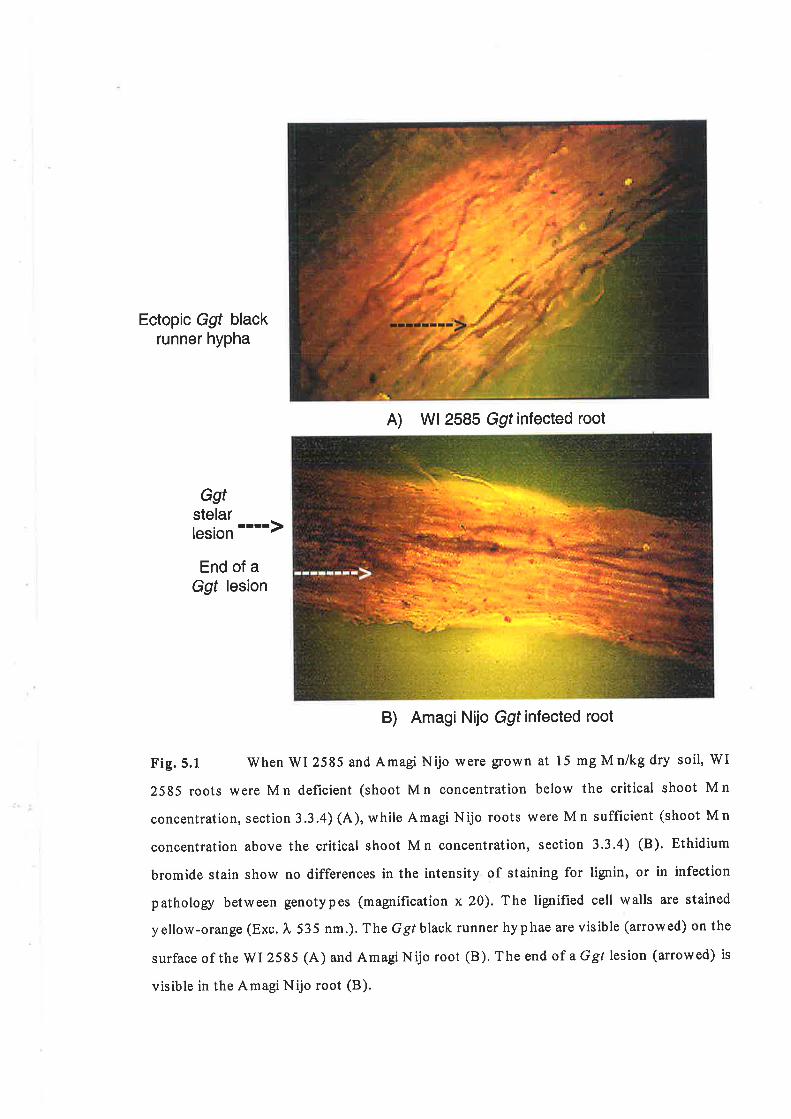
Ectopic Ggf blackrunner hypha
A) Wl 2585 Ggf infected root
Ggtstelarlesion
rrrr)
End of aGgf lesion
B) Amagi Nijo Ggf infected root
Fig.5.1 When WI 2585 and Amagi Nijo were glown at l5 mg Mn/kg dry soil, WI
2585 roots were Mn deficient (shoot Mn concentration below the critical shoot Mn
concentration, section 3.3.4) (A), while Amagi Nijo roots were Mn sufficient (shoot Mn
concentration above the critical shoot Mn concentration, section 3.3.4) (B). Ethidium
bromide stain show no differences in the intensity of staining for lignin, or in infection
patholory between genotypes (magnification x 20). The lignifîed cell walls are stained
yellow-orange (Exc. I 535 nm.). The Ggtblack runner hyphae are visible (arrowed) on the
surface of the WI 2585 (A) and Amagi Nijo root (B). The end of aGgt lesion (arrowed) is
visible in the Amagi Nijo root (B).
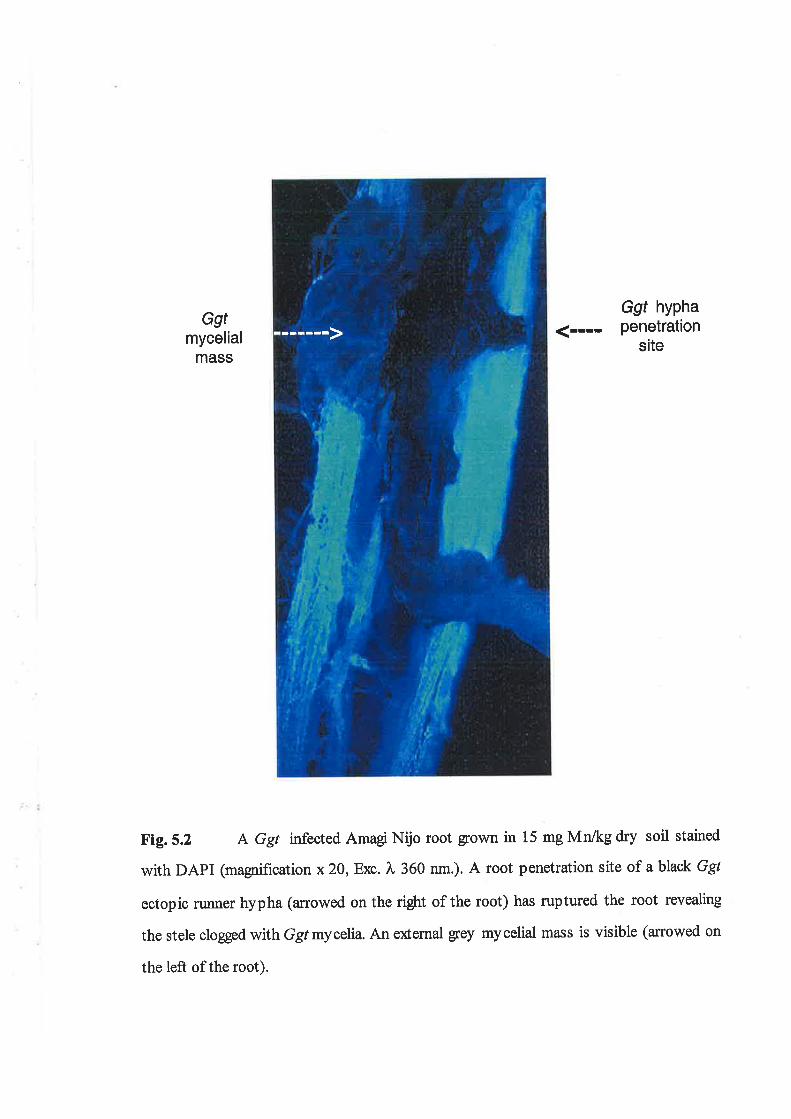
Ggtmycelial
mass
Ggf hyPha
(---- Penetrationsite
Fig. S.2 A Ggt infected Amagi Nijo root grown in 15 mg Mnlkg dry soil stained
with DAPI (magnification x 20, Exc. À 360 nm.). A root penetration site of ablack Ggl
ectopic runner hypha (arrowed on the rigþt of the root) has ruptured the root revealing
the stele clogged with Ggf mycelia. An eúernal grey mycelial mass is visible (arrowed on
the left of the root).
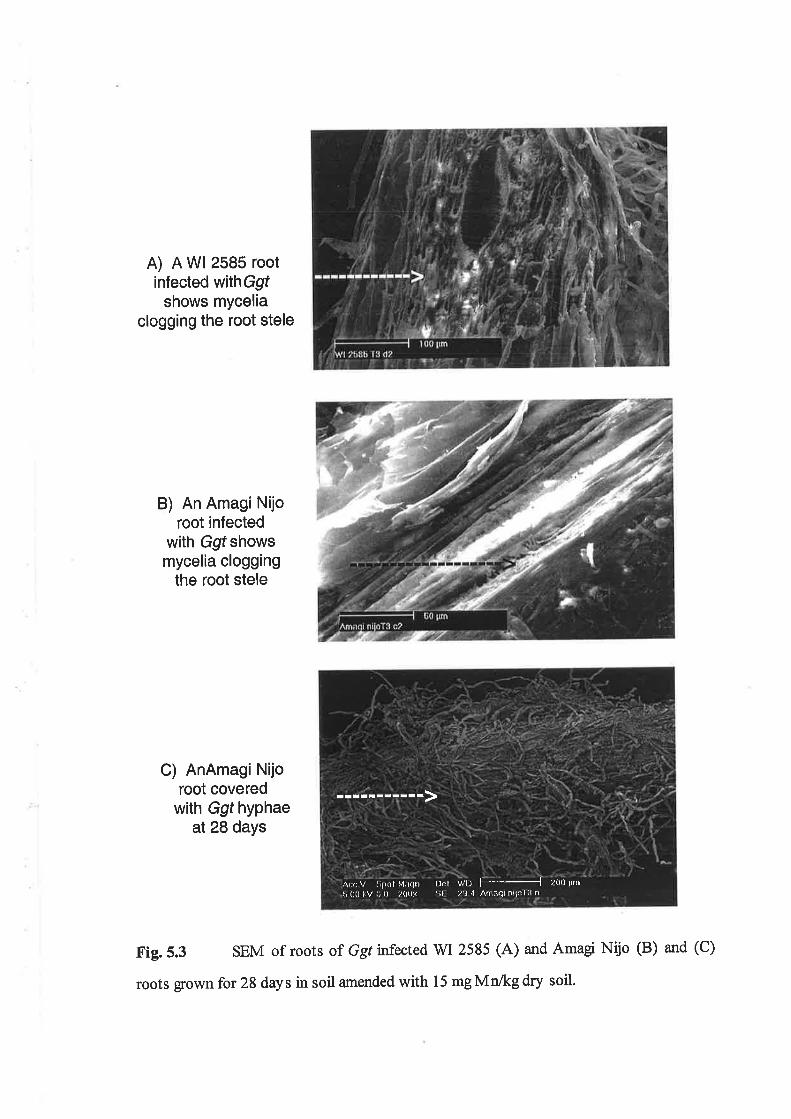
A) A Wl 2585 rootinfected withGgf
shows myceliaclogging the root stele
B) An Amagi Nijoroot infected
with Ggf showsmycelia clogging
the root stele
C) AnAmagi Nijoroot covered
with Ggf hyphaeat 28 days
F'ig. 5.3 SEM of roots of Ggt nfected WI 2585 (A) and Amagi Nijo (B) and (C)
roots grown for 28 days in soil amended with 15 mg Mnlkg dry soil.
{
llct Wl) F--l 2(l0 llmlil 2l) 4
^m¡r¡l nllo lil n
A(r: V ilpol M;r(lnl,0(! l:V li l) i/0(lx
66
5.3.2 SEM EASEM
At the 14 day harvest, Amagi Nijo appeared to have a less dense cover of ectopic Ggl
hyphae compared to WI 2585. But no differences in the density of ectopic Ggt hyphal cover,
intemal hyphae or mycelial morphologyl or morphology of Ggt infection points, were
observed at any of the subsequent harvest times. Because all parts of the infected roots of
both genotypes at all harvest times were clogged with fine Ggt mycelia, the gowing tips of
infection hypha were totally obscured from view (Fig. 5.3)'
5.4 I)iscussion
5.4.1 UV microscopy
All stains were effective under the staining times and methodology at the given
excitation wavelength (Exc. À), for both control (nil Ggt) and Ggt infected root tissue. The acid
fuchsin stained roots orange and the Ggt hypha pink under light microscopy. However, the
Ggt hyphae within the root only showed black when placed under the Confocal Microscope.
This may be due to the natural colour of the hypha being black and thus absorbing all
wavelengths of light.
An increase in the biosynthesis of lignin could be observed in both infected and
uninfected roots between deficient shoot Mn and sufficient shoot Mn concentrations.
However, there was no reduction in Av.LSL associated with increased lignin synthesis going
from deficient shoot Mn to sufhcient shoot Mn concentration with either genotype.
5.4.2 SEM and EASEM
Ggt hyphal infection points, and ectopic and intemal Ggt hyphal and mycelial
morphology and density between WI 2585 and Amagi Nijo are indistinguishable at all harvest
times. The density of the ectopic Ggl infection increased with time in both genotypes. The
tips of infection hyphae within the infected roots were totally obscured by the fine mycelia of
this particular Ggt isolate that completely cloggedthe stele of the root (Fig. 5.3). Elemental
Analysis of root Mn using SEM was not possible due to the root Mn being 100 times below
the detectable concentration for this method. Elemental Analysis using Transmission Electron
Microscopy (TEM) is 100 times more sensitive, but the magnification of TEM, (x 100,000),
is far too great to be of use for investigation of the morphology of Ggt. Therefore, it is not

67
practical to use TEM to detect root Mn within V/I 2585 and Amagi Nijo. In conclusion, SEM
investigation of the infected roots has not shown any differences between V/I 2585 and Amagi
Nijo to suggest a mechanism by which the growth of the Ggl fungus through the stele of the
Amagi Nijo roots is inhibited after 21 days.
68
Chapter 6 Genetic studies
6.1 Introduction
The studies described in chapter 2 rejected the hrst Null Hypothesis that there is no
physiological connection between the expression of the Mn effrciency trait and enhanced
resistance to Gg[ (section 1.10). In this chapter, genetic studies are used to test the alternative
second Null Hypothesis: that there is no genetic linkage between the Mel 1 (4HS) Mn-
efficient allele and enhanced resistance to Ggt (section 1.10). For the genetic studies, a doubled
haploid (DH) population (439 lines) of a cross between the Mn-efflrcient Amagi Nijo and the
Mn-inefficient V/I 2585 were used (Davies and Morton, 1997). DH plants are homozygous at
alt loci enabling accurate early generation screening (Thomson et al., 1991 and Zivy et al-,
r9e2).
The DH Ggl study required the accurate classification of lines into those with the Mn-
efficient or Mn-inefficient allele at Mel 1. A Restriction Fragment Length Polymorphism
(RFLp) marker for Mel l was available, but it was difhcult to interpret since it detected
multiple loci. Therefore, alternative markers \ilere sought based around the use of Amplified
Fragment Length Polymorphism (AFLP). To determine if the presence of the Mel I locus for
Mn efficiency on 4HS is linked to resistance to Ggt, the DH lines were grown and infected
with Ggf in soil deficient in plant available Mn under controlled-environment growth
conditions.
Second, it was also possible that a clear association between Mn eff,rciency and
resistance to Ggt resides at Mn efficiency loci other ihart Mel 1. The bioassays in Mn
deficient soil conducted in a controlled-environment suggested that the Mn-effrcient allele at
Met I accounts for 70-80% of the variance in Mn efficiency, while in field trials, it accounts
for only 50%o of the Mn efficiency (Pallotta et a1.,1999). This result suggests that genes at
other loci than Mel I may contribute to Mn efhciency in the field that do not express in the
pot bioassay. A field trial of the DH population at a Mn dehcient site at Marion Bay,
Southern yorke peninsula, South Australia was conducted in an attempt to identify additional
loci influencing Mn efficiencY.
69
6.2 Method
6.2.1 RFLP analysis to map Mel l precisely
RFLP analysis of WI 2585 and Amagi Nijo parents, and the 439 doubled haploid lines,
including the 29 doubled haploid lines infected with Ggt, was performed (Appendix 3, 3.1'
3.2, and3.2.l to 3.2.4) using the restriction endonuclease Dra I and RFLP probes wg622,
cdo583, abg7l4, andmwg77. All RFLP results for the DH lines were checked to confirm that
the allele type at Met I was consistent with data for Mn efficiency obtained in both pot
bioassays a¡d field Mn efficiency data from two seasons (sections 6'2.4,6.2.5 and 6.2-6). The
mapping programme used to map Mel l precisely on 4HS was Map Manager QT Version
b16, p < 0.01 (Manly and Cudmote 1997) (Appendix 3,3.2 and 3.3)'
6.2.2 Tlne DH Ggt exPeriment
The soil was prepared, incubated, and basal nutrients added (section 2.2'2). Mn, as
MnSOa, was added to correspond to 15 mg MrVkg dry soil. V/I 2585 and Amagi Nijo were the
controls for29 DH lines selected (sections 6.1 and 6.2.1) for infection with Ggl isolate 17916
(see section 2.2.2). There were2pots x 3l genotype/DH lines x 6 plantsiDH line. In all, there
werc 62pots. The seeds used were as listed in Appendix 1, Table 2.2. The Mn-efficient allele
was present in 15 DH lines, while the Mn-ineff,rcient allele was present in 14 DH lines (see
section 6.2.1). Statistical analysis was by l-way ANOVA for all the results obtained (section
2.2.2) (Appendix 2, 6.1).
6.2.3 Outdoor Ggt bioassay
Ggl infection of roots is known to be highly variable. Confirmation of resistance to
Ggt 17916 in the parents and DH lines was checked by Dr H V/allwork (SARDI) in an
outdoor soil bioassay with a mixed Ggl inoculum. The DH lines that showed a short Av.LSL
in earlier experiments and parents WI 2585 and Amagi Nijo were grown in 5 cm x 15 cm tubes
transplanted into sand such that the plant roots grew through the sand. The tubes were placed
over a layer of sand that had been fertilised with Osmocote Plus (Total N 16%, P 3.5o/o, K
10%, S 2.4yo,Mg l.2Yo,B 0.02yo, Cu 0.05olo, Fe 0.4Yo, Mn 0.06%,Mo 0.02o/o,Zn 0'0l5Yo
10
and organic resin coatingS%) controlled release plant food (0.3 g/tube) (The Scotts Company,
Ohio, USA). The soil in the tubes was a modified UC mix pH - 6.8. Coarse washed sand
(Golden Grove) 350L was pasteurised at 100"C for 30 minutes to kill microbes. Then,
Eurotorf peatmoss (250 L) was mixed with the sand for l0 seconds. Ten minutes after the
temperature of this mix had dropped to 80"C, the fertilisers Ca(OH)2 500 g, CaCO3 500 g, and
Nitrophoska(N15 yo,P3.9o/o,Kl2.4o/o,Mgl.25Yo,Ca3.40%o 5009, S 5.300^, Fe 0.30%, Cu
0.0002o/o, Zn 0.007o/o, B 0.0lyo and Mo 0.0003%) were all mixed into it for 20 seconds to
ensure that the finished soil had sufficient air porosity. To this was added, at a rate of 0.03%
or 0.2 g/L soil, a mixed Ggl inoculum consisting of take-all infected ryegrass seeds. Each
variety/DH line was tested using 4 blocks of 25 plants. Watering was by overhead irrigation
for20 mins twice aday. The plants were harvested at maturity. Ggt infection levels were
determined using visual scores from I (no infection) to 5 (plant is dead from the infection) of
both the severity in blackening of the root stele, and the health and extent of the plant foliage.
Statistical analysis was by General Analysis of Variance (Microsoft Statistix Version 2 for
V/indows), (cr: 0.05).
6.2.4 Field trial
The field trial was conducted during the winter of 1999 at a severely Mn deficient site
at Marion Bay, Southern Yorke Peninsula, South Australia. There were 3 replicates of 62 DH
entries in the 1999 field trial. The DH lines were selected against a number of criteria collated
inthe 1998 field trial to obtain data for analysis that was as free as possible of confounding
factors. The seed was taken from the + Mn plots, was similar in size and Mn concentration
and had shown mid-maturity in the 1998 freld trial.
6.2.5 Fietd trial design
A split-plot factorial field experiment was conducted, laid out in a randomised
complete block design. The main plots were genotype and the split-plots were the Mn
treatment. Each main plot was split into two Mn treatments (62 DH lines x +/- Mn
treatments x 3 replicate sub-plots). In addition, WI 2585 and Amagi Nijo were used as
controls (2 genotypes x*/- Mn treatments x 18 replicate sub-plots). In all, there were 444

7lsub-plots in the field trial. At sowing, 20kgMrVha as manganese oxysulphate was applied to
the + Mn plots. Also applied to the -l Mn plots, were two foliar sprays (Mn as MnSOa;-
Mangasol 47, Top Australia Ltd.), firstly at maximum tillering to early elongation stage and
secondly at early grain filling stage. Each nil Mn (- Mn) and + Mn sub-plot consisted of 6
rows with 15 cm spacing sown at a seeding rate of 170-180 seed/m2. The plot area harvested
)was J.J) m-.
6.2.6 Analysis of 1999 fÏeld trial
Six weeks aftcr sowing, the youngest emerged leaf blade (YEB) shoot samples (16
blades) were taken evenly across each - Mn and + Mn sub-plot for determination of YEB Mn
concentration (mg/kg DM) (section2.2.2). The relative shoot (YEB) Mn concentration was
calculated,
relative YEB Mn concentration : 100 x YEB [Mn] from - Mn plotiYEB [Mn] from +
Mn plot.
Twelve weeks after sowing, the sampling of YEBs was repeated. The maturity scores (1-5)
were recorded (1 all the heads still in boot, 5 all heads fully out). At the same time, the field
trial was visually assessed for Mn efficiency (0-100) (%). Comparing the nil Mn plot to the +
Mn plot, points were deducted from a maximum of 50 for decreased vegetative growth, from a
maximum of 20 for each of increased chlorosis and necrosis, and from a maximum of 10 for
increased leaf collapse. These scores were added for each DH line.
At harvest, the relative yield was determined,
relative yield: 100 x yield (g) from - Mn plot/yield (g) from + Mn plot.
Spatial analysis (Gilmour et al., l99J) of the field data was done by H. Oakey, BiometricsSA
to remove spatially systematic variation obtained in held trials. The data were used to detect
Quantitative Trait Loci (QTLs) (Map Manager QT Version b16, Manly and Cudmore, 1997)
influencing Mn efficiency in this DH population(62 DH lines) (tog likelihood (LOD) > 3.2, p
< 0.001) (Appendix 3.2). The significance for a QTL in a minimum interval between markers
20 cM to 40 cM (centimorgan) is given as valid if the LOD score is > 3.2 (Lander and
Botstein, 1939). A graphical display of associations between QTLs was displayed using Q-
GENE (Nelson 1997) (Appendix 3.2 and3.3).

72
6,3 Results
6.3.1 RFLP mapping of Mel l
Dral was used for the identification of polymorphisms between parents WI 2585 and
Amagi Nijo for Xcdo583 (Fig. 6.1), Xwg622, Xmwg77, and Xabg714. The RFLP analysis of
439 doubled haploid lines suggested that Mel I is located within a region of 1.4 cM between
RFLP markers Xcdo583 and Xabg7l4 on chromosome 4HS (Fig. 6.2). The LOD score
obtained (LOD :62.5) is highly significant (Appendix 3,3.2 and 3'3).
Chi-square 51¿1s, P = 0.01
Xw9622
7.4
1.4Xcdo583
Xabg71 4
3.0
Xmwg77
Fig. 6.2 M;ap of Mel 1 region of chromosome 4HS
6.3.2 AFLP mapping of Mel I
The AFLP analysis of the WI 2585 and Amagi Nijo parents and their bulks identified
two putative AFLP markers linked to Mel l (Appendix 3.4).
The primer pair PslAA MseCTC identified a clear polymorphism (Fig. 6.3). The
polymorphism (arrowed) was identified between V/I 2585 (no band) and Amagi Nijo (band),
and also between WI 2585-like bulk (no band), and Amagi Nijo-like bulk (band). This AFLP
marker showed a segregation pattern of 80% similarity to Mel l with the 20 individual DH
lines which made up the V/I 2585-like bulk and the Amagi Nijo-like bulk (Fig. 6'3).
The primer pair PstAC MseCAC also identified a polymorphism (Fig. 6.4). This
marker co-segregated with Mel I for 70Vo of the 20 individual bulk DH lines of the WI 2585-
like bulk (Fig. 6.4).
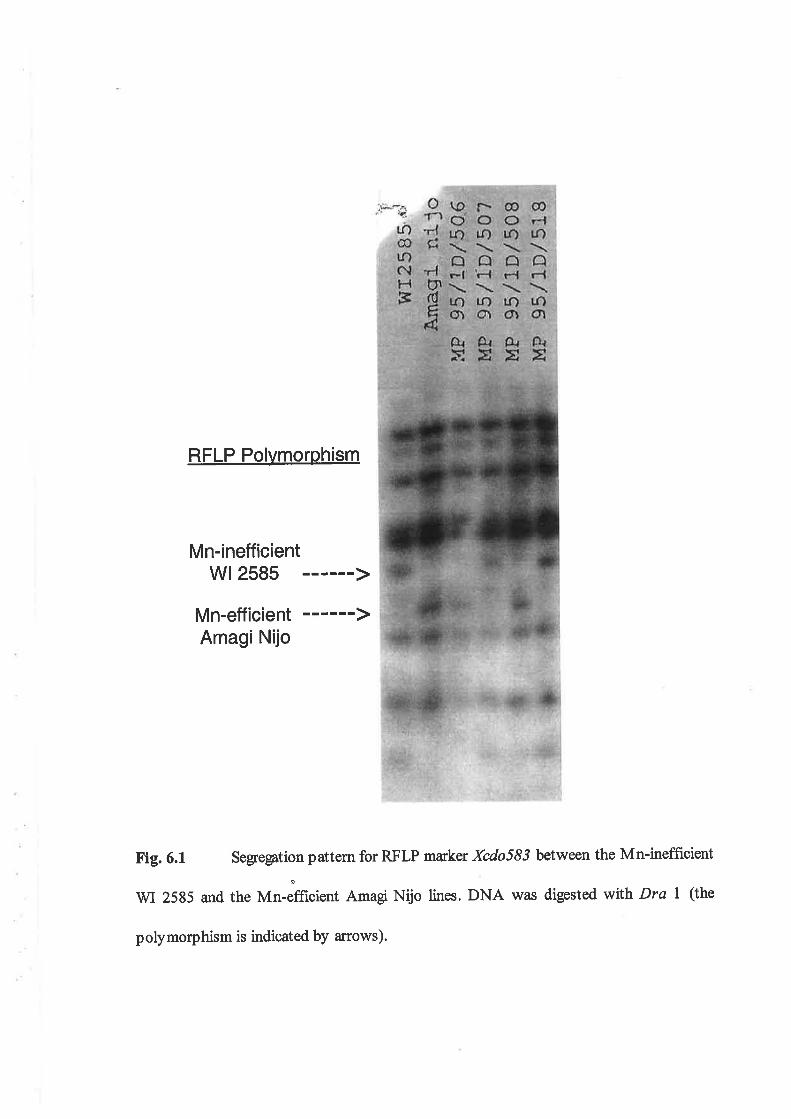
RFLP Polymorphism
Mn-inefficientwl 2585 >
Mn-efficient >Amagi Nijo
Fig. 6.1 Segregation pattern for RFLP marker Xcdo583 between the Mn-inefficient
WI 2585 and the Mn-efflrcient Amagi Nlio lines. DNA was digested with Dra 7 (the
polymorphism is indicated by anows).
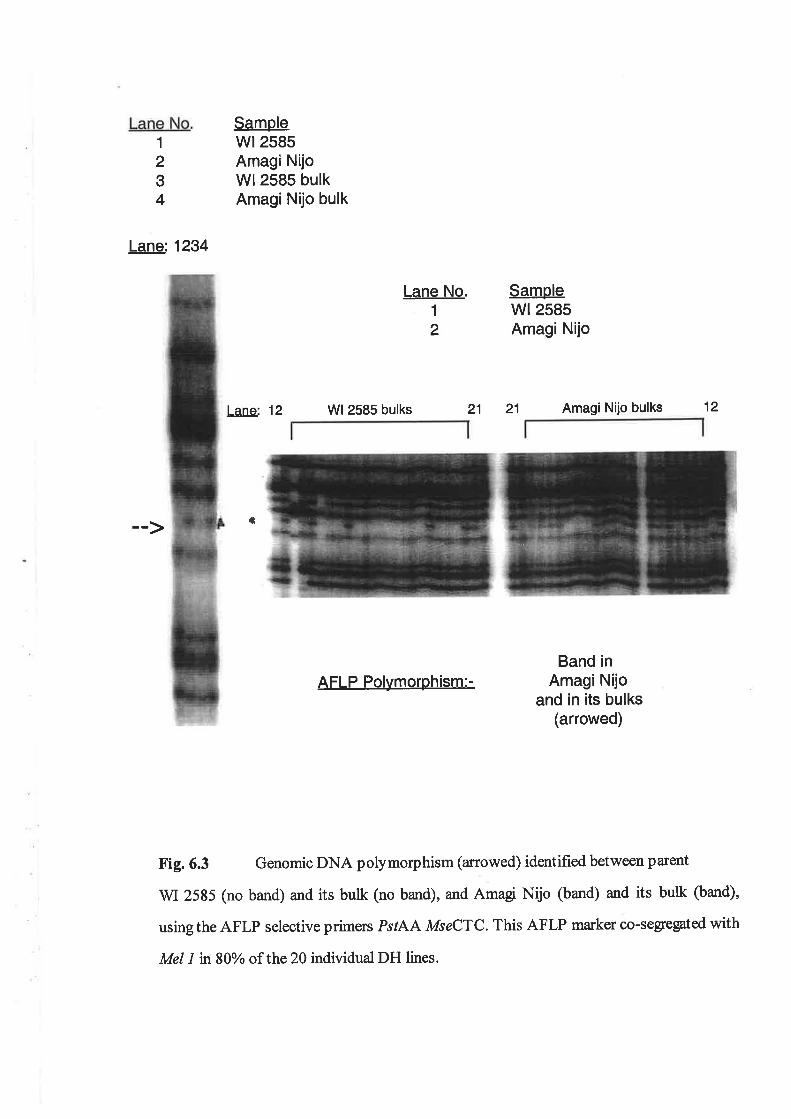
Lane No. Samplewt 2585Amagi NijoWl 2585 bulkAmagi Nijo bulk
Samplewl 2585Amagi Nijo
Lans 12 Wl 2585 bulks 21 21 Amagi Nijo bulks 12
t
1
234
Lane: 1234
Lane No.1
2
AFLP Polymorphism:-Band in
Amagi Nijoand in its bulks
(arrowed)
F'ig. 6.3 Genomic DNA polymorphism (arrowed) identified between parent
1ry1 2585 (no band) and its bulk (no band), and Amagi Nijo (band) and its bulk (band),
usingthe AFLP selective primers PsfAA MseCTC. This AFLP marker co-segepted with
Mel l in 80% of the 20 individual DH lines.
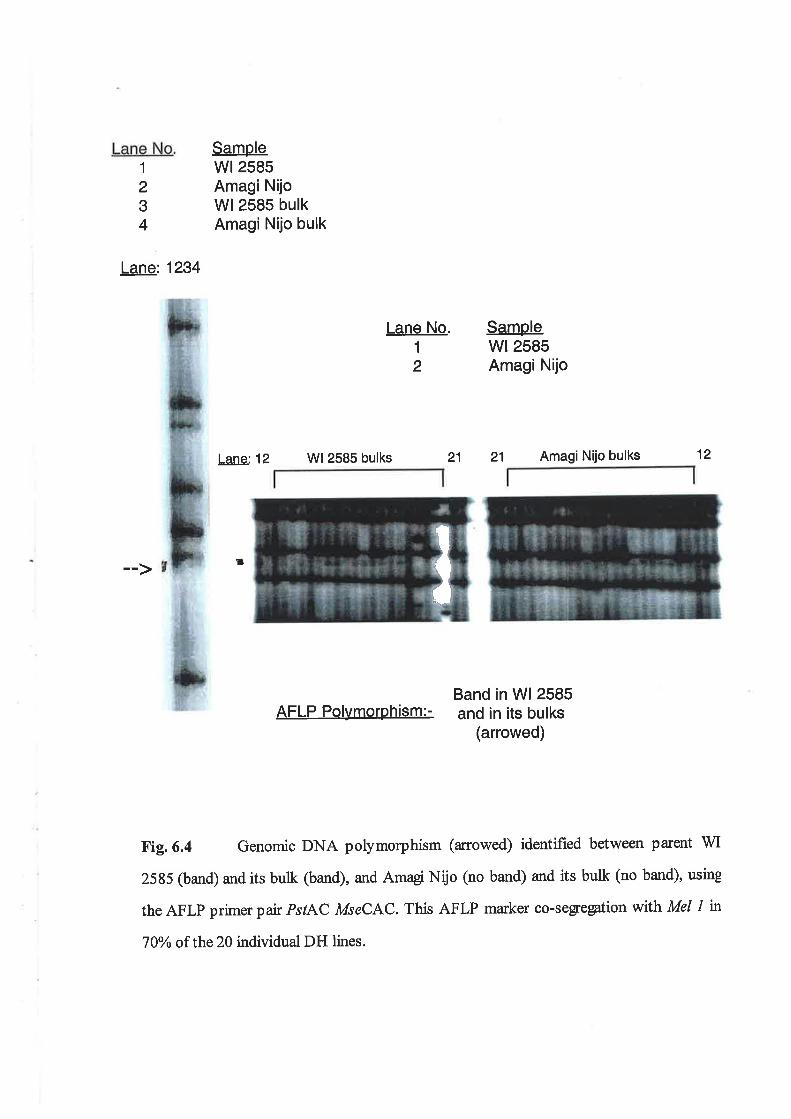
Lane No. Samolewl 2585Amagi NijoWl 2585 bulkAmagi Nijo bulk
Samolewt 2585Amagi Nijo
Lans 12 WI2585 bulks 21 21 Amagi Nijo bulks 12
I
1
234
Lane:1234
Lane No.1
2
Band in Wl 2585AFLP Polymorphism:- and in its bulks
(arrowed)
Fig.6.4 Genomic DNA polymorphism (arrowed) identified between parent WI
25S5 (band) and its bulk (band), and Amagi N{jo (no band) and its bulk (no band), using
the AFLP primer pair PslAC MseCAC, This AFLP marker co-segegation with Mel I n
70Yo of the 20 individual DH lines.
I
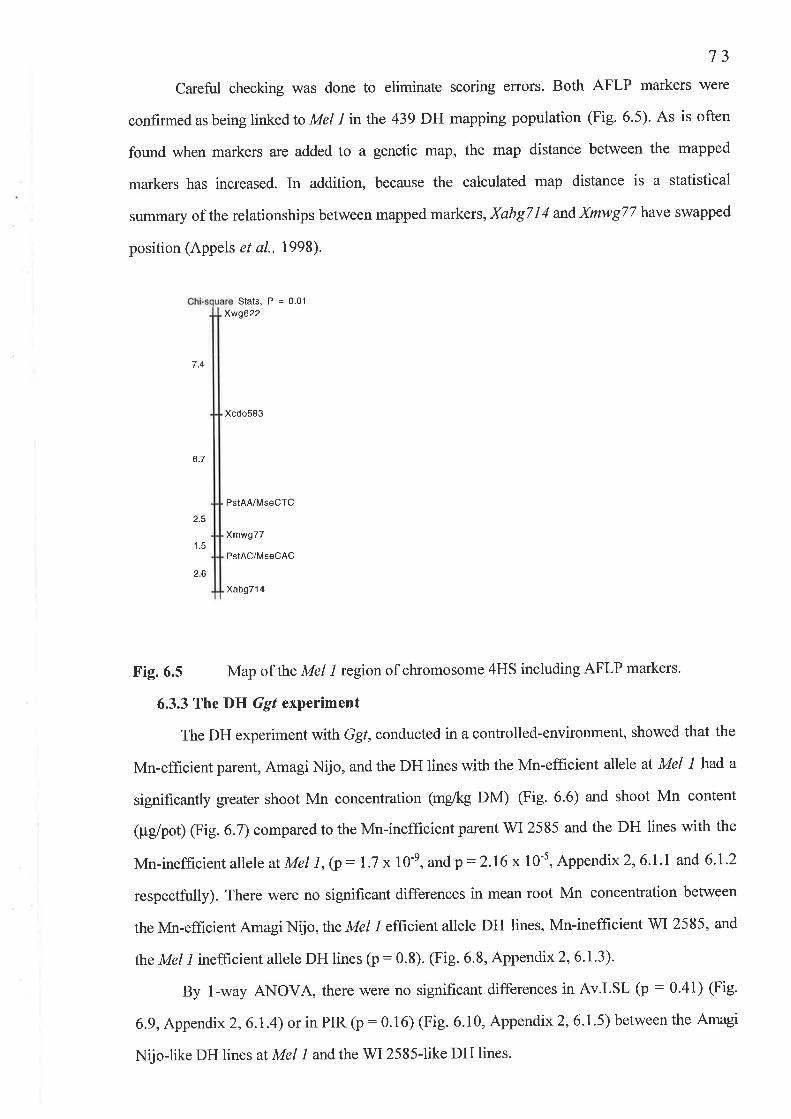
73
Careful checking was done to eliminate scoring errors. Both AFLP markers were
confirmed as being linked to Mel / in the 439 DH mapping population (Fig. 6.5). As is often
found when markers are added to a genetic map, the map distance between the mapped
markers has increased. In addition, because the calculated map distance is a statistical
sunmary of the relationships between mapped markers, Xabg7 14 and Xmwg77 have swapped
position (Appels et al., 1998).
Stats, P = 0.01
Xwg622
7.4
Xcdo583
6.7
PstAA/MseCTC
2.5
1.5
2.6
Xmwg77
PstAC/MseCAC
Xabg71 4
Fig. 6.5 Map of the Mel I region of chromosome 4HS including AFLP markers.
6.3.3 The DH Ggt experiment
The DH experiment withGgt,conducted in a controlled-environment, showed that the
Mn-efficient parent, Amagi Nijo, and the DH lines with the Mn-efficient allele at Mel I had a
significantly greater shoot Mn concentration (mdkg DM) (Fig. 6.6) and shoot Mn content
(pglpot) (Fig. 6.7) compared to the Mn-inefficient parent WI 2585 and the DH lines with the
Mn-inefflrcient allele atMel l,(p: I.7 xl}-e,andp :2.16 x 10⁻⁵, Appendix 2,6'll and 6'I'2
respectfully). There were no significant differences in mean root Mn concentration between
the Mn-efficient Amagi Nijo, the Mel l efficient allele DH lines, Mn-inefftcient WI 2585, and
Íhe Mel l inefhcient allele DH lines (p:0.8).(Fig. 6.8, Appendix 2,6.1.3).
By l-way ANOVA, there were no significant differences in Av.LSL (p : 0.41) (Fig.
6.9, Appen dix2,6.1.4) or in PIR (p : 0.16) (Fig. 6.10, Appendix 2,6.1.5) between the Amagi
Nijo-like DH lines at Mel l and the WI 2585-like DH lines.

74
Three V/I 2585-like doubled haploids showed a low Av.LSL. (D/5 Av.LSL: 7 -9 + 5.5
mm/plant, n: 6 plants, D1256 Av.LSL :7.98 + 2.2 mm/plant, n: 6 plants, and D/701
Av.LSL : 9.04 t2.6 mm/plant, n : 6 plants) all of which were of similar length to Amagi Nijo
Av.LSL : 8.4 + 3.7 mm/plant, n : 6 plants. In addition, eleven Amagi Nijo-like doubled
haploids showed a longer Av.LSL, (D 12, D 13, D 17, D 125, D 132, D I 49, D I 67 8, D 17 9 I, D 1819,
D1843 and D/862), all of which were similar in length to the Av.LSL in WI 2585, 18.2 + 5.5
mm/plant, n: 6 plants (Fig. 6.9). The shoot Mn concentration higher than 15 mg MrVkg DM
in some Amagi NijoJike DH lines did not result in a short Av.LSL (Fig 6.6 and Fig. 6.9).
These results supports the second Null Hypothesis that there is no genetic linkage between
the Mel l (4HS) Mn-efficient allele and enhanced resistance to Ggt (see section 1.10 and
section 6.1).2624222018
16
1412
10
8
6
4
2
0
I Mel 1 ineffcient alleledoubled haploids 1
Mel 'l efficient alleledoubled haploids
W|2585 parent Amagi Nijo parent
Fig. 6.6 WI 2585 and Mn-inefficient DH lines, and Amagi Nijo and Mn-efficient DH
lines grown in pots for 28 days with Ggt 17916 in a controlled-environment growth chamber
in soil treated with 15 mg Mn/kg. The figure shows the effect of Mel 1 allele type (1 allele
type/DH line) on shoot Mn concentration (mg/kg DM).Values are the means of 6 plants. The
vertical bars show the SE.
ôo)ll(')EU'oo-c(t.cc.9(ú
c0)ocooc
Shoot critical Mn concentration
/,/.iìt/r.
l+t:
,,,

75
c(ú
õ_o)f
cc)cooc
ooEU)
4.O
3.5
3.0
2.5
2.0
1.5
1.0
0.5
0.0
1 inefficient alleledoubled haploids
W|2585 parent
Fig. 6.7 WI 2585 and Mn-inefficient DH lines, and Amagi Nijo and Mn-eff,rcient DH
lines grown in pots for 28 days with Ggt 17916 in a controlled-environment growth chamber
in soil treated with 15 mg Mn/kg. The figure shows the effect of Mel 1 allele type (l allele
type/DH line) on shoot Mn content (pglplant). Values are the means of 6 plants. The vertical
bars show the SE.
50
c)45o)
å40Fe35<t,
E30.E 25c€20(d
È1soI 10o:5
Mel 1 inefficient alleledoubled haploids
parent
I Mel 1 efficient alledoubled haploids
WI Amagi Nijo parent
Fig. 6.8 WI 2585 and Mn-inefficient DH lines, and Amagi Nijo and Mn-efficient DH
lines grown in pots for 28 days with Ggt 17916 in a controlled-environment growth charnber
in soil treated with 15 mg Mn/kg. The figure shows the effect of Mel 1 allele type (1 allele
typeiDH line) on root Mn concentrations (mg/kg DM). Values are the means of 6 plants. The
vertical bars show the SE.
TI¡tI
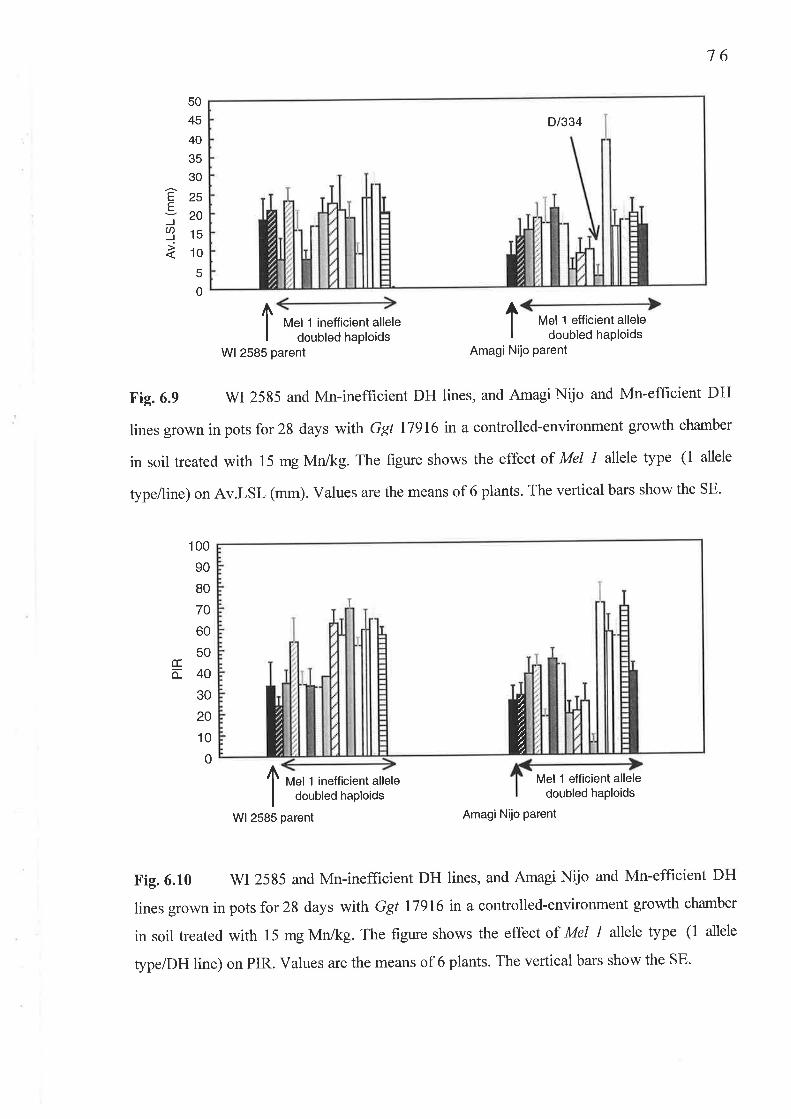
76
50
45
40
35
30
Ê25E12091sì10
5
0
D1334
1Mel 1 inefficient allele
doubled haploids I Mel 1 efficient alleledoubled haploids
Mel 1 efficient alleledoubled haploids
Wl 2585 parent Amagi Nijo parent
Fig. 6.9 WI 2585 and Mn-inefficient DH lines, and Amagi Nijo and Mn-efficient DH
lines grown in pots for 28 days with Ggt 17916 in a controlled-environment growth charnber
in soil treated with 15 mg Mnikg. The figure shows the effect of Mel 1 allele type (l allele
type/line) on Av.LSL (mm). Values are the means of 6 plants. The vertical bars show the SE.
00
90
80
70
60
50
40
30
20
10
0
1
Ío-
1Mel 1 inefficient allele
doubled haploids
W|2585 parent Amagi Nijo parent
Fig.6.10 WI 2585 and Mn-ineffrcient DH lines, and Amagi Nijo and Mn-efficient DH
lines grown in pots for 28 days with Ggt 17916 in a controlled-environment growth chamber
in soil treated with 15 mg Mn/kg. The figure shows the effect of Mel 1 allele type (1 allele
type/DH line) on PIR. Values are the means of 6 plants. The vertical bars show the SE.
t,;t.'L,t
,1
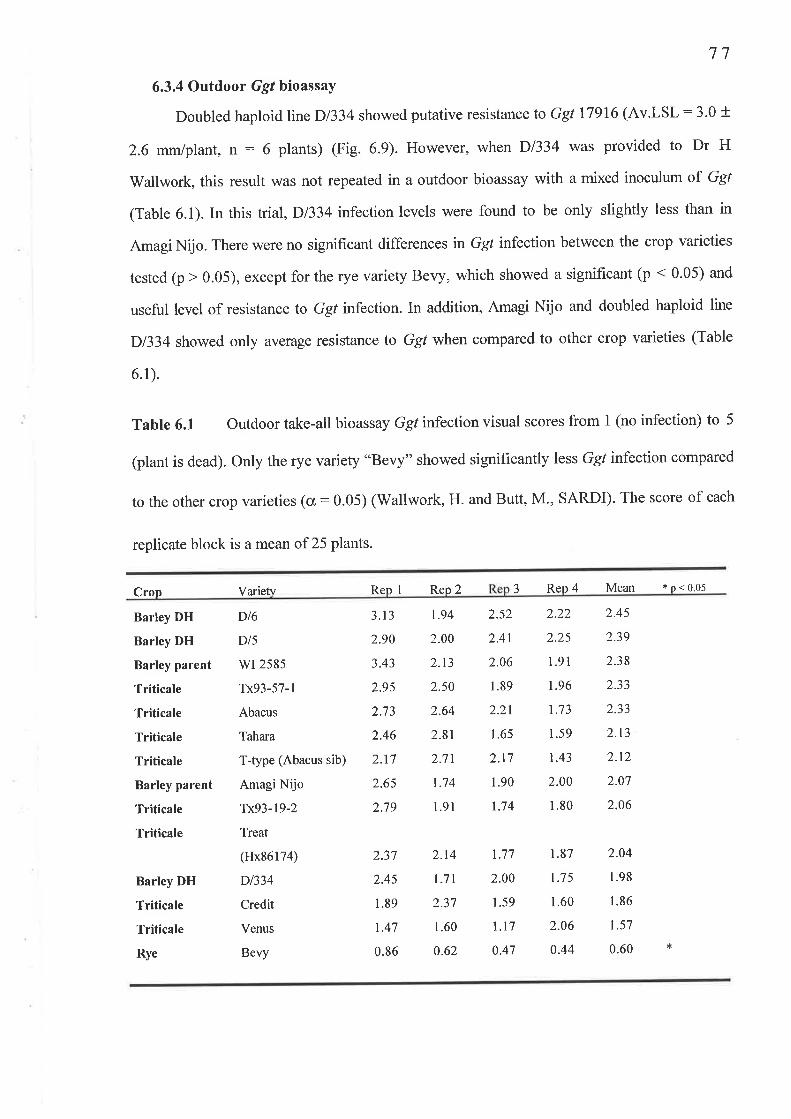
77
6.3.4 Outdoor Ggt bioassay
Doubled haploid line D/334 showed putative resistance to Ggt 17916 (Av.LSL:3.0 *
2.6 mmlplant, n : 6 plants) (Fig. 6.9). However, when D1334 was provided to Dr H
Wallwork, this result was not repeated in a outdoor bioassay with a mixed inoculum of Ggt
(Table 6.1). In this trial, D1334 infection levels were found to be only slightly less than in
Amagi Nijo. There were no significant differences in Ggt infection between the crop varieties
tested (p > 0.05), except for the rye variety B"rry, which showed a significant (p < 0.05) and
useful level of resistance to Ggt infection. In addition, Amagi Nijo and doubled haploid line
D1334 showed only average resistance to Ggt when compared to other crop varieties (Table
6.1).
Table 6.1 Outdoor take-all bioassay Ggt infection visual scores from I (no infection) to 5
(plant is dead). Only the rye variety "Bevy" showed significantly less Ggt infeclion compared
to the other crop varieties (cr:0.05) (Wallwork, H. and Butt, M., SARDI). The score of each
replicate block is a mean of 25 plants.
Cron Varietv Reo 1 Reo 2 3 Rep4 Mean *p<0.05
Barley DH
Barley DH
Barley parent
Triticale
Triticale
Triticale
Triticale
Barley parent
Triticale
Triticale
Barley DH
Triticale
Triticale
Rye
Dl6
Dl5
v/I 2585
Tx93-57- I
Abacus
Tahara
T-type (Abacus sib)
Amagi Nijo
Tx93-19-2
Treat
(Hx86174)
D1334
Credit
Venus
Bevy
3.13
2.90
3.43
2.9s
2.',|3
2.46
2.17
2.65
2.79
1.94
2.00
2.t3
2.50
2.64
2.81
2.71
1.74
l.9l
2.52
2.41
2.06
1.89
2.21
l.6s
2.17
1.90
1.74
2.22
2.25
1.91
1.96
1.73
1.59
1.43
2.00
l.80
2.45
2.39
2.38
2.33
¿.5 J
2.13
2.t2
2.07
2.06
2.37
2.45
l 89
1.47
0.86
2.r4
1.71
2.37
1.60
0.62
L77
2.00
1.s9
l.l70.47
1.87
1.7 5
1.60
2.06
0.44
2.04
1.98
1.86
1.57
0.60 *
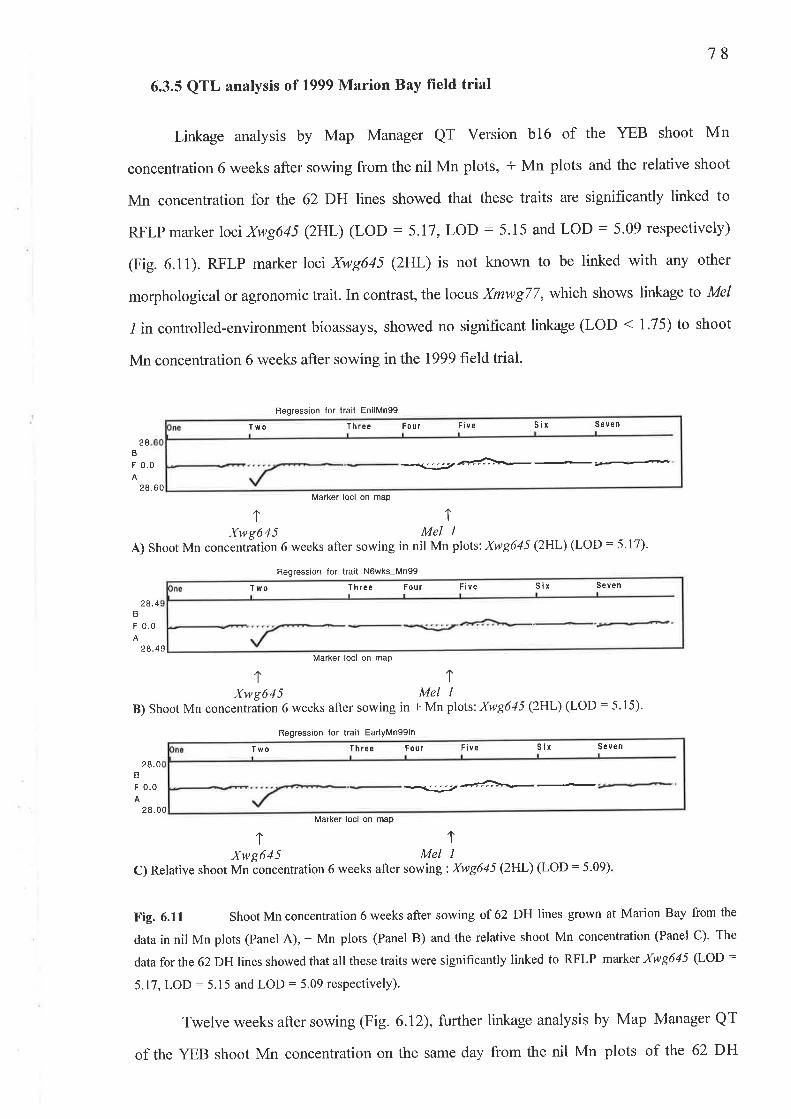
18
6.3.5 QTL analysis of 1999 Marion Bay field trial
Linkage analysis by Map Manager QT Version b16 of the YEB shoot Mn
concentration 6 weeks after sowing from the nil Mn plots, + Mn plots and the relative shoot
Mn concentration for the 62 DH lines showed that these traits are significantly linked to
RFLPmarker lociXwg645 (2HL) (LOD : 5.17, LOD: 5.15 and LOD: 5.09 respectively)
(Fig.6.11). RFLP marker lociXwg645 (2HL) is not known to be linked with any other
morphological or agronomic trait. In contrast, the locus Xmwg77, which shows linkage to Mel
1in controlled-environment bioassays, showed no significant linkage (LOD < l.l5) to shoot
Mn concentration 6 weeks after sowing in the 1999 field trial.
Regression for trait EnilMngg
28B
F 0.0A
28.60
1
Marker loci on map
1Xwg645 Mel l
A) Shoot Mn concentration 6 weeks after sowing in nil Mn ploÍs: Xwg645 (2HL) (LOD : 5.17).
2A.4B
F 0.0A
Regression for trail N6wks-Mn99
Regress¡on for trail EarlyMnggln
Marker loci on map
11Xwg645 Mel I
B) Shoot Mn concentràtion 6 weeks after sowing in + Mn plots'. Xwg645 (2HL) (LOD : 5.15)'
2A 49
2 8.00
28.0B
F 0.0A
1
Marker loci on map
1Xwg645 Mel I
C) Relative shoot Mn õoncentration 6 weeks after sowing : Xwg645 (2HL) (LOD : 5.09)
Fig. 6.ll ShootMnconcentration6weeksafter sowing of 62 DH lines grown at Marion Bay from the
data in nil Mn plots (Panel A), + Mn plots (Panel B) and the relative shoot Mn concentration (Panel C). The
data for the 62 DH lines showed that all these traits were significantly linked to RFLP marker Xwg645 (LOD :
5.17, LOD: 5.15 and LOD:5.09 respectively)'
Twelve weeks after sowing (Fig. 6.12), further linkage analysis by Map Manager QT
of the YEB shoot Mn concentration on the same day from the nil Mn plots of the 62 DH
ThreeTwo SixFiveFour Seven
Threefwo Five SevenSirFouf
Fou rThreeTwo Five SevenSix
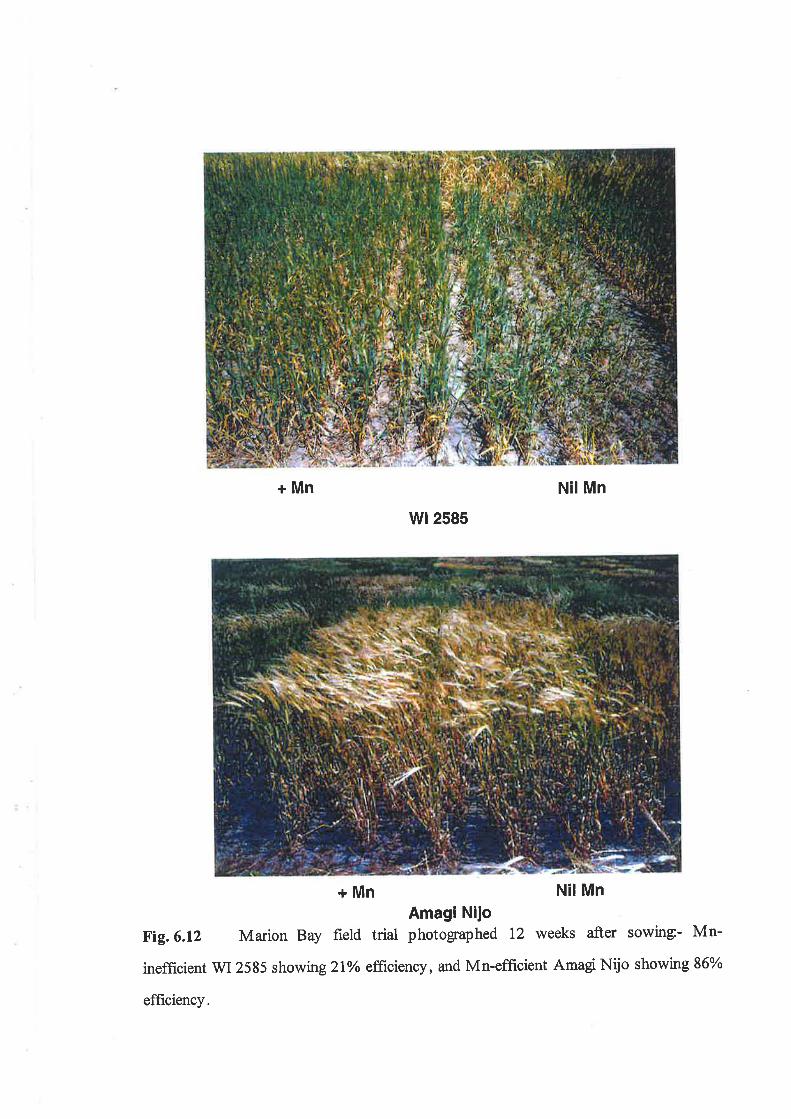
+Mn Nil Mn
wt 2585
+ Mn Nil Mn
Amagi Nijollig,6.l2 Marion Bay field trial photographed 12 weeks after sowing- Mn-
inefficient WI2585 showing 2lYo efficiency, and Mn-efficient Amagi Nijo showngS6%
efficiency.
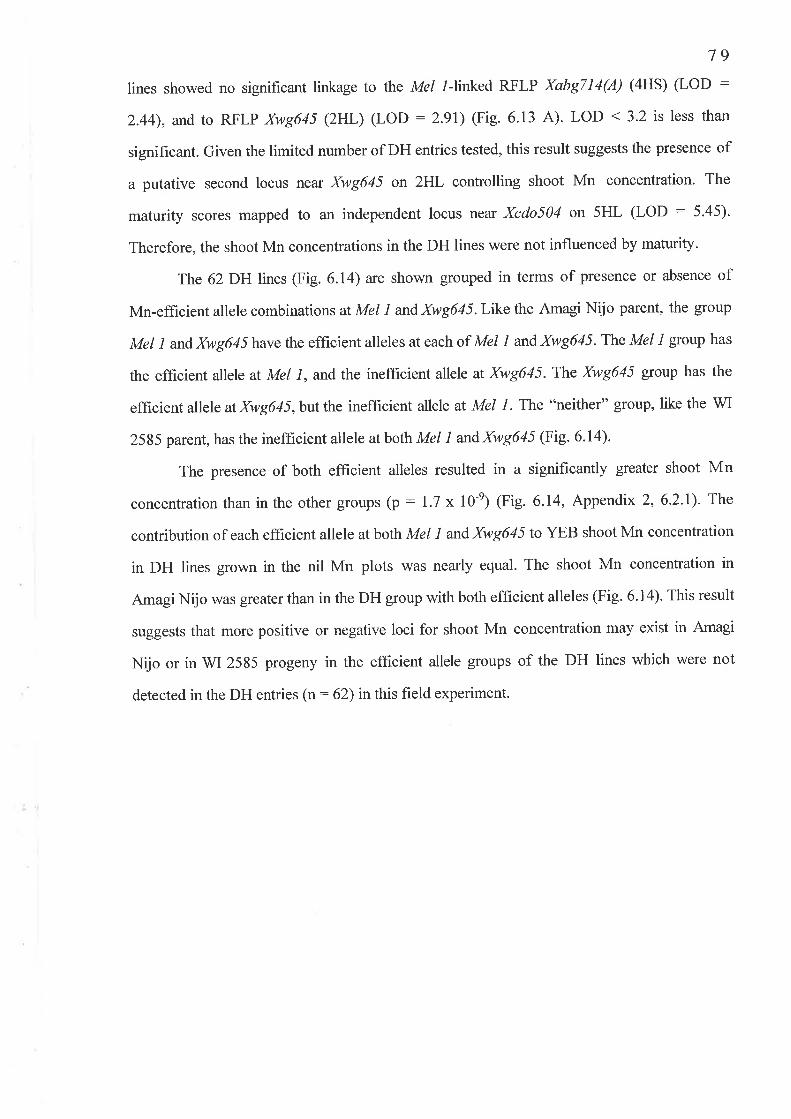
79
lines showed no significant linkage to the Mel t-linked RFLP XabgTl4(A) (4HS) (LOD :
2.44), and to RFLP Xwg645 (2HL) (LOD :2.91) (Fig.6.13 A). LOD <3.2 is less than
signihcant. Given the limited number of DH entries tested, this result suggests the presence of
a putative second locus near Xwg645 on 2HL controlling shoot Mn concentration. The
maturity scores mapped to an independent locus near Xcdo504 on 5HL (LOD : 5.45).
Therefore, the shoot Mn concentrations in the DH lines were not influenced by maturity.
The 62 DH lines (Fig. 6.1a) are shown grouped in terms of presence or absence of
Mn-efficient allele combinations at Mel t andXwg645. Like the Amagi Nijo parent, the group
Mel I un6y1atg645 have the effrcient alleles at each of Mel I andXwg645. The Mel I group has
the effrcient allele at Mel l, and the inefficient allele at Xwg645.The Xwg645 group has the
eflrcient alleleatXwg645,butthe inefficient allele at Mel1. The "neither" group, likethe WI
2585 parent, has the inefficient allele at both Mel I andxwg645 (Fig. 6.14).
The presence of both efficient alleles resulted in a significantly greater shoot Mn
concentrationthan inthe other groups (p: 1.7 x lO-e) (Fig. 6.14, Appendix 2,6.2'l). The
contribution of each efficient allele at both Mel I and Xwg645 to YEB shoot Mn concentration
in DH lines grown in the nil Mn plots was nearly equal. The shoot Mn concentration in
Amagi Nijo was greater than in the DH group \Mith both efficient alleles (Fig. 6.1a). This result
suggests that more positive or negative loci for shoot Mn concentration may exist in Amagi
Nijo or in WI 2585 progeny in the efficient allele groups of the DH lines which were not
detected in the DH entries (n:62) in this field experiment.
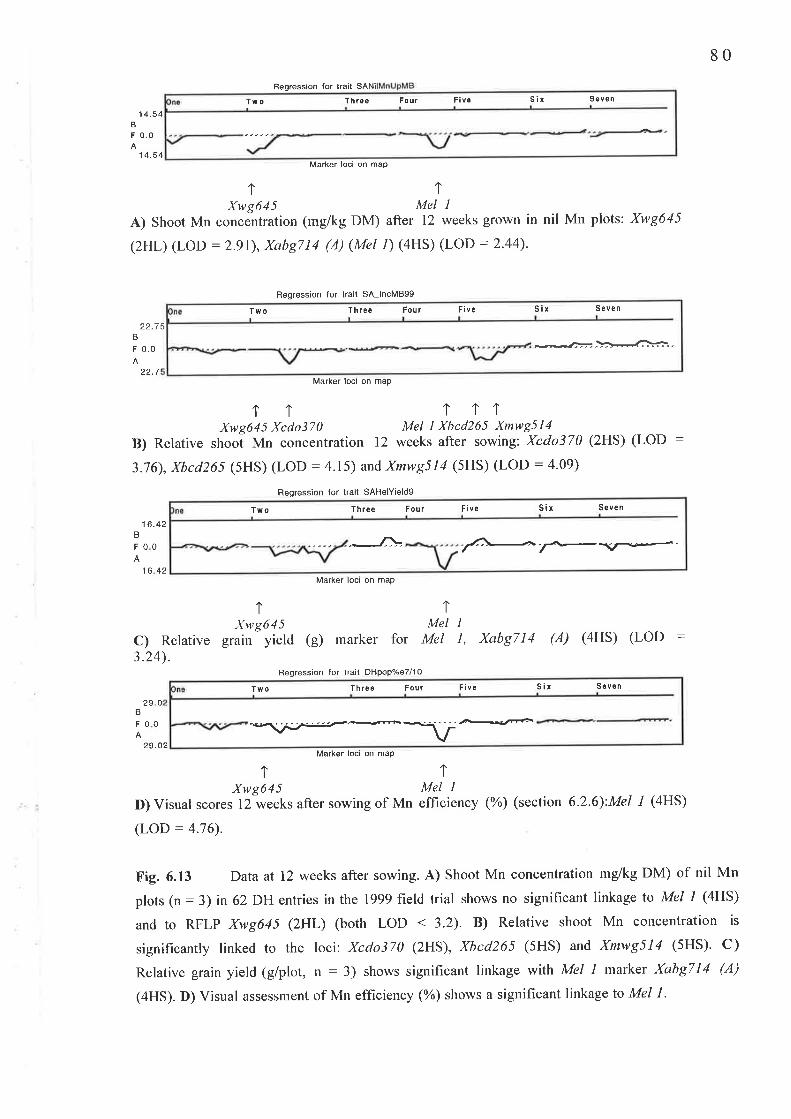
ThreeTwo SixFiv€Four Seven
80
14-54
0.0
14.54
B
F
Regress¡on for tra¡t SAN¡|
Marker loc¡ on map
Begression for trait SA-lncMBgg
11Xwg645 Mel l
A) Shoot Mn conceìtration (mgikg DM) after 12 weeks grown in nil Mn plots: Xwg645
(2HL) (LOD = 2.91), Xabg714 (A) (Mel1) (4HS) (LOD :2.44)'
Marker loci on map
1 1 111Xwg645 Xcdo370 Mel I Xbcd265 Xmwg514
B) Relative shooi Mn concentration 12 weeks after sowing: Xcdo370 (2HS) (LOD :
3.76), Xbcd2ó5 (sHS) (LOD : 4.ls) and Xmwg514 (5HS) (LOD : 4.09)
Regress¡on for trait SARelYieldg
Two Three Fou r F ive Six Seven
---A'
Marker loci on map
22.75
29.O2
B
F 0.0A
22.7
16.42B
F00
16 42
290B
F00
1Xw964 5
C) Relative grain yield (g) marker3.24).
Xabg714 (A) (4HS) (LoD
1Mel l
for Mel I,
Bêgression for tra¡t DHpop%e7l10
p
11Xwg645 Mel I
D) Visual scores l2 weeks after sowing of Mn efficiency (%) (section 6.2.6):Mel 1 (4HS)
(LOD :4.76).
Fig. 6.13 Dataat 12 weeks after sowing. A) Shoot Mn concentration mg/kg DM) of nil Mn
plots (n : 3) in 62 DH entries in the 1999 field trial shows no significant linkage to Mel 1 (4HS)
and to RFLP Xwg645 (2HL) (both LOD < 3.2). B) Relative shoot Mn concentration is
significantly linked to the loci: Xcdo370 (zHS), Xbcd265 (5HS) and Xmwg514 (5HS)' C)
Refative grain yield (giplot, n :3) shows significant linkage with Mel 1 marker Xabg714 (A)
(4HS). D) Visual assessment of Mn efficiency (%) shows a significant linkage to Mel l -
ThreeTwo SirFou r SevenFive
Two S¡xThres SevenFiveFour
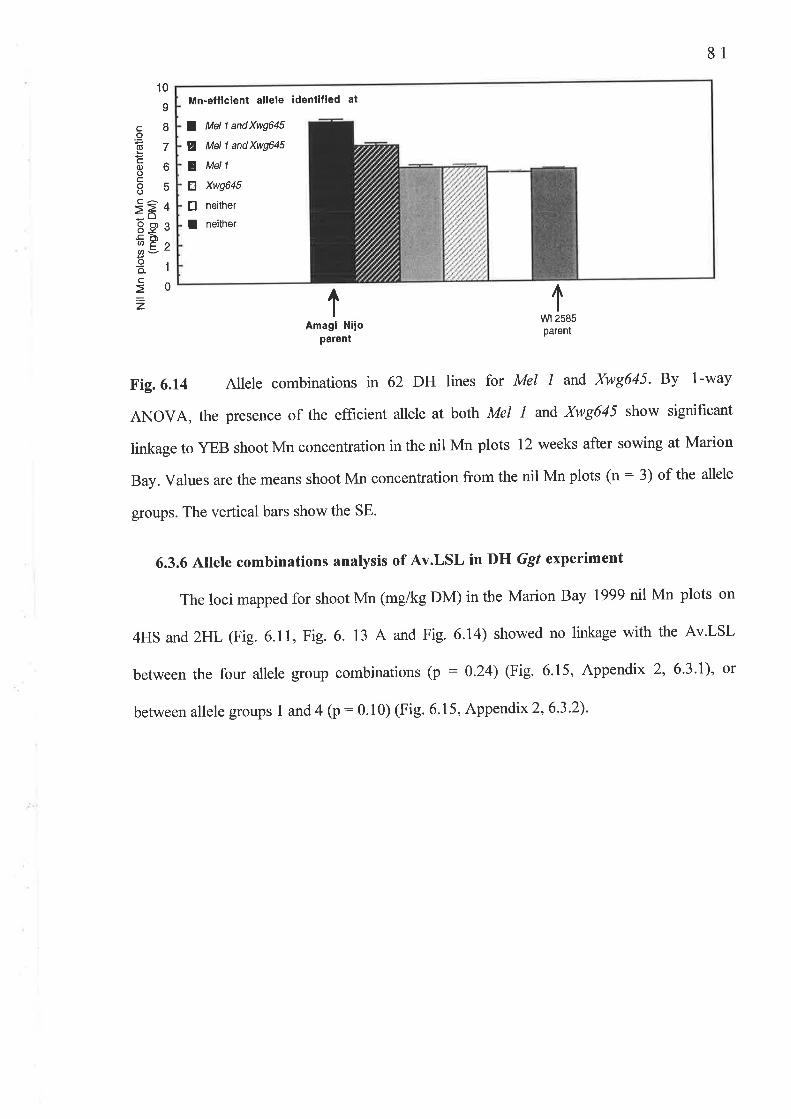
Mn-eflicient allele identified at
I Mel 1 andXwg645
E Mell andXwg645
âMel 1
$ Xwg645
E neither
I neither
81
10
IcBos/-cob()
g55s ¿:o89 3
'rÐ oøÐ'å1So=z I
Amagi Niioparent
Iwl 2585parent
Fig.6.l4 Allele combinations in 62 DH lines for Mel I and Xwg645. By l-way
ANOVA, the presence of the efficient allele at both Met 1 and Xwg645 show significant
linkage to YEB shoot Mn concentration in the nil Mn plots 12 weeks after sowing at Marion
Bay. Values are the means shoot Mn concentration from the nil Mn plots (n : 3) of the allele
groups. The vertical bars show the SE.
6.3.6 Allele combinations analysis of Av.LSL in DH Ggl experiment
The loci mapped for shoot Mn (mg/kg DM) in the Marion Bay 1999 nil Mn plots on
4HS and2HL (Fig. 6.11, Fig. 6. 13 A and Fig. 6.14) showed no linkage with the Av.LSL
between the four allele group combinations (p : 0.24) (Fig. 6.15, Appendix 2, 6'3'l)' or
between allele groups I and 4 (p:0.10) (Fig. 6.15, Appendix2,6'3'2)'
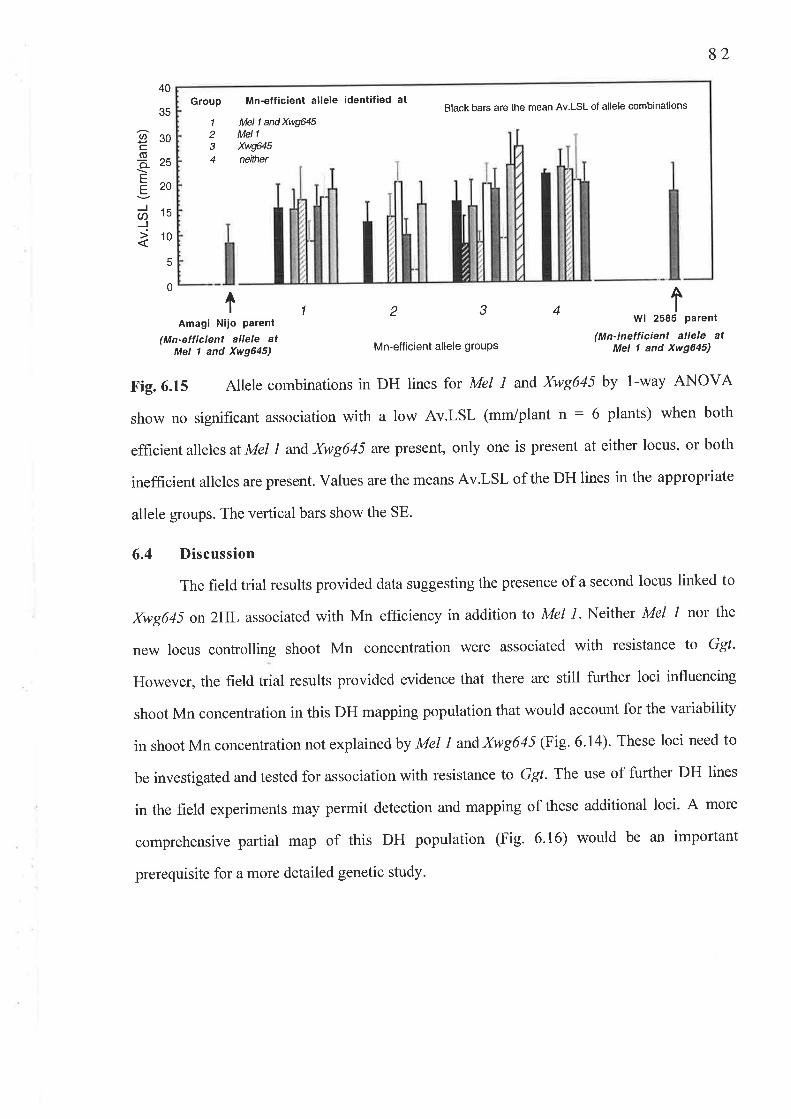
40
35
9soc(5
-o- 25cE20ã'uJ
ì105
0
Group Mn-efficient allele ident¡fied at Brack bars are the mean Av.LSL of ailele combinations
Mel 1 andXwgA4SMel 1
XwgdSneither
1
234
82
IWl 2585 parent
(Mn-inellicient allele atMel I and Xwg645)
IAmagi Nijo Parent
(Mn-eÍÍicient allele atMel 1 and Xwg645)
1 2 3 4
Mn-eff icient allele grouPs
Fig.6.15 Allele combinations in DH lines for Met I and Xwg645 by l-way ANOVA
show no significant association with a low Av.LSL (mm/plant n : 6 plants) when both
efficient alleles af Mel I and Xwg645 are present, only one is present at either locus, or both
inefficient alleles are present. Values are the means Av.LSL of the DH lines in the appropriate
allele groups. The vertical bars show the SE.
6.4 Discussion
The field trial results provided data suggesting the presence of a second locus linked to
Xwg645 on2HL associatedwith Mn efhciency inaddition fo Mel l.Neither Mel I nor the
new locus controlling shoot Mn concentration were associated with resistance to Ggt.
However, the field trial results provided evidence that there are still further loci influencing
shoot Mn concentration in this DH mapping population that would account for the variability
in shoot Mn concentration not explained by Mel I andXwg645 (Fig. 6.14). These loci need to
be investigated and tested for association with resistance to Ggt. The use of further DH lines
in the field experiments may permit detection and mapping of these additional loci. A more
comprehensive partial map of this DH population (Fig. 6.16) would be an important
prerequisite for a more detailed genetic study.

83
xabg590.4
2.9
2.3
50.0
5.9
4.2
2.6
6.7
26.6
3.0
14.4
0.5
0.0'L0
3.6
8.7
8.1
2.8
10.0
4.9
1.8
1.6
9.7
1.8
6.1
12.5
18.7
50.0
14.0
0.4
1.3
23.7
1.0
0.8
5.4
9.1
6.0
16.7
1.2
20.4
(a)
(b)
0(2)
52(2)
xbcd453(b)
xcdo580
160
unknown
105(b)
xabg55xwg241
xabg7l 4(a)
xmwg77
xmne-1(a)
175
4(c)
OB
xksua3(2)
xabgS
xcdo370
74
xbcd339(c)
xwg645
123
67(b)
xmwg820
xabc152(3)
xamyl
154
xwg622(b)
xmwg897
xabc?10(1)
)
'tH
718
xcdol 13
xbcd263(a)
110
105(a)
xbcd129
152(1)
xcdo?SB
xbcd263(b)
117
xabg497(1)
xmne-l(c)
4(b)
xcdo347
7.9
1.2
4.4
16.2
0.0
5.4
0.0
0.0
11.5
17.6
5.5
4.0
5.0
50.0
1.3
0.9
0.9
5.8
0.4
18.6
19.4
5.8
1.3
13.6
17.5
6.7
7.7
18.2
11.5
7.1
10.9
1.1
3.4
20.7
18.0
1.0
0.4
18.5
6.4
4.3
2.4
2.3
10.0
9.9
3.4
3H
)
2H
7
4H
xcdo989
xabc302
1)
14
xbcd808(2)
xbcd265(a)6H
7H
5H
Fig.6.16 RFLP partial map of WI 2585 x Amagi Nijo DH population using RFLP
markers to identifi 92 polymorphic loci between WI 2585 and Amagi Nijo on DNA extracted
from 140 DH lines of this cross (constructed by McCasland-Pexton, A. and Pallotta, M.).
84
6.4.1 RFLP partial map of 140 DH lines
The partial map was constructed by McCasland-Pexton, A. and Pallotta, M., using the
140 DH lines screened in the 1999 Marion Bay field trial (Fig. 6.16). The RFLP markers were
used to identiff 92 polymorphic loci between parents Mn-inefficient V/I 2585 and Mn-
efficient Amagi Nijo shown photographed on the same day 12 weeks after sowing (Fig. 6.12)'
The DNA clones were selected to ensure full genome coverage and maximise the probability of
detection of linkage to the Mn efficiency trait (Darvasi and Soller, 1994). The aim was to
identiff markers at amaximum of 30 cM spacing based on a consensus linkage map (Heun e/
al., 1991, Lui and Tsunewaki, lgg|, Gale et al., 1995 and Langtidge et al', 1995)' Most of
these 92 RFLP marker loci (Appendix 3, 3.2) were ordered at an exclusion LOD of > 3.0.
There were few sustained deviations from the expected segregation ratios over adjacent
marker loci. However, there were regions of the genome where gaps between markers of more
than 50 cM were found (Fig. 6.16). The addition of more markers to this partial map
particularly in the regions where these large gaps occur, may allow the identification of further
Mn loci in addition to Mel I andXwg645.
6.4.2Loci contributing to Mn efficiency and linkage with resistance to Ggt
If it were possible to identify further loci that significantly influence Mn efficiency,
analysis of DH lines infected with Ggt may yet reveal that Mn-eff,rcient alleles are predictive
of a short Av.LSL and greater resistance to Ggt. In addition, increasing the shoot Mn
concentrations from those obtained, (7.3-20.6 mg MrVkg DM), may give results that show
linkage of Mn-efhcient alleles with resistance to Ggt. However, two loci controlling Mn
efficiency have now been identified and mapped. Together, these loci account for the major
portion of the genetic control of Mn efficiency. For further analysis of plants with a higher
shoot Mn concentration infected with Ggt, an experimental method needs to be developed
that produces data that is as free as possible of the confounding factor of a healtþ plant
vigour increasing resistance to pathogens rather than the expression of Mn-efficient alleles. If
loci linked to resistanc e to Ggt are to be mapped , Ggt infection data for at least 60 DH lines
with similar shoot critical Mn concentration, and similar shoot and root size and growth habit,
would be necessary.
85
Chapter 7 I)iscussion
7.1 Introduction
Cook (lgg4) reported that there are no known wheat genotypes which are resistant to
Ggl. Wheat genotypes with increased Mn efficiency when growTl in soil deficient in plant
available Mn were found to have less Ggf infection compared to Mn-inefficient genotypes
(Wilhelrn et ql., 1990). This result suggested the hypothesis that Mn efficiency in wheat
increases resistance to Ggl uncler Mn-deficient conditions. Barley is a diploid crop species in
which traits such as Mn efficiency are more simply inherited than in hexaploid wheat. While
Ggtisof lesssignificance to the barley crop than to wheat, barley was used inphysiological
and genetic studies to investigate if Mn efficiency in barley increases resistance to Ggt. There
was no genetic linkage between enhanced resistance to Ggt in barley and the presence of
manganese efficiency alleles at two loci on chromosomes 4HS and2HL.
7.1.1 The physiological and genetic experiments
When grown in Mn deficient soil, the Mn-efficient Amagi Nijo was found to have a
reduced Av.LSL compared to the Mn in-efficient WI 2585. But the susceptibility of WI 2585
to Ggt was not reduced by the elimination of Mn stress. Further, Amagi Nijo showed a Mn-
independent resistance to Ggt. An investigation of the genetics of Mn efficiency in a DH
population generated from a cross between these two parent genotypes found no linkage
between Av.LSL and the known locus for Mn efficiency, Mel / located on chromosome 4HS.
Finally, a field experiment using this DH population suggested the presence of another locus
controlling shoot, Mn concentration on chromosome 2HL linked to RFLP marker Xwg645,
that when taken together with Mel1, also showed no linkage with Av.LSL and resistance to
Ggl. Therefore, using both physiological and genetic studies, this research has found no
connection between resistance to Ggt and the expression of Mn efhciency linked to two loci
on 4HS and2]ftL when barley is grown within the range of shoot Mn concentrations (7.3-20'6

86
mgkg DM) studied. Loci associated with resistance to Ggt may or may not be Mn-
independent. However, Ggt infection data on at least 60 DH lines, all with similar shoot
critical Mn concentration, and similar shoot and root size and growth habit, would be
necessary for a valid result.
7.2 Future research directions
'Wheat, being generally more susceptible to Mn deficiency than barley (Graham et al.,
19g3; Marcar, 1986), could be used in further pot bioassays and field trials with Ggl infection
to check both the physiological and genetic results obtained with barley. Wheat genotypes
should be chosen in which molecular markers have been identified for the trait of Mn
efficiency. The shoot Mn concentrations investigated in the pot bioassays could be increased
from between 7 to 50 mg Mnlkg DM. However, experiments such as these involving high
levels of Mn added to the soil, need to determine that Mn efficiency is still expressed at these
high Mn soil additions. If high shoot Mn concentrations are obtained, an experimental method
needs to be developed that eliminates the confounding factor of enhanced plant vigour
increasing resistance to Ggt,rather than the expression of Mn-efficient alleles. In addition, the
experiments with wheat should investigate if high root Mn concentration increases the
Av.LSL the same as it may have in barley (see section 4.4.1).If both physiological and genetic
studies in Ggt infected Mn-inefficient and Mn-efficient wheat genotypes also show no
association between Mn efhciency alleles and resistancero Ggt, other altematives are available
to minimise the crop losses resulting ftom Ggt infection.
7.2.1 Field solutions
In a field trial at a site not regarded as Mn deficient, the addition of 7.2 kg/ha Mn
fertiliser compared to 0 Mn added resulted in the Ggr infected wheat having an increased yield
over nil Mn, an effect not shown in the absence of Ggt (Webb and Graham, 1990). The tissue
Mn concentrations for plants in all treatments ranged from 30-37 mg/kg DM, which is supra-
optimal in Mn compared to the critical Mn concentration determined previously (Reuter,
87
1936). The critical Mn concentration in Ggt infected wheat plants may be higher in wheat
plants not infected with Ggl. This result suggests that if supra-optimal levels of Mn fertiliser
can be added to crops the loss in yield due to infection by Ggt may be minimised'
7.2.2 Plant-pathogen interactions
Investigations of plant-pathogen interactions to date provide no clue as the nature of
the inhibition of growth of Ggt within the roots of Amagi Nijo observed in the temporal study
(chapter 4). Other research has revealed the release of an linoleate 8-dioxygenase protein of
unknown biological function from Gaeumannomyces graminis graminis (Su and Oliw' 1996),
the release of a compound of unknown biological function released by Gaeumqnnomyces
graminis var. tritici upon exposure to a plant defence phenolic substrate (Thornton et al',
lggT), and of the release of another protein similar to a plant chemical defence enzyme
lipoxygenase that contains Mn, "Mn-LO", which also has an unknown biological function (Su
and Oliw, l99S). The ambiguity of the source and biological function of the compounds
released in these plant-pathogen interactions in this research provides no justifiable research
direction for investigation into the apparent inhibition of the growth of G$ within the root of
Amagi Nijo (chapter 4). Hence, there is no known starting clue to the nature of the
hypothesised biochemical mechanism in Amagi Nijo which inhibits the growth of Ggt through
the stele of the root after 2l days post inoculation with Ggt'
7 .2.3'l r ansform ation of plant bio chemical defence mechanisms
Other avenues of research may have potential for greater success. Avenacin A-1'
which is biosynthesised constitutively in the epidermal cells in the roots of oat plants is toxic
to Ggt.Thus, oats are resistant to Ggt (Osbourn et al., 1994). Avenacin is present in the roots
of barley and wheat in only minute amounts, so Ggl is able to invade the roots (Bovtyer et al',
1995). Isolates of Gaeumannomyces graminis var. avenae (Gga) produce an eîzyme,
avenacinase, which deglucosylates avenacin to a less toxic form, which enables Gga to invade
88
the roots of oats (Osbourn et al., l99l; Bowyer et al., 1995). However, isolates of Ggt have a
hundredtimeslessavenacinasecomparedtoisolates of Gga(Osbourn etal.,l991).
The transformation into barley and wheat of the gene in oats which encodes for the
biosynthesis of avenacin A-1 has the potential to result in total resistance to Ggt. In addition,
plate tests where high concentrations of avenacin A-1 have been included in the agar have
inhibited the growth of isolates of Gga(Osbourn, et a\.,1991). Hence, the biosynthesis in the
roots of barley andwheatof avenacin A-1 could give these crops total resistance to Ggt, and
moderate resistance Io Gga.
Future work will refine methods for the production of doubled haploids from a cross
between diploid oat species. An outdoor screen with Ggr could be done on a doubled haploid
population derived from a cross between a diploid oat species, Avena longiglumis, which
lacks avenacin, and so is susceptible to Ggt infection, and an avenacin A-1 constitutively
synthesising diploid oat species such as Avena strigosa, which is resistant to Ggt.
The infection data could be used to select DH lines for a bulked segregant analysis on
DNA extracted from high Ggt infection or little to no Ggt infection DH lines. AFLP primer
pairs may detect AFLP polymorphic bands segregating for resistance to Ggt (and moderate
resistance to Gga). The AFLP polymorphic band, which is likely to include the DNA
sequence for the biosynthesis of avenacin A-1, could be cut from the gel, cloned and
sequenced. Then, the sequence containing the gene for biosynthesis of avenacin A-1 may be
transformed into wheat and barley, and tested for the biosynthesis of avenacin A-1 giving
wheat and barley which is resistant to Ggt and has moderate resistance to Gga.
The future use of the modern biotechnology strategies, such as transformation of the
avenacin A-l gene into barley and wheat cultivars, has the potential to give more resistance to
Ggt thanthe use of molecular makers for the Mn eff,rciency loci investigated in this thesis.
However, the pyramiding of Mn-efficient alleles at Mel I and Xwg645 on chromosomes 4HS

89
aîdzqLrespectively into elite barley and wheat cultivars using breeding strategies now rn use
may give greater yields and additional economic benefit to the Australian cereal industry.
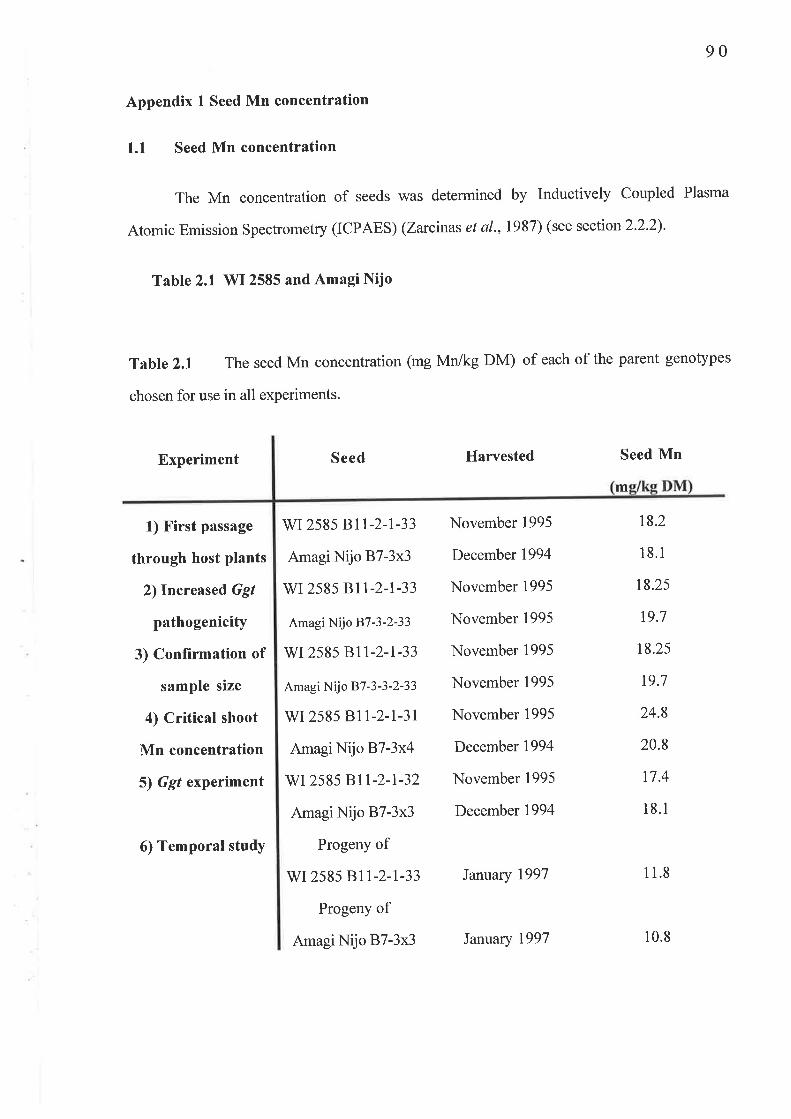
90
Appendix I Seed Mn concentration
1.1 Seed Mn concentration
The Mn concentration of seeds was determined by Inductively Coupled Plasma
Atomic Emission Spectrometry (ICPAES) (Zarcinas et ø1.,1957) (see section 2.2.2).
Table 2.1 WI2585 and Amagi Nijo
Table 2.1 The seed Mn concentration (mg Mnikg DM) of each of the parent genotypes
chosen for use in all experiments.
Experiment Seed Harvested Seed Mn
m
1) First passage
through host plants
2) Increased Ggt
pathogenicity
3) Confirmation of
sample size
4) Critical shoot
Mn concentration
5) Ggt experiment
6) Temporal study
v/r 258s 811-2-l-33
AmagiNijo B7-3x3
wI2585 Bll-2-I-33
AmagiNijo B7-3-2-33
v/I2585 BII-2-I-33
Amagi Nijo B7-3-3-2-33
wI2585 811-2-1-31
AmagiNijo B7-3x4
v/r 2585 Bll-2-l-32
AmagiNijo B7-3x3
Progeny of
wr 2585 Bll-2-l-33
Progeny of
AmagiNijo B7-3x3
November 1995
December 1994
November 1995
November 1995
November 1995
November 1995
November 1995
December 1994
November 1995
December 1994
January 1997
18.2
18.1
t8.25
19.7
18.25
19.7
24.8
20.8
17.4
18.1
1 1.8
January 1997 10.8
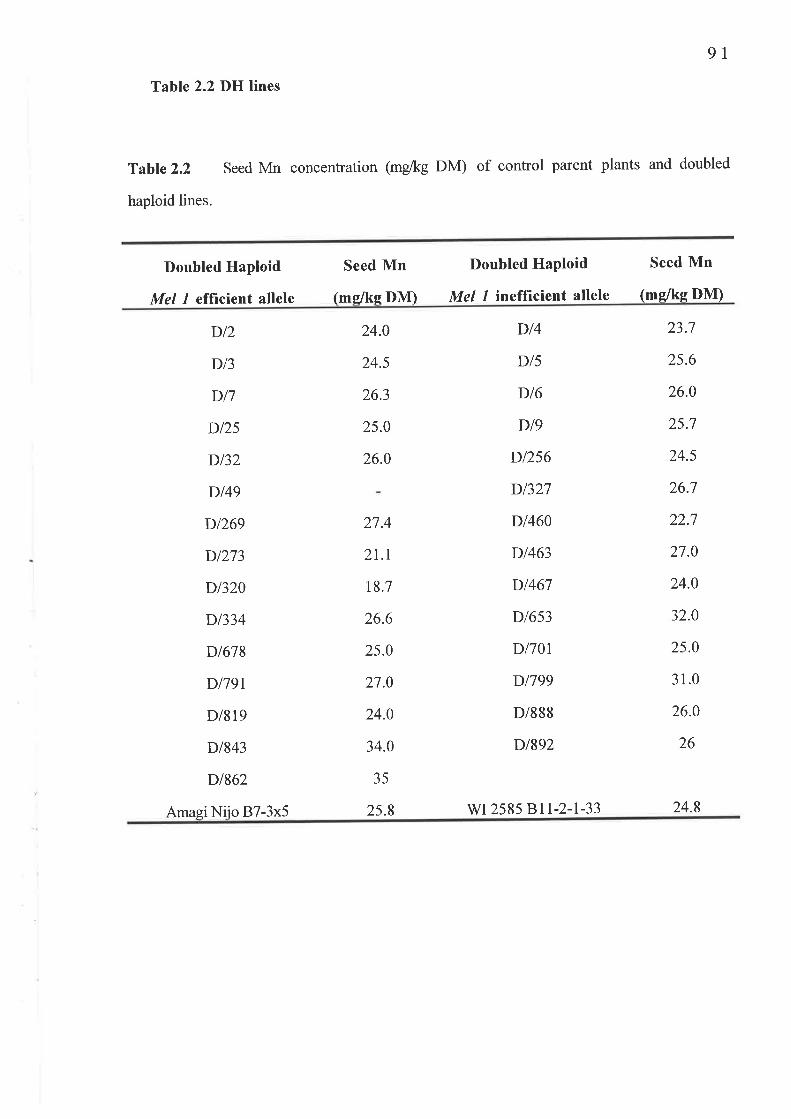
9lTable 2.2 DH lines
Table 2.2 Seed Mn concentration (mg/kg DM) of control parent plants and doubled
haploid lines.
Doubled Haploid Seed Mn
Mel I efficient allele (me/ke DM)
Doubled Haploid
Mel 1 ineffÏcient allele
Seed Mn
(me/ke DM)
D12
D13
D17
Dl2s
Dl32
Dl49
D1269
D1273
D1320
D1334
Dl678
D179T
D/819
D1843
D1862
AmaeiNiio B7-3x5
24.0
24.5
26.3
25.0
26.0
Dl4
Dl5
Dl6
D19
D1256
D1327
D1460
D1463
D1467
D1653
D170t
D1799
D/888
D1892
wr 258s BII-2-I-33
23.7
25.6
26.0
25.7
24.5
26.t
22.7
27.0
24.0
32.0
25.0
31.0
26.0
26
24.8
21.4
2I.l
18.7
26.6
25.0
27.0
24.0
34.0
35
25.8
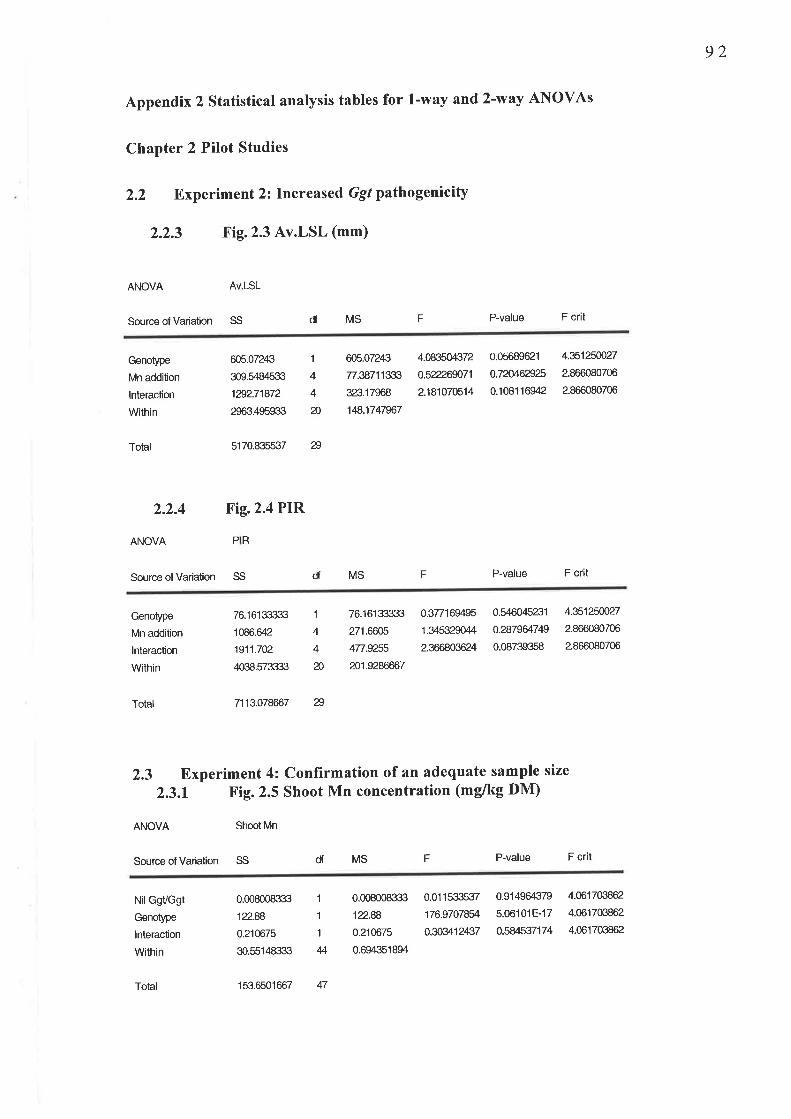
92
Appendix 2 statistical analysis tables for l-way and 2-way ANOVAs
Chapter 2 Pilot Studies
2.2 Experiment 2: Increased Ggl pathogenicity
2.2.3 Fig.2.3 Av.LSL (mm)
ANOVA Av.LSL
Source of Variation SS df MS F P-value F crit
Genotype
Mn addition
lnteraction
Within
Total
ANOVA
Source of Variation SS
5170.835537 æ
2.2.4 Fig.2.4 PIR
605.07243
309.5484533
1æ2.71872
2963.495933
æ5.07243
2.38711333
3æ.17968
1ß.1747%7
4.083504372
0.52226w71
218107É14
0.05689621
o.7æ46?925
0.1081 16942
4.3512ffi27
2.866080706
2.866080706
1
4
4
n
PB
df MS F P-value F crit
Genotype
Mn addition
lnteraction
Within
Total
76.16133333
1086.642
1911.702
4038.573333
7113.078667 æ
Shoot Mn
76.16133333
271.6605
477.92ffi
201.9286667
0.32169495
1.345Ê,2n44
2.366803624
0.5460,15æ1
0.2879æ749
0.08739358
4.35125ú27
2.866080706
2.866080706
1
4
4
n
2.3 Experiment 4: Confirmation of an adequate sample size
2.3.1 Fig. 2.5 Shoot Mn concentration (mg/kg DM)
ANOVA
Source of Variation SS df MS F P-value F crit
NilGgVGgt
Genotype
lnteraction
Within
0.008008333
12-88
0.210675
30.5514833rÍl
0.008008333
12.æ0.210675
0.694351894
0.01 1533537
176.97078.5r'.
0.3f,3412437
0.914Í)&1379
5.06101E-17
0.584æ7174
4.061703862
4.061700862
4.061703862
1
1
1
4
Total 153.6501667 47

93
2.3.2 Table 2.3 Shoot Mn content (pg/pot)
Mn contentANOVA
Source of Variation SS df MS F P-value F crit
NilGgVGgt
Genoçe
lnteraction
Within
0.¿18120075
70.0495041
0.16732408
16.91116æ
87.6091913 47
0.481æ075
70.0495041
0.16732408
0.3843r¿146
0.26924169
3.0003E-17
0.51281496
4.06170386
4.06170386
4.06170386
44
Total
2.3.3 Tablc 2.4 Shoot DM (g/Pot)
ANOVA ShootDM
Source of Variation SS df MS F P-value F cr¡t
NilGgVGgt
Genotype
lnteraction
Within
Total
0.00684019
oj5743752
0.ffi24752
0.15045325
0.00684019
0.15743752
0.0nn,24752
0.003419æ
F
0.1ææ424
2.3598E-08
0.7æ14959
4.06170386
4.06170386
4.06170386
1
1
1
M
ANOVA
0.31497&18 47
2.3.4 Table 2.4 Root DM (g/Pot)
Root DM
Source of Varìation SS df MS P-value F crit
NilGgVGgt
Genotype
lnteraction
Within
Total
0.0103&108
o.nzloÆ0.00232408
0.10719167
0.39200392 47
0.01038408
0.27210408
0.00232,108
0.00243617
4.2624551
111 .693194.
0.95398896
0.05488863
1.18't E-13
0.33404576
4.06170386
4.06170386
4.06170386
4
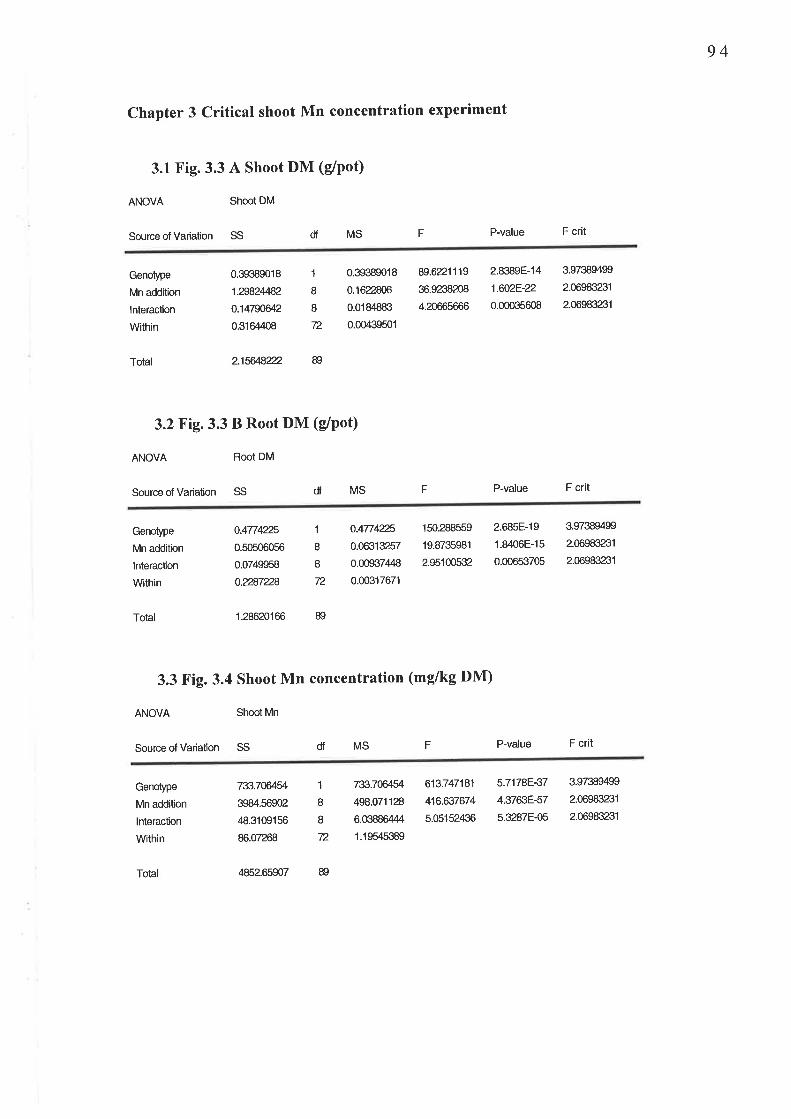
94
Chapter 3 Critical shoot Mn concentration experiment
3.1 Fig. 3.3 A Shoot DM (g/Pot)
ANOVA Shoot DM
Source of Variation SS df MS F P-value F crit
Genoþe
Mn addition
lnteraction
Within
Total
ANOVA
Source of Variation SS
2.1ffi2zz æ
3.2 Fig. 3.3 B Root DM (g/Pot)
Root DM
0.39389018
1.æ824Æ2
o.1479nÆ/.2
0.3164408
0.39389018
0.1622806
0.0184883
0.00439501
89.6221 1 19
36.9æ8æ8
4.æ665666
F
2.8389E-14
1.6028-22
0.00035608
3.97389499
2.06983æ1
2.06983231
1
II72
df MS P-value F crit
Genotype
Mn addition
lnteraction
Within
Total
ANOVA
0.477425
0.50506056
0.0749958
0.28728
Shoot Mn
0.477425
0.06313257
0.00S37,M8
0.00317671
150.288559
19.8735981
2.951005æ
2.685E-19
1.8406E-15
0.00653705
3.97389499
2.06983æ1
2.06983æ1
1
II72
1.286æ166 æ
3.3 Fig. 3.4 Shoot Mn concentration (mg/kg DM)
Source of Variation SS df MS F P-value F crit
Genotype
Mn addition
lnteraction
Within
Total
73370il5r'.
3984.56902
,18.3109156
86.07268
,852.65907 æ
7æ.7cÆ45/.
498.071128
6.09886444
1.1 9545389
613.747181
416.637674
5.05152436
5.71788-37
4.37638-57
5.3287E-05
3.97389499
2.06983æ1
2.06983231
1
8
B
72
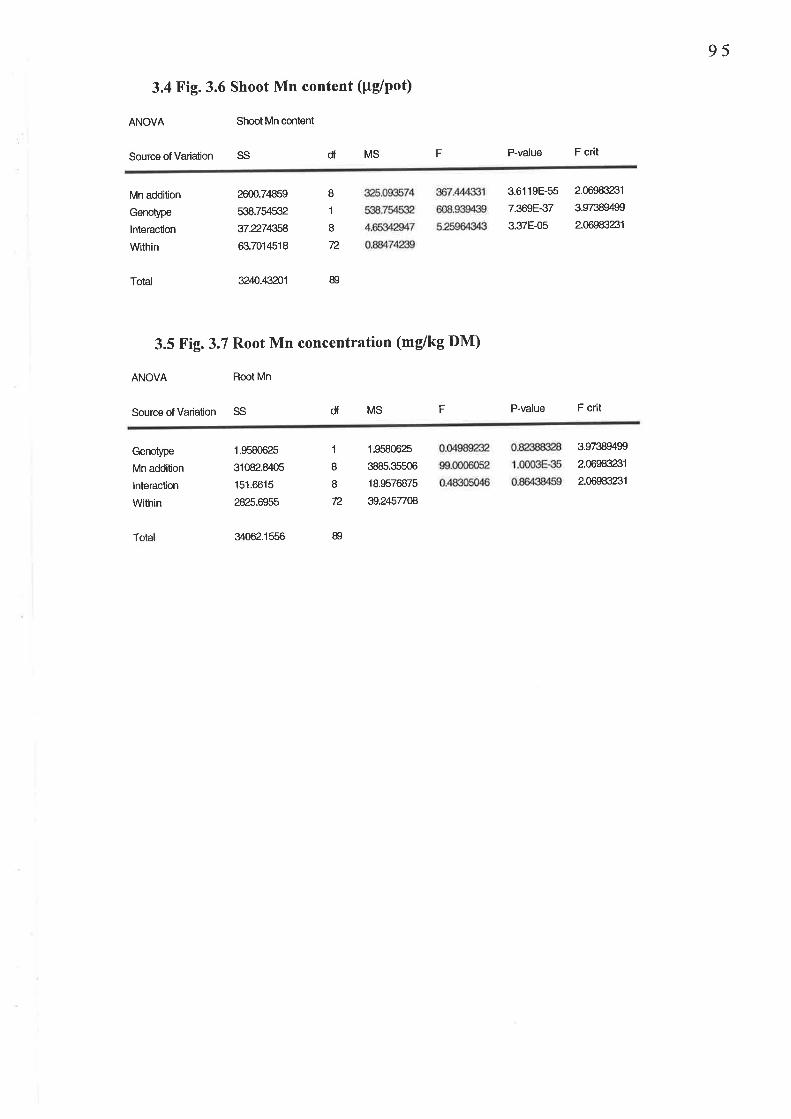
95
3.4 Fig. 3.6 Shoot Mn content (pg/pot)
Shoot Mn contentANOVA
Source of Variation SS df MS F P-value F crit
Mn addition
Genotype
lnteraclion
Within
Total
ANOVA
2600.7,1859
538.754532
37.2743æ
63.701¿1518
32Æ.43?01
Root Mn
F
3.6119E-55
7.369E-37
3.37E-05
2.06983æ1
3.97389499
2.06983æ1
8
1
IT2
89
3.5 Fig. 3.7 Root Mn concentration (mg/kg DM)
Source of Variation SS df MS P-value F crit
Genotype
Mn add¡tion
lnteraction
Within
Total
1.9580625
31082.&105
151.6615
æ25.6955
34062.1556
1.9580625
3885.35506
18.9576875
39.24577æ
3.97389499
2.06983231
2.06983æ1
1
I8
72
æ
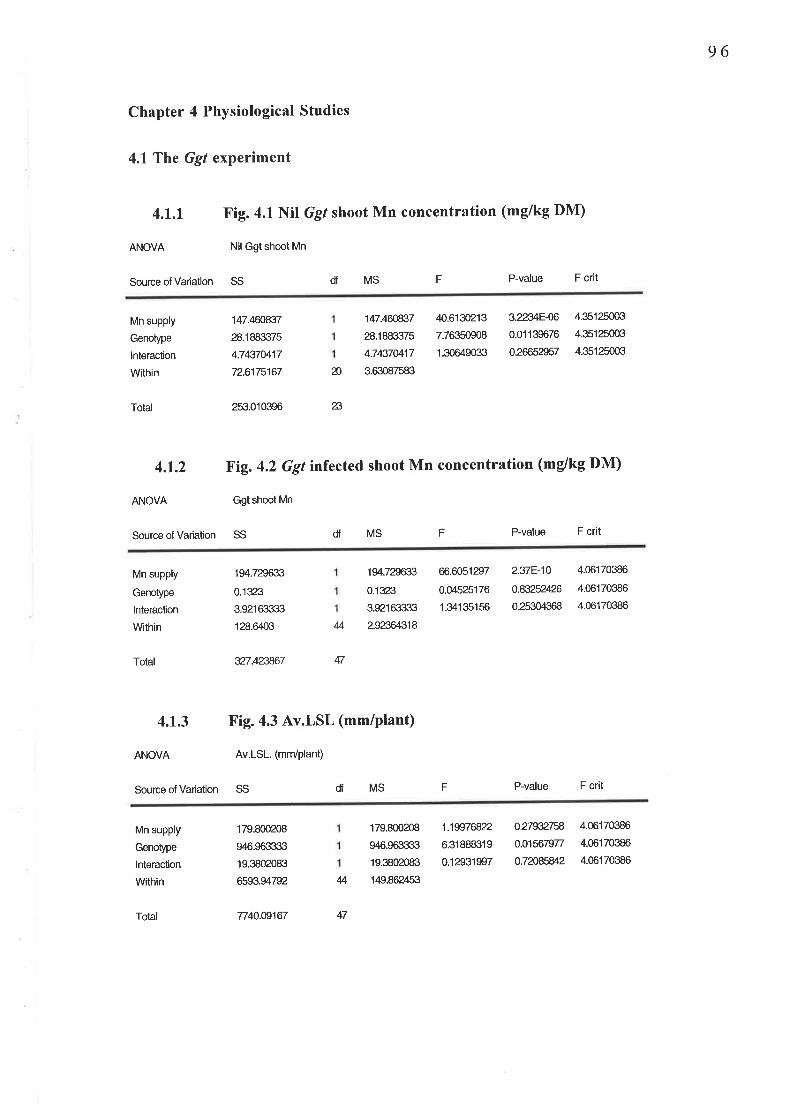
96
Chapter 4 Physiological Studies
4.1 The Ggl experiment
4.1.1 Fig. 4.1 Nil Ggf shoot Mn concentration (mg/kg DM)
ANOVA Nil Ggt shoot Mn
Source of Variatìon SS df MS F P-value F crit
Mn supply
Genotype
lnteraction
Within
Total
ANOVA
Source of Variation SS
147.4€n'837
28.1883375
4.74370417
72.6175167
2s3.010396 n
n
't47.4ñ837
28.1883375
4.7437U17
3.63087583
40.613û213
7.76350908
1.30649033
3229,8-06
0.01 1 39676
0.2665æ57
4.35125003
4.35125003
4.35125003
4.1.2 ßig. 4.2 Ggl infected shoot Mn concentration (mg/kg DM)
Ggt shoot Mn
df MS F P-value F crit
Mn supply
Genoþe
lnteraclion
Within
194.7æ633
0.1323
3.92163333
'128.&ttrl
194.729633
0.1323
3.92163333
2.gm31B
66.6051æ7
0.04525176
1.34135156
2.37É-10
o.æ252426
0.25304368
4.06170386
4.06170386
4.06170386
44
47Total 327.4n867
4.1.3 Fig.4.3 Av.LSL (mm/Plant)
ANOVA Av.LSL. (mrn/Plant)
Source of Variation SS df MS F P-value F crit
Mn supply
Genotype
lnteraction
Within
179.800æ8
946.963333
19.3802083
6593.94792
179.800208
946.963333
19.3802083
1¿19.862453
1jæ7æ2.
6.31888319
0.1æ31997
0.279327æ
0.01567977
o.7n8w2
4.06170386
4.06170386
4.06170386
44
47Total 7740.æ167
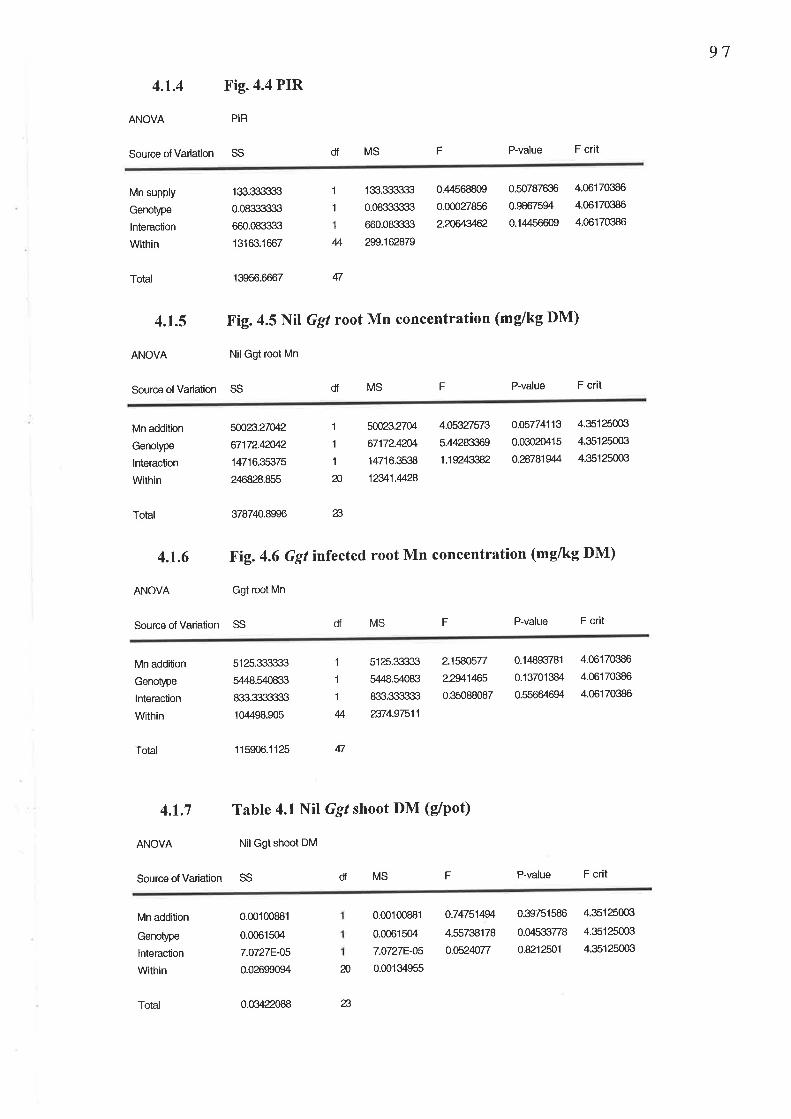
97
4.1.4 Fig.4.4 PIR
ANOVA PIB
Source of Variation SS df MS F P-value F crit
Mn supply
Genotype
lnteraction
Within
133.333333
0.08333333
660.083333
13163.1667
133.333333
0.08333333
660.083333
299.162879
0.4456880S
0.00027856
2.20æ.]/6,2
F
0.50787636
0.9867594
0.14456609
4.06170386
4.06170386
4.06170386
1
1
1
4
Total
ANOVA
Source of Variation SS
13956.6667 47
4.1.5 Fig. 4.5 Nil Ggl root Mn concentration (mg/kg DM)
Nil Ggt root Mn
df MS P-value F crit
Mn addition
Genoþe
lnteraction
Within
ffil3.27M267172.4M2
14716.35375
246828.855
378740.8996 õ
1
1
1
scfJz].27M
67172.42f'4
14716.3538
12U1.4428
4.G5327573
5.,14283369
1j9243æ2
o.05n4113
0.03020415
o.287815M
4.35125003
4.35125003
4.35125003
n
Total
4.1.6
ANOVA
Source of Variation SS
Fig. 4.6 Ggl infected root Mn concentration (mg/kg DM)
Ggt root Mn
df MS F P-value F crit
Mn addition
Genotype
lnteraclion
Within
5125.333333
5448.540833
833.3333333
104498.905
512s.33333
5448.54083
833.333333
æ74.97511
2.1æú77
2.æ/.1ß5
0.35088087
0.14893781
0.13701384
0.55664694
4.06170386
4.06170386
4.06170386
1
1
1
M
47Total 1 15906.1 125
4.1.7 Table 4.1 Nil Ggf shoot DM (g/pot)
ANOVA Nil Ggtshoot DM
Source of Variation SS df MS F P-value F crit
Mn addition
Genotype
lnteraction
Within
0.00100881
0.0061504
7.0727E-05
0.02699094
0.00100881
0.0061504
7.0727E-05
0.00134955
0.7475149/.
4.55738178
0.0524077
0.39751586
0.045Í13778
0.8212501
4.35125000
4.35125003
4.35125003
n
Total 0.0s422088 n
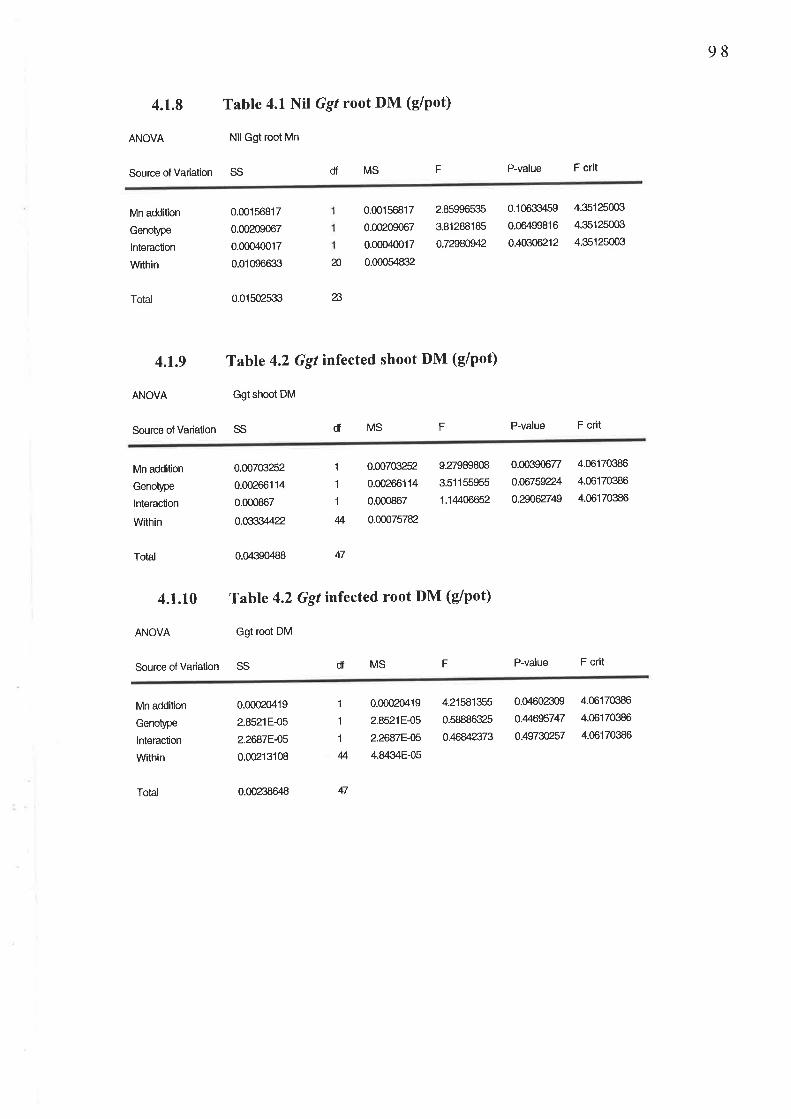
98
4.1.8 Table 4.1 Nil Ggt root DM (g/pot)
ANOVA Nil Ggt root Mn
Source of Variation SS df MS F P-value F crit
Mn addition
Genotype
lnteraction
Within
0.00156817
0.00209067
0.00040017
0.01096633
0.00156817
0.00209067
0.00040017
0.00054832
2.85996535
3.81288185
0.7æ8æ42
0.10633459
0.06499816
0.ß06212
4.35125003
4.35125003
4.35125003
Total
n
ß
4.1.9
ANOVA
Source of Variation SS
0.01502533
Table 4.2 Ggt infected shoot DM (g/pot)
Ggt shoot DM
df MS F P-value F crit
Mn addition
Genoþe
lnteraction
Within
0.æ703252
0.0û266114
0.000867
0.æ334422.
0.@703252
0.0û266114
0.000867
0.00075782
9.27989808
3.51155955
1.1M0€652
0.0039062
o.06759224
0.N62749
4.06170386
4.06170386
4.06170386
1
1
1
44
Total 0.043S0'lB8 47
4.1.10 Table 4.2 Ggt infected root DM (g/pot)
ANOVA Ggt root DM
Source of Variation SS df MS F P-value F crit
Mn addition
Genoþe
lnteracüon
Within
Total
0.00020419
2.852'l E-05
2.2æ78-O5
0.0û213108
0.0tæ8648
0.000æ419
2.8521E-05
2.2æ78-05
4.8434E-05
4.21581355
0.58886325
0.M%73
0.04602309
0.4Æ95747
o.497W257
4.06170386
4.06170386
4.06170386
1
1
1
4
47
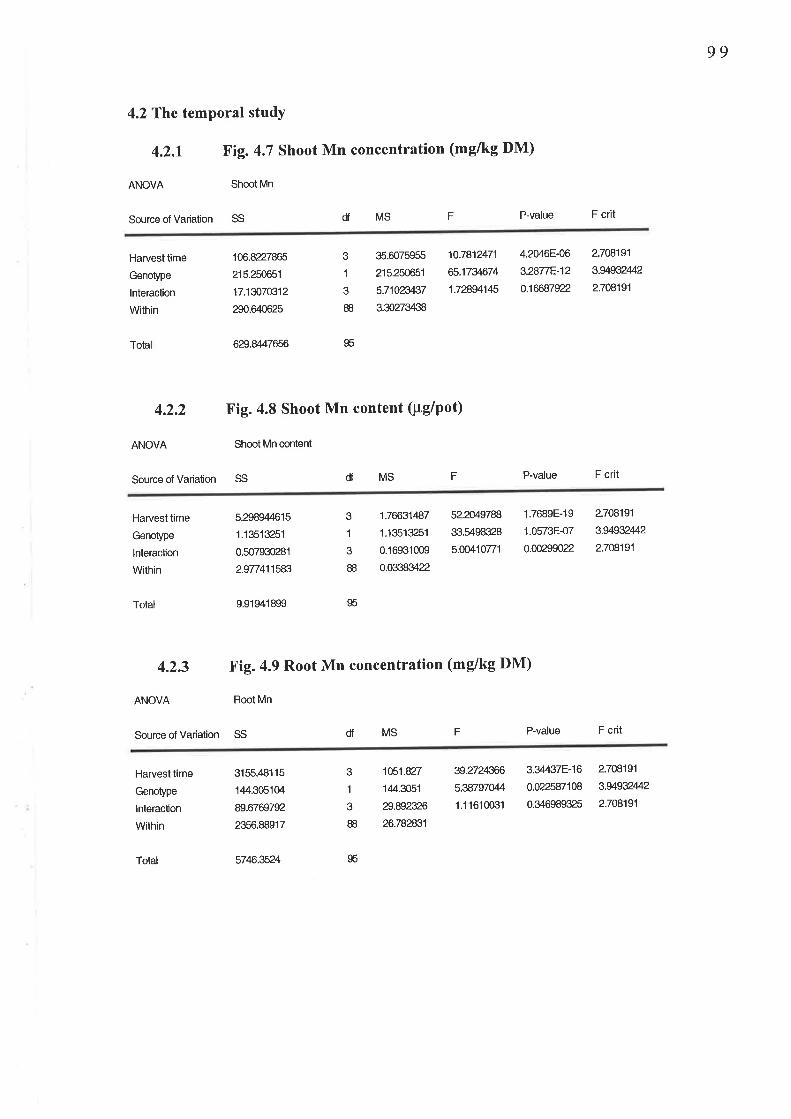
99
4.2The temporal study
4.2.1 Fig.4.7 Shoot Mn concentration (mg/kg DM)
ANOVA Shoot Mn
Source of Variation SS df MS F P-value F crit
Harvest time
Genoþe
lnteraction
Within
Total
ANOVA
Source of Variation SS
106.8227865
215.250651
171æ70312
æ0.640625
3
1
3
88
s
35.6075955
215.250651
5.710zu37
3.30273438
10.7812471
65j7ffi741.72894145
4.2046E-06
3.2877E-'12
0jæ87922.
2.708191
3.gI!932442
2.708191
6æ.8447656
4.2.2 Fig. 4.8 Shoot Mn content (pg/pot)
Shoot Mn content
df MS F P-value F crit
Harvest time
Genoþe
lnteraction
Within
Total
ANOVA
5.æ89¿14615
1.13513251
0.507930281
2.977411æ3
9.91941899
Root Mn
1.7ffi1487
1.1351æ51
0.1693100S
o.03æ92
52.n497æ
33.5498328
5.00410771
F
1.7689E-19
1.0573E-07
0.00299022
2.708191
3.94932442
2.708191
3
'l
3
88
95
4.2.3 Fig. 4.9 Root Mn concentration (mg/kg DM)
df MS P-value F critSource of Variation SS
Harvest time
Genotype
lnteraction
Within
3155.4tì1 15
1¿14.305104
89.6769792
2356.88917
57Æ.3524
1051.827
144.3051
æ.89æ26
26.782831
39.n24ffi5.æ797M4't.11610031
3.34437E-16
0.022587108
0.346989325
2.708191
3.gI!932M2
2]ß191
Total
3
1
3
88
95
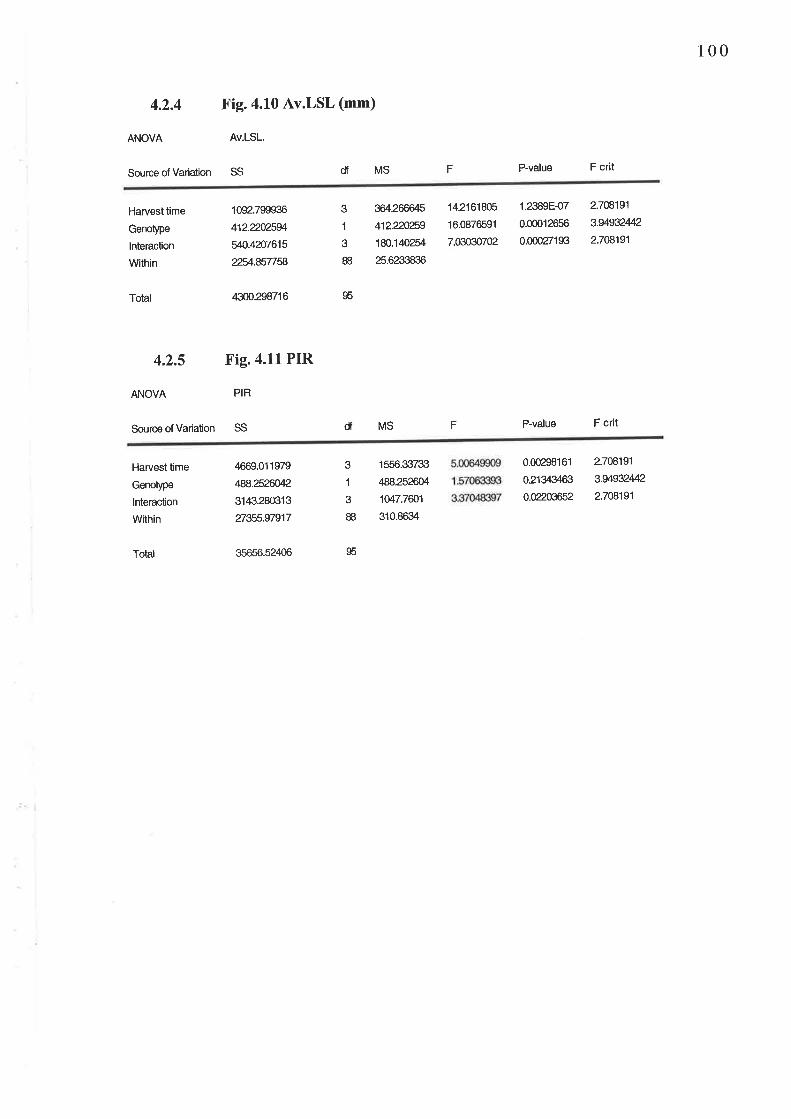
100
4.2.4 Fig.4.10 Av.LSL (mm)
Av.LSL.ANOVA
Source of Variation SS df MS F P-value F crit
Harvest time
Genotype
lnteraclion
Within
Total
ANOVA PIR
Source of Variation SS
,1300.æ8716
4.2.5 Fig.4.11PIR
1092.799936
412.2202591
w.42076'15
225/'.8577æ
364.266415
41222f/259
180.140254
25.6233836
14.2161805
16.0876591
7.0,3n,æ702
1.2389E-07
0.00012656
0.00027193
2.708191
3.U!932442
2.708191
3
1
3
88
95
df MS F P-value F crit
Harvest time
Genotype
lnteraction
Within
Total
4669.01 1979
488.25M23143.280013
n355.97917
35656.52,106
1556.33733
488.252fn/.
1U7.7æ1
310.8631
0.00298161
021343163
0.0203652
2.708191
3.9it93242
2.708191
3
1
3
8B
95
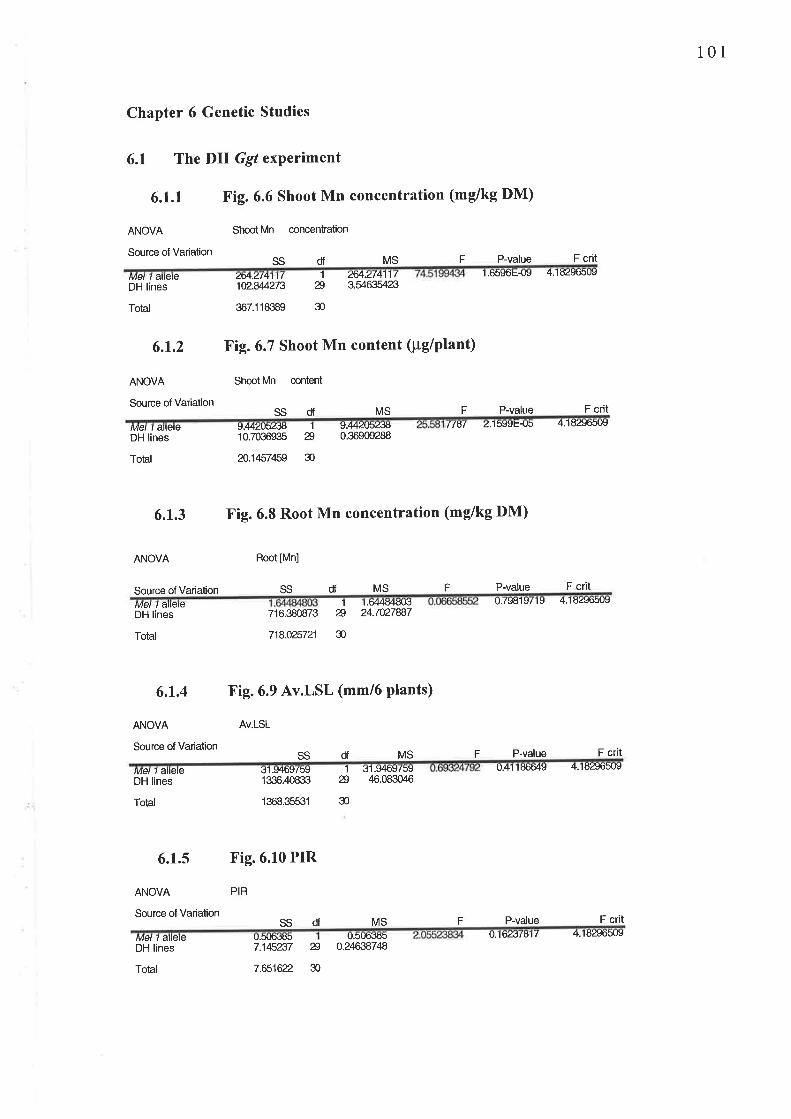
101
Chapter 6 Genetic Studies
6.1 The DH Ggl experiment
6.1.1 Fig. 6.6 Shoot Mn concentration (mg/kg DM)
ANOVA
Source of Variation
Shoot Mn concentration
SS df MS F P-value F crit
zæ.2/4111'tt2.u4273
'M.¿t411t3.546331æ
1
æ
30
1.öbgttts-ug 4.1829ti5u9Met 1 ate|eDH lines
Total
ANOVA
Source of Variation
367.1 18389
6.1.2 Fig.6.7 Shoot Mn content (pg/plant)
ShootMn content
dfSS MS F P-value F crit
Met 1 ate€DH lines
Total
ANOVA
9.44¿U5¿ö10.70369S5
9442íä:¿,Jö0.36909288
1
æTlAl 2.1599ts{J5 4.1829tt509
n.1457459 æ
6.1.3 Fig. 6.8 Root Mn concentration (mg/kg DM)
Root [Mn]
Source of Variation SS df MS F P-value F crit
1 1.ti44U4ð{JrJ u./9ulv/ r9 4.1UZttt5{J9Mel 1 a|eteDH lines
Total
ANOVA
Source of Variation
716.3tìr1873 æ 24.7027æ7
718.025721 æ
6.1.4 Fig.6.9 Av.LSL (mm/6 plants)
Av.LSL
SS MSdf F P-value F crit
3'1.94b9/591336.,10833
1 31.94ti9/59æ 46.083016
0.41'l uttti49 4.182t b5U9Met 1 aileÊDH lines
Total
ANOVA
Source of Variation
1368.35531 30
6.1.5 Fig.6.10 PIR
PR
dfSS MS P-value F crit
Mel l alleteDH lines
Total
u.5utÉtð5 Ll.SuttiJð50.2ßæ7487.145æ7 æ
7.651622. 30
Fu.1ttzJtó1t 4.1öZt tt5(J9
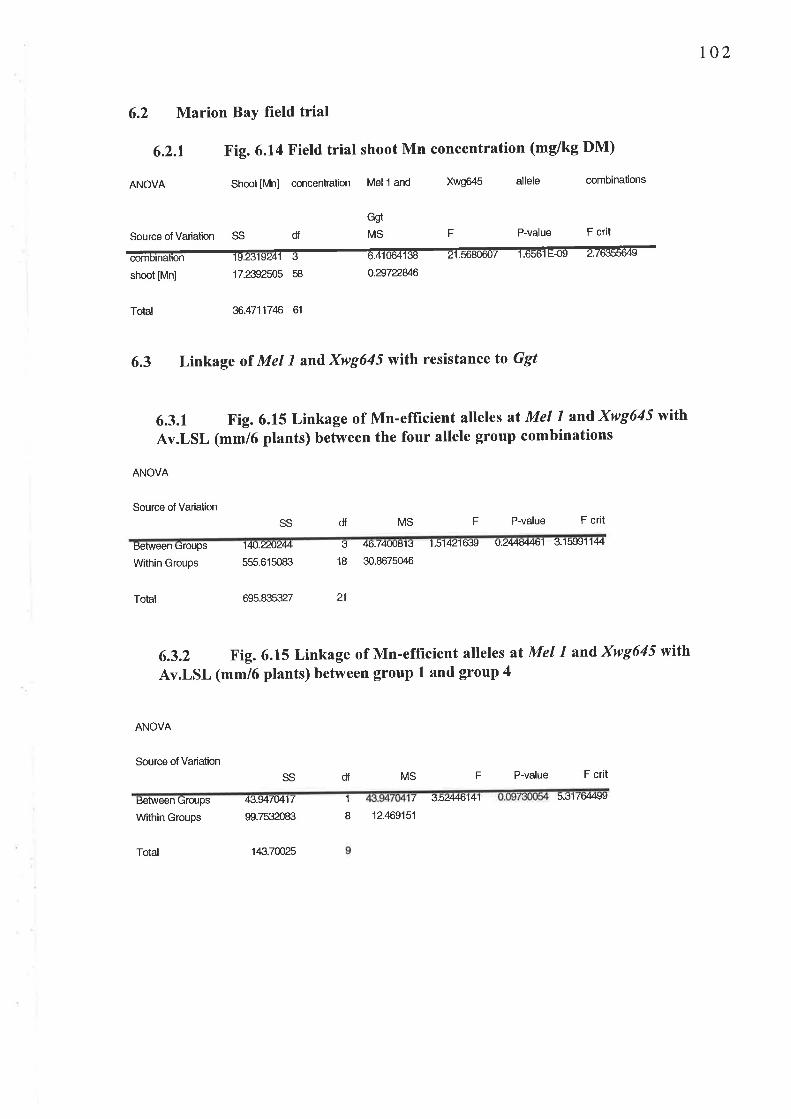
t02
6.2 Marion Bay field trial
6.2.1 Fig. 6.14 Field trial shoot Mn concentration (mg/kg DM)
ANOVA Shoot [Mn] concentration Mel 1 and Xwg645 allele combinations
Source of Variation SS P-value F crit
shoot [Mn] 17.2392505 58 0.æ72W
Total æ.47117ß 61
6.3 Linkage oI Mel l and Xwg645 with resist^nce to Ggt
6.3.1 Fig. 6.15 Linkage of Mn-efficient alleles at Mel l and Xwg645 witln
Av.LSL (mm/6 plants) between the four allele group combinations
ANOVA
Source of Variation
df MS F P-value F crit
Ggt
MSdf F
SS
14D.:äJ244
555.615083
3 4tt.zluJuls
18 30.8675046
1.51421(xJS| U.244ö44tt1 3.15991 144Hetween Liroups
Within Groups
Total
ANOVA
Source of Variation
695.835327 21
6.3.2 Fig.6.15 Linkage of Mn-efficient alleles at Mel l and Xwg645 wit}n
Av.LSL (mm/6 plants) between group 1 and group 4
SS df MS F P-value F crit
43.9.7141t II
I 3.5¿4qt141 5.ij'l /b4rtwtsetween uroups
Within Groups
Total
99.753æ83
143.7@25
12.,169151
103
Appendix 3 Materials and methods for molecular biology
3.1 Small scale genomic DNA extraction
The method used to extract DNA from leaves was a mini-prep modified from
Rogowsky et al., (1991). Two 10 cm healthy leaf blades were rolled and placed into a sterile
2-ml Eppendorf tube, and frozen in liquid nitrogen. The frozen sample was crushed to a
powder in the tube. Then 600 pl DNA extraction buffer (1olo sarkosyl 100mM Tris-HCl,
100mM NaCl, 10 mM EDTA, 2o/o polyvinyl-polypyrrolidone [insoluble] pH 8'5) was added
and mixed with the leaf powder to form a slurry. Phenol extraction was done by adding 600 pl
phenol:chloroform:isoamyl alcohol (25:24:l) equilibrated with I M Tris-HCl pH 8.0 into the
slurry and mixing well. After placing at 4"C for 10-30 minutes, the samples were centrifuged
at l2Krpm for 15 minutes at 4"C. The supernatant was collected into a fresh tube, and DNA
was precipitated after the addition of 60 pl 3 M NaAc (pH to 4.8 with glacial acetic acid) and
600 pl isopropanol. After mixing and leaving at room temperature for 10 minutes, the DNA
was pelleted by centrifugation at l2Krpm for l0 minutes at 4"C. The supernatant was gently
decanted out of the tube, the remaining pellet of DNA was washed with I m\ 70% ethanol'
centrifugation for 5 minutes at room temperature at l2K rpm, and the supernatant discarded.
The DNA pellet was air dried, resuspended and stored at -20"C in 50 pl R40 (40 pdtnl
RNAse A (Boehringer Mannheim) in TE buffer [10 mM Tris-HCl, 1 mM EDTA pH 8'0])'
3.2 RFLP analysis and construction of a partial map
A set of RFLPs were found to identify 92 polymorphic loci between parents Mn-
inefficient WI 2585 and Mn-efficient Amagi Nijo. The DNA clones were selected to ensure
full genome coverage to maximise the probability of detection of linkage to the traits (Darvasi
and Soller, Igg4) and covered the barley genome at a maximum of 30 cM intervals based on a
consensus linkage map for barley (Langddge et al., 1995). Additional markers were selected
from genetic maps for barley and wheat (Heun et al., 1991, Lui and Tsunewaki,Iggl and Gale
et al., 1995). All DNA clones were obtained through the Australian Triticeae Mapping
Initiative.
The RFLP data for 140 DH lines was entered into the mapping programme Map
Manager QT Version b16 (Manly and Cudmore 1997). Associations between markers and the
lo4
QTL pot bioassay and held data were determined by single-point analysis (p < 0.001). A
LOD score > 3.2 was taken as the threshold for detecting a QTL for the DH population
(Lander and Botstein 1989). The eTL associations with the marker loci was identified using
Q-gene (Nelson 1997).
3.2.1 Digestion of genomic DNA for RFLP analysis
Genomic DNA was digested in 1.5 ml Eppendorf tubes containing (3pg) DNA, 4 mM
spermidine, I pg BSA (acetylated), 100 mM Tris-HCL, 0.5 M potassium acetate, 100 mM
magnesium acetate, 10 mM spermidine, l0 mM DTT and 20 units of restriction
endonucleases of eithe r BamHl, Dra I, Eco RI, Eco RV, and Hind lll (Boehringer Mannheim
or promega) in a total volume 10 pl sterile milli-Q water. Digestion was for 4 hours af 37"C.
3.2.2 Gel electrophoresis and Southern transfer
After digestion, 1 pl 10X Ficoll loading buffer (25% lwlvl ficoll 400,0.42Yo lwlvl
bromophenol blue, 0.42% [w/v] xylene cyanol FF, pH 8.0) was added to the samples before
l1 pl of each sample was loaded onto a lo/o agarose gel. Electrophoresis was overnight at 34 V
in a tank containing lX TAE running buffer (400 mM Tris-acetate, 1 mM EDTA pH 8.0 with
glacial acetic acid). The DNA bands were visualised and photographed under UV light after
staining the gel in ethidium bromide. DNA from the parents WI 2585 and Amagi Nijo were
run on each gel as controls for the DNA samples from the DH lines.
Southern transfer was as described by Sambrook et at.,(1989), with the following
modifications. The ethidium bromide was rinsed from the gel3x with nanopure water. The gel
was rinsed in 0.4M NaOH and placed DNA side up on a sheet of Whatman 3MM filter paper
supported by a sponge lying in a reservoir of 0.4 M NaOH. A nylon membrane (Hybond N*,
Amersham), briefly soaked in 0.4 M NaOH was placed on top of the agarose gel. Another
sheet of 'Whatman 3MM f,rlter paper moist with 0.4 M NaOH, was placed on top of the
membrane. Finally a 6 cm stack of dry paper towels gently secured in position with a glass
plate, the Southern transfer was over 3-4 hours by capillary blotting. The membrane \ilas
sealed in a plastic bag for storage at 4"C.
105
3.2.3 Oligolabelling of RFLP DNA clones
Into a sterile 1.5 ml Eppendorf tube was placed 2 pl DNA (50 ng), 3 pl 9mer random
primer mix (0.1 pglpl), and 3 pl of sterile water. After boiling for 5 minutes and chilling on ice
for 5 minutes 12.5 pl oligo buffer (60 pM each of dATP, dTTP, and dGTP (Amersham), attd
150 mM Tris-HCl pH7.6,150 mM NaCl,30 mM MgCl2, and 300 ltdml BSA), and I pl of
Klenow enzyme (Boehringer Mannheim) and 4 pt ¡cr-32l1dCTP (10 pCi/pl, Amersham) was
added. After incubation at 37"C for I hour, this mix was passed through a Sephadex G-100
mini-column saturated with TE buffer to separate the labelled probe from the unincorporated
¡cr-32t1dCtP. Then 500 pl of salmon sperm DNA (5 mg/ml) was added.
3.2.4 Hybridisation of DNA probes to membranes
Seven membranes were hybridised simultaneously. For the pre-hybridisation, the
membranes were soaked in 5X SSC for 5 minutes, rolled up into a cylinder (DNA side on the
inside) and placed into a hybridisation bottle (Hybaid). 7 ml of pre-hybridisation solution was
added (0.5 ml water, 3 ml 5x HSB (3 M NaCl, 100 mM PIPES, 25 mM Naz EDTA, pH to 6'8
with 4 M NaOH), 3 ml Dextran sulphate (25% w/v), 3 ml Denhardt's III (2yoBSA,2Yo Ficoll
4¡1,27oPolyvinyl-pynolidone 360, and 10% SDS) and 500 pl denatured salmon spenn DNA
(5 mg/rnl). The pre-hybridisation step was done over 20 minutes rotation at 65oC in a
hybridisation oven. The membranes were unwound by reversing the orientation of the bottle
in the oven, and resuming the pre-hybridisation for 2-6 hours at 65"C.
The labelled probe was boiled for 5 minutes, chilled on ice for 5 minutes and 500 pl
added to the hybridisation solution in the bottle. The probes were left to hybridise to the
DNA on the membranes overnight at 65"C in a rotating hybridisation oven. The membranes
were washed for 20 minutes in2X SSC, l% SDS in the hybridisation bottle, then removed
from the hybridisation bottle, and washed for 20 minutes at 65"C in each of lX SSC l% SDS,
0.5X SSC l% SDS and 0.2X SSC 1% SDS. The membranes were exposed to Fuji RX medical
X-ray film for 4-5 days at -80'C.
Following autoradiography, the labelled probe DNA was stripped from the
membranes by pouring over the membranes boiling stripping solution (0.I% SDS, 2 mM
EDTA), and leaving the membranes immersed in this solution on a rocking platform for 30
106
minutes. Excess solution was blot dried from the membranes which were then sealed in plastic
and stored at4"C for reuse.
3.3 Linkage analysis for Mel I
The RFLP data of the 439 DH lines for the marker loci Xwg622, Xcdo583, Xabg714,
andXmwgT| wereplaced into the mapping programme Microsoft Map Manager QT Version
b16 (Manly and Cudmore IggT). The genetic distance between marker loci was calculated
using the mapping functions as in Appendix 3.2. The two AFLP primer combinations
identified as linked with Mel1, were added to the mapping data set.
3.4 AFLP analysis
The method of bulked segregant analysis (BSA) (Michelmore et al., 1991) was used to
identifu AFLP markers linked to Mel l (Appendix 3.2 and 2.3) (Vos et al',1995, and Waugh
et al.,lgg7). To identiff putative AFLP markers, genomic DNA from the DH population and
the parents was run on gels using 44 primer pairs. DNA was extracted (Appendix 3, 3.1,3.4.1
and,3.4.2),from V/I 2585 and Amagi Nijo. DNA was also extracted from 20 samples of DH
lines which by RFLp analysis had the Mn-ineffrcient allele (V/I 25S5-like) at all four RFPL
markers linked to Mel l (section 6.2.I), and from 20 samples of DH lines which by RFLP
analysis had the Mn-efficient allele (Amagi Nijo-like) at all four RFLP markers linked to the
Mel l (section 6.2.1). The 20 DNA samples with either the inefficient or the efficient allele at
Mel I were made into an inefficient bulk and an efficient bulk DNA samples. The AFLP
primer pairs which showed a polymorphic band in V/I 2585 and in the inefficient bulk, but no
band in Amagi Nijo and in the efficient bulk, or vice versa, were re-tested (Appendix 3' 3.4.1
to 3.4.2)with parents V/I 2585 and Amagi Nijo, and with the 20 individual lines which made
up each of inefficient bulk and efficient bulk.
Confirmation of the primer pair as identifuing a specific AFLP marker for Mel -l was
validated if the polymorphism present or absent in WI 2585 and in the inefficient bulk, or in
Amagi Nijo and in the efhcient bulk, or vice versa as seen previously, was also in > 70Yo of
the 20 individual bulks that made up either the inefficient bulk or the efficient bulk. To
precisely map Mel.l, the confirmed AFLP marker was run with the individual DH lines which
t07
RFLP analysis had found to be recombinant between the RFLP probes wg622, cdo583,
abg7l4 and,mwg77 (Appendix 3.2and 3.3). The AFLP results of the DH lines were entered
into the Map Manager QT Version b16 (Manly and Cudmore, 1997) file made for the 439
DH lines as in section6.2.l (Appendix 3.2,and3.3).
3.4.1 Genomic DNA digestion, adaptor tigation and pre-amplification
The AFLP method used was modified from Vos et al., (1995). Genomic DNA (1 ttg)
was digested with 5 units of Psl 1 and Mse I (Gibco) for 3 hours at 37"C. Double stranded
adaptors were ligated to the ends of the restriction fragments. The adaptors were 5 pM Mse I
annealed adaptors, 0.5 pM Psr 1 arurealed adaptors (Gibco), in 10 mM Tris-HAc, 10 mM
MgAc,50mM KAc,5 mM DTT, I.2 ¡tl of l0 mM ATP, and I unit of T4 DNA ligase
(Gibco) in a total volume of 73 pl. Pre-amplification was performed using primers specific for
the Psl I and Mse I adaptors including one selective nucleotide. The pre-amplification mix
contained 75 ng MseC primer, 75 ng PstA primer (Gibco), 2.5 ¡tl10X Taq buffer (PCR buffer,
Gibco), 4 pl of 1.25 mM of each dNTPs, 50 mM MgCl2, I unit of Taq polymerase
recombinant (Gibco), and 4 pl of the ligated DNA template mix in a total volume of 25 ¡tl-
Pre-amplification PCR consisted of 20 cycles of 94'C for 30 seconds, 56'C for 1 minute and
72"Cfor 1 minute. The pre-amplification template DNA was diluted l:5 in sterile nanopure
water and stored at -20"C.
3.4.2 AFLP selective amplification and electrophoresis
A total of 44 primer pairs were tested to search for putative AFLP markers linked to
Mel l. Selective amplification was performed using ll Mse 1 primers with 3 selective bases at
the 3' end, and four Ps/ 1 primers with 2 selective bases at the 3' end. The labelling mix was 5
ngPst I primer, 1pl 10X PNK buffer (250 mM Tris-HCl, pH 7.5, 100 mM MgClz 50 mM
DTT, 5 mM spermidine),2 units of polynucleotide kinase (Gibco), and 1 pl ¡1-32f1ARtP (10
pCi/pl, Amersham) in a total volume of 10 pl. After incubation for 30-60 minutes at 37"C, I
pl of the end-labelled 2 selective base primer was added to the selective amplification mix (25
ng of selective primer Pst I,30 ng of selective primer Mse | (Gibco), I pl 10X Taq buffer
(PCRbuffer (Gibco),3.3 pl of 1.25 mM dNTPs, 0.6 pl 50 mM MgCl2, 5 pl of the template
108
DNA, and 0.5 units of Taq polymerase recombinant (Gibco) in a total volume of 14 pl
nanopure water).
The PCR reaction on the selective amplification mix after the addition of the end-
labelled primer consisted of one cycle at 94"C for 30 seconds, 65"C for 30 seconds and 72"C
for I minute, followecl by 9 cycles over which the annealing tempcrature is decreased by l"C
per cycle, with a final run of 25 cycles of 94"C for 30 seconds, 56'C for 30 seconds and 72"C
for 1 minute. Loading buffer (20 pl) (98% formamide, 10 mM Na2EDTA, 0.05yo
bromophenol blue, and 0.05% xylene cyanol) was added to each sample of selectively
amplified PCR sample. The samples were stored at -20"C.
The samples (2 pl) were separated on a 6Yo denaixing polyacrylamide gel made from
Sequegel6, (48 ml) and Sequegel buffer (12 ml) (National Diagnostics). Before loading on the
gel, the samples were denatured for 5 minutes at 95'C and chilled on ice for 5 minutes. The
gels were run at 40 W, transferred to Whatman 3MM paper, dried at 80"C for 45 minutes and
exposed to Fugi RX medical X-ray film at room temperature 48-120 hours.

109
References
ABARE. (1999a). 6. Gross value of production of selected grains, pulses and oilseeds'
Australian Grains Irrdustry: Performanoe by GRDC Agroecological Zones.
Australian Bureau of Agricultural and Resource Economics, Canberra, p 1 1.
ABARE. (1999b). 63. Average annual losses from wheat disease. Australian Grains Industry:
Performance by GRDC Agroecological Zones. Australian Bureau of Agricultural and
Resource Iconomics, Canbcrra, p 138.
Amesz, J. (1933). The role of manganese in photosynthetic oxygen evolution.
Biochem. Biophys Acta726z l-12.
Albert, F. and Anderson, A.J. (1987). The effect of Pseudomonas putida colonization on root
surface peroxidase. Plant Physiol. 85: 537-541.
Appels, R., Morris, R., Gill, B.S. and May, C.E. (1998). Chapter 21. Genetic and molecular
mapping of chromosomes 1n.' Chromosome Biologv Kluwer Academic Publishers,
London, p 33-34.
Arines, J., Vilarino, A. and Sainz, M. 19S9). Effect of different inocula of vesicular-arbuscular
mycorrhizal fungi on manganese content and concentration in red clover
(Trifolium pratense L.) plants. New Phytol.ll2:215-219.
Asher, M.J.C. (1981). Pathogenic variation.lr: Biology and Control of Take-all. Eds.
Asher, M.J.C. and Shipton, P.J. Academic Press, London. pp 199-218.
Asher, M'J'c' and shipton, P'J' Eds' (1981)' Biologv and control of rake-all'
Academic Press, London.
Bannister, J.V., Bannister,'W.H. and Rotilio, G. (1987). Aspects of the structure, function
and applications of superoxide dismutase. CRC Crit. Rev. Biochem2?z 111-180.
Baon, J.8., Smith, S.E., Alston, A.M. and'Wheeler, R.D. (1992). Phosphorus efficiency of
three cereals as related to indigenous mycorrhizal infection. Aust. J. Agric. Res.
43:479-491.
Baon, J.8., Smith, S.E. and Alston, A.M. (1993). Myconhizal responses of barley cultivars
differing in P efficiency. Plant Soil 157: 97-105.
110
Baon, J.B., Smith, S.E. and Alston, A.M. (1994a). Phosphorus uptake and growth of barley
as affected by soil temperature and myconhizal infection. J. Plant Nutr. 17: 479-492.
Barber, D.A. and Lee, R.B. (1974). The effect of micro-organisms on the absorption of
manganese by plants. New Phytol.97: 97-106.
Barber, M.S. and Ride, J.P. (l9SS). A quantitative assay for induced lignification in
wounded wheat leaves and its use to survey potential elicitors of the response.
Physiol. Mol. Plant Pathol. 32¿ 185-197.
Batey, T. (1971). Manganese and boron deficiency 1n,' Trace Elements in Soils and Crops.
Techn. Bull. (Min. Agric. Fish and Food) Lonclon' 2tz 137-148.
Baylis, G.T.S. (1982). Fungi, phosphorus and the evolution of root systems. Search
3:257-259.
Bell, A.A. (l93l). Biochemical mechanisms of disease resistance. Annu. Rev. Plant
Physiol. 322 2l-28.
Bertrand, G. and Javillier, M. (1912). Action of manganese and the development of
Aspergillus niger. Bull. Soc. Chim. Fr. 4 (XI): 212-221.
Biermann, B.J. and Linderman, R.J. (1983). Increased geranium growth using pretransplant
inoculation with a mycorrhizal fungus. J. Am. Soc. Hort. Sci. 108: 972-976.
Bowyer, P., Clarke,8.R., Lunness, P., Daniels, M.J. and osbourne, A.E. (1995). Host
range of a plant pathogenic fungus determined by a saponin detoxifying enzyme.
Science. 267:371-374.
Bromfield, S.A. (197S). The effect of manganese-oxidizing bacteria and pH on the availability
of manganous ions and manganese oxides to oats in nutrient solutions. Plant Soil
492 23-39.
Bromfield, S.M. (1958a). The properties of a biologically formed manganese oxide, its
availability to oats and its solution by root washings. Plant Soil 9z 325-337 -
Brassett, P.R. and Gilligan, G.A. (1990). Effects of self-sown wheat on levels of the take-all
disease on seedlings of winter grown in a model system. J. Phytopathol. 129: 46-57.
Brown, P.H., Graham, R.D. andNicholas, D.J.D. (19S4). The effects of manganese and
nitrate supply on the levels of phenolics and lignin in young wheat plants. Plant Soil
8l:437-440.

111
Burnell, J.N. (193S). The biochemistry of manganese in plants In: Mansanese in Soil and
Plants. Eds. Graham, R.D., Hannam, R.J. and Uren, N.C. Kluwer Academtc
Publishers, Dordrecht, The Netherlands. pp 125-137.
Cheniae, G.M. (1976). Photosystem II and 02 evolution. Annu. Rev. Plant Physiol'
2l:467-498.
Cheniae, G.M. and Martin,I.F. (1970). Sites of function of manganese within photosystem
II. Roles in 02 evolution and system II. Biochim. Biophys. Actal9T:219-239.
Cheniae, G.M. and Martin, I.F. (1971). Effect of hydroxylamine on photosystem II. I.
Factors affecting the decay of CO2 evolution. Plant Physiol.4Tz 568-575.
Coghlan, A. (1996). Sticky coat stops crop rot. New Scientist 1Oth Feb, 1996 pp 19.
Conner, S.D. (1932). Factors affecting manganese availability in soils. J. Am. Soc. Agron.
242 726-733.
Cook, R.J. (l93l). The effect of soil reaction and physical conditions. 1n: Biology and
Control of Take-all. Eds. Asher, M.J.C. and Shipton, P.J. Academic Press, London.
pp 343-352.
Cook, R.J. (1994). Problems and progress in the biological control of wheat take-all.
Plant Pathol. 43: 429-437 .
Cunningham, P.C. (1981). Isolation and culture' 1n" Biologv and Control of Take-all'
Eds. Asher, M.J.C. and shipton, P.J. Academic Press, London. pp 103-124.
Davies, P.A. and Morton, S. (1997). A comparison of barley isolated microspore and
anther culture and the influence of cell culture density. Plant Cell Reports.
17:206-210.
Darvasi, A. and Soller, M. (1994). Optimum spacing of genetic markers for determining
linkage between marker loci and quantitative trait loci. Theor. Appl. Genet.
89:351-357.
De Boer, R.F. and Kollmorgen, J.F. (19S7). Effects of cultivation on rhizoctonia root rot and
take-all of wheat in Victoria. Proc. 6th Australasian Plant Pathol. Conf., Adelaide,
South Aust. p 31.
Dewan, M.M. and Sivasithamparam, K. (1990). Differences in the pathogenicity of isolates
of the take-all fungus from roots of wheat and ryegrass. Soil Biol. Biochem.
222ll9-122.

I12
Dori, S., Solel, Z andBarash, I. (1995). Cell wall-degrading enzymes produced by
Gaeumannomyces graminis var. tritici in vitro and in vlvo. Physiol. Mol. Plant Pathol.
46: 189-198.
El-Baz,F.K., Maier, P., Wissemeier, A.H. and Horst, W.J. (1990). Uptake and distribution of
¡ìangarìese applied to leaves of Viciafaba (cv. Herzfreya) and Zeo mays (cv. Regent)
plants. Z. P flanzenernÑhr. B odenk. 153 z 21 9 -282.
Epstein, E. (1972). Mineral Nutrition of Plants: Principles and Perspectives. John Wiley &
Sons, New York. pp 325-344.
Evans, L.T. and Dunstone, R.L. (1970). Some physiological aspects of evolution in wheat.
Australian Journal of Biological Sciences 232 725-741.
Fernandez-Pol, J.4., Klos, D.J. and Hamilton, P.D. (1994). Metallopanstimulin gene product
produced in a baculovirus expression system is a nuclear phosphoprotein that binds to
DNA. Cell Growth & Differentiation. 5: 811-825.
Gale, M.D., Atkinson, M.D., Chinoy, C.N., Harcourt, R'L., Jia,J., Li, Q.Y. and Devos'
K.M. (1995). Genetic maps of hexaploid wheat. In:Li, Z.S. and Xin, Z.Y. Eds. Proc.
8th Int. Wheat Genet Symp. China Agricultural Scientech Press, Beijing, pp29-40.
Gallagher, P.H. and Walsh, T. (1943). The susceptibility of cereal varieties to manganese
deficiency. J. Agric. Sci.33: 197-203.
Gamham, G.Vy'., Codd, G.A. and Gadd, G.M. (1992). Kinetics of uptake and intercellular
location of cobalt, manganese and zinc in the estuarine green algaChlorellq salina.
Appl. Microbiol. Biotechnol . 37 z 27 0-27 6.
Garrett, S.D. (1934a). Factors affecting the severity of take-all. 1. The importance of soil
micro-organisms. J. Dept. Agric., South Aust. 37: 664-674.
Garrett, S.D. (1938). Soil conditions and the take-all disease of wheat. III Decomposition of
the resting mycelium of Ophiobolus graminis ininfected wheat stubble buried in the
soil. Ann. Appl.Biol.25: 742-766.
Ghanotakis, D.F. and Yocum, C.F. (1990). Photosystem II and the oxygen-evolving complex.
Annu. Rev. Plant Physiol. Plant Mol. Biol. 41: 255-276.
Gilligan, C.A. (19S0). Zone of potential infection between host roots and inoculum of oats
of Gaeumannomyces graminis. Soil Biol' and Biochem. 12: 5 I 3-5 1 4.

113
Gilmour, R.M., Cullis, B.R. and Verbyla, A.P. (1997). Accounting for natural and extraneous
variation in the analysis of field experiments. J. Agric. Biol. Environ. Stat. 2z 269-293.
Godo, G.H. and Reisenauer, H.M. (19S0). Plant effects on soil manganese availability. Soil
Sci. Soc. Am. J. 442 993-995.
Graharn, R.D. and Nambiar, E.K.S. (1981). Advances in research on copper deficiency in
cereals. Aust. J. Agric. Res.32: 1009-1037.
Graham, R.D. (19S3). Effect of nutrient stress on susceptibility to disease with particular
reference to the trace elements. Adv. Bot. Res. l0:221-276.
Graham, R.D., Davies, W.J. Sparrow, D.H.B. and Ascher, J.S. (1983). Tolerance of barley
and other cereals to manganese-deficient calcareous soils of South Australia. In:
Genetic Aspects of Plant Nutrition. Eds. Saric, M.R. and Loughman, B.C. Martinus
Nijhoff/Dr'W. Junk Publishers, The Hague, The Netherlands. pp 339-345.
Graham, R.D. (1984). Breeding for nutritional characteristics in cereals. Adv. Plant Nutr.
l:51-102.
Graham, R.D. and Rovira, A.D. (1984). A role for manganese in the resistance of wheat
plants to take-all. Plant Soil 78:441-444.
Graham, R.D., Davies, Vy'.J. and Ascher, J.S. (1985). The critical concentration of manganese
in field grown wheat. Aust. J. Agric. Res. 36: 145-155.
Graham, R.D. (19SS). Genotypic differences in tolerance to manganese deficiency. 1n:
Mansanese in Soil and Plants. Eds. Graham, R.D., Hannam, R.J' and LJren,
N.C. Kluwer Academic Publishers, Dordrecht, The Netherlands. pp 216-276.
Graham, R.D. and'Webb, M.J. (1991). Micronutrients and disease resistance and tolerance
in plants. In: Micronutrients in Agriculture. 2nd ed. Eds. Mortvedt, J.J. Cox, F.R',
Shuman, L.M. and Welch, R.M. Soil Sci. Soc. Am., Madison, WI. pp329-370.
Gries, D., Brunn, S., Crowley, D.E. and Parker, D.R. (1995). Phytosiderophore release in
relation to micronutrient metal deficiencies in barley. Plant Soil 172l-299-308.
Gross, G.G. (1930). The biochemistry of lignification. Adv. Bot. Res. 8: 25-63.
Hall, I.R. (197S). Effect of vesicular-arbuscular mycorrhizas on two varieties of maize and one
of sweet corn. New ZealandAgric. Res. 36: 517-519.
Hannam, R.J., Riggs, J.L. and Graham, R.D. (19S7). The critical concentration of manganese
in barley. J. Plant Nutr. l0: 2039-2048.

tt4Harbard, J.L. (1992). Mechanisms of manganese efficiency of barley (Hordeum vulgare). M.
Ag. Sc. Thesis, The University of Adelaide, South Australia.
Heun, M., Kennedy, 4.E., Anderson, J.A. Lapitan, N.L.V., Sorrels, M.E. and Tanksley, S.D.
(1991). Construction of a restriction fragment length polymorphism map of barley
(Hordeum vulgare). Genome 34:- 437 -447 .
Hollins, T.W., Scott, P.R. and Gregory, R.J. (19S6). The relative resistance of wheat, rye and
triticale to take-all caused by Gaeumannomyces graminis. Plant Pathol. 35: 93-100.
Huang, C., Vy'ebb, M.J. and Graham, R.D. (1994). Manganese efftciency is expressed in barley
growing in soil system but not in solution culture. J. Plant Nutr. 17 (1). 83-95.
Huang, C. Barker, S.J., Langridge, P. and Graham, R.D. (1995). Cloning and expression of a
novel zinc finger gene associated with Mn efficiency. In;Australian Society of Plant
Physiologists 35th Annual General Meeting & New Zealand Society of Plant
Physiologists 17th Annual General Meeting. Abstract 155. Published by Aust. Soc.
Plant Physiol. Inc., Sydney.
Huang, C. (1996). Mechanism of efficiency in barley. Ph.D. Thesis. The University of
Adelaide, South Australia.
Huang, C., Graham, R.D., Barker, S.J. and Mori, S. (1996b). Differential expression of iron
deficiency-induced genes in barley genotypes with differing manganese effrciency.
J. Plant Nutr. 19 (2) 407-420.
Huber, D.M. (1931). The role of nutrients and chemicals. ¡¿: Biolosv and Control of Take-all
Eds. Asher, M.J.C. and Shipton, P.J. Academic Press, London. pp 317-342.
Huber, D.M. and Dorich, R.A. (19SS). Effect of nitrogen fertility on the take-all disease of
wheat. Down Earth 4a Q): 12-17.
Huber, D.M. and Keeler. R.R. (1977). Alteration of wheat peptidase activity after infection
with powdery mildew. Proc. Am. Phytopathol. Soc. 4: 163.
Huber, D.M. and'Wilhelm, N.S. (198S). The role of manganese in disease resistance.
In: Manganese in Soils and Plants. Eds. Graham, R.D., Hannam, R.J. and Uren, N.C'
Kluwer Academic Publishers. Dordrecht, The Netherlands. pp 155-174.
Jauregui, M.A. and Reisenauer, H.M. (1982a). Calcium carbonate and manganese dioxide as
regulators of available manganese and iron. Soil Sci. 134: 105-110.

115
Jauregui, M.A. and Reisenauer, H.M. (l9S2b). Dissolution of oxides of manganese and iron
by root exudate components. Soil Sci. Soc. Am. J. 462 314-317 '
Kleinhofs, A. and Kilian, A. (1994). RFLP maps of barley.In; DNA-Based Markers rn
Plants. Eds. Phillips, R.L. and Vasil,I.K. Kluwer Academic Publishers, Dordrecht,
The Netherlands. pp 163-198.
Kochian, L.V. (1991). Mechanisms of micronutrient uptake, translocation, and interactions
in plants. 1n,' Micronutrients in Agriculture. 2nd Edn. Eds. Mortvedt, J.J., Cox, F.R.,
Shuman, L.M. and'Welch, R.M. Soil Sci. Soc. Am., Madison, WI, pp229-296.
Kollmorgen, J.F. Ridge, P.E. and Walsgott, D.N. (1985a). Saprophytic survival of
Gaeumannomyces graminis var tritici in the Victorian mallee, Australia. Í¿,'
Ecoloey and Manasement of Soilborne Plant Pathogens. Eds. Parker, C.4., Rovira,
A.D. Moore, K.J., Wong, P.T.W. and Kollmorgen, J.F. Am. Phytopathol. Soc.
St Paul, Minnesota. pp 36-37.
Kollmorgen, J.F. Griffiths, J.B. and Walsgott, D.N. (l9S5b). Effects of cropping sequences
on saprophytic survival and carry-over of Gaeumannomyces graminis var tritici. In.
Ecolosy and Manasement of Soilborne Plant Pathogens. Eds. Parker, C.4., Rovira,
4.D., Moore, K.J., V/ong, P.T.W. and Kollmorgen, J.F. Am. Phytopathol. Soc.
St Paul, Minnesota. pp 240-241.
Kothari, S.K., Marschner, H. and Rîmheld, V. (1991). Effect of a vesicular-arbuscular
mycorrhizal fungus and rhizosphere micro-organisms on manganese reduction in the
rhizosphere and manganese concentrations inmaize (Zea mays L.).New Phytol.
llTz 649-655.
Krauskopf, K.B. (1972). Geochemistry of micronutrients. 1n: Micronutrients in Agriculture
Eds. Mortvedt, J.J., Giordano, P.M. and Lindsay, w.L. soil sci. soc. Am. Inc.
Madison, WI. pp 7-40.
Kriedemann, P.E. Graham, R.D. and Wiskich, J.T. (1935). Photosynthetic dysfunction and
in vivo changes in chlorophyll a fluorescence from manganese-deficient wheat leaves.
Aust. J. Agric. Res. 36: 155-169.
Kubota, J. and Allway, W. H. (1972). Geographic distribution of trace element problems.
1n,' Micronutrients in Agriculture. Eds. Mortvedt, J.J., Giordano, P.M. and Lindsay,
W.L. Soil Sci. Soc. Am.Inc. Madison, WI.pp 525-554.
116
Lander, E.S. and Botstein, D. (19S8). Mapping Mendelian factors underlying quantitative
traits using RFLP linkage maps. Genetics l2lz 185-199.
Langridge, P.J., Karakousis, 4., collins, N., Kretschmer, J. and Manning, s. (1995). A
consensus linkage map of barley (Hordeum vulgare Z.). Mol. Breeding 1: 389-395.
Leeper, G.V/. (1970). Manganese in Six Trace Elements in Soils. Melbourne Univcrsity
Press, Victoria, Australia. pp 20-42.
Lindsay, W.L. (1979). Chemical Equilibria in Soils. John V/iley and Sons, New York.
pp 150-161.
Liu, Y.G. and Tsunewaki, K. (1991). Restriction fragment length polymorphism (RFLP)
analysis in wheat. II Linkage maps of the RFLP sites in common wheat. Jpn. J.
Genet. 66:617-633.
Longnecker, N.E., Graham, R.D., and Marcar, N.E. (198S). The effect of seed manganese on
barley. (Hordeum vulgare L.) growth and yield. In: lntemational Symposium on
Mansanese in Soil and Plants. Eds. Webb, M.J., Nable, R.O., Graham, R'D' and
Hannam, R.J. Manganese Symposium 1988 Inc., Adelaide. pp 47-49.
Longnecker, N.E. and Graham, R.D. (1990). The diagnosis of manganese deficiency in
barley (Hordeum vulgare).1n,' Plant Nutrition - Physiology and Applications. Ed.
Van Beusichem, M.L. Kluwer Academic Publishers, Dordrecht, The Netherlands.
pp 797-803.
Longnecker, N.8., Graham, R.D. and Card, G. (1991). Effects of manganese deficiency on
the pattern of tillering and development of barley (Hordeum vulgare cv. Galleon).
Field Crops Res. 28: 85-102.
Maas, E.V., Moore, D.P. and Mason, B.J. (1968). Manganese absorption by excised barley
roots. Plant Physiol. 43: 527-530.
Mac Nish, G.C. (1980). Management of cereals for control of take-all. J. Dept. Agric.,
West. Aust. (4th Ser.) 21: 48-51.
Manly, K.F. and Cudmore, R.H. (Jr.) (1997). Map Manager QT, Software for mapping
quantitative trait loci. Abstracts of the 1lth International Mouse Genome Conference,
St. Petersburg, FL.
Marcar, N.E. (1986). Genetic variation for manganese efficiency in cereals. Ph.D. Thesis. The
University of Adelaide, South Australia.
tt7Marcar, N.E. and Graham, R.D. (19S6). Effect of seed manganese content on the growth
of wheat (Triticum aestivum) under manganese deficiency. Plant Soil 96: 165-173.
Marschner, H. (1988). Mechanisms of manganese acquisition by roots from soils.
In:Manganese in Soils and Plants Eds. Graham, R.D., Hannam, R.J. and Uren,
N.C. Klwer Academic Publishers. Dorclrecht, The Netherlands. pp l9l-204.
Marschner, H. (1991). Root-induced changes in the availability of micronutrients in
the rhizosphere. In:Plant Roots: the hidden half. Eds. V/aisel, Y. Eshel, A.
and Kafkaji, U. Marcel Dekker,Inc. New York. pp 503-528.
Marschner, H., Rîmheld, V. and Osscn-bcrg-Neuhaus, H. (1982). Rapid method for
measuring changes in pH and reducing processes along roots of intact plants.
Z. Pflanzenphysiol. Bd. 105: 407 -416.
Marschner, H. and Rîmheld, V. (1994). Strategies of plants for acquisition of iron.
Plant Soil. 165: 261-27 4.
M" Carthy, K.W., Longnecker, N.E., Sparrow, D.H.B. and Graham, R.D. (1988). Inheritance
of manganese efhciency in barley (Hordeum vulgare L.). In : International Sympo sium
on Mansanese in Soil and Plants. Eds. 'webb, M.J., Nable, R.o., Graham, R.D. and
Hannam, R.J. Manganese Symposium 1988 Inc., Adelaide. pp I2l-122.
M" Hargue, J.S. (1922). The role of manganese in plants. J. Am. Chem. 44; 1592-1598.
Medeiros, C.A.B., Clark, R.B. and Ellis, J.R. (1995). Effects of excess manganese on
mineral uptake in mycorrhizal sorghum. J. Plant Nutr. L8 (2),20I-217.
Mercer, F.V. Nittim, M. and Possingham, J.V . (1962). The effect of manganese deficiency
on the structure of spinach chloroplasts. J. cell Biol. 15: 379-381.
Michelmore, R.W., Paran, I. and Kesseli, R.V. (1991). Identif,rcation of markers linked to
disease-resistance genes by bulked segregant analysis: A rapid method to detect
markers in specific genomic regions by using segregating populations. Proc. Natl.
Acad. Sci. USA 88: 9828-9832.
Moore, K.J. and Cook, R.J. (19S4). Increased take-all of wheat with direct drilling in the
pacific northwest. Phytopathol. 7 4: 1044-1049'
Morgan, P.W. Joham, H.E. and Amin, J.V.. (1966). Effect of manganese toxicity on the
indole-acetic acid oxidase system in cotton. Plant Physiol. 41: 718-724.

118
Nable, R.O., Bar-Akiva, A. and Loneragan, J.F. (19S4). Functional manganese requirement
and it's use as a critical value for diagnosis of manganese deficiency in subterranean
clover (Trifolium subtetaneumL. cv. Seaton Park). Ann. Bot. (Lond.) 54l. 39-49.
Nable, R.O. and Loneragan, J.F. (1984a). Translocation of manganese in subterranean
clover (Triþtium subterraneumL. cv. Seaton Park). I. Rcdistribution during
vegetative growth. Aust. J. Plant Physiol. 11 : 1 01 - I I 1 .
Nable, R.O. and Loneragan, J.F. (1984b). Translocation of manganese in subterranean
clover (trifolium subterraneumL. cv. Seaton Park). II. Effect of leaf senescence and of
rcstricting supply of manganese to part of a split root system.
Aust. J. Plant Physiol. 11: 113-118.
Nealson, K.H., Tebo, B.M. and Rosson, R.A. (1938). Occurrence and mechanisms of
microbial oxidation of manganese. Adv. Appl. Microbiol. 33:279-318.
Nelson, J.C. (1997). Q-GENE: software for marker-based genomic analysis and breeding.
Mol. Breeding 3: 239-245.
Nielands, J.B. and Leong, S.A. (1986). Siderophores in relation to plant growth and
disease. Ann. Rev. Plant Physiol. 37: 187-208.
Norvell, W.A. (1988). Inorganic reactions of manganese in soils. In: Mansanese in Soil and
Plants. Eds. Graham, R.D., Hannam, R.J. and lJren, N.c. Kluwer Academtc
Publishers, Dordrecht, The Netherlands. pp 37-58.
Nyborg, M. (1970). Sensitivity to manganese deficiency of different cultivars of wheat, oats
and barley. Can. J. Plant Sci. 50: 198-200.
O'Brien, T.P. and Mc Cully, M.E. (1981). The Studv of Plant Structure- Principles and
Selected Methods. Bradford House Pty. Ltd.- South Melbourne
Osboum,4.E., Clarke,8.R., Dow, J.M. and Daniels, M.J. (1991). Partial characterization
of avenacinase from Gaeumannomyces graminis vaÍ. avenoe. Physiol. Mol' Plant
Pathol. 38: 301-312.
Osbourn,4.E., Clarke, 8.R., Lunness, P., Scott, P.R. and Daniels, M.J. (1994). An oat
species lacking avenacin is susceptible to infection by Gaeumannomyces graminis vat.
tritici. Physiol. Mol. Plant Pathol. 45: 457-467.
Pacovski, R.S. (1936). Micronutrient uptake and distribution in myconhizal ot phosphorus
fertilized soybean. Plant Soil95: 379-388.
tt9Page, E.R. and Dainty, J. (1964). Manganese uptake by excised oat roots. J. Exp. Bot.
15:428-443.
Pallotta, M.A., Khabas-Saberi, H., Lewis, J., Graham, R.D. and Barker, S. (1999).
Breeding for tolerance to nutritional stress - molecular mapping of loci for manganese
efficiency in barley and durum wheat. Australian Plant Breeding Conference
Proceeding s, 2z p 144-145.
Pallotta, M.4., Graham, R.D., Langridge, P., Sparrow, D.H.B. and Barker' S.J. (2000).
RFLP mapping of manganese efficiency in barley. Theor. Appl. Genet.
101:1100-1108.
Pearson, J.N. and Rengel, Z. (1994). Distribution and remobilisation of Zn and Mn
during grain development in wheat. J. Exp. Bot. 45: 1829-1835.
Pearson, J.N. and Rengel, Z. (lggsb). Uptake and distribution of 65Znand'oMtt itt
wheat growït at suffrcient and deficient levels of Zn and Mn II during grain
development. J. Exp. Bot. 46: 841-845.
Pedler, J.F. (1994). Resistance to take-all disease by Mn efficient wheat cultivars. University
of Adelaide.
Pedler, J.F., Webb, M.J., Buchhorn, S.C. and Graham, R.D. (1996)' Manganese-oxidising
ability of isolates of the take-all fungus is correlated with virulence. Biol. Fertil. Soils
22:272-278.
Piñeros, M. and Tester, M. (1995). Characterization of a voltage-dependent Ca2*-selective
channel from wheat roots. Planta 195: 478-488.
Reis, E.M., Cook, R.J. and M'Neal, B.L. (1932). Effect of mineral nutrition on take-all of
wheat. Phytopathol. 722 224-229.
Reiter, R.S., Coors, J.G., Sussman, M.R. and Gabelman, V/.H. (1991). Genetic analysis of
tolerance to low-phosphorus stress inmaize using restriction fragment length
polymorphisms. Theor. Appl. Genet. 82: 561-568.
Rengel, Z.,Graham, R.D. and Pedler, J.F. (1993). Manganese nutrition and accumulation of
phenolics ancl lignìn as related to differential resistance of wheat genotypes to the
take-all fungus. Plant and Soil. 151: 255-263.
t20Rengel, Z.,Graham, R.D.and Pedler, J.F. (1994a). Time-course of biosynthesis of
phenolics and lignin in roots of wheat genotypes differing in manganese efftciency and
resistance to take-all fungus. Ann. Bot. 742 471-477.
Reuter, D.J. (1972). The correction of manganese deficiency in barley cfops.
M.Ag. Sc. thesis. University of Adelaide.
Reuter, D.J., Heard, T.G. and Alston, A.M. (1973a). Correction of manganese deficiency in
barley crops on calcareous soils. I. Manganous sulphate applied at sowing and as
foliar sprays. Aust. J. Agric. Anim. Husb. 13: 434-439.
Reuter, D.J. Hcard, T.G. and Alston, ^.M.
(1973b). Correction of manganese deficiency in
calcareous soils. II. Comparison of mixed and compound fertilizers. Aust. J. Agric.
Anim. Husb. l3z 440-445.
Reuter, D.J., Robinson, J.8., Peverill, K.I. and Price, G.H. (1986). 4 Definition of terms and
abbreviations used in the following sets of tables.In; Plant Analysis: An
Interpretation Manual. Eds. Reuter, D.J. and Robinson, J.B. Inkata Press, Melbourne.
pp 34-37
Reuter, D.J. (1936). Temperate and sub-tropical crops. Íe; Plant Analysis: An InterPretation
Manual. Eds: Reuter, D.J. and Robinson, J.B. Inkata Press, Melbourne. pp 38-99.
Rogowsky, P.M., Guidet, F.L.Y., Langridge, P., Shepherd, K.'W. and Koebner, R.M.D.
(1991). Isolation and characterisation of wheat-rye recombinants involving
chromosome ann 1DS of wheat. Theor. Appl.Genet. 822 537-544.
Rîmheld, V. (1991). The role of phytosiderophores in acquisition of iron and other
micronutrients in graminaceous species: an ecological apptoach.In; Iron Nutrition and
Interactions in Plants. Eds Chen, Y. and Hadar, Y. Kluwer Academic Publishers,
Dordrecht, Boston, London. pp 159-166.
Rothrock, C.S. (19S7). Take-all of wheat as affected by tillage and wheat-soybean
doublecropping. Soil Biol. Biochem. 19: 307-311.
l2rRovira, 4.D., Graham, R.D. and Ascher, J.S. (1985). Reduction in infection of wheat roots
by Gaeumannomyces graminis var. tritici with application of manganese to soil.
1z; Ecolosy and Manasement of Soilbome Plant Pathogens. Eds. Parker, C.4.,
Rovira, 4.D., Moore, K.J., Wong, P.T.W. and Kollmorgen, J.F. Am. Phytopathol.
Soc. St. Paul, Minnesota. pp 212-214.
Rovira, A.D. and Venn, N.R. (1985). Effect of rotation and tillage on take-all and rhizoctonia
root rot. 1n: Ecology and Management of Soilbome Plant Pathosens. Eds. Parker,
C.4., Rovira,4.D., Moore, K'J.,'Wong, P.T'W. and Kollmorgen' J.F' Am'
Pþtopathol. Soc. St Paul, Minnesota. pp 255-258.
Sadasivan, T.S. (1965). Effect of mineral nutrients on soil micro-organisms and plant
disease. In: Ecolosy of Soil-bome Pathogens. Eds. Baker, K.F. and Snyder,
W.C. Proc. Int. Symp., Berkeley, CA. 1963. Univ. California Press, Berkeley, CA.
pp 460-470
Sambrook, J., Fritsch, E.F. and Maniatis, T. Eds. (1989).In: Molecular clonins: a laboratory
manual. (2nd Ed.) Cold Spring Harbour Laboratory Press.
Samuel, G. (1924). Take-all investigations. 11. J. Dept. Agric., South Aust. 27: 1134-1147.
Samuel, G. Piper, C.S. (192S). Grey speck (manganese deficiency) disease of oats. J.
Agric. S. Aust. 3ll 696-7 05;, 789-7 99.
Schulze, D.G., M'Cay-Buis, T., Sutton, S.R. and Huber, D.M. (1995)' Manganese
oxidation states in Gaeumannomyces-infested wheat rhizospheres probed by
micro-XANES spectroscopy. Phytopathology 85 : (9) 990 -99 4.
Scott, P.R. and Hollins, T.V/. (19S5). Role of plant breeding in controlling soil-borne diseases
of cereals. 1¡¿. Ecolosv and of Soil-borne Plant Pathogens. Eds. Parker,
C.4., Rovira, A.D. Moore, K.J.,'Wong, P.T.W. and Kollmorgen, J.F. Amer'
Phytopathol. Soc., St Paul, Minnesota. pp 157-I59.
Scott, P.R., Hollins, T.W. and Gregory, R.S. (19S5). Relative susceptibility of wheat, rye and
triticale to isolates of take-all. 1n. Ecolosv and Manasement of Soil-borne Plant
Pathogens. Eds. Parker, C.4., Rovira,4.D., Moore, K.J., Wong, P.T.V/. and
Kollmorgen, J.F. Am. Phytopathol. Soc., St. Paul, Minnesota. pp 180-185.
122
Scott-Craig, J.S., Kerby, K.8., Stein, B.D. and Somerville, S.C. (1995). Expression of an
extracellular peroxidase that is induced in barley (Hordeum vulgare) by the powdery
mildew pathogen (Erysiphe graminis f. sp. hordel). Physiological and Molecular
Plant Pathology. 47 : 407 -418.
Siddique, K.H.M., Belford, R.K. and Tennant, D. (1990). Root : shoot ratios of old and
modern, tall and semi-dwarf wheats in a mediterranean environment. Plant Soil.
121: 89-98.
Skou, J.P. (1931). Morphology and cytology of infection process In: Bioloey and Control of
Take-all. Eds. Asher, M.J.C. and Shipton, P.J. Academic Press, London, pp 175-198
Stone, A.T. and Morgan, J.J. (19S4). Reduction and dissolution of manganese (III) and
manganese (IV) oxides by organics: 2. Survey of the reactivity of organics. Environ.
Sci. Technol. l8z 617-624.
Su, C. and Oliw, E.H. (1996). Purifrcation and characteÅzation of linoleate 8-dioxygenase
from the fungus Gaeumannomyces graminis as a novel hemoprotein. J. Biol. Chem.
2722 l4lI2-I4lI8.
Su, C. and Oliw, E.H. (199S). Manganese lipoxygenase purification and characterization.
J. Biol. Chem. 273:13072-13079.
Taylor, D.M. Morgan, P.W., Joham, H.E. and Amin, J.V. (1963). Influence of substrate and
tissue manganese on the IAA-oxidase system in cotton. Plant Physiol. 43: 243-247.
Thompson, D.M., Chalmers, K.'Waugh, R., Forster,8.P., Thomas, W.T.B., Caligari, P.D.S.
and Powell, W. (1991). The inheritance of genetic markers in microspore-derived
plants of barley Hordeumvulgare L. Theor. Appl.Genet. 8lz 487-492.
Thornton, C.R., Dewey, F.M. and Gilligan, C.A. (1991). Production and characterization of
a monoclonal antibody raised against surface antigens from mycelium of
Gaeumannomyces graminis var. tritici; evidence for an extracellular polyphenol
oxidase. Phytopathology. 87: (l) 123-131.
Timonin, M.I. (1946). Microflora of the rhizosphere in relation to the manganese deficiency
disease of oats. Soil Sci. Soc. Am. Proc. 11: 284-292.
Tinker, P.B. and Gilden, A. (1983). Mycorrhizal fungi and ion uptake 1n: Metals and
Micronutrients: Uptake and Utilization by Plants. Eds. Robb, D'4. and Pierpoint,
W.S. Academic Press Inc., London. pp 28-30.
r23
Trudgill, D.L. (1986). Concepts of resistance, tolerance and susceptibility in relation to cyst
nematodes.In: cyst Nematodes. Eds. Lamberti, F. and Taylor, c.E. Plenum Press,
New York. pp 179-187.
lJren, N.C. (1981). Chemical reduction of an insoluble higher oxide of manganese by plant roots.
J. Plant Nutr. 4: 65-7L
lJren, N.C., Asher, J.C. and Longnecker, N.E. (1938). Techniques for research on manganese in soil-
plant systems. In;Manganese in Soil and Plants. Eds. Graham, R.D., Hannam, R.J. and
lJren, N.C. Kluwer Academic Publishers, Dordrecht, The Netherlands.
Vose, P.B. and Griffiths, D.J. (1961). Manganese and magnesium in the grey speck syndrome
of oats. Nature 191: p 299-300.
VoS, P., Hogers, R., Bleeker, M, Reijans, M., van de Lee, T., Homes, M., Frijters, 4., Pot, J.'
Peleman, J., Kuiper, M. and zabeau, M. (1995). AFLP: a ne\ry technique for DNA
fingerprinting. Nucleic Acids Res. 23: (21) 4407-4414.
'Walker, J. (1931). Taxonomy of take-all fungus and related genera and species. In: Biology
and Control of Take-all. Eds. Asher, M.J.C. and Shipton, P.J. Academic Press,
London. p 15-74.
Wallace, H.R. (1987). A perception of tolerance. Nematologica 33: 419-432
V/allwork, H. (1996). Cereal Root and Crown Diseases. Kondinin Group, SARDI,
Adelaide. pp 61.
Waugh, R., Bonar, N., Baird, E., Thomas,8., Graner, A. Hayes, P. and Powell, W. (1997).
Homology of AFLP products in three mapping populations of barley. Molecular and
General Genetics. 255: (3) 3ll-321.
V/ebb, A.J. and Dell, B. (1990). Effect of manganese supply on development of wheat
(Triticum aestivum) roots.ln: Plant Nutrition-Physiology and Application. Ed. van
Beusichem, M.L. Kluwer Academic Publishers, The Netherlands. pp 235-239.
Webb, A.J. and Graham, R.D. (1990). Supra-optimal manganese suppresses the effect of
Geaumannomyces graminis var. tritici on grain yield of wheat. Paper 4. 14. Australian
Agronomy Conference, Perth. pp 569.
Webb, M.J., Dinkelaker, B.E. and Graham, R.D. (1993a). The dynamic nature of plant-
available manganese during storage of a calcareous soil. Biol. Fertil. Soils. 15: 9-15.
t24
V/ebb, M.J., Norvell, W.4., Vy'elch, R.M. and Graham, R.D. (1993b). Using a chelate-
buffered nutrient solution to establish the critical solution activity of Mn2* required
by barley (Hordeum vulgare L.)' Plant Soil 153: 195-205.
Wehrle, V.M. and Ogilvie, L. (1955). Effect of ley grasses on the carry-over of take-all.
Plant Pathol. 4: 1 I 1-1 13.
'Welch, R.M. (1995). Micronutrient nutrition of plants. Crit. Rev. Plant Sci. 14: 49-82'
Western, J.H. (1971). Diseases of Crop Plants. Macmillan, London.
Wilhelm, N.S., Graham, R.D. and Rovira, A.D. (1937). Manganese suppresses the take-all
disease of wheat by increasing the plant's internal resistance to the penetration of the
fungal hyphae into the root. Symposium Section 24.Proc. XIV Int. Bot. Congr.,
Berlin. 26 July-l Aug. 1987. Koeltz Sci. Books, Konigstein, Germany.
Wilhelm, N.S., Graham, R.D. and Rovira, A.D. (19SS). Application of different sources of
manganese sulphate decreases take-all (Gaeumannomyces graminis var. tritici) of
wheat grown in a manganese def,rcient soil. Aust. J. Agric. Res. 39: 1-10.
'Wilhelm, N.S., Graham, R.D. and Rovira, A.D. (1990). Control of Mn status and infection
rate by genotype of both host and pathogen in the wheat take-all interaction.
Plant Soil l23z 267-275.
Wilhelm, N.S. (1991). Investigation in to Ggt infection of manganese deficient wheat.
Ph.D thesis, University of Adelaide.
'wong, P.T.W. (19S3). Take-all of wheat. Agfact, Dept. Agric., New South wales.
P3.48.10.
Wood, M. J. and Robson, A.D. (1934). Effect of copper deficiency in wheat on the
infection of roots by Gaeumannomyces graminis var. tritici. Aust. J. Agric. Res.
352 735-742.
Xynos, F.P., Klos, D.J., Hamilton, P.D., Schuette, V., Huygens, P. and Fernandez-Pol, J.A'
(lgg4). Expression of metallopanstimulin in condylomata acuminata of the female
anogenital region induced by papilloma virus. Anticancer Res. 14: 773-786.
Zar,S.H. Ed. (19S4). Biostatistical Analysis 2nd Ed. Prentice-Hall International Editions.
Zhang, G.Y., Guo, Y., Chen, S.L. and Chen, S.Y. (1995). RFLP tagging of a salt tolerance gene
inrice. Plant Sci. ll0z22l-234.
t25Zarcinas,B.A., Cartwright, B. and Spouncer, L.R. (19S7). Nitric acid digestion and multi-
element analysis of plant material by inductively coupled plasma spectrometry.
Commun. Soil Sci. PlantAnal. 18: 131-146.
Zivy,M.,Devaux, P., Blaisonneau, J., Jean, R. and Thiellement, H. (1992). Segregation
distortion and linkage studies in microspore-derived double haploids lines of Ëlordeum
vulgare L. Theor. Appl. Genet. 83:919-924.
Zobel, R.V/. (1975). The genetics of root development.In: The Develooment and Function of
Roots. Eds. Torrey, J.G.and Clarkson, D.T. London: Academic Press. pp26l-275.