manganese oxide-based nanocomposite...
TRANSCRIPT
MANGANESE OXIDE-BASED NANOCOMPOSITE
ELECTRODES FOR SUPERCAPACITORS
RUSI
THESIS SUBMITTED IN FULFILMENT OF THE
REQUIREMENT FOR THE DEGREE OF DOCTOR OF
PHILOSOPHY
FACULTY SCIENCE
UNIVERSITY OF MALAYA
KUALA LUMPUR
2016

ii
UNIVERSITI MALAYA
ORIGINAL LITERARY WORK DECLARATION
Name of Candidate: RUSI (I.C/Passport No: A5809715)
Registration/Matric No: SHC120094
Name of Degree: DOCTOR OF PHILOSOPHY
Title of Project Paper/Research Report/Dissertation/Thesis (“this Work”):
MANGANESE OXIDE-BASED NANOCOMPOSITE ELECTRODES FOR
SUPERCAPACITORS
Field of Study: ADVANCED MATERIALS
I do solemnly and sincerely declare that:
(1) I am the sole author/writer of this Work
(2) This Work is original;
(3) Any use of any work in which copyright exists was done by way of fair
dealing and for permitted purposes and any excerpt or extract from, or
reference to or reproduction of any copyright work has been disclosed
expressly and sufficiently and the title of the Work and its authorship have
been acknowledged in this Work;
(4) I do not have any actual knowledge nor do I ought reasonably to know that
the making of this work constitutes an infringement of any copyright work;
(5) I hereby assign all and every rights in the copyright to this Work to the
University of Malaya (“UM”), who henceforth shall be owner of the
copyright in this Work and that any reproduction or use in any form or by
any means whatsoever is prohibited without the written consent of UM
having been first had and obtained;
(6) I am fully aware that if in the course of making this Work I have infringed
any copyright whether intentionally or otherwise, I may be subject to legal
action or any other action as may be determined by UM.
Candidate’s Signature: Date:
Subscribed and solemnly declared before,
Witness’s Signature: Date:
Name:
Designation:
iii
ABSTRACT
The increasing demands on energy have led to environmental issues and the
depletion of fossil fuels. The intense research on energy storage and conversion has
attracted much attention for future technology development. Batteries have become
a choice for energy storage devices in many applications. However, expanding
markets are pushing for alternative pulse batteries that offer high power and long
cycle life. Inspired by this, supercapacitors have attracted growing interest due to
their high power density, long cycle life, and fast charging rate, which display great
potential in complimenting or even replacing batteries in many applications. The
research work in this project concentrates on improving the specific capacitance or
energy density of nanostructure composite metal oxides electrodes, namely oxides
of manganese, nickel and cobalt (MnO2, MnO2/NiO and Mn3O4/NiO/Co3O4) with
porous texture morphology. First, MnO2 was deposited on top of stainless steel by
simple chronopotentiometry electrodeposition method with various manganese
acetate tetrahydrate (Mn(CH3COO)2·4H2O) concentrations in deposition solution.
The optimum performance was obtained using 0.01 M Mn(CH3COO)2·4H2O. In
order to enhance the specific capacitance of MnO2 electrode, the NiO was
incorporated into the MnO2 electrode by adding different concentrations of nickel
acetate tetrahydrate (Ni(CH3COO)2·4H2O) mixed with 0.01 M
Mn(CH3COO)2·4H2O. The optimum performance of MnO2-NiO electrode was
obtained using the deposition solution containing 0.25 M Ni(CH3COO)2·4H2O
mixed with 0.01 M Mn(CH3COO)2·4H2O. The optimum MnO2-NiO electrode was
further studied in different electrodeposition modes and different CV’s cycles. The
work proceeded by adding different concentrations of cobalt ion into 0.01 M
Mn(CH3COO)2·4H2O mixed with 0.25 M Ni(CH3COO)2·4H2O concentration. The
iv
effect of the addition of different cobalt ion concentrations was explored and the
obtained Mn3O4-NiO-Co3O4 ternary electrode exhibited optimum specific
capacitance of 7404 F g-1 with high energy and power density of 1028 Wh kg-1 and
99 kW kg-1 respectively at current density of 20 A g-1 in 0.5 M potassium hydroxide
(KOH)/0.04 M potassium ferrocyanide (K3Fe(CN)6) mixture electrolyte. Lastly, the
electrochemical performance of supercapacitors were enhanced by incorporating
MnO2 electrode with carbon based composite (reduce graphene oxide
(RGO)/glucose carbon). The incorporation of RGO/glucose carbon into MnO2
electrode increased the electrical conductivity of the electrode. The introduction of
D (+) glucose into the deposition solution slowed down the nucleation process of
MnO2 particles and led to uniform and ultrathin nanoflakes structure. The optimized
electrode exhibited low transfer resistance and resulted in excellent electrochemical
performance in three electrolyte systems viz. sodium sulfate (Na2SO4), KOH and
KOH/K3Fe(CN)6 electrolytes. The optimum specific capacitance obtained was
13,333 F g-1 with energy density and power density of 1851 Wh kg-1 and 68
kW kg-1 respectively at current density of 20 A g-1 in mixed 0.5 M KOH/0.04 M
K3Fe(CN)6 electrolyte. The preparation of electrodes in this work using
electrodeposition method is simple, low-cost, and environmental-friendly. It holds
great potential to produce cost-effective and high energy density supercapacitors.
v
ABSTRAK
Penggunaan tenaga yang semakin meningkat telah membawa kepada isu-isu
alam sekitar dan pengurangan bekalan bahan api fosil. Penyelidikan yang intensif
terhadap penyimpanan dan penukaran tenaga telah menarik banyak perhatian
penyelidik untuk pembangunan teknologi masa depan. Bateri telah menjadi pilihan
sebagai peranti penyimpanan tenaga dalam banyak aplikasi. Akan tetapi, pasaran
yang berkembang lebih cenderung memilih bateri yang memiliki kuasa yang tinggi
dan kitaran hidup panjang. Berinspirasikan isu ini, minat dalam penyelidikan
superkapasitor telah meningkat kerana ciri-ciri seperti ketumpatan kuasa tinggi,
kitaran hidup panjang, dan kadar pengisian cepat yang dimiliki oleh peranti ini
memainkan peranan penting dalam menggantikan bateri pada banyak aplikasi.
Kerja-kerja penyelidikan dalam projek ini tertumpu kepada peningkatan kapasitan
spesifik atau ketumpatan tenaga oleh elektrod oksida logam komposit yang
berstruktur nano, seperti oksida logam daripada mangan, nikel, kobalt (MnO2,
MnO2 / NiO dan Mn3O4 / NiO / Co3O4) dengan bertekstur poros. Pertama, MnO2
dideposit melapisi bahagian atas keluli tahan karat dengan kaedah
kronopotensimetri elektrodeposit. Pencapaian elektrod yang optimum telah
diperolehi dengan menggunakan larutan deposit mangan asetat tetrahidrat
(Mn(CH3COO)2·4H2O) berkepekatan 0.01 M. Untuk meningkatkan kapasitan
spesifik elektrod MnO2, NiO telah dikompositkan ke dalam elektrod MnO2 dengan
menambah kepekatan nikel asetat tetrahidrat (Ni(CH3COO)2·4H2O) yang berbeza
dalam 0.01 M Mn(CH3COO)2·4H2O sebagai larutan deposit. Pencapaian elektrod
yang optimum daripada MnO2-NiO telah diperolehi apabila larutan deposit
mengandungi 0.25 M Ni(CH3COO)2·4H2O bercampur dengan 0.01 M
Mn(CH3COO)2·4H2O. Elektrod MnO2-NiO ini dikaji dengan lebih lanjut
vi
menggunakan mod pengelektrodepositan yang berbeza dan kajian kitaran melalui
kaedah kitaran voltametri. Kajian ini diteruskan lagi dengan menambah ion kobalt
berbeza kepekatan ke dalam 0.01 M Mn(CH3COO)2·4H2O yang telah dicampurkan
0.25 M Ni(CH3COO)2·4H2O. Kesan penambahan ion kobalt yang berbeza
kepekatan telah dikaji dan elektrod komposit yang diperolehi daripada Mn3O4-NiO-
Co3O4 memiliki kapasitan spesifik optimum 7404 F g-1 dengan ketumpatan tenaga
dan ketumpatan kuasa yang tinggi iaitu 1028 Wh kg-1 dan 99 kW kg-1 pada
ketumpatan arus 20 A g-1 dalam elektrolit 0.5 M KOH/0.04 M K3Fe(CN)6. Akhir
sekali, teknik yang berbeza digunakan untuk meningkatkan pencapaian elektrokimia
superkapasitor dengan mengkomposit elektrod MnO2 dengan karbon komposit
(RGO / karbon glukosa). Komposit RGO/karbon glukosa dalam elektrod MnO2
boleh meningkatkan kekonduksian elektrik elektrod. Pencampuran glukosa D (+)
dalam larutan deposit boleh melambatkan proses penukleusan zarah MnO2 dan
membawa kepada struktur deposit yang teratur dan sangat tipis. Elektrod yang telah
dioptimum menghasilkan rintangan pemindahan yang rendah dan memberikan
aktiviti elektrokimia yang bagus dalam tiga sistem elektrolit iaitu, Na2SO4, KOH
dan KOH/K3Fe(CN)6. Elektrod MnO2/RGO memiliki kapasitan spesifik 13333
F g-1 dengan ketumpatan tenaga dan ketumpatan kuasa masing-masing 1851
Wh kg-1 dan 68 kW kg-1 pada ketumpatan arus 20 A g-1 dalam campuran elektrolit
0.5 M KOH/0.04 M K3Fe(CN)6. Penggunaan kaedah pengelektrodepositan bagi
penyediaan elektrod dalam projek ini merupakan kaedah yang mudah, murah, dan
mesra alam yang mempunyai potensi besar untuk menghasilkan superkapasitor
dengan kos efektif dan berketumpatan tenaga tinggi.
vii
LIST OF PUBLICATIONS
Articles published in ISI-cited journals which are related to this thesis:
1. Rusi, & Majid, S. R. (2013). Synthesis of MnO2 particles under slow cooling
process and their capacitive performances. Materials Letters, 108, 69-71.
2. Rusi, & Majid, S. R. (2014). Controllable synthesis of flowerlike α-MnO2
as electrode for pseudocapacitor application. Solid State Ionics, 262, 220-
225.
3. Rusi, & Majid, S. R. (2014). High performance super-capacitive behaviour
of deposited manganese oxide/nickel oxide binary electrode system.
Electrochimica Acta, 138,1-8.
4. Rusi, & Majid, S. R. (2015). Electrodeposited Mn3O4-NiO-Co3O4 as a
composite electrode material for electrochemical capacitor. Electrochimica
Acta, 175, 193-201.
5. Rusi, Chan, P. Y., & Majid, S. R. (2015). Layer by Layer Ex-Situ Deposited
Cobalt-Manganese Oxide as Composite Electrode Material for
Electrochemical Capacitor. PLoS ONE, 10(7), e0129780.
6. Rusi, & Majid, S.R. (2015). Green synthesis of in situ electrodeposited
rGO/MnO2 nanocomposite for high energy density supercapacitors.
Scientific Reports, 5, (16195).
7. Rusi, & Majid, S.R. (2016). Effects of electrodeposition mode and
deposition cycle on binary manganese-nickel oxide electrode for
electrochemical capacitor. PLoS ONE, 11(5), e0154566.
viii
Articles submitted and under review in ISI-cited journals:
1. Rusi, Sim, C.K., & Majid, S.R. (2016). Morphology-controlled PANI
electrode by deposition scan rate studies with H2SO4/PVA polymer
electrolyte for electrochemical capacitor. Submitted to Journal of Colloid
and Interface Science.
Papers presented:
1. Rusi, & Majid S.R. (27 May 2013). Poly(vynilpyrrolidone) / poly
(vinylidenefluoride-co hexafluoropropylene) – Magnesium
trifluoromethanesulfonate gel polymer electrolytes for electrochemical
double layer capacitor. Oral presented at the 2013 international Conference
on Advanced Capacitors (ICAC-2013), Osaka, Japan.
2. Rusi, & Majid, S.R. (7 June 2013). Controllable synthesis of flowerlike α-
MnO2 as electrode for pseudocapacitor application. Poster presented at the
19th International Conference on Solid State Ionics, Kyoto, Japan.
3. Rusi, & Majid, S.R. (8 January 2014). Controllable synthesis of flowerlike
α-MnO2 as electrode for pseudocapacitor application. Poster presented at
the 9th Mathematics and Physical Sciences Graduate Congress 2014 (9TH
MPSGC), University of Malaya, Kuala Lumpur.
4. Rusi, & Majid, S.R. (13 June 2015). Green synthesis of in situ
electrodeposited rGO/MnO2 nanocomposite for high energy density
supercapacitors. Poster presented at International Conference on
Nanotechnology, Nanomaterials & Thin Films for Energy Applications
(NANOENERGY), Manchester, UK.

ix
ACKNOWLEDGEMENTS
First of all, I would like to show my deepest respect and most sincere
gratitude to my supervisor Assoc. Prof Dr. Siti Rohana Majid for her continues
guidance, advice, patience and warm encouragement. She imparts her knowledge
and experience to me and gives me good suggestions in my experiments, manuscript
and thesis preparation.
I thank my fellow members of Center Ionics University of Malaya (CIUM)
Dr. Jun Hieng Kiat, Dr. Woo Haw Jiunn, Dr.Sim Lina, Dr. Liew Chiam Wen, Dr.
Teo Li phing, Auyong Chee meng, Chan Pei Yi, Sim Cheng Kim, Tey Jin Ping,
Shah and the rest for their laughter, advices, support and friendship through the
years. I also thank lab assistance, Mr. Ismail for helping me in purchase any research
materials.
My acknowledgments are also extended to all technicians and officers of
University of Malaya for their efforts in helping me to accomplish my research
works. I am also grateful to university for the Bright Sparks scheme scholarship
award and IPPP program (grant no. PG 010-2013A) for the financial support.
Lastly, my deepest gratitude goes towards my beloved my family, Tzu Chi
family and partner for their endless love, pray, support and motivation in numerous
way.
x
TABLE OF CONTENTS
Original literary work of declaration ii
Abstract iii
Abstrak v
List of Publications vii
Acknowledgements ix
Table of Contents x
List of Figures xiv
List of Tables xix
List of Abbreviations xx
Chapter 1: Introduction to the thesis
1.1 Background 1
1.2 Objectives of research 3
1.3 Organization of thesis 4
Chapter 2: Literature review
2.1 Introduction and historical prospective 6
2.2 Overview of supercapacitor 8
2.2.1 Electrical double layer capacitor (EDLC) 8
2.2.2 Pseudocapacitor 10
2.2.3 Hybrid capacitor 11
2.2.4 Parameters of supercapacitor 12
2.2.5 Comparison of battery and supercapacitor 13
2.3 Electrode Materials 14
2.3.1 Carbon materials 15
2.3.2 Faradic materials 17
2.3.2.1 Conducting polymers 17
2.3.2.2 Transition Metal oxides 20
2.3.3 Composite manganese oxide based electrode 21
2.3.3.1 Single manganese oxide electrode 21
2.3.3.2 Binary manganese oxide-nickel oxide electrode 31
2.3.3.3 Ternary manganese oxide-nickel oxide-cobalt oxide
electrode
2.3.4 Composite carbon-MnO2 electrode 37
35
xi
2.4 Summary 41
Chapter 3: Methodology
3.1 Introduction 42
3.2 Materials and preparation 43
3.2.1 Electrodes 43
3.2.2 Materials 44
3.3 Electrode preparation for manganese based electrode 44
3.3.1 Electrodeposition of MnO2 electrode 45
3.3.2 Electrodeposition of MnO2-NiO electrode 45
3.3.3 Electrodeposition of Mn3O4-NiO-Co3O4 electrode 46
3.3.4 Electrodeposition of RGO-MnO2 with glucose carbon electrode 47
3.4 Materials characterization and electrochemical test 48
3.4.1 Materials Characterization 48
3.4.1.1 X-ray diffraction (XRD) 48
3.4.1.2 Field-emission scanning electron microscopy
(FESEM) and energy dispersive X-ray spectroscopy
(EDX)
3.4.1.3 Transmission electron microscopy (TEM) 50
3.4.1.4 Thermogravimetric analysis (TGA) 51
3.4.1.5 Raman spectroscopy 51
3.4.2 Electrochemical test 52
3.5 Summary 54
Chapter 4: Manganese oxide electrode system
4.1 Introduction 55
4.2 Results and discussion 56
4.2.1 Optimization of Mn(CH3COO)2.4H2O concentration 56
4.2.1.1 Schematic illustration of electrodeposited MnO2
electrode
4.2.1.2 Characterization of composition and morphology of
MnO2 electrodes
4.2.1.3 Electrochemical performance of MnO2 electrodes
in KOH electrolyte
4.3 Summary 65
49
56
57
64
xii
Chapter 5: The studies of MnO2-NiO binary electrode system
5.1 Introduction 66
5.2 Results and discussion 67
5.2.1 Optimization of Ni(CH3COO)2.4H2O concentration mix with
0.01 M of Mn(CH3COO)2.4H2O for deposition electrolyte
solution
5.2.1.1 Characterization of composition and morphology of
MnO2-NiO electrode
5.2.1.2 Electrochemical performance of MnO2-NiO
electrode in Na2SO4 electrolyte
5.2.2 Effects of electrodeposition modes of MnO2-NiO electrode 78
5.2.2.1 Characterization of composition and morphology 78
5.2.2.2 Electrochemical performance of MnO2-NiO
electrode in Na2SO4 electrolyte
5.2.3 Effect of electrodeposition cycle of deposited MnO2-NiO
electrode by using cyclic voltammetry mode
5.2.3.1 The morphology studies of MnO2-NiO 82
5.2.3.2 Electrochemical performance of MnO2-NiO in
Na2SO4 electrolyte
5.2.3.3 Electrochemical performance of optimum MnO2-NiO
(CY4) electrode in various electrolytes
5.3 Summary 94
Chapter 6: The studies of Mn3O4-NiO-Co3O4 ternary electrode system
6.1 Introduction 96
6.2 Results and discussion 97
6.2.1 Optimization of CoSO4.7H2O concentration for Mn3O4-NiO-
Co3O4 electrode system
6.2.1.1 Characterization of composition and morphology of
Mn3O4-NiO-Co3O4 electrode
6.2.1.2 Electrochemical performance of Mn3O4-NiO-Co3O4
electrode in Na2SO4 electrolyte
6.2.1.3 Electrochemical performance of Mn3O4-NiO-Co3O4
electrode in various electrolytes
6.3 Summary 110
67
72
80
82
89
97
97
103
106
67
84
xiii
Chapter 7: The studies of RGO-MnO2 based nanocomposite electrode
system
7.1 Introduction 112
7.2 Results and discussion 113
7.2.1 Optimization of RGO-MnO2 electrode by varied the ratio of
GO:Mn(CH3COO)2.4H2O in deposition electrolyte solution
7.2.1.1 Schematic illustration of electrodeposited RGO-
MnO2 electrode
7.2.1.2 The composition and morphology studies of RGO-
MnO2 electrode
7.2.1.3 Electrochemical performance of RGO-MnO2
electrode in Na2SO4 electrolyte
7.2.2 Optimization of D(+)glucose content in deposition
electrolyte solution for RGO-MnO2-glucose carbon electrode
system
7.2.2.1 The composition and morphology studies of RGO-
MnO2-glucose carbon electrode
7.2.2.2 Electrochemical performance of RGO-MnO2-
glucose carbon electrode in Na2SO4 electrolyte
7.2.2.3 Electrochemical performance of RGO/MnO2-
glucose carbon electrode in various electrolytes
7.3 Summary 134
Chapter 8: Conclusions and suggestions for future work
8.1 Conclusions 135
8.2 Suggestions for future work 141
References 142
119
122
123
128
130
113
114
113
xiv
LIST OF FIGURES
Figure Caption Page
Figure 1.1 Ragone plot (specific power vs. specific energy) for
various electrochemical energy storage devices.
2
Figure 2.1 Chronology of capacitor history. 6
Figure 2.2 Schematic of Leyden Jar. 7
Figure 2.3 Charging and discharging electrical double-layer
capacitor.
8
Figure 2.4 Different types of redox mechanism in pseudocapacitor:
(a) underpotential deposition, (b) redox
pseudocapacitance, (c) intercalation pseudocapacitance.
10
Figure 2.5 The specific capacitance performance of different
electrode materials for both EDLC electrodes and
pseudocapacitor electrodes.
15
Figure 2.6 (a) CV and (b) CDC for carbon aerogels electrode. 16
Figure 2.7 Schematic visualization of Ppy’s conduction mechanism. 18
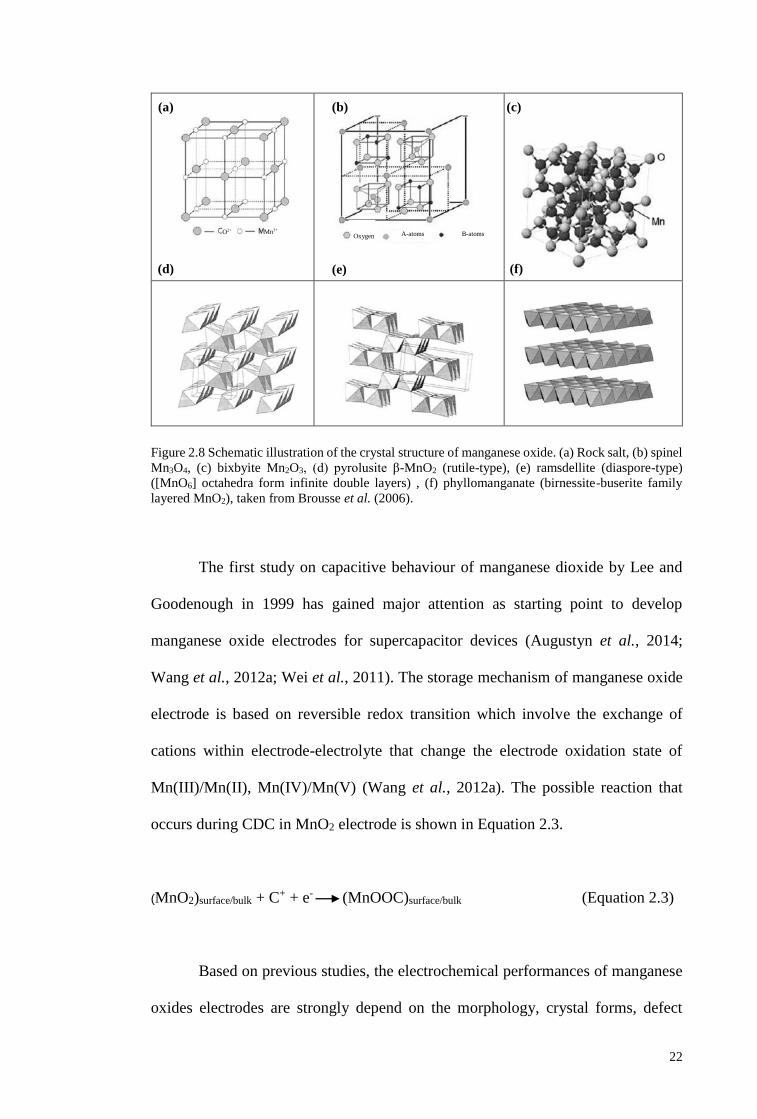
Figure 2.8 Schematic illustration of the crystal structure of
manganese oxide. (a) Rock salt, (b) spinel Mn3O4, (c)
bixbyite Mn2O3, (d) pyrolusite β-MnO2 (rutile-type), (e)
ramsdellite (diaspore-type) ([MnO6] octahedra form
infinite double layers) , (f) phyllomanganate (birnessite-
buserite family layered MnO2).
22
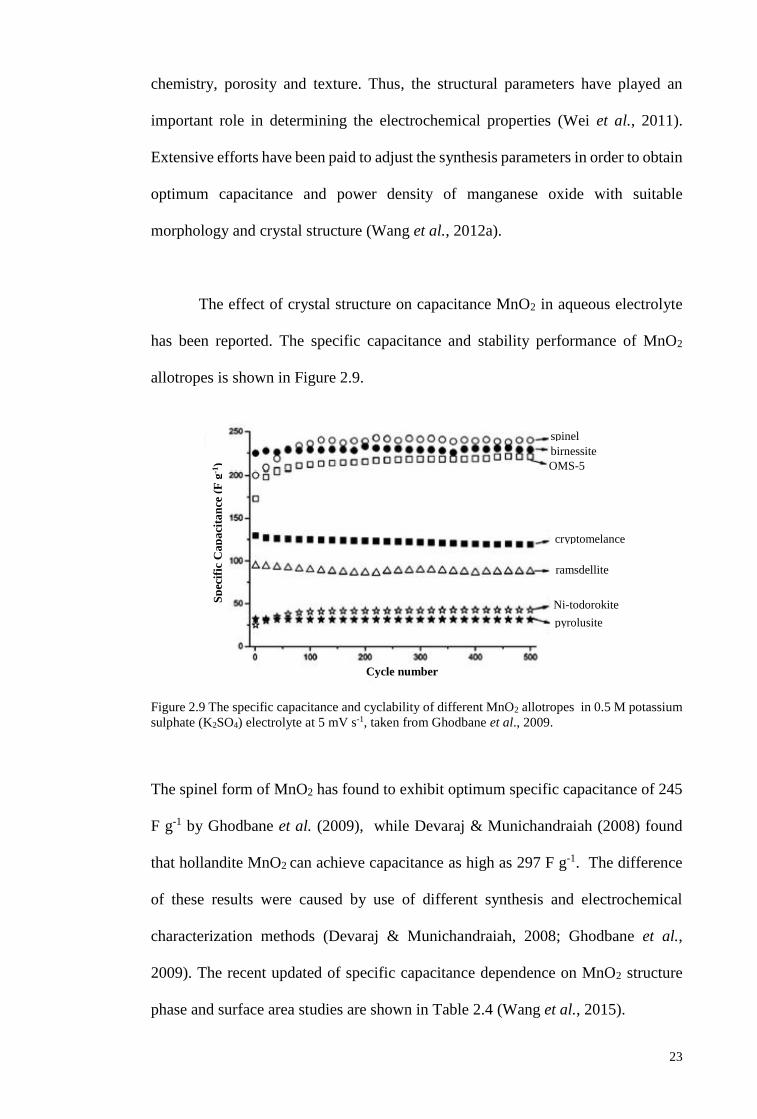
Figure 2.9 The specific capacitance and cyclability of different MnO2
allotropes in 0.5 M K2SO4 electrolyte at 5 mV s-1.
23
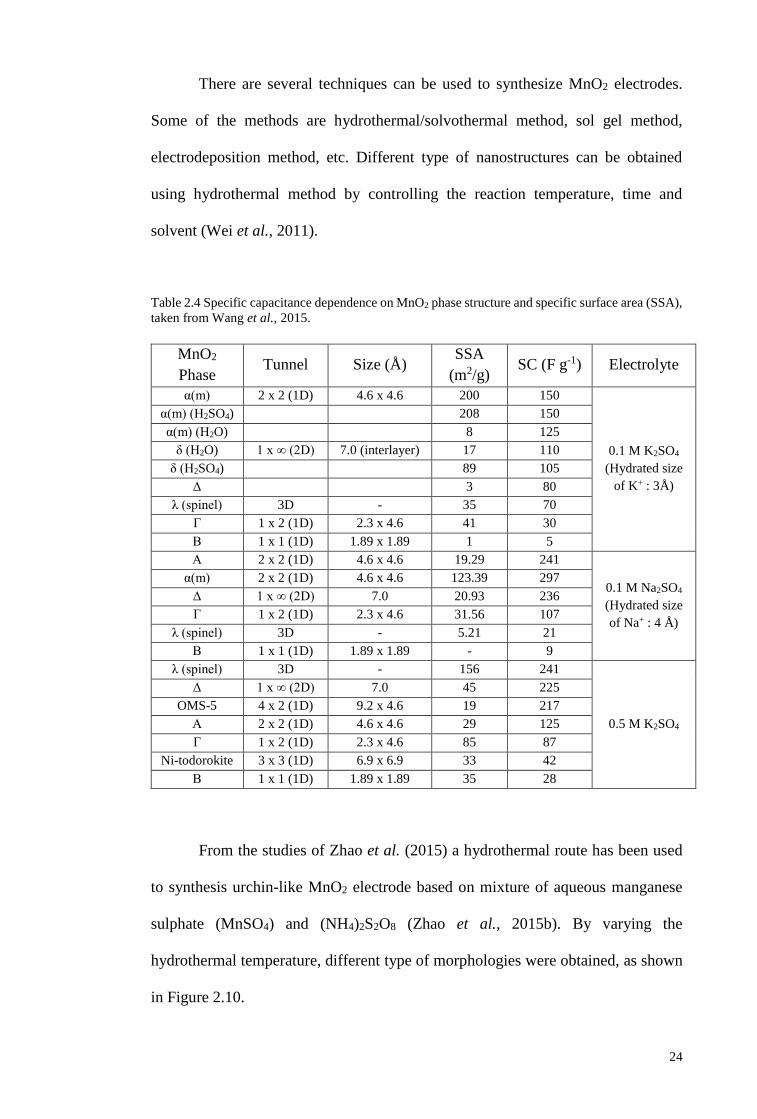
Figure 2.10 SEM images of low magnification (a,c and e) and high
magnification (b,d and f) of urchin-like MnO2 powders
synthesized at different temperatures: (1) a and b, 80°C;
(2) c and d, 110 °C and (3) e and f, 140 °C.
25
Figure 2.11 SEM images of low magnification (a and c) and high
magnification (b and d) of hierarchical MnO2 nanoflowers
synthesized at different concentrate: (1)
n(KMnO4):n(KCl) = 1:3; (2) n(KMnO4):n(KCl) = 3:1.
26
Figure 2.12 (a) Lower and (b) higher magnification SEM images of α-
MnO2 nanowire coated on CFP, c) TEM and (d) HRTEM
images of prepared α-MnO2 nanowire, (e) SAED pattern.
26
Figure 2.13 CV of α-MnO2/CEP electrode and bare CFP in 1 M
Na2SO4 electrolyte at scan rate of 10 mV s-1.
27
Figure 2.14 SEM images of: (a-c) as-prepared silkworm cocoon-like
MnO2 micropowders; (d) MnO2 nanosilks from MnO2
micropowders.
27
xv
Figure 2.15 (a) SEM images of MnO2, (b) CV curve of MnO2 electrode
in 2 M (NH4)2SO4 aqueous solution at scan rate of 10 mV
s-1.
28
Figure 2.16 SEM and cross-section images of deposited manganese
oxide prepared from: (a) 0.003 M Mn(CH3COO)2 solution
at 0.25 mA cm−2; (b) 0.005 M; (c) 0.007 M; (d) 0.01 M;
(e) 0.02 M; (f) 0.03 M Mn(CH3COO)2 solution at 5 mA
cm−2 for 10 min (T = 60 C and pH = 7.5).
29
Figure 2.17 FESEM images of 0.02 M, 0.05 M, 0.1 M, 0.2 M and 0.5
M MnSO4·H2O.
30
Figure 2.18 CV of different composite electrodes, scan rate: 10mV s-1,
(a) MnO2; (b) NiO; (c) 5% NiO; (d) 10% NiO; (e) 25%
NiO; (f) 20% NiO; and (g) 15% NiO.
32
Figure 2.19 Scanning electron micrographs of (a) MnO2, (b) Ni-Mn-O
and transmission electron micrograph of (c) MnO2, (d) Ni-
Mn-O synthesized via the hydrothermal process at 125 °C
for 3 h.
33
Figure 2.20 (a) AFM image of NMO, (b) TEM image of NMO
prepared by a potentiodynamic method at a scan rate of
200 mV s-1.
34
Figure 2.21 SEM images of: (a) Ni1/3Co1/3Mn1/3(OH)2 and (b)
Ni0.37Co0.63(OH)2.
35
Figure 2.22 Cyclability of the MNCO nanowire array at a current
density of 2 A g−1 (vs Ag/AgCl).
36
Figure 2.23 SEM images of (a, b) the hydroxide precursor and (c, d)
the MNCO nanowire array.
36
Figure 2.24 Illustrative fabrication process of the composite electrode
and SEM image of as coated MnO2-graphene.
38
Figure 2.25 FESEM images using deposition duration of: (a) 10
minutes, (b) 13 minutes and (c) 18 minutes.
39
Figure 2.26 (a) Schematics for MnOx/CNT/RGO nanohybrid
fabrication via Routes I and II. Route II includes a plasma
functionalization step prior to MnOx deposition. (b) SEM
image of the CNT/RGO supporting layer, with RGO
highlighted by dotted lines. (c) Low- and (d) high-
magnification SEM images of MnOx nanoparticles
deposited on a CNT/RGO layer.
40
Figure 3.1 Electrodeposition set up. 44
Figure 3.2 Deposited electrode of: (a) 0.01 M of section 3.2.1, (b)
NiO-15 of section 3.2.2 (c) 0.15 M of section 3.2.3.
47
Figure 3.3 Bragg diffraction by crystal plane. The path different
between beams 1 and 2 is BD+DC= 2AD sin θ.
49
Figure 4.1 Illustration of electrodeposited MnO2. 56
xvi
Figure 4.2 (a) XRD pattern of all electrodes on top of SS, (b) XRD
pattern of scrapped off deposits from 0.01 M electrode, (c)
EDX of 0.01 M electrode, (d) EDX of plain SS.
58
Figure 4.3 FESEM images of: (a) 0.0025 M, (b) 0.005 M, (c) 0.01 M,
(d) thickness of 0.01 M, (e) 0.02 M, (f) TEM image of 0.01
M electrode and (g) lattice spacing of deposited MnO2.
60
Figure 4.4 (a) CV curves of all deposited electrode at 0.5 M KOH
electrolyte, (b) CV of scan rate dependent of 0.01 M
electrode, (c) the specific capacitance against scan rate
plot, (d) CDC curve at applied constant current of 1 mA.
63
Figure 4.5 Cycling performance of 0.01 M electrode in 0.5 M KOH
electrolyte at current density of 1 A g-1.
64
Figure 5.1 XRD patterns of (a) empty stainless steel and all deposited
electrode on top of SS, (b) powder of NiO-25 which was
scraped off from stainless steel (c) EDX of the NiO-25
deposited powder.
68
Figure 5.2 FESEM images of: (a) NiO-15, (b) NiO-20, (c) NiO-25,
(d) NiO-30 and (e) NiO-40.
70
Figure 5.3 TEM images of (a) NiO-15, (b) NiO-25, (c) NiO-30, and
(d) lattice fringes of NiO-25 deposited film.
72
Figure 5.4 (a) Nyquist plots of the all deposited electrodes, (b) CDC
profiles of all deposited electrodes at a current density of
1 A g–1, (c) CV curves of all deposited at scan rate of 1 mV
s-1, (d) CV curves of NiO-25 at wide operation potential
range of -1 V until 1 V at different scan rates, (e) specific
capacitance of NiO-25 at wide operation potential range of
-1 until 1 V at different scan rates.
75
Figure 5.5 Specific capacitance retention at scan rate of 10 mV s–1 in
0.5 M Na2SO4 electrolyte with potential range of -1 to 1 V.
77
Figure 5.6 (a) XRD pattern of the deposited powder using different
electrodeposition modes.
78
Figure 5.7 FESEM (left) and TEM (right) images from: (a) CP, (b)
CA, (c) CY7.
79
Figure 5.8 CV profiles of deposited electrodes using different
electrodeposition modes in Na2SO4 electrolyte.
81
Figure 5.9 FESEM images of : (a) CY4, (b) CY7, (c) CY10, (d) CY13
(e) TEM images of CY4 electrode (inset: lattice spacing).
83
Figure 5.10 (a) CV curves at a scan rate of 5 mV s-1, (b) CDC profile
at a current density of 1 A g-1 in a voltage range of -
0.6 V to 1 V, (c) Specific capacitance calculated from
discharge curve and deposit mass over deposition cycle.
85
Figure 5.11 (a) Nyquist plot of all electrodes in frequency range from
10 mHz to 100 kHz at Na2SO4 electrolyte, (b) Bode plots
of frequency dependence on the impedance magnitude
(Z); (c) Bode plots of frequency dependence on phase
88
xvii
angle (), (d) Specific capacitance retention until the
1000th cycle in 0.5 M Na2SO4 electrolyte with potential
range of -1 to 1 V.
Figure 5.12 CV curve of CY4 at scan rate of 5 mV s-1 within potential
range of -0.5 V to 0.5 V at : (a) 0.5 M Na2SO4, (b) 0.5 M
KOH, (c) mix 0.5 M KOH/0.04 M K3Fe(CN)6 and (d) 0.04
M K3Fe(CN)6 electrolyte.
91
Figure 5.13 (Schematic of the role of hexacyanoferrate (II) and (III) in
the process of: (a) charge and (b) discharge of CY4
electrode.
92
Figure 5.14 CDC profiles of CY4 electrode at: (a) current density of
20 A g-1 in three different electrolytes and (b) different
applied current densities in mix KOH/K3Fe(CN)6
electrolyte.
93
Figure 5.15 Specific capacitance retention after 1500th cycle at scan
rate of 10 mV s-1 in potential range of -0.5 V to 0.5 V.
93
Figure 6.1 (XRD pattern for (a) all deposited electrode on the SS, (b)
deposited powder of 0.15 M scraped off from SS, (c) EDX
of deposited powder.
99
Figure 6.2 FESEM images of: (a) 0.05 M, (b) 0.1 M, (c) 0.15 M, (d)
0.15 M (cross-section), (e) 0.2 M and (f) 0.3 M.
101
Figure 6.3 TEM images of: (a) 0.1 M, (b) 0.15 M and (c) the lattice
fringes of 0.15 M deposited film.
103
Figure 6.4 (a) CV curves of all electrodes at scan rate of 5 mV s-1
(inset: graph of calculated specific capacitance), (b) CDC
profiles for electrodes at current density of 1 A g-1 (inset:
graph of calculated specific capacitance), (c) impedance
spectra for all electrodes.
105
Figure 6.5 CV curve of 0.15 M electrode in voltage range of -0.5 V
to 0.5 V at scan rate of 5 mV s-1 in: (a) 0.5 M Na2SO4
electrolyte, (b) 0.5 M KOH electrolyte, (c) 0.04 M
K3Fe(CN)6 electrolyte, (e) 0.5 M KOH/0.04 M K3Fe(CN)6
electrolyte.
108
Figure 6.6 CDC profiles of 0.15 M electrode at different current
densities in: (a) 0.5 M KOH electrolyte, (b) 0.5 M
KOH/0.04 M K3Fe(CN)6 electrolyte, (c) electrochemical
stability of electrode in three different electrolytes, (d)
0.15 M electrode after 1800 cycles in 0.5 M KOH/0.04 M
K3Fe(CN)6 electrolyte.
110
Figure 7.1 A schematic illustration of RGO-MnO2 mechanism via
electrodeposition.
114
Figure 7.2 XRD pattern of: (a) M30, M60, and M90 on top of SS, (b)
scraped-off deposits powder of M30, M60, and M90; (c)
Raman spectroscopy of selected electrodes.
116
xviii
Figure 7.3 EDX spectrum of: (a) empty SS, (b) MnO2 without GO,
(c) M30.
116
Figure 7.4 FESEM morphology images and cross section thickness
of: (a1, a2) pristine MnO2, (b1, b2) M30, (c1, c2) M60, and
(d1, d2) M90.
118
Figure 7.5 TEM images of: (e) M30 and (f) M60. 119
Figure 7.6 (a) CV curve in 0.5 M Na2SO4 electrolyte at a scan rate of
5 mV s-1 of: pristine MnO2, M30, M60, and M90, and (b)
Nyquist plot of: (c) M30, M60, and M90.
121
Figure 7.7 A schematic illustration of RGO-MnO2 mechanism via
electrodeposition: (a) without glucose and (b) with
glucose.
122
Figure 7.8 (a) XRD pattern of G01, G03 and G06 electrode, (b) The
Raman spectroscopy of G01, G03 and G06 electrode, (c)
deconvolution of M30 G03 in the range of 1000 to 1800
cm-1, (d) deconvolution of G03 in the range of 1000 to
1800 cm-1, (e) EDX result of G03 electrode, (f) TGA of D-
(+)-glucose.
125
Figure 7.9 FESEM morphology images and cross section of: (a1, a2)
G01, (b1, b2) G03, (c1, c2) G06.
126
Figure 7.10 TEM images of G03 M in: (a) low-magnification, (b) high-
magnification.
128
Figure 7.11 (a) CV curve in 0.5 M Na2SO4 electrolyte at a scan rate of
5 mV s-1 of G01, G03, and G06, and (b) Nyquist plot of
G01, G03, and G06.
129
Figure 7.12 CV curve of G03 at a scan rate of 5 mV s-1 within potential
scan of -0.5 V to 0.5 V in : (a) 0.5 M Na2SO4, (b) 0.5 M
KOH, (c) 0.04 M K3Fe(CN)6, and (d) 0.5 M KOH/0.04 M
K3Fe(CN)6 electrolyte solution.
132
Figure 7.13 (a) CDC curve of G03, and (b) the cyclability test of G03
electrode in three different electrolytes.
133
xix
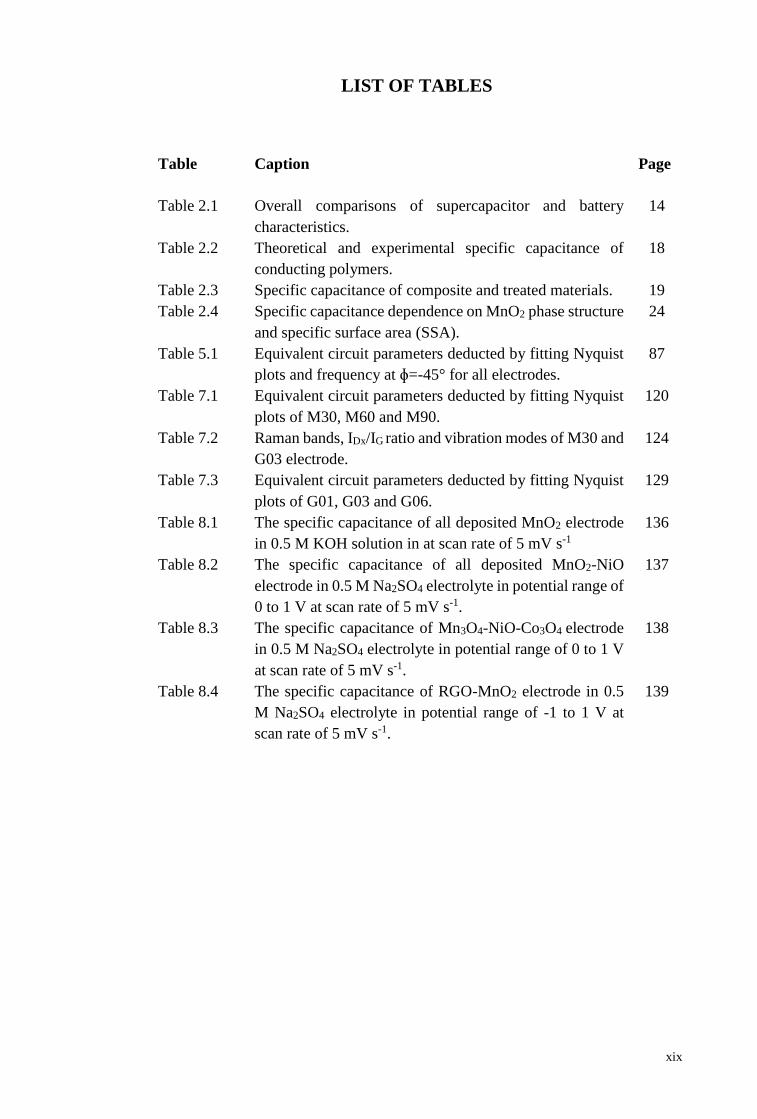
LIST OF TABLES
Table Caption Page
Table 2.1 Overall comparisons of supercapacitor and battery
characteristics.
14
Table 2.2 Theoretical and experimental specific capacitance of
conducting polymers.
18
Table 2.3 Specific capacitance of composite and treated materials. 19
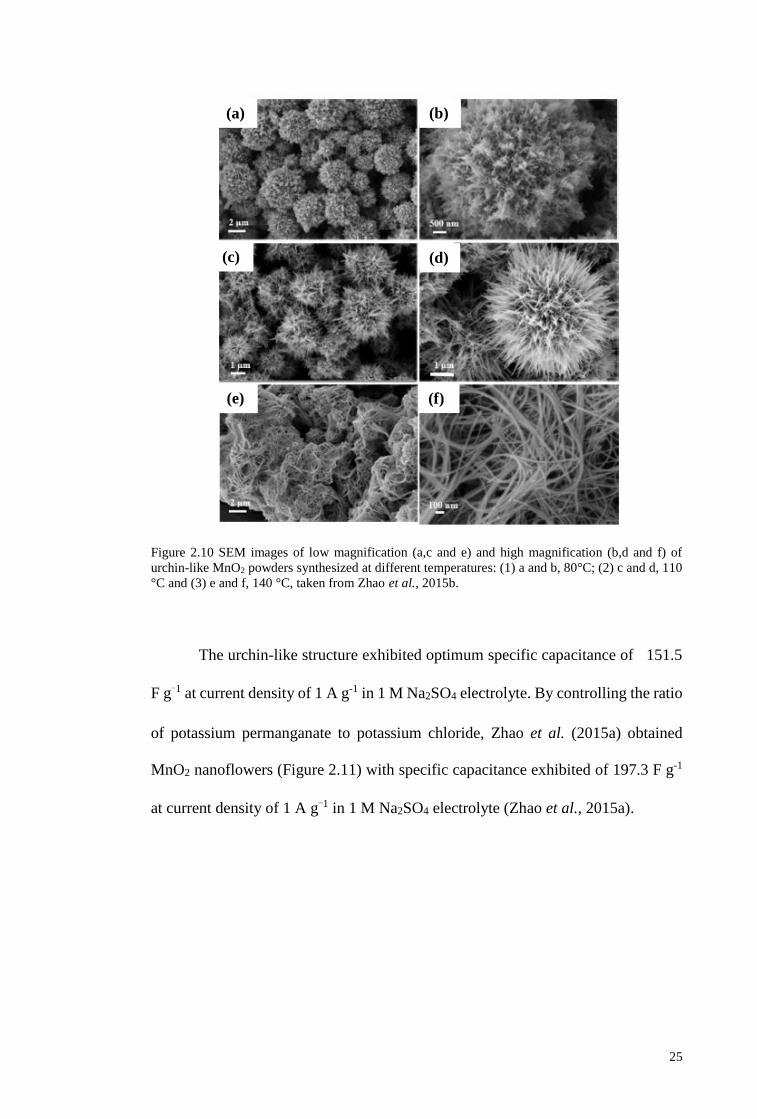
Table 2.4 Specific capacitance dependence on MnO2 phase structure
and specific surface area (SSA).
24
Table 5.1 Equivalent circuit parameters deducted by fitting Nyquist
plots and frequency at ɸ=-45° for all electrodes.
87
Table 7.1 Equivalent circuit parameters deducted by fitting Nyquist
plots of M30, M60 and M90.
120
Table 7.2 Raman bands, IDx/IG ratio and vibration modes of M30 and
G03 electrode.
124
Table 7.3 Equivalent circuit parameters deducted by fitting Nyquist
plots of G01, G03 and G06.
129
Table 8.1 The specific capacitance of all deposited MnO2 electrode
in 0.5 M KOH solution in at scan rate of 5 mV s-1
136
Table 8.2 The specific capacitance of all deposited MnO2-NiO
electrode in 0.5 M Na2SO4 electrolyte in potential range of
0 to 1 V at scan rate of 5 mV s-1.
137
Table 8.3 The specific capacitance of Mn3O4-NiO-Co3O4 electrode
in 0.5 M Na2SO4 electrolyte in potential range of 0 to 1 V
at scan rate of 5 mV s-1.
138
Table 8.4 The specific capacitance of RGO-MnO2 electrode in 0.5
M Na2SO4 electrolyte in potential range of -1 to 1 V at
scan rate of 5 mV s-1.
139
xx
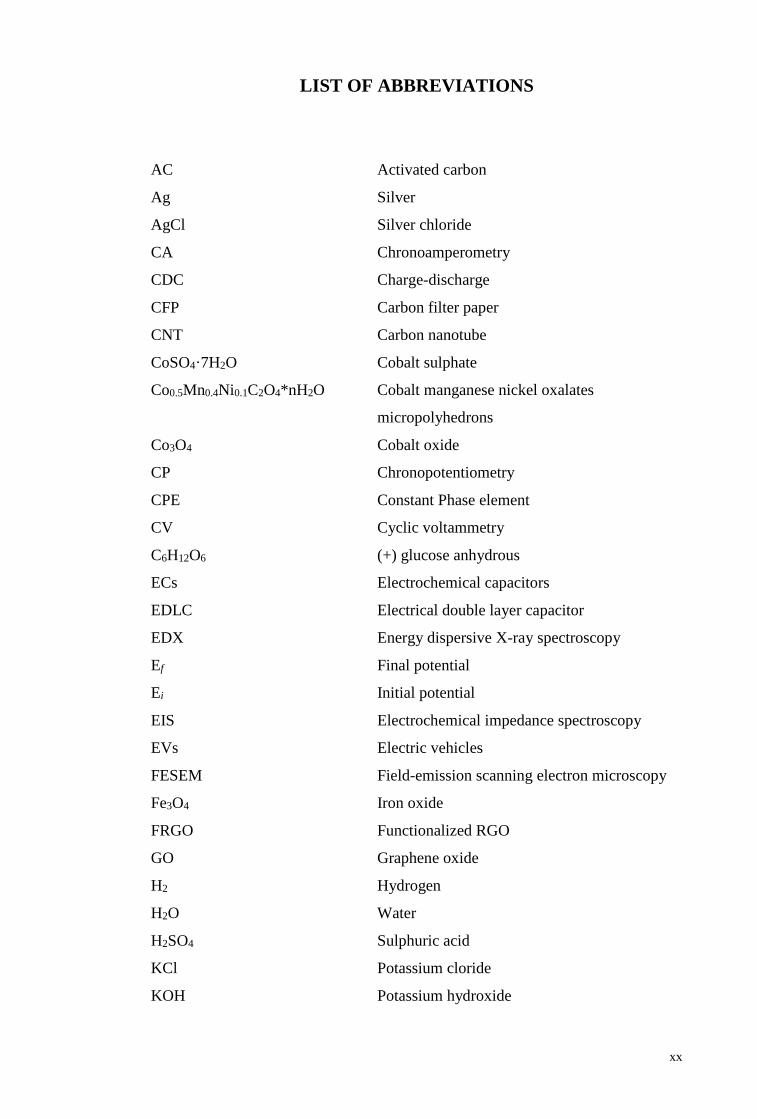
LIST OF ABBREVIATIONS
AC Activated carbon
Ag Silver
AgCl Silver chloride
CA Chronoamperometry
CDC Charge-discharge
CFP Carbon filter paper
CNT Carbon nanotube
CoSO4·7H2O Cobalt sulphate
Co0.5Mn0.4Ni0.1C2O4*nH2O Cobalt manganese nickel oxalates
micropolyhedrons
Co3O4 Cobalt oxide
CP Chronopotentiometry
CPE Constant Phase element
CV Cyclic voltammetry
C6H12O6 (+) glucose anhydrous
ECs Electrochemical capacitors
EDLC Electrical double layer capacitor
EDX Energy dispersive X-ray spectroscopy
Ef Final potential
Ei Initial potential
EIS Electrochemical impedance spectroscopy
EVs Electric vehicles
FESEM Field-emission scanning electron microscopy
Fe3O4 Iron oxide
FRGO Functionalized RGO
GO Graphene oxide
H2 Hydrogen
H2O Water
H2SO4 Sulphuric acid
KCl Potassium cloride
KOH Potassium hydroxide
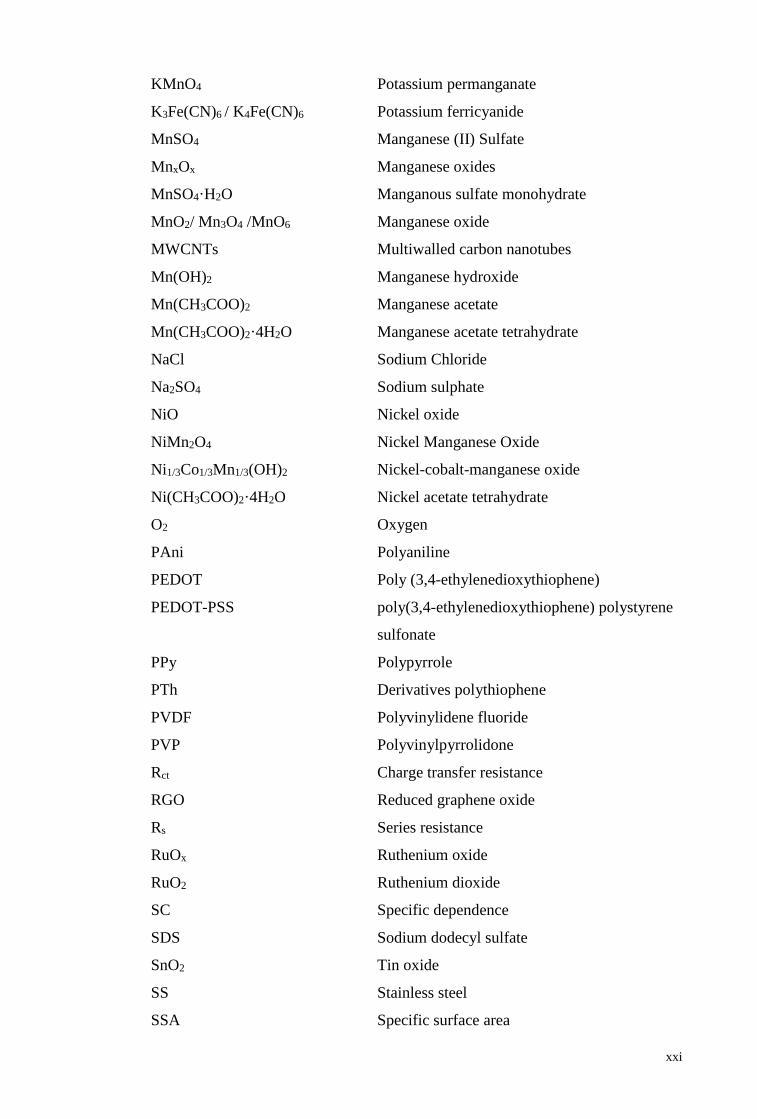
xxi
KMnO4 Potassium permanganate
K3Fe(CN)6 / K4Fe(CN)6 Potassium ferricyanide
MnSO4 Manganese (II) Sulfate
MnxOx Manganese oxides
MnSO4·H2O Manganous sulfate monohydrate
MnO2/ Mn3O4 /MnO6 Manganese oxide
MWCNTs Multiwalled carbon nanotubes
Mn(OH)2 Manganese hydroxide
Mn(CH3COO)2 Manganese acetate
Mn(CH3COO)2·4H2O Manganese acetate tetrahydrate
NaCl Sodium Chloride
Na2SO4 Sodium sulphate
NiO Nickel oxide
NiMn2O4 Nickel Manganese Oxide
Ni1/3Co1/3Mn1/3(OH)2 Nickel-cobalt-manganese oxide
Ni(CH3COO)2·4H2O Nickel acetate tetrahydrate
O2 Oxygen
PAni Polyaniline
PEDOT Poly (3,4-ethylenedioxythiophene)
PEDOT-PSS poly(3,4-ethylenedioxythiophene) polystyrene
sulfonate
PPy Polypyrrole
PTh Derivatives polythiophene
PVDF Polyvinylidene fluoride
PVP Polyvinylpyrrolidone
Rct Charge transfer resistance
RGO Reduced graphene oxide
Rs Series resistance
RuOx Ruthenium oxide
RuO2 Ruthenium dioxide
SC Specific dependence
SDS Sodium dodecyl sulfate
SnO2 Tin oxide
SS Stainless steel
SSA Specific surface area

xxii
SWCNTs Single-walled carbon nanotubes
TEM Transmission electron microscopy
TGA Thermogravimetric analysis
VO/V2O5 Vanadium oxide
W Warburg impedance
XRD X-ray diffraction
ǀZǀ Impedance magnitude
ɸ Phase angle
1
CHAPTER 1: INTRODUCTION
1.1 Background
Today world population is increasing and reaches its 7 billion mark, the
energy usage will also increase. The increasing demand on energy will definitely
lead to environmental issues and depletion of fossil fuels oil. Thus, the urgent need
for efficient, clean and sustainable energy source with new energy conversion and
storage devices are needed (Wang et al., 2012a).
Renewable energy production from sun and wind have rapidly growth as
well as the development of electric vehicles (EVs) with low carbon. Since the
renewable source from sun and wind are both intermittent, electrochemical storage
devices such as rechargeable batteries and supercapacitors (which also known as
electrochemical capacitors (ECs)) are very important to store energy during off-peak
which make the electricity of technologies can smooth out when it operates. Energy
storage devices have attracted much attention for future technologies (Wei et al.,
2011).
Lithium batteries have been widely used in many electronic devices such as
mobile phones, laptops and hybrid vehicles because of their high energy density
with sustainable power supply (Figure 1.1). Supercapacitors / ECs may not have
energy density as high as lithium ion batteries but the development of
supercapacitors with combination of high power and reasonable energy density may
create another landmark in industries and become a versatile solutions to a variety
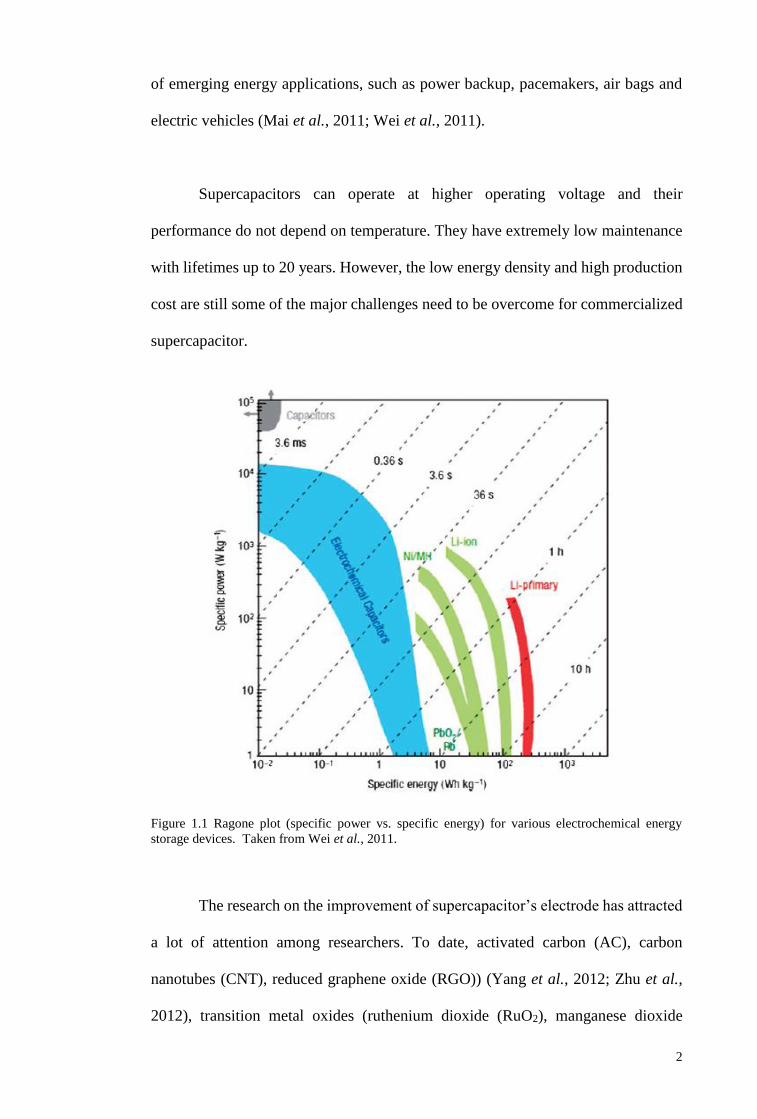
2
of emerging energy applications, such as power backup, pacemakers, air bags and
electric vehicles (Mai et al., 2011; Wei et al., 2011).
Supercapacitors can operate at higher operating voltage and their
performance do not depend on temperature. They have extremely low maintenance
with lifetimes up to 20 years. However, the low energy density and high production
cost are still some of the major challenges need to be overcome for commercialized
supercapacitor.
Figure 1.1 Ragone plot (specific power vs. specific energy) for various electrochemical energy
storage devices. Taken from Wei et al., 2011.
The research on the improvement of supercapacitor’s electrode has attracted
a lot of attention among researchers. To date, activated carbon (AC), carbon
nanotubes (CNT), reduced graphene oxide (RGO)) (Yang et al., 2012; Zhu et al.,
2012), transition metal oxides (ruthenium dioxide (RuO2), manganese dioxide
3
(MnO2), nickel oxide (NiO), cobalt oxide (Co3O4) (Wang et al., 2010b; Wei et al.,
2011) and conducting polymers (polypyrrole (PPy), polyanaline (PAni), poly(3,4-
ethylenedioxythiophene) polystyrene sulfonate (PEDOT-PSS) and polythiophene)
(Alvi et al., 2011; Snook et al., 2011) have been recognized as the most promising
materials for supercapacitors. In recent years, many researchers have focused on
transition metal oxides materials due to its fast faradic reaction. Ruthenium oxide
(RuOx) has been found to have a good electrochemical performance. However, its
high cost and high toxicity have restricted its further applications. Therefore, the
research spotlight has turned towards inexpensive metal oxides such as MnO2, NiO,
Co3O4 and vanadium oxide (VO) (Wei et al., 2011). The electrochemical
performance of those inexpensive metal oxide electrodes are significantly affected
by their morphologies and porous texture. Hence, the design of morphology with
great porous texture is one of the great interests to develop high performance of
supercapacitor.
1.2 Objectives of research
MnO2 is one of the promising materials which can replace ruthenium oxide
due to its average specific capacitance (~1370 F g-1), natural abundance,
environmental compatibility and low cost (Hu et al., 2011a; Xiong et al., 2013).
However, it is still hampered by its poor electrical conductivity, lack specific
capacitance and material dissolution during electrochemical cycling. Thus, making
nanocomposite MnO2 with secondary metal oxide or carbon mixing is an important
approach in enhancing the electrochemical performance (Li et al., 2012a). In this
work, the electrochemical performance of MnO2 electrode is enhanced by using
secondary metal oxide (NiO and Co3O4) and nanocomposite MnO2 with carbon
4
based (RGO-glucose carbon) electrodes. The correlation between electrode
morphologies and their electrochemical performances are systematically studied.
Our results could pave way for the future development of high performance
supercapacitor.
The objectives of this work can be listed as follows:
a) To produce high performance manganese oxide based electrode by
optimizing the concentration of metal ions in deposition electrolyte.
b) To enhance the specific capacitance and energy density of the manganese
oxide based electrode by using secondary metal oxide (NiO and Co3O4) and
compositing with carbon from glucose molecule.
c) To study the influence of various electrolytes of Na2SO4, KOH and mix
KOH/K3Fe(CN)6 on the performance of optimized electrode.
1.3 Organization of thesis
This thesis is divided into 8 main chapters. Chapter 1 begins with an
overview of supercapacitor followed by the objectives of this thesis. Chapter 2
serves to provide some background on supercapacitor and different types of metal
oxides used in this work. Chapter 3 presents a detail description on the synthesis
and material characterization methods used in this research.
Chapter 4 discussed the optimization of MnO2 electrode. The optimum
concentration of manganese acetate in deposition solution as single metal oxide
source to produce the best MnO2 electrode is reported and this work has been
published in “Rusi, Majid SR, synthesis of MnO2 particles under slow cooling
process and their capacitive performances, Materials Letters 108, 69-71 (2013)”.
5
In chapter 5, the optimization of nickel acetate concentration mixed with
0.01 M manganese acetate in deposition solution to produce best MnO2-NiO
electrode is studied and the paper has been published in “Rusi, Majid SR, high
performance super-capacitive behaviour of deposited manganese oxide/nickel oxide
binary electrode system, Electrochimica Acta 138, 1-8 (2014)”. The various
electrodeposition modes in best MnO2-NiO electrode is further investigated, the
paper has been published in “Rusi, Majid SR, effects of electrodeposition mode and
deposition cycle on binary manganese-nickel oxide electrode for electrochemical
capacitor, PLoS ONE 11(5), e0154566 (2016).
In Chapter 6, the different concentrations of cobalt ion have been added into
0.01 M manganese acetate mixed 0.25 M nickel acetate. The optimization of Mn3O4-
NiO-Co3O4 ternary electrode has been studied. This work has been published as
“Rusi, Majid SR, electrodeposited Mn3O4-NiO-Co3O4 as a composite electrode
material for electrochemical capacitor, Electrochimica Acta175, 193-201 (2015)”.
The study of MnO2 electrode composite with RGO/glucose carbon is
reported in Chapter 7. In this work, the different approaches were used to improve
the electrochemical performance of MnO2 electrode. The investigation of additional
different concentrations D (+) glucose in deposition electrolyte in MnO2/RGO
electrode is included. Chapter 7 has been published in “Rusi, Majid SR, green
synthesis of in situ electrodeposited RGO/MnO2 nanocomposite for high energy
density supercapacitors, Scientific Reports 5, 16195 (2015)”. Chapter 8 concludes
the thesis with some suggestions for future work.
6
CHAPTER 2: LITERATURE REVIEW
2.1 Introduction
2.1 Introduction and historical prospective
Energy storage devices in the form of batteries and supercapacitors are
widely used for powering the portable electronics in our society as well as in
transport sector (Augustyn et al., 2014). The usage of energy is expected to be
increased year after year. Storage devices like supercapacitor is highly expected to
reduce the over energy demand problem. It has higher power density and longer
cycle life than batteries (Feng et al., 2014; Wang et al., 2012a). Capacitor was first
made in mid of the 18th century during the period when the phenomena associated
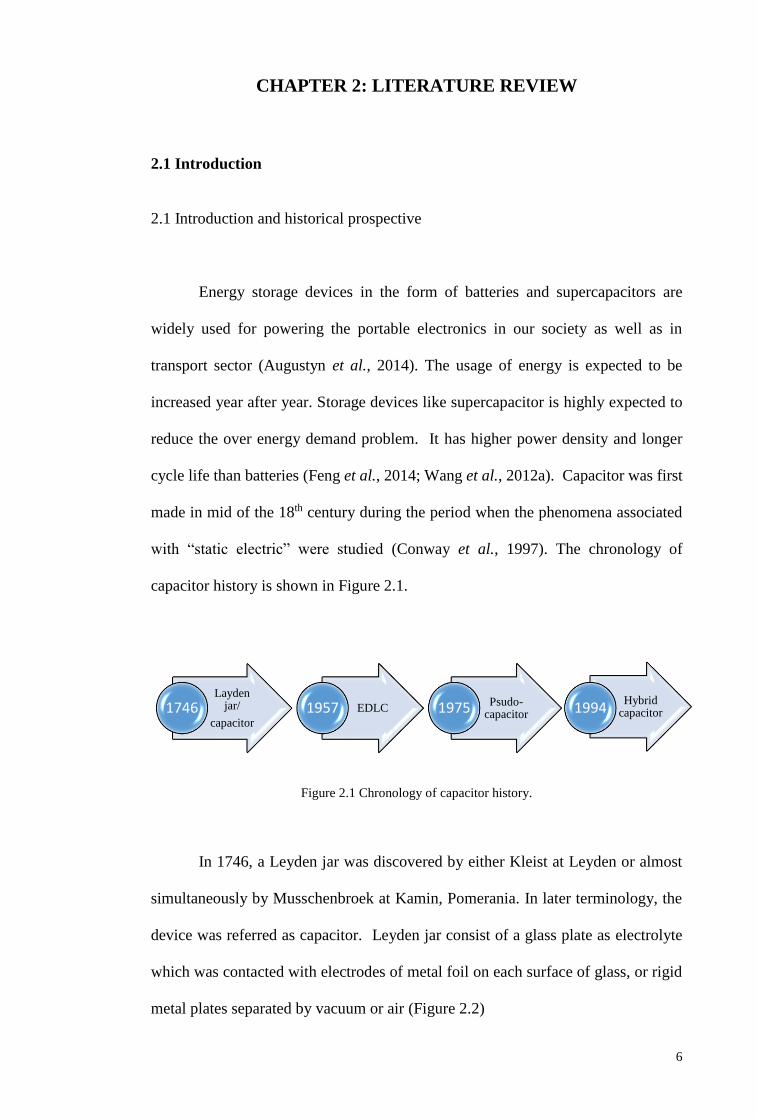
with “static electric” were studied (Conway et al., 1997). The chronology of
capacitor history is shown in Figure 2.1.
Figure 2.1 Chronology of capacitor history.
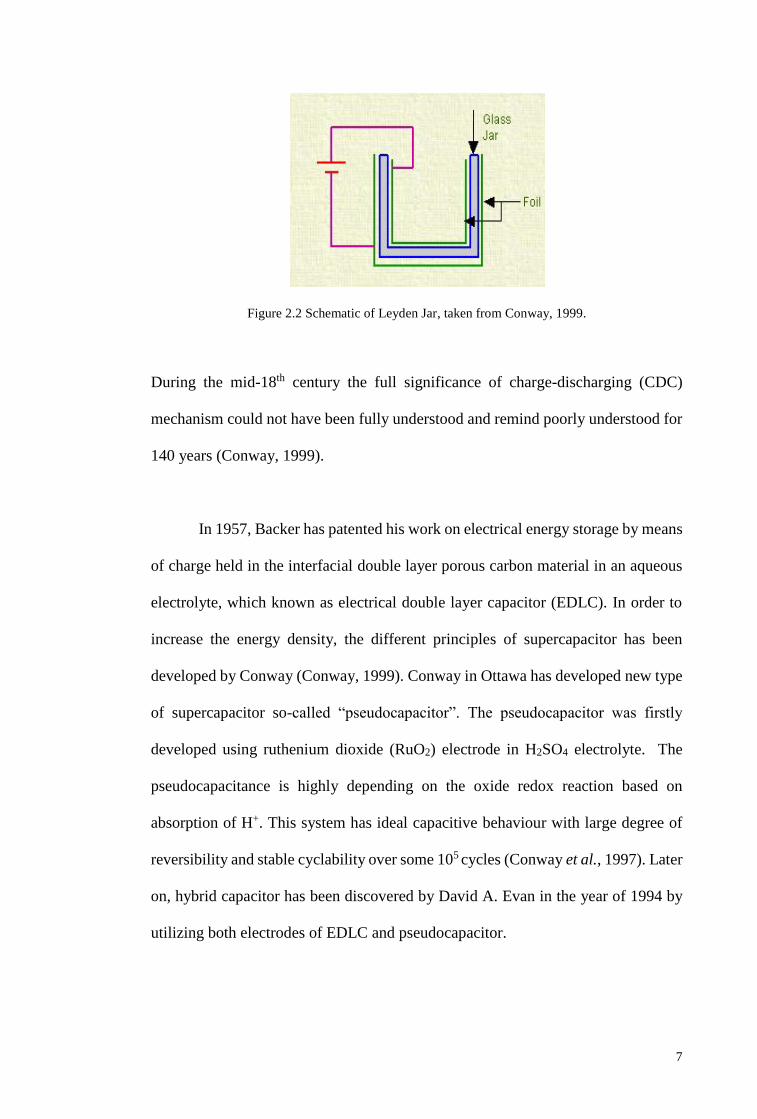
In 1746, a Leyden jar was discovered by either Kleist at Leyden or almost
simultaneously by Musschenbroek at Kamin, Pomerania. In later terminology, the
device was referred as capacitor. Leyden jar consist of a glass plate as electrolyte
which was contacted with electrodes of metal foil on each surface of glass, or rigid
metal plates separated by vacuum or air (Figure 2.2)
Layden jar/
capacitor
1746 EDLC1957 Psudo-capacitor1975
Hybrid capacitor1994
7
Figure 2.2 Schematic of Leyden Jar, taken from Conway, 1999.
During the mid-18th century the full significance of charge-discharging (CDC)
mechanism could not have been fully understood and remind poorly understood for
140 years (Conway, 1999).
In 1957, Backer has patented his work on electrical energy storage by means
of charge held in the interfacial double layer porous carbon material in an aqueous
electrolyte, which known as electrical double layer capacitor (EDLC). In order to
increase the energy density, the different principles of supercapacitor has been
developed by Conway (Conway, 1999). Conway in Ottawa has developed new type
of supercapacitor so-called “pseudocapacitor”. The pseudocapacitor was firstly
developed using ruthenium dioxide (RuO2) electrode in H2SO4 electrolyte. The
pseudocapacitance is highly depending on the oxide redox reaction based on
absorption of H+. This system has ideal capacitive behaviour with large degree of
reversibility and stable cyclability over some 105 cycles (Conway et al., 1997). Later
on, hybrid capacitor has been discovered by David A. Evan in the year of 1994 by
utilizing both electrodes of EDLC and pseudocapacitor.
8
2.2 Overview of supercapacitor
2.2.1 Electrical double layer capacitor (EDLC)
EDLC has similar design and manufacturing to batteries which consists of
two carbon based electrodes, electrolyte and a separator that electrically isolates two
electrodes (Kötz & Carlen, 2000; Wang et al., 2012a). The charge storage
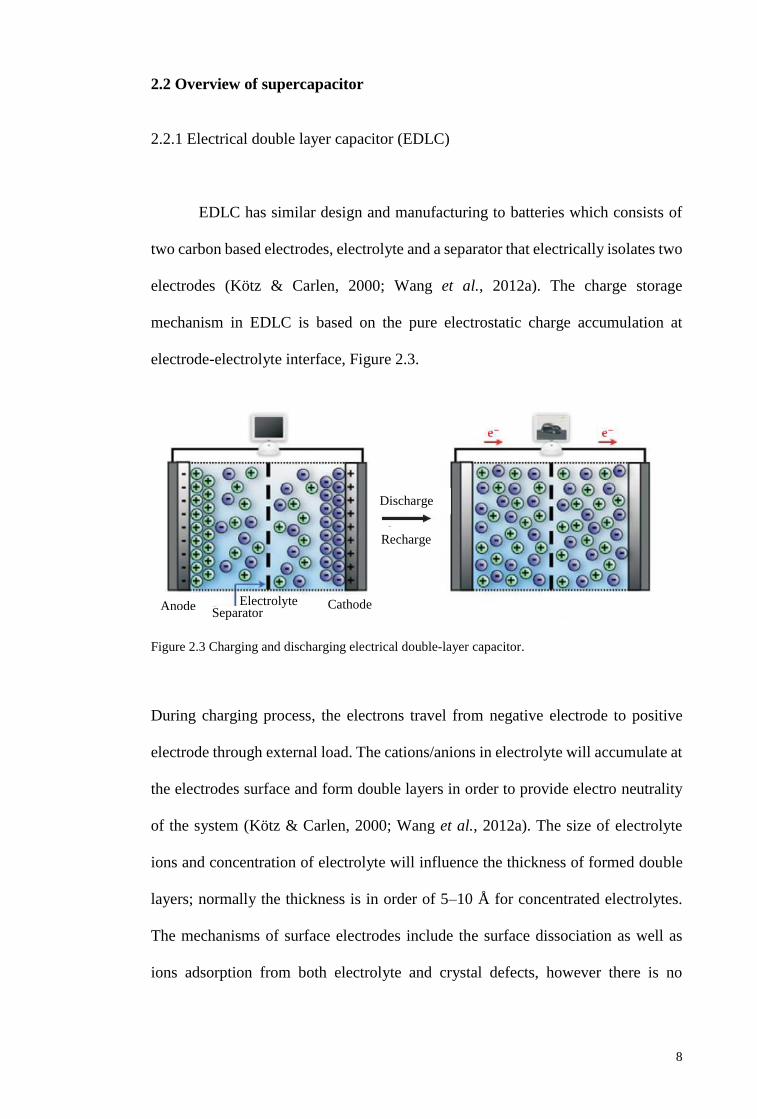
mechanism in EDLC is based on the pure electrostatic charge accumulation at
electrode-electrolyte interface, Figure 2.3.
Figure 2.3 Charging and discharging electrical double-layer capacitor.
During charging process, the electrons travel from negative electrode to positive
electrode through external load. The cations/anions in electrolyte will accumulate at
the electrodes surface and form double layers in order to provide electro neutrality
of the system (Kötz & Carlen, 2000; Wang et al., 2012a). The size of electrolyte
ions and concentration of electrolyte will influence the thickness of formed double
layers; normally the thickness is in order of 5–10 Å for concentrated electrolytes.
The mechanisms of surface electrodes include the surface dissociation as well as
ions adsorption from both electrolyte and crystal defects, however there is no
Discharge
Recharge
Anode
Separator Electrolyte Cathode
9
charges transfer or ion exchanges occur between electrolyte and electrode (Wang et
al., 2012a). In this way, the energy is stored in the double layer interface.
There are few important factors which affect the overall performance of the
devices, such as electrode, current collector, separator as well as the electrolyte.
Thus, the suitable materials are needed to use in order to produce good
supercapacitors. The carbon based materials such as activated carbon (AC), porous
carbon, carbon nanotube (CNT) and graphene oxide (GO) have been widely used in
EDLC (Obreja, 2008; Yu et al., 2013). Up to now, the best activated carbon can
achieve specific capacitance of EDLC at around 15 F g-1 , using carbon with
optimum pore size in ionic liquid electrolytes (Simon & Gogotsi, 2008). The high
surface area of graphene electrodes have gave specific capacitance in the range of
100-250 F g-1 (Augustyn et al., 2014; Tsai et al., 2013).
In summary, the use of the high surface area of carbon for electrodes will
lead to higher capacitance and energy density stored compared to conventional
capacitors (Kötz & Carlen, 2000). However the energy density is still much lower
than batteries. Most commercially available EDLC devices can store energy density
between 3 to 6 Wh kg-1 (Augustyn et al., 2014; Obreja, 2008). Thus, the
involvement of redox reaction mechanism in electrode is used to overcome the low
specific capacitance problem (Conway,1999).
10
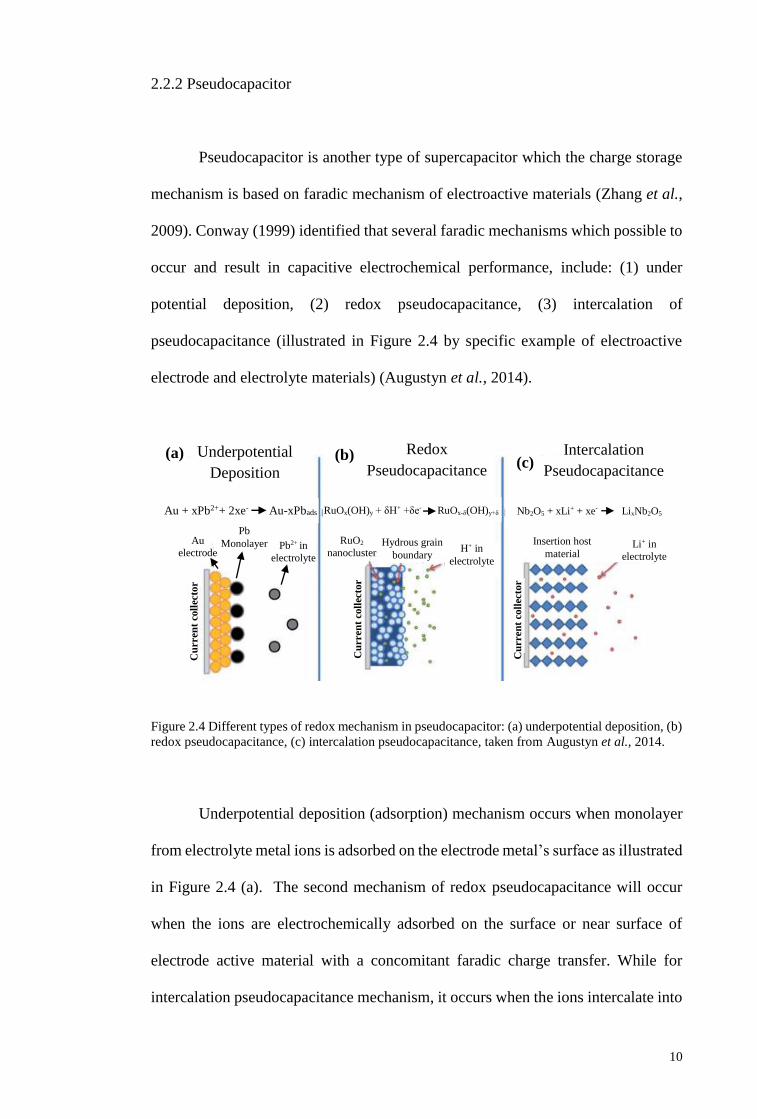
2.2.2 Pseudocapacitor
Pseudocapacitor is another type of supercapacitor which the charge storage
mechanism is based on faradic mechanism of electroactive materials (Zhang et al.,
2009). Conway (1999) identified that several faradic mechanisms which possible to
occur and result in capacitive electrochemical performance, include: (1) under
potential deposition, (2) redox pseudocapacitance, (3) intercalation of
pseudocapacitance (illustrated in Figure 2.4 by specific example of electroactive
electrode and electrolyte materials) (Augustyn et al., 2014).
Figure 2.4 Different types of redox mechanism in pseudocapacitor: (a) underpotential deposition, (b)
redox pseudocapacitance, (c) intercalation pseudocapacitance, taken from Augustyn et al., 2014.
Underpotential deposition (adsorption) mechanism occurs when monolayer
from electrolyte metal ions is adsorbed on the electrode metal’s surface as illustrated
in Figure 2.4 (a). The second mechanism of redox pseudocapacitance will occur
when the ions are electrochemically adsorbed on the surface or near surface of
electrode active material with a concomitant faradic charge transfer. While for
intercalation pseudocapacitance mechanism, it occurs when the ions intercalate into
Underpotential
Deposition Redox
Pseudocapacitance
Intercalation
Pseudocapacitance (a) (b)
(c)
Au + xPb2++ 2xe- Au-xPbads RuOx(OH)y + δH+ +δe- RuOx-δ(OH)y+δ Nb2O5 + xLi+ + xe- LixNb2O5
Pb2+ in
electrolyte
Pb
Monolayer Au
electrode
RuO2
nanocluster Hydrous grain
boundary H+ in
electrolyte
Insertion host
material Li+ in
electrolyte
Cu
rren
t co
llec
tor
Cu
rren
t co
llec
tor
Cu
rren
t co
llec
tor
11
the tunnels of active materials accompanied by a faradic charge transfer with no
crystallographic phase change. The different physical processes, morphologies and
different type of materials will influence the occurrence of these three mechanisms.
The high rate capability to store the energy is limited by the surface and not limited
by solid state diffusions, while the power capability is limited by the solid-state
diffusion within the cathode and anode active materials (Augustyn et al., 2014).
Commonly, conducting polymers and metal oxides are used for electrode
materials for pseudocapacitor. The adsorption mechanism and redox reactions will
occur in transition metal oxides electrodes and reversible electrochemical doping–
dedoping is presented in conductive polymer electrodes. Pseudocapacitor has higher
energy density but lower power density than EDLC and often lacks of cycle stability.
Thus, this field has attracted a great attention for researchers to study and to find out
the suitable electrode materials for improving the performance of pseudocapacitor.
2.2.3 Hybrid capacitor
Other than EDLC and pseudocapacitor, there is another type of
supercapacitors which called hybrid capacitors. Hybrid capacitor is an asymmetric
capacitor which builds from combination of faradic electrode combined with
another capacitive electrode (Simon & Gogotsi, 2008; Yu et al, 2013). This system
has utilized the combination of battery-like electrode which provide high energy
density and EDLC electrode which enables for high power capability in one system
as cathode and anode electrode. This type of supercapacitor generally has
advantages in improving overall cell potential, energy and power densities in
compared with EDLC (Wang et al., 2012a; Yu et al., 2013; Zhang et al., 2009). In
12
this hybrid system, the novelty of electrode materials with rational design of
composite materials, morphology particle size and electrolyte are the key to achieve
high electrochemical performance (Yu et al., 2013).
2.2.4 Parameters of supercapacitor
In electrochemical storage device, energy density and power density have
become the most important parameters for determining the electrochemical
performance. There are also several main parameters which affect their
performance. The theoretical (maximum) energy density (E) and power density (P)
can be expressed as following Equation 2.1 and Equation 2.2 (Obreja, 2008; Zhang
& Zhao, 2009) :
𝐸 =1
2 𝐶𝑉2 (Equation 2.1)
𝑃 =𝑉2
4 𝑚𝑅𝑠 (Equation 2.2)
Where Q is the storage total charge, C, V, m and Rs are specific capacitance, range
of operating potential, mass of electroactive materials and the equivalent resistance
of supercapacitor.
From the equation, the parameters of C, V and Rs are the most important
parameters which influence the performance of the devices. In order to increase the
energy and power density, the values of both V and C have to be increased and the
value of Rs need to be reduced (Obreja, 2008). The operating potential (V) is
determining by electrolyte window stability which means the operating potential can
be increased by finding the suitable electrolyte for the system. For example aqueous
13
electrolyte normally can operate about 1 V, while organic electrolytes have cell
potential in the range of 3 to 3.5 V. The high operating potential also can be achieved
by finding the suitable electrode materials and optimizing the electrode structure.
The specific capacitance has been known as the most important and effective
parameter in increasing the energy density. Based on equation 2.1, higher
capacitance will results in higher energy density. The capacitance is strongly
dependent on its electrode layer structure and the electron/ion transfer within the
electrode layer. Thus, optimizing the electrode structure become an important
research topic for enhancing the electrochemical performance (Wang et al., 2012a).
Also, the power density can be increased by lowering the cell internal
resistance. Internal resistance is caused by the electrode-electrolyte transfer. In
pseudocapacitor, the power density is still higher than battery which is due to the
very fast electron and ion transfer within electrode-electrolyte (Wang et al., 2012a).
2.2.5 Comparison of battery and supercapacitor
In energy storage by EDLC, there is only excess of electrons accumulation
on capacitor plate when charging and discharging. In the case of pseudocapacitor,
there is a faradic charges transfer without any crystallographic phase change. For
electrochemical energy storage in battery, the cell will go through faradic reaction
and chemical interconversion usually results in phase changes of anode and cathode.
Battery usually has irreversibility redox reaction. Furthermore the interconversion
of chemical electrode reagents in the battery can lead to poor cycle life up to one
thousand to several thousand of charge discharge cycles (Conway et al., 1997). The
14
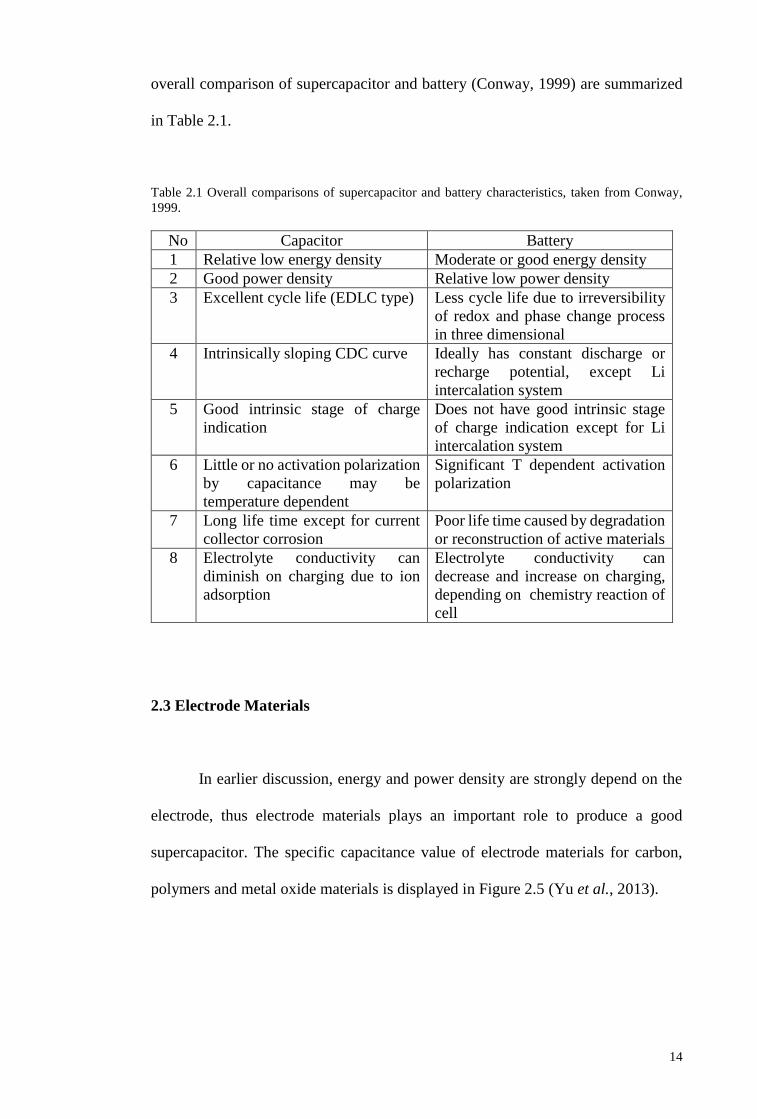
overall comparison of supercapacitor and battery (Conway, 1999) are summarized
in Table 2.1.
Table 2.1 Overall comparisons of supercapacitor and battery characteristics, taken from Conway,
1999.
No Capacitor Battery
1 Relative low energy density Moderate or good energy density
2 Good power density Relative low power density
3 Excellent cycle life (EDLC type) Less cycle life due to irreversibility
of redox and phase change process
in three dimensional
4 Intrinsically sloping CDC curve Ideally has constant discharge or
recharge potential, except Li
intercalation system
5 Good intrinsic stage of charge
indication
Does not have good intrinsic stage
of charge indication except for Li
intercalation system
6 Little or no activation polarization
by capacitance may be
temperature dependent
Significant T dependent activation
polarization
7 Long life time except for current
collector corrosion
Poor life time caused by degradation
or reconstruction of active materials
8 Electrolyte conductivity can
diminish on charging due to ion
adsorption
Electrolyte conductivity can
decrease and increase on charging,
depending on chemistry reaction of
cell
2.3 Electrode Materials
In earlier discussion, energy and power density are strongly depend on the
electrode, thus electrode materials plays an important role to produce a good
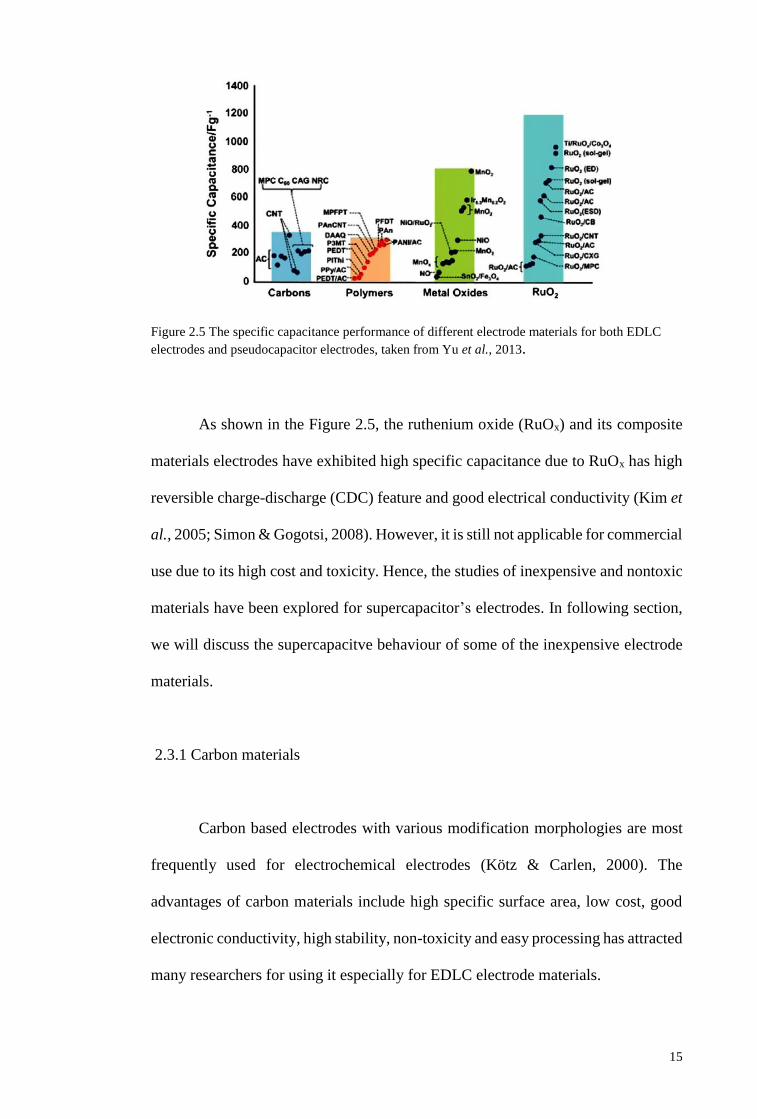
supercapacitor. The specific capacitance value of electrode materials for carbon,
polymers and metal oxide materials is displayed in Figure 2.5 (Yu et al., 2013).
15
Figure 2.5 The specific capacitance performance of different electrode materials for both EDLC
electrodes and pseudocapacitor electrodes, taken from Yu et al., 2013.
As shown in the Figure 2.5, the ruthenium oxide (RuOx) and its composite
materials electrodes have exhibited high specific capacitance due to RuOx has high
reversible charge-discharge (CDC) feature and good electrical conductivity (Kim et
al., 2005; Simon & Gogotsi, 2008). However, it is still not applicable for commercial
use due to its high cost and toxicity. Hence, the studies of inexpensive and nontoxic
materials have been explored for supercapacitor’s electrodes. In following section,
we will discuss the supercapacitve behaviour of some of the inexpensive electrode
materials.
2.3.1 Carbon materials
Carbon based electrodes with various modification morphologies are most
frequently used for electrochemical electrodes (Kötz & Carlen, 2000). The
advantages of carbon materials include high specific surface area, low cost, good
electronic conductivity, high stability, non-toxicity and easy processing has attracted
many researchers for using it especially for EDLC electrode materials.
16
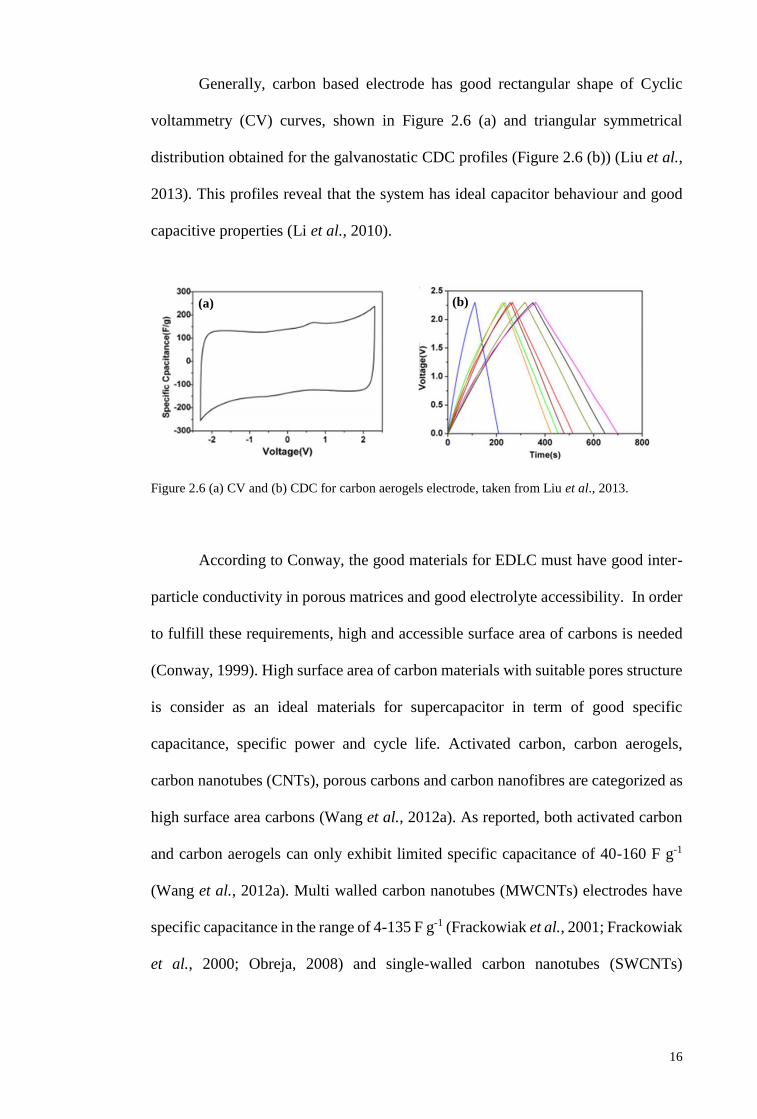
Generally, carbon based electrode has good rectangular shape of Cyclic
voltammetry (CV) curves, shown in Figure 2.6 (a) and triangular symmetrical
distribution obtained for the galvanostatic CDC profiles (Figure 2.6 (b)) (Liu et al.,
2013). This profiles reveal that the system has ideal capacitor behaviour and good
capacitive properties (Li et al., 2010).
Figure 2.6 (a) CV and (b) CDC for carbon aerogels electrode, taken from Liu et al., 2013.
According to Conway, the good materials for EDLC must have good inter-
particle conductivity in porous matrices and good electrolyte accessibility. In order
to fulfill these requirements, high and accessible surface area of carbons is needed
(Conway, 1999). High surface area of carbon materials with suitable pores structure
is consider as an ideal materials for supercapacitor in term of good specific
capacitance, specific power and cycle life. Activated carbon, carbon aerogels,
carbon nanotubes (CNTs), porous carbons and carbon nanofibres are categorized as
high surface area carbons (Wang et al., 2012a). As reported, both activated carbon
and carbon aerogels can only exhibit limited specific capacitance of 40-160 F g-1
(Wang et al., 2012a). Multi walled carbon nanotubes (MWCNTs) electrodes have
specific capacitance in the range of 4-135 F g-1 (Frackowiak et al., 2001; Frackowiak
et al., 2000; Obreja, 2008) and single-walled carbon nanotubes (SWCNTs)
(a) (b)
17
electrodes have been known to achieve a maximum specific capacitance of 180
F g-1 in potassium hydroxide (KOH) electrolyte (Obreja, 2008).
Based on previous studies, although carbon with high surface area and good
electrolyte accessibility is used, the device has also exhibited limited specific
capacitance. This is caused by their high resistivity arises from high internal series
resistance and contact resistance. The development of high performance and low
cost carbon electrodes remains a major challenge.
2.3.2 Faradic materials
Others than carbon based materials, faradic materials are also widely used
as electrode materials for supercapacitors which the storage charge mechanisms are
based on the fast and reversible surface redox reactions (faradic reactions). Faradic
materials are generally classified into two types: Conducting polymers and transition
metal oxides. Recently a lot of research works have been carried out to modify and
develop the suitable faradic materials for pseudocapacitor.
2.3.2.1 Conducting polymers
Conducting polymers are organic polymers that have ability to conduct
electricity through a conjugated bond system along the polymer chain (Shown et al.,
2015). It is widely used as supercapacitor electrode materials due to their reversible
faradic redox nature. In addition to this, compared to metal oxides, conducting
polymer is cheaper and can be easily integrated into flexible electronics system
(Rudge et al., 1994; Snook et al., 2011). Some of the commonly used conducting
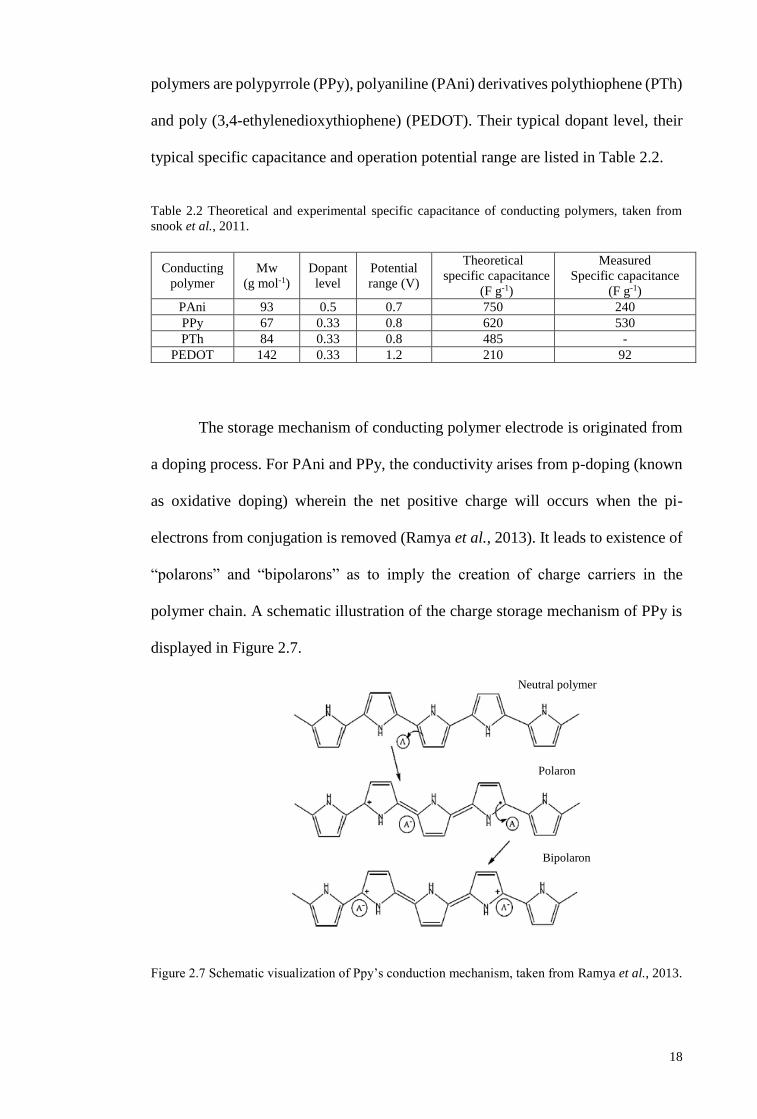
18
polymers are polypyrrole (PPy), polyaniline (PAni) derivatives polythiophene (PTh)
and poly (3,4-ethylenedioxythiophene) (PEDOT). Their typical dopant level, their
typical specific capacitance and operation potential range are listed in Table 2.2.
Table 2.2 Theoretical and experimental specific capacitance of conducting polymers, taken from
snook et al., 2011.
Conducting
polymer
Mw
(g mol-1)
Dopant
level
Potential
range (V)
Theoretical
specific capacitance
(F g-1)
Measured
Specific capacitance
(F g-1)
PAni 93 0.5 0.7 750 240
PPy 67 0.33 0.8 620 530
PTh 84 0.33 0.8 485 -
PEDOT 142 0.33 1.2 210 92
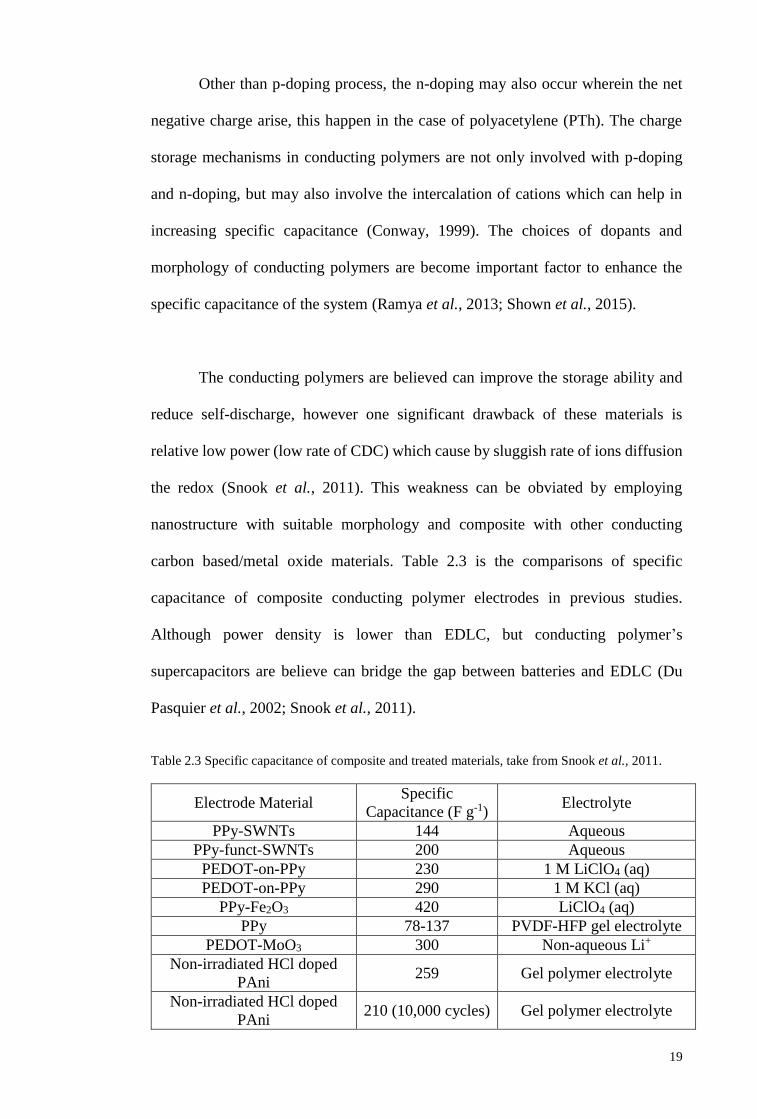
The storage mechanism of conducting polymer electrode is originated from
a doping process. For PAni and PPy, the conductivity arises from p-doping (known
as oxidative doping) wherein the net positive charge will occurs when the pi-
electrons from conjugation is removed (Ramya et al., 2013). It leads to existence of
“polarons” and “bipolarons” as to imply the creation of charge carriers in the
polymer chain. A schematic illustration of the charge storage mechanism of PPy is
displayed in Figure 2.7.
Figure 2.7 Schematic visualization of Ppy’s conduction mechanism, taken from Ramya et al., 2013.
Neutral polymer
Bipolaron
Polaron
19
Other than p-doping process, the n-doping may also occur wherein the net
negative charge arise, this happen in the case of polyacetylene (PTh). The charge
storage mechanisms in conducting polymers are not only involved with p-doping
and n-doping, but may also involve the intercalation of cations which can help in
increasing specific capacitance (Conway, 1999). The choices of dopants and
morphology of conducting polymers are become important factor to enhance the
specific capacitance of the system (Ramya et al., 2013; Shown et al., 2015).
The conducting polymers are believed can improve the storage ability and
reduce self-discharge, however one significant drawback of these materials is
relative low power (low rate of CDC) which cause by sluggish rate of ions diffusion
the redox (Snook et al., 2011). This weakness can be obviated by employing
nanostructure with suitable morphology and composite with other conducting
carbon based/metal oxide materials. Table 2.3 is the comparisons of specific
capacitance of composite conducting polymer electrodes in previous studies.
Although power density is lower than EDLC, but conducting polymer’s
supercapacitors are believe can bridge the gap between batteries and EDLC (Du
Pasquier et al., 2002; Snook et al., 2011).
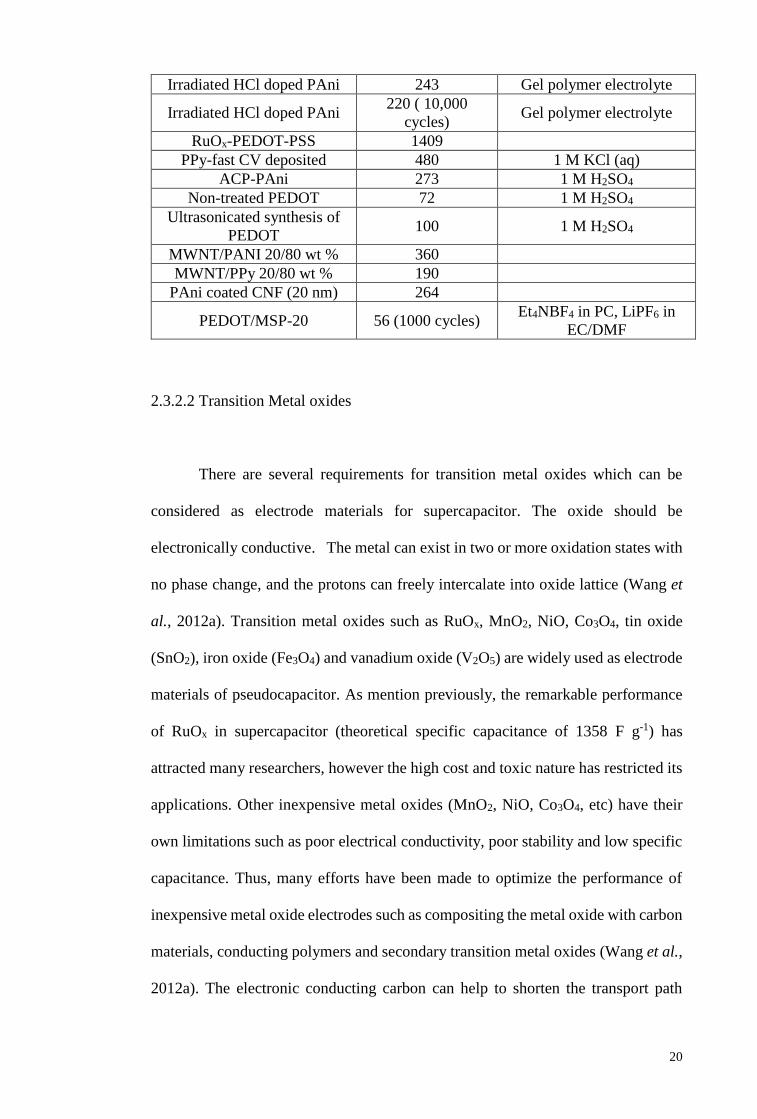
Table 2.3 Specific capacitance of composite and treated materials, take from Snook et al., 2011.
Electrode Material Specific
Capacitance (F g-1) Electrolyte
PPy-SWNTs 144 Aqueous
PPy-funct-SWNTs 200 Aqueous
PEDOT-on-PPy 230 1 M LiClO4 (aq)
PEDOT-on-PPy 290 1 M KCl (aq)
PPy-Fe2O3 420 LiClO4 (aq)
PPy 78-137 PVDF-HFP gel electrolyte
PEDOT-MoO3 300 Non-aqueous Li+
Non-irradiated HCl doped
PAni 259 Gel polymer electrolyte
Non-irradiated HCl doped
PAni 210 (10,000 cycles) Gel polymer electrolyte
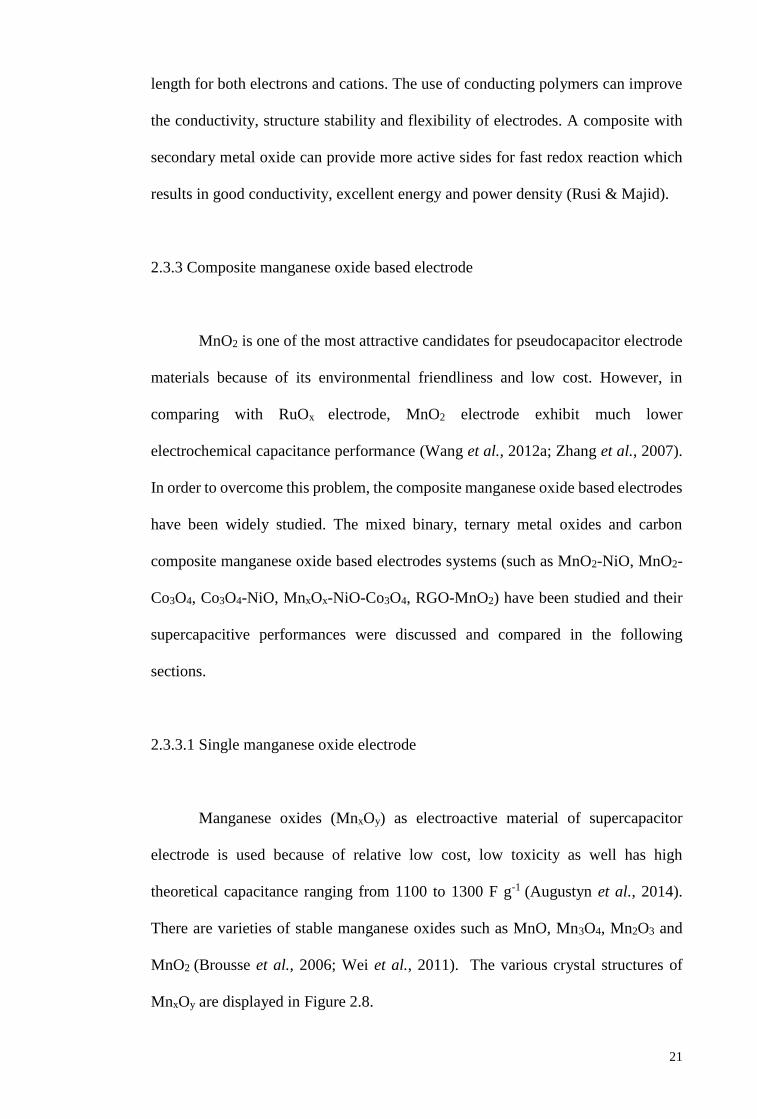
20
Irradiated HCl doped PAni 243 Gel polymer electrolyte
Irradiated HCl doped PAni 220 ( 10,000
cycles) Gel polymer electrolyte
RuOx-PEDOT-PSS 1409
PPy-fast CV deposited 480 1 M KCl (aq)
ACP-PAni 273 1 M H2SO4
Non-treated PEDOT 72 1 M H2SO4
Ultrasonicated synthesis of
PEDOT 100 1 M H2SO4
MWNT/PANI 20/80 wt % 360
MWNT/PPy 20/80 wt % 190
PAni coated CNF (20 nm) 264
PEDOT/MSP-20 56 (1000 cycles) Et4NBF4 in PC, LiPF6 in
EC/DMF
2.3.2.2 Transition Metal oxides
There are several requirements for transition metal oxides which can be
considered as electrode materials for supercapacitor. The oxide should be
electronically conductive. The metal can exist in two or more oxidation states with
no phase change, and the protons can freely intercalate into oxide lattice (Wang et
al., 2012a). Transition metal oxides such as RuOx, MnO2, NiO, Co3O4, tin oxide
(SnO2), iron oxide (Fe3O4) and vanadium oxide (V2O5) are widely used as electrode
materials of pseudocapacitor. As mention previously, the remarkable performance
of RuOx in supercapacitor (theoretical specific capacitance of 1358 F g-1) has
attracted many researchers, however the high cost and toxic nature has restricted its
applications. Other inexpensive metal oxides (MnO2, NiO, Co3O4, etc) have their
own limitations such as poor electrical conductivity, poor stability and low specific
capacitance. Thus, many efforts have been made to optimize the performance of
inexpensive metal oxide electrodes such as compositing the metal oxide with carbon
materials, conducting polymers and secondary transition metal oxides (Wang et al.,
2012a). The electronic conducting carbon can help to shorten the transport path
21
length for both electrons and cations. The use of conducting polymers can improve
the conductivity, structure stability and flexibility of electrodes. A composite with
secondary metal oxide can provide more active sides for fast redox reaction which
results in good conductivity, excellent energy and power density (Rusi & Majid).
2.3.3 Composite manganese oxide based electrode
MnO2 is one of the most attractive candidates for pseudocapacitor electrode
materials because of its environmental friendliness and low cost. However, in
comparing with RuOx electrode, MnO2 electrode exhibit much lower
electrochemical capacitance performance (Wang et al., 2012a; Zhang et al., 2007).
In order to overcome this problem, the composite manganese oxide based electrodes
have been widely studied. The mixed binary, ternary metal oxides and carbon
composite manganese oxide based electrodes systems (such as MnO2-NiO, MnO2-
Co3O4, Co3O4-NiO, MnxOx-NiO-Co3O4, RGO-MnO2) have been studied and their
supercapacitive performances were discussed and compared in the following
sections.
2.3.3.1 Single manganese oxide electrode
Manganese oxides (MnxOy) as electroactive material of supercapacitor
electrode is used because of relative low cost, low toxicity as well has high
theoretical capacitance ranging from 1100 to 1300 F g-1 (Augustyn et al., 2014).
There are varieties of stable manganese oxides such as MnO, Mn3O4, Mn2O3 and
MnO2 (Brousse et al., 2006; Wei et al., 2011). The various crystal structures of
MnxOy are displayed in Figure 2.8.
22
Figure 2.8 Schematic illustration of the crystal structure of manganese oxide. (a) Rock salt, (b) spinel
Mn3O4, (c) bixbyite Mn2O3, (d) pyrolusite β-MnO2 (rutile-type), (e) ramsdellite (diaspore-type)
([MnO6] octahedra form infinite double layers) , (f) phyllomanganate (birnessite-buserite family
layered MnO2), taken from Brousse et al. (2006).
The first study on capacitive behaviour of manganese dioxide by Lee and
Goodenough in 1999 has gained major attention as starting point to develop
manganese oxide electrodes for supercapacitor devices (Augustyn et al., 2014;
Wang et al., 2012a; Wei et al., 2011). The storage mechanism of manganese oxide
electrode is based on reversible redox transition which involve the exchange of
cations within electrode-electrolyte that change the electrode oxidation state of
Mn(III)/Mn(II), Mn(IV)/Mn(V) (Wang et al., 2012a). The possible reaction that
occurs during CDC in MnO2 electrode is shown in Equation 2.3.
(MnO2)surface/bulk + C+ + e- (MnOOC)surface/bulk (Equation 2.3)
Based on previous studies, the electrochemical performances of manganese
oxides electrodes are strongly depend on the morphology, crystal forms, defect
O2+ Mn2+
Oxygen
A-atoms
Tetrahedral side
B-atoms
Octahedral side
(a) (b) (c)
(d) (e) (f)
23
chemistry, porosity and texture. Thus, the structural parameters have played an
important role in determining the electrochemical properties (Wei et al., 2011).
Extensive efforts have been paid to adjust the synthesis parameters in order to obtain
optimum capacitance and power density of manganese oxide with suitable
morphology and crystal structure (Wang et al., 2012a).
The effect of crystal structure on capacitance MnO2 in aqueous electrolyte
has been reported. The specific capacitance and stability performance of MnO2
allotropes is shown in Figure 2.9.
Figure 2.9 The specific capacitance and cyclability of different MnO2 allotropes in 0.5 M potassium
sulphate (K2SO4) electrolyte at 5 mV s-1, taken from Ghodbane et al., 2009.
The spinel form of MnO2 has found to exhibit optimum specific capacitance of 245
F g-1 by Ghodbane et al. (2009), while Devaraj & Munichandraiah (2008) found
that hollandite MnO2 can achieve capacitance as high as 297 F g-1. The difference
of these results were caused by use of different synthesis and electrochemical
characterization methods (Devaraj & Munichandraiah, 2008; Ghodbane et al.,
2009). The recent updated of specific capacitance dependence on MnO2 structure
phase and surface area studies are shown in Table 2.4 (Wang et al., 2015).
Sp
ecif
ic C
ap
aci
tan
ce (
F g
-1)
Cycle number
spinel
birnessite
OMS-5
cryptomelance
ramsdellite
Ni-todorokite
pyrolusite
24
There are several techniques can be used to synthesize MnO2 electrodes.
Some of the methods are hydrothermal/solvothermal method, sol gel method,
electrodeposition method, etc. Different type of nanostructures can be obtained
using hydrothermal method by controlling the reaction temperature, time and
solvent (Wei et al., 2011).
Table 2.4 Specific capacitance dependence on MnO2 phase structure and specific surface area (SSA),
taken from Wang et al., 2015.
MnO2
Phase Tunnel Size (Å)
SSA
(m2/g) SC (F g-1) Electrolyte
α(m) 2 x 2 (1D) 4.6 x 4.6 200 150
0.1 M K2SO4
(Hydrated size
of K+ : 3Å)
α(m) (H2SO4) 208 150
α(m) (H2O) 8 125
δ (H2O) 1 x ∞ (2D) 7.0 (interlayer) 17 110
δ (H2SO4) 89 105
Δ 3 80
λ (spinel) 3D - 35 70
Γ 1 x 2 (1D) 2.3 x 4.6 41 30
Β 1 x 1 (1D) 1.89 x 1.89 1 5
Α 2 x 2 (1D) 4.6 x 4.6 19.29 241
0.1 M Na2SO4
(Hydrated size
of Na+ : 4 Å)
α(m) 2 x 2 (1D) 4.6 x 4.6 123.39 297
Δ 1 x ∞ (2D) 7.0 20.93 236
Γ 1 x 2 (1D) 2.3 x 4.6 31.56 107
λ (spinel) 3D - 5.21 21
Β 1 x 1 (1D) 1.89 x 1.89 - 9
λ (spinel) 3D - 156 241
0.5 M K2SO4
Δ 1 x ∞ (2D) 7.0 45 225
OMS-5 4 x 2 (1D) 9.2 x 4.6 19 217
Α 2 x 2 (1D) 4.6 x 4.6 29 125
Γ 1 x 2 (1D) 2.3 x 4.6 85 87
Ni-todorokite 3 x 3 (1D) 6.9 x 6.9 33 42
Β 1 x 1 (1D) 1.89 x 1.89 35 28
From the studies of Zhao et al. (2015) a hydrothermal route has been used
to synthesis urchin-like MnO2 electrode based on mixture of aqueous manganese
sulphate (MnSO4) and (NH4)2S2O8 (Zhao et al., 2015b). By varying the
hydrothermal temperature, different type of morphologies were obtained, as shown
in Figure 2.10.
25
Figure 2.10 SEM images of low magnification (a,c and e) and high magnification (b,d and f) of
urchin-like MnO2 powders synthesized at different temperatures: (1) a and b, 80°C; (2) c and d, 110
°C and (3) e and f, 140 °C, taken from Zhao et al., 2015b.
The urchin-like structure exhibited optimum specific capacitance of 151.5
F g-1 at current density of 1 A g-1 in 1 M Na2SO4 electrolyte. By controlling the ratio
of potassium permanganate to potassium chloride, Zhao et al. (2015a) obtained
MnO2 nanoflowers (Figure 2.11) with specific capacitance exhibited of 197.3 F g-1
at current density of 1 A g−1 in 1 M Na2SO4 electrolyte (Zhao et al., 2015a).
(a) (b)
(c) (d)
(e) (f)
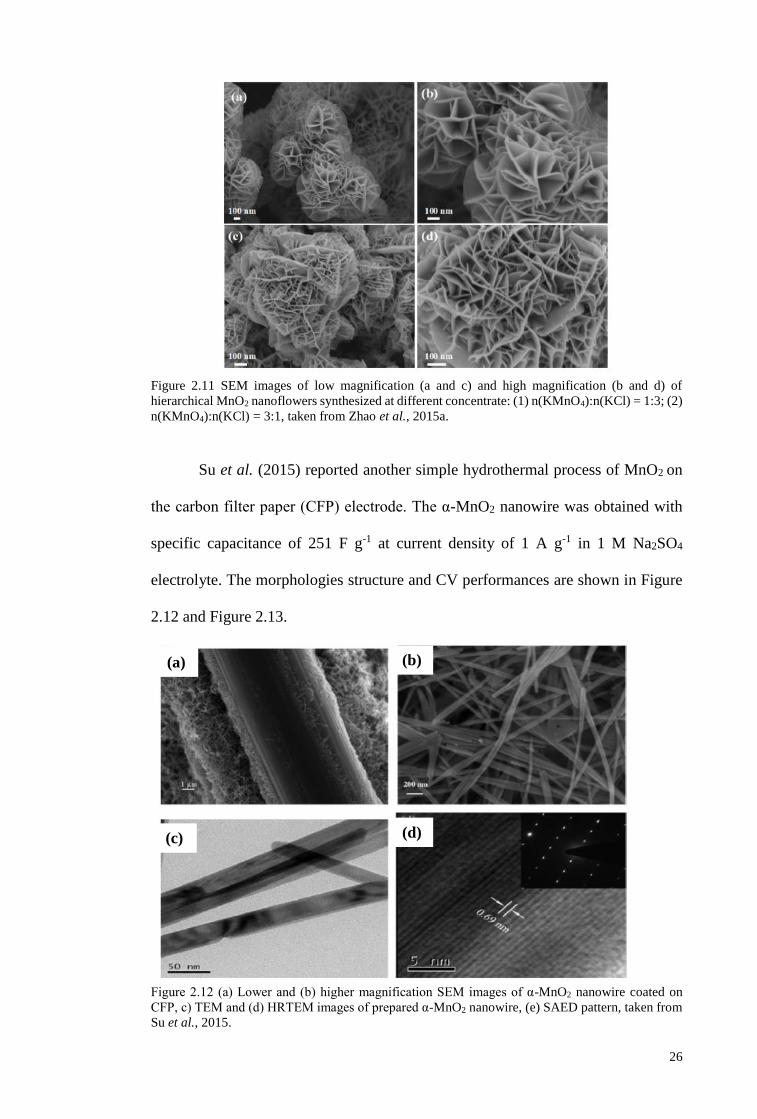
26
Figure 2.11 SEM images of low magnification (a and c) and high magnification (b and d) of
hierarchical MnO2 nanoflowers synthesized at different concentrate: (1) n(KMnO4):n(KCl) = 1:3; (2)
n(KMnO4):n(KCl) = 3:1, taken from Zhao et al., 2015a.
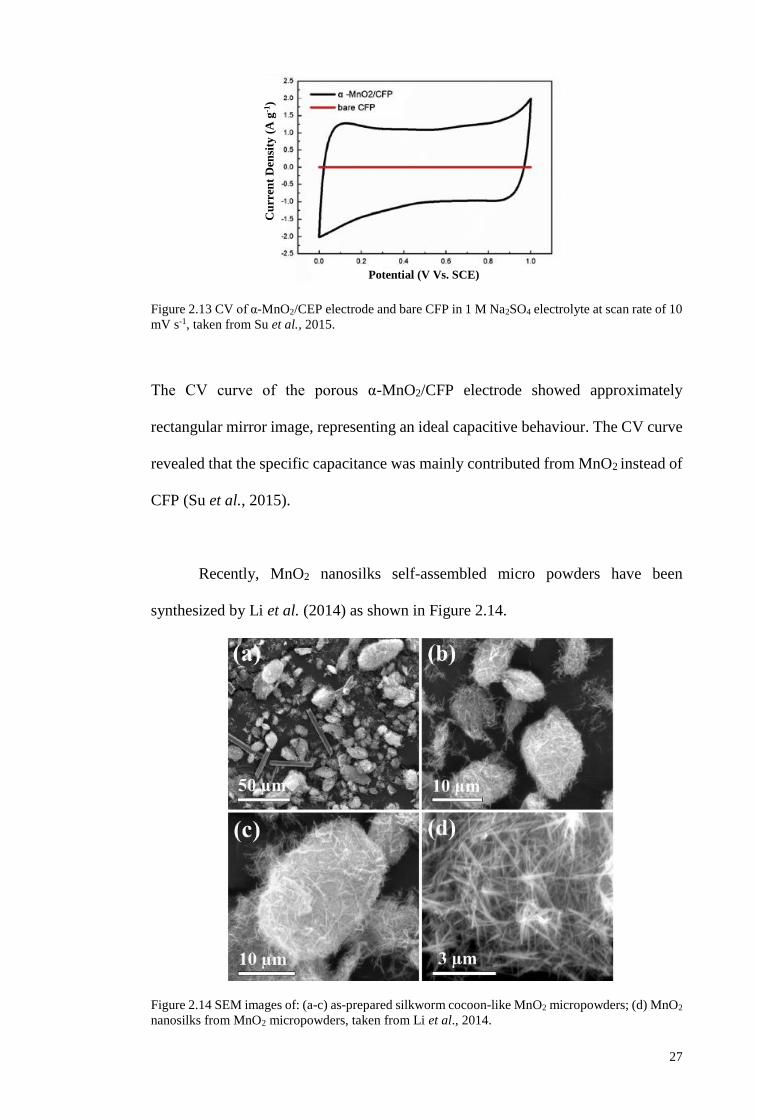
Su et al. (2015) reported another simple hydrothermal process of MnO2 on
the carbon filter paper (CFP) electrode. The α-MnO2 nanowire was obtained with
specific capacitance of 251 F g-1 at current density of 1 A g-1 in 1 M Na2SO4
electrolyte. The morphologies structure and CV performances are shown in Figure
2.12 and Figure 2.13.
Figure 2.12 (a) Lower and (b) higher magnification SEM images of α-MnO2 nanowire coated on
CFP, c) TEM and (d) HRTEM images of prepared α-MnO2 nanowire, (e) SAED pattern, taken from
Su et al., 2015.
(a) (b)
(c) (d)
27
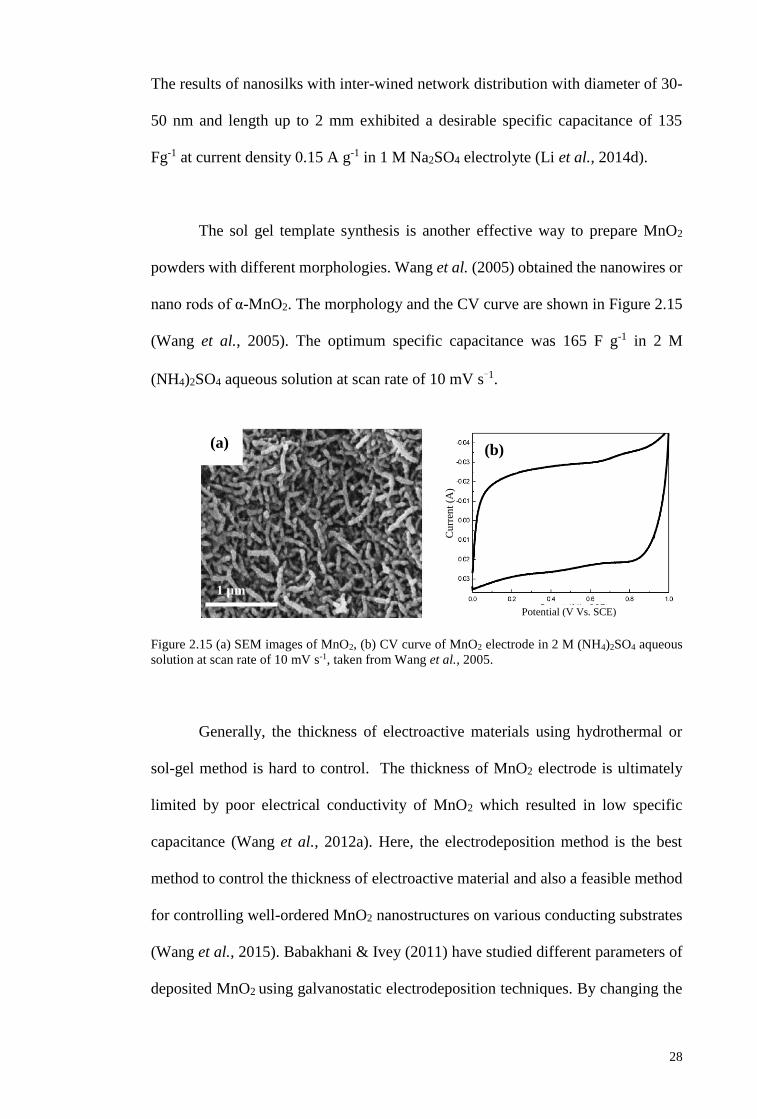
Figure 2.13 CV of α-MnO2/CEP electrode and bare CFP in 1 M Na2SO4 electrolyte at scan rate of 10
mV s-1, taken from Su et al., 2015.
The CV curve of the porous α-MnO2/CFP electrode showed approximately
rectangular mirror image, representing an ideal capacitive behaviour. The CV curve
revealed that the specific capacitance was mainly contributed from MnO2 instead of
CFP (Su et al., 2015).
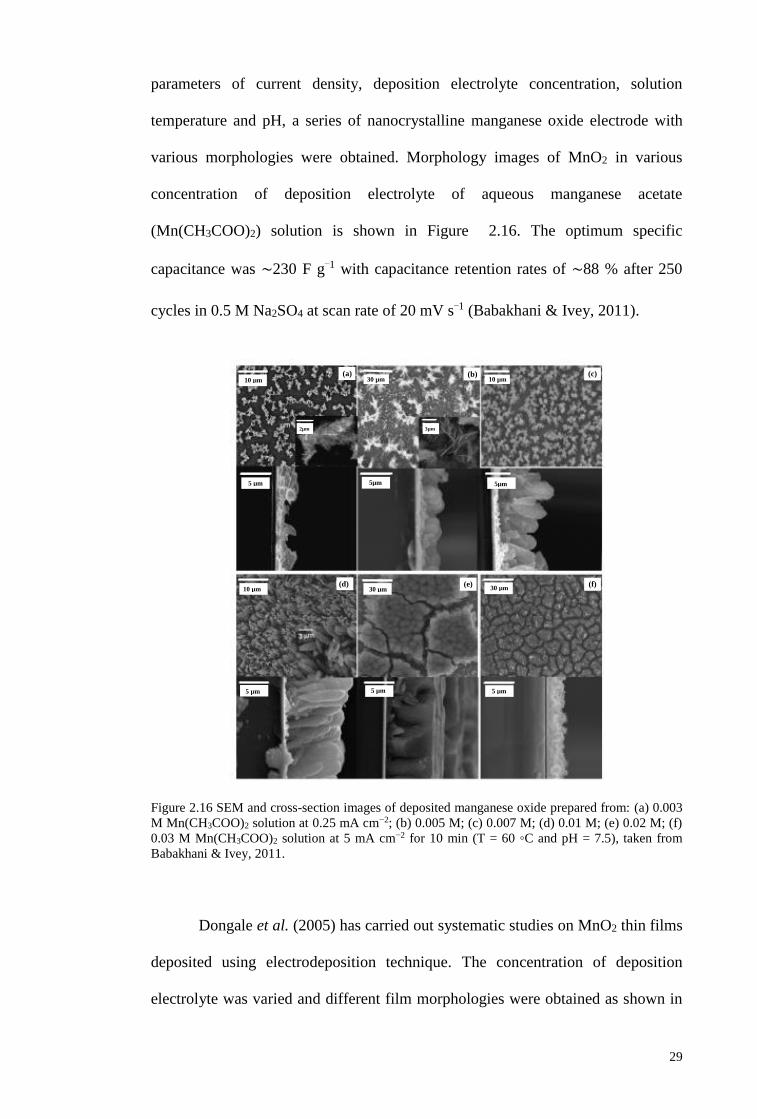
Recently, MnO2 nanosilks self-assembled micro powders have been
synthesized by Li et al. (2014) as shown in Figure 2.14.
Figure 2.14 SEM images of: (a-c) as-prepared silkworm cocoon-like MnO2 micropowders; (d) MnO2
nanosilks from MnO2 micropowders, taken from Li et al., 2014.
C
urr
ent
Den
sity
(A
g-1
) Potential (V Vs. SCE)
28
The results of nanosilks with inter-wined network distribution with diameter of 30-
50 nm and length up to 2 mm exhibited a desirable specific capacitance of 135
Fg-1 at current density 0.15 A g-1 in 1 M Na2SO4 electrolyte (Li et al., 2014d).
The sol gel template synthesis is another effective way to prepare MnO2
powders with different morphologies. Wang et al. (2005) obtained the nanowires or
nano rods of α-MnO2. The morphology and the CV curve are shown in Figure 2.15
(Wang et al., 2005). The optimum specific capacitance was 165 F g-1 in 2 M
(NH4)2SO4 aqueous solution at scan rate of 10 mV s-1.
Figure 2.15 (a) SEM images of MnO2, (b) CV curve of MnO2 electrode in 2 M (NH4)2SO4 aqueous
solution at scan rate of 10 mV s-1, taken from Wang et al., 2005.
Generally, the thickness of electroactive materials using hydrothermal or
sol-gel method is hard to control. The thickness of MnO2 electrode is ultimately
limited by poor electrical conductivity of MnO2 which resulted in low specific
capacitance (Wang et al., 2012a). Here, the electrodeposition method is the best
method to control the thickness of electroactive material and also a feasible method
for controlling well-ordered MnO2 nanostructures on various conducting substrates
(Wang et al., 2015). Babakhani & Ivey (2011) have studied different parameters of
deposited MnO2 using galvanostatic electrodeposition techniques. By changing the
(a) (b)
1 µm
Potential (V Vs. SCE)
Cu
rren
t (A
)
29
parameters of current density, deposition electrolyte concentration, solution
temperature and pH, a series of nanocrystalline manganese oxide electrode with
various morphologies were obtained. Morphology images of MnO2 in various
concentration of deposition electrolyte of aqueous manganese acetate
(Mn(CH3COO)2) solution is shown in Figure 2.16. The optimum specific
capacitance was ∼230 F g−1 with capacitance retention rates of ∼88 % after 250
cycles in 0.5 M Na2SO4 at scan rate of 20 mV s−1 (Babakhani & Ivey, 2011).
Figure 2.16 SEM and cross-section images of deposited manganese oxide prepared from: (a) 0.003
M Mn(CH3COO)2 solution at 0.25 mA cm−2; (b) 0.005 M; (c) 0.007 M; (d) 0.01 M; (e) 0.02 M; (f)
0.03 M Mn(CH3COO)2 solution at 5 mA cm−2 for 10 min (T = 60 C and pH = 7.5), taken from
Babakhani & Ivey, 2011.
Dongale et al. (2005) has carried out systematic studies on MnO2 thin films
deposited using electrodeposition technique. The concentration of deposition
electrolyte was varied and different film morphologies were obtained as shown in
10 µm
10 µm 30 µm
2µm
3µm
5 µm 5µm
5µm
10 µm 30 µm
30 µm
5 µm 5 µm
5 µm
(a)
(b) (c)
(d) (e) (f)
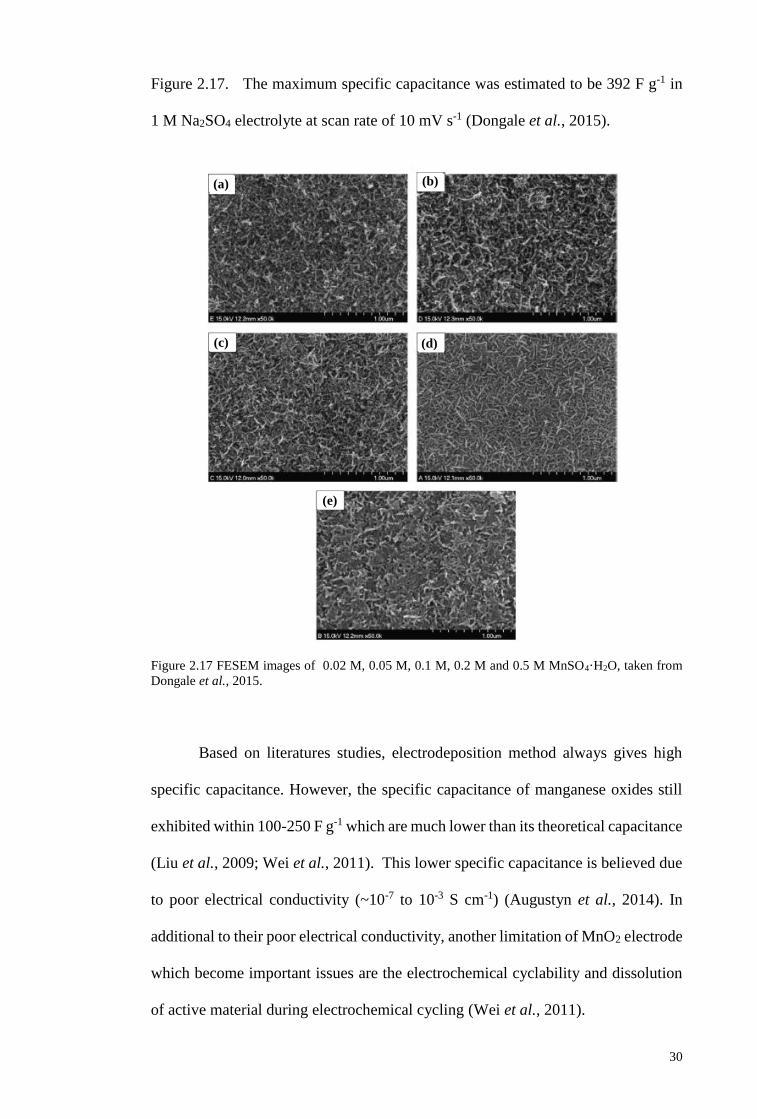
30
Figure 2.17. The maximum specific capacitance was estimated to be 392 F g-1 in
1 M Na2SO4 electrolyte at scan rate of 10 mV s-1 (Dongale et al., 2015).
Figure 2.17 FESEM images of 0.02 M, 0.05 M, 0.1 M, 0.2 M and 0.5 M MnSO4·H2O, taken from
Dongale et al., 2015.
Based on literatures studies, electrodeposition method always gives high
specific capacitance. However, the specific capacitance of manganese oxides still
exhibited within 100-250 F g-1 which are much lower than its theoretical capacitance
(Liu et al., 2009; Wei et al., 2011). This lower specific capacitance is believed due
to poor electrical conductivity (~10-7 to 10-3 S cm-1) (Augustyn et al., 2014). In
additional to their poor electrical conductivity, another limitation of MnO2 electrode
which become important issues are the electrochemical cyclability and dissolution
of active material during electrochemical cycling (Wei et al., 2011).
(a) (b)
(c) (d)
(e)
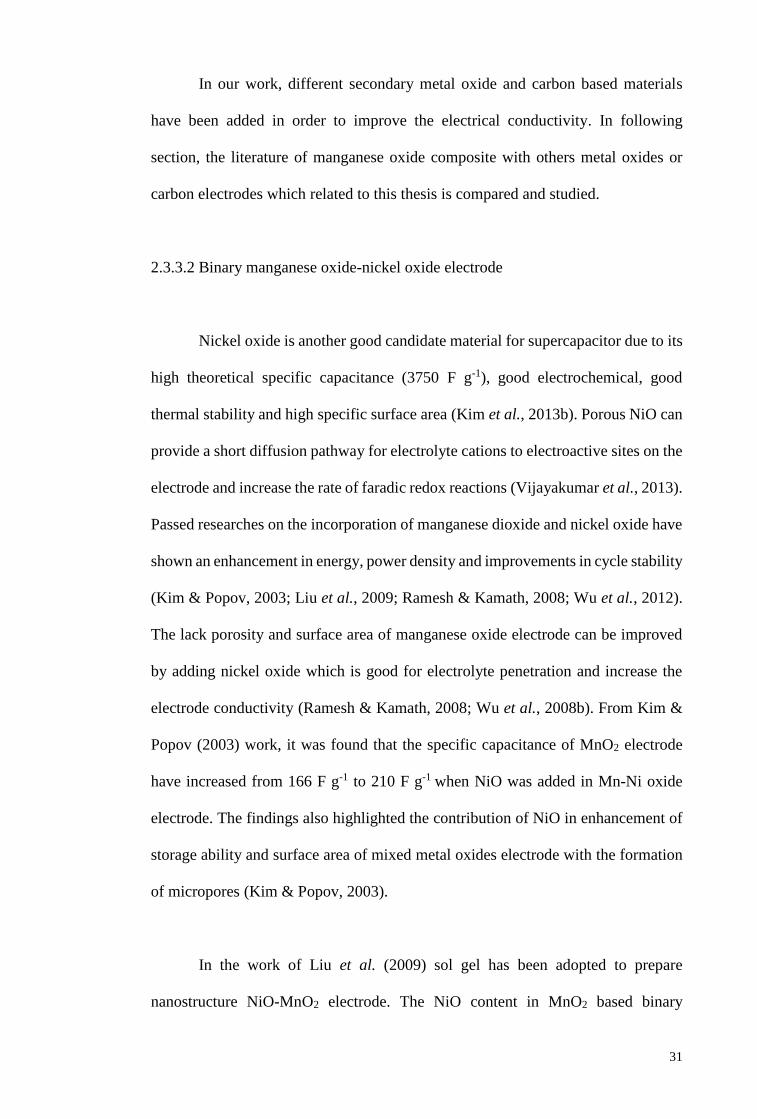
31
In our work, different secondary metal oxide and carbon based materials
have been added in order to improve the electrical conductivity. In following
section, the literature of manganese oxide composite with others metal oxides or
carbon electrodes which related to this thesis is compared and studied.
2.3.3.2 Binary manganese oxide-nickel oxide electrode
Nickel oxide is another good candidate material for supercapacitor due to its
high theoretical specific capacitance (3750 F g-1), good electrochemical, good
thermal stability and high specific surface area (Kim et al., 2013b). Porous NiO can
provide a short diffusion pathway for electrolyte cations to electroactive sites on the
electrode and increase the rate of faradic redox reactions (Vijayakumar et al., 2013).
Passed researches on the incorporation of manganese dioxide and nickel oxide have
shown an enhancement in energy, power density and improvements in cycle stability
(Kim & Popov, 2003; Liu et al., 2009; Ramesh & Kamath, 2008; Wu et al., 2012).
The lack porosity and surface area of manganese oxide electrode can be improved
by adding nickel oxide which is good for electrolyte penetration and increase the
electrode conductivity (Ramesh & Kamath, 2008; Wu et al., 2008b). From Kim &
Popov (2003) work, it was found that the specific capacitance of MnO2 electrode
have increased from 166 F g-1 to 210 F g-1 when NiO was added in Mn-Ni oxide
electrode. The findings also highlighted the contribution of NiO in enhancement of
storage ability and surface area of mixed metal oxides electrode with the formation
of micropores (Kim & Popov, 2003).
In the work of Liu et al. (2009) sol gel has been adopted to prepare
nanostructure NiO-MnO2 electrode. The NiO content in MnO2 based binary
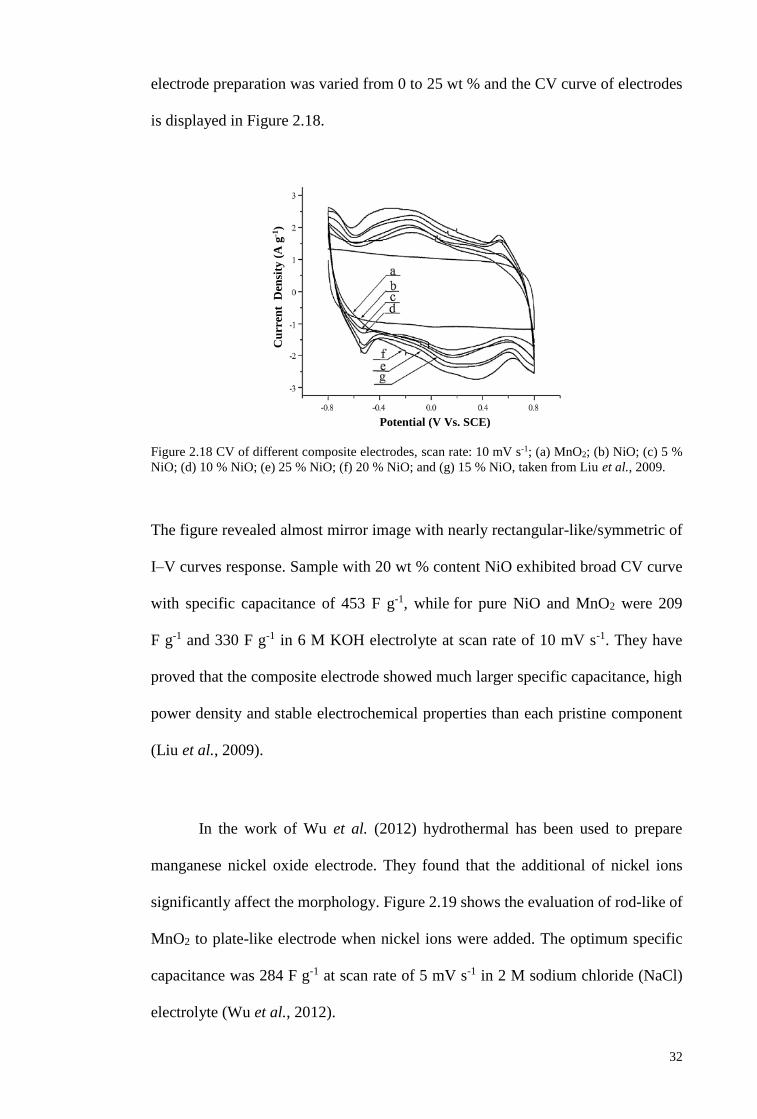
32
electrode preparation was varied from 0 to 25 wt % and the CV curve of electrodes
is displayed in Figure 2.18.
Figure 2.18 CV of different composite electrodes, scan rate: 10 mV s-1; (a) MnO2; (b) NiO; (c) 5 %
NiO; (d) 10 % NiO; (e) 25 % NiO; (f) 20 % NiO; and (g) 15 % NiO, taken from Liu et al., 2009.
The figure revealed almost mirror image with nearly rectangular-like/symmetric of
I–V curves response. Sample with 20 wt % content NiO exhibited broad CV curve
with specific capacitance of 453 F g-1, while for pure NiO and MnO2 were 209
F g-1 and 330 F g-1 in 6 M KOH electrolyte at scan rate of 10 mV s-1. They have
proved that the composite electrode showed much larger specific capacitance, high
power density and stable electrochemical properties than each pristine component
(Liu et al., 2009).
In the work of Wu et al. (2012) hydrothermal has been used to prepare
manganese nickel oxide electrode. They found that the additional of nickel ions
significantly affect the morphology. Figure 2.19 shows the evaluation of rod-like of
MnO2 to plate-like electrode when nickel ions were added. The optimum specific
capacitance was 284 F g-1 at scan rate of 5 mV s-1 in 2 M sodium chloride (NaCl)
electrolyte (Wu et al., 2012).
C
urr
ent
Den
sity
(A
g-1
)
Potential (V Vs. SCE)
33
Figure 2.19 Scanning electron micrographs of (a) MnO2, (b) Ni-Mn-O and transmission electron
micrograph of (c) MnO2, (d) Ni-Mn-O synthesized via the hydrothermal process at 125 °C for 3
hours, taken from Wu et al., 2012.
Other than sol gel and hydrothermal method, the electrodeposition method
has been used to synthesize binary manganese nickel oxide electrode. In the work
of Chen and Hu, Mn-Ni oxide was successfully deposited using the anodic
electrodeposition method with a solution containing a high Ni2+/Mn2+ ratio of 10:1,
the high ratio differences is due to high differences in the reduction potential of Mn2+
(-1.18 V) and Ni2+ (-0.25 V) (Chen & Hu, 2003). Other studies on electrodeposition
techniques have been done by Parasad and Munira (2004) where nanostructured and
microporous manganese nickel oxide has been successfully deposited on SS. The
(a) (b)
(c) (d)
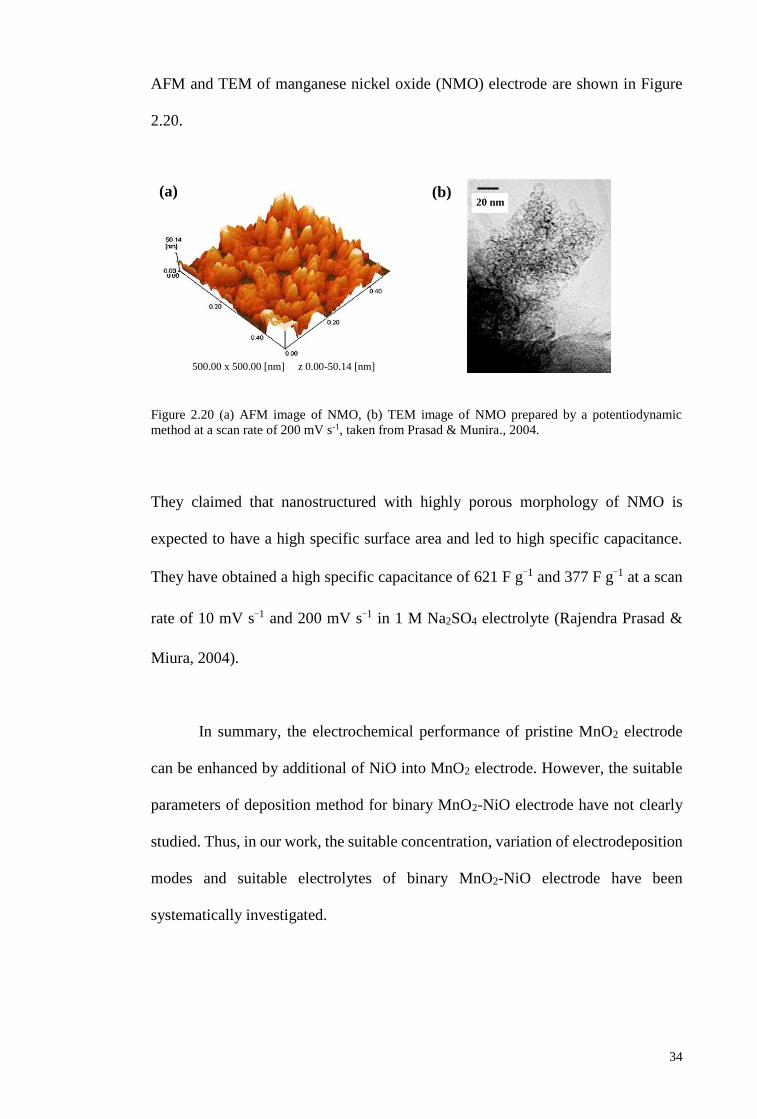
34
AFM and TEM of manganese nickel oxide (NMO) electrode are shown in Figure
2.20.
Figure 2.20 (a) AFM image of NMO, (b) TEM image of NMO prepared by a potentiodynamic
method at a scan rate of 200 mV s-1, taken from Prasad & Munira., 2004.
They claimed that nanostructured with highly porous morphology of NMO is
expected to have a high specific surface area and led to high specific capacitance.
They have obtained a high specific capacitance of 621 F g-1 and 377 F g−1 at a scan
rate of 10 mV s−1 and 200 mV s−1 in 1 M Na2SO4 electrolyte (Rajendra Prasad &
Miura, 2004).
In summary, the electrochemical performance of pristine MnO2 electrode
can be enhanced by additional of NiO into MnO2 electrode. However, the suitable
parameters of deposition method for binary MnO2-NiO electrode have not clearly
studied. Thus, in our work, the suitable concentration, variation of electrodeposition
modes and suitable electrolytes of binary MnO2-NiO electrode have been
systematically investigated.
(a) (b) 20 nm
500.00 x 500.00 [nm] z 0.00-50.14 [nm]
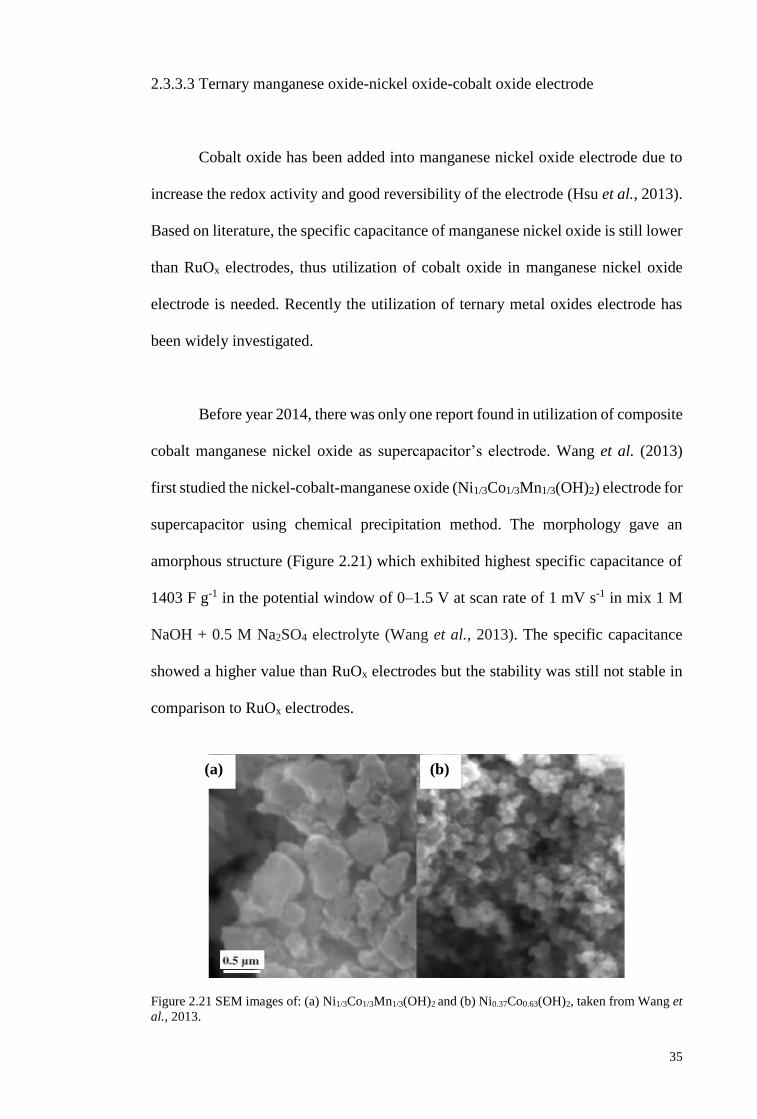
35
2.3.3.3 Ternary manganese oxide-nickel oxide-cobalt oxide electrode
Cobalt oxide has been added into manganese nickel oxide electrode due to
increase the redox activity and good reversibility of the electrode (Hsu et al., 2013).
Based on literature, the specific capacitance of manganese nickel oxide is still lower
than RuOx electrodes, thus utilization of cobalt oxide in manganese nickel oxide
electrode is needed. Recently the utilization of ternary metal oxides electrode has
been widely investigated.
Before year 2014, there was only one report found in utilization of composite
cobalt manganese nickel oxide as supercapacitor’s electrode. Wang et al. (2013)
first studied the nickel-cobalt-manganese oxide (Ni1/3Co1/3Mn1/3(OH)2) electrode for
supercapacitor using chemical precipitation method. The morphology gave an
amorphous structure (Figure 2.21) which exhibited highest specific capacitance of
1403 F g-1 in the potential window of 0–1.5 V at scan rate of 1 mV s-1 in mix 1 M
NaOH + 0.5 M Na2SO4 electrolyte (Wang et al., 2013). The specific capacitance
showed a higher value than RuOx electrodes but the stability was still not stable in
comparison to RuOx electrodes.
Figure 2.21 SEM images of: (a) Ni1/3Co1/3Mn1/3(OH)2 and (b) Ni0.37Co0.63(OH)2, taken from Wang et
al., 2013.
(a) (b)
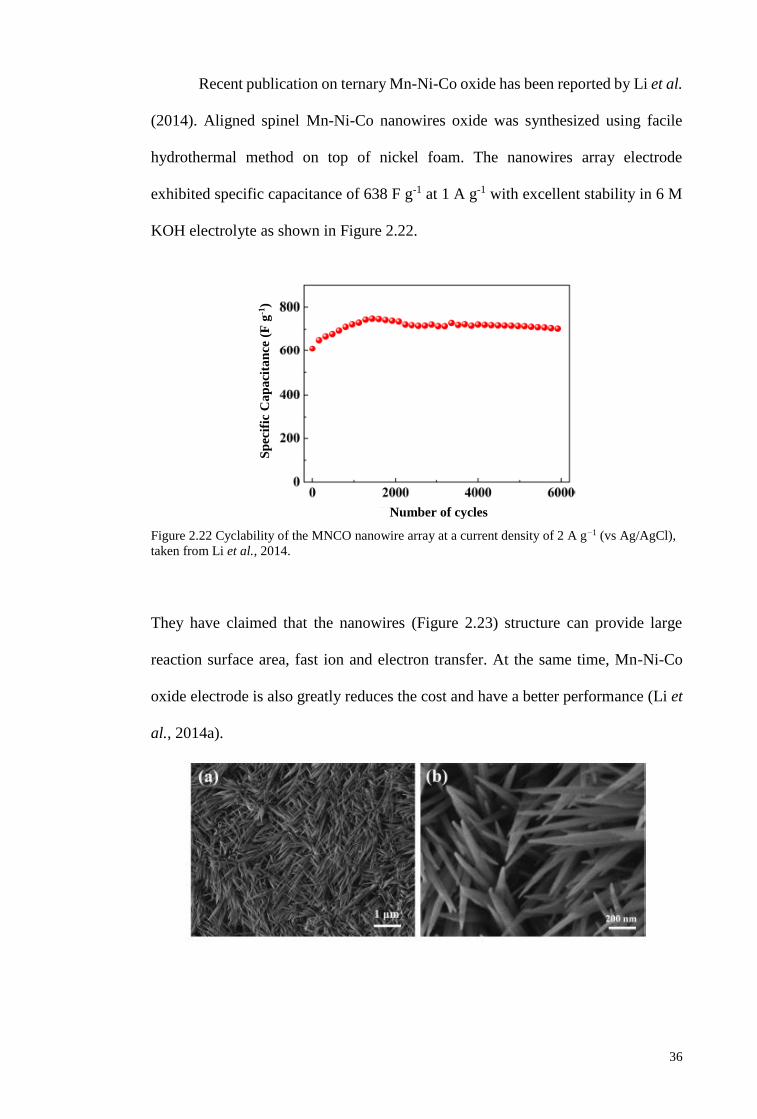
36
Recent publication on ternary Mn-Ni-Co oxide has been reported by Li et al.
(2014). Aligned spinel Mn-Ni-Co nanowires oxide was synthesized using facile
hydrothermal method on top of nickel foam. The nanowires array electrode
exhibited specific capacitance of 638 F g-1 at 1 A g-1 with excellent stability in 6 M
KOH electrolyte as shown in Figure 2.22.
Figure 2.22 Cyclability of the MNCO nanowire array at a current density of 2 A g−1 (vs Ag/AgCl),
taken from Li et al., 2014.
They have claimed that the nanowires (Figure 2.23) structure can provide large
reaction surface area, fast ion and electron transfer. At the same time, Mn-Ni-Co
oxide electrode is also greatly reduces the cost and have a better performance (Li et
al., 2014a).
Sp
ecif
ic C
ap
aci
tan
ce (
F g
-1)
Number of cycles
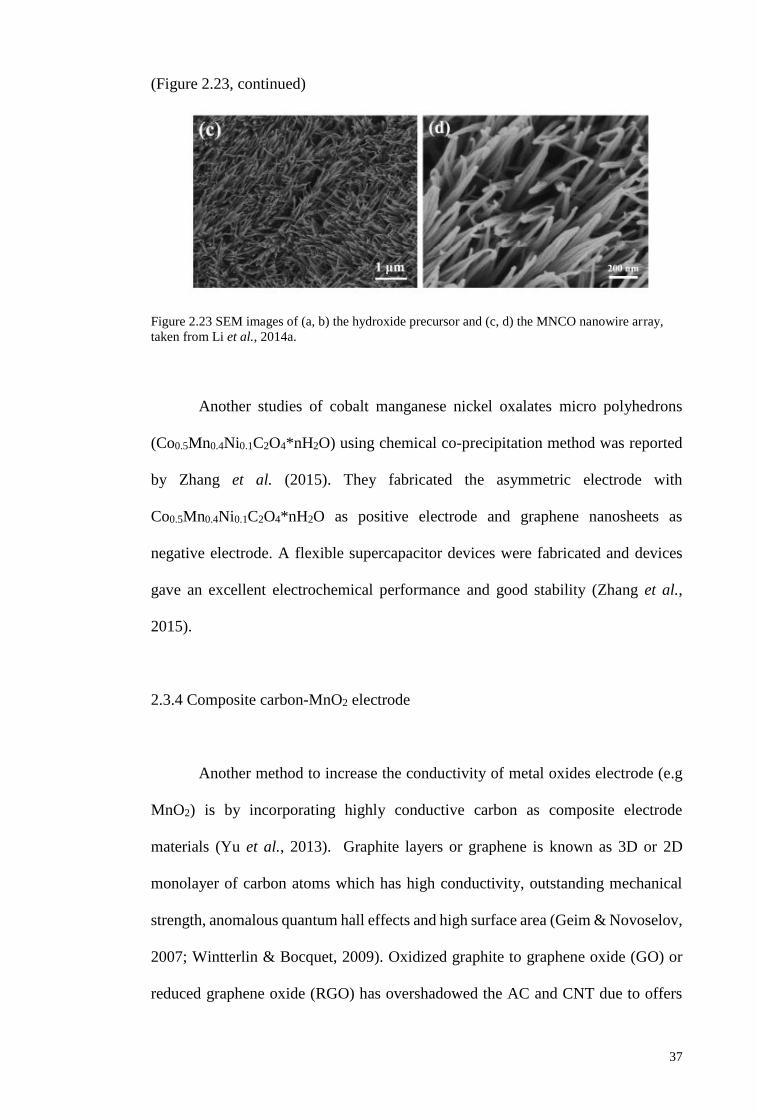
37
(Figure 2.23, continued)
Figure 2.23 SEM images of (a, b) the hydroxide precursor and (c, d) the MNCO nanowire array,
taken from Li et al., 2014a.
Another studies of cobalt manganese nickel oxalates micro polyhedrons
(Co0.5Mn0.4Ni0.1C2O4*nH2O) using chemical co-precipitation method was reported
by Zhang et al. (2015). They fabricated the asymmetric electrode with
Co0.5Mn0.4Ni0.1C2O4*nH2O as positive electrode and graphene nanosheets as
negative electrode. A flexible supercapacitor devices were fabricated and devices
gave an excellent electrochemical performance and good stability (Zhang et al.,
2015).
2.3.4 Composite carbon-MnO2 electrode
Another method to increase the conductivity of metal oxides electrode (e.g
MnO2) is by incorporating highly conductive carbon as composite electrode
materials (Yu et al., 2013). Graphite layers or graphene is known as 3D or 2D
monolayer of carbon atoms which has high conductivity, outstanding mechanical
strength, anomalous quantum hall effects and high surface area (Geim & Novoselov,
2007; Wintterlin & Bocquet, 2009). Oxidized graphite to graphene oxide (GO) or
reduced graphene oxide (RGO) has overshadowed the AC and CNT due to offers
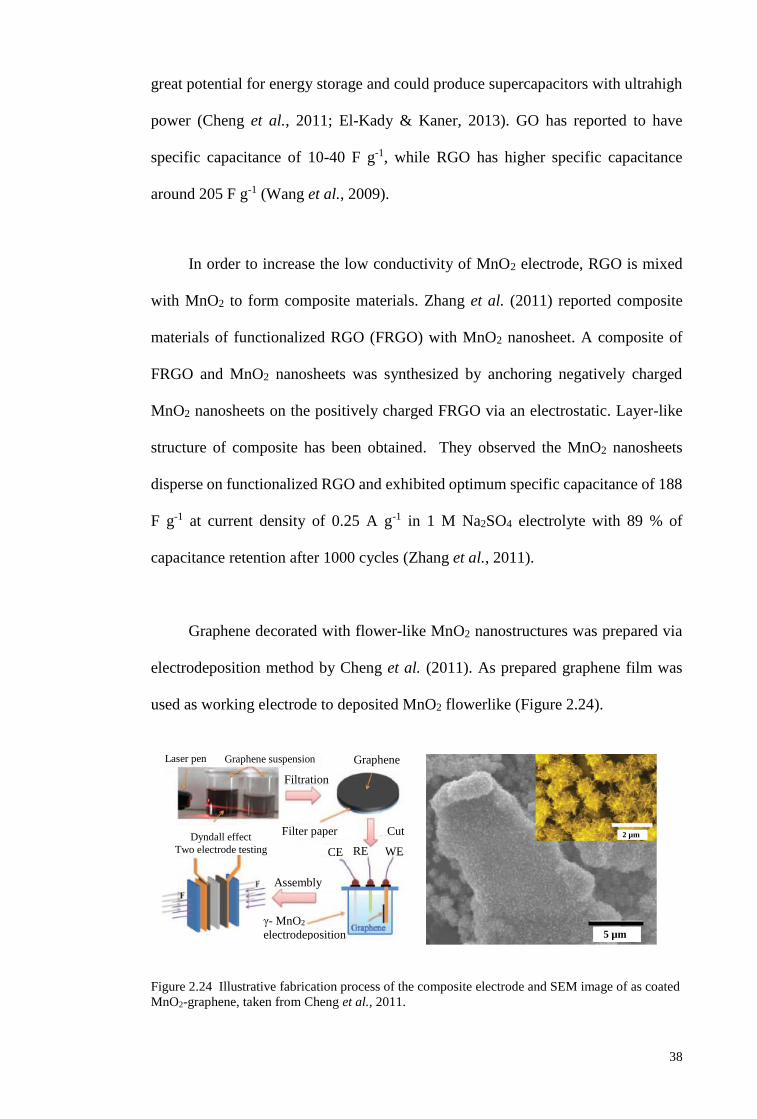
38
great potential for energy storage and could produce supercapacitors with ultrahigh
power (Cheng et al., 2011; El-Kady & Kaner, 2013). GO has reported to have
specific capacitance of 10-40 F g-1, while RGO has higher specific capacitance
around 205 F g-1 (Wang et al., 2009).
In order to increase the low conductivity of MnO2 electrode, RGO is mixed
with MnO2 to form composite materials. Zhang et al. (2011) reported composite
materials of functionalized RGO (FRGO) with MnO2 nanosheet. A composite of
FRGO and MnO2 nanosheets was synthesized by anchoring negatively charged
MnO2 nanosheets on the positively charged FRGO via an electrostatic. Layer-like
structure of composite has been obtained. They observed the MnO2 nanosheets
disperse on functionalized RGO and exhibited optimum specific capacitance of 188
F g-1 at current density of 0.25 A g-1 in 1 M Na2SO4 electrolyte with 89 % of
capacitance retention after 1000 cycles (Zhang et al., 2011).
Graphene decorated with flower-like MnO2 nanostructures was prepared via
electrodeposition method by Cheng et al. (2011). As prepared graphene film was
used as working electrode to deposited MnO2 flowerlike (Figure 2.24).
Figure 2.24 Illustrative fabrication process of the composite electrode and SEM image of as coated
MnO2-graphene, taken from Cheng et al., 2011.
Graphene suspension Graphene
Filtration
Dyndall effect
Two electrode testing
Filter paper Cut
CE RE WE
Assembly
γ- MnO2
electrodeposition 5 µm
2 µm
Laser pen
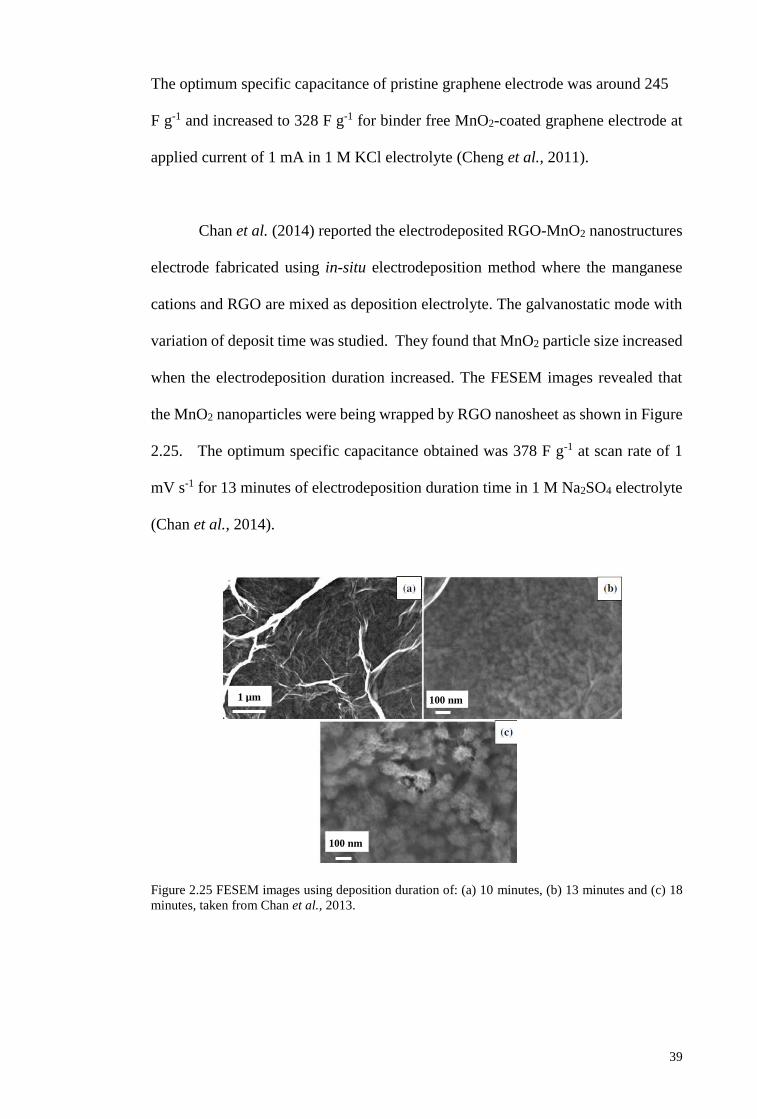
39
The optimum specific capacitance of pristine graphene electrode was around 245
F g-1 and increased to 328 F g-1 for binder free MnO2-coated graphene electrode at
applied current of 1 mA in 1 M KCl electrolyte (Cheng et al., 2011).
Chan et al. (2014) reported the electrodeposited RGO-MnO2 nanostructures
electrode fabricated using in-situ electrodeposition method where the manganese
cations and RGO are mixed as deposition electrolyte. The galvanostatic mode with
variation of deposit time was studied. They found that MnO2 particle size increased
when the electrodeposition duration increased. The FESEM images revealed that
the MnO2 nanoparticles were being wrapped by RGO nanosheet as shown in Figure
2.25. The optimum specific capacitance obtained was 378 F g-1 at scan rate of 1
mV s-1 for 13 minutes of electrodeposition duration time in 1 M Na2SO4 electrolyte
(Chan et al., 2014).
Figure 2.25 FESEM images using deposition duration of: (a) 10 minutes, (b) 13 minutes and (c) 18
minutes, taken from Chan et al., 2013.
1 µm 100 nm
100 nm
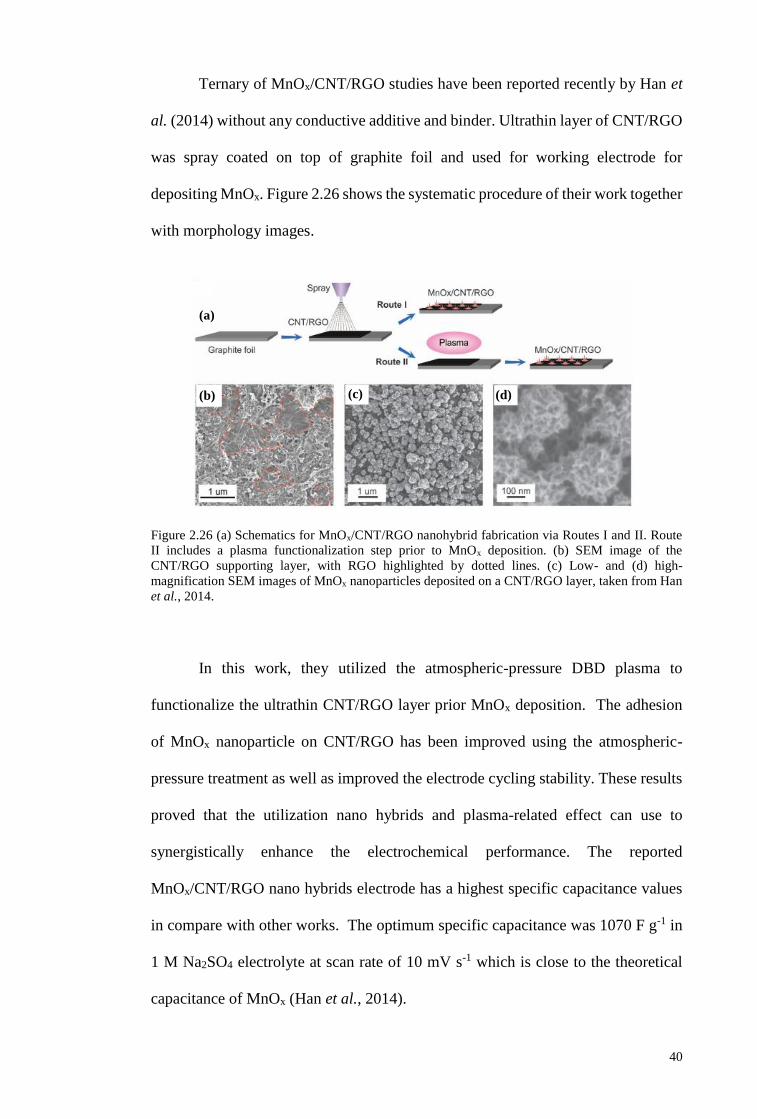
40
Ternary of MnOx/CNT/RGO studies have been reported recently by Han et
al. (2014) without any conductive additive and binder. Ultrathin layer of CNT/RGO
was spray coated on top of graphite foil and used for working electrode for
depositing MnOx. Figure 2.26 shows the systematic procedure of their work together
with morphology images.
Figure 2.26 (a) Schematics for MnOx/CNT/RGO nanohybrid fabrication via Routes I and II. Route
II includes a plasma functionalization step prior to MnOx deposition. (b) SEM image of the
CNT/RGO supporting layer, with RGO highlighted by dotted lines. (c) Low- and (d) high-
magnification SEM images of MnOx nanoparticles deposited on a CNT/RGO layer, taken from Han
et al., 2014.
In this work, they utilized the atmospheric-pressure DBD plasma to
functionalize the ultrathin CNT/RGO layer prior MnOx deposition. The adhesion
of MnOx nanoparticle on CNT/RGO has been improved using the atmospheric-
pressure treatment as well as improved the electrode cycling stability. These results
proved that the utilization nano hybrids and plasma-related effect can use to
synergistically enhance the electrochemical performance. The reported
MnOx/CNT/RGO nano hybrids electrode has a highest specific capacitance values
in compare with other works. The optimum specific capacitance was 1070 F g-1 in
1 M Na2SO4 electrolyte at scan rate of 10 mV s-1 which is close to the theoretical
capacitance of MnOx (Han et al., 2014).
(a)
(b) (c) (d)
41
2.4 Summary
Supercapacitor is believed to overcome the problem of increasing energy
demands due to their higher power density and longer cycle life than
batteries.
The electrode of supercapacitor is one of the important aspects to achieve
high energy and power density devices. Various electrode materials are used
for supercapacitor including carbon based materials, transition metal oxides
and conducting polymers. However, the pristine materials exhibited poor
electrochemical performance. Therefore composite electrode materials are
one of the effective alternatives to improve the performance.
Different composite materials and synthesis techniques will results in
different film morphologies which will affect the electrochemical
performance.
The drawbacks of MnO2 pristine electrode is effectively overcome by
composite it with several transition metal oxides or carbon based materials.
42
CHAPTER 3: METHODOLOGY
3.1 Introduction
There are several method that can be used for preparing supercapacitor’s
electrodes, e.g. hydrothermal, sol-gel method, co-precipitation method,
electrodeposition, and chemical vapour deposition (Wei et al., 2011). Most of the
MnO2 thin films have been synthesized in powder form, therefore the addition of
additives and binders is necessary to prepare the active materials as an electrode.
This procedure requires several preparation steps, starting from the preparation of a
slurry mixture containing the active materials, the binder (e.g. polyvinylidene
fluoride (PVDF)/polyvinylpyrrolidone (PVP)) and a conductivity enhancer (e.g.
carbon black), followed by slurry coating on a current collector (spin/dip coating,
doctor blade techniques) (Rusi & Majid, 2014b). The electrodes are ready for use
after heat treatment and pressurization process to eliminate the solvent and prevent
irregularities on the surface. The addition of insulating binders can cause blocking
effect on some parts of the active surface and reduce the specific capacitance of
cells. This also contributes to the additional resistance of the contact area between
the electrical conductor (i.e. the current collector and/or conductivity enhancer) and
the active materials, thus resulting in reduced power density (Park & Choi, 2010;
Yan & Cui, 1999). Therefore a more effective method to synthesize manganese
oxide based electrodes for electrochemical capacitor applications such as
electrodeposition is important to explore in which the oxide films are directly
deposited on the current collector. Electrodeposition is a simple, easy set up and able
to cater for large area deposition. In addition to this, it only requires low deposition
temperature and the film thickness can be controlled easily (Jagadale et al., 2013).
43
The composite metal oxide films also can be deposited from mixed precursors of
deposition electrolyte (Pauporté et al., 2003).
3.2 Materials and preparation
3.2.1 Electrodes
There are three type of electrodes that have been used in this work: working
electrode, counter electrode and reference electrode. Working electrode is inert.
Thus during the electrolysis process, it is stable against corrosion and does not
support the completing reaction of hydrogen (H2) evolution and oxygen (O2)
evolution/reduction. Counter electrode is used for controlling the current pass
through the working electrode. It provides the current of equal magnitude but
opposite sign to the working electrode. The reference electrode is used for
maintaining a constant potential throughout the experiment (Pletcher, 2009).
The working electrode used in this work was 4 cm2 of 304 stainless steel
(SS) substrate and it was purchased from Magna Value Sdn Bhd. Prior to
electrodeposition, the SS substrate was sonicated for 10 minutes and rinsed with
acetone for 3 times before dried in room temperature. Graphite rods of spectro-
Grade was used as counter electrode for electrodeposition step. Silver/silver chloride
(Ag/AgCl) and platinum electrodes were used as the reference electrode and counter
electrode for electrochemical test, respectively.
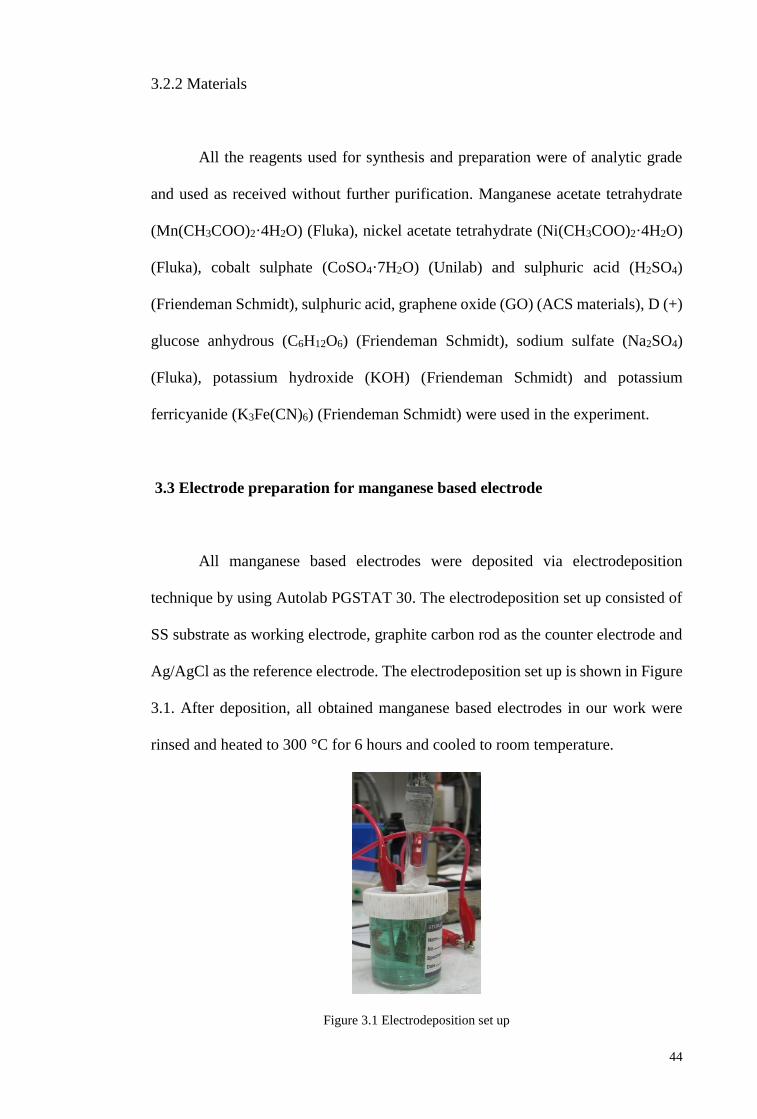
44
3.2.2 Materials
All the reagents used for synthesis and preparation were of analytic grade
and used as received without further purification. Manganese acetate tetrahydrate
(Mn(CH3COO)2·4H2O) (Fluka), nickel acetate tetrahydrate (Ni(CH3COO)2·4H2O)
(Fluka), cobalt sulphate (CoSO4·7H2O) (Unilab) and sulphuric acid (H2SO4)
(Friendeman Schmidt), sulphuric acid, graphene oxide (GO) (ACS materials), D (+)
glucose anhydrous (C6H12O6) (Friendeman Schmidt), sodium sulfate (Na2SO4)
(Fluka), potassium hydroxide (KOH) (Friendeman Schmidt) and potassium
ferricyanide (K3Fe(CN)6) (Friendeman Schmidt) were used in the experiment.
3.3 Electrode preparation for manganese based electrode
All manganese based electrodes were deposited via electrodeposition
technique by using Autolab PGSTAT 30. The electrodeposition set up consisted of
SS substrate as working electrode, graphite carbon rod as the counter electrode and
Ag/AgCl as the reference electrode. The electrodeposition set up is shown in Figure
3.1. After deposition, all obtained manganese based electrodes in our work were
rinsed and heated to 300 °C for 6 hours and cooled to room temperature.
Figure 3.1 Electrodeposition set up
45
3.3.1 Electrodeposition of MnO2 electrode
Mn(CH3COO)2.4H2O were first dissolved in distilled water and stirred for
30 minutes to get a homogeneous deposition electrolyte solution at room
temperature. MnO2 was electrodeposited onto 4 cm2 SS by chronopotentiometry
(CP) mode in 10 minutes at a constant current of 8 mA. MnO2 electrode was
deposited in various deposition electrolyte concentration, i.e 0.0025 M , 0.005 M,
0.01 M and 0.02 M of Mn(CH3COO)2. 4H2O aqueous solutions and the deposited
electrode denoted as 0.00025 M, 0.005 M, 0.01 M and 0.02 M, respectively. All
electrochemical tests were done using two electrodes system in 0.5 M KOH
electrolyte.
3.3.2 Electrodeposition of MnO2-NiO electrode
The binary MnO2-NiO electrodes were also electrodeposited onto SS using
the CP mode for 10 minutes at applied current of 8 mA. The deposition electrolyte
consist of 20 ml of aqueous 0.01 M Mn(CH3COO)2.4H2O, 4 ml of 0.8 M H2SO4 and
20 ml of different concentrations (0.15 M, 0.2 M, 0.25 M, 0.3 M, 0.35 M, and 0.4
M) of Ni(CH3COO)2.4H2O. These deposition electrolytes were then sonicated for
10 min. The deposited electrodes were denoted as NiO-15 NiO-20, NiO-25, NiO-
30, NiO-35, and NiO-40. For example, NiO-15 denotes the MnO2-NiO binary
deposited from a solution containing 0.8 M H2SO4, 0.01 M Mn(CH3COO)2.4H2O
and 0.15 M Ni(CH3COO)2.4H2O. The electrochemical tests of deposited electrodes
were studied using three electrodes systems in Na2SO4 electrolyte.
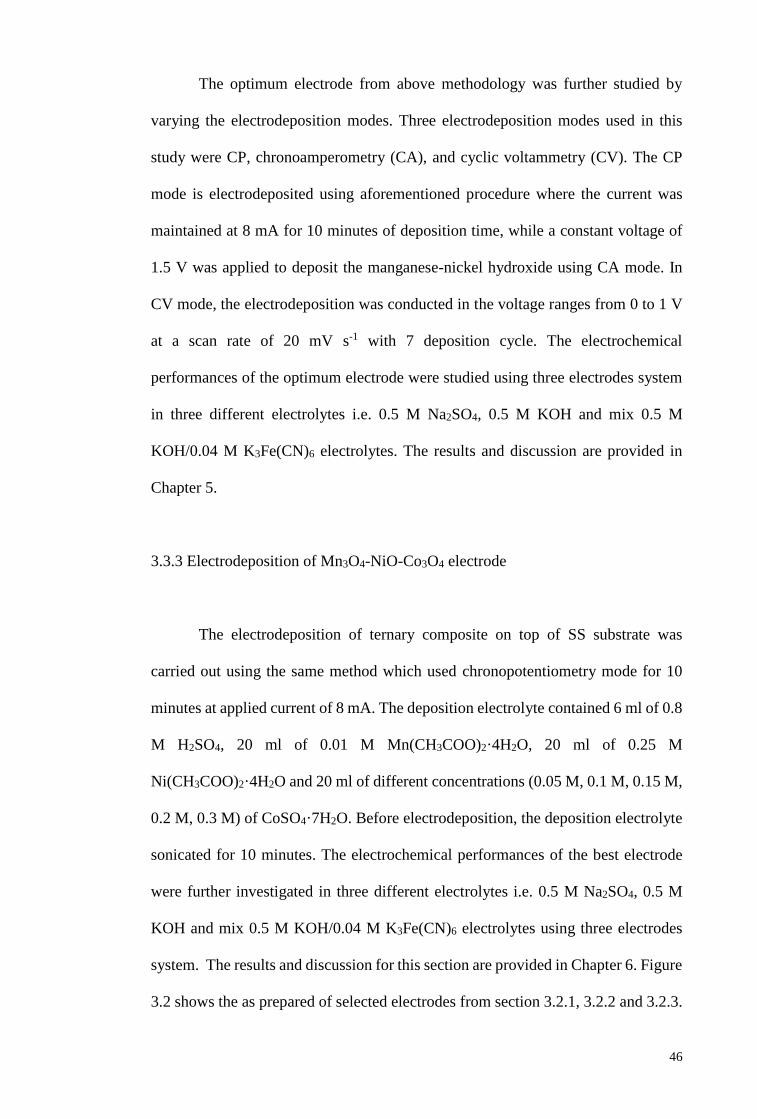
46
The optimum electrode from above methodology was further studied by
varying the electrodeposition modes. Three electrodeposition modes used in this
study were CP, chronoamperometry (CA), and cyclic voltammetry (CV). The CP
mode is electrodeposited using aforementioned procedure where the current was
maintained at 8 mA for 10 minutes of deposition time, while a constant voltage of
1.5 V was applied to deposit the manganese-nickel hydroxide using CA mode. In
CV mode, the electrodeposition was conducted in the voltage ranges from 0 to 1 V
at a scan rate of 20 mV s-1 with 7 deposition cycle. The electrochemical
performances of the optimum electrode were studied using three electrodes system
in three different electrolytes i.e. 0.5 M Na2SO4, 0.5 M KOH and mix 0.5 M
KOH/0.04 M K3Fe(CN)6 electrolytes. The results and discussion are provided in
Chapter 5.
3.3.3 Electrodeposition of Mn3O4-NiO-Co3O4 electrode
The electrodeposition of ternary composite on top of SS substrate was
carried out using the same method which used chronopotentiometry mode for 10
minutes at applied current of 8 mA. The deposition electrolyte contained 6 ml of 0.8
M H2SO4, 20 ml of 0.01 M Mn(CH3COO)2·4H2O, 20 ml of 0.25 M
Ni(CH3COO)2·4H2O and 20 ml of different concentrations (0.05 M, 0.1 M, 0.15 M,
0.2 M, 0.3 M) of CoSO4·7H2O. Before electrodeposition, the deposition electrolyte
sonicated for 10 minutes. The electrochemical performances of the best electrode
were further investigated in three different electrolytes i.e. 0.5 M Na2SO4, 0.5 M
KOH and mix 0.5 M KOH/0.04 M K3Fe(CN)6 electrolytes using three electrodes
system. The results and discussion for this section are provided in Chapter 6. Figure
3.2 shows the as prepared of selected electrodes from section 3.2.1, 3.2.2 and 3.2.3.
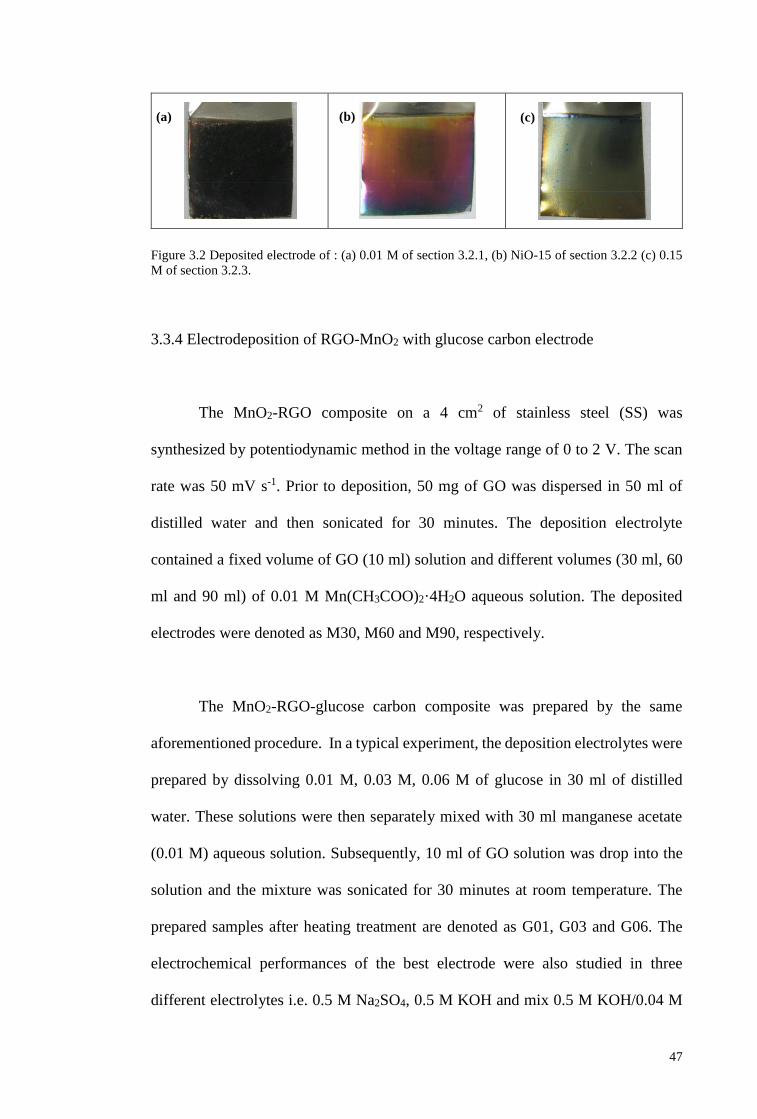
47
Figure 3.2 Deposited electrode of : (a) 0.01 M of section 3.2.1, (b) NiO-15 of section 3.2.2 (c) 0.15
M of section 3.2.3.
3.3.4 Electrodeposition of RGO-MnO2 with glucose carbon electrode
The MnO2-RGO composite on a 4 cm2 of stainless steel (SS) was
synthesized by potentiodynamic method in the voltage range of 0 to 2 V. The scan
rate was 50 mV s-1. Prior to deposition, 50 mg of GO was dispersed in 50 ml of
distilled water and then sonicated for 30 minutes. The deposition electrolyte
contained a fixed volume of GO (10 ml) solution and different volumes (30 ml, 60
ml and 90 ml) of 0.01 M Mn(CH3COO)2·4H2O aqueous solution. The deposited
electrodes were denoted as M30, M60 and M90, respectively.
The MnO2-RGO-glucose carbon composite was prepared by the same
aforementioned procedure. In a typical experiment, the deposition electrolytes were
prepared by dissolving 0.01 M, 0.03 M, 0.06 M of glucose in 30 ml of distilled
water. These solutions were then separately mixed with 30 ml manganese acetate
(0.01 M) aqueous solution. Subsequently, 10 ml of GO solution was drop into the
solution and the mixture was sonicated for 30 minutes at room temperature. The
prepared samples after heating treatment are denoted as G01, G03 and G06. The
electrochemical performances of the best electrode were also studied in three
different electrolytes i.e. 0.5 M Na2SO4, 0.5 M KOH and mix 0.5 M KOH/0.04 M
(a) (b) (c)
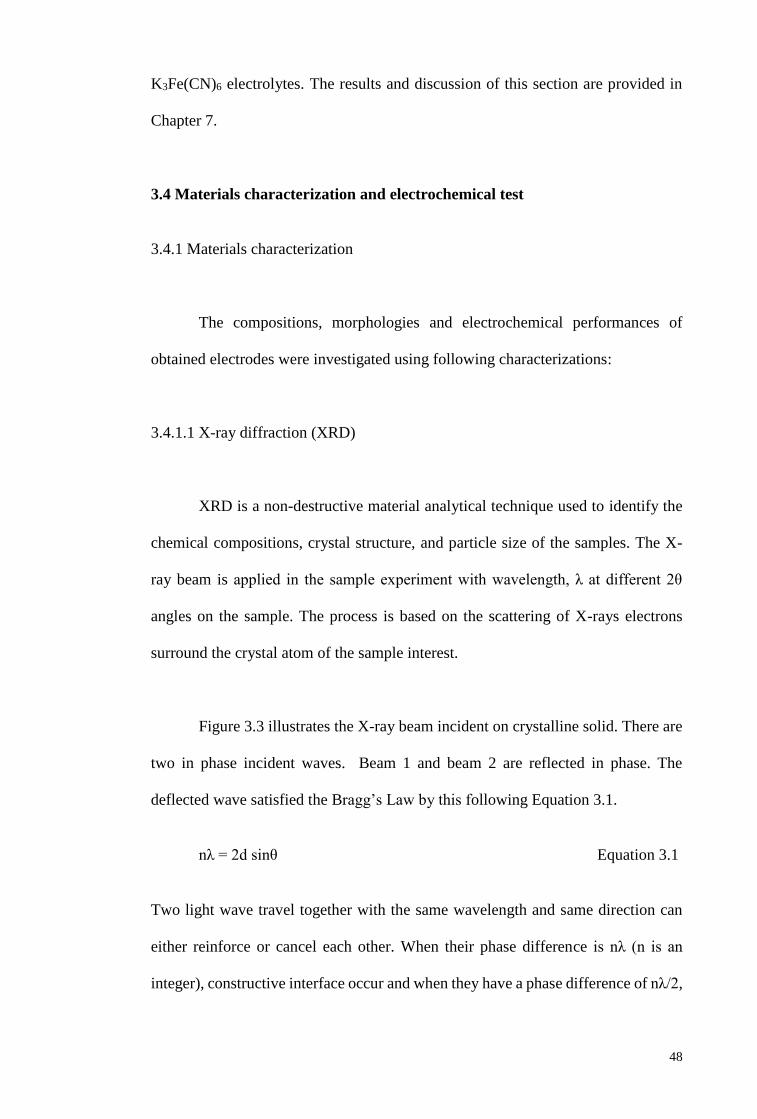
48
K3Fe(CN)6 electrolytes. The results and discussion of this section are provided in
Chapter 7.
3.4 Materials characterization and electrochemical test
3.4.1 Materials characterization
The compositions, morphologies and electrochemical performances of
obtained electrodes were investigated using following characterizations:
3.4.1.1 X-ray diffraction (XRD)
XRD is a non-destructive material analytical technique used to identify the
chemical compositions, crystal structure, and particle size of the samples. The X-
ray beam is applied in the sample experiment with wavelength, λ at different 2θ
angles on the sample. The process is based on the scattering of X-rays electrons
surround the crystal atom of the sample interest.
Figure 3.3 illustrates the X-ray beam incident on crystalline solid. There are
two in phase incident waves. Beam 1 and beam 2 are reflected in phase. The
deflected wave satisfied the Bragg’s Law by this following Equation 3.1.
nλ = 2d sinθ Equation 3.1
Two light wave travel together with the same wavelength and same direction can
either reinforce or cancel each other. When their phase difference is nλ (n is an
integer), constructive interface occur and when they have a phase difference of nλ/2,
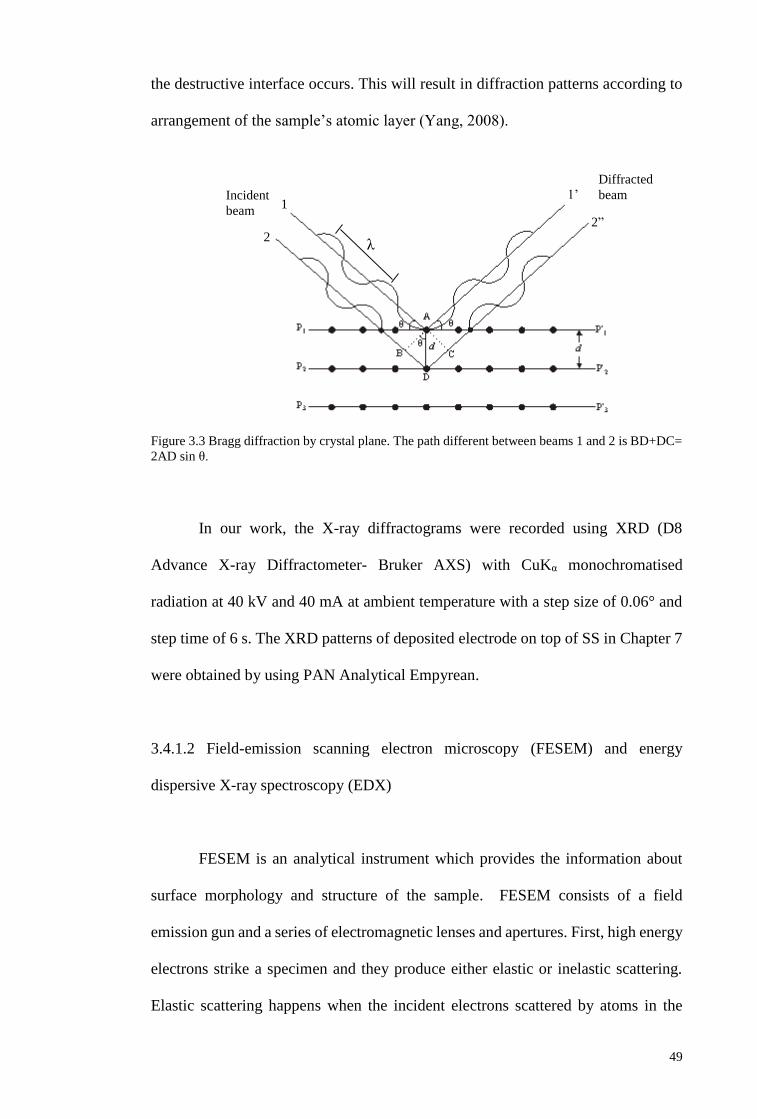
49
the destructive interface occurs. This will result in diffraction patterns according to
arrangement of the sample’s atomic layer (Yang, 2008).
Figure 3.3 Bragg diffraction by crystal plane. The path different between beams 1 and 2 is BD+DC=
2AD sin θ.
In our work, the X-ray diffractograms were recorded using XRD (D8
Advance X-ray Diffractometer- Bruker AXS) with CuKα monochromatised
radiation at 40 kV and 40 mA at ambient temperature with a step size of 0.06° and
step time of 6 s. The XRD patterns of deposited electrode on top of SS in Chapter 7
were obtained by using PAN Analytical Empyrean.
3.4.1.2 Field-emission scanning electron microscopy (FESEM) and energy
dispersive X-ray spectroscopy (EDX)
FESEM is an analytical instrument which provides the information about
surface morphology and structure of the sample. FESEM consists of a field
emission gun and a series of electromagnetic lenses and apertures. First, high energy
electrons strike a specimen and they produce either elastic or inelastic scattering.
Elastic scattering happens when the incident electrons scattered by atoms in the
2
1 Incident
beam
Diffracted
beam
2”
1’
λ
50
specimen while for inelastic scattering, the electrons is ejected from the atoms in the
specimen. During inelastic scattering process, the incident electrons transfer the
kinetic energy to the electrons in the specimen’s atoms. The detected signal
electrons from the specimen are collected by detector and it is used to reconstruct
images (Yang, 2008).
EDX is used to investigate the elemental compositions of the specimen. A
high energy electrons beam is focused into the interested sample. The incident beam
may excite an electron in an inner shell of sample and ejecting it from the shell while
creating an electron-hole. An electron from its outer shells fills the hole and results
in the difference in energy between higher energy shell and lower energy shell which
may be released in the form of X-rays. The energy of X-rays emitted from the
specimen is then measured by energy dispersive spectrometer.
In this thesis, the FESEM equipped with EDX of Jeol JSM-7600F was used
to examine our sample morphologies and elemental compositions.
3.4.1.3 Transmission electron microscopy (TEM)
TEM is a microscopy instrument which use to investigate the morphology
of a sample with significantly high resolution. It has following component along its
optical path i.e. light source (electron gun), condenser lens (electromagnetic lens),
specimen stage, and objective lens and projector lens. The basic principle is based
on a high energy beam of electrons is transmitted through an ultra-thin specimen,
interacting with the specimen as it passed thought. An image is resulted from the
interaction of the electrons transmit through the specimen (Yang, 2008).
51
Jeol JEM-2100F TEM was used to investigate the composite electrode
structure. Prior to the TEM characterization, the scraped off film were dispersed in
distilled water and sonicated for 5 minutes. Then, the solution was dropped on a
copper grid and allowed to dry for 72 hours at room temperature.
3.4.1.4 Thermogravimetric analysis (TGA)
TGA is an analytic method that used to measure the mass changes of a
sample with the temperature increase at a constant heating rate. Samples are placed
in the furnace and its mass change is monitored by a thermo balance. The main
purpose of this TGA is to analyze the material decomposition and thermal stability
through mass change as a function of temperature.
In the work of Chapter 7, the thermal behaviours of D (+) glucose was
examined by Thermal Gravimentric Analyser, TGA Q500 under nitrogen gas at a
heating rate of 14° C min-1.
3.4.1.5 Raman spectroscopy
Raman spectroscopy is a spectroscopic technique that used to examine the
molecular vibrational, rotational, and other low-frequency modes of the sample.
When a monochromatic light source (i.e laser) illuminates on the sample, the laser
light interacts with molecular vibrations, phonons or other excitations in the system.
Energy of laser photons will be shifted up or down, this sifted energy gives
information of molecular vibrational of the system.
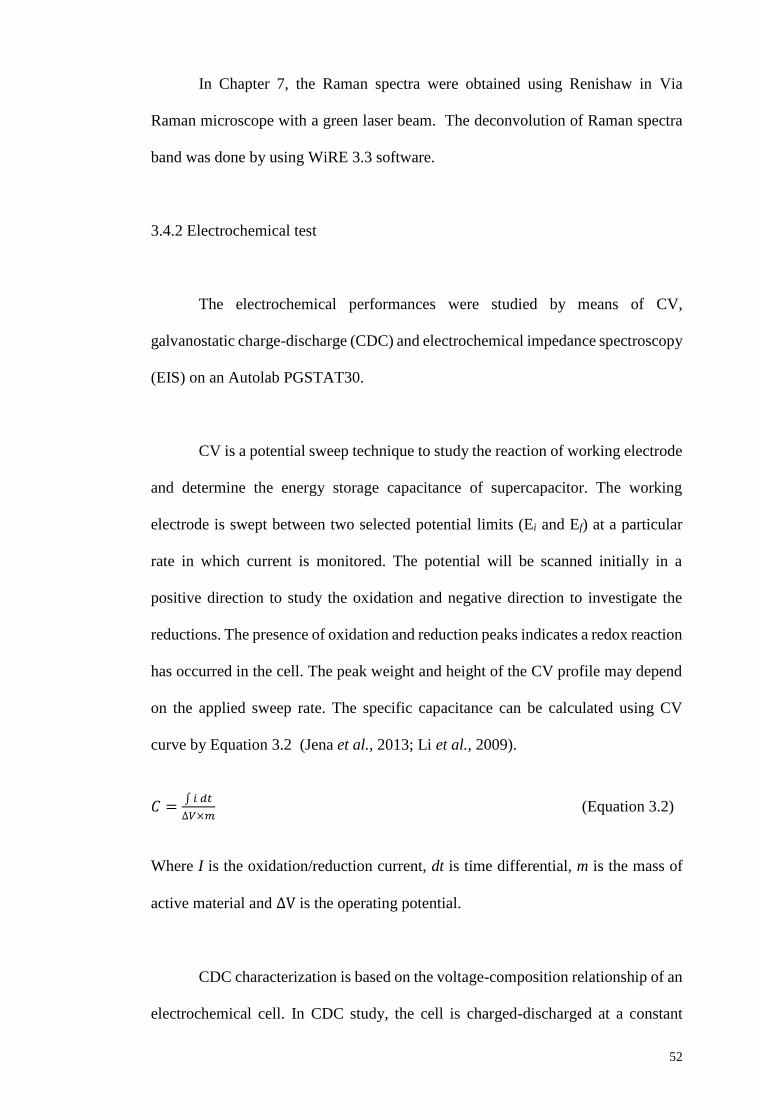
52
In Chapter 7, the Raman spectra were obtained using Renishaw in Via
Raman microscope with a green laser beam. The deconvolution of Raman spectra
band was done by using WiRE 3.3 software.
3.4.2 Electrochemical test
The electrochemical performances were studied by means of CV,
galvanostatic charge-discharge (CDC) and electrochemical impedance spectroscopy
(EIS) on an Autolab PGSTAT30.
CV is a potential sweep technique to study the reaction of working electrode
and determine the energy storage capacitance of supercapacitor. The working
electrode is swept between two selected potential limits (Ei and Ef) at a particular
rate in which current is monitored. The potential will be scanned initially in a
positive direction to study the oxidation and negative direction to investigate the
reductions. The presence of oxidation and reduction peaks indicates a redox reaction
has occurred in the cell. The peak weight and height of the CV profile may depend
on the applied sweep rate. The specific capacitance can be calculated using CV
curve by Equation 3.2 (Jena et al., 2013; Li et al., 2009).
𝐶 =∫ 𝑖 𝑑𝑡
∆𝑉×𝑚 (Equation 3.2)
Where I is the oxidation/reduction current, dt is time differential, m is the mass of
active material and ∆V is the operating potential.
CDC characterization is based on the voltage-composition relationship of an
electrochemical cell. In CDC study, the cell is charged-discharged at a constant
53
current between maximum potential until cut-off discharge potential is applied. The
CDC measurement of potential against time is obtained and the specific capacitance
can be calculated from CDC discharge curve by using the following Equation 3.3
(Li et al., 2009).
𝐶 =𝐼
𝑑𝑉
𝑑𝑡 ×𝑚
(Equation 3.3)
Where I is the discharge current, dV/dt is the change of discharge potential with
respect to discharge time and m is mass of the active materials.
In this thesis, most of CV and CDC studies were conducted on a three-
electrode system, except for the works done in Chapter 4. The deposited electrode
was use as working electrode. Platinum and Ag/AgCl were used as counter
electrode and reference electrode respectively. In Chapter 4, symmetric MnO2
electrodes were used for the two-electrode system to examine the CV and CDC
profile in 0.5 M KOH electrolyte.
EIS is used to study the impedance resistance or conductivity of the electrode
materials. The analysis of impedance study for various electrodes structure and
electrolyte are very important to design and optimize the device performance. In this
work, all of the EIS tests were performed within the frequency from 0.01 Hz to 100
KHz at applied potential of 0 V in Na2SO4 electrolyte.
54
3.5 Summary
This chapter discussed the methodology to prepare the manganese based
electrodes systems namely MnO2, MnO2-NiO, Mn3O4-NiO-Co3O4 and RGO-MnO2-
glucose carbon. All obtained electrodes were characterized using XRD, EDX,
FESEM, TEM, CV, CDC and EIS. Results and discussions from these
characterization techniques will be given in the following chapters.
55
CHAPTER 4: MANGANESE OXIDE ELECTRODE SYSTEM
4.1 Introduction
In the past decades, transition metal oxides have been widely used in many
applications such as sensors (Sun et al., 2014), optical (Buchholz et al., 2009) and
magnetic material (Cordente et al., 2001), catalyst (Lin et al., 2003) and storage
energy devices (Hasa et al., 2015; Shen et al., 2015; Wei et al., 2012). For
supercapacitor applications, RuO2 is well known as the best material to produce high
energy density and high stability devices. However its disadvantages in toxicity
environmental and high cost material limits its application, hence research interest
have fall into inexpensive and non-toxic transition metal oxides for the future
supercapacitors (Rusi & Majid, 2013, 2014a). MnO2 is one of the promising material
to replace ruthenium dioxide (Babakhani & Ivey, 2010, 2011; Reddy & Reddy,
2003). The crystal structure, size and morphology of MnO2 electrode materials are
the important factor which influences the capacitor performance (Babakhani & Ivey,
2010; Devaraj & Munichandraiah, 2008). As a result, developing metal oxide
electrodes with new morphologies for enhanced properties have attracted great
research interests. Many efforts have been focus to synthesis MnO2 electrode with
different morphologies and different effective approaches method (Li et al., 2012a).
In this work, the simple and easy galvanostatic of electrodeposition method
has been used to synthesis flowerlike structure MnO2 without using any physical
template and additional of any surfactant. Electrodeposition method is relative easy
and accurate control of the surface morphology of deposited film by changing
deposition parameters (Babakhani & Ivey, 2011).
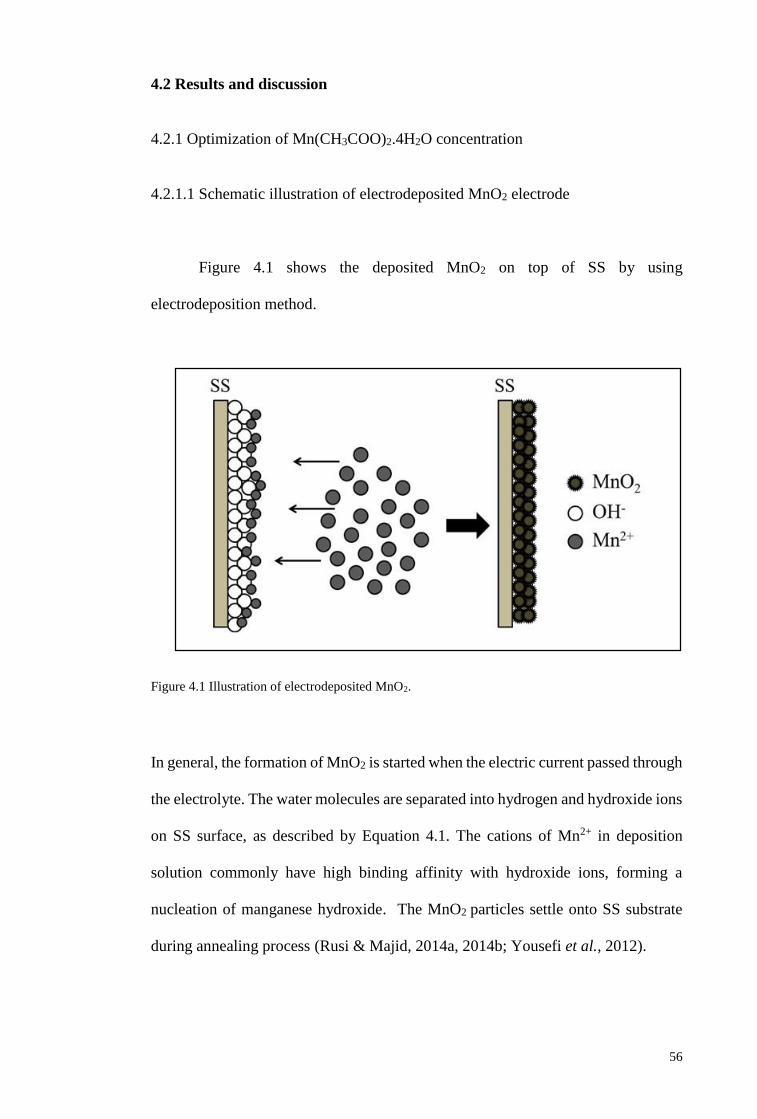
56
4.2 Results and discussion
4.2.1 Optimization of Mn(CH3COO)2.4H2O concentration
4.2.1.1 Schematic illustration of electrodeposited MnO2 electrode
Figure 4.1 shows the deposited MnO2 on top of SS by using
electrodeposition method.
Figure 4.1 Illustration of electrodeposited MnO2.
In general, the formation of MnO2 is started when the electric current passed through
the electrolyte. The water molecules are separated into hydrogen and hydroxide ions
on SS surface, as described by Equation 4.1. The cations of Mn2+ in deposition
solution commonly have high binding affinity with hydroxide ions, forming a
nucleation of manganese hydroxide. The MnO2 particles settle onto SS substrate
during annealing process (Rusi & Majid, 2014a, 2014b; Yousefi et al., 2012).
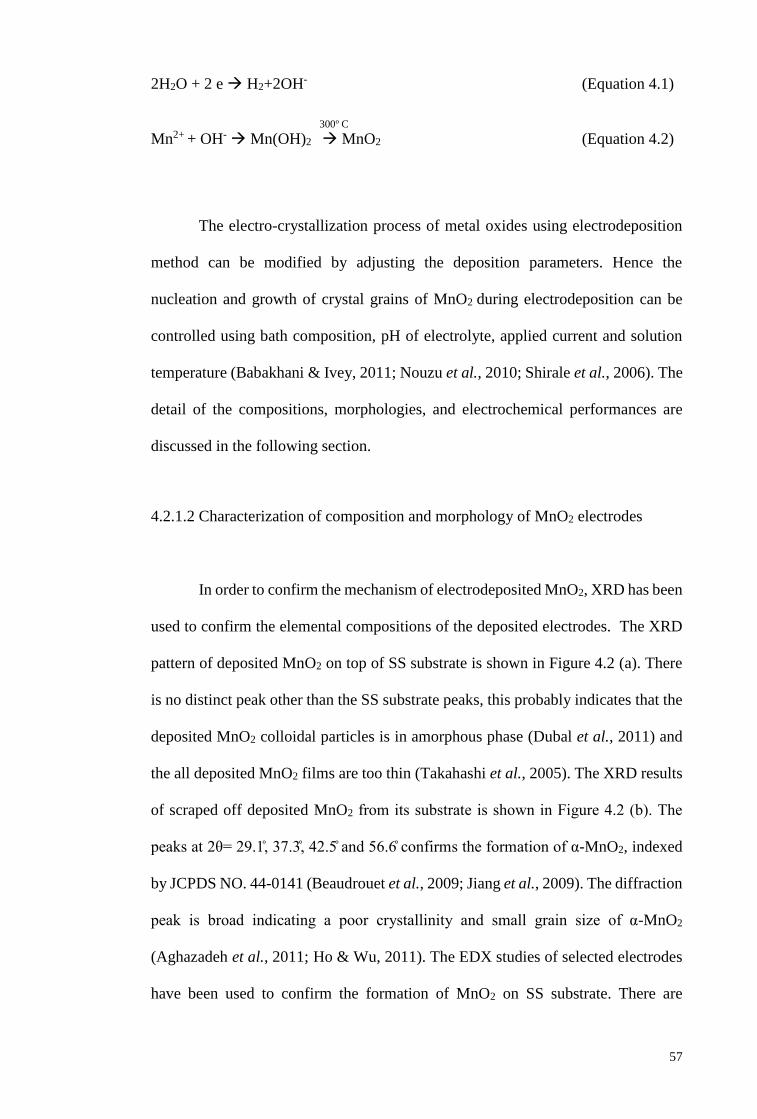
57
2H2O + 2 e H2+2OH- (Equation 4.1)
Mn2+ + OH- Mn(OH)2 MnO2 (Equation 4.2)
The electro-crystallization process of metal oxides using electrodeposition
method can be modified by adjusting the deposition parameters. Hence the
nucleation and growth of crystal grains of MnO2 during electrodeposition can be
controlled using bath composition, pH of electrolyte, applied current and solution
temperature (Babakhani & Ivey, 2011; Nouzu et al., 2010; Shirale et al., 2006). The
detail of the compositions, morphologies, and electrochemical performances are
discussed in the following section.
4.2.1.2 Characterization of composition and morphology of MnO2 electrodes
In order to confirm the mechanism of electrodeposited MnO2, XRD has been
used to confirm the elemental compositions of the deposited electrodes. The XRD
pattern of deposited MnO2 on top of SS substrate is shown in Figure 4.2 (a). There
is no distinct peak other than the SS substrate peaks, this probably indicates that the
deposited MnO2 colloidal particles is in amorphous phase (Dubal et al., 2011) and
the all deposited MnO2 films are too thin (Takahashi et al., 2005). The XRD results
of scraped off deposited MnO2 from its substrate is shown in Figure 4.2 (b). The
peaks at 2θ= 29.1, 37.3, 42.5 and 56.6 confirms the formation of α-MnO2, indexed
by JCPDS NO. 44-0141 (Beaudrouet et al., 2009; Jiang et al., 2009). The diffraction
peak is broad indicating a poor crystallinity and small grain size of α-MnO2
(Aghazadeh et al., 2011; Ho & Wu, 2011). The EDX studies of selected electrodes
have been used to confirm the formation of MnO2 on SS substrate. There are
300o C
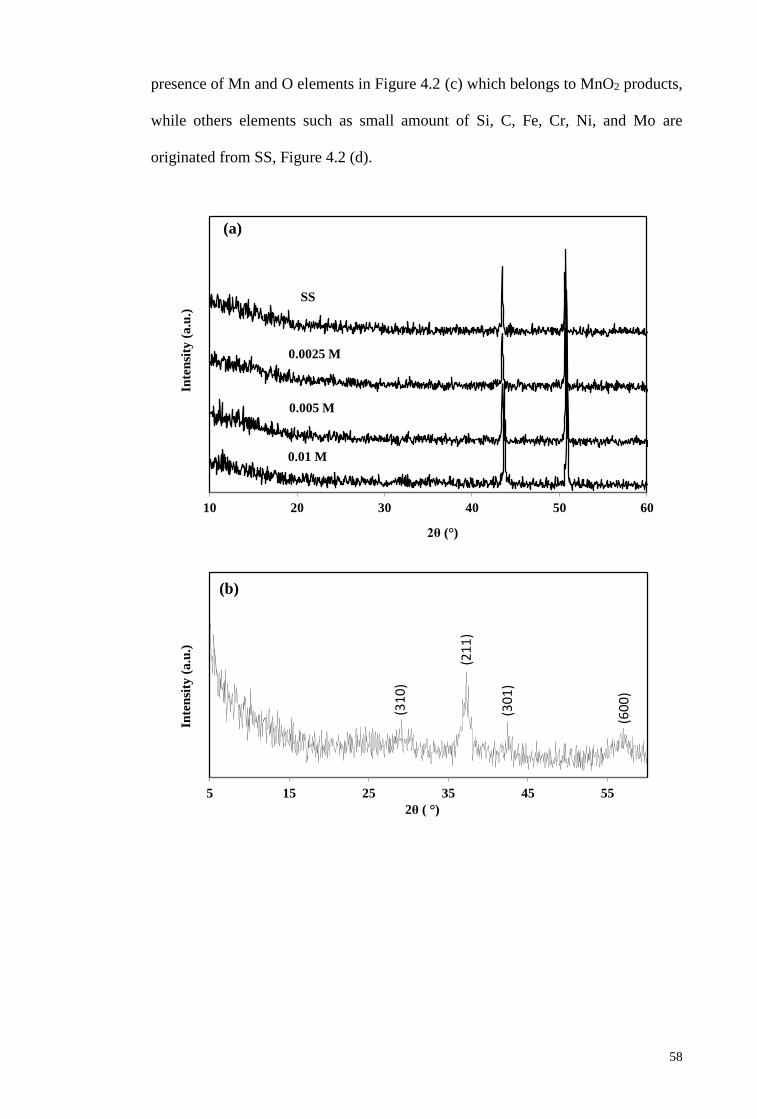
58
presence of Mn and O elements in Figure 4.2 (c) which belongs to MnO2 products,
while others elements such as small amount of Si, C, Fe, Cr, Ni, and Mo are
originated from SS, Figure 4.2 (d).
10 20 30 40 50 60
Inte
nsi
ty (
a.u
.)
2θ (°)
0.01 M
0.005 M
0.0025 M
SS
5 15 25 35 45 55
Inte
nsi
ty (
a.u
.)
2θ ( °)
(31
0)
(21
1)
(60
0)
(30
1)
(a)
(b)
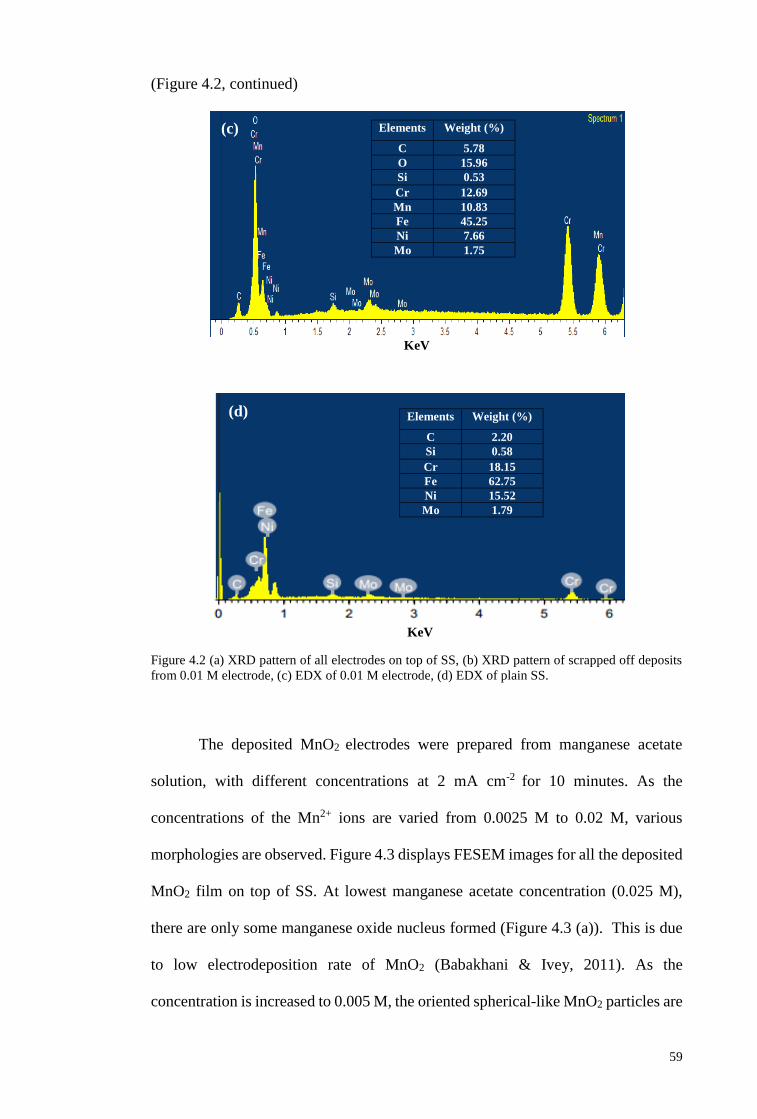
59
(Figure 4.2, continued)
Figure 4.2 (a) XRD pattern of all electrodes on top of SS, (b) XRD pattern of scrapped off deposits
from 0.01 M electrode, (c) EDX of 0.01 M electrode, (d) EDX of plain SS.
The deposited MnO2 electrodes were prepared from manganese acetate
solution, with different concentrations at 2 mA cm-2 for 10 minutes. As the
concentrations of the Mn2+ ions are varied from 0.0025 M to 0.02 M, various
morphologies are observed. Figure 4.3 displays FESEM images for all the deposited
MnO2 film on top of SS. At lowest manganese acetate concentration (0.025 M),
there are only some manganese oxide nucleus formed (Figure 4.3 (a)). This is due
to low electrodeposition rate of MnO2 (Babakhani & Ivey, 2011). As the
concentration is increased to 0.005 M, the oriented spherical-like MnO2 particles are
KeV
KeV
(c)
(d)
Elements Weight (%)
C 5.78
O 15.96
Si 0.53
Cr 12.69
Mn 10.83
Fe 45.25
Ni 7.66
Mo 1.75
Elements Weight (%)
C 2.20
Si 0.58
Cr 18.15
Fe 62.75
Ni 15.52
Mo 1.79
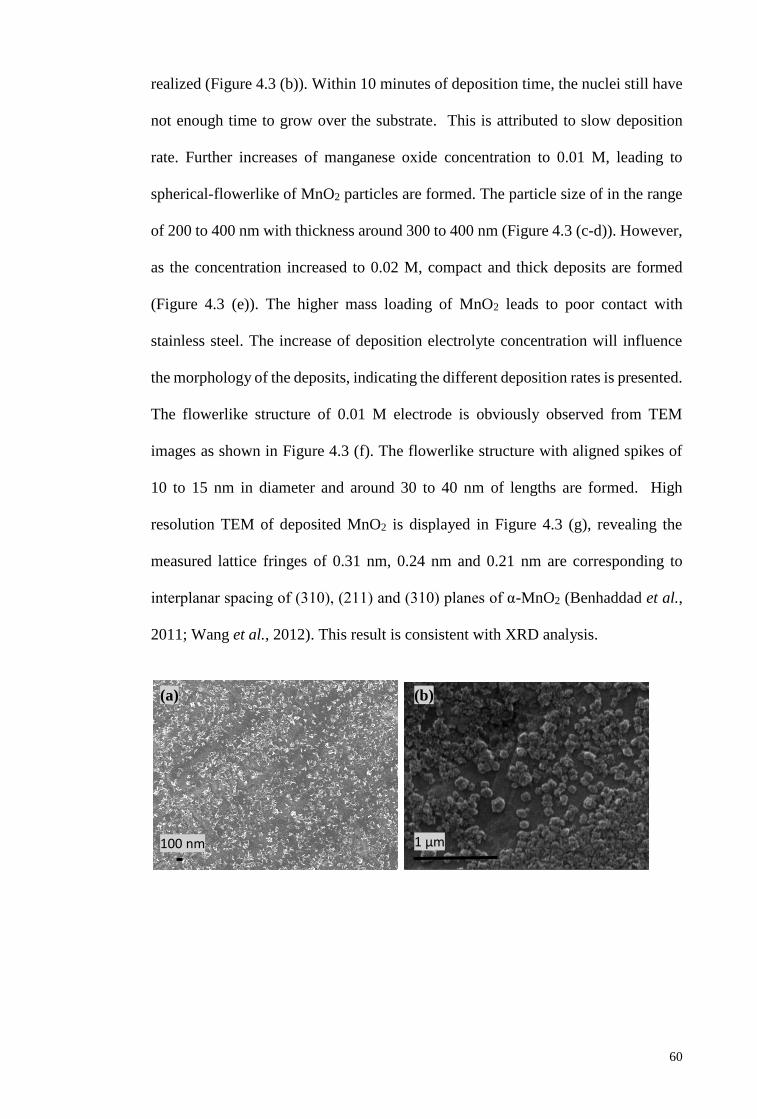
60
realized (Figure 4.3 (b)). Within 10 minutes of deposition time, the nuclei still have
not enough time to grow over the substrate. This is attributed to slow deposition
rate. Further increases of manganese oxide concentration to 0.01 M, leading to
spherical-flowerlike of MnO2 particles are formed. The particle size of in the range
of 200 to 400 nm with thickness around 300 to 400 nm (Figure 4.3 (c-d)). However,
as the concentration increased to 0.02 M, compact and thick deposits are formed
(Figure 4.3 (e)). The higher mass loading of MnO2 leads to poor contact with
stainless steel. The increase of deposition electrolyte concentration will influence
the morphology of the deposits, indicating the different deposition rates is presented.
The flowerlike structure of 0.01 M electrode is obviously observed from TEM
images as shown in Figure 4.3 (f). The flowerlike structure with aligned spikes of
10 to 15 nm in diameter and around 30 to 40 nm of lengths are formed. High
resolution TEM of deposited MnO2 is displayed in Figure 4.3 (g), revealing the
measured lattice fringes of 0.31 nm, 0.24 nm and 0.21 nm are corresponding to
interplanar spacing of (310), (211) and (310) planes of α-MnO2 (Benhaddad et al.,
2011; Wang et al., 2012). This result is consistent with XRD analysis.
1 µm 100 nm
(a) (b)
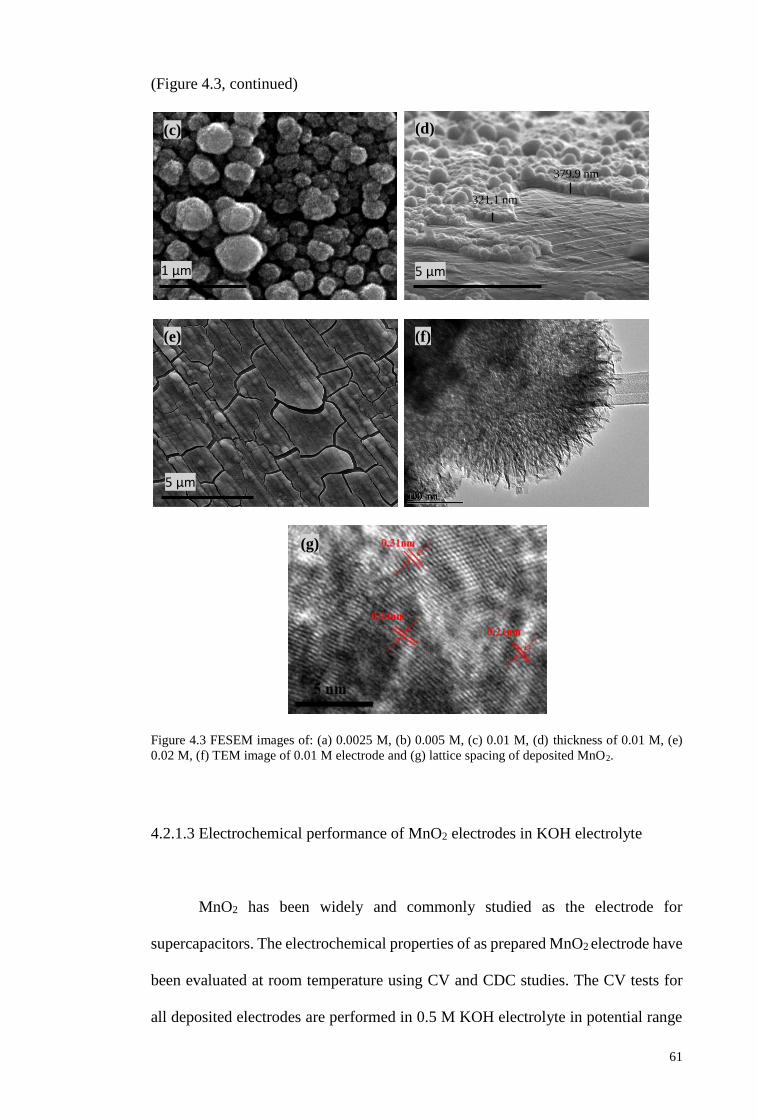
61
(Figure 4.3, continued)
Figure 4.3 FESEM images of: (a) 0.0025 M, (b) 0.005 M, (c) 0.01 M, (d) thickness of 0.01 M, (e)
0.02 M, (f) TEM image of 0.01 M electrode and (g) lattice spacing of deposited MnO2.
4.2.1.3 Electrochemical performance of MnO2 electrodes in KOH electrolyte
MnO2 has been widely and commonly studied as the electrode for
supercapacitors. The electrochemical properties of as prepared MnO2 electrode have
been evaluated at room temperature using CV and CDC studies. The CV tests for
all deposited electrodes are performed in 0.5 M KOH electrolyte in potential range
5 µm 1 µm
5 µm
379.9 nm
321.1 nm
(c) (d)
(e) (f)
(g)
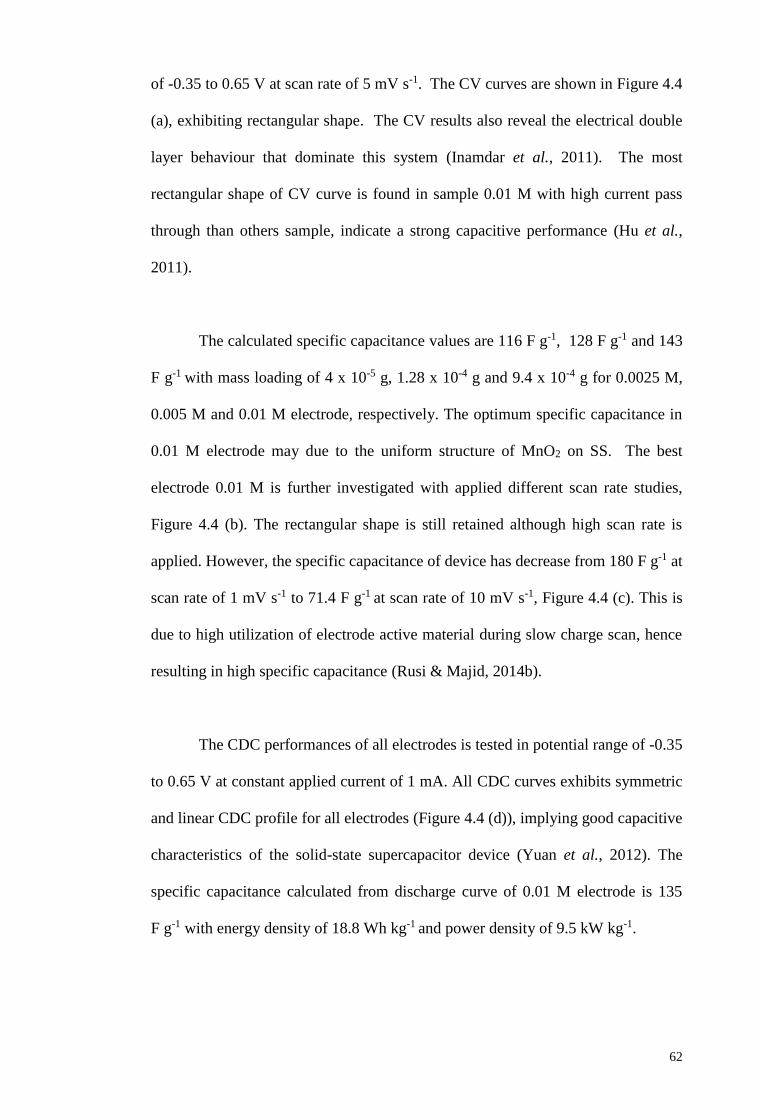
62
of -0.35 to 0.65 V at scan rate of 5 mV s-1. The CV curves are shown in Figure 4.4
(a), exhibiting rectangular shape. The CV results also reveal the electrical double
layer behaviour that dominate this system (Inamdar et al., 2011). The most
rectangular shape of CV curve is found in sample 0.01 M with high current pass
through than others sample, indicate a strong capacitive performance (Hu et al.,
2011).
The calculated specific capacitance values are 116 F g-1, 128 F g-1 and 143
F g-1 with mass loading of 4 x 10⁻⁵ g, 1.28 x 10⁻⁴ g and 9.4 x 10⁻⁴ g for 0.0025 M,
0.005 M and 0.01 M electrode, respectively. The optimum specific capacitance in
0.01 M electrode may due to the uniform structure of MnO2 on SS. The best
electrode 0.01 M is further investigated with applied different scan rate studies,
Figure 4.4 (b). The rectangular shape is still retained although high scan rate is
applied. However, the specific capacitance of device has decrease from 180 F g-1 at
scan rate of 1 mV s-1 to 71.4 F g-1 at scan rate of 10 mV s-1, Figure 4.4 (c). This is
due to high utilization of electrode active material during slow charge scan, hence
resulting in high specific capacitance (Rusi & Majid, 2014b).
The CDC performances of all electrodes is tested in potential range of -0.35
to 0.65 V at constant applied current of 1 mA. All CDC curves exhibits symmetric
and linear CDC profile for all electrodes (Figure 4.4 (d)), implying good capacitive
characteristics of the solid-state supercapacitor device (Yuan et al., 2012). The
specific capacitance calculated from discharge curve of 0.01 M electrode is 135
F g-1 with energy density of 18.8 Wh kg-1 and power density of 9.5 kW kg-1.
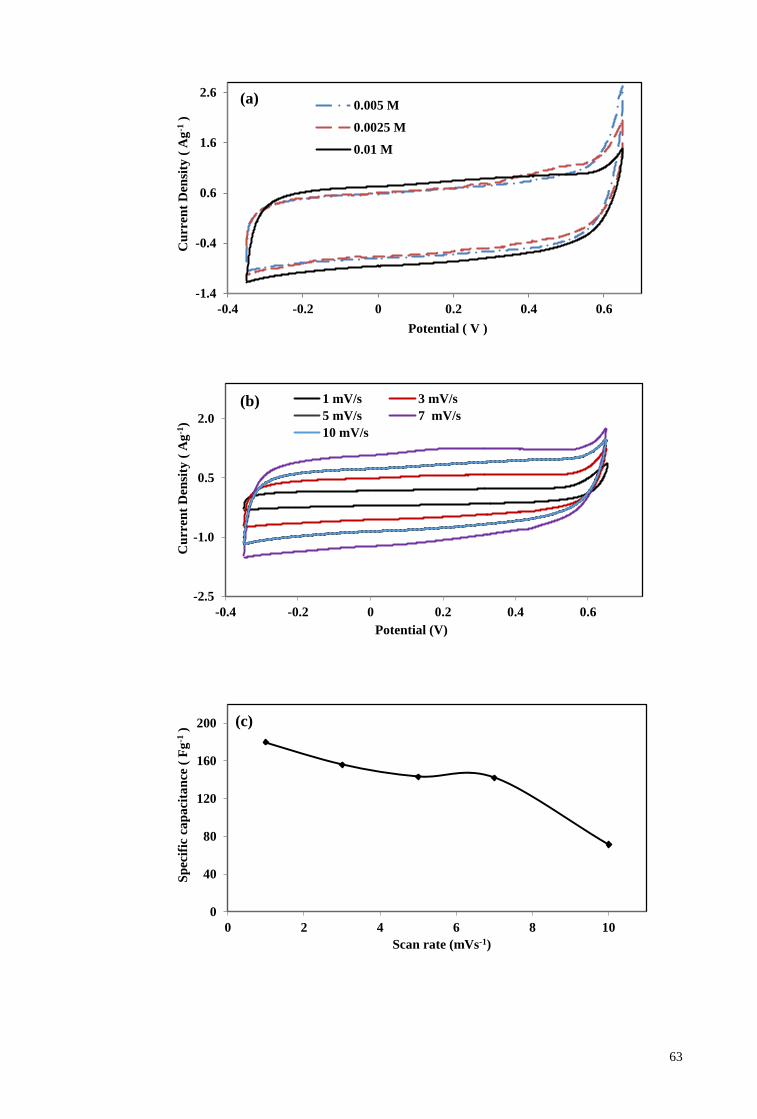
63
-1.4
-0.4
0.6
1.6
2.6
-0.4 -0.2 0 0.2 0.4 0.6
Cu
rren
t D
ensi
ty (
Ag
-1)
Potential ( V )
0.005 M
0.0025 M
0.01 M
-2.5
-1.0
0.5
2.0
-0.4 -0.2 0 0.2 0.4 0.6
Cu
rren
t D
ensi
ty (
Ag
-1)
Potential (V)
1 mV/s 3 mV/s
5 mV/s 7 mV/s
10 mV/s
0
40
80
120
160
200
0 2 4 6 8 10
Sp
ecif
ic c
ap
aci
tan
ce (
Fg
-1)
Scan rate (mVs-1)
(c)
(a)
(b)
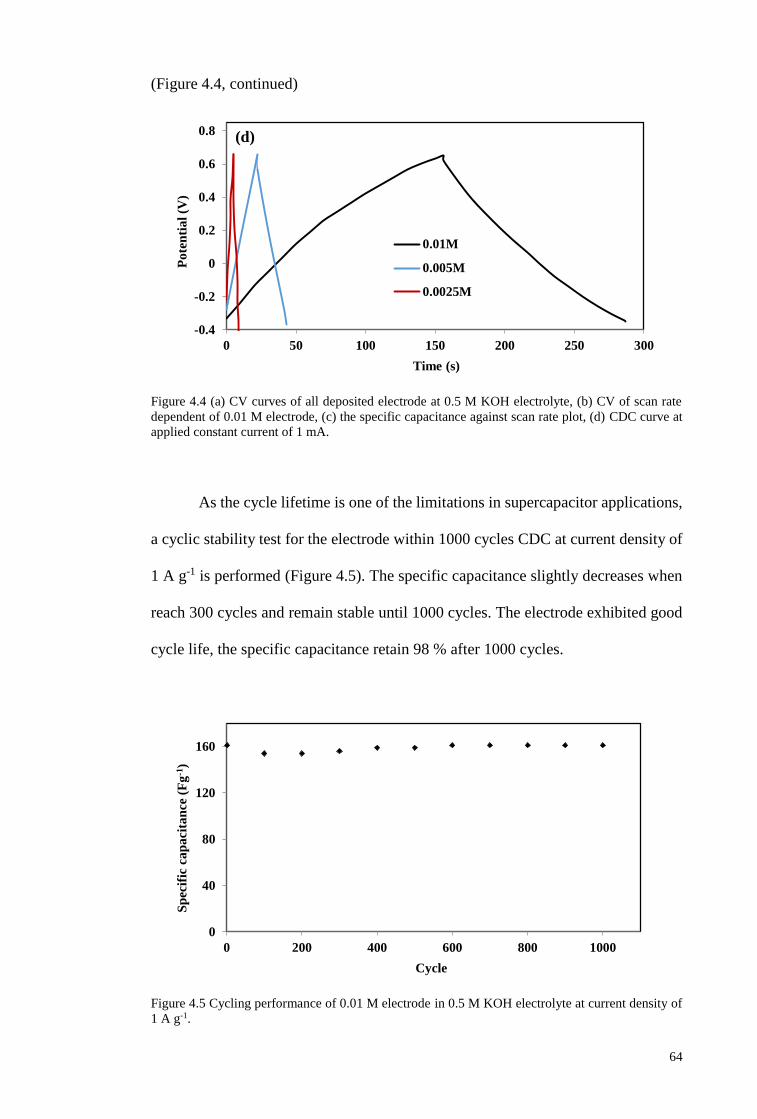
64
(Figure 4.4, continued)
Figure 4.4 (a) CV curves of all deposited electrode at 0.5 M KOH electrolyte, (b) CV of scan rate
dependent of 0.01 M electrode, (c) the specific capacitance against scan rate plot, (d) CDC curve at
applied constant current of 1 mA.
As the cycle lifetime is one of the limitations in supercapacitor applications,
a cyclic stability test for the electrode within 1000 cycles CDC at current density of
1 A g-1 is performed (Figure 4.5). The specific capacitance slightly decreases when
reach 300 cycles and remain stable until 1000 cycles. The electrode exhibited good
cycle life, the specific capacitance retain 98 % after 1000 cycles.
Figure 4.5 Cycling performance of 0.01 M electrode in 0.5 M KOH electrolyte at current density of
1 A g-1.
-0.4
-0.2
0
0.2
0.4
0.6
0.8
0 50 100 150 200 250 300
Po
ten
tia
l (V
)
Time (s)
0.01M
0.005M
0.0025M
0
40
80
120
160
0 200 400 600 800 1000
Sp
ecif
ic c
ap
aci
tan
ce (
Fg
-1)
Cycle
(d)
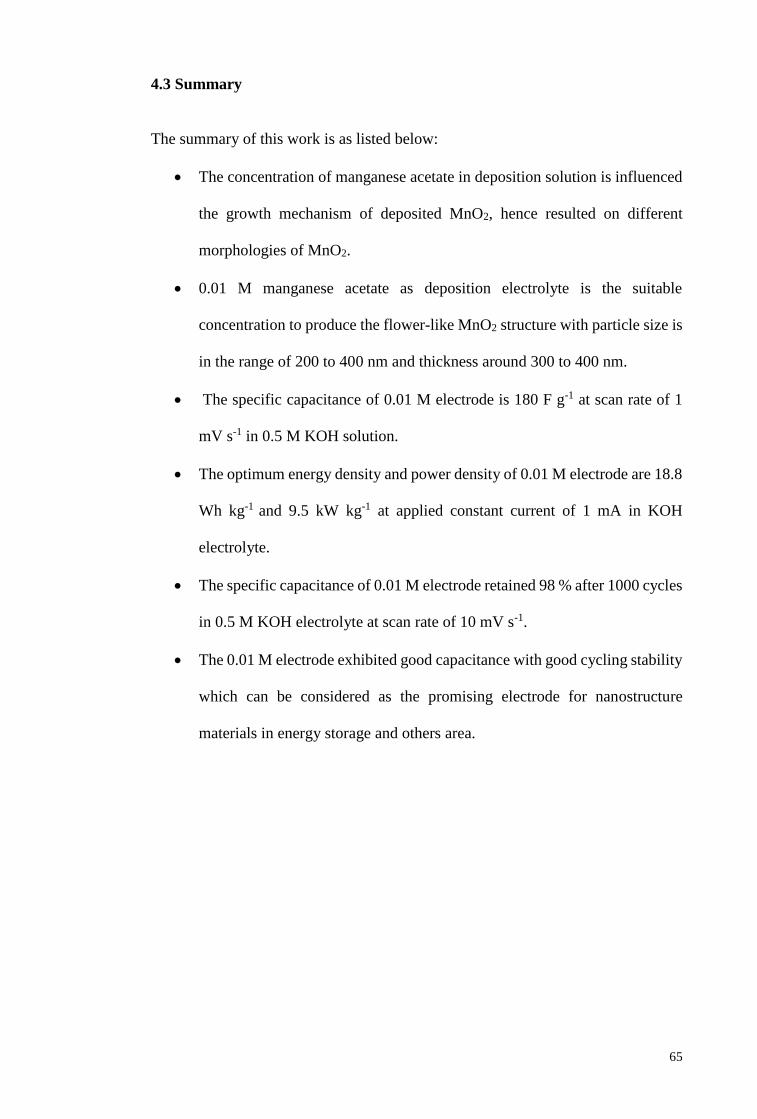
65
4.3 Summary
The summary of this work is as listed below:
The concentration of manganese acetate in deposition solution is influenced
the growth mechanism of deposited MnO2, hence resulted on different
morphologies of MnO2.
0.01 M manganese acetate as deposition electrolyte is the suitable
concentration to produce the flower-like MnO2 structure with particle size is
in the range of 200 to 400 nm and thickness around 300 to 400 nm.
The specific capacitance of 0.01 M electrode is 180 F g-1 at scan rate of 1
mV s-1 in 0.5 M KOH solution.
The optimum energy density and power density of 0.01 M electrode are 18.8
Wh kg-1 and 9.5 kW kg-1 at applied constant current of 1 mA in KOH
electrolyte.
The specific capacitance of 0.01 M electrode retained 98 % after 1000 cycles
in 0.5 M KOH electrolyte at scan rate of 10 mV s-1.
The 0.01 M electrode exhibited good capacitance with good cycling stability
which can be considered as the promising electrode for nanostructure
materials in energy storage and others area.
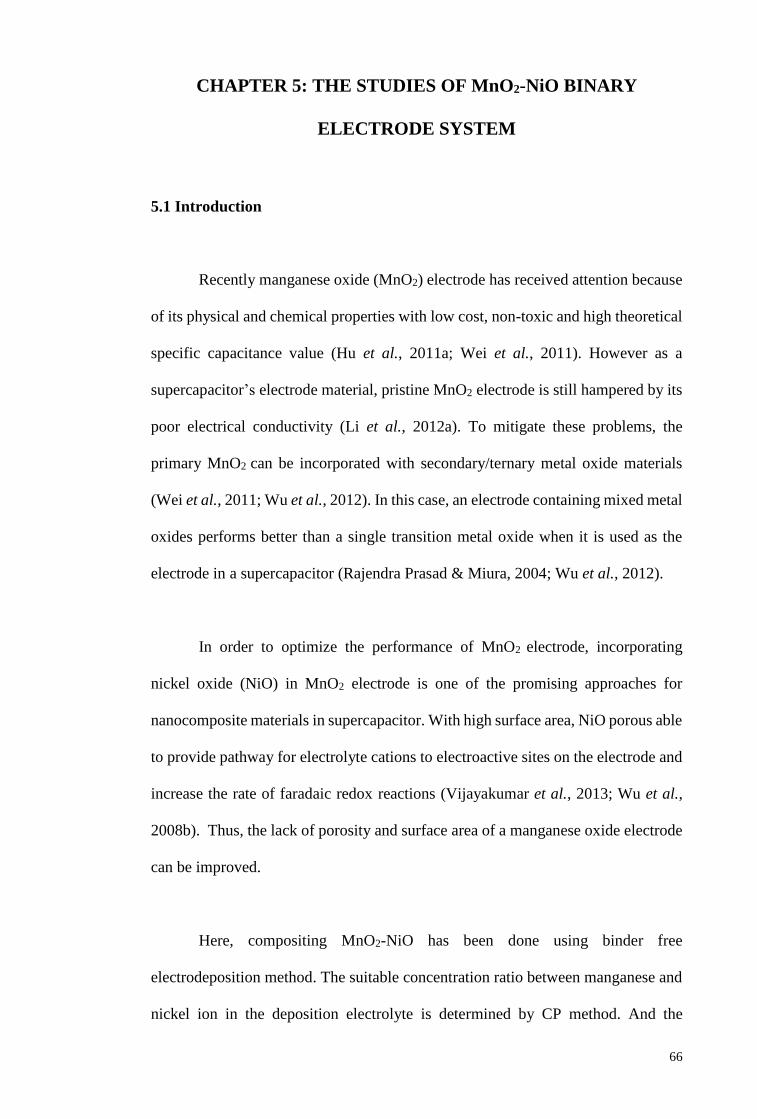
66
CHAPTER 5: THE STUDIES OF MnO2-NiO BINARY
ELECTRODE SYSTEM
5.1 Introduction
Recently manganese oxide (MnO2) electrode has received attention because
of its physical and chemical properties with low cost, non-toxic and high theoretical
specific capacitance value (Hu et al., 2011a; Wei et al., 2011). However as a
supercapacitor’s electrode material, pristine MnO2 electrode is still hampered by its
poor electrical conductivity (Li et al., 2012a). To mitigate these problems, the
primary MnO2 can be incorporated with secondary/ternary metal oxide materials
(Wei et al., 2011; Wu et al., 2012). In this case, an electrode containing mixed metal
oxides performs better than a single transition metal oxide when it is used as the
electrode in a supercapacitor (Rajendra Prasad & Miura, 2004; Wu et al., 2012).
In order to optimize the performance of MnO2 electrode, incorporating
nickel oxide (NiO) in MnO2 electrode is one of the promising approaches for
nanocomposite materials in supercapacitor. With high surface area, NiO porous able
to provide pathway for electrolyte cations to electroactive sites on the electrode and
increase the rate of faradaic redox reactions (Vijayakumar et al., 2013; Wu et al.,
2008b). Thus, the lack of porosity and surface area of a manganese oxide electrode
can be improved.
Here, compositing MnO2-NiO has been done using binder free
electrodeposition method. The suitable concentration ratio between manganese and
nickel ion in the deposition electrolyte is determined by CP method. And the
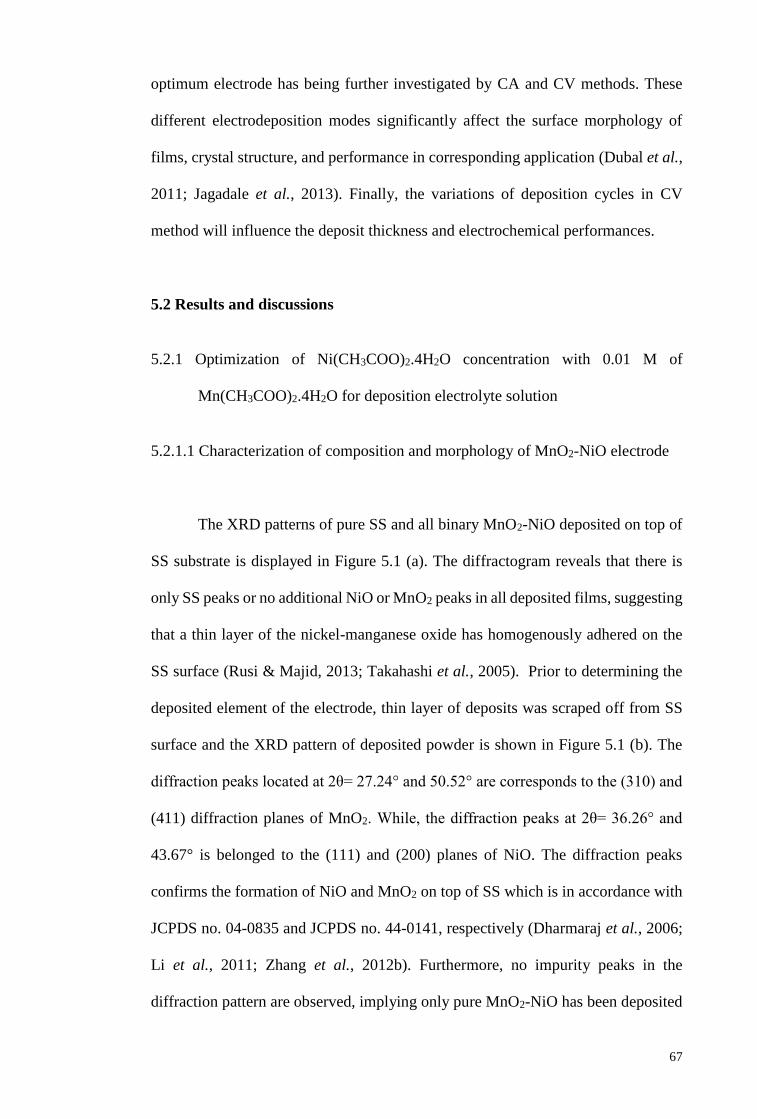
67
optimum electrode has being further investigated by CA and CV methods. These
different electrodeposition modes significantly affect the surface morphology of
films, crystal structure, and performance in corresponding application (Dubal et al.,
2011; Jagadale et al., 2013). Finally, the variations of deposition cycles in CV
method will influence the deposit thickness and electrochemical performances.
5.2 Results and discussions
5.2.1 Optimization of Ni(CH3COO)2.4H2O concentration with 0.01 M of
Mn(CH3COO)2.4H2O for deposition electrolyte solution
5.2.1.1 Characterization of composition and morphology of MnO2-NiO electrode
The XRD patterns of pure SS and all binary MnO2-NiO deposited on top of
SS substrate is displayed in Figure 5.1 (a). The diffractogram reveals that there is
only SS peaks or no additional NiO or MnO2 peaks in all deposited films, suggesting
that a thin layer of the nickel-manganese oxide has homogenously adhered on the
SS surface (Rusi & Majid, 2013; Takahashi et al., 2005). Prior to determining the
deposited element of the electrode, thin layer of deposits was scraped off from SS
surface and the XRD pattern of deposited powder is shown in Figure 5.1 (b). The
diffraction peaks located at 2θ= 27.24° and 50.52° are corresponds to the (310) and
(411) diffraction planes of MnO2. While, the diffraction peaks at 2θ= 36.26° and
43.67° is belonged to the (111) and (200) planes of NiO. The diffraction peaks
confirms the formation of NiO and MnO2 on top of SS which is in accordance with
JCPDS no. 04-0835 and JCPDS no. 44-0141, respectively (Dharmaraj et al., 2006;
Li et al., 2011; Zhang et al., 2012b). Furthermore, no impurity peaks in the
diffraction pattern are observed, implying only pure MnO2-NiO has been deposited
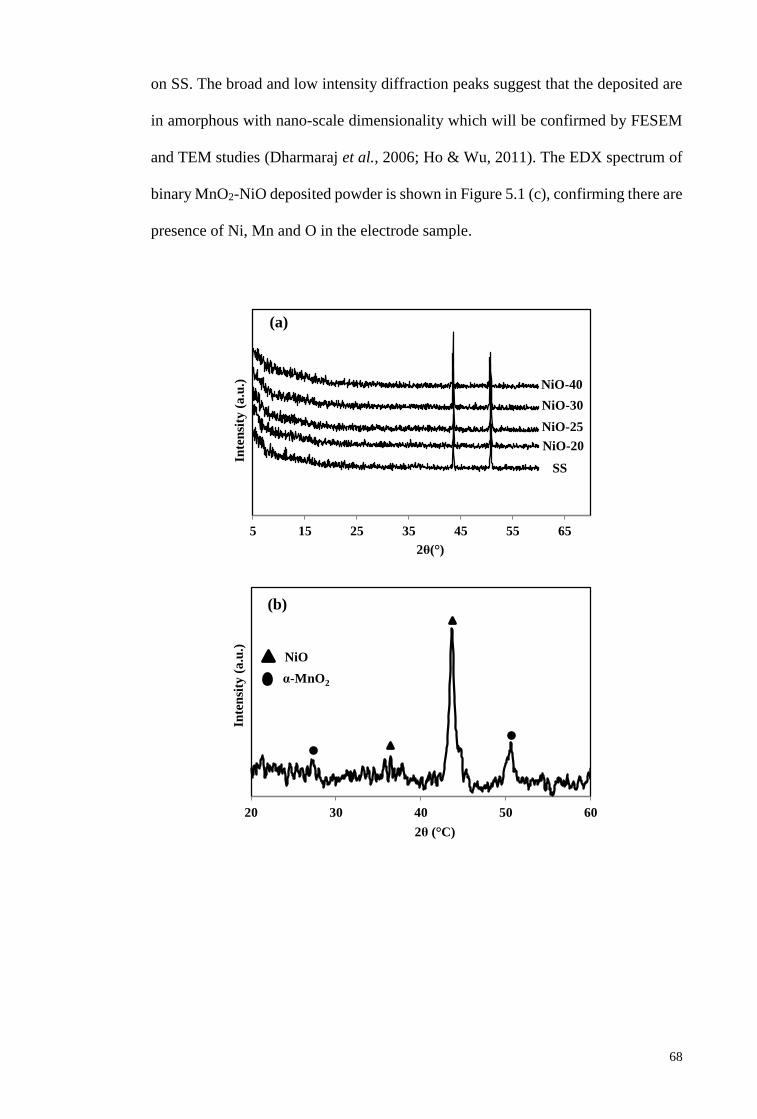
68
on SS. The broad and low intensity diffraction peaks suggest that the deposited are
in amorphous with nano-scale dimensionality which will be confirmed by FESEM
and TEM studies (Dharmaraj et al., 2006; Ho & Wu, 2011). The EDX spectrum of
binary MnO2-NiO deposited powder is shown in Figure 5.1 (c), confirming there are
presence of Ni, Mn and O in the electrode sample.
5 15 25 35 45 55 65
Inte
nsi
ty (
a.u
.)
2θ(°)
SS
NiO-20
NiO-25
NiO-30
NiO-40
(a)
20 30 40 50 60
Inte
nsi
ty (
a.u
.)
2θ (°C)
NiO
α-MnO2
(b)
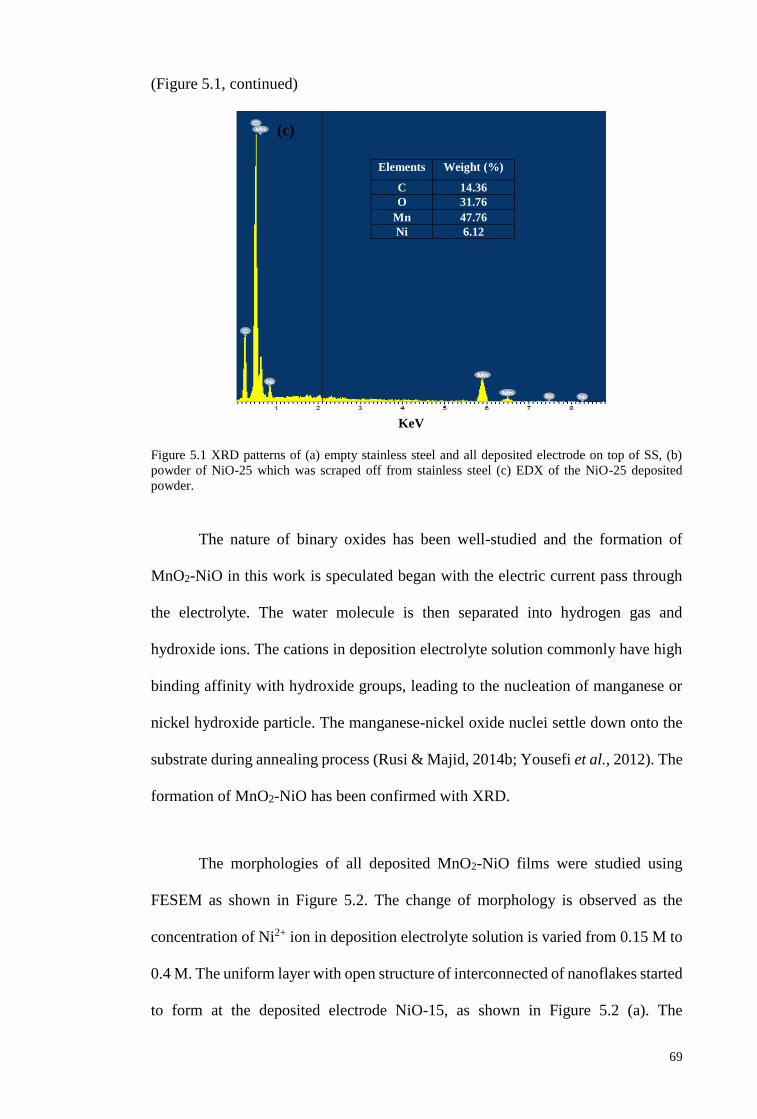
69
(Figure 5.1, continued)
Figure 5.1 XRD patterns of (a) empty stainless steel and all deposited electrode on top of SS, (b)
powder of NiO-25 which was scraped off from stainless steel (c) EDX of the NiO-25 deposited
powder.
The nature of binary oxides has been well-studied and the formation of
MnO2-NiO in this work is speculated began with the electric current pass through
the electrolyte. The water molecule is then separated into hydrogen gas and
hydroxide ions. The cations in deposition electrolyte solution commonly have high
binding affinity with hydroxide groups, leading to the nucleation of manganese or
nickel hydroxide particle. The manganese-nickel oxide nuclei settle down onto the
substrate during annealing process (Rusi & Majid, 2014b; Yousefi et al., 2012). The
formation of MnO2-NiO has been confirmed with XRD.
The morphologies of all deposited MnO2-NiO films were studied using
FESEM as shown in Figure 5.2. The change of morphology is observed as the
concentration of Ni2+ ion in deposition electrolyte solution is varied from 0.15 M to
0.4 M. The uniform layer with open structure of interconnected of nanoflakes started
to form at the deposited electrode NiO-15, as shown in Figure 5.2 (a). The
KeV
(c)
Elements Weight (%)
C 14.36
O 31.76
Mn 47.76
Ni 6.12
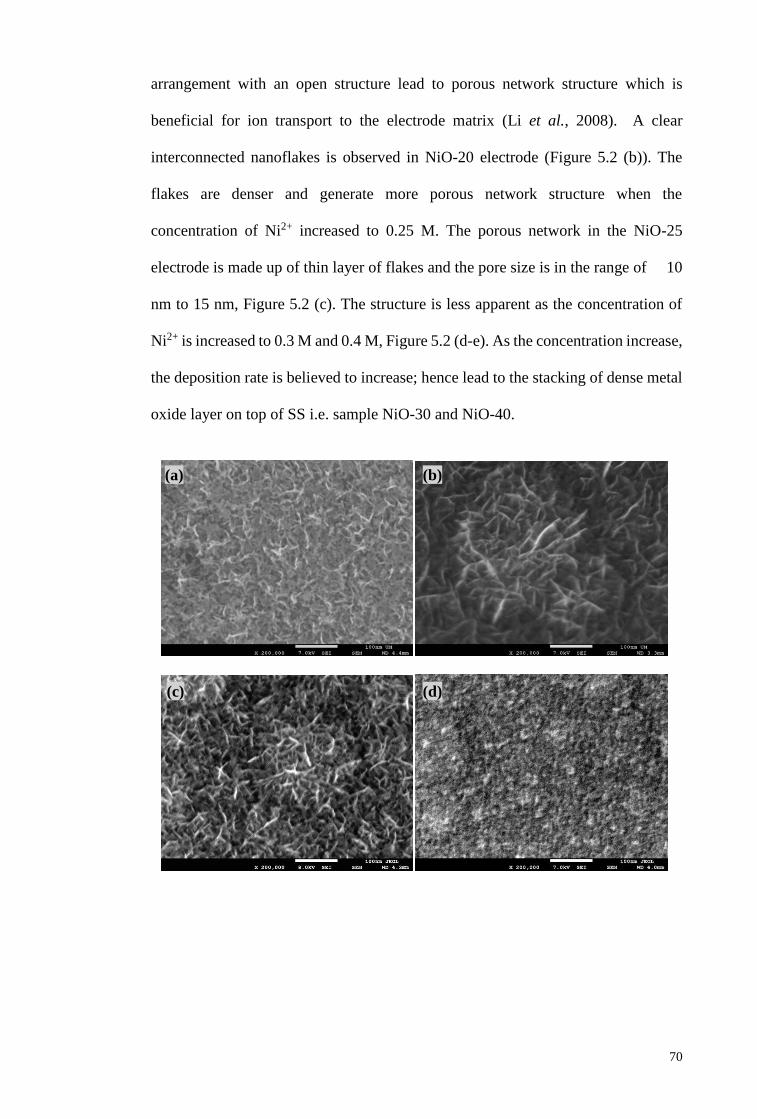
70
arrangement with an open structure lead to porous network structure which is
beneficial for ion transport to the electrode matrix (Li et al., 2008). A clear
interconnected nanoflakes is observed in NiO-20 electrode (Figure 5.2 (b)). The
flakes are denser and generate more porous network structure when the
concentration of Ni2+ increased to 0.25 M. The porous network in the NiO-25
electrode is made up of thin layer of flakes and the pore size is in the range of 10
nm to 15 nm, Figure 5.2 (c). The structure is less apparent as the concentration of
Ni2+ is increased to 0.3 M and 0.4 M, Figure 5.2 (d-e). As the concentration increase,
the deposition rate is believed to increase; hence lead to the stacking of dense metal
oxide layer on top of SS i.e. sample NiO-30 and NiO-40.
(a) (b)
(d) (c)
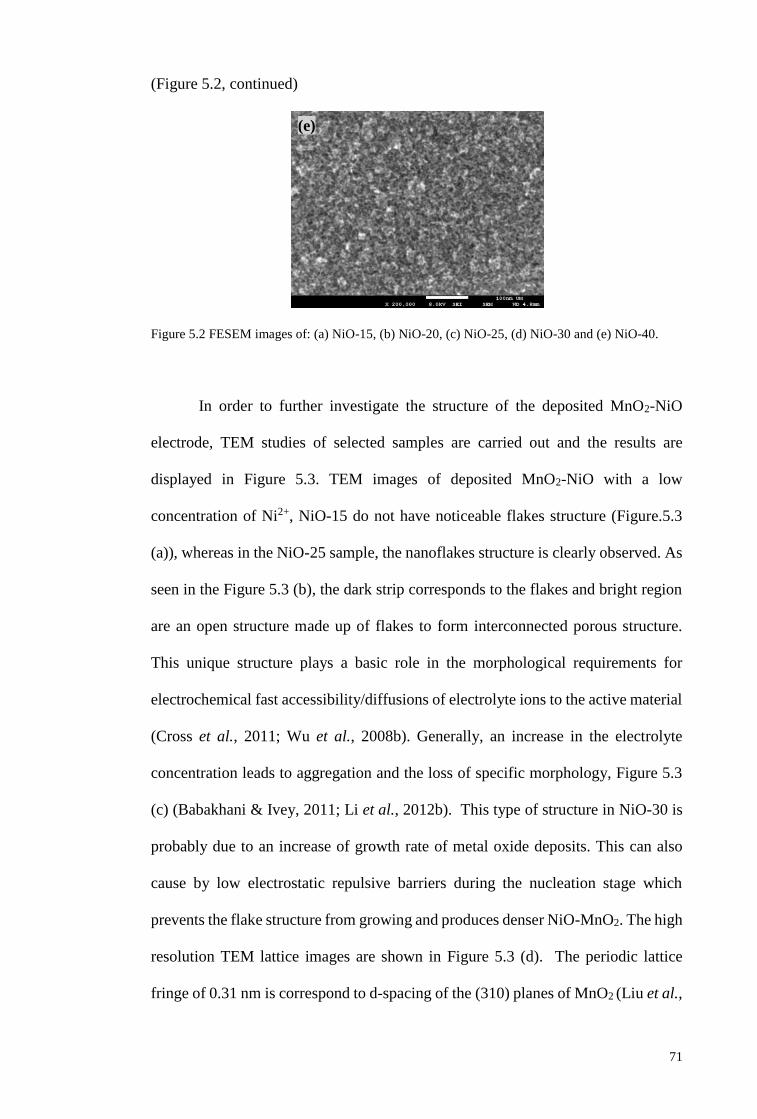
71
(Figure 5.2, continued)
Figure 5.2 FESEM images of: (a) NiO-15, (b) NiO-20, (c) NiO-25, (d) NiO-30 and (e) NiO-40.
In order to further investigate the structure of the deposited MnO2-NiO
electrode, TEM studies of selected samples are carried out and the results are
displayed in Figure 5.3. TEM images of deposited MnO2-NiO with a low
concentration of Ni2+, NiO-15 do not have noticeable flakes structure (Figure.5.3
(a)), whereas in the NiO-25 sample, the nanoflakes structure is clearly observed. As
seen in the Figure 5.3 (b), the dark strip corresponds to the flakes and bright region
are an open structure made up of flakes to form interconnected porous structure.
This unique structure plays a basic role in the morphological requirements for
electrochemical fast accessibility/diffusions of electrolyte ions to the active material
(Cross et al., 2011; Wu et al., 2008b). Generally, an increase in the electrolyte
concentration leads to aggregation and the loss of specific morphology, Figure 5.3
(c) (Babakhani & Ivey, 2011; Li et al., 2012b). This type of structure in NiO-30 is
probably due to an increase of growth rate of metal oxide deposits. This can also
cause by low electrostatic repulsive barriers during the nucleation stage which
prevents the flake structure from growing and produces denser NiO-MnO2. The high
resolution TEM lattice images are shown in Figure 5.3 (d). The periodic lattice
fringe of 0.31 nm is correspond to d-spacing of the (310) planes of MnO2 (Liu et al.,
(e)
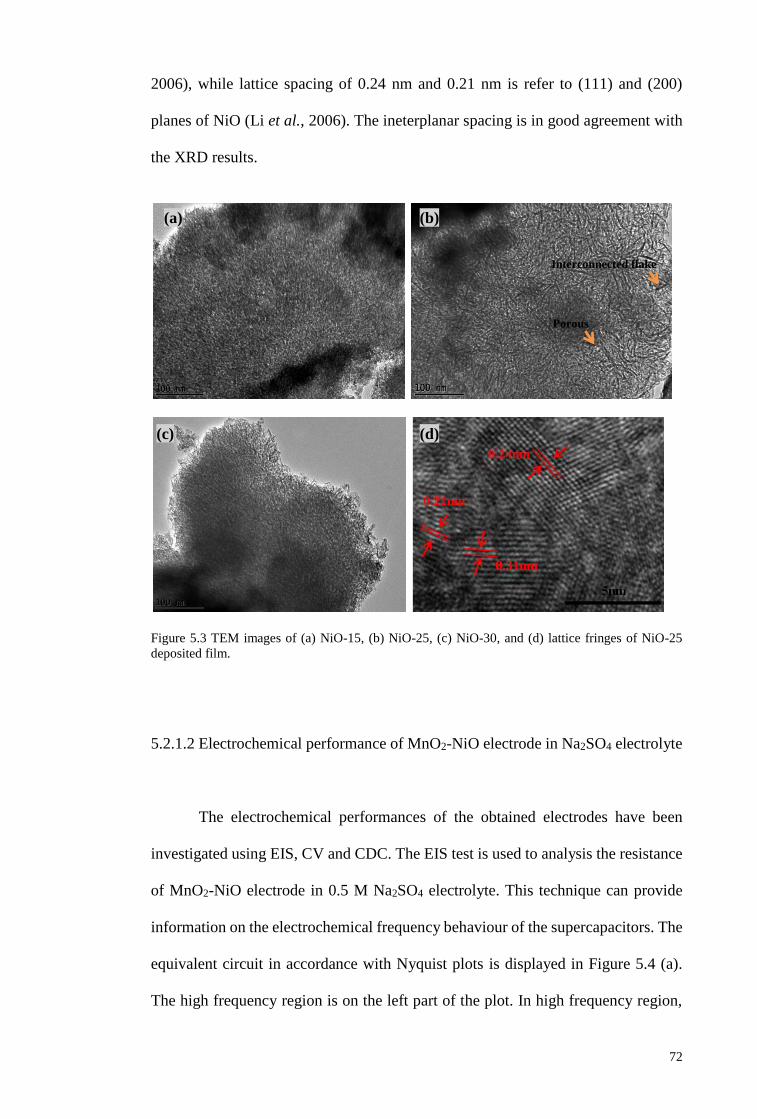
72
2006), while lattice spacing of 0.24 nm and 0.21 nm is refer to (111) and (200)
planes of NiO (Li et al., 2006). The ineterplanar spacing is in good agreement with
the XRD results.
Figure 5.3 TEM images of (a) NiO-15, (b) NiO-25, (c) NiO-30, and (d) lattice fringes of NiO-25
deposited film.
5.2.1.2 Electrochemical performance of MnO2-NiO electrode in Na2SO4 electrolyte
The electrochemical performances of the obtained electrodes have been
investigated using EIS, CV and CDC. The EIS test is used to analysis the resistance
of MnO2-NiO electrode in 0.5 M Na2SO4 electrolyte. This technique can provide
information on the electrochemical frequency behaviour of the supercapacitors. The
equivalent circuit in accordance with Nyquist plots is displayed in Figure 5.4 (a).
The high frequency region is on the left part of the plot. In high frequency region,
Interconnected flake
Porous
(a) (b)
(c) (d)
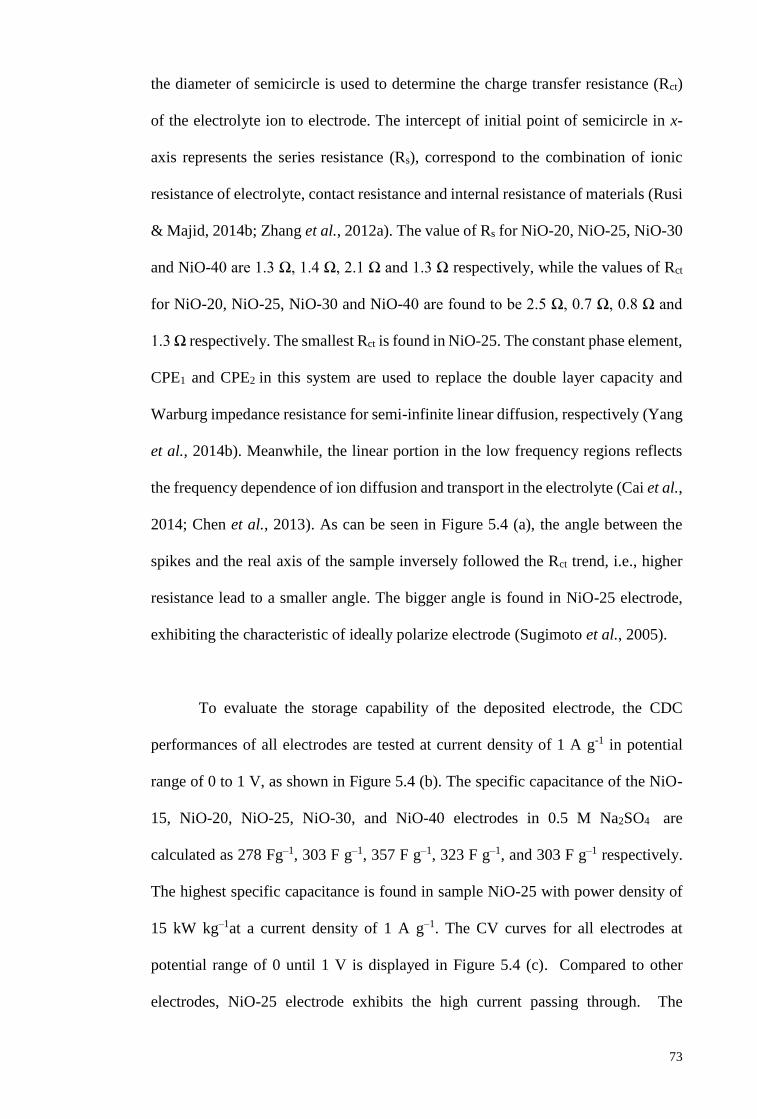
73
the diameter of semicircle is used to determine the charge transfer resistance (Rct)
of the electrolyte ion to electrode. The intercept of initial point of semicircle in x-
axis represents the series resistance (Rs), correspond to the combination of ionic
resistance of electrolyte, contact resistance and internal resistance of materials (Rusi
& Majid, 2014b; Zhang et al., 2012a). The value of Rs for NiO-20, NiO-25, NiO-30
and NiO-40 are 1.3 Ω, 1.4 Ω, 2.1 Ω and 1.3 Ω respectively, while the values of Rct
for NiO-20, NiO-25, NiO-30 and NiO-40 are found to be 2.5 Ω, 0.7 Ω, 0.8 Ω and
1.3 Ω respectively. The smallest Rct is found in NiO-25. The constant phase element,
CPE1 and CPE2 in this system are used to replace the double layer capacity and
Warburg impedance resistance for semi-infinite linear diffusion, respectively (Yang
et al., 2014b). Meanwhile, the linear portion in the low frequency regions reflects
the frequency dependence of ion diffusion and transport in the electrolyte (Cai et al.,
2014; Chen et al., 2013). As can be seen in Figure 5.4 (a), the angle between the
spikes and the real axis of the sample inversely followed the Rct trend, i.e., higher
resistance lead to a smaller angle. The bigger angle is found in NiO-25 electrode,
exhibiting the characteristic of ideally polarize electrode (Sugimoto et al., 2005).
To evaluate the storage capability of the deposited electrode, the CDC
performances of all electrodes are tested at current density of 1 A g-1 in potential
range of 0 to 1 V, as shown in Figure 5.4 (b). The specific capacitance of the NiO-
15, NiO-20, NiO-25, NiO-30, and NiO-40 electrodes in 0.5 M Na2SO4 are
calculated as 278 Fg–1, 303 F g–1, 357 F g–1, 323 F g–1, and 303 F g–1 respectively.
The highest specific capacitance is found in sample NiO-25 with power density of
15 kW kg–1at a current density of 1 A g–1. The CV curves for all electrodes at
potential range of 0 until 1 V is displayed in Figure 5.4 (c). Compared to other
electrodes, NiO-25 electrode exhibits the high current passing through. The
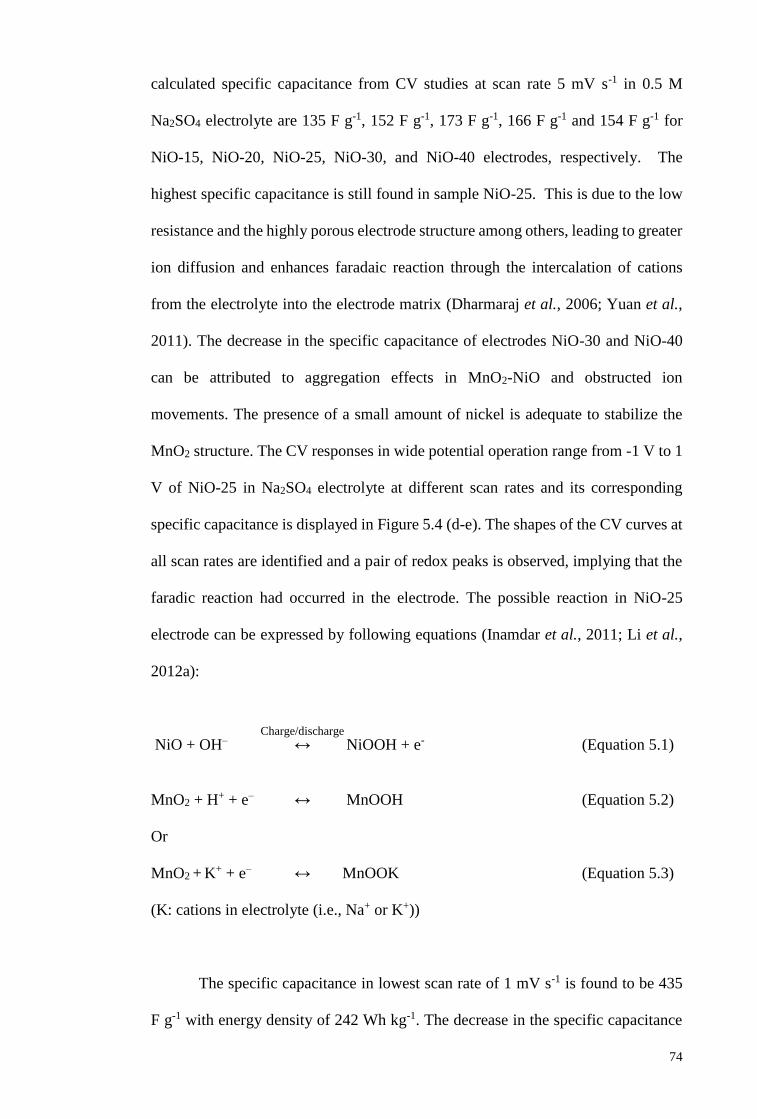
74
calculated specific capacitance from CV studies at scan rate 5 mV s-1 in 0.5 M
Na2SO4 electrolyte are 135 F g-1, 152 F g-1, 173 F g-1, 166 F g-1 and 154 F g-1 for
NiO-15, NiO-20, NiO-25, NiO-30, and NiO-40 electrodes, respectively. The
highest specific capacitance is still found in sample NiO-25. This is due to the low
resistance and the highly porous electrode structure among others, leading to greater
ion diffusion and enhances faradaic reaction through the intercalation of cations
from the electrolyte into the electrode matrix (Dharmaraj et al., 2006; Yuan et al.,
2011). The decrease in the specific capacitance of electrodes NiO-30 and NiO-40
can be attributed to aggregation effects in MnO2-NiO and obstructed ion
movements. The presence of a small amount of nickel is adequate to stabilize the
MnO2 structure. The CV responses in wide potential operation range from -1 V to 1
V of NiO-25 in Na2SO4 electrolyte at different scan rates and its corresponding
specific capacitance is displayed in Figure 5.4 (d-e). The shapes of the CV curves at
all scan rates are identified and a pair of redox peaks is observed, implying that the
faradic reaction had occurred in the electrode. The possible reaction in NiO-25
electrode can be expressed by following equations (Inamdar et al., 2011; Li et al.,
2012a):
NiO + OH– ↔ NiOOH + e- (Equation 5.1)
MnO2 + H+ + e– ↔ MnOOH (Equation 5.2)
Or
MnO2 + K+ + e– ↔ MnOOK (Equation 5.3)
(K: cations in electrolyte (i.e., Na+ or K+))
The specific capacitance in lowest scan rate of 1 mV s-1 is found to be 435
F g-1 with energy density of 242 Wh kg-1. The decrease in the specific capacitance
Charge/discharge
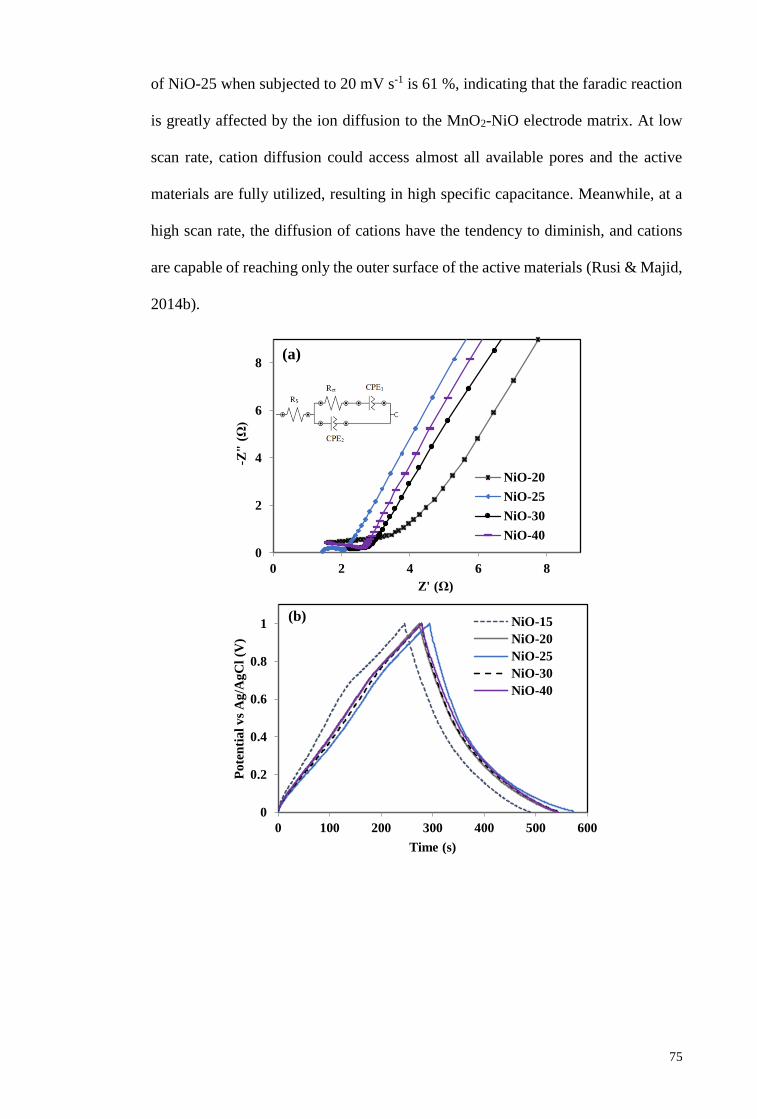
75
of NiO-25 when subjected to 20 mV s-1 is 61 %, indicating that the faradic reaction
is greatly affected by the ion diffusion to the MnO2-NiO electrode matrix. At low
scan rate, cation diffusion could access almost all available pores and the active
materials are fully utilized, resulting in high specific capacitance. Meanwhile, at a
high scan rate, the diffusion of cations have the tendency to diminish, and cations
are capable of reaching only the outer surface of the active materials (Rusi & Majid,
2014b).
0
2
4
6
8
0 2 4 6 8
-Z"
(Ω
)
Z' (Ω)
NiO-20
NiO-25
NiO-30
NiO-40
0
0.2
0.4
0.6
0.8
1
0 100 200 300 400 500 600
Po
ten
tia
l v
s A
g/A
gC
l (V
)
Time (s)
NiO-15
NiO-20
NiO-25
NiO-30
NiO-40
(b)
(a)
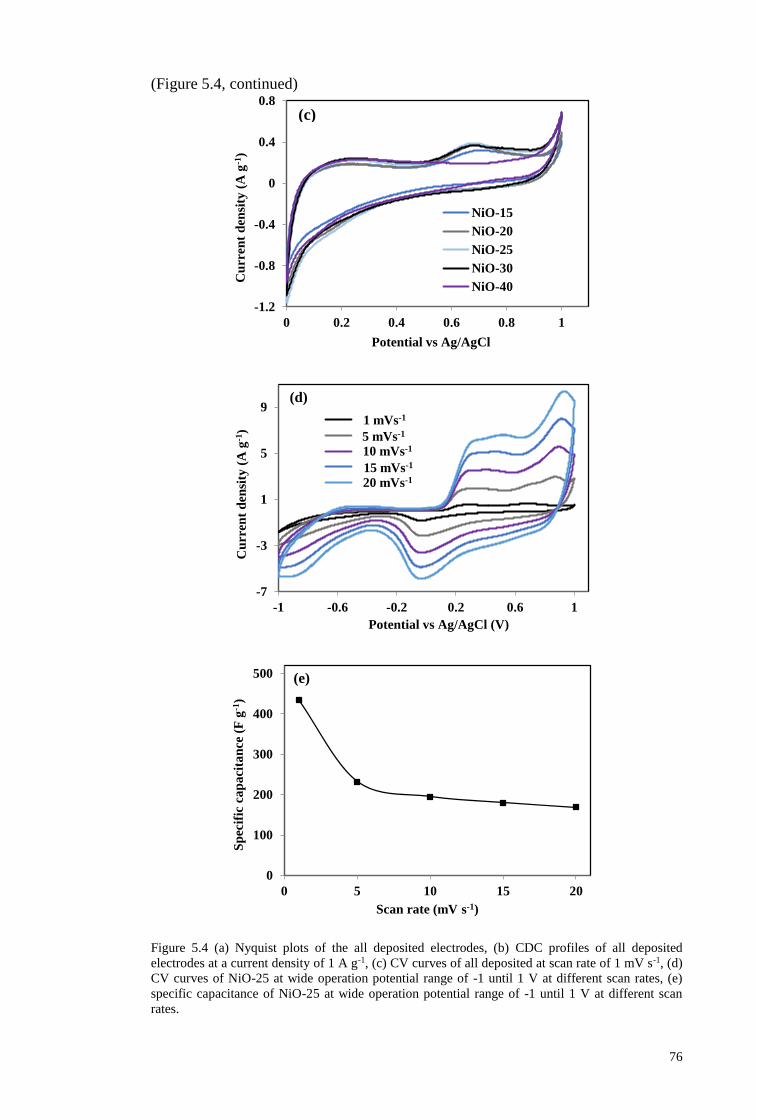
76
(Figure 5.4, continued)
Figure 5.4 (a) Nyquist plots of the all deposited electrodes, (b) CDC profiles of all deposited
electrodes at a current density of 1 A g-1, (c) CV curves of all deposited at scan rate of 1 mV s-1, (d)
CV curves of NiO-25 at wide operation potential range of -1 until 1 V at different scan rates, (e)
specific capacitance of NiO-25 at wide operation potential range of -1 until 1 V at different scan
rates.
-1.2
-0.8
-0.4
0
0.4
0.8
0 0.2 0.4 0.6 0.8 1
Cu
rren
t d
ensi
ty (
A g
-1)
Potential vs Ag/AgCl
NiO-15
NiO-20
NiO-25
NiO-30
NiO-40
-7
-3
1
5
9
-1 -0.6 -0.2 0.2 0.6 1
Cu
rren
t d
ensi
ty (
A g
-1)
Potential vs Ag/AgCl (V)
1 mV/s
5 mV/s
10 mV/s
15 mV/s
20 mV/s
(d)
20 mVs-1
15 mVs-1
10 mVs-1
5 mVs-1
1 mVs-1
0
100
200
300
400
500
0 5 10 15 20
Sp
ecif
ic c
ap
aci
tan
ce (
F g
-1)
Scan rate (mV s-1)
(e)
(c)
77
The cyclability of the electrode are important for practical applications
because give a high power demand from portable electronic power tool and EVs.
The cyclability test of NiO-25 is performed in 0.5 M Na2SO4 electrolyte at scan rate
of 10 mV s-1 until 900 cycles in potential range of -1 V to 1 V, as shown in Figure
5.5.
Figure 5.5 Specific capacitance retention at scan rate of 10 mVs–1 in 0.5 M Na2SO4 electrolyte with
potential range of -1 to 1 V.
The specific capacitance decreases during the initial cycle and slowly increase
before it reached 100 % retention after 900 cycles. A similar trend is also observed
in MnO2, NiO, nickel manganese oxide (NiMn2O4) and nickel cobalt oxide
(NiCo2O4) electrodes (Pang et al., 2000; Zhang et al., 2013b) . This increase is
probably due the increase in active sites in the materials during the electrochemical
process which lead to the incomplete diffusions of cations at a relative high scan
rate. Within this potential range, the diffusion of cations do not seems to induce
significant electrode structure change (Zhang et al., 2013b).
Although the stability of the electrode is good, the energy density and power
density of the electrode requires further improvements. In order to improve the
0
20
40
60
80
100
120
0 200 400 600 800 1000
Ret
enti
on
(%
)
Cycle
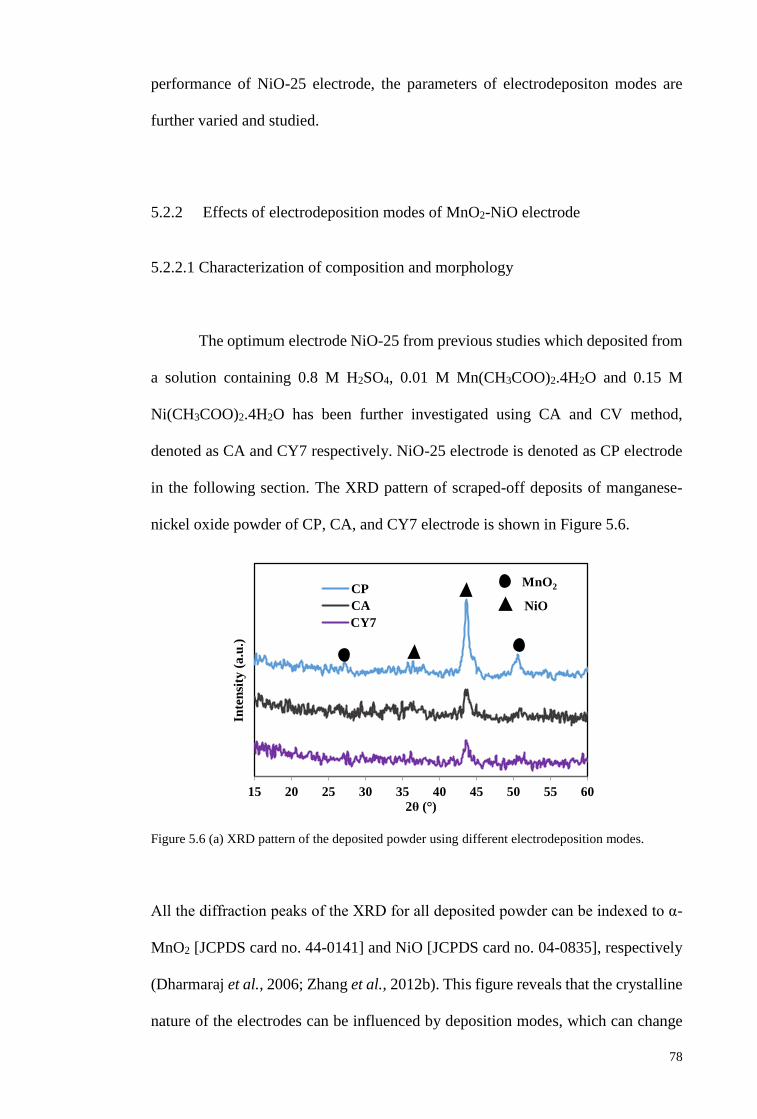
78
performance of NiO-25 electrode, the parameters of electrodepositon modes are
further varied and studied.
5.2.2 Effects of electrodeposition modes of MnO2-NiO electrode
5.2.2.1 Characterization of composition and morphology
The optimum electrode NiO-25 from previous studies which deposited from
a solution containing 0.8 M H2SO4, 0.01 M Mn(CH3COO)2.4H2O and 0.15 M
Ni(CH3COO)2.4H2O has been further investigated using CA and CV method,
denoted as CA and CY7 respectively. NiO-25 electrode is denoted as CP electrode
in the following section. The XRD pattern of scraped-off deposits of manganese-
nickel oxide powder of CP, CA, and CY7 electrode is shown in Figure 5.6.
Figure 5.6 (a) XRD pattern of the deposited powder using different electrodeposition modes.
All the diffraction peaks of the XRD for all deposited powder can be indexed to α-
MnO2 [JCPDS card no. 44-0141] and NiO [JCPDS card no. 04-0835], respectively
(Dharmaraj et al., 2006; Zhang et al., 2012b). This figure reveals that the crystalline
nature of the electrodes can be influenced by deposition modes, which can change
15 20 25 30 35 40 45 50 55 60
Inte
nsi
ty (
a.u
.)
2θ (°)
CP
CA
7 cy
MnO2
NiO
CY7
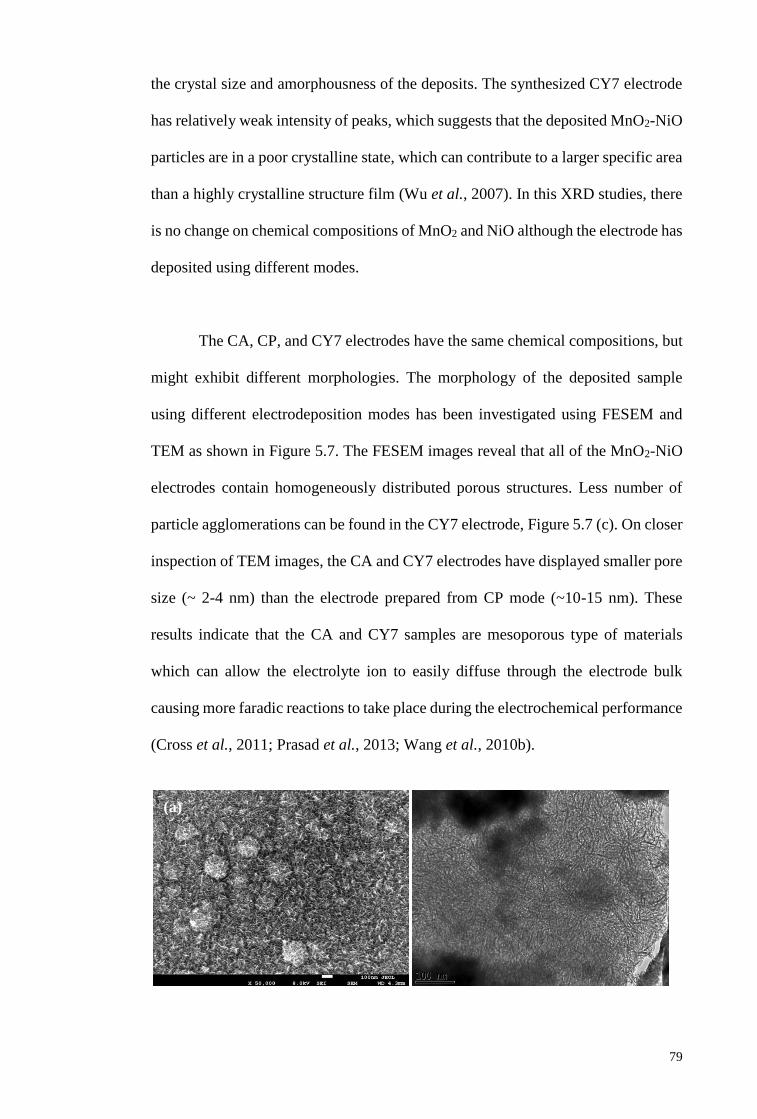
79
the crystal size and amorphousness of the deposits. The synthesized CY7 electrode
has relatively weak intensity of peaks, which suggests that the deposited MnO2-NiO
particles are in a poor crystalline state, which can contribute to a larger specific area
than a highly crystalline structure film (Wu et al., 2007). In this XRD studies, there
is no change on chemical compositions of MnO2 and NiO although the electrode has
deposited using different modes.
The CA, CP, and CY7 electrodes have the same chemical compositions, but
might exhibit different morphologies. The morphology of the deposited sample
using different electrodeposition modes has been investigated using FESEM and
TEM as shown in Figure 5.7. The FESEM images reveal that all of the MnO2-NiO
electrodes contain homogeneously distributed porous structures. Less number of
particle agglomerations can be found in the CY7 electrode, Figure 5.7 (c). On closer
inspection of TEM images, the CA and CY7 electrodes have displayed smaller pore
size (~ 2-4 nm) than the electrode prepared from CP mode (~10-15 nm). These
results indicate that the CA and CY7 samples are mesoporous type of materials
which can allow the electrolyte ion to easily diffuse through the electrode bulk
causing more faradic reactions to take place during the electrochemical performance
(Cross et al., 2011; Prasad et al., 2013; Wang et al., 2010b).
(a)
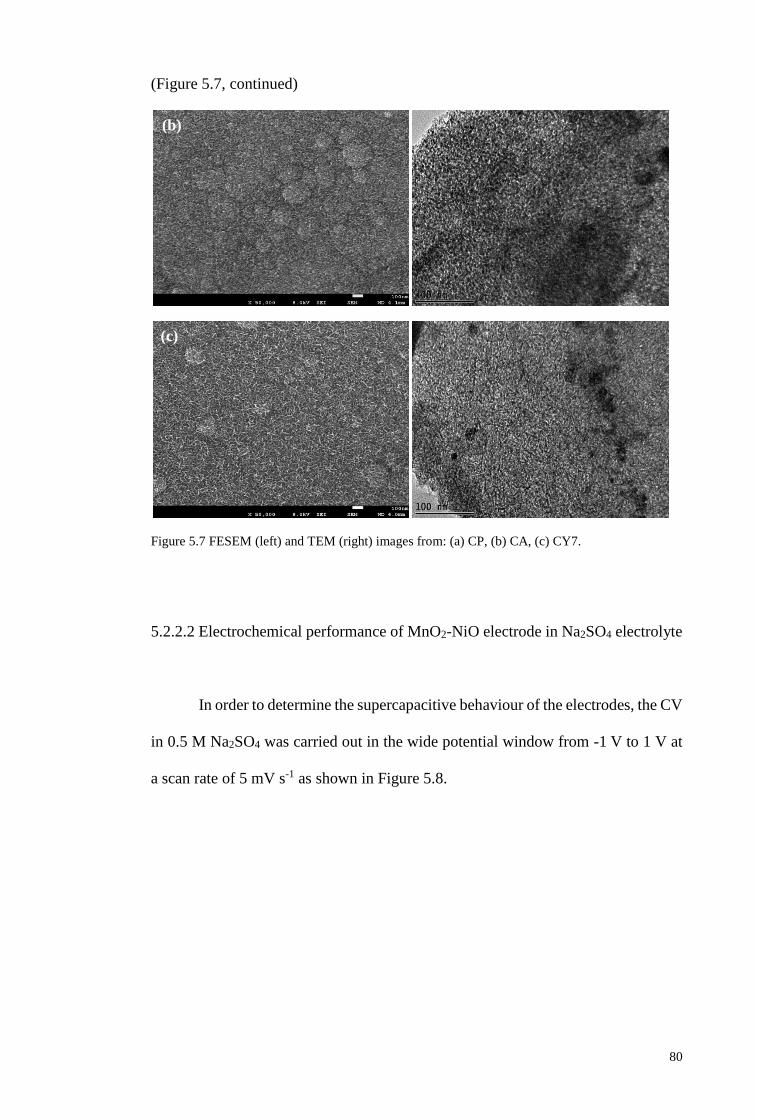
80
(Figure 5.7, continued)
Figure 5.7 FESEM (left) and TEM (right) images from: (a) CP, (b) CA, (c) CY7.
5.2.2.2 Electrochemical performance of MnO2-NiO electrode in Na2SO4 electrolyte
In order to determine the supercapacitive behaviour of the electrodes, the CV
in 0.5 M Na2SO4 was carried out in the wide potential window from -1 V to 1 V at
a scan rate of 5 mV s-1 as shown in Figure 5.8.
(b)
(c)
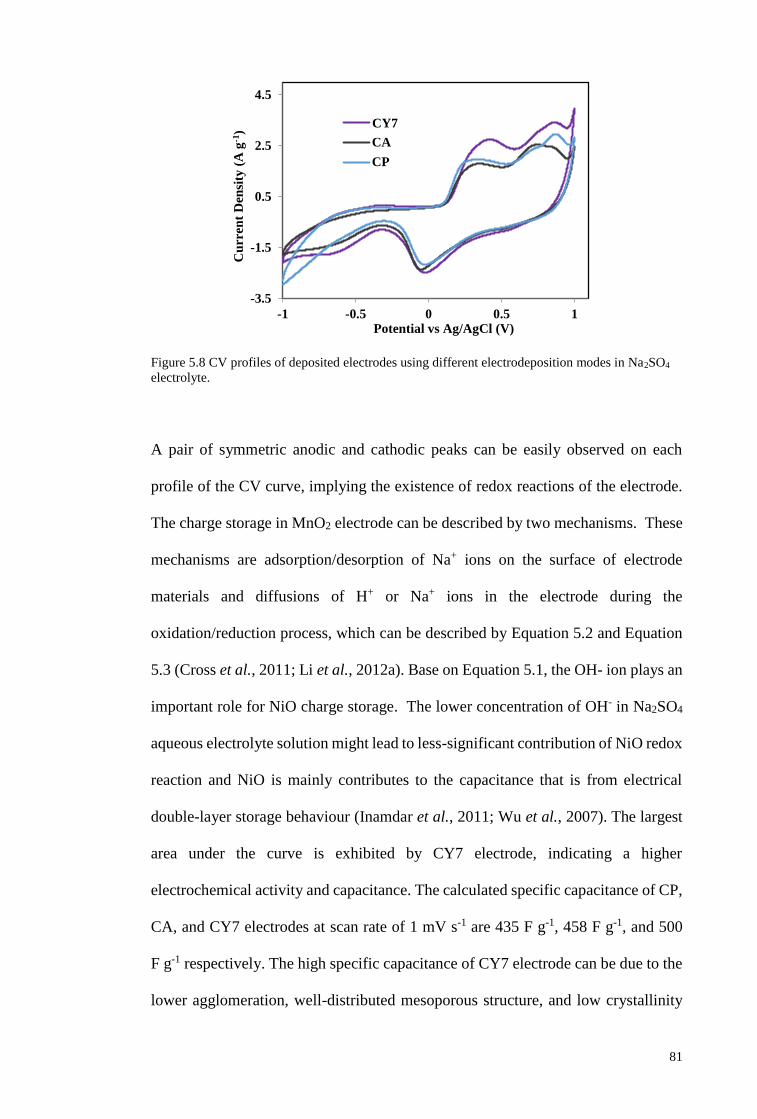
81
Figure 5.8 CV profiles of deposited electrodes using different electrodeposition modes in Na2SO4
electrolyte.
A pair of symmetric anodic and cathodic peaks can be easily observed on each
profile of the CV curve, implying the existence of redox reactions of the electrode.
The charge storage in MnO2 electrode can be described by two mechanisms. These
mechanisms are adsorption/desorption of Na+ ions on the surface of electrode
materials and diffusions of H+ or Na+ ions in the electrode during the
oxidation/reduction process, which can be described by Equation 5.2 and Equation
5.3 (Cross et al., 2011; Li et al., 2012a). Base on Equation 5.1, the OH- ion plays an
important role for NiO charge storage. The lower concentration of OH- in Na2SO4
aqueous electrolyte solution might lead to less-significant contribution of NiO redox
reaction and NiO is mainly contributes to the capacitance that is from electrical
double-layer storage behaviour (Inamdar et al., 2011; Wu et al., 2007). The largest
area under the curve is exhibited by CY7 electrode, indicating a higher
electrochemical activity and capacitance. The calculated specific capacitance of CP,
CA, and CY7 electrodes at scan rate of 1 mV s-1 are 435 F g-1, 458 F g-1, and 500
F g-1 respectively. The high specific capacitance of CY7 electrode can be due to the
lower agglomeration, well-distributed mesoporous structure, and low crystallinity
-3.5
-1.5
0.5
2.5
4.5
-1 -0.5 0 0.5 1
Cu
rren
t D
ensi
ty (
A g
-1)
Potential vs Ag/AgCl (V)
7 cy CV
CA
CP
CY7
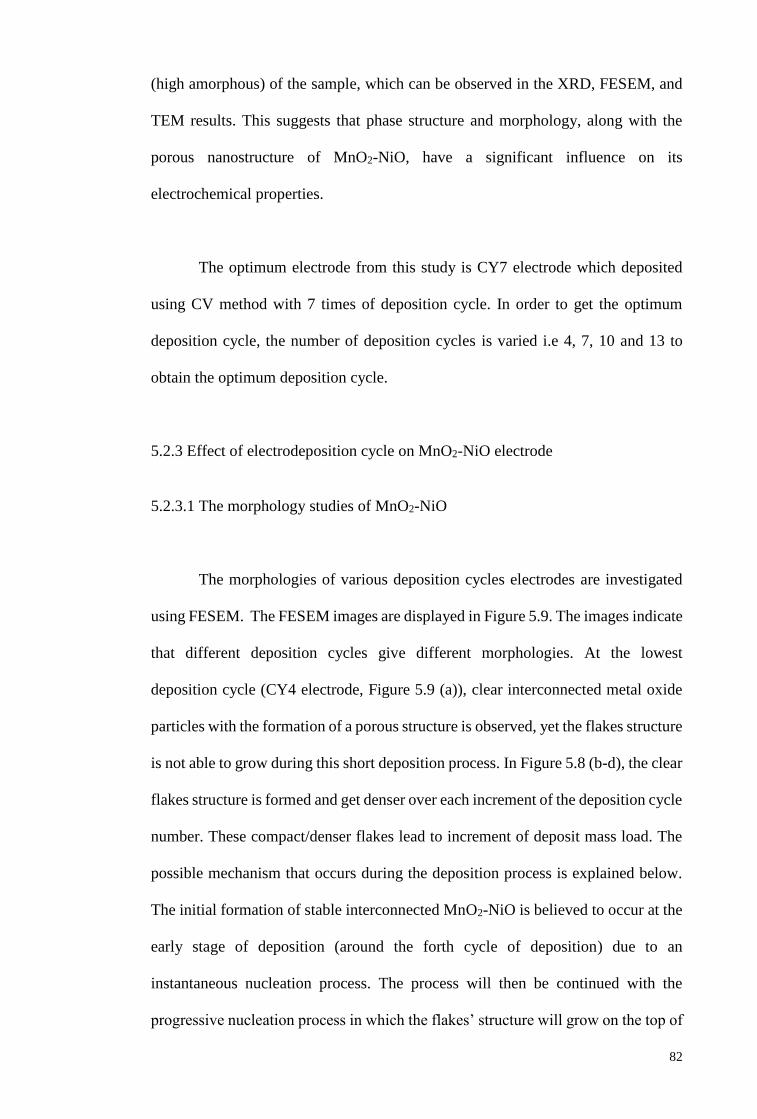
82
(high amorphous) of the sample, which can be observed in the XRD, FESEM, and
TEM results. This suggests that phase structure and morphology, along with the
porous nanostructure of MnO2-NiO, have a significant influence on its
electrochemical properties.
The optimum electrode from this study is CY7 electrode which deposited
using CV method with 7 times of deposition cycle. In order to get the optimum
deposition cycle, the number of deposition cycles is varied i.e 4, 7, 10 and 13 to
obtain the optimum deposition cycle.
5.2.3 Effect of electrodeposition cycle on MnO2-NiO electrode
5.2.3.1 The morphology studies of MnO2-NiO
The morphologies of various deposition cycles electrodes are investigated
using FESEM. The FESEM images are displayed in Figure 5.9. The images indicate
that different deposition cycles give different morphologies. At the lowest
deposition cycle (CY4 electrode, Figure 5.9 (a)), clear interconnected metal oxide
particles with the formation of a porous structure is observed, yet the flakes structure
is not able to grow during this short deposition process. In Figure 5.8 (b-d), the clear
flakes structure is formed and get denser over each increment of the deposition cycle
number. These compact/denser flakes lead to increment of deposit mass load. The
possible mechanism that occurs during the deposition process is explained below.
The initial formation of stable interconnected MnO2-NiO is believed to occur at the
early stage of deposition (around the forth cycle of deposition) due to an
instantaneous nucleation process. The process will then be continued with the
progressive nucleation process in which the flakes’ structure will grow on the top of
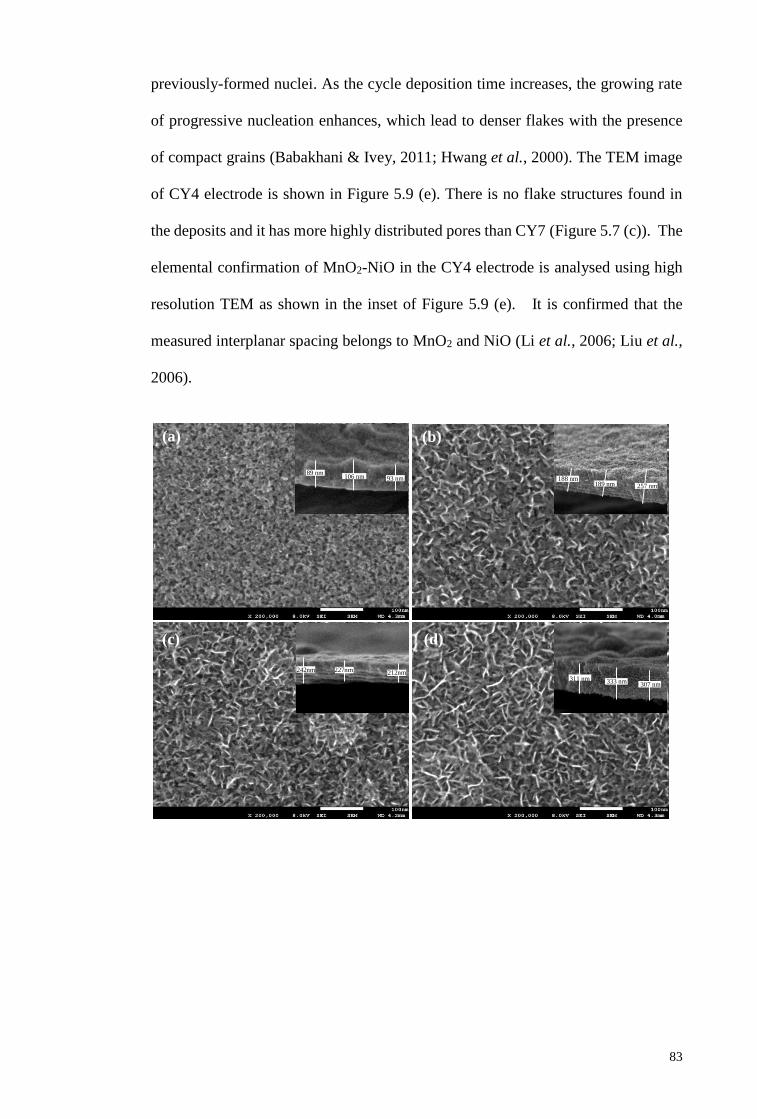
83
previously-formed nuclei. As the cycle deposition time increases, the growing rate
of progressive nucleation enhances, which lead to denser flakes with the presence
of compact grains (Babakhani & Ivey, 2011; Hwang et al., 2000). The TEM image
of CY4 electrode is shown in Figure 5.9 (e). There is no flake structures found in
the deposits and it has more highly distributed pores than CY7 (Figure 5.7 (c)). The
elemental confirmation of MnO2-NiO in the CY4 electrode is analysed using high
resolution TEM as shown in the inset of Figure 5.9 (e). It is confirmed that the
measured interplanar spacing belongs to MnO2 and NiO (Li et al., 2006; Liu et al.,
2006).
(a) (b)
(c) (d)
89 nm 106 nm
93 nm
188 nm
189 nm
257 nm
242nm 227nm 212nm
311 nm 333 nm 307 nm
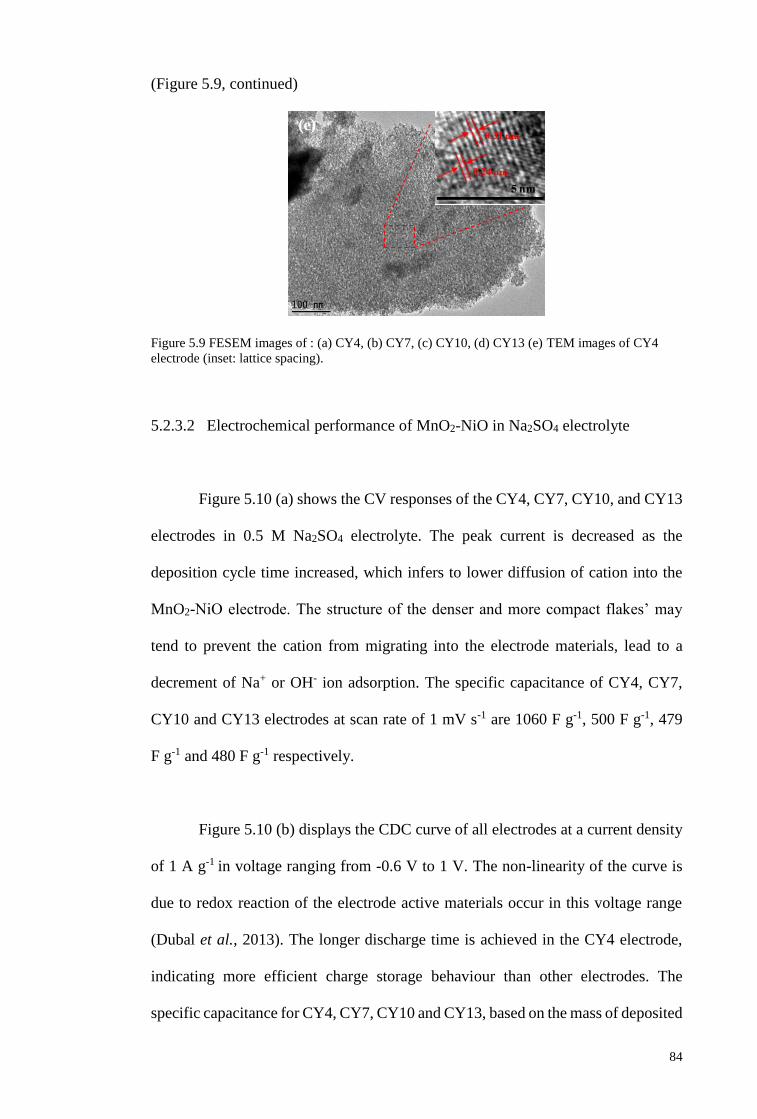
84
(Figure 5.9, continued)
Figure 5.9 FESEM images of : (a) CY4, (b) CY7, (c) CY10, (d) CY13 (e) TEM images of CY4
electrode (inset: lattice spacing).
5.2.3.2 Electrochemical performance of MnO2-NiO in Na2SO4 electrolyte
Figure 5.10 (a) shows the CV responses of the CY4, CY7, CY10, and CY13
electrodes in 0.5 M Na2SO4 electrolyte. The peak current is decreased as the
deposition cycle time increased, which infers to lower diffusion of cation into the
MnO2-NiO electrode. The structure of the denser and more compact flakes’ may
tend to prevent the cation from migrating into the electrode materials, lead to a
decrement of Na+ or OH- ion adsorption. The specific capacitance of CY4, CY7,
CY10 and CY13 electrodes at scan rate of 1 mV s-1 are 1060 F g-1, 500 F g-1, 479
F g-1 and 480 F g-1 respectively.
Figure 5.10 (b) displays the CDC curve of all electrodes at a current density
of 1 A g-1 in voltage ranging from -0.6 V to 1 V. The non-linearity of the curve is
due to redox reaction of the electrode active materials occur in this voltage range
(Dubal et al., 2013). The longer discharge time is achieved in the CY4 electrode,
indicating more efficient charge storage behaviour than other electrodes. The
specific capacitance for CY4, CY7, CY10 and CY13, based on the mass of deposited
(e)
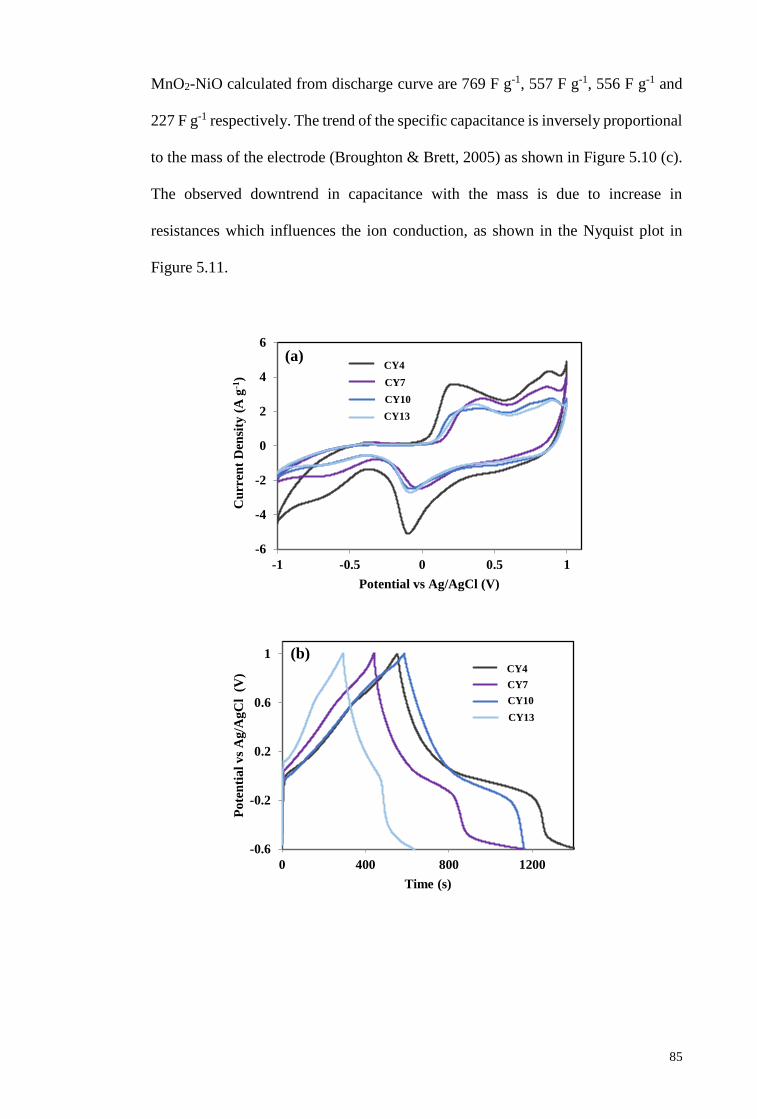
85
MnO2-NiO calculated from discharge curve are 769 F g-1, 557 F g-1, 556 F g-1 and
227 F g-1 respectively. The trend of the specific capacitance is inversely proportional
to the mass of the electrode (Broughton & Brett, 2005) as shown in Figure 5.10 (c).
The observed downtrend in capacitance with the mass is due to increase in
resistances which influences the ion conduction, as shown in the Nyquist plot in
Figure 5.11.
-6
-4
-2
0
2
4
6
-1 -0.5 0 0.5 1
Cu
rren
t D
ensi
ty (
A g
-1)
Potential vs Ag/AgCl (V)
4 cy
7 cy
10 cy
13 cy
-0.6
-0.2
0.2
0.6
1
0 400 800 1200
Po
ten
tia
l v
s A
g/A
gC
l (
V)
Time (s)
4 Cy
7 Cy
10 Cy
13 Cy
(a)
(b)
CY4
CY7
CY10
CY13
CY4
CY7
CY10
CY13
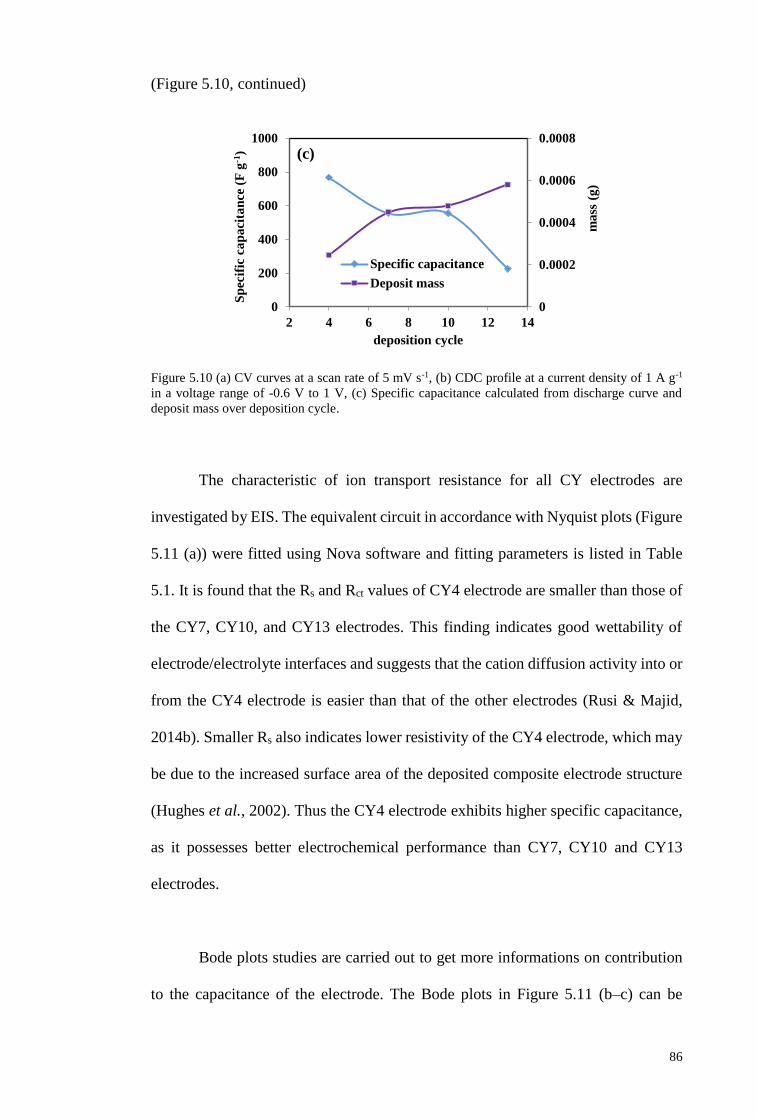
86
(Figure 5.10, continued)
Figure 5.10 (a) CV curves at a scan rate of 5 mV s-1, (b) CDC profile at a current density of 1 A g-1
in a voltage range of -0.6 V to 1 V, (c) Specific capacitance calculated from discharge curve and
deposit mass over deposition cycle.
The characteristic of ion transport resistance for all CY electrodes are
investigated by EIS. The equivalent circuit in accordance with Nyquist plots (Figure
5.11 (a)) were fitted using Nova software and fitting parameters is listed in Table
5.1. It is found that the Rs and Rct values of CY4 electrode are smaller than those of
the CY7, CY10, and CY13 electrodes. This finding indicates good wettability of
electrode/electrolyte interfaces and suggests that the cation diffusion activity into or
from the CY4 electrode is easier than that of the other electrodes (Rusi & Majid,
2014b). Smaller Rs also indicates lower resistivity of the CY4 electrode, which may
be due to the increased surface area of the deposited composite electrode structure
(Hughes et al., 2002). Thus the CY4 electrode exhibits higher specific capacitance,
as it possesses better electrochemical performance than CY7, CY10 and CY13
electrodes.
Bode plots studies are carried out to get more informations on contribution
to the capacitance of the electrode. The Bode plots in Figure 5.11 (b–c) can be
0
0.0002
0.0004
0.0006
0.0008
0
200
400
600
800
1000
2 4 6 8 10 12 14
ma
ss (
g)
Sp
ecif
ic c
ap
aci
tan
ce (
F g
-1)
deposition cycle
Specific capacitance
Deposit mass
(c)
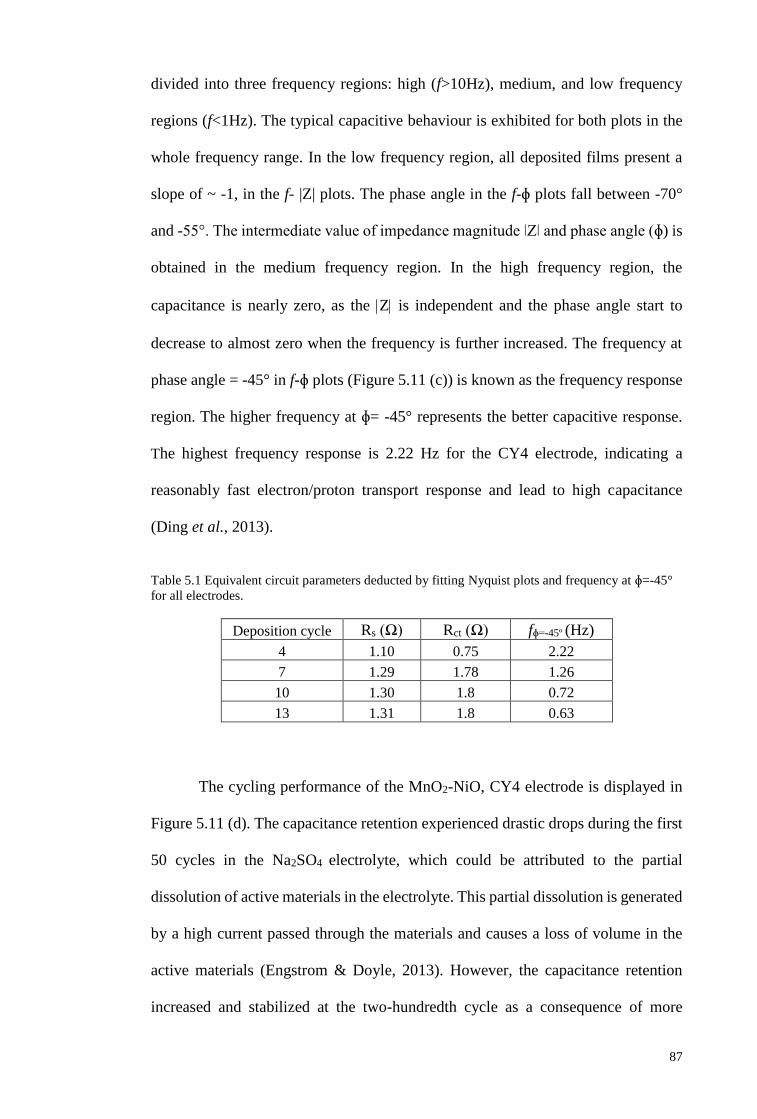
87
divided into three frequency regions: high (f>10Hz), medium, and low frequency
regions (f<1Hz). The typical capacitive behaviour is exhibited for both plots in the
whole frequency range. In the low frequency region, all deposited films present a
slope of ~ -1, in the f- |Z| plots. The phase angle in the f-ɸ plots fall between -70°
and -55°. The intermediate value of impedance magnitude ǀZǀ and phase angle (ɸ) is
obtained in the medium frequency region. In the high frequency region, the
capacitance is nearly zero, as the Z is independent and the phase angle start to
decrease to almost zero when the frequency is further increased. The frequency at
phase angle = -45° in f-ɸ plots (Figure 5.11 (c)) is known as the frequency response
region. The higher frequency at ɸ= -45° represents the better capacitive response.
The highest frequency response is 2.22 Hz for the CY4 electrode, indicating a
reasonably fast electron/proton transport response and lead to high capacitance
(Ding et al., 2013).
Table 5.1 Equivalent circuit parameters deducted by fitting Nyquist plots and frequency at ɸ=-45°
for all electrodes.
Deposition cycle Rs (Ω) Rct (Ω) fɸ=-45º (Hz)
4 1.10 0.75 2.22
7 1.29 1.78 1.26
10 1.30 1.8 0.72
13 1.31 1.8 0.63
The cycling performance of the MnO2-NiO, CY4 electrode is displayed in
Figure 5.11 (d). The capacitance retention experienced drastic drops during the first
50 cycles in the Na2SO4 electrolyte, which could be attributed to the partial
dissolution of active materials in the electrolyte. This partial dissolution is generated
by a high current passed through the materials and causes a loss of volume in the
active materials (Engstrom & Doyle, 2013). However, the capacitance retention
increased and stabilized at the two-hundredth cycle as a consequence of more
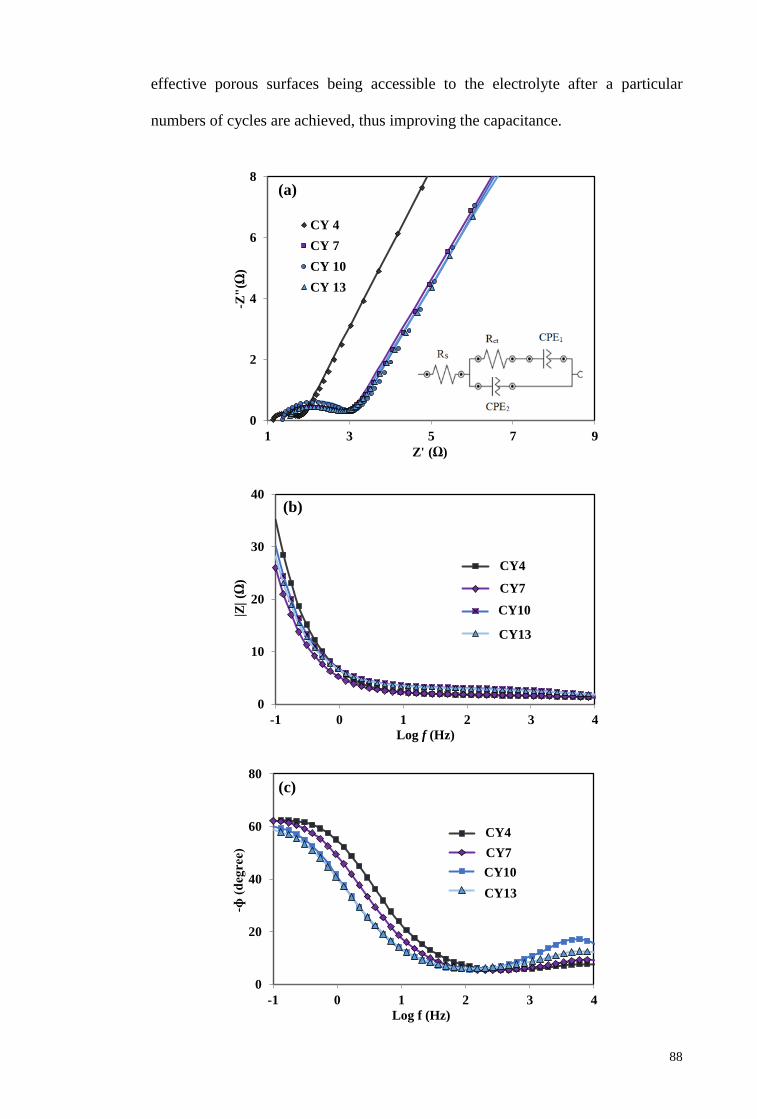
88
effective porous surfaces being accessible to the electrolyte after a particular
numbers of cycles are achieved, thus improving the capacitance.
0
2
4
6
8
1 3 5 7 9
-Z"
(Ω)
Z' (Ω)
CY 4
CY 7
CY 10
CY 13
0
10
20
30
40
-1 0 1 2 3 4
|Z|
(Ω)
Log f (Hz)
4 Cy
7 Cy
10 Cy
13 Cy
0
20
40
60
80
-1 0 1 2 3 4
-ɸ (
deg
ree)
Log f (Hz)
4 Cy
7 Cy
10 Cy
13 Cy
(c)
CY4
CY7
CY10
CY13
(a)
(b)
CY4
CY7
CY10
CY13
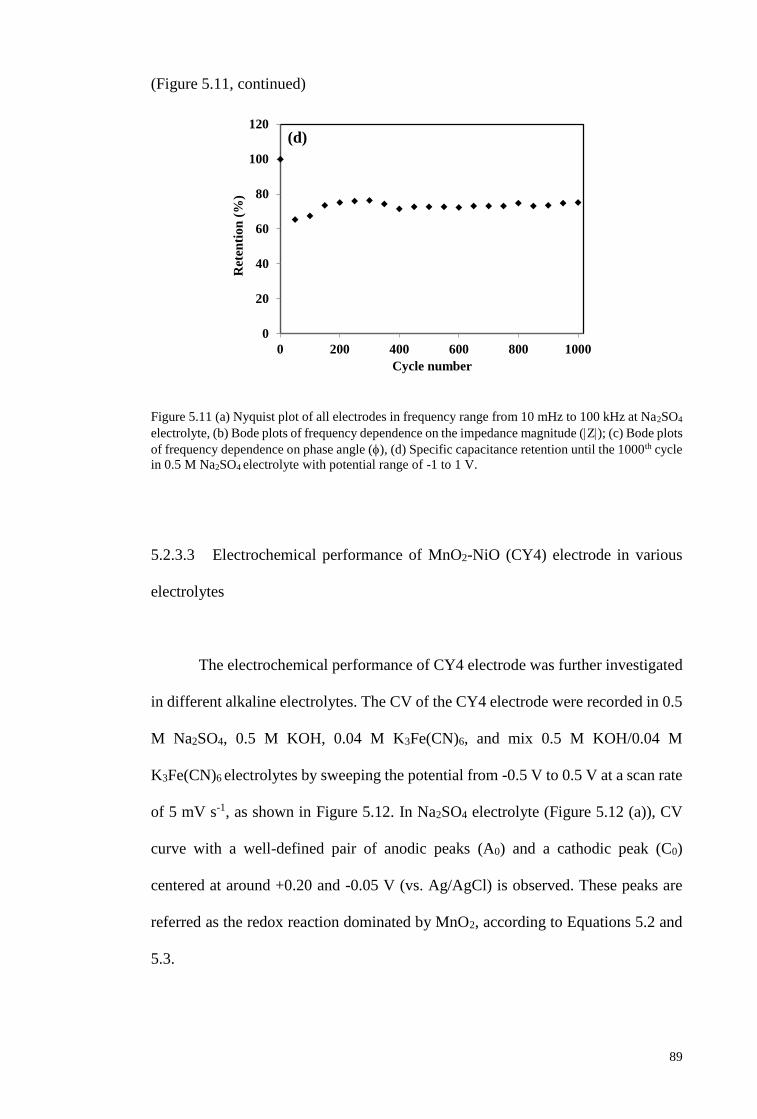
89
(Figure 5.11, continued)
Figure 5.11 (a) Nyquist plot of all electrodes in frequency range from 10 mHz to 100 kHz at Na2SO4
electrolyte, (b) Bode plots of frequency dependence on the impedance magnitude (Z); (c) Bode plots
of frequency dependence on phase angle (), (d) Specific capacitance retention until the 1000th cycle
in 0.5 M Na2SO4 electrolyte with potential range of -1 to 1 V.
5.2.3.3 Electrochemical performance of MnO2-NiO (CY4) electrode in various
electrolytes
The electrochemical performance of CY4 electrode was further investigated
in different alkaline electrolytes. The CV of the CY4 electrode were recorded in 0.5
M Na2SO4, 0.5 M KOH, 0.04 M K3Fe(CN)6, and mix 0.5 M KOH/0.04 M
K3Fe(CN)6 electrolytes by sweeping the potential from -0.5 V to 0.5 V at a scan rate
of 5 mV s-1, as shown in Figure 5.12. In Na2SO4 electrolyte (Figure 5.12 (a)), CV
curve with a well-defined pair of anodic peaks (A0) and a cathodic peak (C0)
centered at around +0.20 and -0.05 V (vs. Ag/AgCl) is observed. These peaks are
referred as the redox reaction dominated by MnO2, according to Equations 5.2 and
5.3.
0
20
40
60
80
100
120
0 200 400 600 800 1000
Ret
enti
on
(%
)
Cycle number
(d)
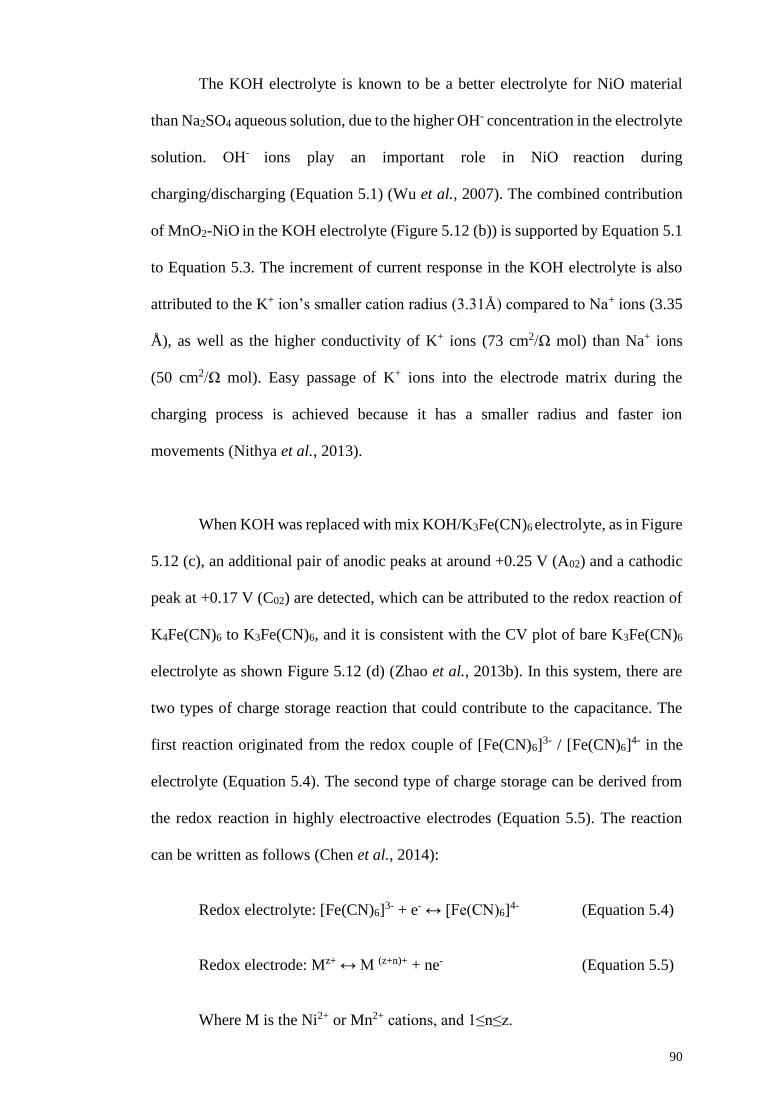
90
The KOH electrolyte is known to be a better electrolyte for NiO material
than Na2SO4 aqueous solution, due to the higher OH- concentration in the electrolyte
solution. OH- ions play an important role in NiO reaction during
charging/discharging (Equation 5.1) (Wu et al., 2007). The combined contribution
of MnO2-NiO in the KOH electrolyte (Figure 5.12 (b)) is supported by Equation 5.1
to Equation 5.3. The increment of current response in the KOH electrolyte is also
attributed to the K+ ion’s smaller cation radius (3.31Å) compared to Na+ ions (3.35
Å), as well as the higher conductivity of K+ ions (73 cm2/Ω mol) than Na+ ions
(50 cm2/Ω mol). Easy passage of K+ ions into the electrode matrix during the
charging process is achieved because it has a smaller radius and faster ion
movements (Nithya et al., 2013).
When KOH was replaced with mix KOH/K3Fe(CN)6 electrolyte, as in Figure
5.12 (c), an additional pair of anodic peaks at around +0.25 V (A02) and a cathodic
peak at +0.17 V (C02) are detected, which can be attributed to the redox reaction of
K4Fe(CN)6 to K3Fe(CN)6, and it is consistent with the CV plot of bare K3Fe(CN)6
electrolyte as shown Figure 5.12 (d) (Zhao et al., 2013b). In this system, there are
two types of charge storage reaction that could contribute to the capacitance. The
first reaction originated from the redox couple of [Fe(CN)6]3- / [Fe(CN)6]
4- in the
electrolyte (Equation 5.4). The second type of charge storage can be derived from
the redox reaction in highly electroactive electrodes (Equation 5.5). The reaction
can be written as follows (Chen et al., 2014):
Redox electrolyte: [Fe(CN)6]3- + e- ↔ [Fe(CN)6]
4- (Equation 5.4)
Redox electrode: Mz+ ↔ M (z+n)+ + ne- (Equation 5.5)
Where M is the Ni2+ or Mn2+ cations, and 1≤n≤z.
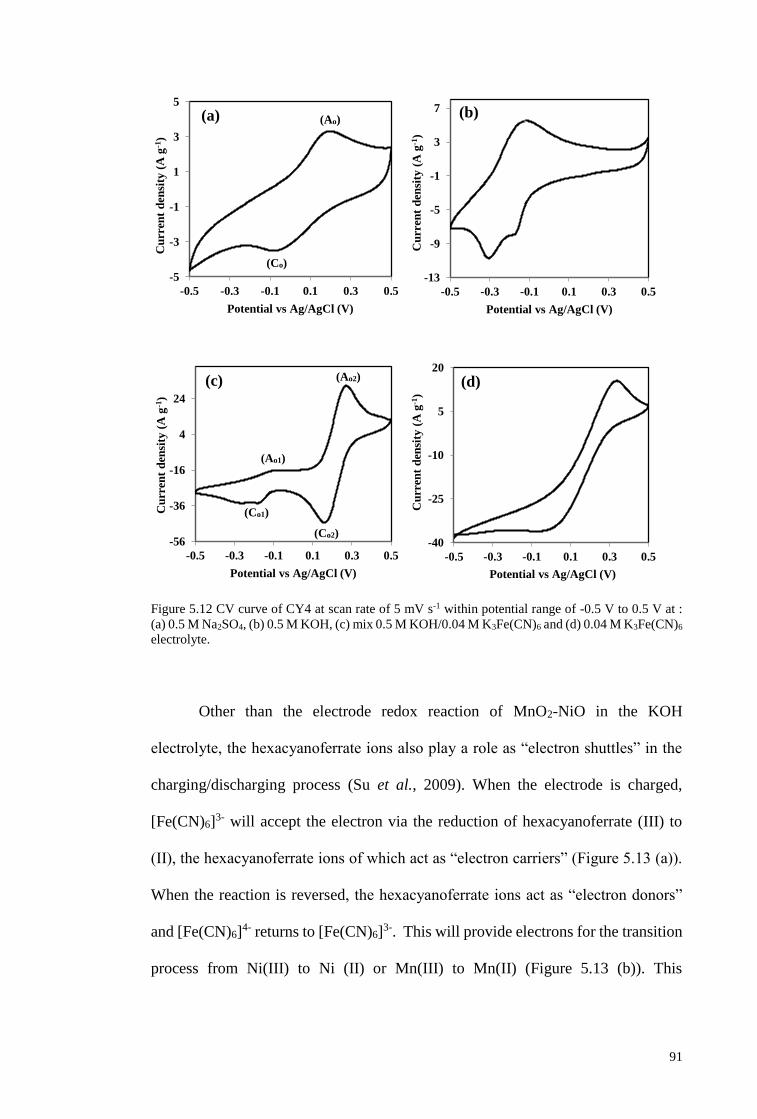
91
Figure 5.12 CV curve of CY4 at scan rate of 5 mV s-1 within potential range of -0.5 V to 0.5 V at :
(a) 0.5 M Na2SO4, (b) 0.5 M KOH, (c) mix 0.5 M KOH/0.04 M K3Fe(CN)6 and (d) 0.04 M K3Fe(CN)6
electrolyte.
Other than the electrode redox reaction of MnO2-NiO in the KOH
electrolyte, the hexacyanoferrate ions also play a role as “electron shuttles” in the
charging/discharging process (Su et al., 2009). When the electrode is charged,
[Fe(CN)6]3- will accept the electron via the reduction of hexacyanoferrate (III) to
(II), the hexacyanoferrate ions of which act as “electron carriers” (Figure 5.13 (a)).
When the reaction is reversed, the hexacyanoferrate ions act as “electron donors”
and [Fe(CN)6]4- returns to [Fe(CN)6]
3-. This will provide electrons for the transition
process from Ni(III) to Ni (II) or Mn(III) to Mn(II) (Figure 5.13 (b)). This
-5
-3
-1
1
3
5
-0.5 -0.3 -0.1 0.1 0.3 0.5
Cu
rren
t d
ensi
ty (
A g
-1)
Potential vs Ag/AgCl (V)
-13
-9
-5
-1
3
7
-0.5 -0.3 -0.1 0.1 0.3 0.5
Cu
rren
t d
ensi
ty (
A g
-1)
Potential vs Ag/AgCl (V)
-56
-36
-16
4
24
-0.5 -0.3 -0.1 0.1 0.3 0.5
Cu
rren
t d
ensi
ty (
A g
-1)
Potential vs Ag/AgCl (V)
-40
-25
-10
5
20
-0.5 -0.3 -0.1 0.1 0.3 0.5
Cu
rren
t d
ensi
ty (
A g
-1)
Potential vs Ag/AgCl (V)
(Ao) (a) (b)
(c) (d)
(Co)
(Ao1)
(Co1)
(Co2)
(Ao2)
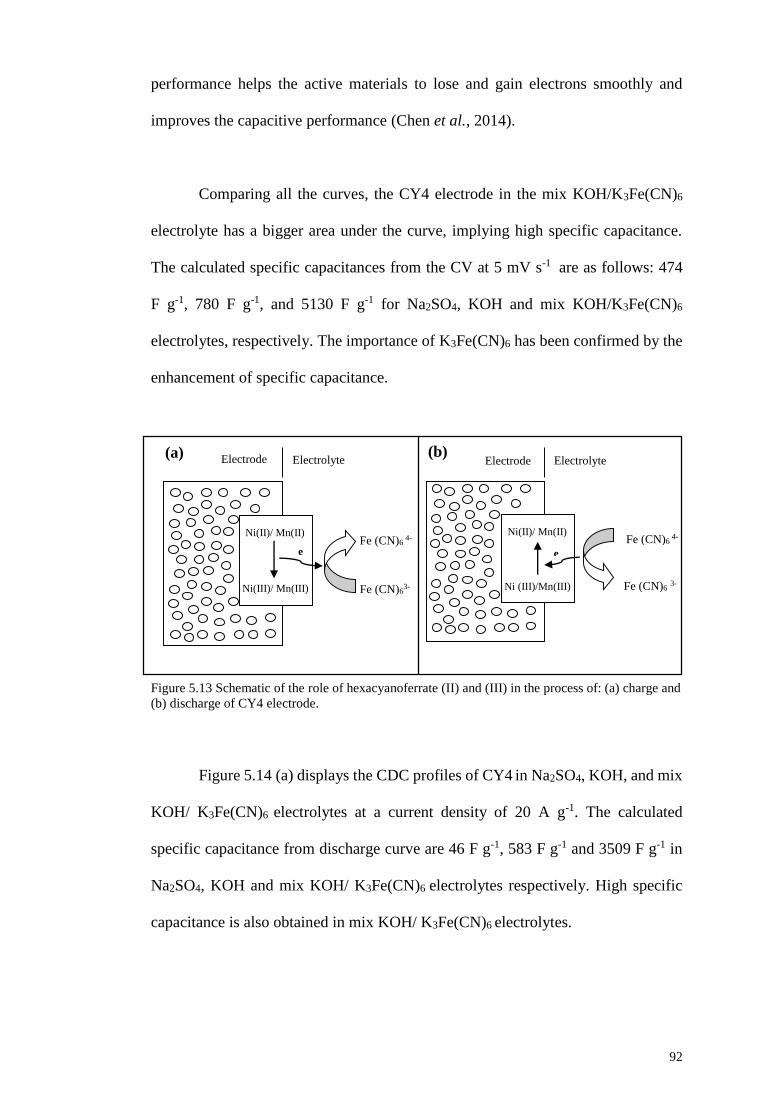
92
performance helps the active materials to lose and gain electrons smoothly and
improves the capacitive performance (Chen et al., 2014).
Comparing all the curves, the CY4 electrode in the mix KOH/K3Fe(CN)6
electrolyte has a bigger area under the curve, implying high specific capacitance.
The calculated specific capacitances from the CV at 5 mV s-1 are as follows: 474
F g-1, 780 F g-1, and 5130 F g-1 for Na2SO4, KOH and mix KOH/K3Fe(CN)6
electrolytes, respectively. The importance of K3Fe(CN)6 has been confirmed by the
enhancement of specific capacitance.
Figure 5.13 Schematic of the role of hexacyanoferrate (II) and (III) in the process of: (a) charge and
(b) discharge of CY4 electrode.
Figure 5.14 (a) displays the CDC profiles of CY4 in Na2SO4, KOH, and mix
KOH/ K3Fe(CN)6 electrolytes at a current density of 20 A g-1. The calculated
specific capacitance from discharge curve are 46 F g-1, 583 F g-1 and 3509 F g-1 in
Na2SO4, KOH and mix KOH/ K3Fe(CN)6 electrolytes respectively. High specific
capacitance is also obtained in mix KOH/ K3Fe(CN)6 electrolytes.
e
Ni(II)/ Mn(II)
Ni (III)/Mn(III)
Fe (CN)6 4-
Fe (CN)6 3-
Electrode Electrolyte
Ni(II)/ Mn(II)
Ni(III)/ Mn(III)
Fe (CN)6 4-
Fe (CN)63-
e
-
Electrode Electrolyte (a) (b)
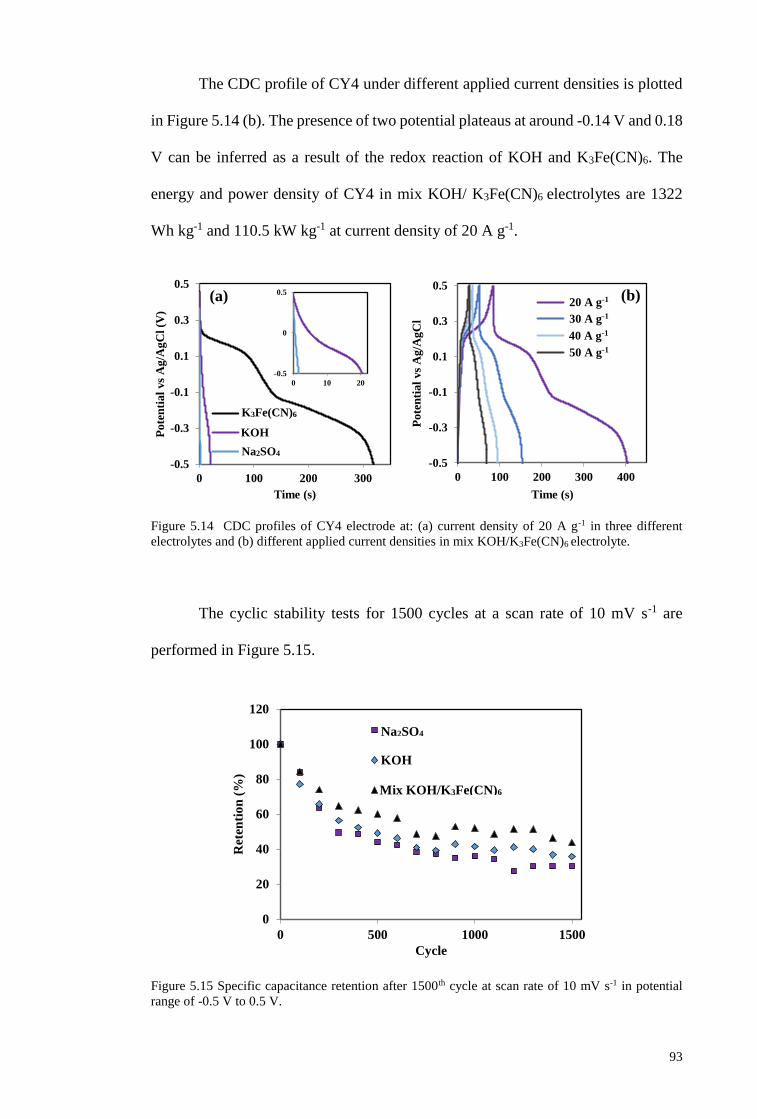
93
The CDC profile of CY4 under different applied current densities is plotted
in Figure 5.14 (b). The presence of two potential plateaus at around -0.14 V and 0.18
V can be inferred as a result of the redox reaction of KOH and K3Fe(CN)6. The
energy and power density of CY4 in mix KOH/ K3Fe(CN)6 electrolytes are 1322
Wh kg-1 and 110.5 kW kg-1 at current density of 20 A g-1.
Figure 5.14 CDC profiles of CY4 electrode at: (a) current density of 20 A g-1 in three different
electrolytes and (b) different applied current densities in mix KOH/K3Fe(CN)6 electrolyte.
The cyclic stability tests for 1500 cycles at a scan rate of 10 mV s-1 are
performed in Figure 5.15.
Figure 5.15 Specific capacitance retention after 1500th cycle at scan rate of 10 mV s-1 in potential
range of -0.5 V to 0.5 V.
-0.5
-0.3
-0.1
0.1
0.3
0.5
0 100 200 300
Pote
nti
al
vs
Ag
/Ag
Cl
(V)
Time (s)
K3Fe(CN)6
KOH
Na2SO4-0.5
-0.3
-0.1
0.1
0.3
0.5
0 100 200 300 400
Pote
nti
al
vs
Ag
/Ag
Cl
Time (s)
20 Ag-1
30 Ag-1
40 Ag-1
50 Ag-1
0
20
40
60
80
100
120
0 500 1000 1500
Ret
enti
on
(%
)
Cycle
Na2SO4
KOH
Mix KOH/K3Fe(CN)6
-0.5
0
0.5
0 10 20
20 A g-1
30 A g-1
40 A g-1
50 A g-1
K3Fe(CN)6
Na2SO4
Na2SO4
Mix KOH/K3Fe(CN)6
(a) (b)
94
The retention of specific capacitance of CY4 in Na2SO4, KOH and mix
KOH/K3Fe(CN)6 electrolytes after 1500 cycles are 30 %, 36 %, and 44 %,
respectively. Low capacitance retention over 1500 cycles could be attributed to high
degradation of the electrode results from the high current passing through during the
cyclability test and volume loss of active materials (Engstrom & Doyle, 2013). The
retention of specific capacitance in KOH is remarkably enhanced when 0.4 M
K3Fe(CN)6 was added to the KOH electrolyte. The additional of K3Fe(CN)6
electrolyte enhance the specific capacitance and improves of electrode stability. This
suggests that the mixed electrolyte is the stable electrolyte for the CY4 electrode.
Although the specific capacitance and energy density in this system is extremely
high, the stability still needs to be improved.
5.3 Summary
The summary of this current work is listed below:
First, the binary MnO2-NiO electrode is successfully deposited on top of SS
using CP mode.
The NiO-25 electrode deposited from deposition electrolyte with
concentration ratio of 0.25 M Ni(CH3COO)2.4H2O mixed with 0.01 M
Mn(CH3COO)2.4H2O is found to have uniform interconnected flake porous
structure.
The electrochemical performance of NiO-25 confirmed that it has better
performance in ion diffusion with specific capacitance of 435 F g-1 at scan
rate of 1 mV s-1 at 0.5 M Na2SO4 electrolyte.
95
The optimum electrolyte ratio (0.25 M Ni(CH3COO)2.4H2O : 0.01 M
Mn(CH3COO)2.4H2O) is further used in different electrodeposition mode
studies include CA and CV modes.
The suitable electrodeposition modes for deposited MnO2-NiO electrodes is
CV mode.
The number of deposition cycles in CV mode influences the nucleation
process, morphology structure, deposit thickness and electrochemical
performance of deposited MnO2-NiO electrode.
The CV mode with 4 times deposition cycle (CY4 electrode) gave a better
electrochemical performance with specific capacitance of 769 F g-1 at scan
rate of 5 mV s-1 at 0.5 M Na2SO4 electrolyte.
The specific capacitance, energy density and power density of CY4 electrode
in mix KOH/ K3Fe(CN)6 electrolyte are 3509 F g-1, 1322 Wh kg-1 and 110.5
kW kg-1 at current density of 20 A g-1 with potential range from -0.5 to 0.5
V.
CY 4 electrode exhibits 44 % of specific capacitance retention after 1500
cycles in mix KOH/ K3Fe(CN)6 electrolyte with potential range from -0.5 to
0.5 V at scan rate of 10 mV s-1.
The additional K3Fe(CN)6 in KOH electrolyte has improved the specific
capacitance and electrode stability MnO2-NiO binary electrodes.
MnO2-NiO binary electrodes are cost efficient electrodes for supercapacitor
application.
96
CHAPTER 6: THE STUDIES OF Mn3O4-NiO-Co3O4 TERNARY
ELECTRODE SYSTEM
6.1 Introduction
Pseudocapacitor with high energy density, power density and high cycle
stability has become the necessary requirement in many applications (Pu et al.,
2013; Wang et al., 2014). Transition metal oxides are well known as one of the main
electrode materials that can produce high pseudocapacitance due to its reversibility
in oxidisation and reduction over a wide potential range (Rusi & Majid). However
the limitation of capacitive storage ability of single inexpensive metal oxide (MnO2,
NiO, Co3O4 and VO) as electrode is still a major problem. Thus, it has led to many
research works in this area (Wang et al., 2010b; Wei et al., 2011).
One of the simple approaches to improve the performance of single metal
oxide electrode is by incorporating two or more metal oxides in one electrode. This
method has become a popular method to produce high surface area electrode and it
can reduce the resistance and enhance the charge storage capability (Rusi & Majid,
2014b; Wang et al., 2013; Wang et al., 2010b; Wei et al., 2011). In our previous
studies, a binary electrode consisting of a binary metal oxides, MnO2-NiO electrode
has been successfully electrodeposited by the chronopotentiometry method (Rusi &
Majid, 2014b). The electrode exhibited an enhanced specific capacitance compared
with MnO2 deposits. The best specific capacitance has been found to be 435 F g-1 in
0.5 M Na2SO4 at scan rate of 1 mV s-1 (in a voltage range of -1 V to 1 V). The
capacitance of the MnO2-NiO electrode can be further improved by compositing
another metal oxide into this binary electrodes.
97
In this work, we synthesized a composite electrode containing three metal
oxides, Mn3O4, NiO and Co3O4, in thin film through the galvanostatic technique.
Mn3O4 is one of the most stable manganese oxides and has moderate specific
capacitance, long-term stability and good corrosion stability (Dubal et al., 2010).
Nickel oxide has high theoretical specific capacitance (~2573 F g-1) but relatively
low redox reversibility (Jena et al., 2013) while cobalt oxide has a relatively low
specific capacitance but has high redox activity and good reversibility (Hsu et al.,
2013). The combination of these features is beneficial for higher electrochemical
capacitance of the composite electrode (Wang et al., 2013).
The ternary of Mn3O4-NiO-Co3O4 nanostructures/SS electrode are also
evaluated in different electrolytes: 0.5 M Na2SO4, 0.5 M KOH and mixed 0.5 M
KOH/0.04 M K3Fe(CN)6 electrolytes. The use of the redox additive K3Fe(CN)6 in
alkaline electrolytes is designed to improve the storage capability performance (Su
et al., 2009; Zhao et al., 2013).
6.2 Results and discussion
6.2.1 Optimization of CoSO4.7H2O concentration for Mn3O4-NiO-Co3O4 electrode
system
6.2.1.1 Characterization of composition and morphology of Mn3O4-NiO-Co3O4
electrode
The formation of Mn3O4-NiO-Co3O4 ternary layer is generated from an
electrochemical reaction during the electrodeposition process and can be expressed
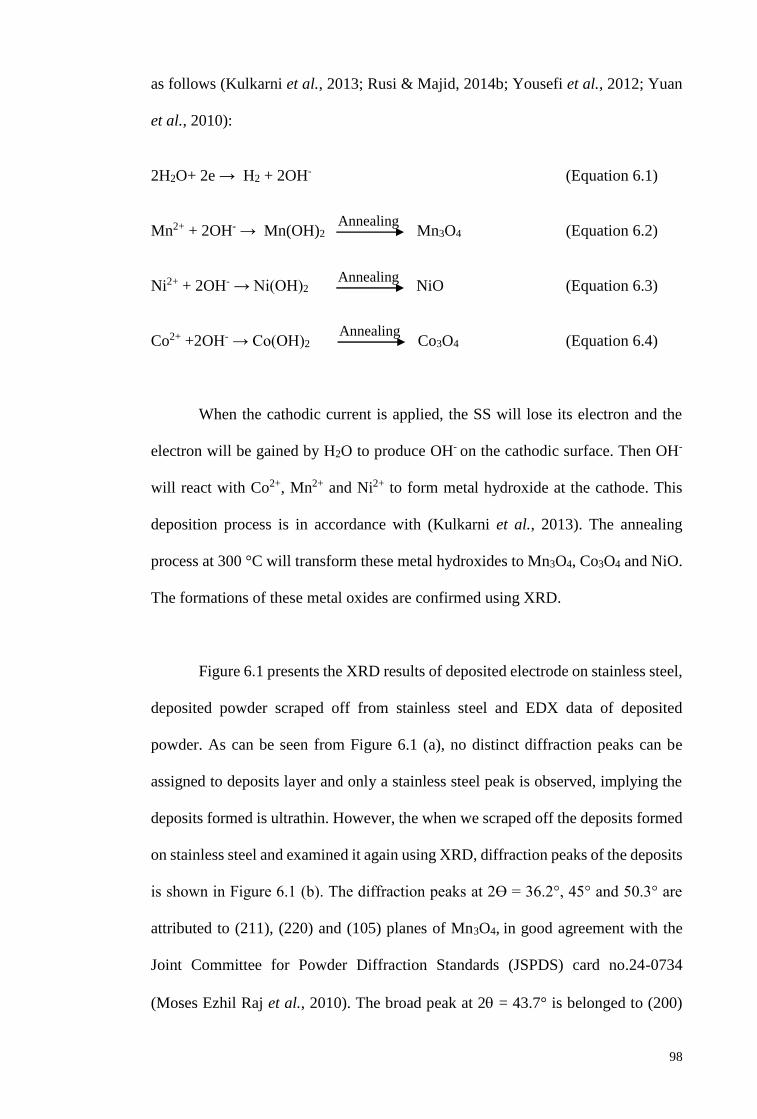
98
as follows (Kulkarni et al., 2013; Rusi & Majid, 2014b; Yousefi et al., 2012; Yuan
et al., 2010):
2H2O+ 2e → H2 + 2OH- (Equation 6.1)
Mn2+ + 2OH- → Mn(OH)2 Mn3O4 (Equation 6.2)
Ni2+ + 2OH- → Ni(OH)2 NiO (Equation 6.3)
Co2+ +2OH- → Co(OH)2 Co3O4 (Equation 6.4)
When the cathodic current is applied, the SS will lose its electron and the
electron will be gained by H2O to produce OH- on the cathodic surface. Then OH-
will react with Co2+, Mn2+ and Ni2+ to form metal hydroxide at the cathode. This
deposition process is in accordance with (Kulkarni et al., 2013). The annealing
process at 300 °C will transform these metal hydroxides to Mn3O4, Co3O4 and NiO.
The formations of these metal oxides are confirmed using XRD.
Figure 6.1 presents the XRD results of deposited electrode on stainless steel,
deposited powder scraped off from stainless steel and EDX data of deposited
powder. As can be seen from Figure 6.1 (a), no distinct diffraction peaks can be
assigned to deposits layer and only a stainless steel peak is observed, implying the
deposits formed is ultrathin. However, the when we scraped off the deposits formed
on stainless steel and examined it again using XRD, diffraction peaks of the deposits
is shown in Figure 6.1 (b). The diffraction peaks at 2Ө = 36.2°, 45° and 50.3° are
attributed to (211), (220) and (105) planes of Mn3O4, in good agreement with the
Joint Committee for Powder Diffraction Standards (JSPDS) card no.24-0734
(Moses Ezhil Raj et al., 2010). The broad peak at 2 = 43.7° is belonged to (200)
Annealing
Annealing
Annealing
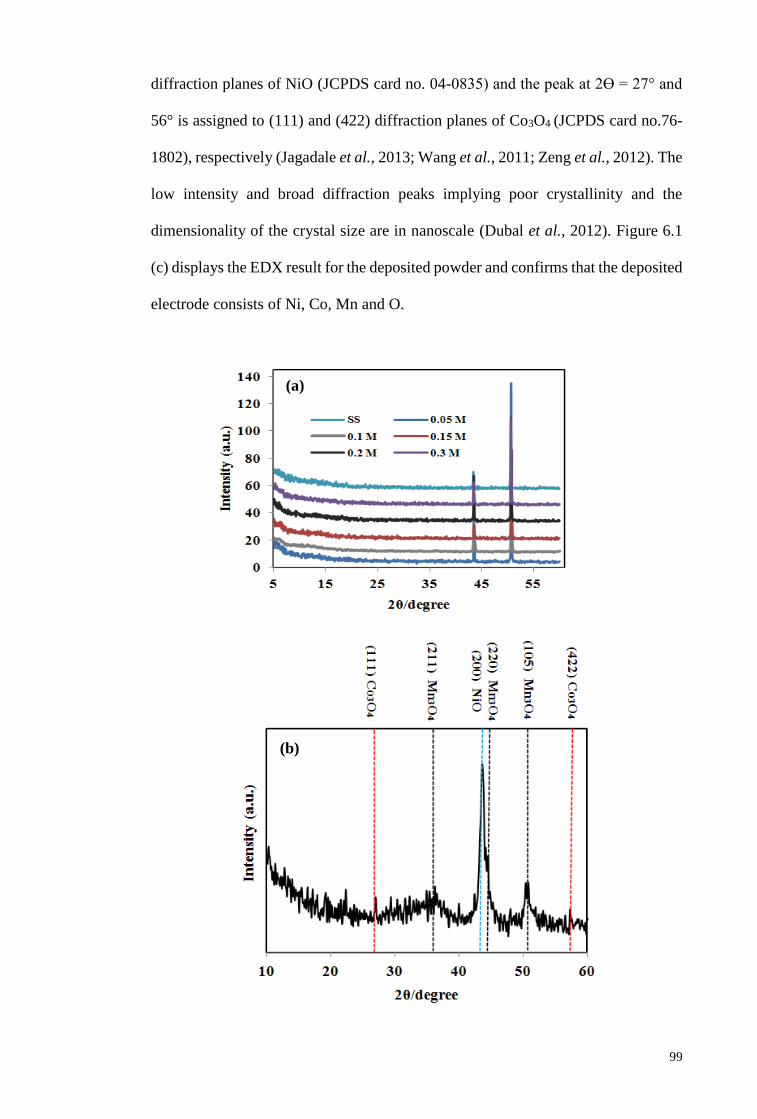
99
diffraction planes of NiO (JCPDS card no. 04-0835) and the peak at 2Ө = 27° and
56° is assigned to (111) and (422) diffraction planes of Co3O4 (JCPDS card no.76-
1802), respectively (Jagadale et al., 2013; Wang et al., 2011; Zeng et al., 2012). The
low intensity and broad diffraction peaks implying poor crystallinity and the
dimensionality of the crystal size are in nanoscale (Dubal et al., 2012). Figure 6.1
(c) displays the EDX result for the deposited powder and confirms that the deposited
electrode consists of Ni, Co, Mn and O.
(a)
(b)
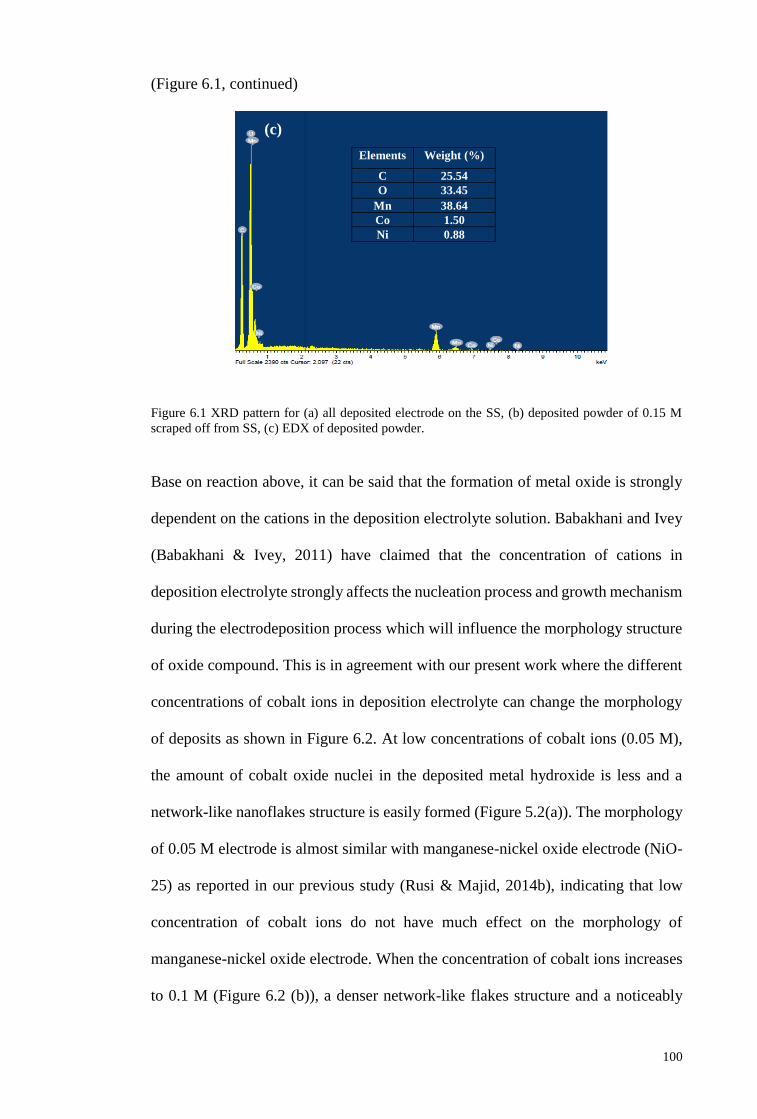
100
(Figure 6.1, continued)
Figure 6.1 XRD pattern for (a) all deposited electrode on the SS, (b) deposited powder of 0.15 M
scraped off from SS, (c) EDX of deposited powder.
Base on reaction above, it can be said that the formation of metal oxide is strongly
dependent on the cations in the deposition electrolyte solution. Babakhani and Ivey
(Babakhani & Ivey, 2011) have claimed that the concentration of cations in
deposition electrolyte strongly affects the nucleation process and growth mechanism
during the electrodeposition process which will influence the morphology structure
of oxide compound. This is in agreement with our present work where the different
concentrations of cobalt ions in deposition electrolyte can change the morphology
of deposits as shown in Figure 6.2. At low concentrations of cobalt ions (0.05 M),
the amount of cobalt oxide nuclei in the deposited metal hydroxide is less and a
network-like nanoflakes structure is easily formed (Figure 5.2(a)). The morphology
of 0.05 M electrode is almost similar with manganese-nickel oxide electrode (NiO-
25) as reported in our previous study (Rusi & Majid, 2014b), indicating that low
concentration of cobalt ions do not have much effect on the morphology of
manganese-nickel oxide electrode. When the concentration of cobalt ions increases
to 0.1 M (Figure 6.2 (b)), a denser network-like flakes structure and a noticeably
(c)
Elements Weight (%)
C 25.54
O 33.45
Mn 38.64
Co 1.50
Ni 0.88
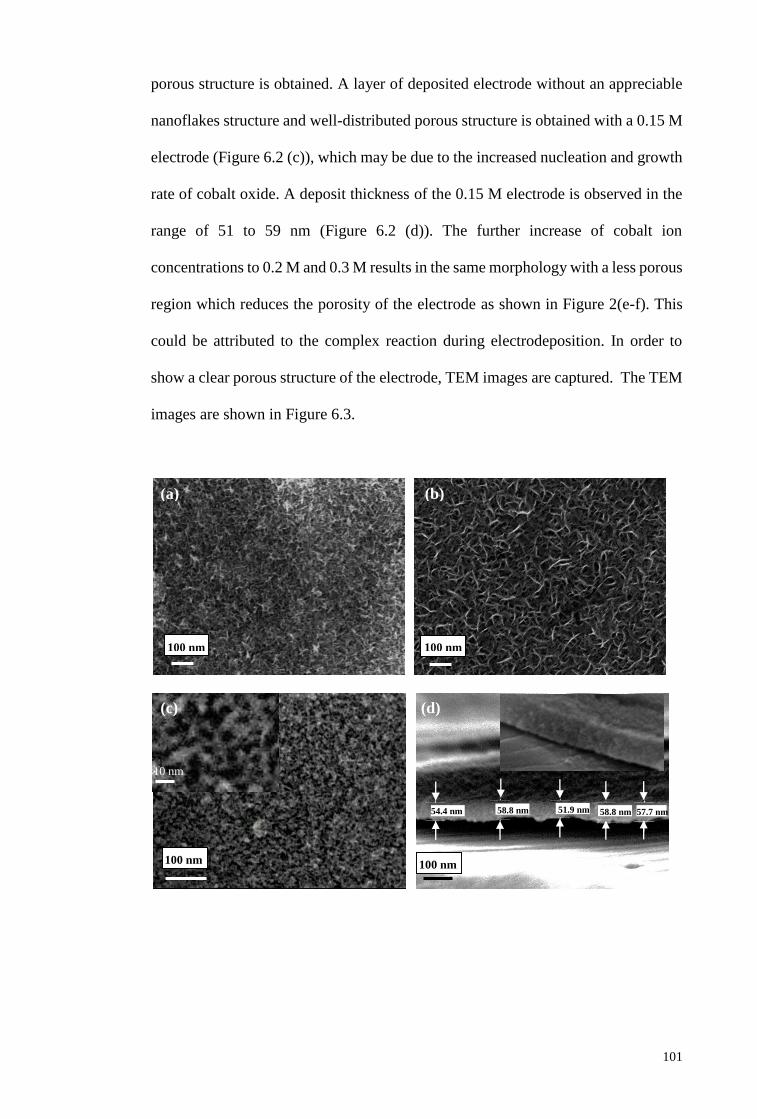
101
porous structure is obtained. A layer of deposited electrode without an appreciable
nanoflakes structure and well-distributed porous structure is obtained with a 0.15 M
electrode (Figure 6.2 (c)), which may be due to the increased nucleation and growth
rate of cobalt oxide. A deposit thickness of the 0.15 M electrode is observed in the
range of 51 to 59 nm (Figure 6.2 (d)). The further increase of cobalt ion
concentrations to 0.2 M and 0.3 M results in the same morphology with a less porous
region which reduces the porosity of the electrode as shown in Figure 2(e-f). This
could be attributed to the complex reaction during electrodeposition. In order to
show a clear porous structure of the electrode, TEM images are captured. The TEM
images are shown in Figure 6.3.
10 nm
(a) (b)
(c) (d)
100 nm 100 nm
100 nm 100 nm
54.4 nm
58.8 nm 51.9 nm
58.8 nm 57.7 nm
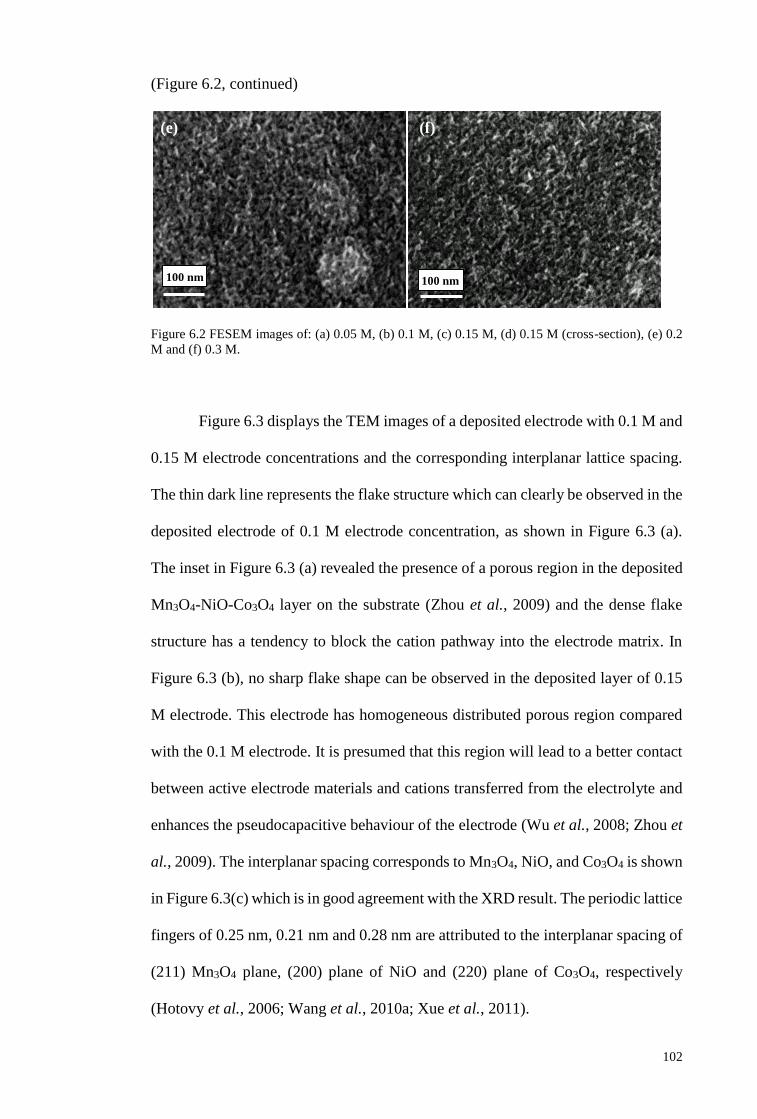
102
(Figure 6.2, continued)
Figure 6.2 FESEM images of: (a) 0.05 M, (b) 0.1 M, (c) 0.15 M, (d) 0.15 M (cross-section), (e) 0.2
M and (f) 0.3 M.
Figure 6.3 displays the TEM images of a deposited electrode with 0.1 M and
0.15 M electrode concentrations and the corresponding interplanar lattice spacing.
The thin dark line represents the flake structure which can clearly be observed in the
deposited electrode of 0.1 M electrode concentration, as shown in Figure 6.3 (a).
The inset in Figure 6.3 (a) revealed the presence of a porous region in the deposited
Mn3O4-NiO-Co3O4 layer on the substrate (Zhou et al., 2009) and the dense flake
structure has a tendency to block the cation pathway into the electrode matrix. In
Figure 6.3 (b), no sharp flake shape can be observed in the deposited layer of 0.15
M electrode. This electrode has homogeneous distributed porous region compared
with the 0.1 M electrode. It is presumed that this region will lead to a better contact
between active electrode materials and cations transferred from the electrolyte and
enhances the pseudocapacitive behaviour of the electrode (Wu et al., 2008; Zhou et
al., 2009). The interplanar spacing corresponds to Mn3O4, NiO, and Co3O4 is shown
in Figure 6.3(c) which is in good agreement with the XRD result. The periodic lattice
fingers of 0.25 nm, 0.21 nm and 0.28 nm are attributed to the interplanar spacing of
(211) Mn3O4 plane, (200) plane of NiO and (220) plane of Co3O4, respectively
(Hotovy et al., 2006; Wang et al., 2010a; Xue et al., 2011).
(e) (f)
100 nm 100 nm
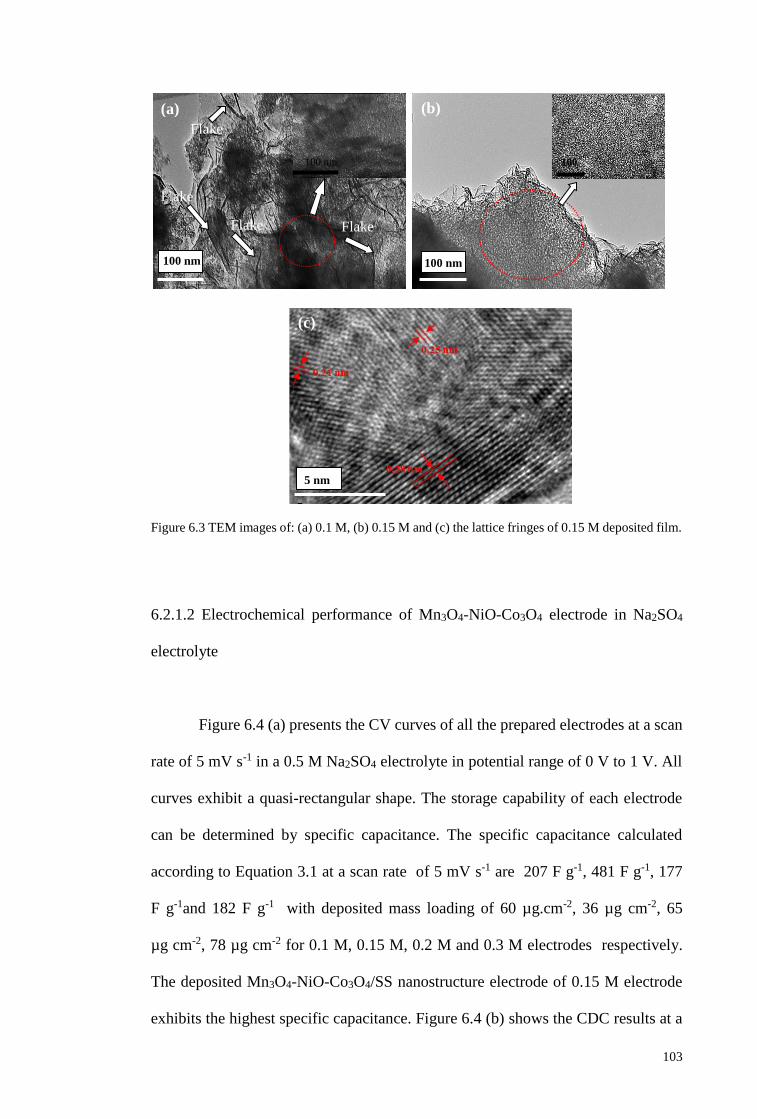
103
Figure 6.3 TEM images of: (a) 0.1 M, (b) 0.15 M and (c) the lattice fringes of 0.15 M deposited film.
6.2.1.2 Electrochemical performance of Mn3O4-NiO-Co3O4 electrode in Na2SO4
electrolyte
Figure 6.4 (a) presents the CV curves of all the prepared electrodes at a scan
rate of 5 mV s-1 in a 0.5 M Na2SO4 electrolyte in potential range of 0 V to 1 V. All
curves exhibit a quasi-rectangular shape. The storage capability of each electrode
can be determined by specific capacitance. The specific capacitance calculated
according to Equation 3.1 at a scan rate of 5 mV s-1 are 207 F g-1, 481 F g-1, 177
F g-1and 182 F g-1 with deposited mass loading of 60 µg.cm-2, 36 µg cm-2, 65
µg cm-2, 78 µg cm-2 for 0.1 M, 0.15 M, 0.2 M and 0.3 M electrodes respectively.
The deposited Mn3O4-NiO-Co3O4/SS nanostructure electrode of 0.15 M electrode
exhibits the highest specific capacitance. Figure 6.4 (b) shows the CDC results at a
Flake
Flake Flake
Flake
100 nm 100
nm
(a) (b)
(c)
(b)
(c)
100 nm 100 nm
5 nm
104
constant current density of 1 A g-1. All CDC curves are linear and symmetrical,
implying ideal capacitive behaviour. The CDC process operates in a constant range
potential reflecting the excellent storage capability of the electrodes (Hung et al.,
2013). The specific capacitances calculated from Equation 3.2 are 526 F g-1, 1428
F g-1, 417 F g-1and 370 F g-1 for 0.1 M, 0.15 M, 0.2 M and 0.3 M electrodes at 1
A g-1 respectively. The 0.15 M electrode again shows the highest specific
capacitance. Compared to the electrode without cobalt (Rusi & Majid, 2014b), the
specific capacitance of Mn3O4-NiO-Co3O4/SS has increased to 1071 F g-1 when 0.15
M cobalt ion is added into the deposition electrolyte solution, implying that the
cobalt oxide plays a role in the increment of specific capacitance. Although the
values of specific capacitances obtained from CV and CDC are different, the trends
are identical. The specific capacitance calculated from Equation 3.2 is higher than
the one obtained from Equation 3.1. This is because of the slower charging rate at
low current in the CDC test that allows more intercalation of electrolyte ions to occur
(Engstrom & Doyle, 2013). Thus more charges can be stored and contribute to the
higher specific capacitance.
The AC impedance measurement is performed in order to understand the ion
transportation and charge transfer mechanism. The Nyquist plots of the AC
impedance responses in the 0.5 M Na2SO4 electrolyte are shown in Figure 6.4 (c).
The measured impedances are analysed using Nova simulation software on the basis
of the equivalent circuit in Fig.6.4 (c, insert). Here, Rs is represented bulk resistance
which due to combination resistance of ionic resistance of electrolyte, contact
resistance and internal resistance of the materials. Rct is related to charge transfer
resistance in the electrode/electrolyte interface. The Warburg impedance (W) is
associated with the cation diffusion in the electrode, CPE1 represents the non-ideal
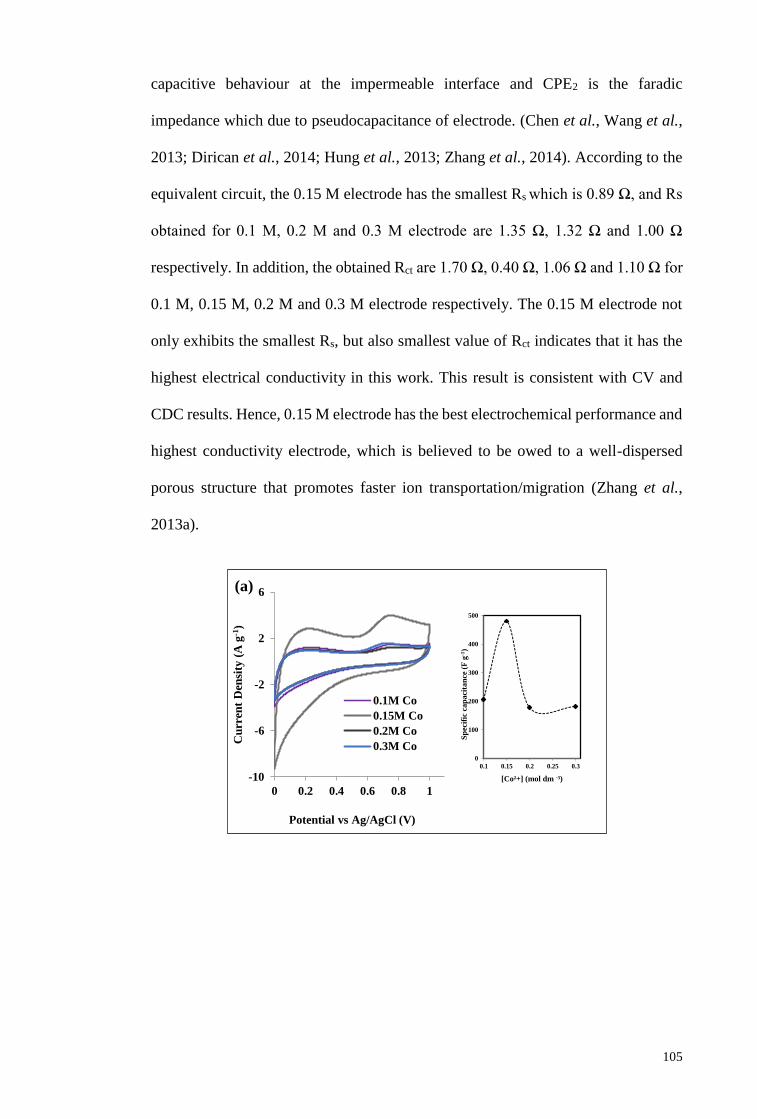
105
capacitive behaviour at the impermeable interface and CPE2 is the faradic
impedance which due to pseudocapacitance of electrode. (Chen et al., Wang et al.,
2013; Dirican et al., 2014; Hung et al., 2013; Zhang et al., 2014). According to the
equivalent circuit, the 0.15 M electrode has the smallest Rs which is 0.89 Ω, and Rs
obtained for 0.1 M, 0.2 M and 0.3 M electrode are 1.35 Ω, 1.32 Ω and 1.00 Ω
respectively. In addition, the obtained Rct are 1.70 Ω, 0.40 Ω, 1.06 Ω and 1.10 Ω for
0.1 M, 0.15 M, 0.2 M and 0.3 M electrode respectively. The 0.15 M electrode not
only exhibits the smallest Rs, but also smallest value of Rct indicates that it has the
highest electrical conductivity in this work. This result is consistent with CV and
CDC results. Hence, 0.15 M electrode has the best electrochemical performance and
highest conductivity electrode, which is believed to be owed to a well-dispersed
porous structure that promotes faster ion transportation/migration (Zhang et al.,
2013a).
-10
-6
-2
2
6
0 0.2 0.4 0.6 0.8 1
Cu
rren
t D
ensi
ty (
A g
-1)
Potential vs Ag/AgCl (V)
0.1M Co
0.15M Co
0.2M Co
0.3M Co0
100
200
300
400
500
0.1 0.15 0.2 0.25 0.3
Sp
ecif
ic c
ap
aci
tan
ce (
F g
-1)
[Co²+] (mol dm -³)
(a)
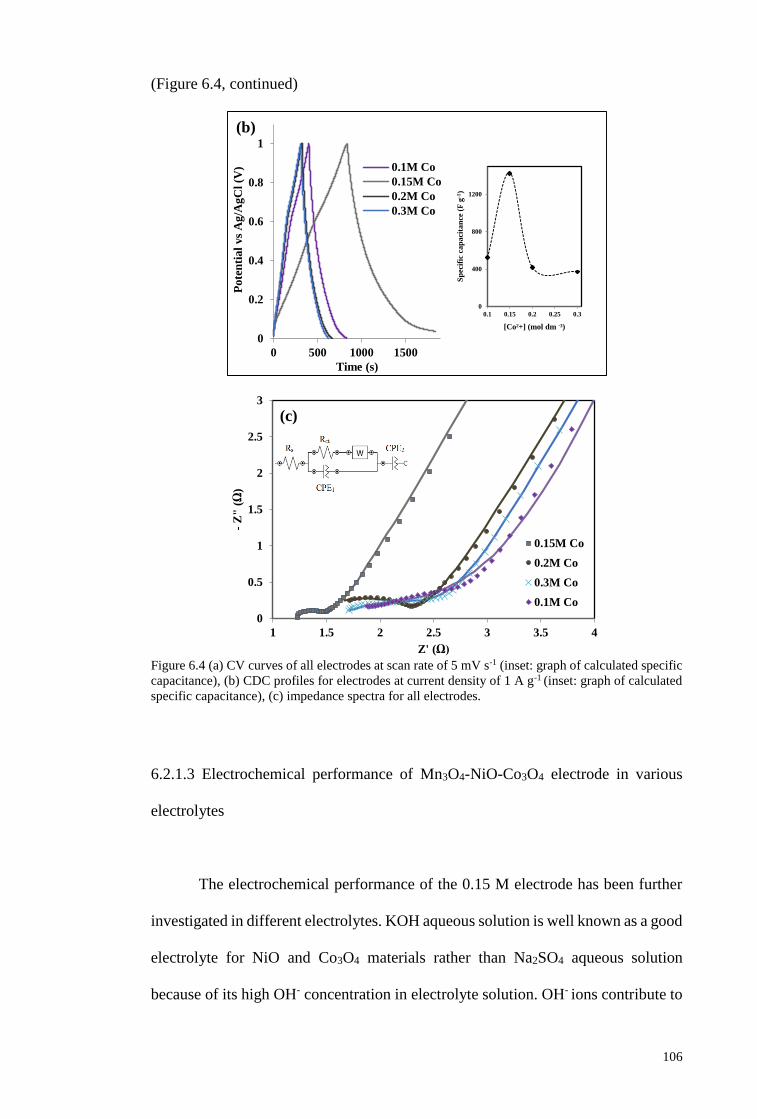
106
(Figure 6.4, continued)
Figure 6.4 (a) CV curves of all electrodes at scan rate of 5 mV s-1 (inset: graph of calculated specific
capacitance), (b) CDC profiles for electrodes at current density of 1 A g-1 (inset: graph of calculated
specific capacitance), (c) impedance spectra for all electrodes.
6.2.1.3 Electrochemical performance of Mn3O4-NiO-Co3O4 electrode in various
electrolytes
The electrochemical performance of the 0.15 M electrode has been further
investigated in different electrolytes. KOH aqueous solution is well known as a good
electrolyte for NiO and Co3O4 materials rather than Na2SO4 aqueous solution
because of its high OH- concentration in electrolyte solution. OH- ions contribute to
0
0.2
0.4
0.6
0.8
1
0 500 1000 1500
Pote
nti
al
vs
Ag
/Ag
Cl
(V)
Time (s)
0.1M Co
0.15M Co
0.2M Co
0.3M Co
0
0.5
1
1.5
2
2.5
3
1 1.5 2 2.5 3 3.5 4
-Z
" (
Ω)
Z' (Ω)
0.15M Co
0.2M Co
0.3M Co
0.1M Co
0
400
800
1200
0.1 0.15 0.2 0.25 0.3
Sp
ecif
ic c
ap
aci
tan
ce (
F g
-1)
[Co²+] (mol dm -³)
(c)
(b)
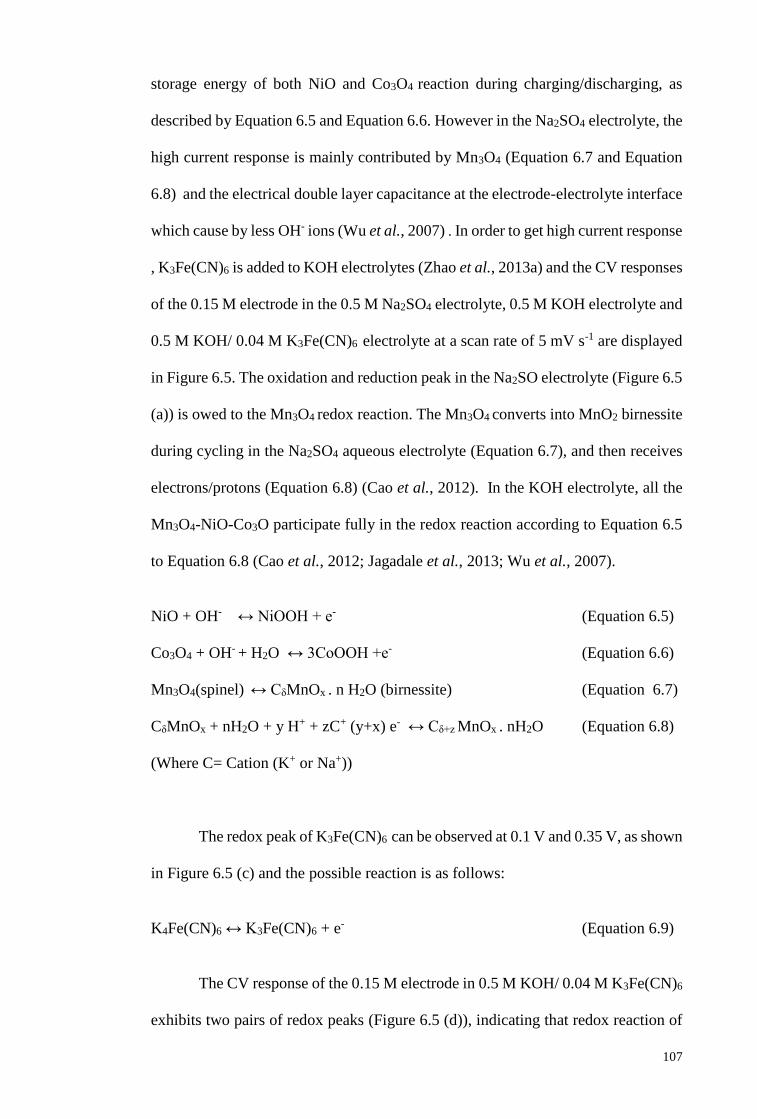
107
storage energy of both NiO and Co3O4 reaction during charging/discharging, as
described by Equation 6.5 and Equation 6.6. However in the Na2SO4 electrolyte, the
high current response is mainly contributed by Mn3O4 (Equation 6.7 and Equation
6.8) and the electrical double layer capacitance at the electrode-electrolyte interface
which cause by less OH- ions (Wu et al., 2007) . In order to get high current response
, K3Fe(CN)6 is added to KOH electrolytes (Zhao et al., 2013a) and the CV responses
of the 0.15 M electrode in the 0.5 M Na2SO4 electrolyte, 0.5 M KOH electrolyte and
0.5 M KOH/ 0.04 M K3Fe(CN)6 electrolyte at a scan rate of 5 mV s-1 are displayed
in Figure 6.5. The oxidation and reduction peak in the Na2SO electrolyte (Figure 6.5
(a)) is owed to the Mn3O4 redox reaction. The Mn3O4 converts into MnO2 birnessite
during cycling in the Na2SO4 aqueous electrolyte (Equation 6.7), and then receives
electrons/protons (Equation 6.8) (Cao et al., 2012). In the KOH electrolyte, all the
Mn3O4-NiO-Co3O participate fully in the redox reaction according to Equation 6.5
to Equation 6.8 (Cao et al., 2012; Jagadale et al., 2013; Wu et al., 2007).
NiO + OH- ↔ NiOOH + e- (Equation 6.5)
Co3O4 + OH- + H2O ↔ 3CoOOH +e- (Equation 6.6)
Mn3O4(spinel) ↔ CδMnOx . n H2O (birnessite) (Equation 6.7)
CδMnOx + nH2O + y H+ + zC+ (y+x) e- ↔ Cδ+z MnOx . nH2O (Equation 6.8)
(Where C= Cation (K+ or Na+))
The redox peak of K3Fe(CN)6 can be observed at 0.1 V and 0.35 V, as shown
in Figure 6.5 (c) and the possible reaction is as follows:
K4Fe(CN)6 ↔ K3Fe(CN)6 + e- (Equation 6.9)
The CV response of the 0.15 M electrode in 0.5 M KOH/ 0.04 M K3Fe(CN)6
exhibits two pairs of redox peaks (Figure 6.5 (d)), indicating that redox reaction of
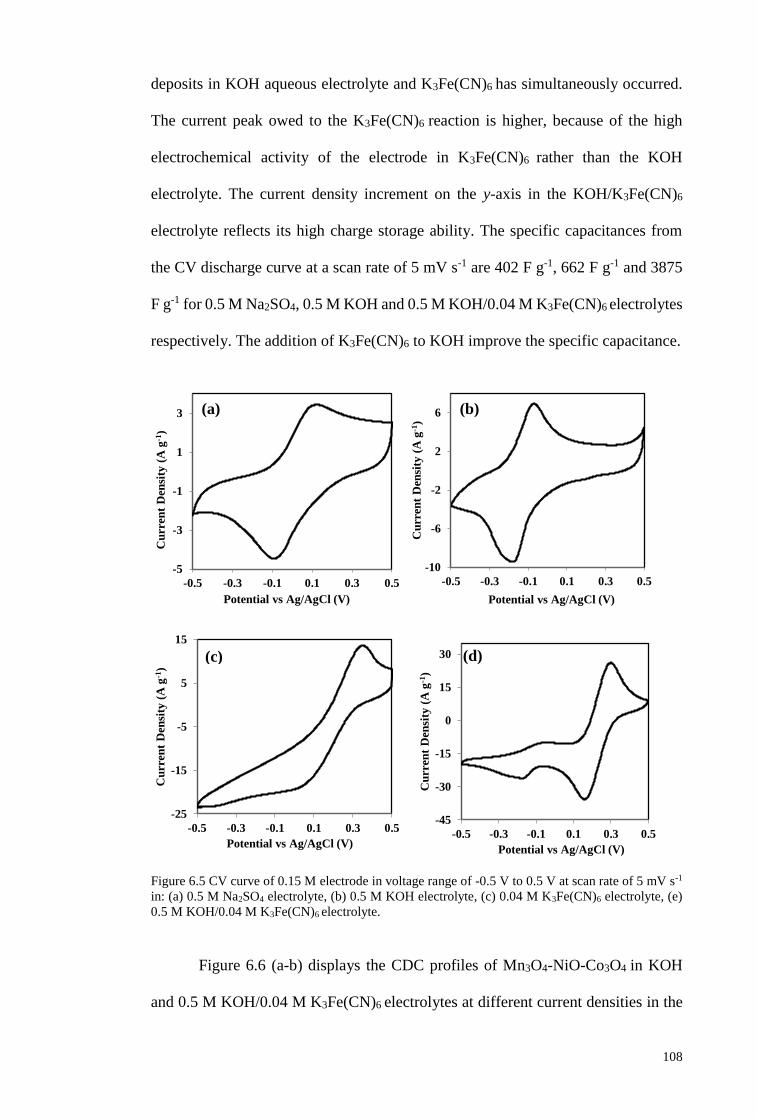
108
deposits in KOH aqueous electrolyte and K3Fe(CN)6 has simultaneously occurred.
The current peak owed to the K3Fe(CN)6 reaction is higher, because of the high
electrochemical activity of the electrode in K3Fe(CN)6 rather than the KOH
electrolyte. The current density increment on the y-axis in the KOH/K3Fe(CN)6
electrolyte reflects its high charge storage ability. The specific capacitances from
the CV discharge curve at a scan rate of 5 mV s-1 are 402 F g-1, 662 F g-1 and 3875
F g-1 for 0.5 M Na2SO4, 0.5 M KOH and 0.5 M KOH/0.04 M K3Fe(CN)6 electrolytes
respectively. The addition of K3Fe(CN)6 to KOH improve the specific capacitance.
Figure 6.5 CV curve of 0.15 M electrode in voltage range of -0.5 V to 0.5 V at scan rate of 5 mV s-1
in: (a) 0.5 M Na2SO4 electrolyte, (b) 0.5 M KOH electrolyte, (c) 0.04 M K3Fe(CN)6 electrolyte, (e)
0.5 M KOH/0.04 M K3Fe(CN)6 electrolyte.
Figure 6.6 (a-b) displays the CDC profiles of Mn3O4-NiO-Co3O4 in KOH
and 0.5 M KOH/0.04 M K3Fe(CN)6 electrolytes at different current densities in the
-5
-3
-1
1
3
-0.5 -0.3 -0.1 0.1 0.3 0.5
Cu
rren
t D
ensi
ty (
A g
-1)
Potential vs Ag/AgCl (V)
-10
-6
-2
2
6
-0.5 -0.3 -0.1 0.1 0.3 0.5
Cu
rren
t D
ensi
ty (
A g
-1)
Potential vs Ag/AgCl (V)
-25
-15
-5
5
15
-0.5 -0.3 -0.1 0.1 0.3 0.5
Cu
rren
t D
ensi
ty (
A g
-1)
Potential vs Ag/AgCl (V)
-45
-30
-15
0
15
30
-0.5 -0.3 -0.1 0.1 0.3 0.5
Cu
rren
t D
ensi
ty (
A g
-1)
Potential vs Ag/AgCl (V)
(a) (b)
(c) (d)
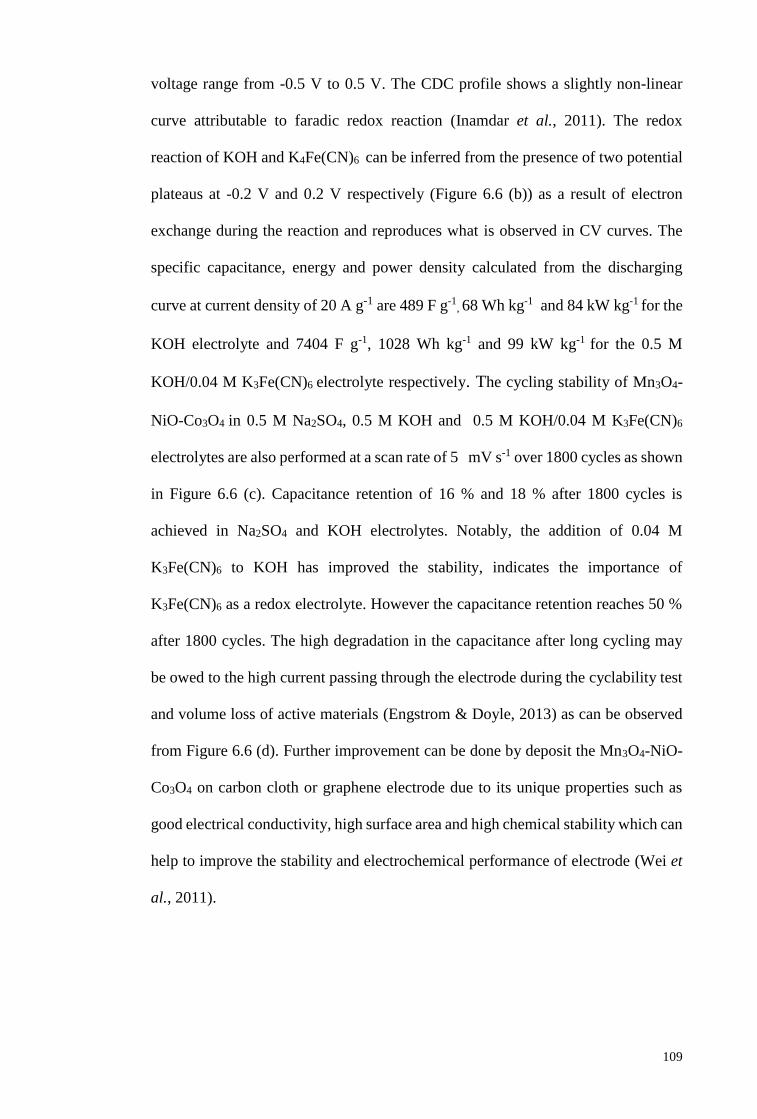
109
voltage range from -0.5 V to 0.5 V. The CDC profile shows a slightly non-linear
curve attributable to faradic redox reaction (Inamdar et al., 2011). The redox
reaction of KOH and K4Fe(CN)6 can be inferred from the presence of two potential
plateaus at -0.2 V and 0.2 V respectively (Figure 6.6 (b)) as a result of electron
exchange during the reaction and reproduces what is observed in CV curves. The
specific capacitance, energy and power density calculated from the discharging
curve at current density of 20 A g-1 are 489 F g-1, 68 Wh kg-1 and 84 kW kg-1 for the
KOH electrolyte and 7404 F g-1, 1028 Wh kg-1 and 99 kW kg-1 for the 0.5 M
KOH/0.04 M K3Fe(CN)6 electrolyte respectively. The cycling stability of Mn3O4-
NiO-Co3O4 in 0.5 M Na2SO4, 0.5 M KOH and 0.5 M KOH/0.04 M K3Fe(CN)6
electrolytes are also performed at a scan rate of 5 mV s-1 over 1800 cycles as shown
in Figure 6.6 (c). Capacitance retention of 16 % and 18 % after 1800 cycles is
achieved in Na2SO4 and KOH electrolytes. Notably, the addition of 0.04 M
K3Fe(CN)6 to KOH has improved the stability, indicates the importance of
K3Fe(CN)6 as a redox electrolyte. However the capacitance retention reaches 50 %
after 1800 cycles. The high degradation in the capacitance after long cycling may
be owed to the high current passing through the electrode during the cyclability test
and volume loss of active materials (Engstrom & Doyle, 2013) as can be observed
from Figure 6.6 (d). Further improvement can be done by deposit the Mn3O4-NiO-
Co3O4 on carbon cloth or graphene electrode due to its unique properties such as
good electrical conductivity, high surface area and high chemical stability which can
help to improve the stability and electrochemical performance of electrode (Wei et
al., 2011).
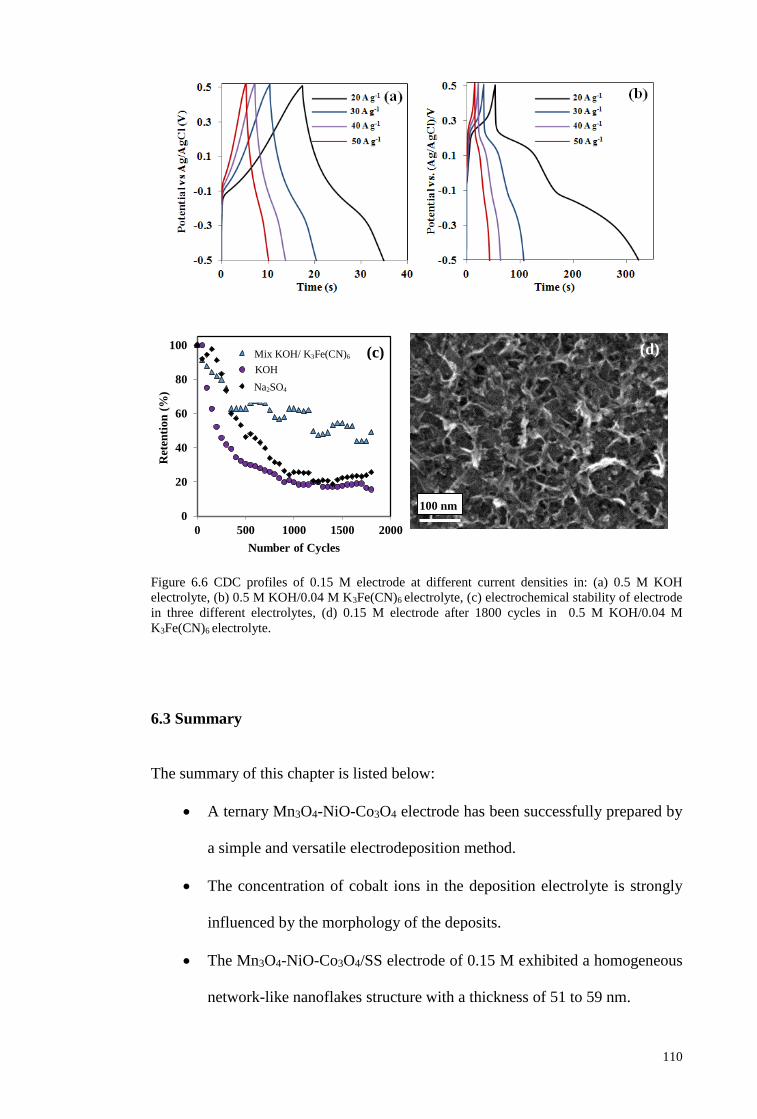
110
Figure 6.6 CDC profiles of 0.15 M electrode at different current densities in: (a) 0.5 M KOH
electrolyte, (b) 0.5 M KOH/0.04 M K3Fe(CN)6 electrolyte, (c) electrochemical stability of electrode
in three different electrolytes, (d) 0.15 M electrode after 1800 cycles in 0.5 M KOH/0.04 M
K3Fe(CN)6 electrolyte.
6.3 Summary
The summary of this chapter is listed below:
A ternary Mn3O4-NiO-Co3O4 electrode has been successfully prepared by
a simple and versatile electrodeposition method.
The concentration of cobalt ions in the deposition electrolyte is strongly
influenced by the morphology of the deposits.
The Mn3O4-NiO-Co3O4/SS electrode of 0.15 M exhibited a homogeneous
network-like nanoflakes structure with a thickness of 51 to 59 nm.
0
20
40
60
80
100
0 500 1000 1500 2000
Ret
enti
on
(%
)
Number of Cycles
Mix KOH with K3FeCN6
KOH
Na2SO4
Mix KOH/ K3Fe(CN)6
KOH
Na2SO4
(c) (d)
100 nm
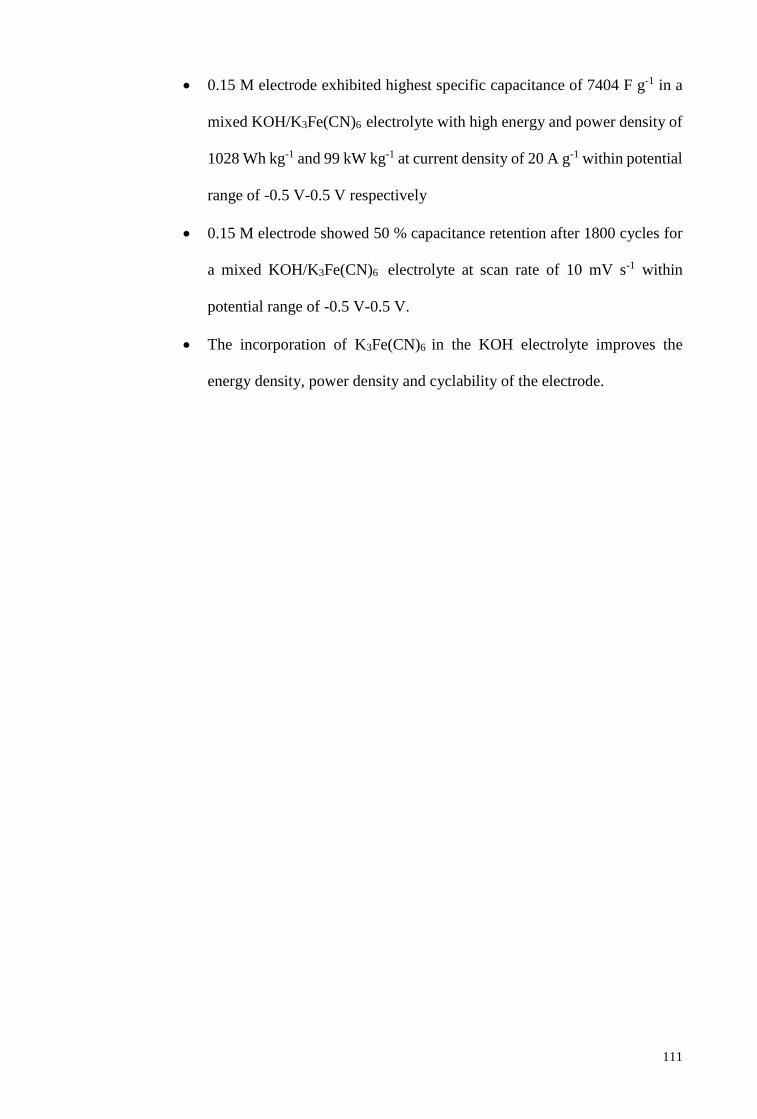
111
0.15 M electrode exhibited highest specific capacitance of 7404 F g-1 in a
mixed KOH/K3Fe(CN)6 electrolyte with high energy and power density of
1028 Wh kg-1 and 99 kW kg-1 at current density of 20 A g-1 within potential
range of -0.5 V-0.5 V respectively
0.15 M electrode showed 50 % capacitance retention after 1800 cycles for
a mixed KOH/K3Fe(CN)6 electrolyte at scan rate of 10 mV s-1 within
potential range of -0.5 V-0.5 V.
The incorporation of K3Fe(CN)6 in the KOH electrolyte improves the
energy density, power density and cyclability of the electrode.
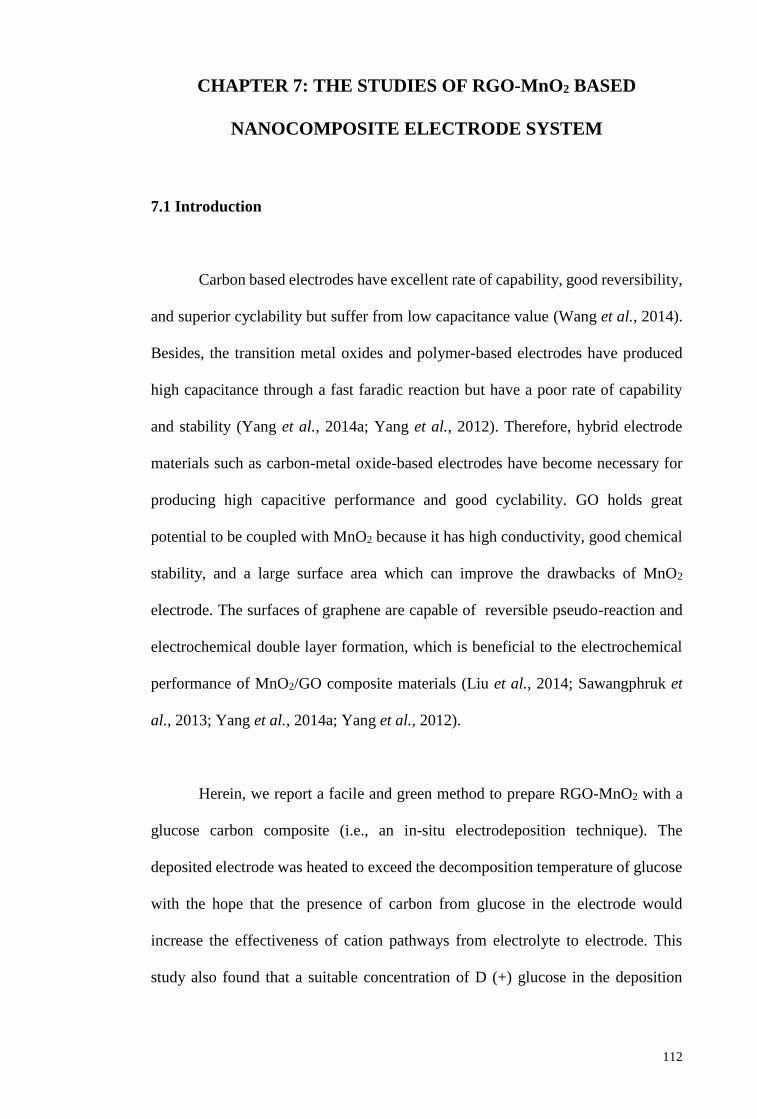
112
CHAPTER 7: THE STUDIES OF RGO-MnO2 BASED
NANOCOMPOSITE ELECTRODE SYSTEM
7.1 Introduction
Carbon based electrodes have excellent rate of capability, good reversibility,
and superior cyclability but suffer from low capacitance value (Wang et al., 2014).
Besides, the transition metal oxides and polymer-based electrodes have produced
high capacitance through a fast faradic reaction but have a poor rate of capability
and stability (Yang et al., 2014a; Yang et al., 2012). Therefore, hybrid electrode
materials such as carbon-metal oxide-based electrodes have become necessary for
producing high capacitive performance and good cyclability. GO holds great
potential to be coupled with MnO2 because it has high conductivity, good chemical
stability, and a large surface area which can improve the drawbacks of MnO2
electrode. The surfaces of graphene are capable of reversible pseudo-reaction and
electrochemical double layer formation, which is beneficial to the electrochemical
performance of MnO2/GO composite materials (Liu et al., 2014; Sawangphruk et
al., 2013; Yang et al., 2014a; Yang et al., 2012).
Herein, we report a facile and green method to prepare RGO-MnO2 with a
glucose carbon composite (i.e., an in-situ electrodeposition technique). The
deposited electrode was heated to exceed the decomposition temperature of glucose
with the hope that the presence of carbon from glucose in the electrode would
increase the effectiveness of cation pathways from electrolyte to electrode. This
study also found that a suitable concentration of D (+) glucose in the deposition
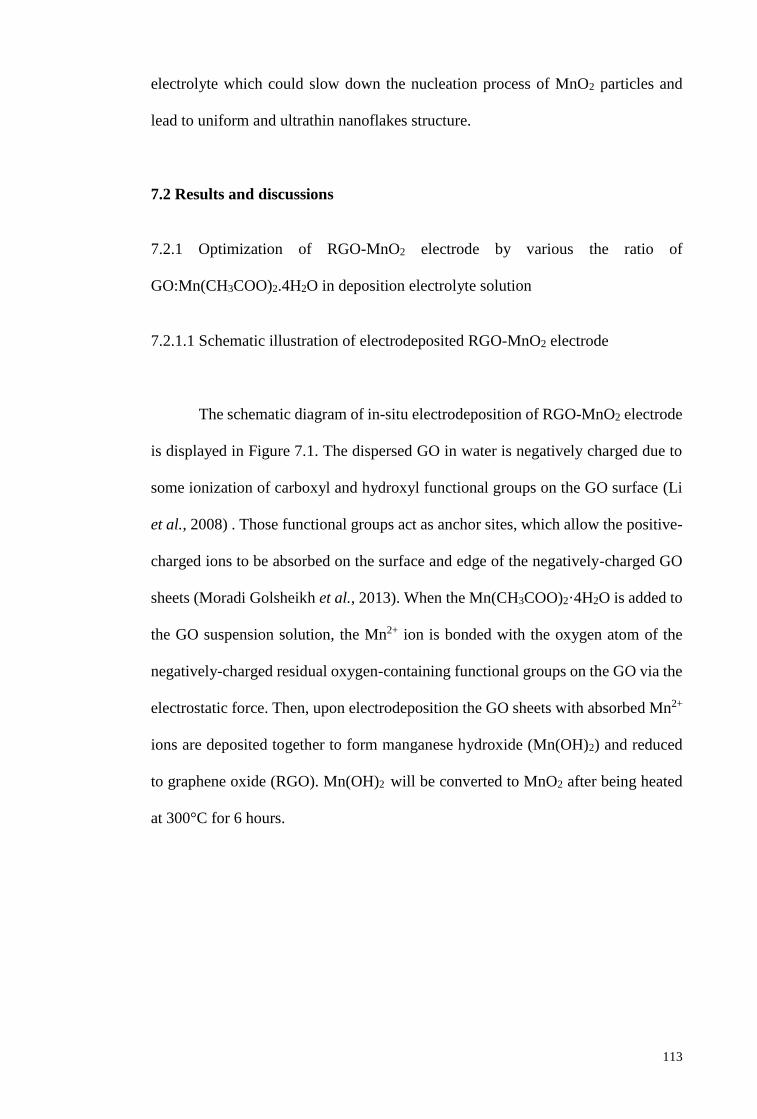
113
electrolyte which could slow down the nucleation process of MnO2 particles and
lead to uniform and ultrathin nanoflakes structure.
7.2 Results and discussions
7.2.1 Optimization of RGO-MnO2 electrode by various the ratio of
GO:Mn(CH3COO)2.4H2O in deposition electrolyte solution
7.2.1.1 Schematic illustration of electrodeposited RGO-MnO2 electrode
The schematic diagram of in-situ electrodeposition of RGO-MnO2 electrode
is displayed in Figure 7.1. The dispersed GO in water is negatively charged due to
some ionization of carboxyl and hydroxyl functional groups on the GO surface (Li
et al., 2008) . Those functional groups act as anchor sites, which allow the positive-
charged ions to be absorbed on the surface and edge of the negatively-charged GO
sheets (Moradi Golsheikh et al., 2013). When the Mn(CH3COO)2·4H2O is added to
the GO suspension solution, the Mn2+ ion is bonded with the oxygen atom of the
negatively-charged residual oxygen-containing functional groups on the GO via the
electrostatic force. Then, upon electrodeposition the GO sheets with absorbed Mn2+
ions are deposited together to form manganese hydroxide (Mn(OH)2) and reduced
to graphene oxide (RGO). Mn(OH)2 will be converted to MnO2 after being heated
at 300°C for 6 hours.
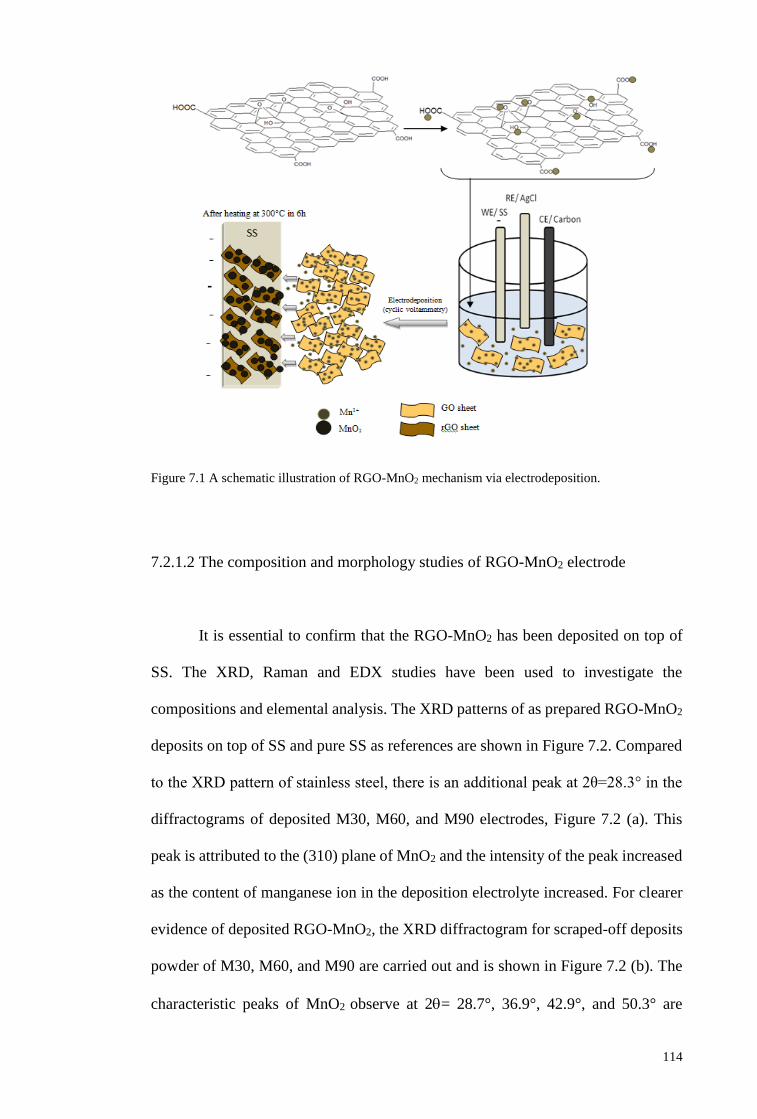
114
Figure 7.1 A schematic illustration of RGO-MnO2 mechanism via electrodeposition.
7.2.1.2 The composition and morphology studies of RGO-MnO2 electrode
It is essential to confirm that the RGO-MnO2 has been deposited on top of
SS. The XRD, Raman and EDX studies have been used to investigate the
compositions and elemental analysis. The XRD patterns of as prepared RGO-MnO2
deposits on top of SS and pure SS as references are shown in Figure 7.2. Compared
to the XRD pattern of stainless steel, there is an additional peak at 2θ=28.3° in the
diffractograms of deposited M30, M60, and M90 electrodes, Figure 7.2 (a). This
peak is attributed to the (310) plane of MnO2 and the intensity of the peak increased
as the content of manganese ion in the deposition electrolyte increased. For clearer
evidence of deposited RGO-MnO2, the XRD diffractogram for scraped-off deposits
powder of M30, M60, and M90 are carried out and is shown in Figure 7.2 (b). The
characteristic peaks of MnO2 observe at 2= 28.7°, 36.9°, 42.9°, and 50.3° are
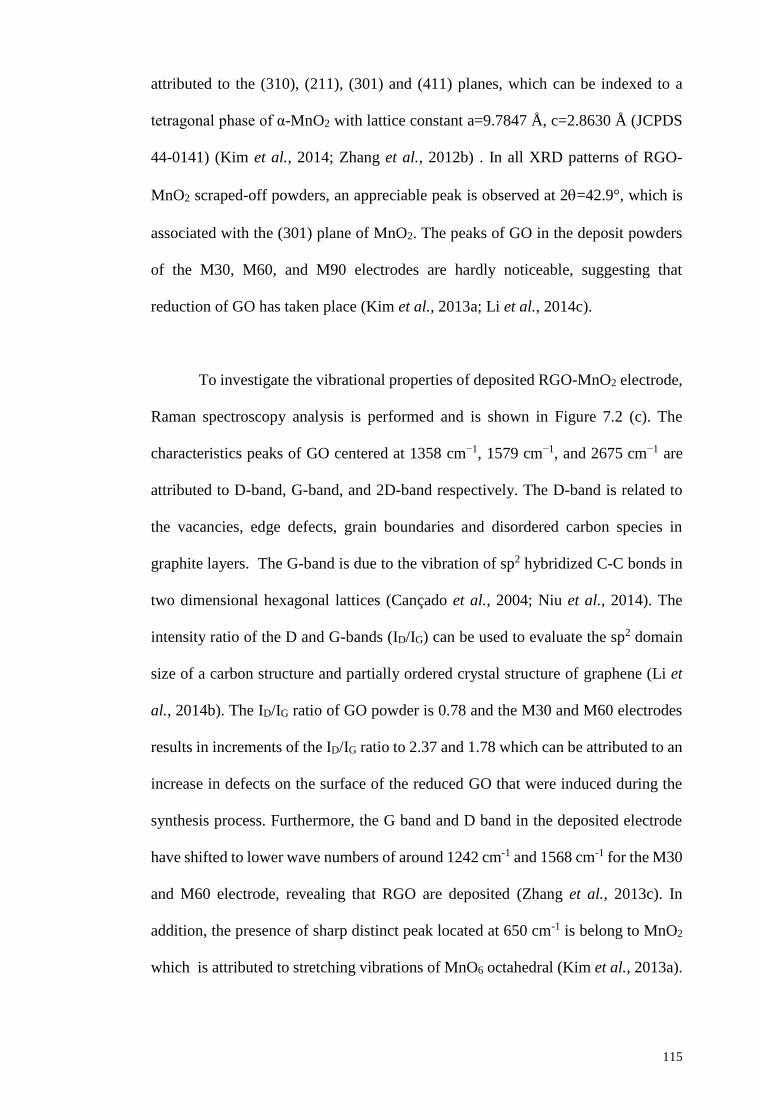
115
attributed to the (310), (211), (301) and (411) planes, which can be indexed to a
tetragonal phase of α-MnO2 with lattice constant a=9.7847 Å, c=2.8630 Å (JCPDS
44-0141) (Kim et al., 2014; Zhang et al., 2012b) . In all XRD patterns of RGO-
MnO2 scraped-off powders, an appreciable peak is observed at 2=42.9°, which is
associated with the (301) plane of MnO2. The peaks of GO in the deposit powders
of the M30, M60, and M90 electrodes are hardly noticeable, suggesting that
reduction of GO has taken place (Kim et al., 2013a; Li et al., 2014c).
To investigate the vibrational properties of deposited RGO-MnO2 electrode,
Raman spectroscopy analysis is performed and is shown in Figure 7.2 (c). The
characteristics peaks of GO centered at 1358 cm−1, 1579 cm−1, and 2675 cm−1 are
attributed to D-band, G-band, and 2D-band respectively. The D-band is related to
the vacancies, edge defects, grain boundaries and disordered carbon species in
graphite layers. The G-band is due to the vibration of sp2 hybridized C-C bonds in
two dimensional hexagonal lattices (Cançado et al., 2004; Niu et al., 2014). The
intensity ratio of the D and G-bands (ID/IG) can be used to evaluate the sp2 domain
size of a carbon structure and partially ordered crystal structure of graphene (Li et
al., 2014b). The ID/IG ratio of GO powder is 0.78 and the M30 and M60 electrodes
results in increments of the ID/IG ratio to 2.37 and 1.78 which can be attributed to an
increase in defects on the surface of the reduced GO that were induced during the
synthesis process. Furthermore, the G band and D band in the deposited electrode
have shifted to lower wave numbers of around 1242 cm-1 and 1568 cm-1 for the M30
and M60 electrode, revealing that RGO are deposited (Zhang et al., 2013c). In
addition, the presence of sharp distinct peak located at 650 cm-1 is belong to MnO2
which is attributed to stretching vibrations of MnO6 octahedral (Kim et al., 2013a).
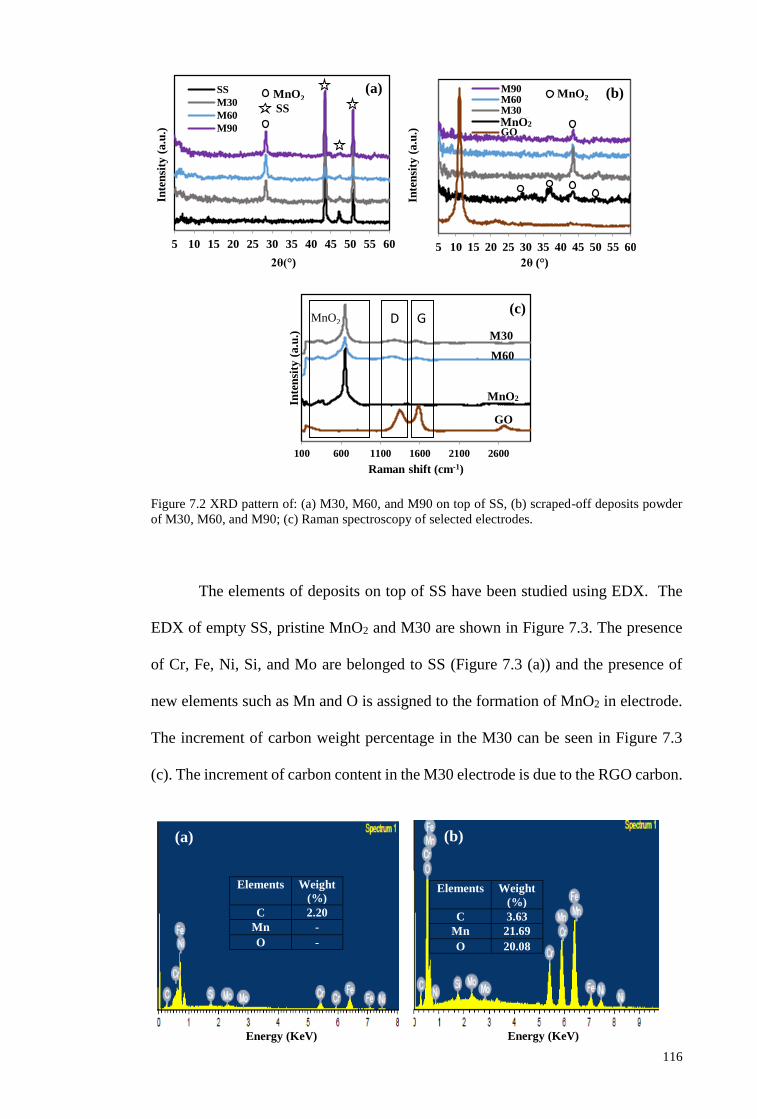
116
Figure 7.2 XRD pattern of: (a) M30, M60, and M90 on top of SS, (b) scraped-off deposits powder
of M30, M60, and M90; (c) Raman spectroscopy of selected electrodes.
The elements of deposits on top of SS have been studied using EDX. The
EDX of empty SS, pristine MnO2 and M30 are shown in Figure 7.3. The presence
of Cr, Fe, Ni, Si, and Mo are belonged to SS (Figure 7.3 (a)) and the presence of
new elements such as Mn and O is assigned to the formation of MnO2 in electrode.
The increment of carbon weight percentage in the M30 can be seen in Figure 7.3
(c). The increment of carbon content in the M30 electrode is due to the RGO carbon.
5 10 15 20 25 30 35 40 45 50 55 60
Inte
nsi
ty (
a.u
.)
2θ(°)
SS
M30
M60
M90
MnO2
SS
(a)
-10
40
90
140
190
-5
0
5
10
15
20
25
30
35
5 10 15 20 25 30 35 40 45 50 55 60
Inte
nsi
ty (
a.u
.)
2θ (°)
M90M60M30MnO2GO
MnO2 (b)
100 600 1100 1600 2100 2600
Inte
nsi
ty (
a.u
.)
Raman shift (cm-1)
MnO2
GO
M30
(c)
Elements Weight
(%)
C 3.63
Mn 21.69
O 20.08
(a) (b)
Elements Weight
(%)
C 2.20
Mn -
O -
Energy (KeV) Energy (KeV)
G D
MnO2
MnO2
M60
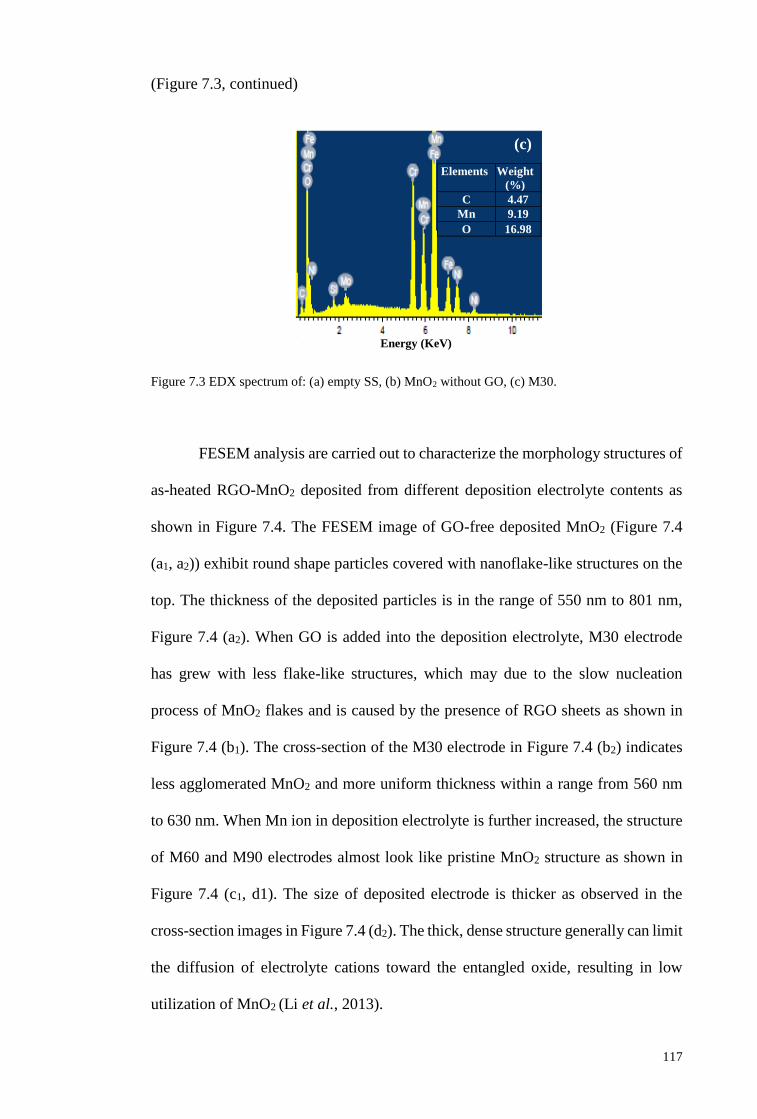
117
(Figure 7.3, continued)
Figure 7.3 EDX spectrum of: (a) empty SS, (b) MnO2 without GO, (c) M30.
FESEM analysis are carried out to characterize the morphology structures of
as-heated RGO-MnO2 deposited from different deposition electrolyte contents as
shown in Figure 7.4. The FESEM image of GO-free deposited MnO2 (Figure 7.4
(a1, a2)) exhibit round shape particles covered with nanoflake-like structures on the
top. The thickness of the deposited particles is in the range of 550 nm to 801 nm,
Figure 7.4 (a2). When GO is added into the deposition electrolyte, M30 electrode
has grew with less flake-like structures, which may due to the slow nucleation
process of MnO2 flakes and is caused by the presence of RGO sheets as shown in
Figure 7.4 (b1). The cross-section of the M30 electrode in Figure 7.4 (b2) indicates
less agglomerated MnO2 and more uniform thickness within a range from 560 nm
to 630 nm. When Mn ion in deposition electrolyte is further increased, the structure
of M60 and M90 electrodes almost look like pristine MnO2 structure as shown in
Figure 7.4 (c1, d1). The size of deposited electrode is thicker as observed in the
cross-section images in Figure 7.4 (d2). The thick, dense structure generally can limit
the diffusion of electrolyte cations toward the entangled oxide, resulting in low
utilization of MnO2 (Li et al., 2013).
Elements Weight
(%)
C 4.47
Mn 9.19
O 16.98
(c) (c)
Energy (KeV)
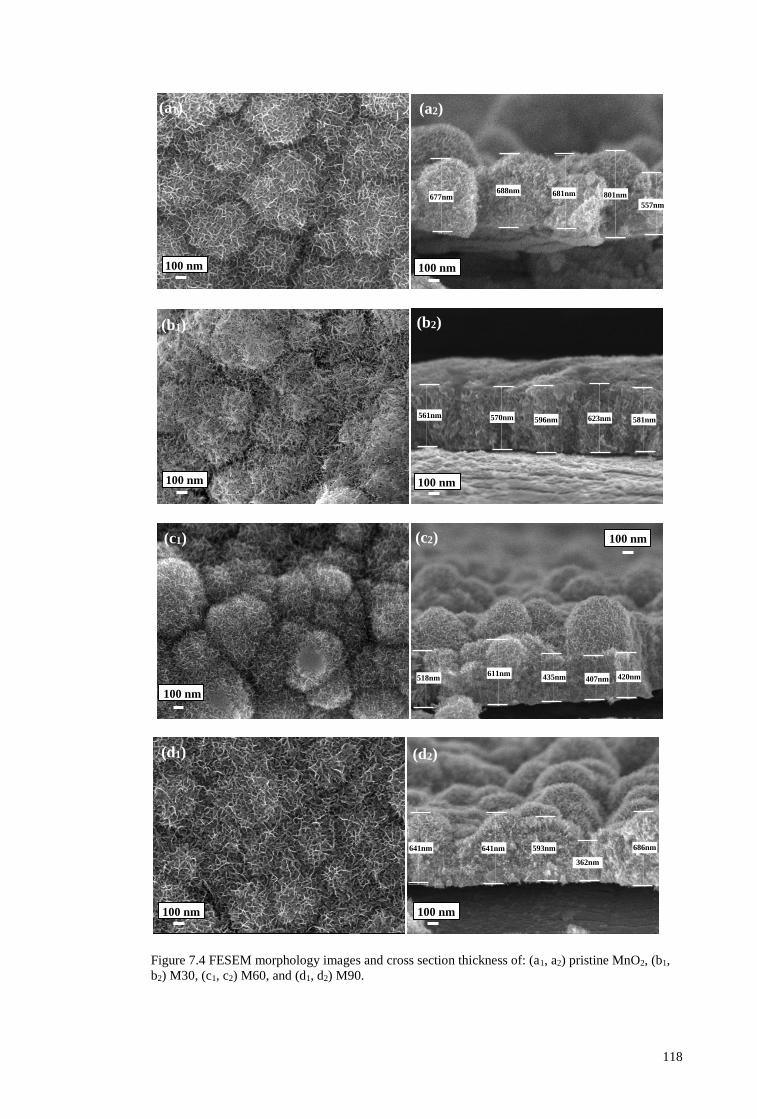
118
Figure 7.4 FESEM morphology images and cross section thickness of: (a1, a2) pristine MnO2, (b1,
b2) M30, (c1, c2) M60, and (d1, d2) M90.
(a1) (a2)
(b1) (b2)
(c1)
(d2) (d1)
(c2)
100 nm 100 nm
100 nm
100 nm 100 nm
100 nm
100 nm
100 nm
677nm
688nm 681nm
801nm
557nm
561nm
570nm 596nm 623nm 581nm
518nm
611nm 435nm
407nm
420nm
641nm 641nm 593nm
362nm
686nm
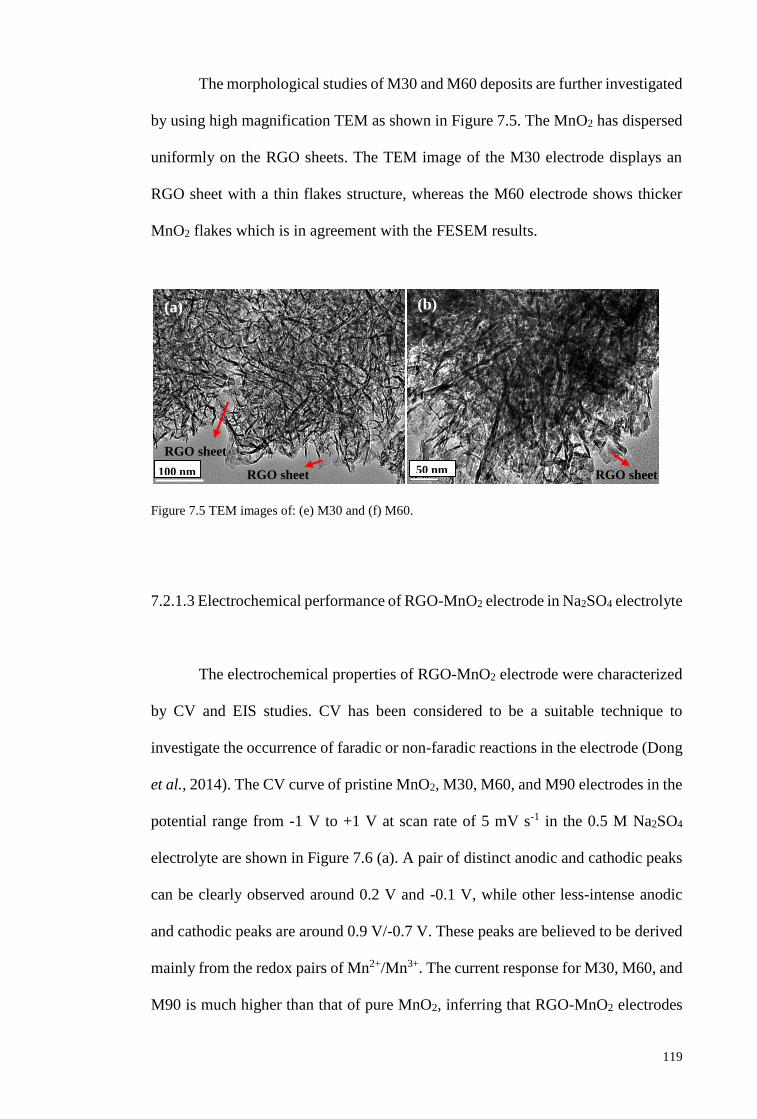
119
The morphological studies of M30 and M60 deposits are further investigated
by using high magnification TEM as shown in Figure 7.5. The MnO2 has dispersed
uniformly on the RGO sheets. The TEM image of the M30 electrode displays an
RGO sheet with a thin flakes structure, whereas the M60 electrode shows thicker
MnO2 flakes which is in agreement with the FESEM results.
Figure 7.5 TEM images of: (e) M30 and (f) M60.
7.2.1.3 Electrochemical performance of RGO-MnO2 electrode in Na2SO4 electrolyte
The electrochemical properties of RGO-MnO2 electrode were characterized
by CV and EIS studies. CV has been considered to be a suitable technique to
investigate the occurrence of faradic or non-faradic reactions in the electrode (Dong
et al., 2014). The CV curve of pristine MnO2, M30, M60, and M90 electrodes in the
potential range from -1 V to +1 V at scan rate of 5 mV s-1 in the 0.5 M Na2SO4
electrolyte are shown in Figure 7.6 (a). A pair of distinct anodic and cathodic peaks
can be clearly observed around 0.2 V and -0.1 V, while other less-intense anodic
and cathodic peaks are around 0.9 V/-0.7 V. These peaks are believed to be derived
mainly from the redox pairs of Mn2+/Mn3+. The current response for M30, M60, and
M90 is much higher than that of pure MnO2, inferring that RGO-MnO2 electrodes
RGO sheet
RGO sheet RGO sheet
(a) (b)
50 nm 100 nm
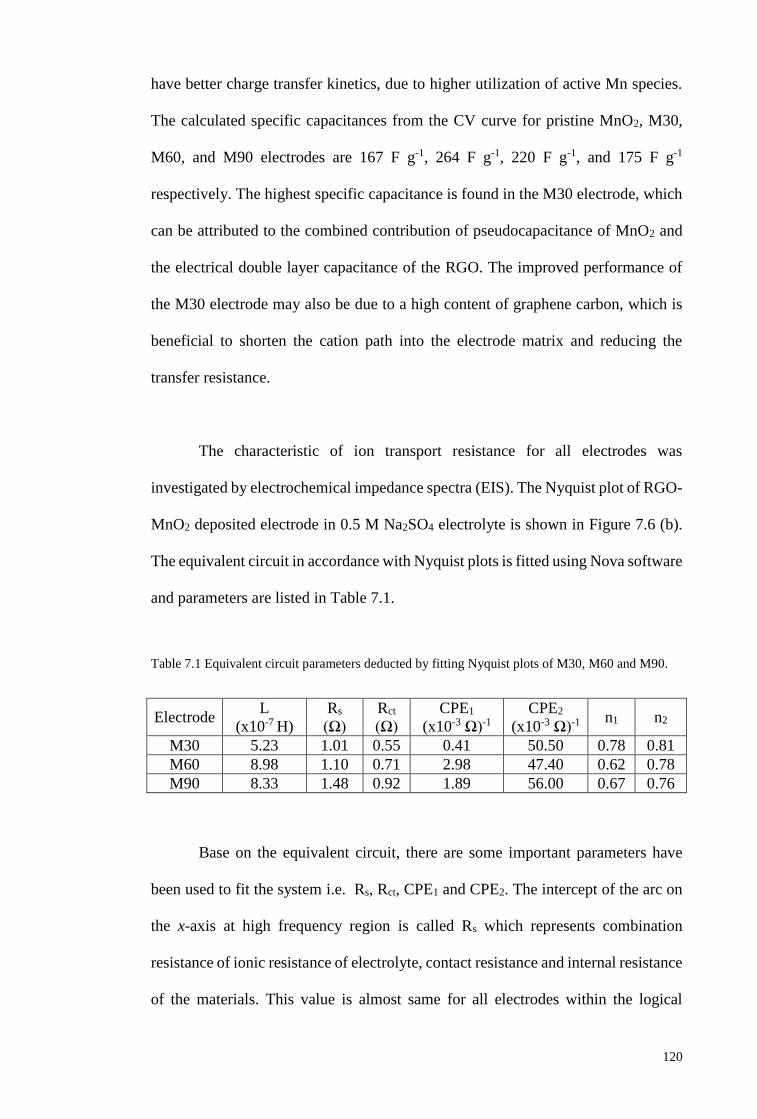
120
have better charge transfer kinetics, due to higher utilization of active Mn species.
The calculated specific capacitances from the CV curve for pristine MnO2, M30,
M60, and M90 electrodes are 167 F g-1, 264 F g-1, 220 F g-1, and 175 F g-1
respectively. The highest specific capacitance is found in the M30 electrode, which
can be attributed to the combined contribution of pseudocapacitance of MnO2 and
the electrical double layer capacitance of the RGO. The improved performance of
the M30 electrode may also be due to a high content of graphene carbon, which is
beneficial to shorten the cation path into the electrode matrix and reducing the
transfer resistance.
The characteristic of ion transport resistance for all electrodes was
investigated by electrochemical impedance spectra (EIS). The Nyquist plot of RGO-
MnO2 deposited electrode in 0.5 M Na2SO4 electrolyte is shown in Figure 7.6 (b).
The equivalent circuit in accordance with Nyquist plots is fitted using Nova software
and parameters are listed in Table 7.1.
Table 7.1 Equivalent circuit parameters deducted by fitting Nyquist plots of M30, M60 and M90.
Base on the equivalent circuit, there are some important parameters have
been used to fit the system i.e. Rs, Rct, CPE1 and CPE2. The intercept of the arc on
the x-axis at high frequency region is called Rs which represents combination
resistance of ionic resistance of electrolyte, contact resistance and internal resistance
of the materials. This value is almost same for all electrodes within the logical
Electrode L
(x10-7 H)
Rs
(Ω)
Rct
(Ω)
CPE1
(x10-3 Ω)-1
CPE2
(x10-3 Ω)-1 n1 n2
M30 5.23 1.01 0.55 0.41 50.50 0.78 0.81
M60 8.98 1.10 0.71 2.98 47.40 0.62 0.78
M90 8.33 1.48 0.92 1.89 56.00 0.67 0.76
121
magnitude error. The semicircle region in high frequency region corresponds to
charge transfer resistance, Rct (Chen et al., 2013). The two constant phase elements
of CPE1 and CPE2 in this system are used to replace the double layer capacity and
Warburg impedance resistance for semi-infinite linear diffusion respectively (Yang
et al., 2014b). M30 electrode has lowest series resistance and transfer resistance
among all RGO-MnO2 electrodes, indicating M30 has a better electrochemical
performance and lead to high specific capacitance.
Figure 7.6 (a) CV curve in 0.5 M Na2SO4 electrolyte at a scan rate of 5 mV s-1 of : pristine MnO2,
M30, M60, and M90, and (b) Nyquist plot of : (c) M30, M60, and M90.
-3.5
-1.5
0.5
2.5
4.5
-1 -0.5 0 0.5 1
Cu
rren
t D
ensi
ty (
Ag
-1)
Potential Vs Ag/AgCl (V)
MnO2
M30
M60
M90
0
1
2
3
0 1 2 3
-Z"
(Ω
)
Z' (Ω)
M30
M60
M90
MnO2 (a)
(b)
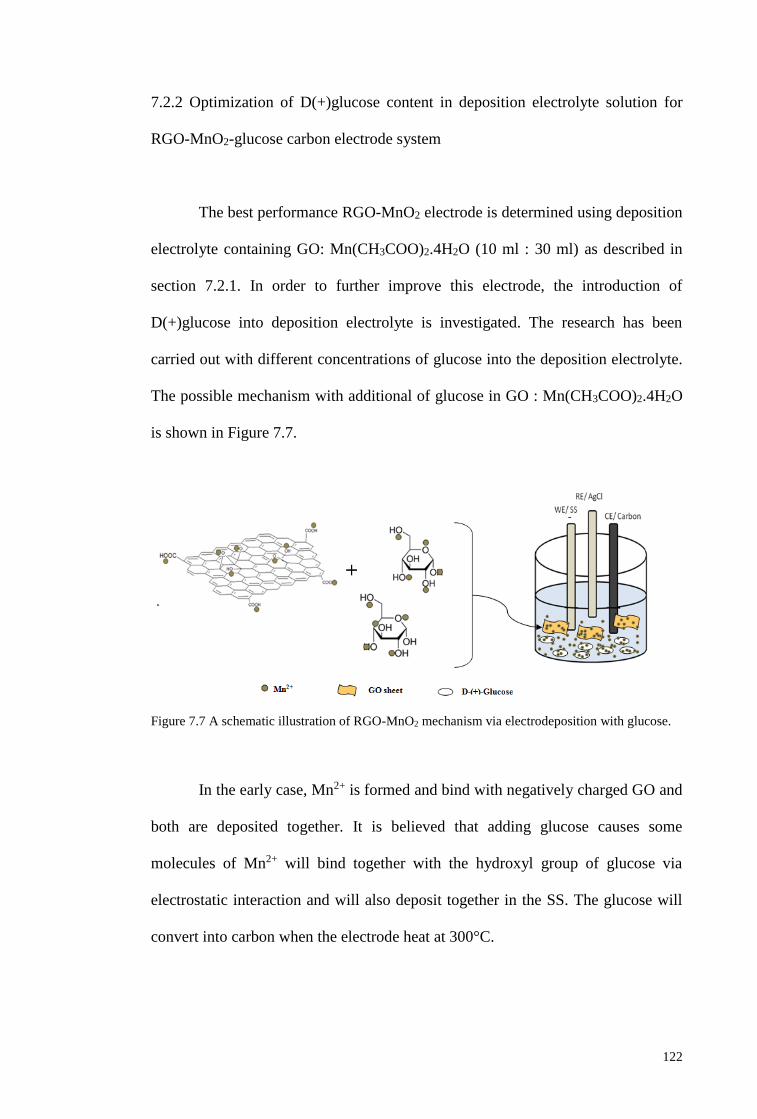
122
7.2.2 Optimization of D(+)glucose content in deposition electrolyte solution for
RGO-MnO2-glucose carbon electrode system
The best performance RGO-MnO2 electrode is determined using deposition
electrolyte containing GO: Mn(CH3COO)2.4H2O (10 ml : 30 ml) as described in
section 7.2.1. In order to further improve this electrode, the introduction of
D(+)glucose into deposition electrolyte is investigated. The research has been
carried out with different concentrations of glucose into the deposition electrolyte.
The possible mechanism with additional of glucose in GO : Mn(CH3COO)2.4H2O
is shown in Figure 7.7.
Figure 7.7 A schematic illustration of RGO-MnO2 mechanism via electrodeposition with glucose.
In the early case, Mn2+ is formed and bind with negatively charged GO and
both are deposited together. It is believed that adding glucose causes some
molecules of Mn2+ will bind together with the hydroxyl group of glucose via
electrostatic interaction and will also deposit together in the SS. The glucose will
convert into carbon when the electrode heat at 300°C.
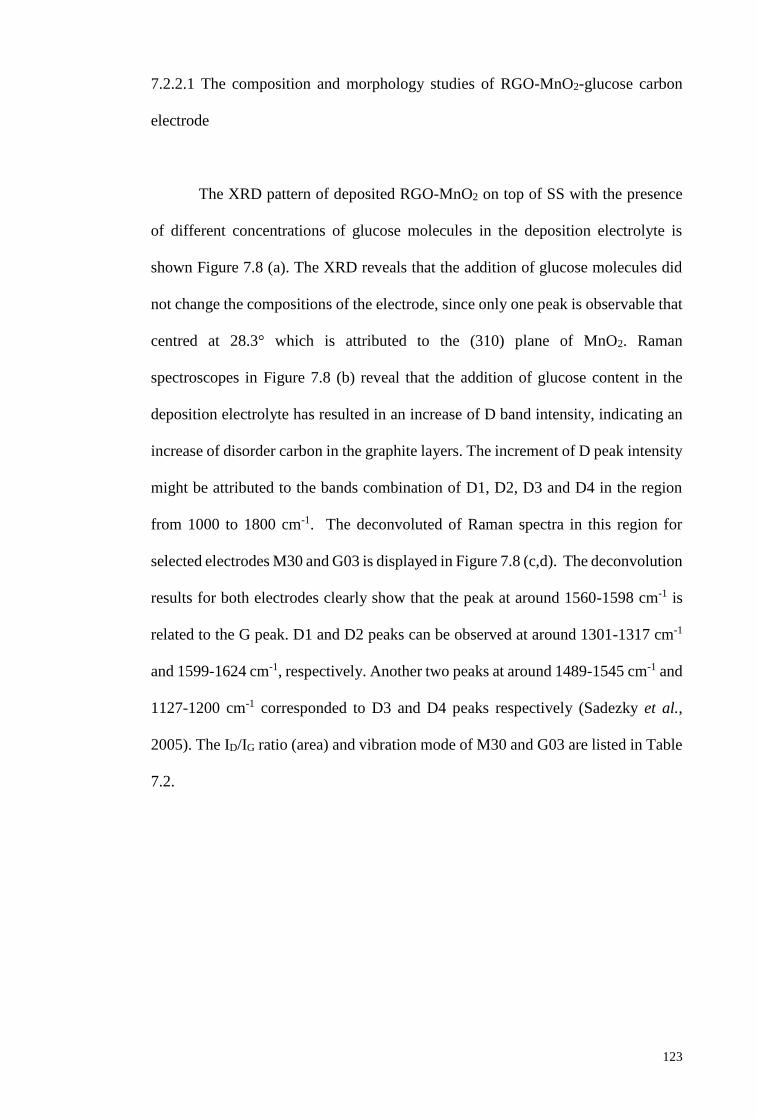
123
7.2.2.1 The composition and morphology studies of RGO-MnO2-glucose carbon
electrode
The XRD pattern of deposited RGO-MnO2 on top of SS with the presence
of different concentrations of glucose molecules in the deposition electrolyte is
shown Figure 7.8 (a). The XRD reveals that the addition of glucose molecules did
not change the compositions of the electrode, since only one peak is observable that
centred at 28.3° which is attributed to the (310) plane of MnO2. Raman
spectroscopes in Figure 7.8 (b) reveal that the addition of glucose content in the
deposition electrolyte has resulted in an increase of D band intensity, indicating an
increase of disorder carbon in the graphite layers. The increment of D peak intensity
might be attributed to the bands combination of D1, D2, D3 and D4 in the region
from 1000 to 1800 cm-1. The deconvoluted of Raman spectra in this region for
selected electrodes M30 and G03 is displayed in Figure 7.8 (c,d). The deconvolution
results for both electrodes clearly show that the peak at around 1560-1598 cm-1 is
related to the G peak. D1 and D2 peaks can be observed at around 1301-1317 cm-1
and 1599-1624 cm-1, respectively. Another two peaks at around 1489-1545 cm-1 and
1127-1200 cm-1 corresponded to D3 and D4 peaks respectively (Sadezky et al.,
2005). The ID/IG ratio (area) and vibration mode of M30 and G03 are listed in Table
7.2.
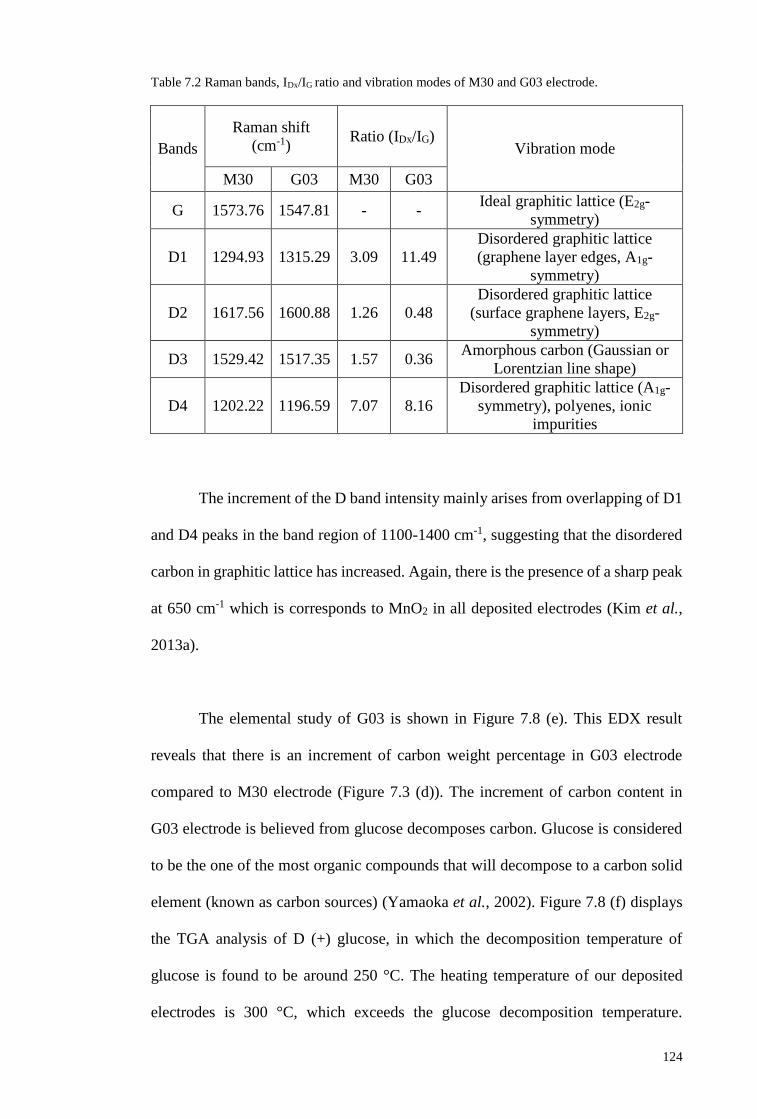
124
Table 7.2 Raman bands, IDx/IG ratio and vibration modes of M30 and G03 electrode.
Bands
Raman shift
(cm-1) Ratio (IDx/IG)
Vibration mode
M30 G03 M30 G03
G 1573.76 1547.81 - - Ideal graphitic lattice (E2g-
symmetry)
D1 1294.93 1315.29 3.09 11.49
Disordered graphitic lattice
(graphene layer edges, A1g-
symmetry)
D2 1617.56 1600.88 1.26 0.48
Disordered graphitic lattice
(surface graphene layers, E2g-
symmetry)
D3 1529.42 1517.35 1.57 0.36 Amorphous carbon (Gaussian or
Lorentzian line shape)
D4 1202.22 1196.59 7.07 8.16
Disordered graphitic lattice (A1g-
symmetry), polyenes, ionic
impurities
The increment of the D band intensity mainly arises from overlapping of D1
and D4 peaks in the band region of 1100-1400 cm-1, suggesting that the disordered
carbon in graphitic lattice has increased. Again, there is the presence of a sharp peak
at 650 cm-1 which is corresponds to MnO2 in all deposited electrodes (Kim et al.,
2013a).
The elemental study of G03 is shown in Figure 7.8 (e). This EDX result
reveals that there is an increment of carbon weight percentage in G03 electrode
compared to M30 electrode (Figure 7.3 (d)). The increment of carbon content in
G03 electrode is believed from glucose decomposes carbon. Glucose is considered
to be the one of the most organic compounds that will decompose to a carbon solid
element (known as carbon sources) (Yamaoka et al., 2002). Figure 7.8 (f) displays
the TGA analysis of D (+) glucose, in which the decomposition temperature of
glucose is found to be around 250 °C. The heating temperature of our deposited
electrodes is 300 °C, which exceeds the glucose decomposition temperature.
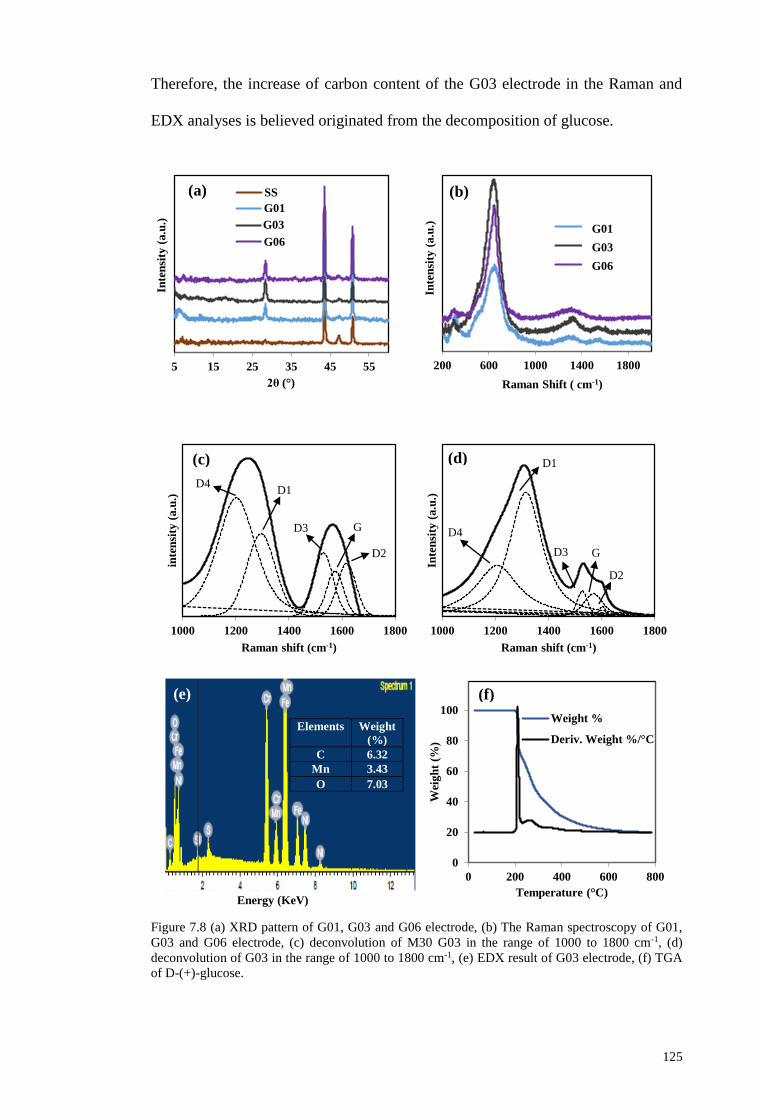
125
Therefore, the increase of carbon content of the G03 electrode in the Raman and
EDX analyses is believed originated from the decomposition of glucose.
Figure 7.8 (a) XRD pattern of G01, G03 and G06 electrode, (b) The Raman spectroscopy of G01,
G03 and G06 electrode, (c) deconvolution of M30 G03 in the range of 1000 to 1800 cm-1, (d)
deconvolution of G03 in the range of 1000 to 1800 cm-1, (e) EDX result of G03 electrode, (f) TGA
of D-(+)-glucose.
5 15 25 35 45 55
Inte
nsi
ty (
a.u
.)
2θ (°)
SS
0.01M
0.03M
0.06M
(a)
200 600 1000 1400 1800
Inte
nsi
ty (
a.u
.)
Raman Shift ( cm-1)
0.01M
0.03M
0.06M
G01
G03
G06
(b)
1000 1200 1400 1600 1800
inte
nsi
ty (
a.u
.)
Raman shift (cm-1)
1000 1200 1400 1600 1800
Inte
nsi
ty (
a.u
.)
Raman shift (cm-1)
-1
0
1
2
3
4
5
0
20
40
60
80
100
0 200 400 600 800
Wei
gh
t (%
)
Temperature (°C)
Weight %
Deriv. Weight %/°CElements Weight
(%)
C 6.32
Mn 3.43
O 7.03
(e) (f)
G01
G03
G06
Energy (KeV)
(c) (d)
D4 D1
G
D3
D2
D4
D1
D3
G
D2
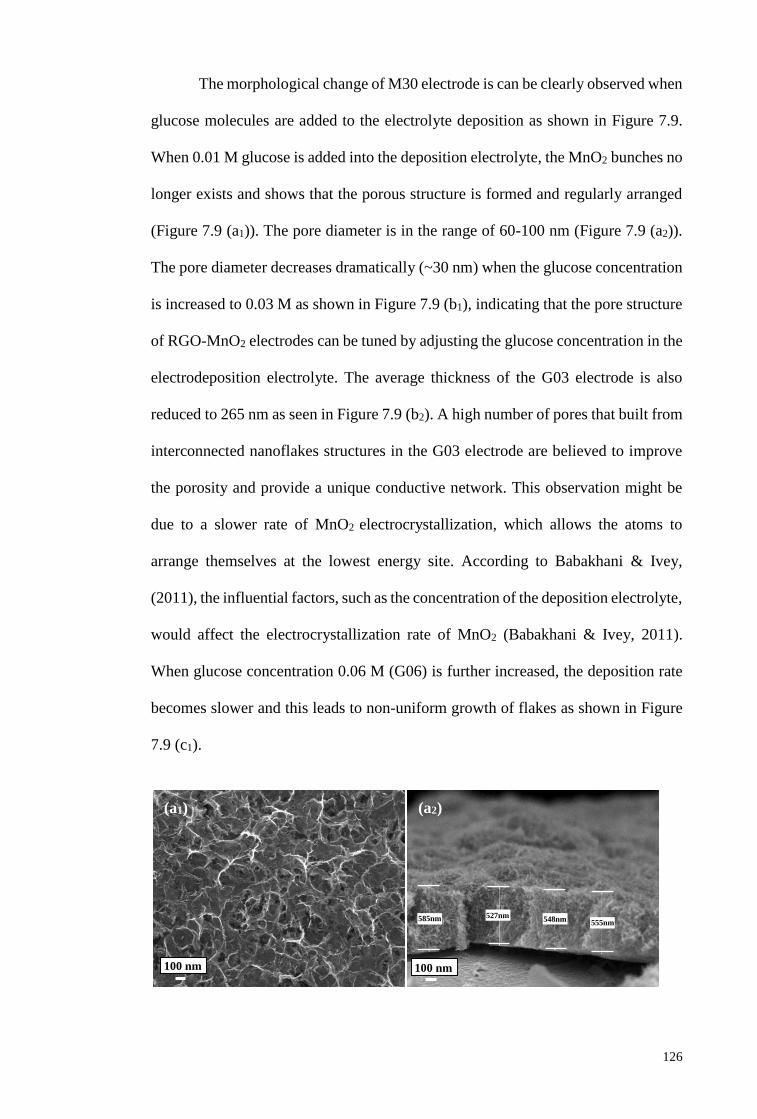
126
The morphological change of M30 electrode is can be clearly observed when
glucose molecules are added to the electrolyte deposition as shown in Figure 7.9.
When 0.01 M glucose is added into the deposition electrolyte, the MnO2 bunches no
longer exists and shows that the porous structure is formed and regularly arranged
(Figure 7.9 (a1)). The pore diameter is in the range of 60-100 nm (Figure 7.9 (a2)).
The pore diameter decreases dramatically (~30 nm) when the glucose concentration
is increased to 0.03 M as shown in Figure 7.9 (b1), indicating that the pore structure
of RGO-MnO2 electrodes can be tuned by adjusting the glucose concentration in the
electrodeposition electrolyte. The average thickness of the G03 electrode is also
reduced to 265 nm as seen in Figure 7.9 (b2). A high number of pores that built from
interconnected nanoflakes structures in the G03 electrode are believed to improve
the porosity and provide a unique conductive network. This observation might be
due to a slower rate of MnO2 electrocrystallization, which allows the atoms to
arrange themselves at the lowest energy site. According to Babakhani & Ivey,
(2011), the influential factors, such as the concentration of the deposition electrolyte,
would affect the electrocrystallization rate of MnO2 (Babakhani & Ivey, 2011).
When glucose concentration 0.06 M (G06) is further increased, the deposition rate
becomes slower and this leads to non-uniform growth of flakes as shown in Figure
7.9 (c1).
(a1) (a2)
100 nm 100 nm
585nm
527nm 548nm 555nm
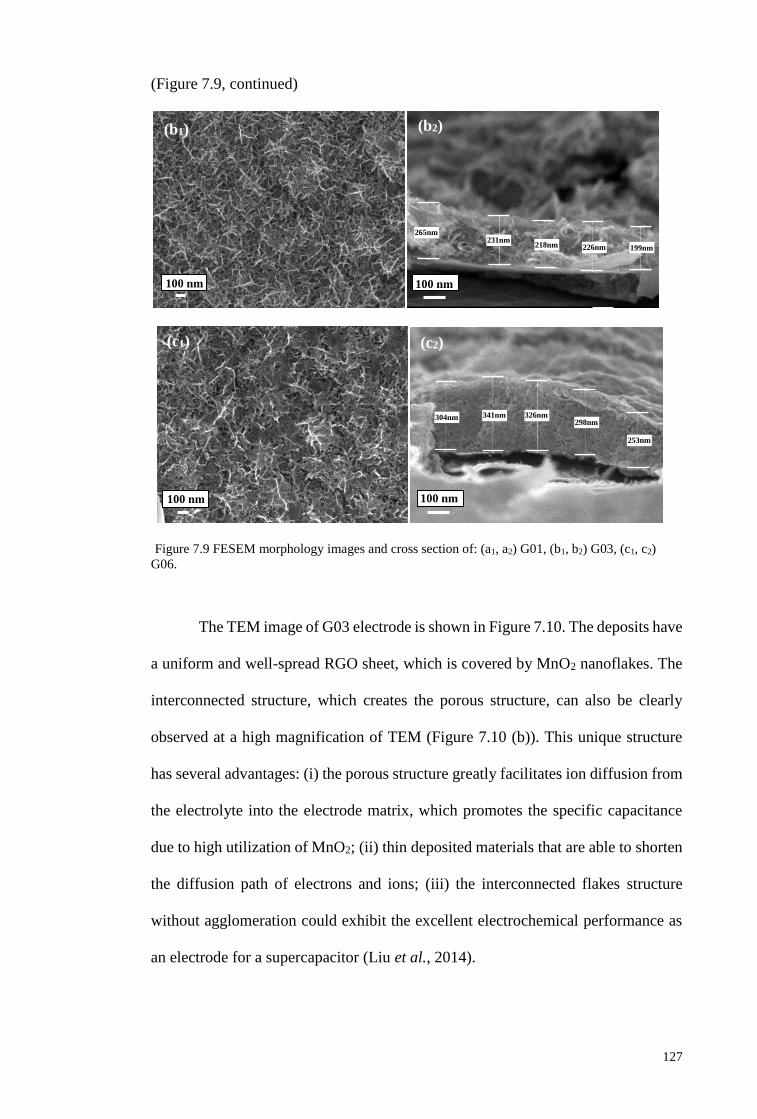
127
(Figure 7.9, continued)
Figure 7.9 FESEM morphology images and cross section of: (a1, a2) G01, (b1, b2) G03, (c1, c2)
G06.
The TEM image of G03 electrode is shown in Figure 7.10. The deposits have
a uniform and well-spread RGO sheet, which is covered by MnO2 nanoflakes. The
interconnected structure, which creates the porous structure, can also be clearly
observed at a high magnification of TEM (Figure 7.10 (b)). This unique structure
has several advantages: (i) the porous structure greatly facilitates ion diffusion from
the electrolyte into the electrode matrix, which promotes the specific capacitance
due to high utilization of MnO2; (ii) thin deposited materials that are able to shorten
the diffusion path of electrons and ions; (iii) the interconnected flakes structure
without agglomeration could exhibit the excellent electrochemical performance as
an electrode for a supercapacitor (Liu et al., 2014).
(b1) (b2)
(c1) (c2)
100 nm
100 nm
100 nm 100 nm
265nm 231nm
218nm 226nm 199nm
341nm 304nm 326nm 298nm
253nm
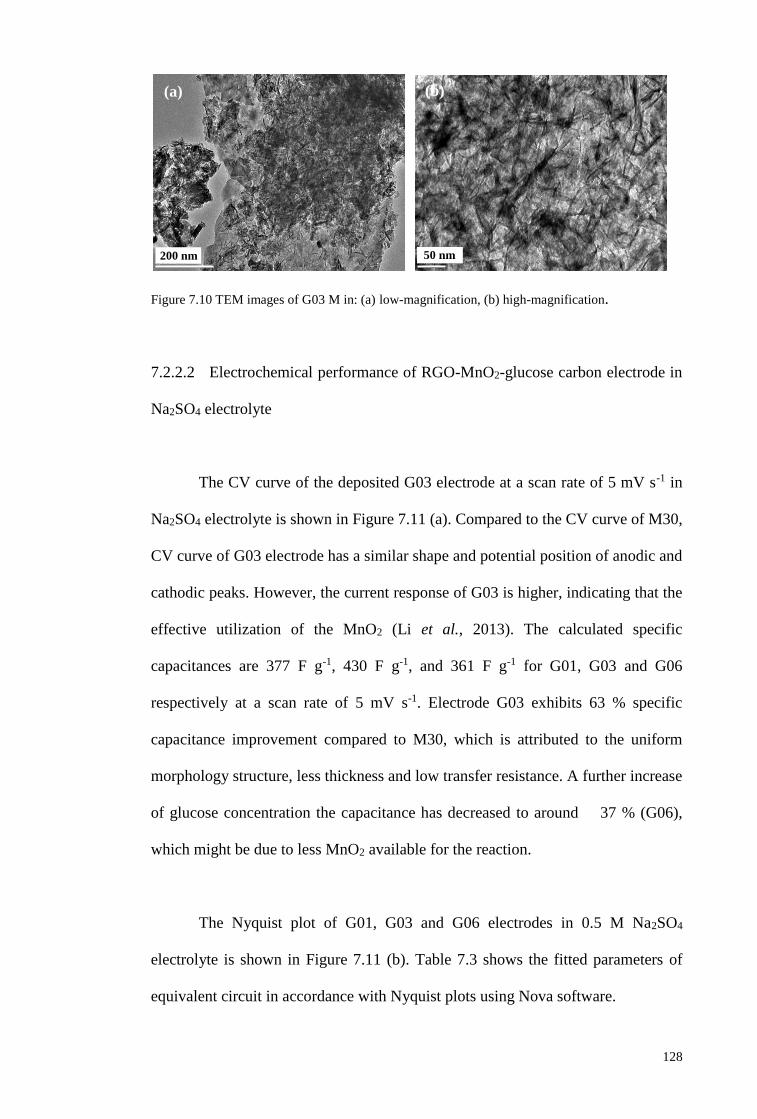
128
Figure 7.10 TEM images of G03 M in: (a) low-magnification, (b) high-magnification.
7.2.2.2 Electrochemical performance of RGO-MnO2-glucose carbon electrode in
Na2SO4 electrolyte
The CV curve of the deposited G03 electrode at a scan rate of 5 mV s-1 in
Na2SO4 electrolyte is shown in Figure 7.11 (a). Compared to the CV curve of M30,
CV curve of G03 electrode has a similar shape and potential position of anodic and
cathodic peaks. However, the current response of G03 is higher, indicating that the
effective utilization of the MnO2 (Li et al., 2013). The calculated specific
capacitances are 377 F g-1, 430 F g-1, and 361 F g-1 for G01, G03 and G06
respectively at a scan rate of 5 mV s-1. Electrode G03 exhibits 63 % specific
capacitance improvement compared to M30, which is attributed to the uniform
morphology structure, less thickness and low transfer resistance. A further increase
of glucose concentration the capacitance has decreased to around 37 % (G06),
which might be due to less MnO2 available for the reaction.
The Nyquist plot of G01, G03 and G06 electrodes in 0.5 M Na2SO4
electrolyte is shown in Figure 7.11 (b). Table 7.3 shows the fitted parameters of
equivalent circuit in accordance with Nyquist plots using Nova software.
(a) (b)
200 nm 50 nm
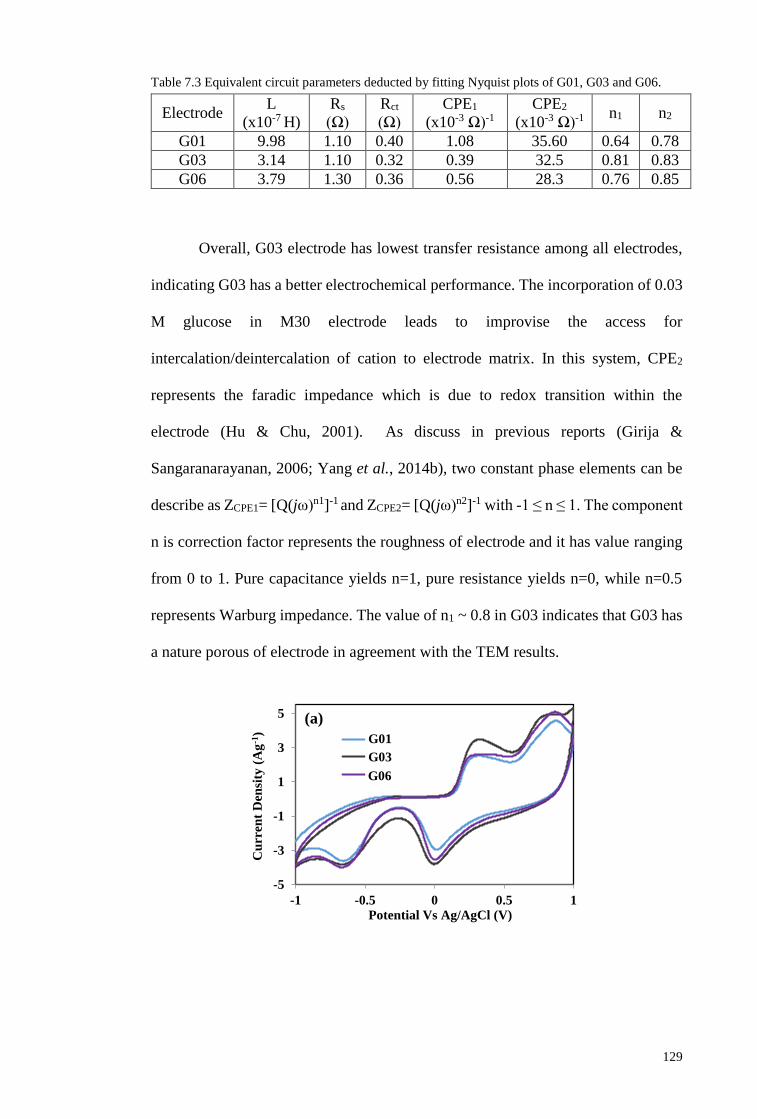
129
Table 7.3 Equivalent circuit parameters deducted by fitting Nyquist plots of G01, G03 and G06.
Overall, G03 electrode has lowest transfer resistance among all electrodes,
indicating G03 has a better electrochemical performance. The incorporation of 0.03
M glucose in M30 electrode leads to improvise the access for
intercalation/deintercalation of cation to electrode matrix. In this system, CPE2
represents the faradic impedance which is due to redox transition within the
electrode (Hu & Chu, 2001). As discuss in previous reports (Girija &
Sangaranarayanan, 2006; Yang et al., 2014b), two constant phase elements can be
describe as ZCPE1= [Q(jω)n1]-1 and ZCPE2= [Q(jω)n2]-1 with -1 ≤ n ≤ 1. The component
n is correction factor represents the roughness of electrode and it has value ranging
from 0 to 1. Pure capacitance yields n=1, pure resistance yields n=0, while n=0.5
represents Warburg impedance. The value of n1 ~ 0.8 in G03 indicates that G03 has
a nature porous of electrode in agreement with the TEM results.
-5
-3
-1
1
3
5
-1 -0.5 0 0.5 1
Cu
rren
t D
ensi
ty (
Ag
-1)
Potential Vs Ag/AgCl (V)
0.01M
0.03M
0.06M
Electrode L
(x10-7 H)
Rs
(Ω)
Rct
(Ω)
CPE1
(x10-3 Ω)-1
CPE2
(x10-3 Ω)-1 n1 n2
G01 9.98 1.10 0.40 1.08 35.60 0.64 0.78
G03 3.14 1.10 0.32 0.39 32.5 0.81 0.83
G06 3.79 1.30 0.36 0.56 28.3 0.76 0.85
G01
G03
G06
(a)
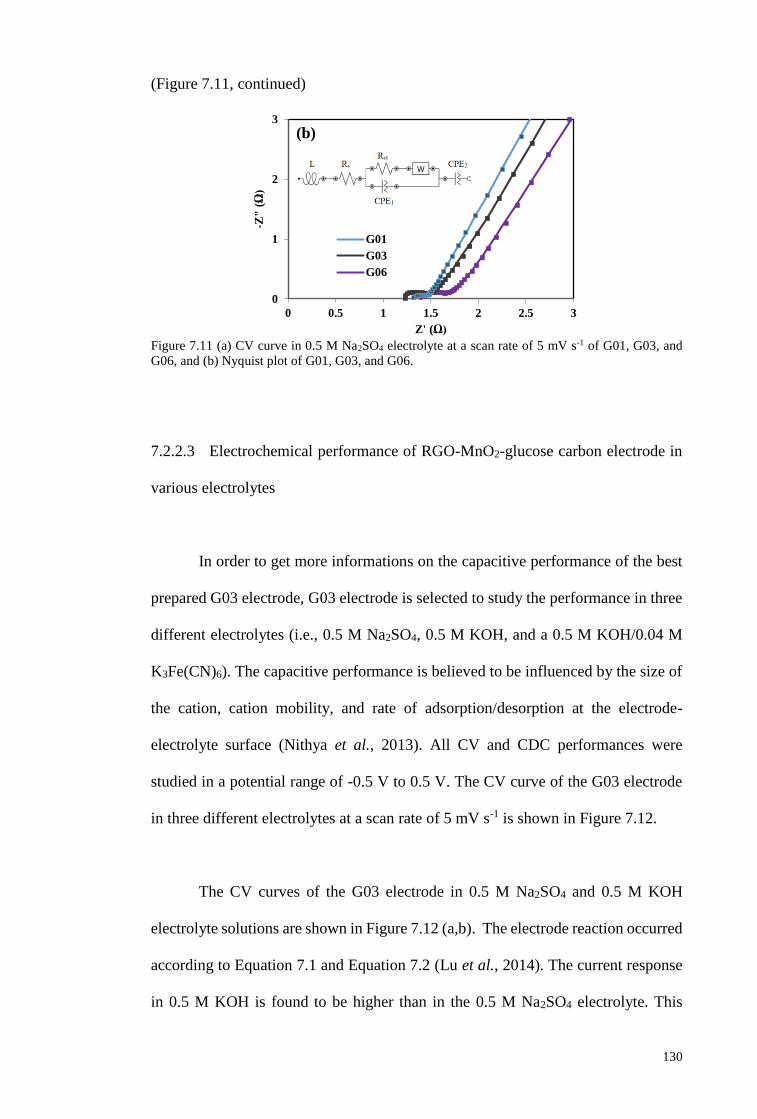
130
(Figure 7.11, continued)
Figure 7.11 (a) CV curve in 0.5 M Na2SO4 electrolyte at a scan rate of 5 mV s-1 of G01, G03, and
G06, and (b) Nyquist plot of G01, G03, and G06.
7.2.2.3 Electrochemical performance of RGO-MnO2-glucose carbon electrode in
various electrolytes
In order to get more informations on the capacitive performance of the best
prepared G03 electrode, G03 electrode is selected to study the performance in three
different electrolytes (i.e., 0.5 M Na2SO4, 0.5 M KOH, and a 0.5 M KOH/0.04 M
K3Fe(CN)6). The capacitive performance is believed to be influenced by the size of
the cation, cation mobility, and rate of adsorption/desorption at the electrode-
electrolyte surface (Nithya et al., 2013). All CV and CDC performances were
studied in a potential range of -0.5 V to 0.5 V. The CV curve of the G03 electrode
in three different electrolytes at a scan rate of 5 mV s-1 is shown in Figure 7.12.
The CV curves of the G03 electrode in 0.5 M Na2SO4 and 0.5 M KOH
electrolyte solutions are shown in Figure 7.12 (a,b). The electrode reaction occurred
according to Equation 7.1 and Equation 7.2 (Lu et al., 2014). The current response
in 0.5 M KOH is found to be higher than in the 0.5 M Na2SO4 electrolyte. This
0
1
2
3
0 0.5 1 1.5 2 2.5 3
-Z"
(Ω
)
Z' (Ω)
G01
G03
G06
(b)
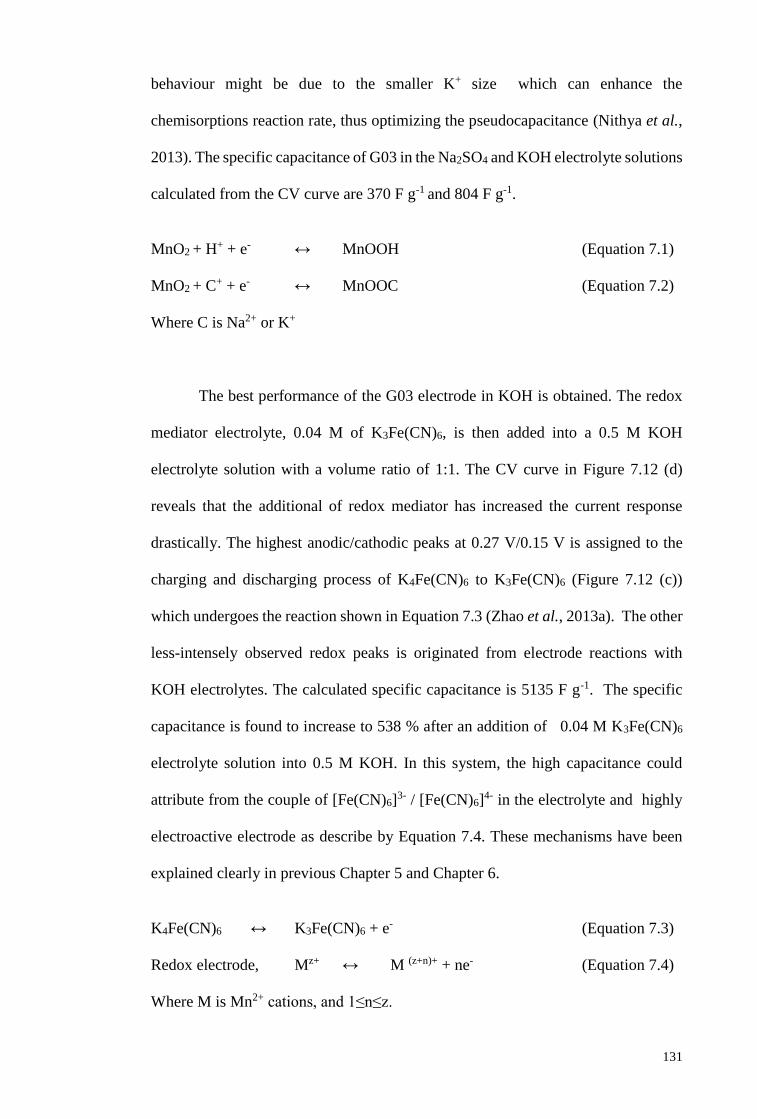
131
behaviour might be due to the smaller K+ size which can enhance the
chemisorptions reaction rate, thus optimizing the pseudocapacitance (Nithya et al.,
2013). The specific capacitance of G03 in the Na2SO4 and KOH electrolyte solutions
calculated from the CV curve are 370 F g-1 and 804 F g-1.
MnO2 + H+ + e- ↔ MnOOH (Equation 7.1)
MnO2 + C+ + e- ↔ MnOOC (Equation 7.2)
Where C is Na2+ or K+
The best performance of the G03 electrode in KOH is obtained. The redox
mediator electrolyte, 0.04 M of K3Fe(CN)6, is then added into a 0.5 M KOH
electrolyte solution with a volume ratio of 1:1. The CV curve in Figure 7.12 (d)
reveals that the additional of redox mediator has increased the current response
drastically. The highest anodic/cathodic peaks at 0.27 V/0.15 V is assigned to the
charging and discharging process of K4Fe(CN)6 to K3Fe(CN)6 (Figure 7.12 (c))
which undergoes the reaction shown in Equation 7.3 (Zhao et al., 2013a). The other
less-intensely observed redox peaks is originated from electrode reactions with
KOH electrolytes. The calculated specific capacitance is 5135 F g-1. The specific
capacitance is found to increase to 538 % after an addition of 0.04 M K3Fe(CN)6
electrolyte solution into 0.5 M KOH. In this system, the high capacitance could
attribute from the couple of [Fe(CN)6]3- / [Fe(CN)6]
4- in the electrolyte and highly
electroactive electrode as describe by Equation 7.4. These mechanisms have been
explained clearly in previous Chapter 5 and Chapter 6.
K4Fe(CN)6 ↔ K3Fe(CN)6 + e- (Equation 7.3)
Redox electrode, Mz+ ↔ M (z+n)+ + ne- (Equation 7.4)
Where M is Mn2+ cations, and 1≤n≤z.
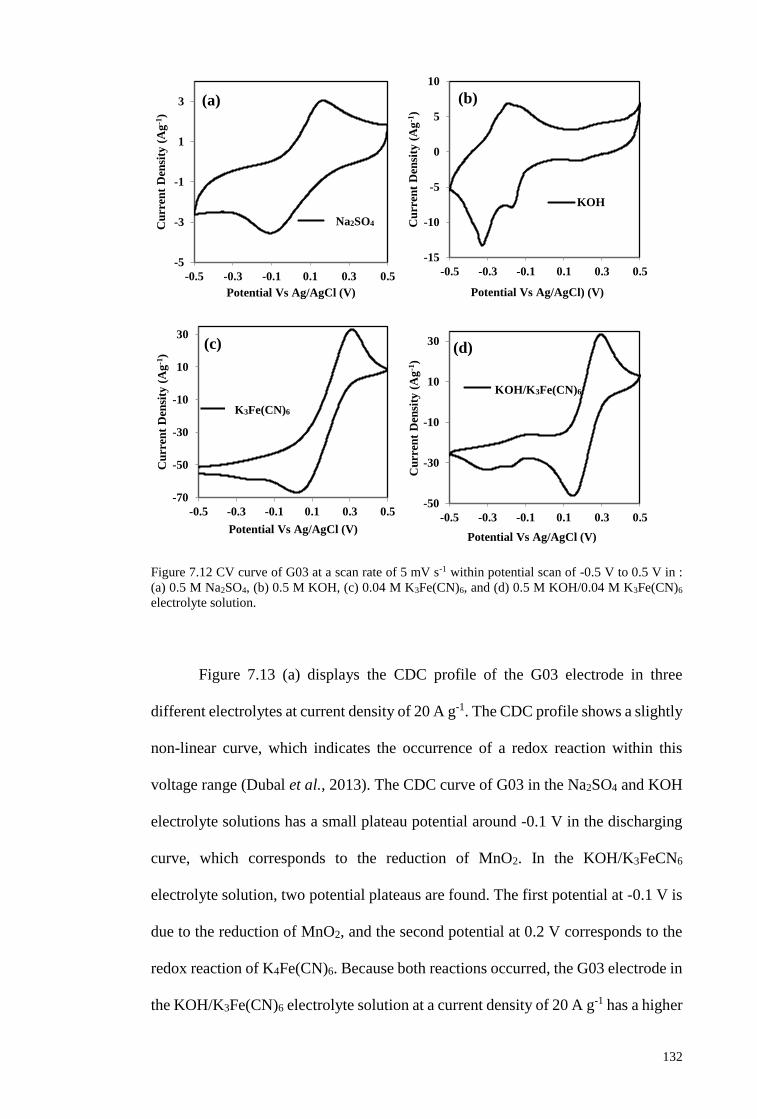
132
Figure 7.12 CV curve of G03 at a scan rate of 5 mV s-1 within potential scan of -0.5 V to 0.5 V in :
(a) 0.5 M Na2SO4, (b) 0.5 M KOH, (c) 0.04 M K3Fe(CN)6, and (d) 0.5 M KOH/0.04 M K3Fe(CN)6
electrolyte solution.
Figure 7.13 (a) displays the CDC profile of the G03 electrode in three
different electrolytes at current density of 20 A g-1. The CDC profile shows a slightly
non-linear curve, which indicates the occurrence of a redox reaction within this
voltage range (Dubal et al., 2013). The CDC curve of G03 in the Na2SO4 and KOH
electrolyte solutions has a small plateau potential around -0.1 V in the discharging
curve, which corresponds to the reduction of MnO2. In the KOH/K3FeCN6
electrolyte solution, two potential plateaus are found. The first potential at -0.1 V is
due to the reduction of MnO2, and the second potential at 0.2 V corresponds to the
redox reaction of K4Fe(CN)6. Because both reactions occurred, the G03 electrode in
the KOH/K3Fe(CN)6 electrolyte solution at a current density of 20 A g-1 has a higher
-5
-3
-1
1
3
-0.5 -0.3 -0.1 0.1 0.3 0.5
Cu
rren
t D
ensi
ty (
Ag
-1)
Potential Vs Ag/AgCl (V)
Na2SO4
-15
-10
-5
0
5
10
-0.5 -0.3 -0.1 0.1 0.3 0.5
Cu
rren
t D
ensi
ty (
Ag
-1)
Potential Vs Ag/AgCl) (V)
KOH
-70
-50
-30
-10
10
30
-0.5 -0.3 -0.1 0.1 0.3 0.5
Cu
rren
t D
ensi
ty (
Ag
-1)
Potential Vs Ag/AgCl (V)
K3Fe(CN)6
-50
-30
-10
10
30
-0.5 -0.3 -0.1 0.1 0.3 0.5
Cu
rren
t D
ensi
ty (
Ag
-1)
Potential Vs Ag/AgCl (V)
Mix KOH/
K3Fe(CN)6
Na2SO4
K3Fe(CN)6
(c) (d)
(a) (b)
KOH/K3Fe(CN)6
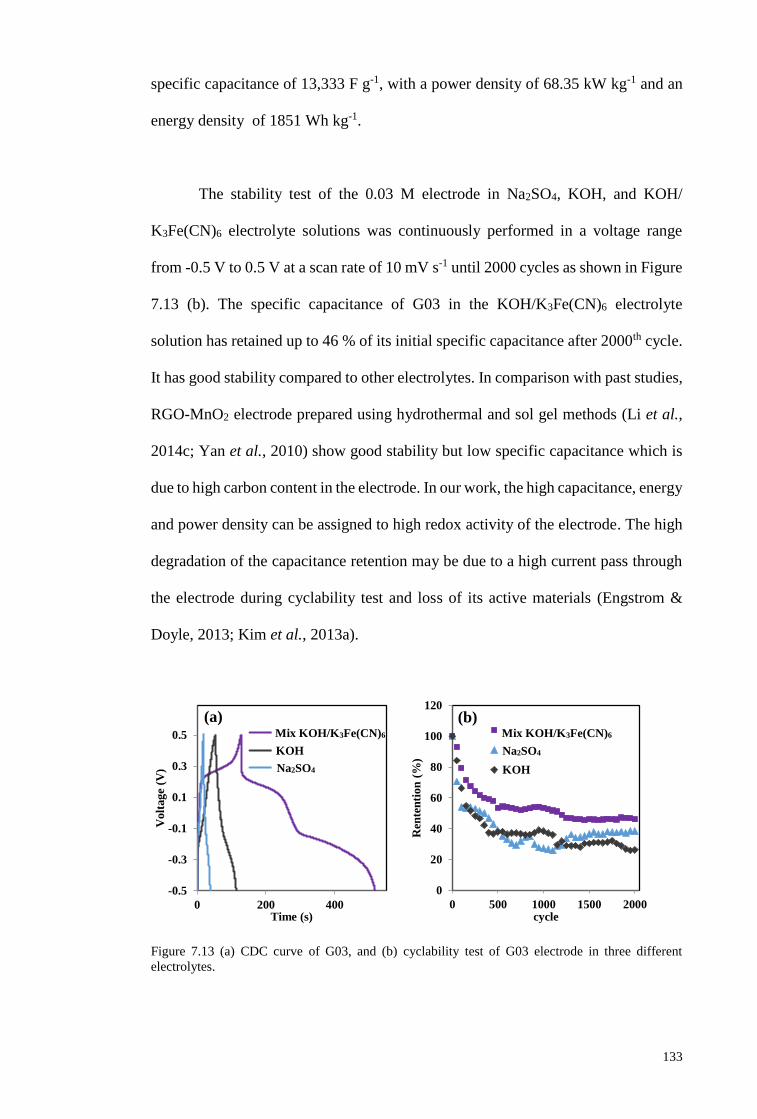
133
specific capacitance of 13,333 F g-1, with a power density of 68.35 kW kg-1 and an
energy density of 1851 Wh kg-1.
The stability test of the 0.03 M electrode in Na2SO4, KOH, and KOH/
K3Fe(CN)6 electrolyte solutions was continuously performed in a voltage range
from -0.5 V to 0.5 V at a scan rate of 10 mV s-1 until 2000 cycles as shown in Figure
7.13 (b). The specific capacitance of G03 in the KOH/K3Fe(CN)6 electrolyte
solution has retained up to 46 % of its initial specific capacitance after 2000th cycle.
It has good stability compared to other electrolytes. In comparison with past studies,
RGO-MnO2 electrode prepared using hydrothermal and sol gel methods (Li et al.,
2014c; Yan et al., 2010) show good stability but low specific capacitance which is
due to high carbon content in the electrode. In our work, the high capacitance, energy
and power density can be assigned to high redox activity of the electrode. The high
degradation of the capacitance retention may be due to a high current pass through
the electrode during cyclability test and loss of its active materials (Engstrom &
Doyle, 2013; Kim et al., 2013a).
Figure 7.13 (a) CDC curve of G03, and (b) cyclability test of G03 electrode in three different
electrolytes.
-0.5
-0.3
-0.1
0.1
0.3
0.5
0 200 400
Volt
ag
e (V
)
Time (s)
in Mix KOH/K3FeCN6
KOH
Na2SO4
0
20
40
60
80
100
120
0 500 1000 1500 2000
Ren
ten
tion
(%
)
cycle
Mix
Na2SO4
KOH
(a) (b)
Na2SO4
KOH
Mix KOH/K3Fe(CN)6 Mix KOH/K3Fe(CN)6
Na2SO4
KOH
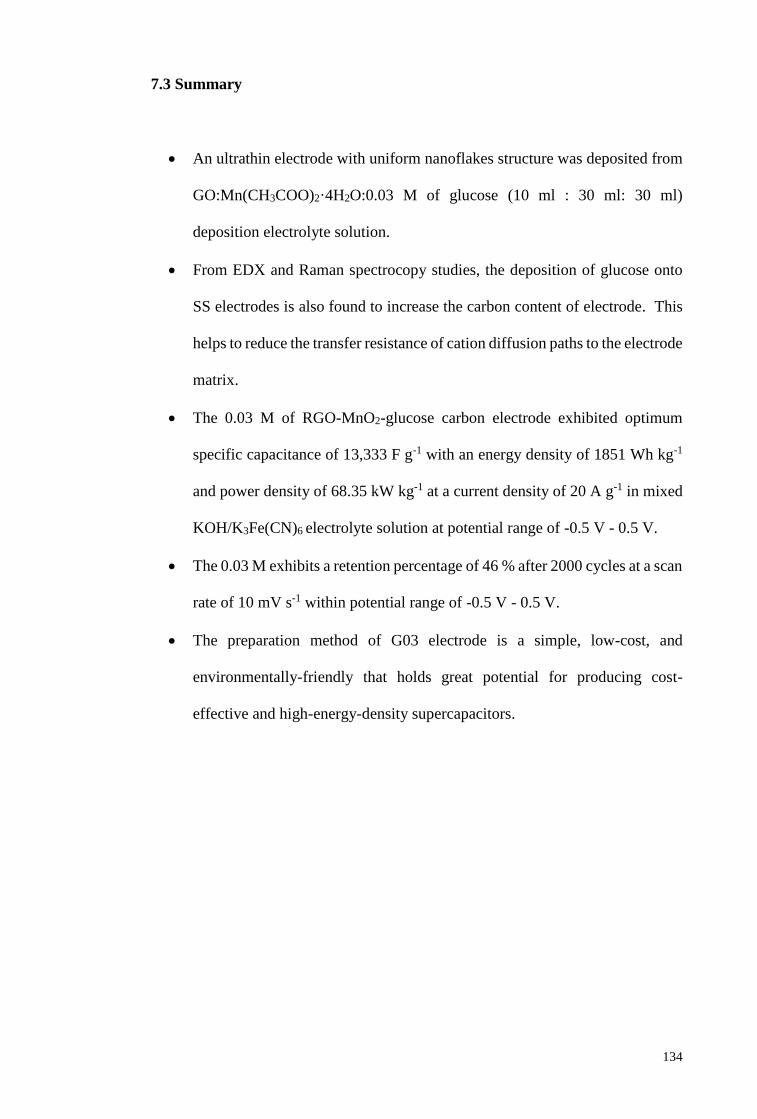
134
7.3 Summary
An ultrathin electrode with uniform nanoflakes structure was deposited from
GO:Mn(CH3COO)2·4H2O:0.03 M of glucose (10 ml : 30 ml: 30 ml)
deposition electrolyte solution.
From EDX and Raman spectrocopy studies, the deposition of glucose onto
SS electrodes is also found to increase the carbon content of electrode. This
helps to reduce the transfer resistance of cation diffusion paths to the electrode
matrix.
The 0.03 M of RGO-MnO2-glucose carbon electrode exhibited optimum
specific capacitance of 13,333 F g-1 with an energy density of 1851 Wh kg-1
and power density of 68.35 kW kg-1 at a current density of 20 A g-1 in mixed
KOH/K3Fe(CN)6 electrolyte solution at potential range of -0.5 V - 0.5 V.
The 0.03 M exhibits a retention percentage of 46 % after 2000 cycles at a scan
rate of 10 mV s-1 within potential range of -0.5 V - 0.5 V.
The preparation method of G03 electrode is a simple, low-cost, and
environmentally-friendly that holds great potential for producing cost-
effective and high-energy-density supercapacitors.
135
CHAPTER 8: CONCLUSIONS AND SUGGESTIONS FOR
FUTURE WORK
8.1 Conclusions
In summary, the main objectives of the present study were achieved as
mentioned in Chapter 1. This thesis focuses on the development of composite
manganese oxide based electrode with secondary/ternary transition metal oxides and
conductive carbon for supercapacitor’s electrodes. There are four electrode systems
that have been produced and tested successfully and reported in this thesis, as listed
below:
i. MnO2 electrode,
ii. MnO2-NiO binary electrode,
iii. Mn3O4-NiO-Co3O4 ternary electrode,
iv. RGO-MnO2-glucose carbon nanocomposite electrode.
During the first part of our work, different MnO2 structures have been
observed by varying the concentration of manganese acetate tetrahydrate
(Mn(CH3COO)2·4H2O) in deposition electrolyte (Chapter 4). The concentration of
cations source in deposition electrolyte is one of the important parameters that
influence the electrodeposition rate and nucleation process, thus resulted in various
morphologies. At small concentration of Mn(CH3COO)2·4H2O (<0.01 M), the
deposited MnO2 particles were less formed which is due to slow electrodeposition
rate. The deposition electrolyte of 0.01 M Mn(CH3COO)2·4H2O was identified as a
suitable concentration to produce nano flower-like structure electrode through
chronopotentiometry mode. The diameter size of spherical flower is in the range of
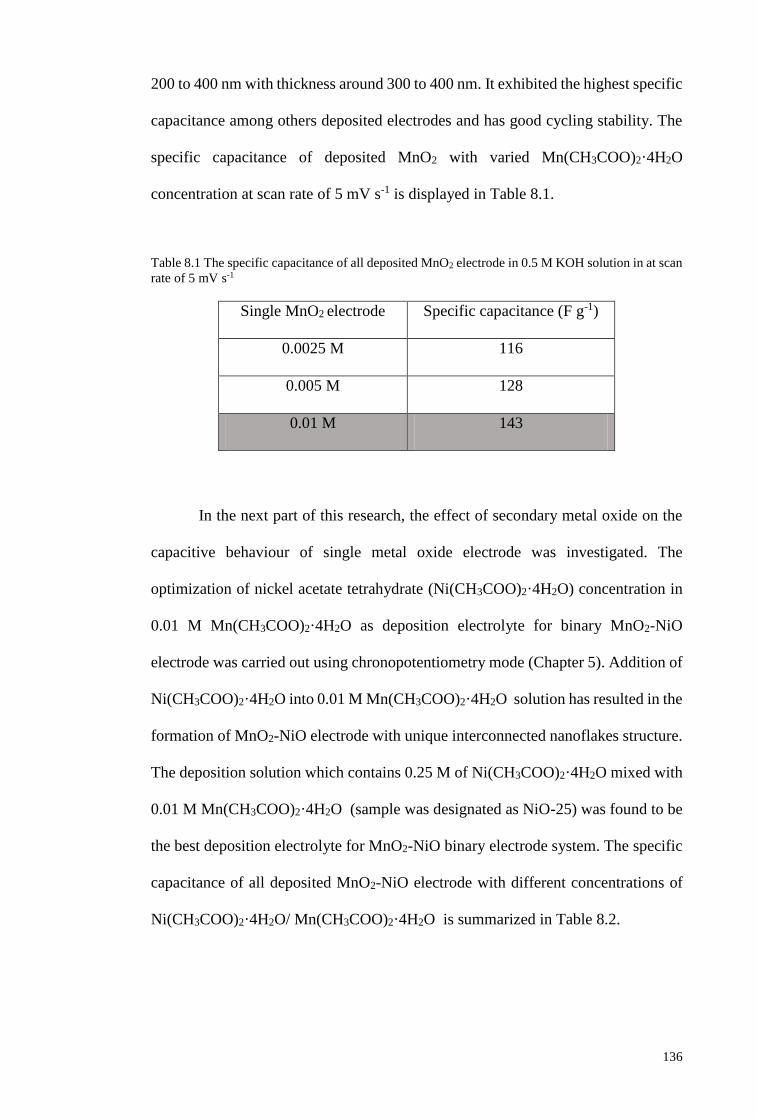
136
200 to 400 nm with thickness around 300 to 400 nm. It exhibited the highest specific
capacitance among others deposited electrodes and has good cycling stability. The
specific capacitance of deposited MnO2 with varied Mn(CH3COO)2·4H2O
concentration at scan rate of 5 mV s-1 is displayed in Table 8.1.
Table 8.1 The specific capacitance of all deposited MnO2 electrode in 0.5 M KOH solution in at scan
rate of 5 mV s-1
Single MnO2 electrode Specific capacitance (F g-1)
0.0025 M 116
0.005 M 128
0.01 M 143
In the next part of this research, the effect of secondary metal oxide on the
capacitive behaviour of single metal oxide electrode was investigated. The
optimization of nickel acetate tetrahydrate (Ni(CH3COO)2·4H2O) concentration in
0.01 M Mn(CH3COO)2·4H2O as deposition electrolyte for binary MnO2-NiO
electrode was carried out using chronopotentiometry mode (Chapter 5). Addition of
Ni(CH3COO)2·4H2O into 0.01 M Mn(CH3COO)2·4H2O solution has resulted in the
formation of MnO2-NiO electrode with unique interconnected nanoflakes structure.
The deposition solution which contains 0.25 M of Ni(CH3COO)2·4H2O mixed with
0.01 M Mn(CH3COO)2·4H2O (sample was designated as NiO-25) was found to be
the best deposition electrolyte for MnO2-NiO binary electrode system. The specific
capacitance of all deposited MnO2-NiO electrode with different concentrations of
Ni(CH3COO)2·4H2O/ Mn(CH3COO)2·4H2O is summarized in Table 8.2.
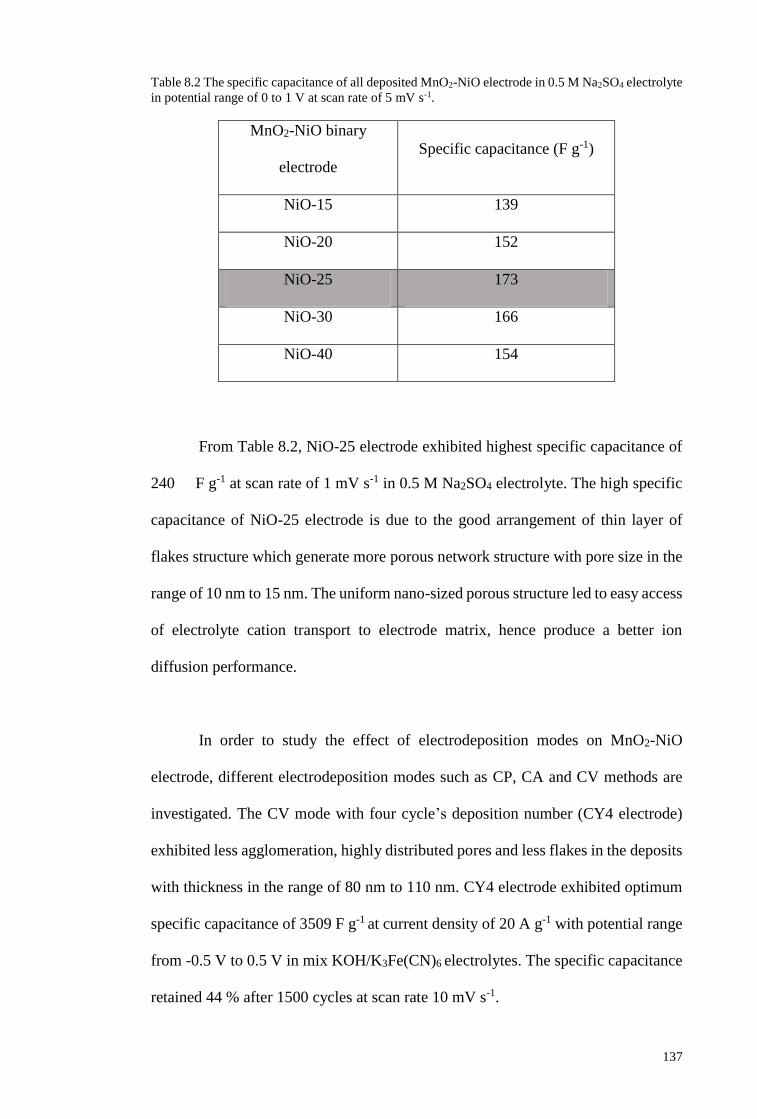
137
Table 8.2 The specific capacitance of all deposited MnO2-NiO electrode in 0.5 M Na2SO4 electrolyte
in potential range of 0 to 1 V at scan rate of 5 mV s-1.
MnO2-NiO binary
electrode
Specific capacitance (F g-1)
NiO-15 139
NiO-20 152
NiO-25 173
NiO-30 166
NiO-40 154
From Table 8.2, NiO-25 electrode exhibited highest specific capacitance of
240 F g-1 at scan rate of 1 mV s-1 in 0.5 M Na2SO4 electrolyte. The high specific
capacitance of NiO-25 electrode is due to the good arrangement of thin layer of
flakes structure which generate more porous network structure with pore size in the
range of 10 nm to 15 nm. The uniform nano-sized porous structure led to easy access
of electrolyte cation transport to electrode matrix, hence produce a better ion
diffusion performance.
In order to study the effect of electrodeposition modes on MnO2-NiO
electrode, different electrodeposition modes such as CP, CA and CV methods are
investigated. The CV mode with four cycle’s deposition number (CY4 electrode)
exhibited less agglomeration, highly distributed pores and less flakes in the deposits
with thickness in the range of 80 nm to 110 nm. CY4 electrode exhibited optimum
specific capacitance of 3509 F g-1 at current density of 20 A g-1 with potential range
from -0.5 V to 0.5 V in mix KOH/K3Fe(CN)6 electrolytes. The specific capacitance
retained 44 % after 1500 cycles at scan rate 10 mV s-1.
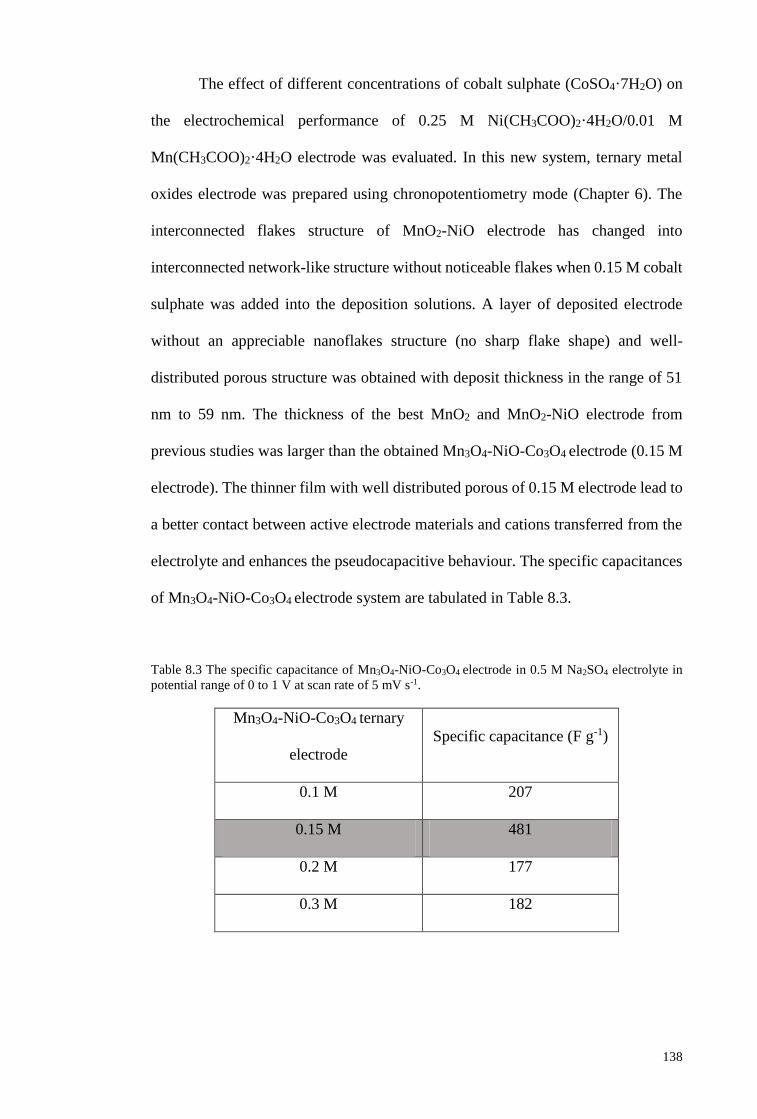
138
The effect of different concentrations of cobalt sulphate (CoSO4·7H2O) on
the electrochemical performance of 0.25 M Ni(CH3COO)2·4H2O/0.01 M
Mn(CH3COO)2·4H2O electrode was evaluated. In this new system, ternary metal
oxides electrode was prepared using chronopotentiometry mode (Chapter 6). The
interconnected flakes structure of MnO2-NiO electrode has changed into
interconnected network-like structure without noticeable flakes when 0.15 M cobalt
sulphate was added into the deposition solutions. A layer of deposited electrode
without an appreciable nanoflakes structure (no sharp flake shape) and well-
distributed porous structure was obtained with deposit thickness in the range of 51
nm to 59 nm. The thickness of the best MnO2 and MnO2-NiO electrode from
previous studies was larger than the obtained Mn3O4-NiO-Co3O4 electrode (0.15 M
electrode). The thinner film with well distributed porous of 0.15 M electrode lead to
a better contact between active electrode materials and cations transferred from the
electrolyte and enhances the pseudocapacitive behaviour. The specific capacitances
of Mn3O4-NiO-Co3O4 electrode system are tabulated in Table 8.3.
Table 8.3 The specific capacitance of Mn3O4-NiO-Co3O4 electrode in 0.5 M Na2SO4 electrolyte in
potential range of 0 to 1 V at scan rate of 5 mV s-1.
Mn3O4-NiO-Co3O4 ternary
electrode
Specific capacitance (F g-1)
0.1 M 207
0.15 M 481
0.2 M 177
0.3 M 182
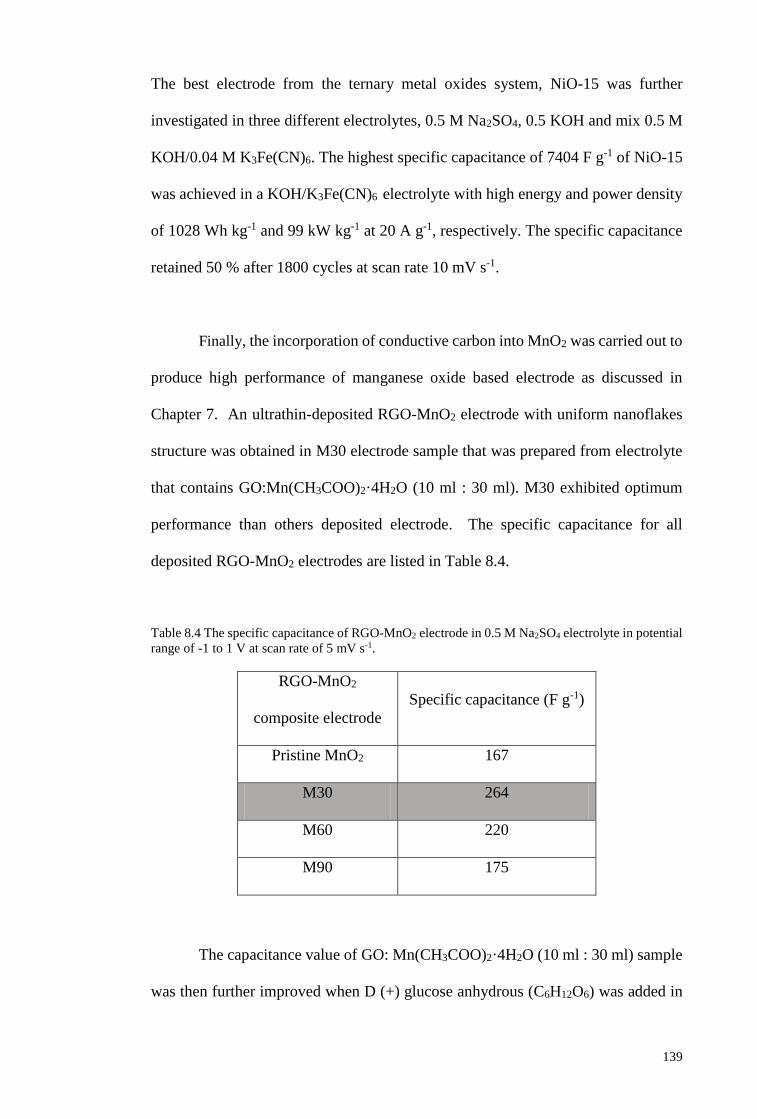
139
The best electrode from the ternary metal oxides system, NiO-15 was further
investigated in three different electrolytes, 0.5 M Na2SO4, 0.5 KOH and mix 0.5 M
KOH/0.04 M K3Fe(CN)6. The highest specific capacitance of 7404 F g-1 of NiO-15
was achieved in a KOH/K3Fe(CN)6 electrolyte with high energy and power density
of 1028 Wh kg-1 and 99 kW kg-1 at 20 A g-1, respectively. The specific capacitance
retained 50 % after 1800 cycles at scan rate 10 mV s-1.
Finally, the incorporation of conductive carbon into MnO2 was carried out to
produce high performance of manganese oxide based electrode as discussed in
Chapter 7. An ultrathin-deposited RGO-MnO2 electrode with uniform nanoflakes
structure was obtained in M30 electrode sample that was prepared from electrolyte
that contains GO:Mn(CH3COO)2·4H2O (10 ml : 30 ml). M30 exhibited optimum
performance than others deposited electrode. The specific capacitance for all
deposited RGO-MnO2 electrodes are listed in Table 8.4.
Table 8.4 The specific capacitance of RGO-MnO2 electrode in 0.5 M Na2SO4 electrolyte in potential
range of -1 to 1 V at scan rate of 5 mV s-1.
RGO-MnO2
composite electrode
Specific capacitance (F g-1)
Pristine MnO2 167
M30 264
M60 220
M90 175
The capacitance value of GO: Mn(CH3COO)2·4H2O (10 ml : 30 ml) sample
was then further improved when D (+) glucose anhydrous (C6H12O6) was added in
140
the deposition electrolyte solution. In this approach, we found that the addition of
glucose was able to slow down the nucleation process of MnO2 and enhanced the
carbon content of the electrode which helps to reduce the transfer resistance of cation
diffusion paths to the electrode matrix. The deposited electrode by using deposition
solution of 0.03 M glucose mixed 10 ml GO : 30 ml Mn(CH3COO)2·4H2O (G03)
exhibited uniform and well distributed porous structure within 60-100 nm of pore
diameter size. The average thickness of G03 electrode was around 265 nm. The
specific capacitances of all deposited electrode with additional of glucose, G01, G03
and G06 electrode in Na2SO4 electrolyte were 377 F g-1, 430 F g-1 and 361 F g-1,
respectively at scan rate of 5 mV s-1 in potential range of -1 to 1 V. The unique
structure of G03 gives an optimum electrochemical performance of specific
capacitance.
The G03 electrode was also studied in mixed 0.5 M KOH/ 0.04 M
K3Fe(CN)6 electrolyte. It exhibited specific capacitance of 13,333 F g-1 with a power
density of 68.35 kW kg-1, and an energy density of 1851 Wh kg-1 at a current density
of 20 A g-1. The extremely high specific capacitance in mixed KOH/ K3Fe(CN)6
electrolyte solution is attributed from the [Fe(CN)6]3- / [Fe(CN)6]
4- in the electrolyte
and highly redox reaction from electroactive electrode. Although the specific
capacitance and energy density if G03 in mix 0.5 M KOH/ 0.04 M K3Fe(CN)6
electrolyte was higher than earlier study, the specific capacitance retention is still
need to be improved. A retention percentage of 46 % was observed after 2000 cycles
at a scan rate of 10 mV s-1. High degradation is due to loss of active material and
high current. The obtained G03 electrode with optimum ratio of RGO-MnO2-
glucose carbon has been achieved in this study. All optimized electrode in each
141
system of MnO2 based electrode has been studied in mix 0.5 M KOH/ 0.04 M
K3Fe(CN)6 electrolyte.
8.2 Suggestions for future work
In this work, the concentration and deposition parameters have been
optimized for manganese oxide based electrode systems. Overall, the high specific
capacitance and energy density was obtained in our research which is suitable for
supercpacitor application. However, the cycling performance of the electrode is still
needs to be improved. There are some future works which can be used to improve
the electrochemical performance of electrodes as listed below:
The cycling performance and power density of electrode is believed can be
improved by deposited the nanostructure manganese oxide based electrode
with carbon based substrate like graphite cloth, graphite sheet, carbon cloth,
or CNT based electrode.
The adhesion between the electrode surface and active material can be
improved by adding the sodium dodecyl sulfate (SDS) into deposition
solution.
The optimized electrode in our studies can be used as cathode electrode for
hybrid supercapacitor and high conductivity of carbon materials as anode
electrode. This combination able to give good electrochemical performance
for flexible supercapacitor devices.
The optimized electrode can be further used to investigate their
electrochemical performance in different electrolytes viz. gel polymer
electrolyte or solid polymer electrolyte.
142
References
Aghazadeh, M., Golikand, A. N., & Ghaemi, M. (2011). Synthesis, characterization,
and electrochemical properties of ultrafine β-Ni(OH)2 nanoparticles.
International Journal of Hydrogen Energy, 36(14), 8674-8679
Alvi, F., Ram, M. K., Basnayaka, P. A., Stefanakos, E., Goswami, Y., & Kumar, A.
(2011). Graphene–polyethylenedioxythiophene conducting polymer
nanocomposite based supercapacitor. Electrochimica Acta, 56(25), 9406-
9412
Augustyn, V., Simon, P., & Dunn, B. (2014). Pseudocapacitive oxide materials for
high-rate electrochemical energy storage. Energy & Environmental Science,
7(5), 1597-1614
Babakhani, B., & Ivey, D. G. (2010). Anodic deposition of manganese oxide
electrodes with rod-like structures for application as electrochemical
capacitors. Journal of Power Sources, 195(7), 2110-2117
Babakhani, B., & Ivey, D. G. (2011). Effect of electrodeposition conditions on the
electrochemical capacitive behavior of synthesized manganese oxide
electrodes. Journal of Power Sources, 196(24), 10762-10774
Beaudrouet, E., Le Gal La Salle, A., & Guyomard, D. (2009). Nanostructured
manganese dioxides: Synthesis and properties as supercapacitor electrode
materials. Electrochimica Acta, 54(4), 1240-1248
Benhaddad, L., Makhloufi, L., Messaoudi, B., Rahmouni, K., & Takenouti, H.
(2011). Reactivity of Nanostructured MnO2 in Alkaline Medium Studied
with a Microcavity Electrode: Effect of Oxidizing Agent. Journal of
Materials Science & Technology, 27(7), 585-593
Broughton, J. N., & Brett, M. J. (2005). Variations in MnO2 electrodeposition for
electrochemical capacitors. Electrochimica Acta, 50(24), 4814-4819
Brousse, T., Toupin, M., Dugas, R., Athouël, L., Crosnier, O., & Bélanger, D.
(2006). Crystalline MnO2 as Possible Alternatives to Amorphous
Compounds in Electrochemical Supercapacitors. Journal of the
Electrochemical Society, 153(12), A2171-A2180
Buchholz, D. B., Liu, J., Marks, T. J., Zhang, M., & Chang, R. P. H. (2009). Control
and Characterization of the Structural, Electrical, and Optical Properties of
Amorphous Zinc−Indium−Tin Oxide Thin Films. ACS Applied Materials &
Interfaces, 1(10), 2147-2153
Cai, Y., Wang, Y., Deng, S., Chen, G., Li, Q., Han, B., Han, R., Wang, Y. (2014).
Graphene nanosheets-tungsten oxides composite for supercapacitor
electrode. Ceramics International, 40(3), 4109-4116
143
Cançado, L. G., Pimenta, M. A., Neves, B. R. A., Dantas, M. S. S., & Jorio, A.
(2004). Influence of the Atomic Structure on the Raman Spectra of Graphite
Edges. Physical Review Letters, 93(24), 247401
Cao, J., Wang, Y., Zhou, Y., Jia, D., Ouyang, J.-H., & Guo, L. (2012). Performances
of high voltage electrochemical capacitor using ball-milled graphite/Mn3O4
composite electrodes. Journal of Electroanalytical Chemistry, 682, 23-28
Chan, P. Y., Rusi, & Majid, S. R. (2014). RGO-wrapped MnO2 composite electrode
for supercapacitor application. Solid State Ionics, 262, 226-229
Chen, K., Song, S., & Xue, D. (2014). An ionic aqueous pseudocapacitor system:
electroactive ions in both a salt electrode and redox electrolyte. RSC
Advances, 4(44), 23338-23343
Chen, Y.-S., & Hu, C.-C. (2003). Capacitive Characteristics of Binary Manganese-
Nickel Oxides Prepared by Anodic Deposition. Electrochemical and Solid-
State Letters, 6(10), A210-A213
Chen, Y., Wang, J.-W., Shi, X.-C., & Chen, B.-Z. (2013). Pseudocapacitive
characteristics of manganese oxide anodized from manganese coating
electrodeposited from aqueous solution. Electrochimica Acta, 109, 678-683
Cheng, Q., Tang, J., Ma, J., Zhang, H., Shinya, N., & Qin, L.-C. (2011). Graphene
and nanostructured MnO2 composite electrodes for supercapacitors. Carbon,
49(9), 2917-2925
Conway, B. E. (1999). Electrochemical Supercapacitors: Scientific Fundamentals
and Technological Applications. New York: Kluwer-Plenum.
Conway, B. E., Birss, V., & Wojtowicz, J. (1997). The role and utilization of
pseudocapacitance for energy storage by supercapacitors. Journal of Power
Sources, 66(1–2), 1-14
Cordente, N., Respaud, M., Senocq, F., Casanove, M.-J., Amiens, C., & Chaudret,
B. (2001). Synthesis and Magnetic Properties of Nickel Nanorods. Nano
Letters, 1(10), 565-568
Cross, A., Morel, A., Cormie, A., Hollenkamp, T., & Donne, S. (2011). Enhanced
manganese dioxide supercapacitor electrodes produced by electrodeposition.
Journal of Power Sources, 196(18), 7847-7853
Devaraj, S., & Munichandraiah, N. (2008). Effect of Crystallographic Structure of
MnO2 on Its Electrochemical Capacitance Properties. The Journal of
Physical Chemistry C, 112(11), 4406-4417
Derek, P. (2009). A first course in electrode process 2nd edition. RSC
publishing:Cambridge UK.
Dharmaraj, N., Prabu, P., Nagarajan, S., Kim, C. H., Park, J. H., & Kim, H. Y.
(2006). Synthesis of nickel oxide nanoparticles using nickel acetate and
144
poly(vinyl acetate) precursor. Materials Science and Engineering: B, 128(1–
3), 111-114
Ding, R., Qi, L., Jia, M., & Wang, H. (2013). Facile and large-scale chemical
synthesis of highly porous secondary submicron/micron-sized NiCo2O4
materials for high-performance aqueous hybrid AC-NiCo2O4
electrochemical capacitors. Electrochimica Acta, 107, 494-502
Dirican, M., Yanilmaz, M., & Zhang, X. (2014). Free-standing polyaniline-porous
carbon nanofiber electrodes for symmetric and asymmetric supercapacitors.
RSC Advances, 4(103), 59427-59435
Dong, X., Wang, K., Zhao, C., Qian, X., Chen, S., Li, Z., Liu, H., Dou, S. (2014).
Direct synthesis of RGO/Cu2O composite films on Cu foil for
supercapacitors. Journal of Alloys and Compounds, 586, 745-753
Dongale, T. D., Jadhav, P. R., Navathe, G. J., Kim, J. H., Karanjkar, M. M., & Patil,
P. S. (2015). Development of nano fiber MnO2 thin film electrode and cyclic
voltammetry behavior modeling using artificial neural network for
supercapacitor application. Materials Science in Semiconductor Processing,
36, 43-48
Du Pasquier, A., Laforgue, A., Simon, P., Amatucci, G. G., & Fauvarque, J.-F.
(2002). A Nonaqueous Asymmetric Hybrid Li4Ti O12 /
Poly(fluorophenylthiophene) Energy Storage Device. Journal of the
Electrochemical Society, 149(3), A302-A306
Dubal, D. P., Dhawale, D. S., Gujar, T. P., & Lokhande, C. D. (2011). Effect of
different modes of electrodeposition on supercapacitive properties of MnO2
thin films. Applied Surface Science, 257(8), 3378-3382
Dubal, D. P., Dhawale, D. S., Salunkhe, R. R., Pawar, S. M., & Lokhande, C. D.
(2010). A novel chemical synthesis and characterization of Mn3O4 thin films
for supercapacitor application. Applied Surface Science, 256(14), 4411-4416
Dubal, D. P., Gund, G. S., Holze, R., Jadhav, H. S., Lokhande, C. D., & Park, C.-J.
(2013). Solution-based binder-free synthetic approach of RuO2 thin films for
all solid state supercapacitors. Electrochimica Acta, 103, 103-109
Dubal, D. P., Jagadale, A. D., Patil, S. V., & Lokhande, C. D. (2012). Simple route
for the synthesis of supercapacitive Co–Ni mixed hydroxide thin films.
Materials Research Bulletin, 47(5), 1239-1245
El-Kady, M. F., & Kaner, R. B. (2013). Scalable fabrication of high-power graphene
micro-supercapacitors for flexible and on-chip energy storage. Nat Commun,
4, 1475
Engstrom, A. M., & Doyle, F. M. (2013). Exploring the cycle behavior of
electrodeposited vanadium oxide electrochemical capacitor electrodes in
various aqueous environments. Journal of Power Sources, 228, 120-131
145
Feng, L., Zhu, Y., Ding, H., & Ni, C. (2014). Recent progress in nickel based
materials for high performance pseudocapacitor electrodes. Journal of
Power Sources, 267, 430-444
Frackowiak, E., Jurewicz, K., Delpeux, S., & Béguin, F. (2001). Nanotubular
materials for supercapacitors. Journal of Power Sources, 97–98, 822-825
Frackowiak, E., Metenier, K., Bertagna, V., & Beguin, F. (2000). Supercapacitor
electrodes from multiwalled carbon nanotubes. Applied Physics Letters,
77(15), 2421-2423
Geim, A. K., & Novoselov, K. S. (2007). The rise of graphene. Nat Mater, 6(3),
183-191
Ghodbane, O., Pascal, J.-L., & Favier, F. (2009). Microstructural Effects on Charge-
Storage Properties in MnO2-Based Electrochemical Supercapacitors. ACS
Applied Materials & Interfaces, 1(5), 1130-1139
Girija, T. C., & Sangaranarayanan, M. V. (2006). Analysis of polyaniline-based
nickel electrodes for electrochemical supercapacitors. Journal of Power
Sources, 156(2), 705-711
Han, Z. J., Seo, D. H., Yick, S., Chen, J. H., & Ostrikov, K. (2014). MnOx/carbon
nanotube/reduced graphene oxide nanohybrids as high-performance
supercapacitor electrodes. NPG Asia Mater, 6, e140
Hasa, I., Buchholz, D., Passerini, S., & Hassoun, J. (2015). A Comparative Study of
Layered Transition Metal Oxide Cathodes for Application in Sodium-Ion
Battery. ACS Applied Materials & Interfaces, 7(9), 5206-5212
Ho, C.-L., & Wu, M.-S. (2011). Manganese Oxide Nanowires Grown on Ordered
Macroporous Conductive Nickel Scaffold for High-Performance
Supercapacitors. The Journal of Physical Chemistry C, 115(44), 22068-
22074
Hotovy, I., Huran, J., Spiess, L., Romanus, H., Buc, D., & Kosiba, R. (2006). NiO-
based nanostructured thin films with Pt surface modification for gas
detection. Thin Solid Films, 515(2), 658-661
Hsu, H.-Y., Chang, K.-H., Salunkhe, R. R., Hsu, C.-T., & Hu, C.-C. (2013).
Synthesis and characterization of mesoporous Ni–Co oxy-hydroxides for
pseudocapacitor application. Electrochimica Acta, 94, 104-112
Hu, C.-C., Hung, C.-Y., Chang, K.-H., & Yang, Y.-L. (2011a). A hierarchical
nanostructure consisting of amorphous MnO2, Mn3O4 nanocrystallites, and
single-crystalline MnOOH nanowires for supercapacitors. Journal of Power
Sources, 196(2), 847-850
Hu, C. C., & Chu, C. (2001). Electrochemical impedance characterization of
polyaniline-coated graphite electrodes for electrochemical capacitors -
146
effects of film coverage/thickness and anions. Journal of Electroanalytical
Chemistry, 503(1), 105-116
Hu, L., Chen, W., Xie, X., Liu, N., Yang, Y., Wu, H., Yao, Y., Pasta, M., Alshareef
H. N., Cui, Y. (2011b). Symmetrical MnO2–Carbon Nanotube–Textile
Nanostructures for Wearable Pseudocapacitors with High Mass Loading.
ACS Nano, 5(11), 8904-8913
Hughes, M., Chen, G. Z., Shaffer, M. S. P., Fray, D. J., & Windle, A. H. (2002).
Electrochemical Capacitance of a Nanoporous Composite of Carbon
Nanotubes and Polypyrrole. Chemistry of Materials, 14(4), 1610-1613
Hung, C. J., Lin, P., & Tseng, T. Y. (2013). Electrophoretic fabrication and
pseudocapacitive properties of graphene/manganese oxide/carbon nanotube
nanocomposites. Journal of Power Sources, 243, 594-602
Hwang, B. J., Santhanam, R., & Lin, Y. L. (2000). Nucleation and Growth
Mechanism of Electropolymerization of Polypyrrole on Gold/Highly
Oriented Pyrolytic Graphite Electrode. Journal of the Electrochemical
Society, 147(6), 2252-2257
Inamdar, A. I., Kim, Y., Pawar, S. M., Kim, J. H., Im, H., & Kim, H. (2011).
Chemically grown, porous, nickel oxide thin-film for electrochemical
supercapacitors. Journal of Power Sources, 196(4), 2393-2397
Jagadale, A. D., Kumbhar, V. S., & Lokhande, C. D. (2013). Supercapacitive
activities of potentiodynamically deposited nanoflakes of cobalt oxide
(Co3O4) thin film electrode. Journal of Colloid and Interface Science, 406,
225-230
Jena, A., Munichandraiah, N., & Shivashankar, S. A. (2013). Carbonaceous nickel
oxide nano-composites: As electrode materials in electrochemical capacitor
applications. Journal of Power Sources, 237, 156-166
Jiang, R., Huang, T., Liu, J., Zhuang, J., & Yu, A. (2009). A novel method to prepare
nanostructured manganese dioxide and its electrochemical properties as a
supercapacitor electrode. Electrochimica Acta, 54(11), 3047-3052
Kim, H., & Popov, B. N. (2003). Synthesis and Characterization of MnO2-Based
Mixed Oxides as Supercapacitors. Journal of the Electrochemical Society,
150(3), D56-D62
Kim, M., Hwang, Y., & Kim, J. (2013a). Graphene/MnO2-based composites
reduced via different chemical agents for supercapacitors. Journal of Power
Sources, 239, 225-233
Kim, M., Yoo, M., Yoo, Y., & Kim, J. (2014). Capacitance behavior of composites
for supercapacitor applications prepared with different durations of
graphene/nanoneedle MnO2 reduction. Microelectronics Reliability, 54(3),
587-594
147
Kim, S.-I., Lee, J.-S., Ahn, H.-J., Song, H.-K., & Jang, J.-H. (2013b). Facile Route
to an Efficient NiO Supercapacitor with a Three-Dimensional Nanonetwork
Morphology. ACS Applied Materials & Interfaces, 5(5), 1596-1603
Kim, Y.-T., Tadai, K., & Mitani, T. (2005). Highly dispersed ruthenium oxide
nanoparticles on carboxylated carbon nanotubes for supercapacitor electrode
materials. Journal of Materials Chemistry, 15(46), 4914-4921
Kötz, R., & Carlen, M. (2000). Principles and applications of electrochemical
capacitors. Electrochimica Acta, 45(15–16), 2483-2498
Kulkarni, S. B., Jagadale, A. D., Kumbhar, V. S., Bulakhe, R. N., Joshi, S. S., &
Lokhande, C. D. (2013). Potentiodynamic deposition of composition
influenced Co1−xNix LDHs thin film electrode for redox supercapacitors.
International Journal of Hydrogen Energy, 38(10), 4046-4053
Leng, Y. (2008). Materials characterization: Introduction to microscopic and
spectroscopic methods. Willey: Singapore
Li, D., Muller, M. B., Gilje, S., Kaner, R. B., & Wallace, G. G. (2008). Processable
aqueous dispersions o f graphene nanosheets. Nat Nano, 3(2), 101-105
Li, H., Wang, J., Chu, Q., Wang, Z., Zhang, F., & Wang, S. (2009). Theoretical and
experimental specific capacitance of polyaniline in sulfuric acid. Journal of
Power Sources, 190(2), 578-586
Li, H., Zhu, S., Xi, H. a., & Wang, R. (2006). Nickel oxide nanocrystallites within
the wall of ordered mesoporous carbon CMK-3: Synthesis and
characterization. Microporous and Mesoporous Materials, 89(1–3), 196-
203
Li, J., Yang, Q. M., & Zhitomirsky, I. (2008). Nickel foam-based manganese
dioxide–carbon nanotube composite electrodes for electrochemical
supercapacitors. Journal of Power Sources, 185(2), 1569-1574
Li, L., Zhang, Y., Shi, F., Zhang, Y., Zhang, J., Gu, C., Wang, X., Tu, J. (2014a).
Spinel Manganese–Nickel–Cobalt Ternary Oxide Nanowire Array for High-
Performance Electrochemical Capacitor Applications. ACS Applied
Materials & Interfaces, 6(20), 18040-18047
Li, M., Bo, X., Mu, Z., Zhang, Y., & Guo, L. (2014b). Electrodeposition of nickel
oxide and platinum nanoparticles on electrochemically reduced graphene
oxide film as a nonenzymatic glucose sensor. Sensors and Actuators B:
Chemical, 192, 261-268
Li, Q.-Y., Li, Z.-S., Lin, L., Wang, X. Y., Wang, Y.-F., Zhang, C.-H., & Wang, H.-
Q. (2010). Facile synthesis of activated carbon/carbon nanotubes compound
for supercapacitor application. Chemical Engineering Journal, 156(2), 500-
504
148
Li, S.-H., Liu, Q.-H., Qi, L., Lu, L.-H., & Wang, H.-Y. (2012a). Progress in
Research on Manganese Dioxide Electrode Materials for Electrochemical
Capacitors. Chinese Journal of Analytical Chemistry, 40(3), 339-346
Li, S.-M., Wang, Y.-S., Yang, S.-Y., Liu, C.-H., Chang, K.-H., Tien, H.-W., Wen,
N.-T., Ma, C.-C., Hu, C.-C. (2013). Electrochemical deposition of
nanostructured manganese oxide on hierarchically porous graphene–carbon
nanotube structure for ultrahigh-performance electrochemical capacitors.
Journal of Power Sources, 225, 347-355
Li, X., Xu, X., Xia, F., Bu, L., Qiu, H., Chen, M., Zhang, L., Gao, J. (2014c).
Electrochemically active MnO2/RGO nanocomposites using Mn powder as
the reducing agent of GO and the MnO2 precursor. Electrochimica Acta, 130,
305-313
Li, Y., Diao, P., Jin, T., Sun, J., & Xu, D. (2012b). Shape-controlled
electrodeposition of standing Rh nanoplates on indium tin oxide substrates
and their electrocatalytic activity toward formic acid oxidation.
Electrochimica Acta, 83, 146-154
Li, Y., Xie, H., Wang, J., & Chen, L. (2011). Preparation and electrochemical
performances of α-MnO2 nanorod for supercapacitor. Materials Letters,
65(2), 403-405
Li, Z., Liu, Z., Li, B., Li, D., Li, Q., & Wang, H. (2014d). MnO2 nanosilks self-
assembled micropowders: Facile one-step hydrothermal synthesis and their
application as supercapacitor electrodes. Journal of the Taiwan Institute of
Chemical Engineers, 45(6), 2995-2999
Lin, H.-K., Chiu, H.-C., Tsai, H.-C., Chien, S.-H., & Wang, C.-B. (2003). Synthesis,
Characterization and Catalytic Oxidation of Carbon Monoxide over Cobalt
Oxide. Catalysis Letters, 88(3-4), 169-174
Liu, E.-H., Li, W., Li, J., Meng, X.-Y., Ding, R., & Tan, S.-T. (2009). Preparation
and characterization of nanostructured NiO/MnO2 composite electrode for
electrochemical supercapacitors. Materials Research Bulletin, 44(5), 1122-
1126
Liu, N., Shen, J., & Liu, D. (2013). Activated high specific surface area carbon
aerogels for EDLCs. Microporous and Mesoporous Materials, 167, 176-181
Liu, Y., Yan, D., Li, Y., Wu, Z., Zhuo, R., Li, S., Feng, J., Wang, J., Yan, P., Geng,
Z. (2014). Manganese dioxide nanosheet arrays grown on graphene oxide as
an advanced electrode material for supercapacitors. Electrochimica Acta,
117, 528-533
Liu, Y., Zhang, M., Zhang, J., & Qian, Y. (2006). A simple method of fabricating
large-area α-MnO2 nanowires and nanorods. Journal of Solid State
Chemistry, 179(6), 1757-1761
149
Lu, X., Yu, M., Wang, G., Tong, Y., & Li, Y. (2014). Flexible solid-state
supercapacitors: design, fabrication and applications. Energy &
Environmental Science, 7(7), 2160-2181
Mai, L.-Q., Yang, F., Zhao, Y.-L., Xu, X., Xu, L., & Luo, Y.-Z. (2011). Hierarchical
MnMoO4/CoMoO4 heterostructured nanowires with enhanced
supercapacitor performance. Nat Commun, 2, 381
Moradi Golsheikh, A., Huang, N. M., Lim, H. N., Zakaria, R., & Yin, C.-Y. (2013).
One-step electrodeposition synthesis of silver-nanoparticle-decorated
graphene on indium-tin-oxide for enzymeless hydrogen peroxide detection.
Carbon, 62, 405-412
Moses Ezhil Raj, A., Victoria, S. G., Jothy, V. B., Ravidhas, C., Wollschläger, J.,
Suendorf, M., Neumann, M., Jayachandran, M., Sanjeeviraja, C. (2010).
XRD and XPS characterization of mixed valence Mn3O4 hausmannite thin
films prepared by chemical spray pyrolysis technique. Applied Surface
Science, 256(9), 2920-2926
Nithya, V. D., Kalai Selvan, R., Kalpana, D., Vasylechko, L., & Sanjeeviraja, C.
(2013). Synthesis of Bi2WO6 nanoparticles and its electrochemical
properties in different electrolytes for pseudocapacitor electrodes.
Electrochimica Acta, 109, 720-731
Niu, L., Wang, J., Hong, W., Sun, J., Fan, Z., Ye, X., Wang, H., Yang, S. (2014).
Solvothermal Synthesis of Ni/Reduced Graphene Oxide Composites as
Electrode Material for Supercapacitors. Electrochimica Acta, 123, 560-568
Nouzu, N., Ashida, A., Yoshimura, T., & Fujimura, N. (2010). Control of cathodic
potential for deposition of ZnO by constant-current electrochemical method.
Thin Solid Films, 518(11), 2957-2960
Obreja, V. V. N. (2008). On the performance of supercapacitors with electrodes
based on carbon nanotubes and carbon activated material—A review.
Physica E: Low-dimensional Systems and Nanostructures, 40(7), 2596-2605
Pang, S. C., Anderson, M. A., & Chapman, T. W. (2000). Novel electrode materials
for thin-film ultracapacitors: comparison of electrochemical properties of
sol-gel-derived and electrodeposited manganese dioxide. Journal of the
Electrochemical Society, 147(2), 444-450
Park, B.-H., & Choi, J.-H. (2010). Improvement in the capacitance of a carbon
electrode prepared using water-soluble polymer binder for a capacitive
deionization application. Electrochimica Acta, 55(8), 2888-2893
Pauporté, T., Goux, A., Kahn-Harari, A., de Tacconi, N., Chenthamarakshan, C. R.,
Rajeshwar, K., & Lincot, D. (2003). Cathodic electrodeposition of mixed
oxide thin films. Journal of Physics and Chemistry of Solids, 64(9–10),
1737-1742
150
Prasad, K. P. S., Dhawale, D. S., Joseph, S., Anand, C., Wahab, M. A., Mano, A.,
Sathish, C. I., Balasubramaniam, V. V., Sivakumar, T., Vinu, A. (2013).
Post-synthetic functionalization of mesoporous carbon electrodes with
copper oxide nanoparticles for supercapacitor application. Microporous and
Mesoporous Materials, 172, 77-86
Pu, J., Wang, J., Jin, X., Cui, F., Sheng, E., & Wang, Z. (2013). Porous hexagonal
NiCo2O4 nanoplates as electrode materials for supercapacitors.
Electrochimica Acta, 106, 226-234
Rajendra Prasad, K., & Miura, N. (2004). Electrochemically synthesized MnO2-
based mixed oxides for high performance redox supercapacitors.
Electrochemistry Communications, 6(10), 1004-1008
Ramesh, T. N., & Kamath, P. V. (2008). Nickel oxyhydroxide/manganese dioxide
composite as a candidate electrode material for alkaline secondary cells.
Journal of Power Sources, 175(1), 625-629
Ramya, R., Sivasubramanian, R., & Sangaranarayanan, M. V. (2013). Conducting
polymers-based electrochemical supercapacitors—Progress and prospects.
Electrochimica Acta, 101, 109-129
Reddy, R. N., & Reddy, R. G. (2003). Sol–gel MnO2 as an electrode material for
electrochemical capacitors. Journal of Power Sources, 124(1), 330-337
Rudge, A., Raistrick, I., Gottesfeld, S., & Ferraris, J. P. (1994). A study of the
electrochemical properties of conducting polymers for application in
electrochemical capacitors. Electrochimica Acta, 39(2), 273-287
Rusi, & Majid, S. R. Electrodeposited Mn3O4-NiO-Co3O4 as a composite electrode
material for electrochemical capacitor. Electrochimica Acta(0)
Rusi, & Majid, S. R. (2013). Synthesis of MnO2 particles under slow cooling process
and their capacitive performances. Materials Letters, 108, 69-71
Rusi, & Majid, S. R. (2014a). Controllable synthesis of flowerlike α-MnO2 as
electrode for pseudocapacitor application. Solid State Ionics, 262, 220-225
Rusi, & Majid, S. R. (2014b). High performance super-capacitive behaviour of
deposited manganese oxide/nickel oxide binary electrode system.
Electrochimica Acta, 138, 1-8
Sadezky, A., Muckenhuber, H., Grothe, H., Niessner, R., & Pöschl, U. (2005).
Raman microspectroscopy of soot and related carbonaceous materials:
Spectral analysis and structural information. Carbon, 43(8), 1731-1742
Sawangphruk, M., Srimuk, P., Chiochan, P., Krittayavathananon, A., Luanwuthi, S.,
& Limtrakul, J. (2013). High-performance supercapacitor of manganese
oxide/reduced graphene oxide nanocomposite coated on flexible carbon
fiber paper. Carbon, 60, 109-116
151
Shen, L., Yu, L., Wu, H. B., Yu, X.-Y., Zhang, X., & Lou, X. W. (2015). Formation
of nickel cobalt sulfide ball-in-ball hollow spheres with enhanced
electrochemical pseudocapacitive properties. Nat Commun, 6
Shirale, D. J., Gade, V. K., Gaikwad, P. D., Kharat, H. J., Kakde, K. P., Savale, P.
A., Hussaini, S. S., Dhumane, N. R., Shirsat, M. D. (2006). The influence of
electrochemical process parameters on the conductivity of poly(N-
methylpyrrole) films by galvanostatic method. Materials Letters, 60(11),
1407-1411
Shown, I., Ganguly, A., Chen, L.-C., & Chen, K.-H. (2015). Conducting polymer-
based flexible supercapacitor. Energy Science & Engineering, 3(1), 2-26
Simon, P., & Gogotsi, Y. (2008). Materials for electrochemical capacitors. Nat
Mater, 7(11), 845-854
Snook, G. A., Kao, P., & Best, A. S. (2011). Conducting-polymer-based
supercapacitor devices and electrodes. Journal of Power Sources, 196(1), 1-
12
Su, L.-H., Zhang, X.-G., Mi, C.-H., Gao, B., & Liu, Y. (2009). Improvement of the
capacitive performances for Co-Al layered double hydroxide by adding
hexacyanoferrate into the electrolyte. Physical Chemistry Chemical Physics,
11(13), 2195-2202
Su, X., Yu, L., Cheng, G., Zhang, H., Sun, M., & Zhang, X. (2015). High-
performance α-MnO2 nanowire electrode for supercapacitors. Applied
Energy, 153, 94-100
Sugimoto, W., Iwata, H., Yokoshima, K., Murakami, Y., & Takasu, Y. (2005).
Proton and Electron Conductivity in Hydrous Ruthenium Oxides Evaluated
by Electrochemical Impedance Spectroscopy: The Origin of Large
Capacitance. The Journal of Physical Chemistry B, 109(15), 7330-7338
Sun, Z., Liao, T., Dou, Y., Hwang, S. M., Park, M.-S., Jiang, L., Kim, J. H., Dou, S.
X. (2014). Generalized self-assembly of scalable two-dimensional transition
metal oxide nanosheets. Nat Commun, 5
Takahashi, K., Wang, Y., & Cao, G. (2005). Ni−V2O5·nH2O Core−Shell Nanocable
Arrays for Enhanced Electrochemical Intercalation. The Journal of Physical
Chemistry B, 109(1), 48-51
Tsai, W.-Y., Lin, R., Murali, S., Li Zhang, L., McDonough, J. K., Ruoff, R. S.,
Taberna, P. L., Gogotsi, Y., Simon, P. (2013). Outstanding performance of
activated graphene based supercapacitors in ionic liquid electrolyte from −50
to 80 °C. Nano Energy, 2(3), 403-411
Vijayakumar, S., Nagamuthu, S., & Muralidharan, G. (2013). Porous NiO/C
Nanocomposites as Electrode Material for Electrochemical Supercapacitors.
ACS Sustainable Chemistry & Engineering, 1(9), 1110-1118
152
Wang, B., Park, J., Wang, C., Ahn, H., & Wang, G. (2010a). Mn3O4 nanoparticles
embedded into graphene nanosheets: Preparation, characterization, and
electrochemical properties for supercapacitors. Electrochimica Acta, 55(22),
6812-6817
Wang, G., Liu, L., Zhang, L., & Zhang, J. (2013). Nickel, cobalt, and manganese
oxide composite as an electrode material for electrochemical
supercapacitors. Ionics, 19(4), 689-695
Wang, G., Zhang, L., & Zhang, J. (2012a). A review of electrode materials for
electrochemical supercapacitors. Chemical Society Reviews, 41(2), 797-828
Wang, H., Gao, Q., & Hu, J. (2010b). Asymmetric capacitor based on superior
porous Ni–Zn–Co oxide/hydroxide and carbon electrodes. Journal of Power
Sources, 195(9), 3017-3024
Wang, J.-G., Kang, F., & Wei, B. (2015). Engineering of MnO2-based
nanocomposites for high-performance supercapacitors. Progress in
Materials Science, 74, 51-124
Wang, L., Zheng, Y., Chen, S., Ye, Y., Xu, F., Tan, H., Li, Z., Hou, H., Song, Y.
(2014). Three-Dimensional Kenaf Stem-Derived Porous Carbon/MnO2 for
High-Performance Supercapacitors. Electrochimica Acta, 135, 380-387
Wang, M., Tan, W., Feng, X., Koopal, L. K., Liu, M., & Liu, F. (2012b). One-step
synthesis of sea urchin-like α-MnO2 using KIO4 as the oxidant and its
oxidation of arsenite. Materials Letters, 77, 60-62
Wang, X., Wang, X., Huang, W., Sebastian, P. J., & Gamboa, S. (2005). Sol–gel
template synthesis of highly ordered MnO2 nanowire arrays. Journal of
Power Sources, 140(1), 211-215
Wang, X., Yu, L., Wu, X.-L., Yuan, F., Guo, Y.-G., Ma, Y., & Yao, J. (2009).
Synthesis of Single-Crystalline Co3O4 Octahedral Cages with Tunable
Surface Aperture and Their Lithium Storage Properties. The Journal of
Physical Chemistry C, 113(35), 15553-15558
Wang, Y., Shi, J.-C., Cao, J.-L., Sun, G., & Zhang, Z.-Y. (2011). Synthesis of Co3O4
nanoparticles via the CTAB-assisted method. Materials Letters, 65(2), 222-
224
Wei, D., Scherer, M. R. J., Bower, C., Andrew, P., Ryhänen, T., & Steiner, U.
(2012). A Nanostructured Electrochromic Supercapacitor. Nano Letters,
12(4), 1857-1862
Wei, W., Cui, X., Chen, W., & Ivey, D. G. (2011). Manganese oxide-based materials
as electrochemical supercapacitor electrodes. Chemical Society Reviews,
40(3), 1697-1721
Wintterlin, J., & Bocquet, M. L. (2009). Graphene on metal surfaces. Surface
Science, 603(10–12), 1841-1852
153
Wu, C.-H., Ma, J.-S., & Lu, C.-H. (2012). Synthesis and characterization of nickel–
manganese oxide via the hydrothermal route for electrochemical capacitors.
Current Applied Physics, 12(4), 1190-1194
Wu, M.-S., Huang, Y.-A., Jow, J.-J., Yang, W.-D., Hsieh, C.-Y., & Tsai, H.-M.
(2008a). Anodically potentiostatic deposition of flaky nickel oxide
nanostructures and their electrochemical performances. International
Journal of Hydrogen Energy, 33(12), 2921-2926
Wu, M.-S., Huang, Y.-A., Yang, C.-H., & Jow, J.-J. (2007). Electrodeposition of
nanoporous nickel oxide film for electrochemical capacitors. International
Journal of Hydrogen Energy, 32(17), 4153-4159
Wu, M.-S., Yang, C.-H., & Wang, M.-J. (2008b). Morphological and structural
studies of nanoporous nickel oxide films fabricated by anodic
electrochemical deposition techniques. Electrochimica Acta, 54(2), 155-161
Xiong, G., Hembram, K. P. S. S., Reifenberger, R. G., & Fisher, T. S. (2013). MnO2-
coated graphitic petals for supercapacitor electrodes. Journal of Power
Sources, 227, 254-259
Xue, W. J., Wang, Y. F., Li, P., Liu, Z.-T., Hao, Z. P., & Ma, C. Y. (2011).
Morphology effects of Co3O4 on the catalytic activity of Au/Co3O4 catalysts
for complete oxidation of trace ethylene. Catalysis Communications, 12(13),
1265-1268
Yamaoka, S., Shaji Kumar, M. D., Kanda, H., & Akaishi, M. (2002). Thermal
decomposition of glucose and diamond formation under diamond-stable
high pressure–high temperature conditions. Diamond and Related Materials,
11(1), 118-124
Yan, D., & Cui, W. (1999). Preparation and properties of no-binder electrode Ni/MH
battery. Journal of Alloys and Compounds, 293–295, 780-783
Yan, J., Fan, Z., Wei, T., Qian, W., Zhang, M., & Wei, F. (2010). Fast and reversible
surface redox reaction of graphene–MnO2 composites as supercapacitor
electrodes. Carbon, 48(13), 3825-3833
Yang, Q., Li, Q., Yan, Z., Hu, X., Kang, L., Lei, Z., & Liu, Z.-H. (2014a). High
performance graphene/manganese oxide hybrid electrode with flexible holey
structure. Electrochimica Acta, 129, 237-244
Yang, W., Gao, Z., Song, N., Zhang, Y., Yang, Y., & Wang, J. (2014b). Synthesis
of hollow polyaniline nano-capsules and their supercapacitor application.
Journal of Power Sources, 272, 915-921
Yang, W., Gao, Z., Wang, J., Wang, B., Liu, Q., Li, Z., Mann, T., Yang, P., Zhang,
M., Liu, L. (2012). Synthesis of reduced graphene nanosheet/urchin-like
manganese dioxide composite and high performance as supercapacitor
electrode. Electrochimica Acta, 69, 112-119
154
Yousefi, T., Golikand, A. N., Mashhadizadeh, M. H., & Aghazadeh, M. (2012).
Template-free synthesis of MnO2 nanowires with secondary flower like
structure: Characterization and supercapacitor behavior studies. Current
Applied Physics, 12(1), 193-198
Yu, G., Xie, X., Pan, L., Bao, Z., & Cui, Y. (2013). Hybrid nanostructured materials
for high-performance electrochemical capacitors. Nano Energy, 2(2), 213-
234
Yuan, L., Lu, X.-H., Xiao, X., Zhai, T., Dai, J., Zhang, F., Hu, B., Wang, X., Gong,
L., Chen, J., Hu, C., Tong, Y., Zhou, J., Wang, Z. L. (2012). Flexible Solid-
State Supercapacitors Based on Carbon Nanoparticles/MnO2 Nanorods
Hybrid Structure. ACS Nano, 6(1), 656-661
Yuan, Y. F., Xia, X. H., Wu, J. B., Gui, J. S., Chen, Y. B., & Guo, S. Y. (2010).
Electrochromism in mesoporous nanowall cobalt oxide thin films prepared
via lyotropic liquid crystal media with electrodeposition. Journal of
Membrane Science, 364(1–2), 298-303
Yuan, Y. F., Xia, X. H., Wu, J. B., Yang, J. L., Chen, Y. B., & Guo, S. Y. (2011).
Nickel foam-supported porous Ni(OH)2/NiOOH composite film as advanced
pseudocapacitor material. Electrochimica Acta, 56(6), 2627-2632
Zeng, W., Miao, B., Lin, L.-y., & Xie, J.-y. (2012). Facile synthesis of NiO
nanowires and their gas sensing performance. Transactions of Nonferrous
Metals Society of China, 22, Supplement 1, s100-s104
Zhang, J., Jiang, J., & Zhao, X. S. (2011). Synthesis and Capacitive Properties of
Manganese Oxide Nanosheets Dispersed on Functionalized Graphene
Sheets. The Journal of Physical Chemistry C, 115(14), 6448-6454
Zhang, J., Wang, X., Ma, J., Liu, S., & Yi, X. (2013a). Preparation of cobalt
hydroxide nanosheets on carbon nanotubes/carbon paper conductive
substrate for supercapacitor application. Electrochimica Acta, 104, 110-116
Zhang, L. L., & Zhao, X. S. (2009). Carbon-based materials as supercapacitor
electrodes. Chemical Society Reviews, 38(9), 2520-2531
Zhang, M., Guo, S., Zheng, L., Zhang, G., Hao, Z., Kang, L., & Liu, Z.-H. (2013b).
Preparation of NiMn2O4 with large specific surface area from an epoxide-
driven sol−gel process and its capacitance. Electrochimica Acta, 87, 546-
553
Zhang, M., Xie, J., Sun, Q., Yan, Z., Chen, M., Jing, J., & Hossain, A. M. S. (2013c).
In situ synthesis of palladium nanoparticle on functionalized graphene sheets
at improved performance for ethanol oxidation in alkaline media.
Electrochimica Acta, 111, 855-861
Zhang, X., Ji, L., Zhang, S., & Yang, W. (2007). Synthesis of a novel polyaniline-
intercalated layered manganese oxide nanocomposite as electrode material
for electrochemical capacitor. Journal of Power Sources, 173(2), 1017-1023
155
Zhang, Y.-Z., Zhao, J., Xia, J., Wang, L., Lai, W.-Y., Pang, H., & Huang, W. (2015).
Room temperature synthesis of cobalt-manganese-nickel oxalates
micropolyhedrons for high-performance flexible electrochemical energy
storage device. Scientific Reports, 5, 8536
Zhang, Y., Feng, H., Wu, X., Wang, L., Zhang, A., Xia, T., Dong, H., Li, X., Zhang,
L. (2009). Progress of electrochemical capacitor electrode materials: A
review. International Journal of Hydrogen Energy, 34(11), 4889-4899
Zhang, Y., Li, J., Kang, F., Gao, F., & Wang, X. (2012a). Fabrication and
electrochemical characterization of two-dimensional ordered nanoporous
manganese oxide for supercapacitor applications. International Journal of
Hydrogen Energy, 37(1), 860-866
Zhang, Y., Yang, Y., Zhang, Y., Zhang, T., & Ye, M. (2012b). Heterogeneous
oxidation of naproxen in the presence of α-MnO2 nanostructures with
different morphologies. Applied Catalysis B: Environmental, 127, 182-189
Zhang, Y. X., Huang, M., Li, F., Wang, X. L., & Wen, Z. Q. (2014). One-pot
synthesis of hierarchical MnO2-modified diatomites for electrochemical
capacitor electrodes. Journal of Power Sources, 246, 449-456
Zhao, C., Zheng, W., Wang, X., Zhang, H., Cui, X., & Wang, H. (2013). Ultrahigh
capacitive performance from both Co(OH)2/graphene electrode and
K3Fe(CN)6 electrolyte. Scientific Reports, 3, 2986
Zhao, S., Liu, T., Hou, D., Zeng, W., Miao, B., Hussain, S., Pheng, X., Javed, M. S.
(2015a). Controlled synthesis of hierarchical birnessite-type MnO2
nanoflowers for supercapacitor applications. Applied Surface Science, 356,
259-265
Zhao, S., Liu, T., Shi, D., Zhang, Y., Zeng, W., Li, T., & Miao, B. (2015b).
Hydrothermal synthesis of urchin-like MnO2 nanostructures and its
electrochemical character for supercapacitor. Applied Surface Science, 351,
862-868
Zhou, W.-J., Xu, M.-W., Zhao, D.-D., Xu, C.-L., & Li, H.-L. (2009).
Electrodeposition and characterization of ordered mesoporous cobalt
hydroxide films on different substrates for supercapacitors. Microporous
and Mesoporous Materials, 117(1–2), 55-60
Zhu, Y., Li, L., Zhang, C., Casillas, G., Sun, Z., Yan, Z., Ruan, G., Pheng, Z., Raji,
R. J. O., Kittrel, C., Hauge, R. H., Tour, J. M. (2012). A seamless three-
dimensional carbon nanotube graphene hybrid material. Nat Commun, 3,
1225