manipulating the abundance of natural enemies in ornamental landscapes ... et al 2005.pdf ·...
TRANSCRIPT
www.elsevier.com/locate/ybcon
Biological Control 33 (2005) 203–216
Manipulating the abundance of natural enemiesin ornamental landscapes with floral resource plants
Eric J. Rebek a,*, Clifford S. Sadof a, Lawrence M. Hanks b
a Department of Entomology, Purdue University, 901 W. State Street, West Lafayette, IN 47907, USAb Department of Entomology, University of Illinois at Urbana-Champaign, 320 Morrill Hall, 505 S. Goodwin Ave., Urbana, IL 61801, USA
Received 5 November 2004; accepted 20 February 2005Available online 23 March 2005
Abstract
We manipulated densities of floral resource plants to test the hypothesis that natural enemies would be more abundant in arti-ficial ornamental landscapes that contained high densities of floral resource plants than in landscapes without these plants. Weestablished an experimental landscape consisting of 3 · 3 m plots that contained a central bed of Euonymus fortunei (Turcz.) andeither a low or high density of four species of perennial flowering plants, or no flowering plants. The cultivars of perennials, Trifo-lium repens L., Euphorbia epithymoides L., Coreopsis verticillata L. var. �Moonbeam,� and Solidago canadensis L. var. �Golden Baby,�were chosen because their staggered bloom periods would provide nectar and pollen for natural enemies throughout the summermonths. We used yellow sticky cards and a vacuum sampler to collect arthropods from experimental plots in 2000 to 2003. Naturalenemies in general, and spiders and parasitic wasps specifically, were usually most abundant in euonymus beds surrounded by flow-ering plants. The number of parasitic wasps and total natural enemies on sticky cards was positively correlated with biomass of E.epithymoides within plots, and that of all flowering plants combined. Removal of inflorescences from plants in a subset of study plotsdid not affect patterns of natural enemy abundance or dispersion of natural enemies within the landscape, suggesting that vegetativecharacteristics of plants, rather than flowers, influenced the abundance of natural enemies. We conclude from these findings that thepresence of floral resource plants in landscapes enhances the abundance of natural enemies.� 2005 Elsevier Inc. All rights reserved.
Keywords: Conservation biological control; Habitat manipulation; Euonymus fortunei; Trifolium repens; Euphorbia epithymoides; Coreopsis
verticillata; Solidago canadensis
1. Introduction
Conservation biological control encourages naturalenemies to suppress target pests through manipulationof environmental factors that influence natural enemysurvival and effectiveness, including microclimate, avail-ability of food for adults and alternative prey, and shel-ter from adverse environmental conditions (Ehler, 1998;Landis et al., 2000; Rabb et al., 1976). Floral nectar andpollen also are highly attractive to a diversity of preda-
1049-9644/$ - see front matter � 2005 Elsevier Inc. All rights reserved.
doi:10.1016/j.biocontrol.2005.02.011
* Corresponding author. Present address: Department of Entomol-ogy, Michigan State University, East Lansing, MI 48824, USA. Fax:+1 517 353 4354.
E-mail address: [email protected] (E.J. Rebek).
ceous insects such as syrphids (Carreck and Williams,1997; Hickman and Wratten, 1996; White et al., 1995),coccinellids (Freeman Long et al., 1998; Nalepa et al.,1992; Pemberton and Vandenberg, 1993), and lacewings(Freeman Long et al., 1998). Some flowering plant spe-cies also are highly attractive to parasitic wasps (Bugg etal., 1989; Carreck and Williams, 1997; Jervis et al., 1993;Leius, 1960; Shahjahan, 1974; Tooker and Hanks,2000a; Wackers, 2004), and can enhance parasitismrates of herbivorous pests (Leius, 1967). Parasitoidsmay visit flowers to obtain nectar and/or pollen, whichcontain essential nutrients that can improve the survivaland/or fecundity of adult wasps (Foster and Ruesink,1984; Hougardy and Gregoire, 2000; Idris and Grafius,1995, 1997; Leius, 1963; Shahjahan, 1974; Syme, 1975).

204 E.J. Rebek et al. / Biological Control 33 (2005) 203–216
Although incorporation of flowering plants into agro-ecosystems can enhance natural enemy populations(Hickman and Wratten, 1996; Patt et al., 1997a; Whiteet al., 1995), it may fail to promote biological controlof the target pest if flowering does not coincide withthe activity period of key natural enemies (Bowie etal., 1995), if corolla structure hinders feeding by adultnatural enemies (Patt et al., 1997b), or if natural enemiesdo not move from flowering plants to crop plants (Big-ger and Chaney, 1998; Freeman Long et al., 1998).
Although much attention has been given to the ben-eficial effects of floral resource plants on natural enemiesin agroecosystems (e.g., Altieri and Whitcomb, 1979;Cowgill et al., 1995; Idris and Grafius, 1995; Zhaoet al., 1992), conservation biological control also holdspromise for managing pests in urban landscapes. Urbanlandscapes are often poor quality habitats for naturalenemies when they consist of matrices of pavementand turf, devoid of resources that are required by natu-ral enemies, and are subject to high temperatures, pollu-tion, dust, and pesticides (Dreistadt et al., 1990; Hanksand Denno, 1993; Luck and Dahlsten, 1975; Sperryet al., 2001). Despite these problems, natural enemiescan be favored in urban landscapes by simply increasingthe diversity of plant species. A review by Barbosa andBenrey (1998) revealed plant architecture and diversitycan influence abundance and diversity of parasitoids.For example, Shrewsbury and Raupp (2000) suggestedthat rates of predation of azalea lace bug were greaterin habitats in which plant communities were taxonomi-cally and structurally diverse. Hanks and Denno (1993)found that densities of generalist natural enemies of ascale insect, and predation rates, were greater on hosttrees in more diverse woodlots than on trees in isolatedlocations. Higher rates of predation in more diverse hab-itats resulted in lower densities of scales (Hanks andDenno, 1993). Similarly, a greater diversity and abun-dance of generalist predators in natural habitats appar-ently resulted in lower population densities of anotherscale species on conifers compared to populations inmanaged landscapes (Tooker and Hanks, 2000b).
In this paper, we test the hypothesis that incorporatingfloral resource plants in ornamental landscapes will en-hance the abundance of natural enemies. Effects ofmanipulating flowering plant density on population den-sities of herbivorous insects will be presented in anotherpaper.
2. Materials and methods
2.1. Study plots and plant species
Research plots were established in the summer of1999 in a turf area adjacent to the Purdue UniversityNursery in West Lafayette, Indiana. Each study plot
measured 3 · 3 m and consisted of a central 1-m2 bedof Euonymus fortunei (Turcz.) var. �Coloratus,� containergrown and purchased from a local nursery, planted on22-cm centers (20 plants per bed). Prior to planting,we inoculated euonymus plants in the greenhouse withmobile, first-instar euonymus scales, Unaspis euonymi(Comstock) (Homoptera: Diaspididae), by attachingscale-infested euonymus cuttings to each plant (see Sa-dof and Raupp, 1991). Euonymus plants were sur-rounded by a �10-cm layer of composted wood mulchthat was amended each spring. All plants grew vigor-ously and it was necessary to trim them each autumnto maintain the original border with the wood mulch.Study plots were arranged 3 m apart in four rows spaced6 m apart. Ten blocks were used for long-term studieson abundance of natural enemies (N = 30 plots) whilefour blocks, separated from long-term plots by 6 m,were used for short-term studies on abundance of natu-ral enemies and floral bloom phenology (N = 12 plots).Areas between plots were seeded with Kentucky bluegrass, Poa pratensis L.
Treatments were randomly assigned to plots in eachblock by varying the density of floral resource plantssurrounding the beds of euonymus plants. Floral re-source plants were selected to provide natural enemieswith floral resources from early spring through earlyfall, and included: (1) flowering spurge, Euphorbia epith-
ymoides L. (Euphorbiaceae) (formerly E. polychroma A.Kern.), blooming from mid-April to mid-May, whichhas exposed nectaries that are readily accessible to nat-ural enemies (Patt et al., 1997b); (2) coreopsis, Coreopsisverticillata L. var. �Moonbeam� (Asteraceae), bloomingfrom mid-June to late August, which produces abun-dant pollen; (3) goldenrod, Solidago canadensis L. var.�Golden Baby� (Asteraceae), blooming from late Juneto mid-August, which is visited in abundance by a diver-sity of natural enemies (Tooker and Hanks, 2000a); and(4) white clover, Trifolium repens L. (Fabaceae), bloom-ing from late May to mid-July, which is known to beattractive to aphelinid parasitoids of scale insects (Too-ker and Hanks, 2000b). ‘‘No Flower’’ plots did not re-ceive flowering plants; ‘‘Low Flower Density’’ plotsreceived one row of three plants spaced 0.3 m apart;and ‘‘High Flower Density’’ plots received three rows(0.3 m apart) of three, five, and seven plants, respectively(Fig. 1). In plots with floral resource plants, four specieswere randomly assigned to plot quadrants and they re-mained in their assigned position for the duration ofthe study. In accordance with the treatment design,one and three rows of white clover were seeded intoLow Flower Density and High Flower Density plots,respectively (see Fig. 1). Euonymus fortunei var. �Colora-tus� does not bloom, and so would not interfere with theeffects of floral resource plants on the abundance of nat-ural enemies. Average densities of euonymus scale wereinitially similar across all treatments (unpub. data).

Fig. 1. Representative plot layout for the three treatments of floralresource plants in 2000–2002. See text for description of experimentaldesign.
E.J. Rebek et al. / Biological Control 33 (2005) 203–216 205
Plots were irrigated during periods of low precipita-tion with an overhead sprinkler system (0.8-m height)running between plot rows. Weeds growing within plotswere usually pulled by hand, but several localized appli-cations of glyphosate (480 g a.i./L; Round-up Pro;Monsanto, St. Louis, MO) were required each year tosuppress weeds. We managed weeds growing in turfareas by mowing and suppressed broadleaf weeds byapplying 2,4-D (240 g a.i./L), Dicamba (25 g a.i./L),
and Mecoprop-P (128 g a.i./L) (Trimec Classic, PBIGordon, Kansas City, MO USA) each spring.
2.2. Floral bloom phenology
To determine floral bloom phenology, we assessedflower abundance in the High Flower Density treatmentin short-term study plots (N = 12) in 2002–2003. Wesampled flower density in these plots weekly over the en-tire blooming period of each flowering plant species byblindly throwing a wire quadrat (600 cm2) into quad-rants and counting the number of blooms within thequadrat. Two samples were taken per flowering plantspecies per plot in 2002, and three samples in 2003.For each sample date, we calculated mean floral abun-dance per flowering plant species.
2.3. Influence of floral resource plants on abundance of
natural enemies
We monitored abundance of natural enemies in2000–2003 by sampling study plots at monthly intervalsduring the growing season so as not to deplete plots ofnatural enemies. During each sampling period, arthro-pods were sampled by two methods: (1) with double-sided, 7.5- by 12.5-cm yellow sticky cards (Sensor Mon-itoring Cards, Whitmire Micro-Gen Research Labora-tories, St. Louis, MO USA) to capture flying insectsand (2) a vacuum sampler to capture resting and lessvagile arthropods (modified leaf blower, Model No.BG 75, Stihl, Virginia Beach, VA USA, fitted with a vac-uum attachment and 250-mesh organdy bag securedover the vacuum tube with a rubber band). All studyplots (N = 42) were sampled with sticky cards, but onlylong-term study plots (N = 30) were vacuum sampled.
We vacuum sampled arthropods only on warm(P21 �C), sunny days between 1000 and 1400 h whenarthropods were most active. Each sample consisted ofsix, 10-s suctions of arbitrary locations within the bedof euonymus and each resource plant species. We sam-pled resource plants as they appeared, regardless ofblooming period. Collection bags were immediatelyplaced in a chilled cooler to inhibit predation. In the lab-oratory, samples were frozen, then arthropods weresorted under a dissecting microscope, spiders were iden-tified to class, and predaceous and parasitic insects toorder and family. Voucher specimens were depositedin the Purdue University Entomology Research Collec-tion. Vacuum samples were collected on 10 dates: 29June and 19 September, 2000; 29 May, 26 June, 27 July,and 21 August, 2001; 30 May, 20 June, 11 July, and 12August, 2002.
Sticky cards were placed in the field when several con-secutive days of sunny, warm weather (P21 �C) wereforecast. We placed two sticky cards within each euony-mus bed, and two cards within each species of flowering

206 E.J. Rebek et al. / Biological Control 33 (2005) 203–216
plant when plants were present (No Flower plots ex-cluded). Sticky cards were attached to bamboo plantstakes 5 cm above the plant canopy and left in the fieldfor 48 h. Cards were then collected and covered withplastic wrap to facilitate handling. We examined cardsunder a dissecting microscope to count and classify nat-ural enemies as described above. Sampling dates were13–15 June, 26–28 July, and 13–15 September, 2000;15–17 May, 18–20 June, 16–18 July, and 13–15 August,2001; 22–24 May, 17–19 June, 8–10 July, and 6–8 Au-gust, 2002.
Natural enemy counts were log10 (x + 1) transformedto stabilize the variance among samples. For each sam-pling period and method, we used one-way analysis ofvariance (ANOVA) for a randomized complete blockdesign (PROC GLM, SAS Institute, 1985) to analyzetreatment differences in abundance of natural enemiescollected from each euonymus bed. We tested the depen-dent variable (abundance of natural enemies) with treat-ment and block as the independent variables. Werepeated this analysis for vacuum sample data using par-asitic wasps and spiders as separate dependent variables.Differences between means were tested with Fisher pro-tected least significant difference tests. We used two-fac-tor ANOVA to test the dependent variable (abundanceof natural enemies) with two independent variables(flowering plant species and treatment), as well as theirinteraction. Differences between means were tested withFisher protected least significant difference tests. How-ever, May samples were confined to euphorbia and clo-ver because these were the only species having asufficient amount of above-ground plant material forsampling in late spring. Therefore, we compared Maytrap catches for euphorbia and clover using paired t tests(PROC TTEST, SAS Institute, 1985).
In 2003, we altered the experimental design of long-term study plots to investigate the direct influence of flo-ral resources on populations of natural enemies. The NoFlower treatment was retained from earlier experiments,while plots with flowering plants were split into two newtreatments: all flower buds were removed prior to budbreak in ‘‘Flowers Removed’’ plots, whereas flowerswere allowed to bloom in ‘‘Flowers Intact’’ plots. We as-signed these treatments to plots in late April 2003 byranking all plots containing flowering resource plantsby increasing order of percent plot area covered byeuphorbia (the only flowering plant species present atthe time). Every other ranked plot was assigned to theFlowers Removed treatment to establish an even distri-bution of flowering plant densities across bothtreatments.
We used vacuum and sticky card samples in 2003 toassess the effect of removing inflorescences from re-source plants on total abundance of natural enemiesby the methods already described. Vacuum sampleswere taken 16 June, 25 July, and 22 August. Sticky cards
were placed in the field 13–15 May, 9–11 June, 21–23July, and 18–20 August. Natural enemy counts werelog10 (x + 1) transformed. No Flower, Flowers Re-moved, and Flowers Intact plots were not replicated inblocks. For each sampling period and method, we usedANOVA for a completely randomized design (PROCGLM, SAS Institute, 1985) to analyze treatment differ-ences in abundance of natural enemies caught withineuonymus. We tested the dependent variable (abun-dance of natural enemies) with treatment as the indepen-dent variable. Treatment means for each analysis wereseparated by Fisher protected least significant differencetests. For both sampling methods, we used paired t tests(PROC TTEST, SAS Institute, 1985) to compare natu-ral enemy abundance between Flowers Removed andFlowers Intact treatments for each floral resource plant.
To investigate the effect of resource plant biomass onabundance of natural enemies, we harvested above-ground flowering plant material from the long-termplots at the end of the 2003 season and dried them at70 �C. Pearson correlation coefficients (PROC CORR,SAS Institute, 1985) were used to compare data fordry weights of flowering plants with correspondinglog-transformed data for abundance of natural enemiesfrom 2003. Because late-season plant dry weightsencompass total growth over the entire 2003 season,we analyzed average arthropod abundance per plot foreach natural enemy group collected throughout the sea-son. For both sampling methods, dry weights were com-pared with count data for both parasitic wasps and totalnatural enemies; for vacuum samples, dry weights werealso compared with spider abundance. All statisticalprocedures were analyzed at a = 0.05.
2.4. Influence of floral resources on spatial distribution of
natural enemies
We conducted a separate study in 2002–2003 to inves-tigate spatial patterns of natural enemy abundanceacross the experimental landscape. We placed a yellowsticky card at the perimeter of each plot in each of thefour cardinal directions and in three locations (N = 12cards per plot): (1) at the interface between euonymusand resource plants or mulch, (2) at the interface be-tween resource plants or mulch and turf, and (3) 1 minto turf surrounding plot borders. The landscape wasmapped in x- and y-coordinates (in meters) and the po-sition of each sticky card sample (N = 504) was plottedand recorded. Thus, trap catch allowed us to gauge theoverall distribution of natural enemies throughout thelandscape. Samples were processed as described above.Sampling was conducted on 12–14 June, 16–18 July,and 20–22 August, 2002; and 18–20 June and 29–31July, 2003.
Count data were square-root transformed to stabilizethe variance. For each sample date, we used two-factor
E.J. Rebek et al. / Biological Control 33 (2005) 203–216 207
ANOVA to test the dependent variable (abundance ofnatural enemies) with two independent variables (treat-ment and location), as well as their interaction. Weinterpret a significant treatment-by-location interactionas an indication that proximity to floral resource plantsinfluences the distribution of natural enemies.
Geostatistics is a branch of applied statistics that esti-mates and models spatial patterns using both values andlocations of a given data set (Liebhold and Sharov,1998; Rossi et al., 1992). Traditionally used in geologyand mining, geostatistics has been widely applied to eco-logical data, including analysis of spatial autocorrela-tion among insect count data (Gribko et al., 1995;Tobin and Pitts, 2002; Wright et al., 2002). Data areconsidered spatially autocorrelated when values aremore similar for samples taken from locations in prox-imity than for samples from locations that are separatedby a greater distance (Liebhold and Sharov, 1998). Avariogram is a geostatistical tool that measures the sep-aration distance, or lag distance (h), at which data pairsare no longer spatially autocorrelated. The variogram,c (h), summarizes all possible data pairs over significantlag distances (Liebhold and Sharov, 1998), and is equalto half the average squared difference between paireddata values at the same separation distance (Isaaksand Srivastava, 1989). The variogram is calculated as:
cðhÞ ¼ 1
2N ðhÞ
Xði;jÞjhi;j¼h
ðvi � vjÞ2; ð1Þ
where N(h) is the number of data pairs in h, vi is a valueat location i, and vj is a value at location j separated by h(see Isaaks and Srivastava, 1989 for further informationon variogram models and the methods described below).
To describe how the spatial continuity of a given var-iable changes with distance and direction, variogramvalues (y-axis) are plotted against all lag distances (x-axis). Because only a small number of data pairs fall ex-actly along h in any given direction, lag tolerance andangle tolerance values are chosen to increase the numberof data pairs used in construction of the variogram. Alag tolerance value of typically one-half the lag distanceis incorporated to include data pairs that are separatedby distances approaching h. Similarly, angular tolerancemanipulates positive and negative rotation about thevector to include more data pairs. Because a large num-ber of variograms can be calculated for all data pairsseparated by h in any given direction, it is common toconstruct omnidirectional variograms. These vario-grams represent an approximate average of the variousdirectional variograms, and are valid if spatial continu-ity is determined to be similar in all directions (i.e., it isisotropic). Various models are then used to estimate thestructure of the omnidirectional variogram. The basicvariogram structure is then used to calculate: (1) therange value, or distance at which further increases in
separation distance (h) no longer yield increases in vari-ogram value, and (2) the sill value, or the plateaureached by the variogram at the range value.
To determine the spatial structure of untransformednatural enemy counts on sticky cards located at eachx-, y-coordinate, we calculated omnidirectional vario-grams (Geovariances, 2002) for each sampling periodand standardized each variogram value to 1. We deter-mined that abundance data were isotropic based onanalysis of variance maps (Geovariances, 2002). Wechose a 2-m lag distance with a lag tolerance of ±1 mand an angular tolerance of 90�. Nugget effect andspherical models were used to describe the structure ofeach variogram and estimate the sill and range values.The nugget effect accounts for discontinuities that occurat the origin of the variogram, and is modeled as:
c0ðhÞ ¼0 if h ¼ 0;
1 otherwise:
�ð2Þ
Discontinuities arise because the variogram value ath = 0 is strictly 0, but may be considerably larger than0 at very small lag distances (Isaaks and Srivastava,1989). The spherical model describes the basic structureof the variogram and is calculated as:
cðhÞ ¼ 1:5 ha � 0:5ðha Þ
3 if h 6 a;
1 otherwise;
(ð3Þ
where a is the range (Isaaks and Srivastava, 1989). To-gether with the treatment-by-location interaction fromANOVA, we interpreted range as the distance at whichflowering plants cease to affect abundance of naturalenemies. We compared variograms for different yearsto detect changes in response of natural enemies to floralresource plants in 2002 when flowers were intact and in2003 when flowers had been removed from half of thelong-term plots.
3. Results
3.1. Floral bloom phenology
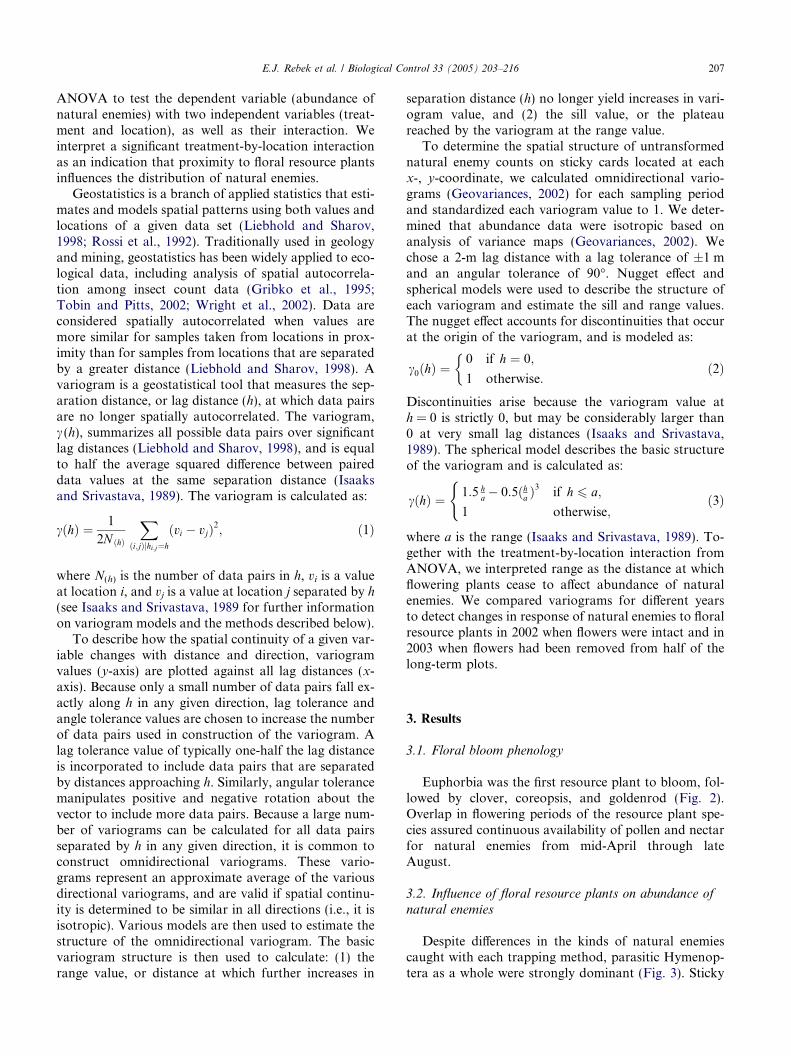
Euphorbia was the first resource plant to bloom, fol-lowed by clover, coreopsis, and goldenrod (Fig. 2).Overlap in flowering periods of the resource plant spe-cies assured continuous availability of pollen and nectarfor natural enemies from mid-April through lateAugust.
3.2. Influence of floral resource plants on abundance of
natural enemies
Despite differences in the kinds of natural enemiescaught with each trapping method, parasitic Hymenop-tera as a whole were strongly dominant (Fig. 3). Sticky
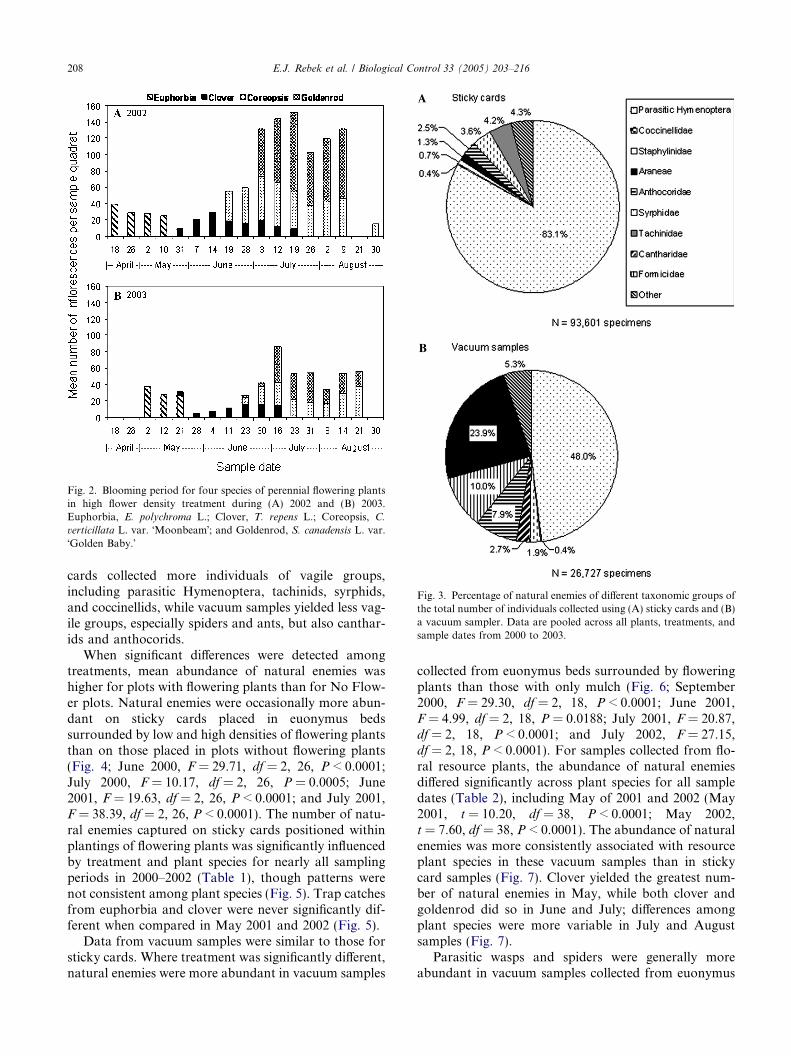
Fig. 2. Blooming period for four species of perennial flowering plantsin high flower density treatment during (A) 2002 and (B) 2003.Euphorbia, E. polychroma L.; Clover, T. repens L.; Coreopsis, C.
verticillata L. var. �Moonbeam�; and Goldenrod, S. canadensis L. var.�Golden Baby.�
Fig. 3. Percentage of natural enemies of different taxonomic groups ofthe total number of individuals collected using (A) sticky cards and (B)a vacuum sampler. Data are pooled across all plants, treatments, andsample dates from 2000 to 2003.
208 E.J. Rebek et al. / Biological Control 33 (2005) 203–216
cards collected more individuals of vagile groups,including parasitic Hymenoptera, tachinids, syrphids,and coccinellids, while vacuum samples yielded less vag-ile groups, especially spiders and ants, but also canthar-ids and anthocorids.
When significant differences were detected amongtreatments, mean abundance of natural enemies washigher for plots with flowering plants than for No Flow-er plots. Natural enemies were occasionally more abun-dant on sticky cards placed in euonymus bedssurrounded by low and high densities of flowering plantsthan on those placed in plots without flowering plants(Fig. 4; June 2000, F = 29.71, df = 2, 26, P < 0.0001;July 2000, F = 10.17, df = 2, 26, P = 0.0005; June2001, F = 19.63, df = 2, 26, P < 0.0001; and July 2001,F = 38.39, df = 2, 26, P < 0.0001). The number of natu-ral enemies captured on sticky cards positioned withinplantings of flowering plants was significantly influencedby treatment and plant species for nearly all samplingperiods in 2000–2002 (Table 1), though patterns werenot consistent among plant species (Fig. 5). Trap catchesfrom euphorbia and clover were never significantly dif-ferent when compared in May 2001 and 2002 (Fig. 5).
Data from vacuum samples were similar to those forsticky cards. Where treatment was significantly different,natural enemies were more abundant in vacuum samples
collected from euonymus beds surrounded by floweringplants than those with only mulch (Fig. 6; September2000, F = 29.30, df = 2, 18, P < 0.0001; June 2001,F = 4.99, df = 2, 18, P = 0.0188; July 2001, F = 20.87,df = 2, 18, P < 0.0001; and July 2002, F = 27.15,df = 2, 18, P < 0.0001). For samples collected from flo-ral resource plants, the abundance of natural enemiesdiffered significantly across plant species for all sampledates (Table 2), including May of 2001 and 2002 (May2001, t = 10.20, df = 38, P < 0.0001; May 2002,t = 7.60, df = 38, P < 0.0001). The abundance of naturalenemies was more consistently associated with resourceplant species in these vacuum samples than in stickycard samples (Fig. 7). Clover yielded the greatest num-ber of natural enemies in May, while both clover andgoldenrod did so in June and July; differences amongplant species were more variable in July and Augustsamples (Fig. 7).
Parasitic wasps and spiders were generally moreabundant in vacuum samples collected from euonymus

Table 1Results of two-factor ANOVA for 2000–2002 sticky card samples fromfloral resource plants
Effects N df F P
June 2000 112Treatment 1 21.10 <0.0001***
Flowering plant 3 34.43 <0.0001***
Trt · Plant 3 0.14 0.9370Error 216
July 2000 112Treatment 1 104.15 <0.0001***
Flowering plant 3 11.91 <0.0001***
Trt · Plant 3 1.42 0.2412Error 216
September 2000 112Treatment 1 6.86 0.0104*
Flowering plant 3 110.23 <0.0001***
Trt · Plant 3 4.00 0.0101*
Error 216
June 2001 112Treatment 1 5.48 0.0215*
Flowering plant 3 22.29 <0.0001***
Trt · Plant 3 1.38 0.2533Error 216
July 2001 112Treatment 1 9.72 0.0024**
Flowering plant 3 4.69 0.0043**
Trt · Plant 3 1.33 0.2701Error 216
August 2001 111Treatment 1 5.32 0.0020**
Flowering plant 3 4.69 0.0043**
Trt · Plant 3 1.43 0.2401Error 216
October 2001 110Treatment 1 0.17 0.6773Flowering plant 3 16.68 <0.0001***
Trt · Plant 3 0.10 0.9613Error 216
June 2002 112Treatment 1 3.17 0.0784Flowering plant 3 14.81 <0.0001***
Trt · Plant 3 2.55 0.0606Error 216
July 2002 112Treatment 1 3.16 0.0787Flowering plant 3 8.40 <0.0001***
Trt · Plant 3 0.86 0.4629Error 216
August 2002 112Treatment 1 2.79 0.0981Flowering plant 3 1.65 0.1838Trt · Plant 3 0.06 0.9803Error 216
The dependent variable is abundance of natural enemies.* P < 0.05.
** P < 0.01.*** P < 0.001.
Fig. 4. Mean log10 (x + 1) number of natural enemies per plot (±SE)collected from euonymus beds on sticky cards in 2000–2002. Meanswith different letters within months are significantly different (FisherProtected LSD, P 6 0.05).
E.J. Rebek et al. / Biological Control 33 (2005) 203–216 209
beds with flowering plants than those with only mulch(Figs. 8 and 9; parasitic wasps: September 2000, F =7.62, df = 2, 18, P = 0.0040; June 2001, F = 7.83, df = 2,18, P = 0.0036; July 2001, F = 5.62, df = 2, 18, P =0.0134; August 2001, F = 5.98, df = 2, 18, P = 0.0108;July 2002, F = 16.04, df = 2, 18, P = 0.0001; and August2002, F = 4.03, df = 2, 18, P = 0.0357; spiders: Septem-ber 2000, F = 10.11, df = 2, 18, P = 0.0011; July 2001,F = 14.28, df = 2, 18, P = 0.0002; and July 2002, F =5.95, df = 2, 18, P < 0.0104).
Removing flowers significantly influenced the abun-dance of natural enemies collected in euonymus beds inMay 2003 sticky card samples (F = 4.65, df = 2, 27,P = 0.0184) and August 2003 vacuum samples (F =4.07, df = 2, 25, P = 0.0295) (Table 3). When assessedseparately for each resource plant species, removing
Fig. 5. Mean log10 (x + 1) number of natural enemies per plot (±SE)collected from floral resource plants on sticky cards in 2000–2002.Means with different letters within months are significantly different(Fisher Protected LSD, P 6 0.05).
Fig. 6. Mean log10 (x + 1) number of natural enemies per plot (±SE)collected from euonymus beds in vacuum samples in 2000–2002.Means with different letters within months are significantly different(Fisher Protected LSD, P 6 0.05).
210 E.J. Rebek et al. / Biological Control 33 (2005) 203–216
inflorescences from resource plants had a negligible influ-ence on natural enemy abundance. The treatment effectwas significant only for July vacuum samples in golden-rod (t = 4.83, df = 18, P < 0.0001), with 1.225 ± 0.044versus 0.911 ± 0.048 natural enemies collected in FlowersIntact and Flowers Removed treatments, respectively.
Biomass of flowering plants was not correlated withmean abundance of natural enemies in vacuum samplescollected from euonymus beds in 2003 (Pearson correla-tion, P > 0.05). In contrast, when natural enemies weresampled with sticky cards in euonymus beds, dryweights of euphorbia were positively correlated withmean abundance of parasitic wasps (r = 0.508,P = 0.0223) and total natural enemies (r = 0.604,P = 0.0048), and combined dry weights of all resourceplants were positively correlated with mean abundance
of parasitic wasps (r = 0.494, P = 0.0268) and total nat-ural enemies (r = 0.558, P = 0.0106).
3.3. Influence of floral resources on spatial distribution of
natural enemies
The treatment-by-location interaction was highly sig-nificant for all sample dates except July 2003 (Table 4),which may indicate that the spatial location of floral re-source plants typically influenced the distribution of nat-ural enemies in the landscape. Spatial variance innatural enemy abundance, assessed with sticky cards,showed similar structure for all sampling months in2002–2003 (Fig. 10). The range values were 16.1, 5.4,7.8, 6.6, and 7.6 m for June, July, and August 2002,and June and July 2003, respectively. With the exception
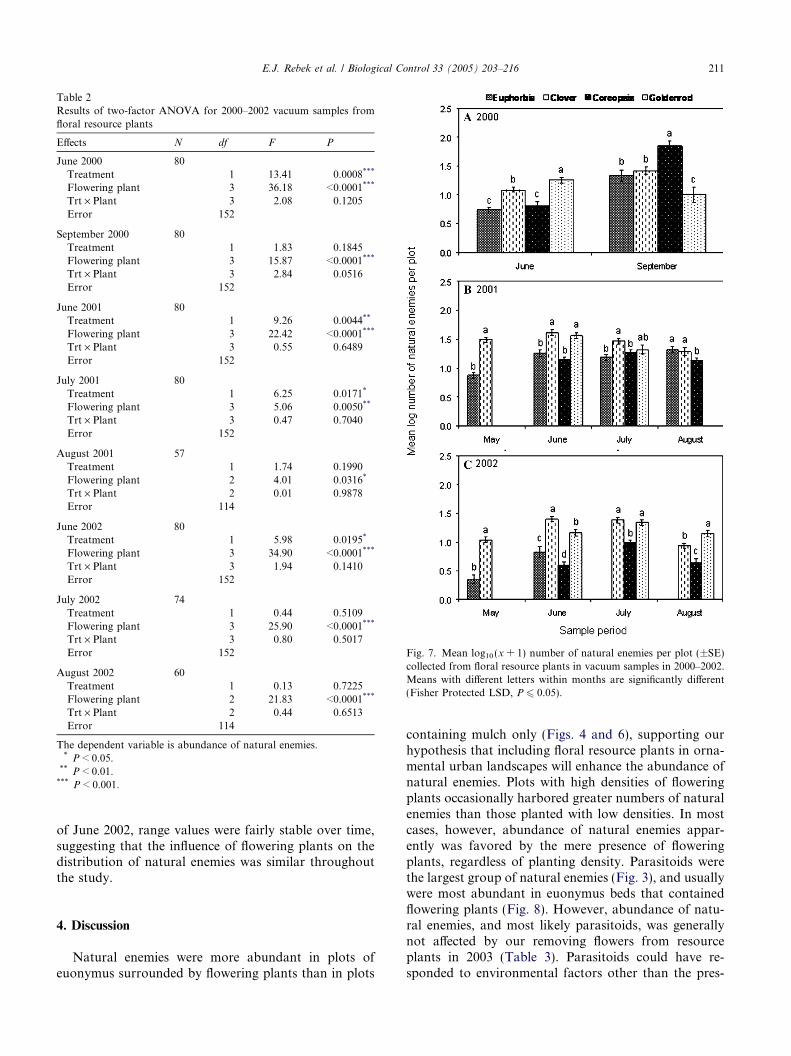
Table 2Results of two-factor ANOVA for 2000–2002 vacuum samples fromfloral resource plants
Effects N df F P
June 2000 80Treatment 1 13.41 0.0008***
Flowering plant 3 36.18 <0.0001***
Trt · Plant 3 2.08 0.1205Error 152
September 2000 80Treatment 1 1.83 0.1845Flowering plant 3 15.87 <0.0001***
Trt · Plant 3 2.84 0.0516Error 152
June 2001 80Treatment 1 9.26 0.0044**
Flowering plant 3 22.42 <0.0001***
Trt · Plant 3 0.55 0.6489Error 152
July 2001 80Treatment 1 6.25 0.0171*
Flowering plant 3 5.06 0.0050**
Trt · Plant 3 0.47 0.7040Error 152
August 2001 57Treatment 1 1.74 0.1990Flowering plant 2 4.01 0.0316*
Trt · Plant 2 0.01 0.9878Error 114
June 2002 80Treatment 1 5.98 0.0195*
Flowering plant 3 34.90 <0.0001***
Trt · Plant 3 1.94 0.1410Error 152
July 2002 74Treatment 1 0.44 0.5109Flowering plant 3 25.90 <0.0001***
Trt · Plant 3 0.80 0.5017Error 152
August 2002 60Treatment 1 0.13 0.7225Flowering plant 2 21.83 <0.0001***
Trt · Plant 2 0.44 0.6513Error 114
The dependent variable is abundance of natural enemies.* P < 0.05.
** P < 0.01.*** P < 0.001.
Fig. 7. Mean log10 (x + 1) number of natural enemies per plot (±SE)collected from floral resource plants in vacuum samples in 2000–2002.Means with different letters within months are significantly different(Fisher Protected LSD, P 6 0.05).
E.J. Rebek et al. / Biological Control 33 (2005) 203–216 211
of June 2002, range values were fairly stable over time,suggesting that the influence of flowering plants on thedistribution of natural enemies was similar throughoutthe study.
4. Discussion
Natural enemies were more abundant in plots ofeuonymus surrounded by flowering plants than in plots
containing mulch only (Figs. 4 and 6), supporting ourhypothesis that including floral resource plants in orna-mental urban landscapes will enhance the abundance ofnatural enemies. Plots with high densities of floweringplants occasionally harbored greater numbers of naturalenemies than those planted with low densities. In mostcases, however, abundance of natural enemies appar-ently was favored by the mere presence of floweringplants, regardless of planting density. Parasitoids werethe largest group of natural enemies (Fig. 3), and usuallywere most abundant in euonymus beds that containedflowering plants (Fig. 8). However, abundance of natu-ral enemies, and most likely parasitoids, was generallynot affected by our removing flowers from resourceplants in 2003 (Table 3). Parasitoids could have re-sponded to environmental factors other than the pres-

Fig. 8. Mean log10 (x + 1) number of parasitic Hymenoptera per plot(±SE) collected from euonymus beds in vacuum samples in 2000–2002.Means with different letters within months are significantly different(Fisher Protected LSD, P 6 0.05).
Fig. 9. Mean log10 (x + 1) number of Araneae per plot (±SE) collectedfrom euonymus beds in vacuum samples in 2000–2002. Means withdifferent letters within months are significantly different (FisherProtected LSD, P 6 0.05).
212 E.J. Rebek et al. / Biological Control 33 (2005) 203–216
ence or absence of floral resources. For example, be-cause the landscape surrounding the research site is rel-atively impoverished and affords little protection fromadverse climatic conditions, floral resource plants mayhave influenced parasitoid abundance by providing afavorable microclimate (Landis et al., 2000). Alterna-tively, parasitoids may have learned to forage on re-source plants that emitted non-floral plant volatilesand continued to be attracted to resource plants evenafter flowers were removed. Flowering plants also mayhave harbored aphids, which could provide honeydewor serve as hosts to some parasitoid species (Barbosa,1998).
Spiders were occasionally most abundant in vacuumsamples of plots that contained floral resource plants(Fig. 9), particularly during late summer when resource
plants had dense canopies. Because spiders do not feedon floral resources, the positive impact of floweringplants on spider abundance is probably related to char-acteristics of the vegetation such as increased plantstructure, diversity, and/or complexity (Bell et al.,2002; Coll and Bottrell, 1995; Kevan and Greco, 2001;Rieux et al., 1999; Schwab et al., 2002), or increasedprey abundance. The significant influence of resourceplant treatments on abundance of spiders and parasit-oids, representing two different entomophagous func-tional groups, suggests that there is potential forcontrolling a wide variety of arthropod pests using thisconservation biological control tactic.
All of the flowering plant species in this study wereeither attractive to, or able to retain, predators and par-asitoids. However, the abundance of natural enemies did

Table 3Trap catch of natural enemies from sticky card and vacuum samples ineuonymus beds in 2003
Treatment N Mean log-number ofnatural enemies ± SEa
Sticky card samples
MayNo Flower 10 0.687 ± 0.056aFlowers Intact 10 0.482 ± 0.041bFlowers Removed 10 0.617 ± 0.047ab
JuneNo Flower 10 1.018 ± 0.038aFlowers Intact 9 0.937 ± 0.037aFlowers Removed 10 0.925 ± 0.044a
JulyNo Flower 10 0.547 ± 0.031aFlowers Intact 10 0.677 ± 0.043aFlowers Removed 9 0.658 ± 0.064a
AugustNo Flower 10 0.640 ± 0.059aFlowers Intact 10 0.690 ± 0.021aFlowers Removed 10 0.839 ± 0.090a
Vacuum samples
JuneNo Flower 10 0.790 ± 0.087aFlowers Intact 10 0.625 ± 0.083aFlowers Removed 10 0.674 ± 0.072a
JulyNo Flower 10 0.793 ± 0.056aFlowers Intact 10 0.908 ± 0.033aFlowers Removed 10 0.950 ± 0.088a
AugustNo Flower 10 0.866 ± 0.106bFlowers Intact 9 1.153 ± 0.039aFlowers Removed 9 1.077 ± 0.050ab
a Means with different letters within months are significantly different(P 6 0.05).
Table 4Results of two-factor ANOVA for the 2002–2003 study of theinfluence of floral resource plants on the spatial distribution of naturalenemies
Effects N df F P
June 2002 504Treatment 2 18.47 <0.0001***
Location 2 6.42 0.0018**
Trt · Loc 4 3.31 0.0109*
Error 369
July 2002 504Treatment 2 28.81 <0.0001***
Location 2 29.81 <0.0001***
Trt · Loc 4 2.63 0.0340*
Error 369
August 2002 504Treatment 2 28.81 <0.0001***
Location 2 29.81 <0.0001***
Trt · Loc 4 2.63 0.0340*
Error 369
June 2003 492Treatment 2 22.79 <0.0001***
Location 2 9.37 0.0001***
Trt · Loc 4 4.70 0.0010**
Error 360
July 2003 501Treatment 2 10.69 <0.0001***
Location 2 8.57 0.0002***
Trt · Loc 4 0.64 0.6354Error 369
Sticky card samples were taken from all plots at the following loca-tions: euonymus bed-plot interface, plot-turf interface, and in turf (seetext). The dependent variable is abundance of natural enemies.* P < 0.05.
** P < 0.01.*** P < 0.001.
E.J. Rebek et al. / Biological Control 33 (2005) 203–216 213
not necessarily correspond to the availability of floral re-sources. For example, a large number of natural enemieswere collected from euphorbia through late summer andearly fall (Figs. 7A and B), even though it usuallystopped blooming at the end of May (Fig. 2). With re-spect to flowering plant species, patterns of abundancewere much clearer for vacuum samples (Fig. 7) thansticky card samples (Fig. 5). These results suggest thatless vagile natural enemies (e.g., spiders) were morestrongly influenced by regular changes in some qualityof each plant species; in contrast, the highly variable re-sponse of flying natural enemies may relate to more sub-tle differences among flowering plant species over time.
The flower removal study provided little evidence forthe influence of floral resources on the abundance ofnatural enemies. In May 2003, more natural enemieswere captured on sticky cards placed in No Flower plotsthan in other treatments (Table 3). In August 2003 vac-uum samples, however, the highest number of natural
enemies were in Flowers Intact plots (Table 3). Perhapsremoving flowers had the greatest effect on natural en-emy abundance in August because of the greater massof flowers present. When we analyzed each floweringplant species separately for all sample dates, however,only one instance showed a greater number of naturalenemies associated with Flowers Intact than FlowersRemoved plots. Further, numbers of both parasiticwasps and total natural enemies caught on sticky cardswere positively correlated with total biomass of euphor-bia and all flowering plants combined. Similar vario-gram structure and range values among most of thesample dates for 2002–2003 (Fig. 10) also suggest thatremoving flowers from half the long-term study plotsin 2003 had a negligible effect, if any, on dispersion ofnatural enemies throughout the landscape. The largedifference in range values between June 2002 and June2003 is not likely due to effects of flower removal be-cause effects were also not observed between naturalenemies caught in sticky cards placed in plots with andwithout flowers in June 2003. However, the range values

Fig. 10. Relative omnidirectional variograms for abundance of naturalenemies trapped on yellow sticky cards from June 2002 through July2003. Each variogram contains two structures (nugget effect andspherical model), 15 lags of 2 m with a 50% tolerance, and an angulartolerance of 90�.
214 E.J. Rebek et al. / Biological Control 33 (2005) 203–216
(ranging from 5.4 to 16.1 m) we obtained hint at poten-tial interactions among flowering plant species locatedwithin plots, and more importantly, between plots thatare separated by 6 m or less of turf. Such interactioncould have confounded the results of analysis of vari-ance for the flower removal study, thereby explaininga general lack of significance among treatments in2003. Yet, we were able to find significant effects oftreatment and flowering plant species in the previousstudy in 2000–2002, despite the possibility of confound-ing interactions between plots. Therefore, we concludethat floral resources themselves had little impact onthe abundance of natural enemies.
Geostatistical analysis demonstrated that the distri-bution of natural enemies was rather stable over time,even when flowers were removed in 2003. Analysis ofvariance determined a significant interaction betweentreatment and trap location for all sample periods ex-cept July 2003 (Table 4), suggesting that the spatial loca-tion of flowering plants did not influence thedistribution of natural enemies for that sample period.Indeed, compared to previous sample dates, the vario-gram structure for July 2003 (Fig. 10) is relatively weak,implying that the range value calculated for that sampledate is simply an artifact of the model fitting procedure.
Our study clearly demonstrates that floral resourceplants can be used to increase abundance of natural ene-mies in ornamental urban landscapes, though naturalenemies may benefit more from the flowering plantsthemselves than the floral resources they provide.Enhancing natural enemy populations in managed hab-itats engenders a greater potential for successful biolog-ical control. With a few notable exceptions (see reviewby Landis et al., 2000), however, most studies to datehave been unable to associate increased predation orparasitism rates with increased abundance of naturalenemies. Future research should directly address therelationship between natural enemy abundance andeffective regulation of arthropod pests.
Acknowledgments
We are grateful to the countless undergraduate re-search technicians who maintained our research plotsand collected, sorted, and identified arthropods. We alsothank R.J. O�Neil, M. Dana, N. Dudareva, J. Holland,D. Richmond, and two anonymous reviewers for com-ments on previous versions of the manuscript. Thismaterial is based upon work supported by The Cooper-ative State Research, Education, and Extension Service,U.S. Department of Agriculture, under Agreement Nos.99-35316-7850 and 2001-35316-11275. This is paper2005-17600 of the Indiana Agriculture ResearchProgram.
References
Altieri, M.A., Whitcomb, W.H., 1979. The potential use of weeds inthe manipulation of beneficial insects. HortScience 14, 12–18.
Barbosa, P., 1998. Agroecosystems and conservation biologicalcontrol. In: Barbosa, P. (Ed.), Conservation Biological Control.Academic Press, San Diego, CA, pp. 39–54.
Barbosa, P., Benrey, B., 1998. The influence of plants on insectparasitoids: implications for conservation biological control. In:Barbosa, P. (Ed.), Conservation Biological Control. AcademicPress, San Diego, CA, pp. 55–82.
Bell, J.R., Johnson, P.J., Hambler, C., Haughton, A.J., Smith, H.,Feber, R.E., Tattersall, F.H., Hart, B.H., Manley, W., MacDon-ald, D.W., 2002. Manipulating the abundance of Lepthyphantes
tenuis (Araneae: Linyphiidae) by field margin management. Agric.Ecosyst. Environ. 93, 295–304.
Bigger, D.S., Chaney, W.E., 1998. Effects of Iberis umbellata (Brass-icaceae) on insect pests of cabbage and on potential biologicalcontrol agents. Environ. Entomol. 27, 161–167.
Bowie, M.H., Wratten, S.D., White, A.J., 1995. Agronomy andphenology of ‘‘companion plants’’ of potential for enhancement ofinsect biological control. N. Z. J. Crop Hortic. Sci. 23, 423–427.
Bugg, R.L., Ellis, R.T., Carlson, R.W., 1989. Ichneumonidae (Hyme-noptera) using extrafloral nectar of faba bean (Vicia faba L.,Fabaceae) in Massachusetts. Biol. Agric. Hortic. 6, 107–114.
Carreck, N.L., Williams, I.H., 1997. Observations on two commercialflower mixtures as food sources for beneficial insects in the UK. J.Agric. Sci. 128, 397–403.

E.J. Rebek et al. / Biological Control 33 (2005) 203–216 215
Coll, M., Bottrell, D.G., 1995. Predator–prey association in mono- anddicultures: effect of maize and bean vegetation. Agric. Ecosyst.Environ. 54, 115–125.
Cowgill, S.E., Wratten, S.D., Sotherton, N.W., 1995. The selective useof floral resources by the hoverfly Episyrphus balteatus (Diptera:Syrphidae) on farmland. Ann. Appl. Biol. 114, 223–231.
Dreistadt, S.H., Dahlsten, D.L., Frankie, G.W., 1990. Urban forestsand insect ecology. BioScience 40, 192–198.
Ehler, L.E., 1998. Conservation biological control: past, present, andfuture. In: Barbosa, P. (Ed.), Conservation Biological Control.Academic Press, San Diego, CA, pp. 1–8.
Foster, M.A., Ruesink, W.G., 1984. Influence of flowering weedsassociated with reduced tillage in corn on a black cutworm(Lepidoptera: Noctuidae) parasitoid, Meteorus rubens (Nees vonEsenbeck). Environ. Entomol. 13, 664–668.
Freeman Long, R., Corbett, A., Lamb, C., Reberg-Horton, C.,Chandler, J., Stimmann, M., 1998. Beneficial insects move fromflowering plants to nearby crops. Calif. Agric. 52, 23–26.
Geovariances, 2002. Isatis Software Manual, fourth ed. Geovariances,Avon Cedex, France.
Gribko, L.S., Liebhold, A.M., Hohn, M.E., 1995. Model to predictgypsy moth (Lepidoptera: Lymantriidae) defoliation using krigingand logistic regression. Environ. Entomol. 24, 529–537.
Hanks, L.M., Denno, R.F., 1993. Natural enemies and plant waterrelations influence the distribution of an armored scale insect.Ecology 74, 1081–1091.
Hickman, J.M., Wratten, S.D., 1996. Use of Phacelia tanacetifolia
strips to enhance biological control of aphids by hoverfly larvae incereal fields. J. Econ. Entomol. 89, 832–840.
Hougardy, E., Gregoire, J.C., 2000. Spruce stands provide naturalfood sources to adult hymenopteran parasitoids of bark beetles.Entomol. Exp. Appl. 96, 253–263.
Idris, A.B., Grafius, E., 1995. Wildflowers as nectar sources forDiadegma insulare (Hymenoptera: Ichneumonidae), a parasitoid ofdiamondback moth (Lepidoptera: Yponomeutidae). Environ.Entomol. 24, 1726–1735.
Idris, A.B., Grafius, E., 1997. Nectar-collecting behavior of Diadegma
insulare (Hymenoptera: Ichneumonidae), a parasitoid of diamond-back moth (Lepidoptera: Plutellidae). Environ. Entomol. 26, 114–120.
Isaaks, E.H., Srivastava, R.M., 1989. An Introduction to AppliedGeostatistics. Oxford University Press, New York, NY.
Jervis, M.A., Kidd, N.A.C., Fitton, M.G., Huddleston, T., Dawah,H.A., 1993. Flower-visiting by hymenopteran parasitoids. J. Nat.Hist. 27, 67–105.
Kevan, P.G., Greco, C.F., 2001. Contrasting patch choice behavior byimmature ambush predators, a spider (Misumena vatia) and aninsect (Phymata americana). Ecol. Entomol. 26, 148–153.
Landis, D.A., Wratten, S.D., Gurr, G.M., 2000. Habitat managementto conserve natural enemies of arthropod pests in agriculture.Annu. Rev. Entomol. 45, 175–201.
Leius, K., 1960. Attractiveness of different foods and flowers to theadults of some hymenopterous parasites. Can. Entomol. 92, 369–376.
Leius, K., 1963. Effects of pollens on fecundity and longevity of adultScambus buolianae (Htg.) (Hymenoptera: Ichneumonidae). Can.Entomol. 95, 202–207.
Leius, K., 1967. Influence of wild flowers on parasitism of tentcaterpillar and codling moth. Can. Entomol. 99, 444–446.
Liebhold, A.M., Sharov, A.A., 1998. Testing for correlation in thepresence of autocorrelation in insect count data. In: Baumgartner,J., Brandmayr, P., Manly, B. (Eds.), Population and CommunityEcology for Insect Management and Conservation: Proceedings ofthe Ecology and Population Dynamics Section of the 20thInternational Congress of Entomology, Florence, Italy, 25–31August, 1996. A.A. Balkema, Rotterdam, Netherlands, pp. 111–117.
Luck, R.F., Dahlsten, D.L., 1975. Natural decline of a pine needlescale (Chionaspis pinifoliae [Fitch]), outbreak at South Lake Tahoe,California following cessation of adult mosquito control withmalathion. Ecology, 893–904.
Nalepa, C.A., Bambara, S.B., Burroughs, A.M., 1992. Pollen andnectar feeding by Chilocorus kuwanae (Silvestri) (Coleoptera:Coccinellidae). Proc. Entomol. Soc. Wash. 94, 596–597.
Patt, J.M., Hamilton, G.C., Lashomb, J.H., 1997a. Impact of strip-insectary intercropping with flowers on conservation biologicalcontrol of the Colorado potato beetle. Adv. Hortic. Sci. 11, 175–181.
Patt, J.M, Hamilton, G.C., Lashomb, J.H., 1997b. Foraging success ofparasitoid wasps on flowers: interplay of insect morphology, floralarchitecture and searching behavior. Entomol. Exp.Appl. 83, 21–30.
Pemberton, R.W., Vandenberg, N.J., 1993. Extrafloral nectar feedingby ladybird beetles (Coleoptera: Coccinellidae). Proc. Entomol.Soc. Wash. 95, 139–151.
Rabb, R.L., Stinner, R.E., van den Bosch, R., 1976. Conservation andaugmentation of natural enemies. In: Huffaker, C.B., Messenger,P.S. (Eds.), Theory and Practice of Biological Control. AcademicPress, San Diego, CA, pp. 233–254.
Rieux, R., Simon, S., Defrance, H., 1999. Role of hedgerows andground cover management on arthropod populations in pearorchards. Agric. Ecosyst. Environ. 73, 119–127.
Rossi, R.E., Mulla, D.J., Journel, A.G., Franz, E.H., 1992. Geosta-tistical tools for modeling and interpreting ecological spatialdependence. Ecol. Monogr. 62, 277–314.
Sadof, C.S., Raupp, M.J., 1991. Effect of variegation in Euonymus
japonica var. aureus on two phloem feeding insects, Unaspis
euonymi (Homoptera: Diaspididae) and Aphis fabae (Homoptera:Aphididae). Environ. Entomol. 20, 83–89.
SAS Institute, 1985. SAS User�s Guide, Statistics, version 5. SASInstitute, Cary, NC.
Schwab, A., Dubois, D., Fried, P.M., Edwards, P.J., 2002. Estimatingthe biodiversity of hay meadows in north-eastern Switzerland onthe basis of vegetation structure. Agric. Ecosyst. Environ. 93, 197–209.
Shahjahan, M., 1974. Erigeron flowers as a food and attractive odorsource for Peristenus pseudopallipes, a braconid parasitoid of thetarnished plant bug. Environ. Entomol. 3, 69–72.
Shrewsbury, P.M., Raupp, M.J., 2000. Evaluation of components ofvegetational texture for predicting azalea lace bug, Stephanitis
pyrioides (Heteroptera: Tingidae), abundance in managed land-scapes. Environ. Entomol. 29, 919–926.
Sperry, C.E., Chaney, W.R., Shao, G., Sadof, C.S., 2001. Effects oftree density, tree species diversity, and percentage of hardscape onthree insect pests of honeylocust. J. Arboric. 27, 263–271.
Syme, P.D., 1975. The effects of flowers on the longevity and fecundityof two native parasites of the European pine shoot moth inOntario. Environ. Entomol. 4, 337–346.
Tobin, P.C., Pitts, C.W., 2002. Geostatistical analysis and the impactof moisture on the spatial and temporal distribution of larvalMusca domestica (Diptera: Muscidae). Environ. Entomol. 31, 273–280.
Tooker, J.F., Hanks, L.M., 2000a. Flowering plant hosts of adulthymenopteran parasitoids of central Illinois. Ann. Entomol. Soc.Am. 93, 580–588.
Tooker, J.F., Hanks, L.M., 2000b. Influence of plant communitystructure on natural enemies of pine needle scale (Homoptera:Diaspididae) in urban landscapes. Environ. Entomol. 29, 1305–1311.
Wackers, F.L., 2004. Assessing the suitability of flowering herbs asparasitoid food sources: flower attractiveness and nectar accessi-bility. Biol. Control 29, 307–314.
White, A.J., Wratten, S.D., Berry, N.A., Weigmann, U., 1995.Habitat manipulation to enhance biological control of Brassica
pests by hover flies (Diptera: Syrphidae). J. Econ. Entomol. 88,1171–1176.

216 E.J. Rebek et al. / Biological Control 33 (2005) 203–216
Wright, R.J., DeVries, T.A., Young, L.J., Jarvi, K.J., Seymour, R.C.,2002. Geostatistical analysis of the small-scale distribution ofEuropean corn borer (Lepidoptera: Crambidae) larvae and damagein whorl stage corn. Environ. Entomol. 31, 160–167.
Zhao, J.Z., Ayers, G.S., Grafius, E.J., Stehr, F.W., 1992. Effects ofneighboring nectar-producing plants on populations of pest Lep-idoptera and their parasitoids in broccoli plantings. Great LakesEntomol. 25, 253–258.