manual for - cdn.ioos.noaa.gov · goos global ocean observing system ioos integrated ocean...
TRANSCRIPT

Manual for Real-Time Quality Control of Dissolved Nutrients Observations
A Guide to Quality Control and Quality Assurance for Dissolved Nutrients Observations in Coastal Oceans
Version 1.1 February 2018

ii
February 20, 2018
February 20, 2018
February 20, 2018
Document Validation
U.S. IOOS Program Office Validation
______________________________________________________________________________ Carl C. Gouldman, U.S. IOOS Program Director Date
QARTOD Project Manager Validation
______________________________________________________________________________ Kathleen Bailey, U.S. IOOS Project Manager Date
QARTOD Board of Advisors Validation
__________________________________________________________ Julianna O. Thomas, Southern California Coastal Ocean Observing System Date
Dissolved Nutrients
iii
Table of Contents
Table of Contents ................................................................................................ iii
List of Figures ...................................................................................................... iv
List of Tables ......................................................................................................... v
Revision History ................................................................................................... vi
Endorsement Disclaimer .................................................................................... vii
Acknowledgements ........................................................................................... viii
Acronyms and Abbreviations .............................................................................. ix
Definitions of Selected Terms ............................................................................... x
1.0 Background and Introduction ..................................................................... 1
2.0 Purpose/Constraints/Applications ............................................................. 3 2.1 Purpose ............................................................................................................................................................... 3 2.2 Temperature/Salinity ....................................................................................................................................... 5 2.3 Constraints ......................................................................................................................................................... 5
2.3.1 Data Processing Methodology ........................................................................................................ 5 2.3.2 Traceability to Accepted Standards ................................................................................................ 6 2.3.3 The Effect of Dynamic Environments on Sensor Data ............................................................. 7 2.3.4 Sensor Deployment Considerations and Hardware Limitations ............................................... 7
2.4 Applications of Dissolved Nutrients Data ................................................................................................. 15
3.0 Quality Control ........................................................................................... 17 3.1 QC Flags .......................................................................................................................................................... 17 3.2 Test Hierarchy ................................................................................................................................................. 18 3.3 QC Tests .......................................................................................................................................................... 19
3.3.1 Applications of QC Tests to Stationary DN Sensors ................................................................ 19 Test 1) Gap Test (Required) ........................................................................................................................ 19 Test 2) Syntax Test (Required) .................................................................................................................... 20 Test 3) Location Test (Required) ................................................................................................................ 20 Test 4) Gross Range Test (Required) ........................................................................................................ 21 Test 5) Climatology Test (Strongly Recommended) ............................................................................... 21 Test 6) Spike Test (Strongly Recommended) ........................................................................................... 22 Test 7) Rate of Change Test (Strongly Recommended) ......................................................................... 23 Test 8) Flat Line Test (Strongly Recommended) ..................................................................................... 24 Test 9) Multi-Variate Test (Suggested) ...................................................................................................... 25 Test 10) Attenuated Signal Test (Suggested) ............................................................................................. 26 Test 11) Neighbor Test (Suggested) ............................................................................................................ 27 3.3.2 Applications of QC Tests to DN Sensor Deployments ........................................................... 27
4.0 Summary ..................................................................................................... 32
5.0 References .................................................................................................. 34

Dissolved Nutrients
iv
Appendix A Quality Assurance ...................................................................... A-1 A.1 Sensor Calibration Considerations ............................................................................................................. A-1 A.2 Sensor Comparison ...................................................................................................................................... A-1 A.3 Bio-fouling and Corrosion Prevention Strategies.................................................................................... A-3 A.4 Common QA Considerations ..................................................................................................................... A-4 A.5 QA Levels for Best Practices ...................................................................................................................... A-5 A.6 Additional Sources of QA Information .................................................................................................... A-6 A.7 Sample Checklists ......................................................................................................................................... A-6
General QA Checklist: ................................................................................................................................ A-6 Deployment Checklist ................................................................................................................................. A-7 Post-deployment Checklist ......................................................................................................................... A-7
Appendix B Dissolved Nutrients Manual Team and Reviewers .............. Error! Bookmark not defined.
List of Figures
Figure 2-1. Nitrate spikes observed during the passage of a tropical storm are associated with an increase in
the standard deviation of the measurements, perhaps attributable to interference such as an
increase in turbidity. Close scrutiny would be possible if the high-frequency measurements were
available in real time. (Graphic courtesy of Jeff Scudder/University of South Florida) ................. 6 Figure 2-2. (L) shows a Sea-Bird Scientific SUNA V2 (Submersible Ultraviolet Nitrate Analyzer) mounted on
a fixed structure on the Mississippi River at Baton Rouge, where the instrument cage is lowered
and raised. (R) shows a NexSens buoy supporting a Sea-Bird Scientific SUNA nitrate sensor and
WET Labs Cycle Phosphate sensor (in addition to a YSI EXO multi-parameter sonde
measuring algal pigments, turbidity, and dissolved organic matter). (Photos courtesy of Brian
Pellerin/USGS) ........................................................................................................................................... 8 Figure 2-3. A cage for a boat deployment in the Bay Delta with several instruments (fluorometers, nitrate
sensors, phosphate sensors, etc.). (Photo courtesy of Brian Pellerin/USGS) .................................. 9 Figure 2-4. WebbGlider Profiler 3-D (L) (photo courtesy of Dr. Grace Saba) and Liquid Robotics Wave
Glider Mobile Surface (R) (Photo courtesy of Liquid Robotics). ....................................................... 9 Figure 2-5. WET Labs AMP C100 In-Situ Profiler. (Photo courtesy of WET Labs) .......................................... 10 Figure 2-6. Commonly used DN sensors. (Photos courtesy of Corey Koch/WET Labs, Pompeo
Moscetta/SYSTEA, Vince Kelly/Green Eyes LLC) .......................................................................... 12 Figure 2-7. These Sea-Bird Scientific Cycle PO4 phosphate sensors have accumulated an external bio-fouling
coating during deployment (top). A Sea-Bird Scientific SUNA nitrate sensor uses a rotating,
motorized brush to keep the optical lenses free of bio-fouling. (Photos courtesy of Corey
Koch/WET Labs) .................................................................................................................................... 12 Figure 2-8A-F. Time-series of nitrate concentrations at instrument depth determined optically by the ISUS
and standard method chemical assays of total nitrates (nitrate plus nitrite). Burst optical data
were collected hourly and data was binned to 10 seconds average calls of nitrate concentration
at a sampling rate of 1 Hz. (Photo courtesy of Dr. Eric Milbrandt/Sanibel-Captiva Conservation
Foundation) ............................................................................................................................................... 14
Dissolved Nutrients
v
List of Tables
Table 2-1. Types of platforms and areas included and excluded in this manual. .................................................... 4
Table 2-2. DN variables that are included or excluded from this manual. ............................................................... 5
Table 2-3. Commonly used sensors for DN observations........................................................................................ 11
Table 3-1. Flags for real-time data (UNESCO 2013) ................................................................................................ 18
Table 3-2. QC Tests in order of implementation ....................................................................................................... 18
Table 3-3 Application of Required QC Tests for Sensor Deployments. Note: The ‘s’ axis means “along
path.” ........................................................................................................................................................... 28
Table 3-4. Application of Strongly Recommended QC Tests for Sensor Deployments ..................................... 29
Table 3-5. Application Suggested QC Tests for Sensor Deployments ................................................................... 31
Dissolved Nutrients
vi
Revision History
Date Revision Description Notes September 2015 Original Document Published February 2018 Revise cover to reflect correct version and publication date.
Revise names and dates on Document Validation page (page ii).
Update Table of Contents (pages iii-iv).
Update Revision History (page v).
Update email address in Request to Manual Users (page vi).
Update Acknowledgements to include manual update version 1.1 team members (page vii).
Update Acronyms and Abbreviations (pages viii).
Add interoperable, sensor, variable to Definitions of Selected Terms. Update format of definitions. (page ix).
Update section 1.0 to reflect QARTOD publications completed since original dissolved nutrients manual; added digital object identifiers for each manual (pages 1-2).
Update sections 2.1, 2.2 and 2.3 to clarify and enhance existing content. Add definition of conservative variable and reference (section 2.3.3) and revise table 2-1, 2-3, and figure 2-6.
Update section 3.3 to reflect more recent references and to make minor editing adjustments to Tests 4, 5, 6, 7, 8, 9, 10, 11, 12, and 13.
Add examples to section 3.3.2, table 3-4, Test 7; minor revision to table 3-4, Tests 7 and 8.
Update References to include JCGM 2012 added for sensor definition.
Update QARTOD Board of Advisor and Regional Association Director listings in appendix B (B-1 through B-3).
Perform general editing for consistency in style and terminology; update Web links.
Update formatting to ensure compliance to Section 508 requirements.
Version 1.1

Dissolved Nutrients
vii
Endorsement Disclaimer
Mention of a commercial company or product does not constitute an
endorsement by NOAA. Use of information from this publication for
publicity or advertising purposes concerning proprietary products or
the tests of such products is not authorized.
Request to Manual Users
To gauge the success of the QARTOD project, it helps to be aware
of groups working to utilize these QC tests. Please notify us of your
efforts or intentions to implement QARTOD processes by sending a
brief email to [email protected] or posting a notice at
http://www.linkedin.com/groups?gid=2521409.

Dissolved Nutrients
viii
Acknowledgements
In addition to acknowledging support for the original version of this manual in the paragraphs below, we
wish to thank those who assisted in creating this updated version (appendix B). We appreciate the review and
comments provided by Robert Maxfield, Senior Science Advisor for Advanced Monitoring Technology (U.S.
Environmental Protection Agency/New England). We thank Dr. Brian Pellerin (U.S. Geological Survey)
once again, and Brett Johnston from the USGS Florida-Caribbean Water Science Center for their reviews and
comments. We are especially thankful for the extensive reviews provided by Dr. Matthias Lankhorst at UCSD
Scripps Institution of Oceanography and Vince Kelly at Green Eyes LLC.
We are grateful to our entire dissolved nutrients team (appendix B), especially to those who served on the
dissolved nutrients manual committee and provided content and suggestions for the initial draft, as well as all
who reviewed each draft and provided valuable feedback.
Much appreciation goes to Dr. Emilio Mayorga (University of Washington/NANOOS) and Daniel Schar
(Alliance for Coastal Technologies/University of Hawaii) for their time and enthusiasm while serving as co-
editors.
The manual was greatly improved thanks to the extensive feedback provided by Corey Koch (WET Labs)
and Dr. Brian Pellerin (USGS). We also benefited from the wisdom of Dr. Carol Janzen (formerly at Sea-Bird
Scientific and now at AOOS). Many thanks for early input and support go to Dr. Eric Milbrandt (Sanibel-
Captiva Conservation Foundation), to Eric Breuer and Nathan Holcomb (NOS/CO-OPS), and to Dr. Brian
Lapointe (Florida Atlantic University). We also appreciate the suggestions related to low nutrient, open-ocean
regions provided by Dr. Jia-Zhong Zhang (NOAA/AOML).
Finally, thanks to the QARTOD Board of Advisors (listed in appendix B) and to Carl Gouldman, Derrick
Snowden, Kathleen Bailey, and Kate Culpepper (U.S. IOOS) for their support of the QARTOD project.

Dissolved Nutrients
ix
Acronyms and Abbreviations
AOOS Alaska Ocean Observing System
AUV Autonomous Underwater Vehicle
CDIP Coastal Data Information Program
CeNCOOS Central and Northern California Ocean Observing System
CO-OPS Center for Operational Oceanographic Products and Services
CRC Cyclic Redundancy Check
DIW De-ionized Water
DMAC Data Management and Communications
DN Dissolved Nutrients
GCOOS Gulf of Mexico Coastal Ocean Observing System
GLOS Great Lakes Observing System
GOOS Global Ocean Observing System
IOOS Integrated Ocean Observing System
ISUS In-situ Ultraviolet Spectrophotometer
MARACOOS Mid-Atlantic Regional Association Coastal Ocean Observing System
mg/L Milligrams per Liter
µM Micromoles (also called micromolar = 10^-6 mol/liter)
NANOOS Northwest Association of Networked Ocean Observing Systems
NERACOOS North Eastern Regional Association of Coastal Ocean Observing Systems
NIST National Institute of Standards and Technology
NOAA National Oceanic and Atmospheric Administration
PacIOOS Pacific Islands Ocean Observing System
QARTOD Quality Control/Quality-Assurance of Real-Time Oceanographic Data
QA Quality Assurance
QC Quality Control
RCOOS Regional Coastal Ocean Observing System
SCCOOS Southern California Coastal Ocean Observing System
SD Standard Deviation
SECOORA Southeast Coastal Ocean Observing Regional Association
UNESCO United Nations Educational, Scientific, and Cultural Organization
USGS United States Geological Survey

Dissolved Nutrients
x
Definitions of Selected Terms
This manual contains several terms whose meanings are critical to those using the manual. These terms are included in the following table to ensure that the meanings are clearly defined.
Codable Instructions Codable instructions are specific guidance that can be used by a software programmer to design, construct, and implement a test. These instructions also include examples with sample thresholds.
Data Record Data record is one or more messages that form a coherent, logical, and complete observation.
Dissolved Nutrients (DN) Sensor
DN sensor is a generic reference to a sensor used to measure one or more specific dissolved nutrients such as NO3−, NO2−, NH4+, PO4
3−, SiO43−, Ptot,
or Ntot. No single sensor is capable of measuring all dissolved nutrients; for a number of dissolved nutrients, no sensors are available.
Interoperable Interoperable means the ability of two or more systems to exchange and mutually use data, metadata, information, or system parameters using established protocols or standards.
Message Message means a standalone data transmission. A data record can be composed of multiple messages.
Operator Operators are individuals or entities responsible for collecting and providing data.
Quality Assurance (QA)
QA means processes that are employed with hardware to support the generation of high quality data. (section 2.0 and appendix A)
Quality Control (QC)
QC means follow-on steps that support the delivery of high-quality data, requiring both automation and human intervention. (section 3.0)
Real Time Real time means that: data are delivered without delay for immediate use; time series extends only backwards in time, where the next data point is not available; and sample intervals may range from a few seconds to a few hours or even days, depending upon the sensor configuration (section 1.0).
Sensor A sensor is a device that detects or measures a physical property and provides the result without delay. A sensor is an element of a measuring system that is directly affected by a phenomenon, body, or substance carrying a quantity to be measured. (JCGM 2012)
Thresholds Thresholds are limits that are defined by the operator.
Variable A variable is an observation (or measurement) of biogeochemical properties within oceanographic and/or meteorological environments.

Dissolved Nutrients
1
1.0 Background and Introduction
The U.S. Integrated Ocean Observing System (IOOS®) has a vested interest in collecting high-quality data for
the 26 core variables (U.S. IOOS 2010) measured on a national scale. In response to this interest, U.S. IOOS
continues to establish written, authoritative procedures for the quality control (QC) of real-time data through
the Quality Assurance/Quality Control of Real-Time Oceanographic Data (QARTOD) Project, addressing
each variable as funding permits. This dissolved nutrients (DN) data manual is the eighth in a series of
guidance documents that address the QC of real-time data for each core variable and the eighth manual to be
updated.
Please refer to https://ioos.noaa.gov/project/qartod/ for the following documents:
1) U.S. Integrated Ocean Observing System, 2015. U.S IOOS QARTOD Project Plan -
Accomplishments for 2012–2016 and Update for 2017–2021. 47 pp.
https://doi.org/10.7289/V5JQ0Z71
2) U.S. Integrated Ocean Observing System, 2015. Manual for Real-Time Quality Control of Dissolved
Oxygen Observations Version 2.0: A Guide to Quality Control and Quality Assurance for Dissolved
Oxygen Observations in Coastal Oceans. 48 pp. https://doi.org/10.7289/V5ZW1J4J
3) U.S. Integrated Ocean Observing System, 2015. Manual for Real-Time Quality Control of In-Situ
Current Observations Version 2.0: A Guide to Quality Control and Quality Assurance of Acoustic
Doppler Current Profiler Observations. 51 pp. https://doi.org/10.7289/V5WM1BMZ
4) U.S. Integrated Ocean Observing System, 2015. Manual for Real-Time Quality Control of In-Situ
Surface Wave Data Version 2.0: A Guide to Quality Control and Quality Assurance of In-Situ
Surface Wave Observations. 64 pp. https://doi.org/10.7289/V5KK991T
5) U.S. Integrated Ocean Observing System, 2015. Manual for Real-Time Quality Control of In-Situ
Temperature and Salinity Data Version 2.0: A Guide to Quality Control and Quality Assurance of In-
Situ Temperature and Salinity Observations. 56 pp. https://doi.org/10.7289/V5V40SD4
6) U.S. Integrated Ocean Observing System, 2014. Manual for Real-Time Quality Control of Water
Level Data Version 2.0: A Guide to Quality Control and Quality Assurance of Water Level
Observations. 43 pp. https://doi.org/10.7289/V5QC01Q7
7) U.S. Integrated Ocean Observing System, 2017. Manual for Real-Time Quality Control of Wind Data
Version 1.1: A Guide to Quality Control and Quality Assurance of Coastal and Oceanic Wind
Observations. 47 pp. https://doi.org/10.7289/V5FX77NH
8) U.S. Integrated Ocean Observing System, 2017. Manual for Real-Time Quality Control of Ocean
Optics Data Version 1.1: A Guide to Quality Control and Quality Assurance of Coastal and Oceanic
Optics Observations. 49 pp. https://doi.org/10.7289/V5XW4H05
9) U.S. Integrated Ocean Observing System, 2016. Manual for Real-Time Quality Control of High
Frequency Radar Surface Currents Data Version 1.0: A Guide to Quality Control and Quality
Assurance of High Frequency Radar Surface Currents Data Observations. 58 pp.
https://doi.org/10.7289/V5T43R96

Dissolved Nutrients
2
10) U.S. Integrated Ocean Observing System, 2017. Manual for Real-Time Quality Control of
Phytoplankton Data Version 1.0: A Guide to Quality Control and Quality Assurance of
Phytoplankton Data Observations. 67 pp. https://doi.org/10.7289/V56D5R6S
11) U.S. Integrated Ocean Observing System, 2017. Manual for Real-Time Quality Control of Passive
Acoustics Data Version 1.0: A Guide to Quality Control and Quality Assurance of Passive Acoustics
Observations. 45 pp. https://doi.org/10.7289/V5PC30M9
Please reference this document as:
U.S. Integrated Ocean Observing System, 2018. Manual for Real-Time Quality Control of Dissolved
Nutrients Data Version 1.1: A Guide to Quality Control and Quality Assurance of Coastal and
Dissolved Nutrients Observations. 56 pp. https://doi.org/10.7289/V5TT4P7R
This manual is a living document that reflects the state-of-the-art QC testing procedures for DN
observations. It is written for the experienced operator but also provides examples for those who are just
entering the field.

Dissolved Nutrients
3
2.0 Purpose/Constraints/Applications
The following sections describe the purpose of this manual, as well as the constraints that operators may
encounter when performing QC of DN data and specific applications of those data.
2.1 Purpose
The purpose of this manual is to provide guidance to the U.S. IOOS and the dissolved nutrients community at
large for the real-time QC of DN measurements using an agreed-upon, documented, and implemented standard
process. This manual is also a deliverable to the U.S. IOOS Regional Associations and the ocean observing
community and represents a contribution to a collection of core variable QC documents.
Most operators provide real-time data on a provisional basis, alerting users that post-processing is required to
validate their data. However, even this provisional data should be quality controlled. Data released in real time
should be subjected to automated QC processes, which: 1) provide a quality-control indicator, 2) alert the
operator when questionable or interesting data are presented, and 3) prevent the dissemination of bad data.
These practices for sensor QC of DN data were developed by operators with experience using a variety of
sensors and technologies. In-situ, real-time detection of DN can be accomplished using direct spectroscopy
methods, ion-specific electrodes, or more traditional wet chemistry. Systems using wet chemistry draw water
samples into a reagent mixing chamber, where the chemical reaction is measured and quantified. This process
is controlled by micro-pumps, injection valves, and small reactor cells combined with absorption or
fluorescence detectors. Using these miniaturized colorimetric or fluorometric methods leads to sensitive in-
situ measurements of any dissolved chemical species that can form a color complex. Some of these systems
may require frequent maintenance due to the complexity associated with pumps, chambers, mixing, and
detection components. They may require frequent calibration of fluid delivery devices (pumps) and
replenishment of multiple reagent and standard solutions, some of which are not stable unless kept at low
temperature and shielded from light. Some systems can operate from four to eight weeks without replacing
reagents, depending on sample frequency and other environmental circumstances. Spectroscopic and ion-
specific electrode technologies are equally subject to drift, which requires quality assurance (QA) and QC.
DN observations covered by these procedures are collected as a measure of water quality along bays or
coasts1 in real-time or near-real-time settings. These tests draw from existing expertise in programs such as
the Studies of Ecological and Chemical Responses to Environmental Trends, a joint effort by the California
Cooperative Oceanic Fisheries Investigations and the Monterey Bay Aquarium Research Institute.
This manual differs from existing QC procedures for DN measurements in that its focus is on real-time data.
It presents a series of eleven tests that operators can incorporate into practices and procedures for QC of DN
measurements. These tests apply only to the in-situ, real-time measurement of DN as observed by sensors
deployed on fixed or mobile platforms and not to remotely sensed DN measurements (e.g., satellite
observations). Table 2-1 shows types of platforms and areas that are included and excluded in this manual.
Those excluded are deemed to require substantially different QC tests, a different observational community,
1The coast means coasts of the U.S. Exclusive Economic Zone (EEZ) and territorial sea (http://oceanservice.noaa.gov/facts/eez.html) Great Lakes, and semi-enclosed bodies of water and tidal wetlands connected to the coastal ocean.

Dissolved Nutrients
4
substantially greater resources, or they presently lack a real-time data delivery capability. Whenever possible,
they will be included in later manual updates.
Table 2-1. Types of platforms and areas included and excluded in this manual.
Platforms Included Platforms Excluded
Coastal and offshore buoys Oil platforms C-MAN (Coastal-Marine Automated Network) Surface fixed and mobile platforms Autonomous surface vessels and ships
Satellite Aircraft
These test procedures are written as a high-level narrative from which a computer programmer can develop code
to execute specific tests and set data flags (data quality indicators) within a software program. Those
implementing QARTOD tests have created a code repository (https://github.com/ioos/qartod) where
operators may find or post examples of code in use. Although certain tests are recommended, thresholds can
vary among data providers. The tests described here are designed to support a range of DN sensors and operator
capabilities. Some well-established programs, such as the U.S. Geological Survey (USGS) National Real-Time
Water Quality program (http://nrtwq.usgs.gov), with the highest standards have implemented very rigorous QC
processes. Others, with different requirements, may utilize sensors with data streams that cannot support as
many QC checks—all have value when used prudently. It is the responsibility of the users to understand and
appropriately utilize data of varying quality, and operators must provide support by documenting and publishing
their QC processes. A balance must be struck between the time-sensitive needs of real-time observing systems
and the degree of rigor that has been applied to non-real-time systems by operators with decades of QC
experience.
High-quality marine observations require sustained QA and QC practices to ensure credibility and value to
operators and data users. QA practices involve processes that are employed with hardware to support the
generation of high-quality data, such as a sufficiently accurate, precise, and reliable sensor with adequate
resolution. Other QA practices include: sensor calibration; calibration checks and/or in-situ verification,
including post-deployment calibration; proper deployment considerations, such as measures for corrosion
control and anti-fouling; solid data communications; adequate maintenance intervals; and creation of a robust
quality control process. Post-deployment calibration (instrument verification after recovery) issues are not part of
the scope of this manual. However, QC and QA are interrelated, and both are important to the process;
therefore, QA considerations are briefly addressed in appendix A.
QC involves follow-on steps that support the delivery of high-quality data and requires both automation and
human intervention. QC practices include such things as format, checksum, timely arrival of data, threshold
checks (minimum/maximum rate of change), neighbor checks, climatology checks, model comparisons,
signal/noise ratios, verification of user satisfaction, and generation of data flags (Bushnell 2005).
The process of ensuring data quality is not always straightforward. QA/QC procedures may be specific to a
sensor technology or even to a particular manufacturer’s model, so the establishment of a methodology that is
applicable to every sensor is challenging.

Dissolved Nutrients
5
2.2 Temperature/Salinity
The DN sensor detects a measure of dissolved nutrient concentration, but the sensor response and DN
concentration calculations may also depend upon the quality of the temperature and salinity data (Martini et al.
2017). Corrections to the sensor output may be required to account for the effects of temperature and salinity.
These corrections might occur internally in many instruments, and in these cases, failure of the instrument to
collect accurate temperature and/or salinity data necessitates that the DN data be highlighted with a suspect or
fail flag and reviewed during the QC process. Not all sensors make the temperature data available, and not all
sensors measure salinity. Some DN sensors require the operator to input a fixed salinity that represents the likely
value. Often these temperature and salinity corrections are applied during post-processing. Other interferences
can be important as well. For example, high turbidity and colored dissolved organic matter values can cause
measurement errors, especially in lakes and coastal regions.
2.3 Constraints
Many measurements of the 26 U.S. IOOS core variables of interest utilize similar sensing technologies but
require substantially different QC methods. However, QC tests should not be overly generic, so these
variables must be divided and grouped so that specific meaningful tests are appropriate to the variables
included in the group. In this manual, DN that are sufficiently common in nature to have similar QC checks
are identified. Table 2-2 shows the variables to be addressed in this manual, as well as those that are excluded.
Table 2-2. DN variables that are included or excluded from this manual.
Variables Included Variables Excluded
Nitrogen (NO3, NO2, and NH4) Phosphate (PO4) Silicate (SiO4)
Dissolved Organic Carbon Sulfur/Sulphates Dissolved Organic Nitrogen Dissolved Organic Phosphorus
2.3.1 Data Processing Methodology
The type of sensor system used to collect DN data and the system used to process and transmit the
measurements determine which QC algorithms are used. In-situ systems with sufficient onboard processing
power within the sensor may substantially process the data to produce derived products, such as temperature
and salinity corrections to DN observations. Some sensors may sample at high-rate or burst mode (e.g.,
1 Hz). These samples are used to produce the actual, real-time value transmitted (e.g., hourly value). Statistical
information about the high-rate sample distributions can also be used and transmitted as real-time QC
parameters (e.g., sample standard deviations and outliers). If ample transmission capability is available,
expanded data streams may be transmitted ashore and subsequently quality controlled from there. To
accommodate a range of different operator methodologies, three levels of QC are proposed: required,
strongly recommended, and suggested.
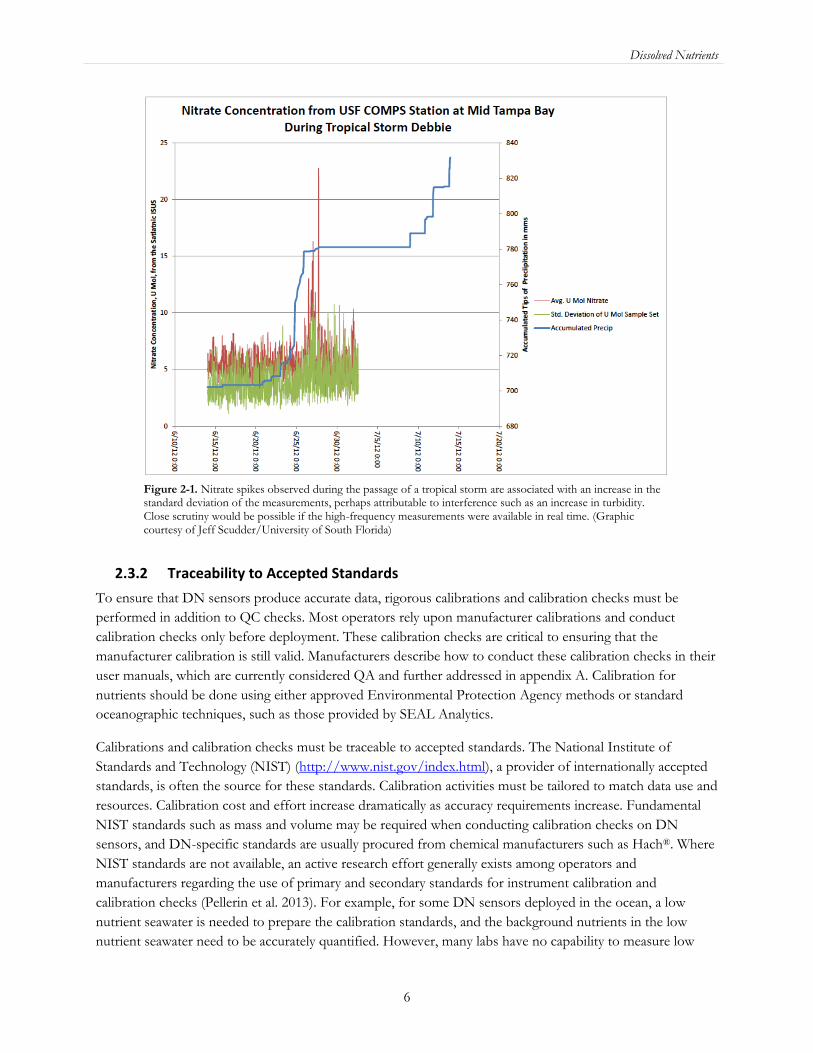
When onboard processing is used to reduce high-frequency sampling, apply associated corrections, and
generate the resultant observation to be transmitted, operators should have a full understanding of the
algorithms employed. These processes are often proprietary, and when not fully revealed by the vendor or
manufacturer, the operator should sufficiently test the system to gain the needed understanding. In the
example provided in fig. 2-1, nitrate data obtained during the passage of Tropical Storm Debbie are shown.
The 1 Hz data samples were processed by a data logger for 30 seconds. There is a clear nitrate signal, but the
associated standard deviation values show that the data quality is poor, perhaps due to an increase in turbidity.
Dissolved Nutrients
6
Figure 2-1. Nitrate spikes observed during the passage of a tropical storm are associated with an increase in the standard deviation of the measurements, perhaps attributable to interference such as an increase in turbidity. Close scrutiny would be possible if the high-frequency measurements were available in real time. (Graphic courtesy of Jeff Scudder/University of South Florida)
2.3.2 Traceability to Accepted Standards
To ensure that DN sensors produce accurate data, rigorous calibrations and calibration checks must be
performed in addition to QC checks. Most operators rely upon manufacturer calibrations and conduct
calibration checks only before deployment. These calibration checks are critical to ensuring that the
manufacturer calibration is still valid. Manufacturers describe how to conduct these calibration checks in their
user manuals, which are currently considered QA and further addressed in appendix A. Calibration for
nutrients should be done using either approved Environmental Protection Agency methods or standard
oceanographic techniques, such as those provided by SEAL Analytics.
Calibrations and calibration checks must be traceable to accepted standards. The National Institute of
Standards and Technology (NIST) (http://www.nist.gov/index.html), a provider of internationally accepted
standards, is often the source for these standards. Calibration activities must be tailored to match data use and
resources. Calibration cost and effort increase dramatically as accuracy requirements increase. Fundamental
NIST standards such as mass and volume may be required when conducting calibration checks on DN
sensors, and DN-specific standards are usually procured from chemical manufacturers such as Hach®. Where
NIST standards are not available, an active research effort generally exists among operators and
manufacturers regarding the use of primary and secondary standards for instrument calibration and
calibration checks (Pellerin et al. 2013). For example, for some DN sensors deployed in the ocean, a low
nutrient seawater is needed to prepare the calibration standards, and the background nutrients in the low
nutrient seawater need to be accurately quantified. However, many labs have no capability to measure low

Dissolved Nutrients
7
background nutrients in the low nutrient seawaters. Seawater nutrient consensus reference material for total
dissolved nitrogen from the International GO-SHIP community is available at
http://yyy.rsmas.miami.edu/groups/biogeochem/CRM.html.
2.3.3 The Effect of Dynamic Environments on Sensor Data
DN measurements can be challenging for two reasons: DNs are non-conservative2 variables, and dynamic
coastal regions create rapid horizontal and vertical water mass changes. Tidal and meteorological events can
create substantial steps in the DN time series. Other variations are induced by such things as seasonal
stratification, upwelling, organic loading, increased biological activity (blooms), air-sea exchange, river inputs,
spawning aggregations, fish kills, (indeed, all biological activities), sediment-water exchange, groundwater
seepage, and springs.
As with many other real-time QC challenges, the question is how to deal with extremes associated with a
phenomenon (e.g., storm, spill, etc.) in a data time series, yet identify questionable data values that may have
similar characteristics. One option is to allow a tighter QC requirement for the data, highlighting the event
with a suspect flag and requiring a human review. This way, the event is both acknowledged as substantial if
real, and identified as potentially questionable in the absence of causal forces.
2.3.4 Sensor Deployment Considerations and Hardware Limitations
DN sensors can be deployed in several ways. Stationary sensor deployments are on fixed platforms or
moorings where there is minimal movement either horizontally or vertically. They may be lowered from a
ship, deployed aboard autonomous surface or submerged vehicles, or installed on moored or drifting buoys.
The typical constraints of oceanographic data collection apply—including cost, power, data transmission, bio-
fouling, vandalism, and electronics in a marine environment. Examples of these deployment options are
shown in figs. 2-2 and 2-3.
Mobile platforms are available in a variety of configurations and require different real-time DN QC
considerations. Mobile platforms are, in order of increasing complexity: fixed vertical profilers, mobile surface
vessels, and vessels freely operating in three dimensions (e.g., gliders, floats, powered autonomous underwater
vehicles or AUVs). Figures 2-4 and 2-5 provide examples of mobile platforms.
Data derived from sensors on moving platforms are limited due to response time of the sensor, i.e., the time
it takes for a technology to respond to a step change in the environment or to multiple forces. For example, a
nutrient sensor might respond to a change in nutrient concentration, as well as to changes in temperature,
salinity, pressure, and other chemical conditions in the water column. Light can also cause interference on
optical instruments. Data from a glider or profiling CTD (conductivity/temperature/depth) system on a
moving platform will be affected by dynamic errors that, in most cases, have to be corrected in post-
processing. These limitations occur in most sensor technology.
2“Conservative constituents are physical, chemical, or biological properties of sea water that are not altered by external or internal processes which may either create or destroy the amount or concentration of such constituents or properties in a given volume of water” (Neumann and Pierson 1966). Temperature and salinity are conservative properties because there are no sources or sinks of heat and salt in the interior of the ocean. Other properties, such as oxygen are non-conservative. For example, oxygen content may change slowly due to oxidation of organic material and respiration by animals.

Dissolved Nutrients
8
Spatial and temporal resolution require a clear understanding of sensor response time, sample rate of the
instrument (and in some cases the average period per measurement, if one exists), and the vehicle speed. The
response time will often limit the realized resolution of an instrument, and accuracy may be limited relative to
the nutrient gradients through which the vehicle is traveling. For example, a sensor with a response time of 60
seconds, sampling at 1 Hz and moving through the water at 25 knots will not yield accurate map conditions.
Generally speaking, dynamic errors in moving platform data complicate QA/QC actions for real-time data.
Operators must understand the magnitude of these errors before setting QA/QC limits on data.
Figure 2-2. (L) shows a Sea-Bird Scientific SUNA V2 (Submersible Ultraviolet Nitrate Analyzer) mounted on a fixed structure on the Mississippi River at Baton Rouge, where the instrument cage is lowered and raised. (R) shows a NexSens buoy supporting a Sea-Bird Scientific SUNA nitrate sensor and WET Labs Cycle Phosphate sensor (in addition to a YSI EXO multi-parameter sonde measuring algal pigments, turbidity, and dissolved organic matter). (Photos courtesy of Brian Pellerin/USGS)

Dissolved Nutrients
9
Figure 2-3. A cage for a boat deployment in the Bay Delta with several instruments (fluorometers, nitrate sensors, phosphate sensors, etc.). (Photo courtesy of Brian Pellerin/USGS)
Figure 2-4. WebbGlider Profiler 3-D (L) (photo courtesy of Dr. Grace Saba) and Liquid Robotics Wave Glider Mobile Surface (R)
(Photo courtesy of Liquid Robotics).
Dissolved Nutrients
10
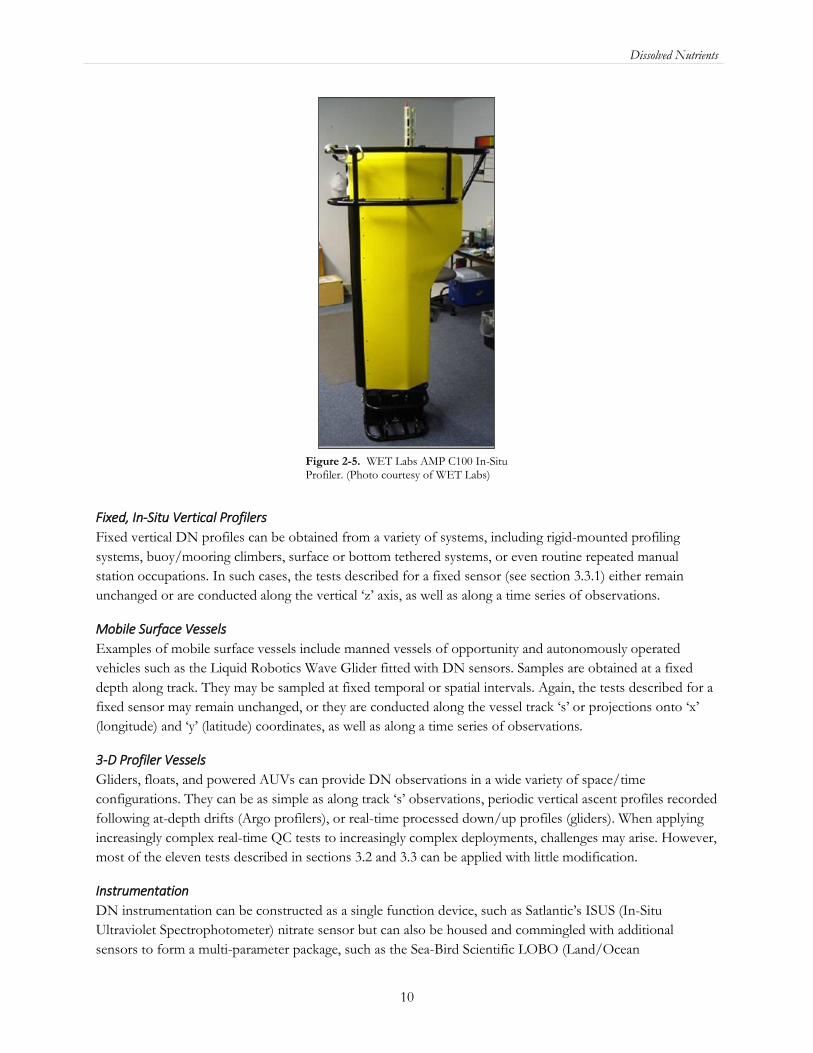
Figure 2-5. WET Labs AMP C100 In-Situ Profiler. (Photo courtesy of WET Labs)
Fixed, In-Situ Vertical Profilers
Fixed vertical DN profiles can be obtained from a variety of systems, including rigid-mounted profiling
systems, buoy/mooring climbers, surface or bottom tethered systems, or even routine repeated manual
station occupations. In such cases, the tests described for a fixed sensor (see section 3.3.1) either remain
unchanged or are conducted along the vertical ‘z’ axis, as well as along a time series of observations.
Mobile Surface Vessels
Examples of mobile surface vessels include manned vessels of opportunity and autonomously operated
vehicles such as the Liquid Robotics Wave Glider fitted with DN sensors. Samples are obtained at a fixed
depth along track. They may be sampled at fixed temporal or spatial intervals. Again, the tests described for a
fixed sensor may remain unchanged, or they are conducted along the vessel track ‘s’ or projections onto ‘x’
(longitude) and ‘y’ (latitude) coordinates, as well as along a time series of observations.
3-D Profiler Vessels
Gliders, floats, and powered AUVs can provide DN observations in a wide variety of space/time
configurations. They can be as simple as along track ‘s’ observations, periodic vertical ascent profiles recorded
following at-depth drifts (Argo profilers), or real-time processed down/up profiles (gliders). When applying
increasingly complex real-time QC tests to increasingly complex deployments, challenges may arise. However,
most of the eleven tests described in sections 3.2 and 3.3 can be applied with little modification.
Instrumentation
DN instrumentation can be constructed as a single function device, such as Satlantic’s ISUS (In-Situ
Ultraviolet Spectrophotometer) nitrate sensor but can also be housed and commingled with additional
sensors to form a multi-parameter package, such as the Sea-Bird Scientific LOBO (Land/Ocean
Dissolved Nutrients
11
Biogeochemical Observatory). To make the most meaningful DN observations, operators often co-locate a
wide variety of additional sensors such as pressure, temperature, salinity/conductivity, and chlorophyll A.
To make DN observations, operators employ a variety of sensors. Listed below are descriptions of several
types of sensors that generate data that could be subjected to the tests described herein. The list is not
comprehensive, and operators must determine if these tests apply to their particular DN sensor.
• Nitrate sensors: Modern instruments use ion-specific electrodes or UV absorption
techniques, and some apply temperature/salinity compensation to compute nitrate
concentration.
• Phosphate sensors: These devices still require the use of wet chemistry.
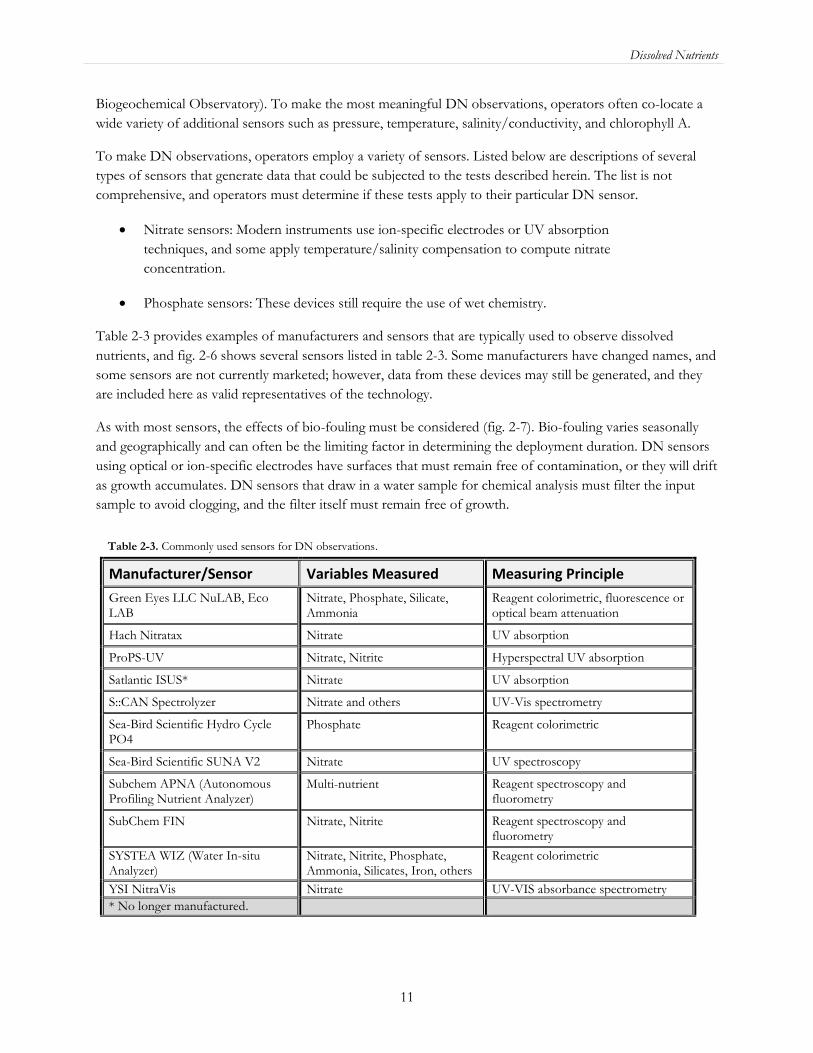
Table 2-3 provides examples of manufacturers and sensors that are typically used to observe dissolved
nutrients, and fig. 2-6 shows several sensors listed in table 2-3. Some manufacturers have changed names, and
some sensors are not currently marketed; however, data from these devices may still be generated, and they
are included here as valid representatives of the technology.
As with most sensors, the effects of bio-fouling must be considered (fig. 2-7). Bio-fouling varies seasonally
and geographically and can often be the limiting factor in determining the deployment duration. DN sensors
using optical or ion-specific electrodes have surfaces that must remain free of contamination, or they will drift
as growth accumulates. DN sensors that draw in a water sample for chemical analysis must filter the input
sample to avoid clogging, and the filter itself must remain free of growth.
Table 2-3. Commonly used sensors for DN observations.
Manufacturer/Sensor Variables Measured Measuring Principle
Green Eyes LLC NuLAB, Eco LAB
Nitrate, Phosphate, Silicate, Ammonia
Reagent colorimetric, fluorescence or optical beam attenuation
Hach Nitratax Nitrate UV absorption
ProPS-UV Nitrate, Nitrite Hyperspectral UV absorption
Satlantic ISUS* Nitrate UV absorption
S::CAN Spectrolyzer Nitrate and others UV-Vis spectrometry
Sea-Bird Scientific Hydro Cycle PO4
Phosphate Reagent colorimetric
Sea-Bird Scientific SUNA V2 Nitrate UV spectroscopy
Subchem APNA (Autonomous Profiling Nutrient Analyzer)
Multi-nutrient Reagent spectroscopy and fluorometry
SubChem FIN Nitrate, Nitrite Reagent spectroscopy and fluorometry
SYSTEA WIZ (Water In-situ Analyzer)
Nitrate, Nitrite, Phosphate, Ammonia, Silicates, Iron, others
Reagent colorimetric
YSI NitraVis Nitrate UV-VIS absorbance spectrometry
* No longer manufactured.

Dissolved Nutrients
12
Figure 2-6. Commonly used DN sensors. (Photos courtesy of Corey Koch/WET Labs, Pompeo Moscetta/SYSTEA, and Vince Kelly/Green Eyes LLC)
Figure 2-7. These Sea-Bird Scientific Cycle PO4 phosphate sensors have accumulated an external bio-fouling coating during deployment (top). A Sea-Bird Scientific SUNA nitrate sensor uses a rotating, motorized brush to keep the optical lenses free of bio-fouling. (Photos courtesy of Corey Koch/WET Labs)
The following sections describe the sensor technologies that are most often used, with a brief note about
typical observations and associated issues with nitrate sensors. Figure 2-8 shows the time series of nitrate

Dissolved Nutrients
13
observations obtained with Satlantic ISUS (now Sea-Bird Scientific) sensors at six locations in south Florida.
One problem in the maintenance routines provided by the manufacturer occurs during the 48 hours
(sometimes longer or shorter) after the ISUS is cleaned. The problem is particularly visible in figs. 2E and 2F.
The ISUS concentrations spike, then exponentially drop over time while the air bubble is worked out of the
system.
Field calibration of the ISUS can unpredictably and abruptly change the nitrate concentrations (figs. 2-8A-F).
Satlantic recommends updating the instrument calibrations in the field; however, the small volume of the
cuvette and the unpredictable nature of field conditions have led to problems. The small volume of the
cuvette used is subject to contamination by water containing particles and cells dripping off the bulkhead.
Under the current protocol, the probe tip is cleaned with isopropanol, then Type I DIW (de-ionized water). If
the DIW test is not within the instrument specifications (± 2 µM), then a new calibration is applied using
fresh Type I DIW. This calibration is done in the field under conditions that are less than ideal and where
temperature differences between calibrations and stations may cause large changes in the baseline nitrate
concentrations. It may be better to clean the instrument in the field but delay the update to the calibrations
until the instrument is in the laboratory under more tightly controlled conditions.

Dissolved Nutrients
14
Figure 2-8A-F. Time-series of nitrate concentrations at instrument depth determined optically by the ISUS and standard method chemical assays of total nitrates (nitrate plus nitrite). Burst optical data were collected hourly and data was binned to 10 seconds average calls of nitrate concentration at a sampling rate of 1 Hz. (Photo courtesy of Dr. Eric Milbrandt/Sanibel-Captiva Conservation
Foundation)
A. Blind Pass
Oct-07 Nov-07 Dec-07 Jan-08 Feb-08 Mar-08 Apr-08 May-08 Jun-08 Jul-08 Aug-08 Sep-08 Oct-08
Nitra
te (
-30
-20
-10
0
10
20
30
Nitra
te N
itrite
(m
g N
l-1
)
-0.2
-0.1
0.0
0.1
0.2ISUS V3 (SN 146)
Discrete FDEP
B. Fort Myers
Oct-07 Nov-07 Dec-07 Jan-08 Feb-08 Mar-08 Apr-08 May-08 Jun-08 Jul-08 Aug-08 Sep-08 Oct-08
Nitra
te (
-30
-20
-10
0
10
20
30
Nitra
te N
itrite
(m
g N
l-1
)
-0.2
-0.1
0.0
0.1
0.2ISUS V3 (SN 147)
Discrete FDEP
C. Gulf of Mexico
Oct-07 Nov-07 Dec-07 Jan-08 Feb-08 Mar-08 Apr-08 May-08 Jun-08 Jul-08 Aug-08 Sep-08 Oct-08
Nitra
te (
-30
-20
-10
0
10
20
30
Nitra
te N
itrite
(m
g N
l-1
)
-0.2
-0.1
0.0
0.1
0.2ISUS V3 (SN 150)
Discrete FDEP
D. Moore Haven
Nov-07 Dec-07 Jan-08 Feb-08 Mar-08 Apr-08 May-08 Jun-08 Jul-08 Aug-08 Sep-08 Oct-08
Nitra
te (
-30
-20
-10
0
10
20
30
Nitra
te N
itrite
(m
g N
l-1
)
-0.2
-0.1
0.0
0.1
0.2
ISUS V3 (SN 149)
Discrete FDEP
E. Redfish Pass
Oct-07 Nov-07 Dec-07 Jan-08 Feb-08 Mar-08 Apr-08 May-08 Jun-08 Jul-08 Aug-08 Sep-08 Oct-08
Nitra
te (
-30
-20
-10
0
10
20
30
Nitra
te N
itrite
(m
g N
l-1
)-0.2
-0.1
0.0
0.1
0.2ISUS V3 (SN 126)
Discrete FDEP
F.Shell Point
Oct-07 Nov-07 Dec-07 Jan-08 Feb-08 Mar-08 Apr-08 May-08 Jun-08 Jul-08 Aug-08 Sep-08 Oct-08
Nitra
te (
-30
-20
-10
0
10
20
30
Nitra
te N
itrite
(m
g N
l-1
)
-0.2
-0.1
0.0
0.1
0.2ISUS V3 (SN 151)
Discrete FDEP
Dissolved Nutrients
15
Such steps in a time series during a calibration, sensor swap, or cleaning provide valuable information for
future service intervals, and (if caused by bio-fouling) can be highly dependent on both the site and season.
Correcting a data shift like this is extremely difficult, so servicing schedules and the technology used should
be carefully considered. Constant improvements in anti-fouling measures and sensor technology stability are
being made. Operators should investigate which technology best suits their application, the field service
budget, and data quality goals.
Figures 2-8A-F also show increased noise levels toward the end of the record. Additional co-located sensors
might help to explain the cause, which could be optical interference by high levels of dissolved organic
matter. Test 9, the multi-variate test described herein, is designed with this specific application in mind.
While outside the scope of the real-time tests described in this manual, QA is critical to data quality. Sensors
require attention to proper QA measures both before and after the deployment. Operators must follow the
manufacturer’s recommendations for factory calibration schedules and proper sensor maintenance. Often,
operators take field samples during deployment, recovery, or service to validate the performance of an in-situ
sensor. As illustrated in figure 2-8, this is a risky time period for ensuring quality sensor data, often due to
initial stabilization, sensor/environment disturbance, or high fouling near the end. If resources permit, it is
recommended that samples be obtained mid-deployment without disturbing the sensor.
Also important, but beyond the scope of this document at present, is the determination and reporting of data
uncertainty. Knowledge of the accuracy of each observation is required to ensure that data are used
appropriately and aids in the computation of error bounds for subsequent products derived by users. All
sensors and measurements contain errors that are determined by hardware quality, methods of operation, and
data processing techniques. Operators should routinely provide a quantitative measure of data uncertainty in
the associated metadata. Such calculations can be challenging, so operators should also document the
methods used to compute the uncertainty. The limits and thresholds implemented by operators for the data
QC tests described here are a key component in establishing the observational error bounds. Operators are
strongly encouraged to consider the impact of the QC tests on data uncertainty, as these two efforts greatly
enhance the utility of their data.
Sensor redundancy is key to obtaining measurements and ensuring that uncertainties can be assigned to those
measurements. DN measurements are not independent, being sensitive primarily to local concentration.
Hence, comparing two adjacent instruments can assist in evaluation of data quality, as well as provide two (or
more) independent estimates of a variable of interest. Variation in the estimated values can be useful in
uncertainty calculations.
2.4 Applications of Dissolved Nutrients Data
Real-time observations of DN are important for a wide variety of applications, including:
• Water quality
o Monitoring for adherence to regulations
o Monitoring stormwater runoff and wastewater discharge
o Monitoring fish farm effluent
o Making load estimates
o Establishing nutrient criteria
o Evaluating nutrient management strategies and technologies

Dissolved Nutrients
16
• Ocean biogeochemistry research, e.g., harmful algal blooms prediction models
• Ocean productivity, e.g., fisheries studies
• Freshwater nutrient cycling research
• Agricultural best practices research
Other applications utilizing post-processed data do not require real-time QC but benefit from it through early
detection of DN sensors’ issues. Some examples of observatories that may benefit from standardized real-
time QC testing include:
• Florida Atlantic University Harbor Branch Indian River Lagoon Observatory,
http://fau.loboviz.com/
• Sanibel-Captiva Conservation Foundation River, Estuary and Coastal Observing Network
(RECON), http://recon.sccf.org/sites

Dissolved Nutrients
17
3.0 Quality Control
In order to conduct real-time QC on DN observations, the first pre-requisite is to understand the science and
context within which the measurements are being conducted. DN measurements are dependent upon many
things such as season, location, time of day, and the physical, chemical, and biological conditions where the
measurements are being taken. The real-time QC of these observations can be extremely challenging. Human
involvement is therefore important to ensure that solid scientific principles are applied to the process. Without
credible science-based thought, good data might be discarded, and bad data distributed. It is also important to
note that advances in DN sensor technology have eliminated many of the problems encountered in older devices.
Again, this manual focuses specifically on real-time data in coastal environments, so the operator is likely to
encounter aspects of data QC where the flags and tests described in the following sections do not apply
because the data are not considered to be real time. For example, in the absence of reference data points such
as water samples collected nearby, drift often cannot be detected or corrected. Drift correction for DN
sensors during post-processing is difficult even with a post-calibration in hand because drift in DN sensors is
not always linear. Drift is often caused by bio-fouling, usually results in a lower reading, and is accompanied
by an attenuated response. Another example might be the ability of some data providers to backfill data gaps.
In both of these examples, the observations are not considered to be real time for purposes of QC checks.
3.1 QC Flags
Data are evaluated using QC tests, and the results of those tests are indicated using flags in the data files.
Table 3-1 provides the set of flags and associated descriptions proposed by the International Oceanographic
Data and Information Exchange (IODE) and adopted by the Intergovernmental Oceanographic Commission
(IOC) in 2013. Operators may incorporate additional flags for inclusion in metadata records. For example, a
DN observation may fail the gross range test and be flagged as having failed the test. Additional flags may be
incorporated to provide more detailed information to assist with troubleshooting. If the data failed the gross
range check by exceeding the upper limit, “failed high” may indicate that the values were higher than the
expected range, but such detailed flags primarily support maintenance efforts and are presently beyond U.S.
IOOS requirements for QC of real-time data.
Flags set in real time should retain their original settings. Further post-processing of the data may yield
different conclusions from those suggested in the initial real-time flags. However, by retaining the real-time
flag settings, the historical documentation is preserved. The exception to the rule occurs for test 6 spike
check, where the most recent point must be flagged as “2 Not Evaluated” until the next point arrives, and the
spike check can be performed.

Dissolved Nutrients
18
Table 3-1. Flags for real-time data (UNESCO 2013)
Flag Description
Pass=1 Data have passed critical real-time quality control tests and are deemed adequate for use as preliminary data.
Not Evaluated=2 Data have not been QC-tested, or the information on quality is not available.
Suspect or Of High Interest=3
Data are considered to be either suspect or of high interest to data providers and users. They are flagged suspect to draw further attention to them by operators.
Fail=4 Data are considered to have failed one or more critical real-time QC checks. If they are disseminated at all, it should be readily apparent that they are not of acceptable quality.
Missing Data=9 Data are missing; used as a placeholder.
3.2 Test Hierarchy
This section outlines the eleven real-time QC tests that are required or recommended for selected DN sensors.
Tests are listed in order of increasing complexity, and generally, decreasing utility and are divided into three
groups. The tests in group 1 are required for all DN data measurements collected for U.S. IOOS. Operators
must consider each test in group 2 and group 3 to determine if it can be applied in their particular instance—
not all tests can be implemented in all situations. Table 3-2 shows the test hierarchy.
Table 3-2. QC Tests in order of implementation
Group 1 Required
Test 1 Test 2 Test 3 Test 4
Gap Test Syntax Test Location Test Gross Range Test
Group 2 Strongly
Recommended
Test 5 Test 6 Test 7 Test 8
Climatological Test Spike Test Rate of Change Test Flat Line Test
Group 3 Suggested
Test 9 Test 10 Test 11
Multi-Variate Test Attenuated Signal Test Neighbor Test
Some effort will be needed to select the best thresholds, which are determined at the local level and may
require multiple iterations of trial and error before final selections are made. This manual does not provide
overly generic guidance for selecting thresholds because doing so may not yield a good starting point at the
local level. Although more tests imply a more robust QC effort, valid reasons may exist for not invoking a
particular test in some instances. Where a test from group 2 or group 3 cannot be implemented, the operator
should document the reason it does not apply. Such flexibility is needed to support the U.S. IOOS effort,
since the number of tests conducted and the justification for not applying some tests are useful for evaluating
an operator’s skill levels.

Dissolved Nutrients
19
3.3 QC Tests
A variety of tests can be performed on the data to indicate data quality. Testing the integrity of the data
transmission itself using a gap test and syntax test is a first step. If the data transmission is not sound, further
testing is irrelevant. Additional checks evaluate the DN core variable values themselves through various
comparisons to the data stream and to the expected conditions in the given environment. The tests listed in
the following section presume a time ordered series of observations and denote the most recent observation
as DNn, preceded by a value at DNn-1, and so on backwards in time. They were developed from input by
authors and reviewers of this manual, as well as from QARTOD workshops (QARTOD 2003-2009). The
focus is primarily on the real-time QC of observation DNn, DNn-1, and DNn-2. There are several instances
when tests are closely related, e.g., the climatology test is similar to the gross range test, the multi-variate test
can be similar to the rate of change test, etc. As such, there are opportunities for clever and efficient coding,
which are left to the programmers.
3.3.1 Applications of QC Tests to Stationary DN Sensors
These eleven tests require operators to select a variety of thresholds. These thresholds should not be
determined arbitrarily but can be based on historical knowledge or statistics derived from more recently
acquired data. Operators must document the reasons and methods used to determine the thresholds.
Examples are provided in the following test tables; however, operators are in the best position to determine
the appropriate thresholds for their operations. Some tests rely on multiple data points most recently received
to determine the quality of the current data point. When this series of data points reveals that the entire group
fails, the current data point is flagged, but the previous flags are not changed. This action supports the view
that historical flags are not altered. The first example is in test 8, the flat line test, where this scenario will
become clearer. For additional information regarding flags, see U.S. IOOS (2017) posted on the U.S. IOOS
QARTOD website.
Test 1) Gap Test (Required)
Check for arrival of data.
Test determines that the most recent data point has been received within the expected time window (TIM_INC) and has the correct time stamp (TIM_STMP).
Note: For those systems that don’t update at regular intervals, a large value for TIM_STMP can be assigned. The gap check is not a panacea for all timing errors. Data could arrive earlier than expected. This test does not address all clock drift/jump issues.
Flags Condition Codable Instructions
Fail=4 Data have not arrived as expected. NOW – TIM_STMP > TIM_INC
Suspect=3 N/A N/A
Pass=1 Applies for test pass condition. N/A
Test Exception: None.
Test specifications to be established locally by operator. Example: TIM_INC= 1 hour

Dissolved Nutrients
20
Test 2) Syntax Test (Required)
Test 3) Location Test (Required)
Check to ensure that the message is structured properly.
Received data record (full message) contains the proper structure without any indicators of flawed transmission such as parity errors. Possible tests are: a) the expected number of characters (NCHAR) for fixed length messages equals the number of characters received (REC_CHAR), or b) passes a standard parity bit check, CRC check, etc. Many such syntax tests exist, and the user should select the best criteria for one or more syntax tests.
Note: Capabilities for dealing with flawed messages vary among operators; some may have the ability to parse messages to extract data within the flawed message sentence before the flaw. Syntax check is performed only at the message level and not at the sub-message level.
Flags Condition Codable Instructions
Fail=4 Data record cannot be parsed. REC_CHAR ≠NCHAR
Suspect =3 Data record can be parsed. REC_CHAR ≠NCHAR
Pass=1 Expected data record received; absence of parity errors.
N/A
Test Exception: None.
Test specifications to be established locally by operator. Example: NCHAR = 128
Check for reasonable geographic location.
Test checks that the reported present physical location (latitude/longitude) is within operator-determined limits. The location test(s) can vary from a simple invalid location to a more complex check for displacement (DISP) exceeding a distance limit RANGEMAX based upon a previous location and platform speed. Operators may also check for erroneous locations based upon other criteria, such as reported positions over land, as appropriate.
Flags Condition Codable Instructions
Fail=4 Invalid location. If |LAT| > 90 or |LONG| > 180, flag = 4
Suspect=3 Unlikely platform displacement. If DISP > RANGEMAX, flag = 3
Pass=1 Applies for test pass condition. N/A
Test Exception: Test does not apply to fixed deployments when no location is transmitted.
Test specifications to be established locally by the operator. Example: Displacement DISP calculated between sequential position reports, RANGEMAX = 20 km

Dissolved Nutrients
21
Test 4) Gross Range Test (Required)
Data point exceeds sensor or operator selected min/max.
All sensors have a limited output range, and this can form the most rudimentary gross range check. No values less than a minimum value or greater than the maximum value the sensor can output (DN_SENSOR_MIN, DN_SENSOR_MAX) are acceptable. Additionally, the operator can select a smaller span (DN_USER_MIN, DN_USER_MAX) based upon local knowledge or a desire to draw attention to extreme values.
Flags Condition Codable Instructions
Fail=4 Reported value is outside of sensor span.
DNn < DN_SENSOR_MIN, or DNn > DN_SENSOR_MAX
Suspect=3 Reported value is outside of user-selected span.
DNn < DN_USER_MIN, or DNn > DN_USER_MAX
Pass=1 Applies for test pass condition. N/A
Test Exception: None.
Test specifications to be established locally by operator. Examples: DN_SENSOR_MAX = (limited by the character output field, for example) DN_SENSOR_MIN =
DN_USER_MAX = DN_USER_MIN =
Test 5) Climatology Test (Strongly Recommended)
Test that data point falls within seasonal expectations.
This test is a variation on the gross range check, where the gross range DN_Season_MAX and DN_Season_MIN are adjusted monthly, seasonally, or at some other operator-selected time period (TIM_TST). Expertise of the local user is required to determine reasonable seasonal averages. Longer time series permit more refined identification of appropriate thresholds.
Flags Condition Codable Instructions
Fail=4 Because of the dynamic nature of DN, no fail flag is identified for this test.
N/A
Suspect=3 Reported value is outside of user-identified climatology window.
DNn < DN_Season_MIN or DNn > DN_Season_MAX
Pass=1 Applies for test pass condition. N/A
Test Exception: None.
Test specifications to be established locally by operator: A seasonal matrix of DNmax and DNmin values at all TIM_TST intervals. Examples: DN_SPRING_MIN =, DN_SPRING_MAX =

Dissolved Nutrients
22
Test 6) Spike Test (Strongly Recommended)
Data point n-1 exceeds a selected threshold relative to adjacent data points.
This check is for single value spikes, specifically the DN value at point n-1 (DNn-1)). Spikes consisting of more than one data point are notoriously difficult to capture, but their onset may be flagged by the rate of change test. The spike test consists of two operator-selected thresholds, THRSHLD_LOW and THRSHLD_HIGH. Adjacent data points (DNn-2 and DNn) are averaged to form a spike reference (SPK_REF). The absolute value of the spike is tested to capture positive and negative going spikes. Large spikes are easier to identify as outliers and flag as failures. Smaller spikes may be real and are only flagged suspect.
Flags Condition Codable Instructions
Fail=4 High spike threshold exceeded. | DNn-1 – SPK_REF| > THRSHLD_HIGH
Suspect=3 Low spike threshold exceeded. | DNn-1 – SPK_REF| > THRSHLD_LOW | DNn-1 – SPK_REF| < THRSHLD_HIGH
Pass=1 Applies for test pass condition. N/A
Test Exception: None.
Test specifications to be established locally by operator. Examples: THRSHLD_LOW =, THRSHLD_HIGH =
Dissolved Nutrients
23
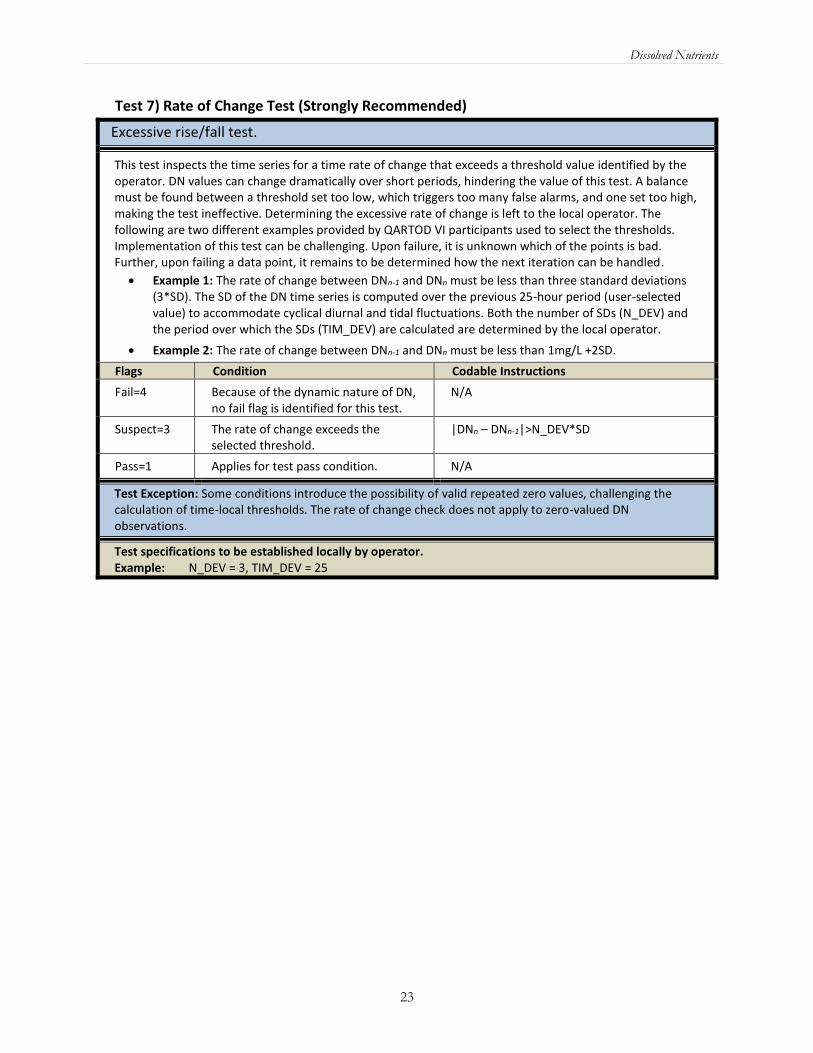
Test 7) Rate of Change Test (Strongly Recommended)
Excessive rise/fall test.
This test inspects the time series for a time rate of change that exceeds a threshold value identified by the operator. DN values can change dramatically over short periods, hindering the value of this test. A balance must be found between a threshold set too low, which triggers too many false alarms, and one set too high, making the test ineffective. Determining the excessive rate of change is left to the local operator. The following are two different examples provided by QARTOD VI participants used to select the thresholds. Implementation of this test can be challenging. Upon failure, it is unknown which of the points is bad. Further, upon failing a data point, it remains to be determined how the next iteration can be handled.
• Example 1: The rate of change between DNn-1 and DNn must be less than three standard deviations (3*SD). The SD of the DN time series is computed over the previous 25-hour period (user-selected value) to accommodate cyclical diurnal and tidal fluctuations. Both the number of SDs (N_DEV) and the period over which the SDs (TIM_DEV) are calculated are determined by the local operator.
• Example 2: The rate of change between DNn-1 and DNn must be less than 1mg/L +2SD.
Flags Condition Codable Instructions
Fail=4 Because of the dynamic nature of DN, no fail flag is identified for this test.
N/A
Suspect=3 The rate of change exceeds the selected threshold.
|DNn – DNn-1|>N_DEV*SD
Pass=1 Applies for test pass condition. N/A
Test Exception: Some conditions introduce the possibility of valid repeated zero values, challenging the calculation of time-local thresholds. The rate of change check does not apply to zero-valued DN observations.
Test specifications to be established locally by operator. Example: N_DEV = 3, TIM_DEV = 25

Dissolved Nutrients
24
Test 8) Flat Line Test (Strongly Recommended)
Invariate DN value.
When some sensors and/or data collection platforms fail, the result can be a continuously repeated observation of the same value. This test compares the present observation (DNn) to a number (REP_CNT_FAIL or REP_CNT_SUSPECT) of previous observations. DNn is flagged if it has the same value as previous observations within a tolerance value EPS to allow for numerical round-off error. Note that historical flags are not changed.
Flags Condition Codable Instructions
Fail=4 When the five most recent observations are equal, DNn is flagged fail.
DNn ≠ 0 AND For i=1,REP_CNT_FAIL DNn –DNn-I <EPS
Suspect=3 It is possible but unlikely that the present observation and the two previous observations would be equal. When the three most recent observations are equal, DNn is flagged suspect.
For i=1,REP_CNT_SUSPECT DNn –DNn-I <EPS
Pass=1 Applies for test pass condition. N/A
Test Exception: Sensor failure introduces the possibility of repeated zero values. However, in oligotrophic waters, nutrient levels may be below the detection limit of DN sensors, and repeated zero values may be accurate. Operators must carefully choose how to flag data under these conditions.
Test specifications to be established locally by operator. Examples: REP_CNT_FAIL = 5, REP_CNT_SUSPECT= 3

Dissolved Nutrients
25
Test 9) Multi-Variate Test (Suggested)
Comparison to other variables.
This is an advanced family of tests, starting with the simpler test described here and anticipating growth towards full co-variance testing in the future. To our knowledge, no one is conducting tests such as these in real time. As these tests are developed and implemented, they should indeed be documented and standardized in later versions of this living DN manual.
In this simple example, it is a pair of rate of change tests as described in test 7. The DN rate of change test is conducted with a more restrictive threshold (N_DN_DEV). If this test fails, a second rate of change test operating on a second variable (temperature or conductivity would be the most probable) is conducted. The absolute valued rate of change should be tested since the relationship between DN and variable two is indeterminate. If the rate of change test on the second variable fails to exceed a threshold (e.g., an anomalous step is found in DN and is lacking in temperature), then the DNn value is flagged.
Flags Condition Codable Instructions
Fail=4 Because of the dynamic nature of DN, no fail flag is identified for this test.
N/A
Suspect=3 DNn fails the DN rate of change and the second variable does not exceed the rate of change.
|DNn – DNn-1|>N_DN_DEV*SD_DN AND |TEMPn – TEMPn-1|<N_TEMP_DEV*SD_T
Pass=1 N/A N/A
Test Exception: None.
Test specifications to be established locally by operator. Examples: N_DN_DEV = 2, N_TEMP_DEV=2, TIM_DEV = 25 hours
NOTE: In a more complex case, more than one secondary rate of change test can be conducted.
Temperature, salinity, turbidity, dissolved oxygen, and chlorophyll are all possible secondary candidates, and
they all could be checked for anomalous rate of change values. In this case, a knowledgeable operator may
elect to pass a high rate of change DN observation when any one of the secondary variables also exhibits a
high rate of change. Such tests border on modeling, should be carefully considered, and may be beyond the
scope of this effort.
The dissolved nutrients committee recognized the high value in full co-variance testing but also noted the
challenges. Such testing remains to be a research project not yet ready for operational implementation.
Dissolved Nutrients
26
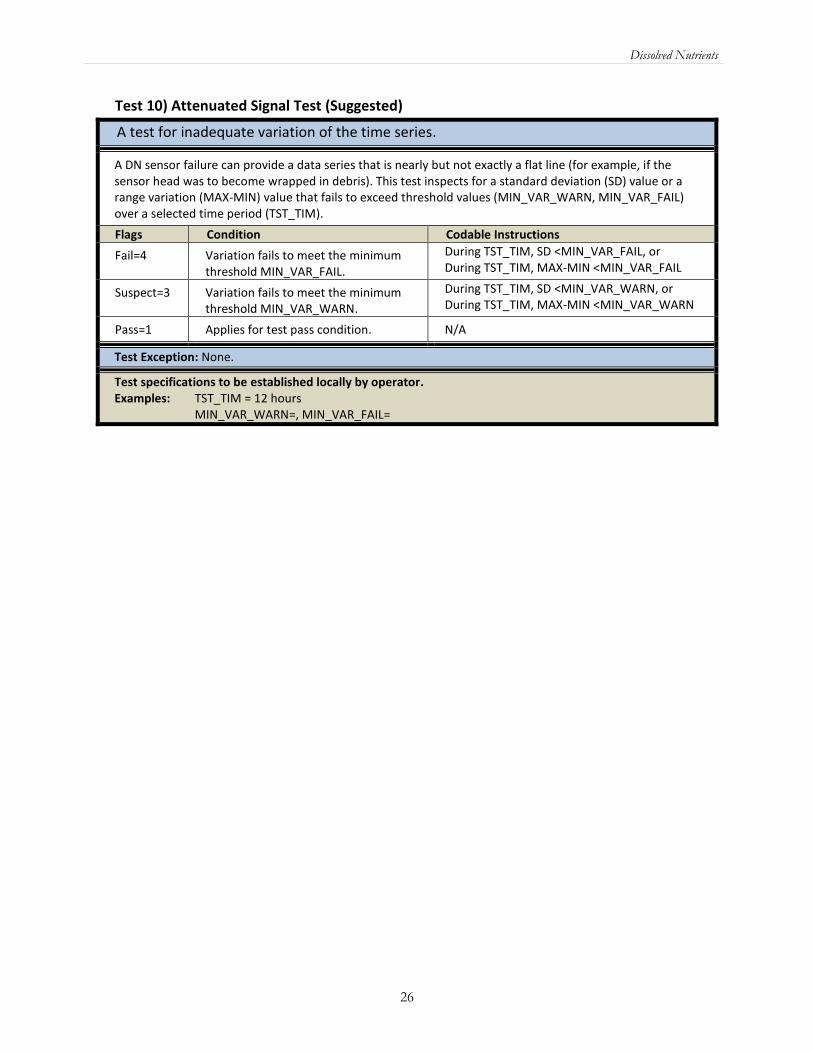
Test 10) Attenuated Signal Test (Suggested)
A test for inadequate variation of the time series.
A DN sensor failure can provide a data series that is nearly but not exactly a flat line (for example, if the sensor head was to become wrapped in debris). This test inspects for a standard deviation (SD) value or a range variation (MAX-MIN) value that fails to exceed threshold values (MIN_VAR_WARN, MIN_VAR_FAIL) over a selected time period (TST_TIM).
Flags Condition Codable Instructions
Fail=4 Variation fails to meet the minimum threshold MIN_VAR_FAIL.
During TST_TIM, SD <MIN_VAR_FAIL, or During TST_TIM, MAX-MIN <MIN_VAR_FAIL
Suspect=3 Variation fails to meet the minimum threshold MIN_VAR_WARN.
During TST_TIM, SD <MIN_VAR_WARN, or During TST_TIM, MAX-MIN <MIN_VAR_WARN
Pass=1 Applies for test pass condition. N/A
Test Exception: None.
Test specifications to be established locally by operator. Examples: TST_TIM = 12 hours MIN_VAR_WARN=, MIN_VAR_FAIL=

Dissolved Nutrients
27
Test 11) Neighbor Test (Suggested)
Comparison to nearby DN sensors.
The check has the potential to be the most useful test when a nearby second sensor is determined to have a similar response.
In a perfect world, redundant DN sensors utilizing different technology would be co-located and alternately serviced at different intervals. This close neighbor would provide the ultimate QC check, but cost prohibits such a deployment in most cases.
In the real world, there are very few instances where a second DN sensor is sufficiently proximate to provide a useful QC check. Just a few hundred meters in the horizontal and less than 10 meters vertical separation yield greatly different results. Nevertheless, the test should not be overlooked where it may have application.
This test is the same as 9) multi-variate test – comparison to other variables where the second variable is the second DN sensor. The selected thresholds depend entirely upon the relationship between the two sensors as determined by the local knowledge of the operator.
In the instructions and examples below, data from one site (DN1) are compared to a second site (DN2). The standard deviation for each site (SD1, SD2) is calculated over the period (TIM_DEV) and multiplied as appropriate (N_DN1_DEV for site DN1) to calculate the rate of change threshold. Note that an operator could also choose to use the same threshold for each site since they are presumed to be similar.
Flags Condition Codable Instructions
Fail=4 Because of the dynamic nature of DN, no fail flag is identified for this test.
N/A
Suspect=3 DNn fails the DN rate of change and the second DN sensor does not exceed the rate of change.
|DN1n – DN1n-1|>N_DN1_DEV*SD1 AND |DN2n – DN2n-1|<N_DN2_DEV*SD2
Pass=1 N/A N/A
Test Exception: None.
Test specifications to be established locally by operator. Examples: N_DN1_DEV = 2, N_DN2_DEV=2, TIM_DEV = 25 hours
3.3.2 Applications of QC Tests to DN Sensor Deployments
The specific application of the QC tests can be dependent on the way the sensor is deployed. Table 3-3
provides a summary of each QC test described earlier in section 3.3 and indicates any changes necessary for
the test to be applied to different deployment scenarios. Note that the “s” axis indicates “along path” for
mobile platforms.

Dissolved Nutrients
28
Table 3-3 Application of Required QC Tests for Sensor Deployments. Note: The ‘s’ axis means “along path.”
Test Condition Platform Codable Instructions
1) Gap Test (Required)
Test determines that the most recent data point has been received within the expected time window (TIM_INC) and has the correct time stamp (TIM_STMP). Note: For those systems that don’t update at regular intervals, a large value for TIM_STMP can be assigned. The gap check is not a panacea for all timing errors. Data could arrive earlier than expected. This test does not address all clock drift/jump issues.
Check for arrival of data.
Stationary No change
Fixed Vertical
Mobile
3-D
2) Syntax Test (Required)
Received data record contains the proper structure without any indicators of flawed transmission such as parity errors. Possible tests are: a) the expected number of characters (NCHAR) for fixed length messages equals the number of characters received (REC_CHAR), or b) passes a standard parity bit check, CRC check, etc. Many such syntax tests exist, and the user should select the best criteria for one or more syntax tests.
Expected data record received, absence of parity errors.
Stationary No change
Fixed Vertical
Mobile
3-D
3) Location Test (Required)
Test checks that the reported present physical location (latitude/longitude) is within operator-determined limits. The location test(s) can vary from a simple invalid location to a more complex check for displacement (DISP) exceeding a distance limit RANGEMAX based upon a previous location and platform speed. Operators may also check for erroneous locations based upon other criteria, such as reported positions over land, as appropriate.
Check for reasonable geographic location.
Stationary No change
Fixed Vertical
Mobile
3-D
4) Gross Range Test (Required)
All sensors have a limited output range, and this can form the most rudimentary gross range check. No values less than a minimum value or greater than the maximum value the sensor can output (DN_SENSOR_MIN, DN_SENSOR_MAX) are acceptable. Additionally, the operator can select a smaller span (DN_USER_MIN, DN_USER_MAX) based upon local knowledge or a desire to draw attention to extreme values.
Data point exceeds sensor or operator selected min/max.
Stationary No change
Fixed Vertical
Mobile
3-D
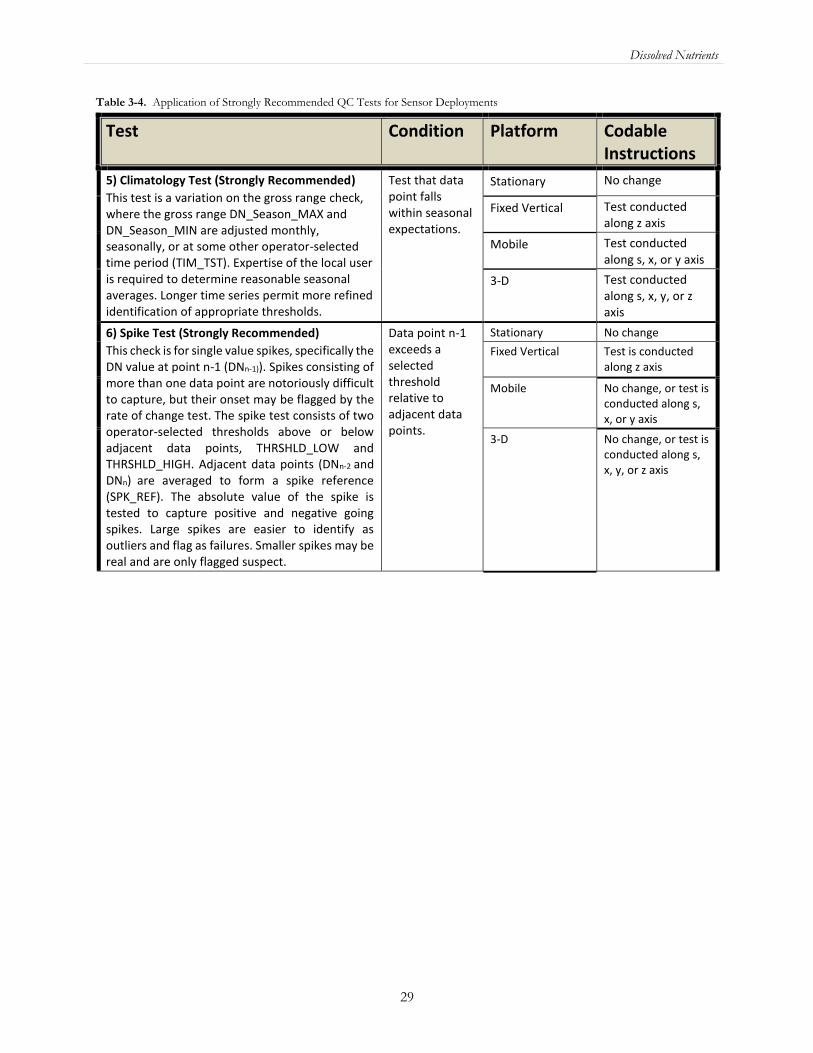
Dissolved Nutrients
29
Table 3-4. Application of Strongly Recommended QC Tests for Sensor Deployments
Test Condition Platform Codable Instructions
5) Climatology Test (Strongly Recommended)
This test is a variation on the gross range check, where the gross range DN_Season_MAX and DN_Season_MIN are adjusted monthly, seasonally, or at some other operator-selected time period (TIM_TST). Expertise of the local user is required to determine reasonable seasonal averages. Longer time series permit more refined identification of appropriate thresholds.
Test that data point falls within seasonal expectations.
Stationary No change
Fixed Vertical Test conducted along z axis
Mobile Test conducted along s, x, or y axis
3-D Test conducted along s, x, y, or z axis
6) Spike Test (Strongly Recommended)
This check is for single value spikes, specifically the DN value at point n-1 (DNn-1)). Spikes consisting of more than one data point are notoriously difficult to capture, but their onset may be flagged by the rate of change test. The spike test consists of two operator-selected thresholds above or below adjacent data points, THRSHLD_LOW and THRSHLD_HIGH. Adjacent data points (DNn-2 and DNn) are averaged to form a spike reference (SPK_REF). The absolute value of the spike is tested to capture positive and negative going spikes. Large spikes are easier to identify as outliers and flag as failures. Smaller spikes may be real and are only flagged suspect.
Data point n-1 exceeds a selected threshold relative to adjacent data points.
Stationary No change
Fixed Vertical
Test is conducted along z axis
Mobile
No change, or test is conducted along s, x, or y axis
3-D No change, or test is conducted along s, x, y, or z axis

Dissolved Nutrients
30
Test Condition Platform Codable Instructions
7) Rate of Change Test (Strongly Recommended)
This test inspects the time series for a time rate of change that exceeds a threshold value identified by the operator. DN values can change dramatically over short periods, hindering the value of this test. A balance must be found between a threshold set too low, which triggers too many false alarms, and one set too high, making the test ineffective. Determining the excessive rate of change is left to the local operator. The following are two different examples provided by QARTOD VI participants used to select the thresholds. Implementation of this test can be challenging. Upon failure, it is unknown which of the points is bad. Further, upon failing a data point, it remains to be determined how the next iteration can be handled.
• Example 1: The rate of change between DNn-1 and DNn must be less than three standard deviations (3*SD). The SD of the DN time series is computed over the previous 25-hour period (user-selected value) to accommodate cyclical diurnal and tidal fluctuations. Both the number of SDs (N_DEV) and the period over which the SDs (TIM_DEV) are calculated are determined by the local operator.
• Example 2: The rate of change between DNn-1 and DNn must be less than 1mg/L +2SD.
Excessive rise/fall test.
Stationary No change
Fixed Vertical Test is conducted along z axis
Mobile No change, or test is conducted along s, x, or y axis
3-D No change, or test is conducted along s, x, y, or z axis
8) Flat Line Test (Strongly Recommended)
When some sensors and/or data collection platforms fail, the result can be a continuously repeated observation of exactly the same value. This test compares the present observation (DNn) to a number (REP_CNT_FAIL or REP_CNT_SUSPECT) of previous observations. DNn is flagged if it has the same value as previous observations within a tolerance value EPS to allow for numerical round-off error. Note that historical flags are not changed.
Invariant DN value.
Stationary No change
Vertical Test is conducted along z axis
Mobile No change, or test is conducted along s, x, or y axis
3-D No change, or test is conducted along s, x, y, or z axis

Dissolved Nutrients
31
Table 3-5. Application Suggested QC Tests for Sensor Deployments
Test Condition Platform Codable Instructions
9) Multi-Variate Test (Suggested)
This is an advanced family of tests, starting with the simpler test described here and anticipating growth towards full co-variance testing in the future.
In the simplest case, it is a pair of rate of change tests as described in test 7. The DN rate of change test is conducted with a more restrictive threshold (N_DN_DEV). If this test fails, a second rate of change test operating on a second variable (temperature or conductivity would be the most probable) is conducted. The absolute valued rate of change should be tested since the relationship between DN and variable two is indeterminate. If the rate of change test on the second variable fails to exceed a threshold (e.g., an anomalous step is found in DN and is lacking in temperature), then the DN value n0 is flagged.
Comparison to other variables.
Stationary No change
Fixed Vertical Test is conducted along z axis
Mobile Test is conducted along s, x, or y axis
3-D Test is conducted along s, x, y, or z axis
10) Attenuated Signal Test (Suggested)
A DN sensor failure can provide a data series that is nearly but not exactly a flat line (for example, if the sensor head was to become wrapped in debris). This test inspects for a standard deviation (SD) value or a range variation (MAX-MIN) value that fails to exceed a threshold value (MIN_VAR) over a selected time period (TST_TIM).
Inadequate variation test.
Stationary No change
Fixed Vertical Test is conducted along z axis
Mobile No change, or test is conducted along s, x, or y axis
3-D No change, or test is conducted along s, x, y, or z axis
11) Neighbor Test (Suggested)
The check has the potential to be the most useful test when a nearby second sensor is determined to have a similar response.
This test is the same as test 9) multi-variate check – comparison to other variables where the second variable is the second DN sensor. The selected thresholds depend entirely upon the relationship between the two sensors as determined by the local knowledge of the operator.
Comparison to nearby DN sensors.
Stationary No change
Fixed Vertical Test is conducted along z axis
Mobile No change
3-D No change
Dissolved Nutrients
32
4.0 Summary
The QC tests in this DN manual have been compiled using the guidance provided by QARTOD workshops
(QARTOD 2003-2009) and from operators with extensive experience. Wherever possible, redundant tests
have been merged. These tests are designed to support a range of DN sensors and operator capabilities. Some
well-established programs with the highest standards have implemented very rigorous QC processes. Others,
with different requirements, may utilize sensors with data streams that cannot support as many QC checks—
all have value when used prudently. It is the responsibility of the users to understand and appropriately utilize
data of varying quality, and operators must provide support by documenting and publishing their QC
processes. A balance must be struck between the time-sensitive needs of real-time observing systems and the
degree of rigor that has been applied to non-real-time systems by operators with decades of QC experience.
The eleven data QC tests identified in this manual apply to DN observations from a variety of sensor types
and platforms that may be used in U.S. IOOS. Several existing programs, such as the USGS National Real-
Time Water Quality program, have already developed QC tests that are similar to the U.S. IOOS QARTOD
tests in this manual. The QARTOD dissolved nutrients committee’s objective is for the QC tests of these
programs to comply with U.S. IOOS QARTOD requirements and recommendations without being overly
prescriptive, by providing meaningful guidance and thresholds that everyone can accomplish within a
National framework. The individual tests are described and include codable instructions, output conditions,
example thresholds, and exceptions (if any).
Selection of the proper thresholds is critical to a successful QC effort. Thresholds can be based on historical
knowledge or statistics derived from more recently acquired data and should not be determined arbitrarily.
This manual provides some guidance for selecting thresholds based on input from various operators, but also
notes that operators need the subject-matter expertise in selecting the proper thresholds to maximize the
value of their QC effort. Because long-term data for DN variables are relatively scarce, it is expected that
refinement of thresholds and exceptions will occur over time globally as well as becoming more specific to
regional databases.
Future QARTOD manuals will address standard QC
test procedures and best practices for all types of
common as well as uncommon platforms and sensors
for all the U.S. IOOS core variables. Some test
procedures may even take place within the sensor
package. Significant components of metadata will
reside in the sensor and be transmitted either on demand or automatically along with the data stream. Users
may also reference metadata through Uniform Resource Locators to simplify the identification of which QC
steps have been applied to data. However, QARTOD QC test procedures in this manual address only real-
time, in-situ observations made by sensors on fixed or mobile platforms. The tests do not include post-
processing, which is not conducted in real time but may be useful for ecosystem-based management, or
delayed-mode, which is required for climate studies.
Training and education are of paramount importance to ensuring that both QA and QC practices are in place.
The sensor manufacturers can play a huge role in this area. The manufacturers have spent enormous efforts
helping customers use these sensors successfully. Most manufacturers provide instructions for best practices,
Knowledgeable human involvement
is required to properly understand the physical, chemical, and biological conditions within which
the DN observations are being taken.

Dissolved Nutrients
33
and those practices should be used as a first-order QA for all measurements. The manufacturer-supplied
user’s manual includes these instructions, and carefully following them is critical to knowing how to use the
instruments, understanding their limitations and accuracy, knowing how to interpret output, and then having
a meaningful way to validate performance. Validation of sensor performance can be done by taking periodic
water samples, using a known calibrated and maintained reference instrument, or performing laboratory tests
to a given accuracy.
Each QC manual is a dynamic document and is posted on the QARTOD website
(https://ioos.noaa.gov/project/qartod/) upon completion. This practice allows for updating each U.S. IOOS
core variable QC manual as technology development occurs, accommodating not only new sensors, but also
the upgrades envisioned for the existing sensors.
This website permits easy access to all QARTOD material and updates as they are identified. It includes code
libraries, procedures for testing data, and links to social media—enabling the growing ocean observing
community to stay engaged across the enterprise regionally, nationally, and internationally.
This QARTOD project may be one of the best working examples of private-public partnerships, which is a
fundamental tenet of U.S. IOOS. As this DN manual has exemplified, the sensor manufacturers must be fully
involved in the creation of most, if not all, QC manuals for the 26 U.S. IOOS core variables.
It is through this kind of uniform QC process that integration can occur across the national ocean enterprise,
capitalizing the I in U.S. IOOS. Implementing these procedures will accelerate the research-to-operations
process to support a real-time, operational, integrated ocean observing system of defined data quality.

Dissolved Nutrients
34
5.0 References
Bushnell, M., Presentation at QARTOD III: November 2005. Scripps Institution of Oceanography, La Jolla,
California.
Joint Committee for Guides in Metrology (JCGM), 2012. International Vocabulary of Metrology: Basic and
General Concepts and Associated Terms. 3rd Edition.
Martini, K.I., Walsh, I.D., Branham, C.W., 2017. Measuring Nitrate in Puget Sound Using Optical Sensors.
Sea Technology, October 2017, pp. 10-13.
Neumann, Gerhard and Pierson, W. J., 1966. Principles of Physical Oceanography, Prentice Hall, p. 154.
Paris. Intergovernmental Oceanographic Commission of UNESCO, 2013. Ocean Data Standards, Vol.3:
Recommendation for a Quality Flag Scheme for the Exchange of Oceanographic and Marine
Meteorological Data. (IOC Manuals and Guides, 54, Vol. 3.) 12 pp. (English) (IOC/2013/MG/54-3)
http://www.nodc.noaa.gov/oceanacidification/support/MG54_3.pdf
Pellerin, B.A., Bergamaschi, B.A., Downing, B.D., Saraceno, J.F., Garrett, J.A., and Olsen, L.D., 2013, Optical
techniques for the determination of nitrate in environmental waters: Guidelines for instrument selection,
operation, deployment, maintenance, quality assurance, and data reporting: U.S. Geological Survey
Techniques and Methods 1–D5, p. 37. http://pubs.usgs.gov/tm/01/d5/pdf/tm1d5.pdf
QARTOD I-V Reports 2003-2009: https://ioos.noaa.gov/project/qartod/
U.S. IOOS Office, November 2010. A Blueprint for Full Capability, Version 1.0, 254 pp.
https://www.ioos.noaa.gov/wp-content/uploads/2015/09/us_ioos_blueprint_ver1.pdf
U.S. Integrated Ocean Observing System, 2017. Manual for the Use of Real-Time Oceanographic Data
Quality Control Flags Version 1.1. 41 pp. https://doi.org/10.7289/V5B56GZJ

Dissolved Nutrients
35
Additional References to Related Documents:
Scheme on QC flags, which is a general document that discusses how to write the results of tests but does not
discuss the actual tests. http://www.oceandatastandards.org/
The ocean data standards resource pool can be found at: http://www.oceandatastandards.org/resourcepool-
mainmenu-7.
http://www.oceandatastandards.org is the higher-level page (see menu to the right for subpages). Argo
Quality Control Manual can be found at:
http://www.argodatamgt.org/content/download/341/2650/file/argo-quality-control-manual-V2.7.pdf
National Data Buoy Center (NDBC) Technical Document 09-02, Handbook of Automated Data Quality
Control Checks and Procedures, August 2009. National Data Buoy Center, Stennis Space Center,
Mississippi 39529-6000.
National Oceanographic Partnership Program (NOPP) January 2006. The First U.S. Integrated Ocean
Observing System (IOOS)Development Plan – A report of the national Ocean Research Leadership
Council and the Interagency Committee on Ocean Science and Resource Management Integration. The
National Office for Integrated and Sustained Ocean Observations. Ocean US Publication No. 9.
Wagner, R.J., Boulger, R.W., Jr., Oblinger, C.J., and Smith, B.A., 2006, Guidelines and standard procedures
for continuous water-quality monitors—Station operation, record computation, and data reporting: U.S.
Geological Survey Techniques and Methods 1–D3, 51 p. http://pubs.water.usgs.gov/tm1d3
Villagarcía, M. 2005. Calibration of Biogeochemical Data from Nitrate Sensors. Instituto Canario de Ciencias
Marinas (ICCU) Las Palmas, Spain.

Dissolved Nutrients
36
Supporting Documents Found on the QARTOD Website:
https://ioos.noaa.gov/ioos-in-action/dissolved-nutrients/
NDBC Handbook of Automated Data Quality Control
Argo Quality Control Manual, V 2.7 3 January 2012
National Water Quality Monitoring Council Water Quality Data Elements: A User Guide
Requirements for Global Implementation of the Strategic Plan for Coastal GOOS - Panel for Integrated
Coastal Observation (PICO-I)
UHM Stormwater Monitoring System Servicing Checklist
Optical Techniques for the Determination of Nitrate in Environmental Waters: Guidelines for Instrument
Selection, Operation, Deployment, Maintenance, Quality Assurance, and Data Reporting

Dissolved Nutrients
A-1
Appendix A Quality Assurance
A major pre-requisite for establishing data quality for dissolved nutrient observations is having strong QA
practices that address all actions related to the sensor during pre-deployment, deployment, and post-
deployment. The consensus that emerged from past QARTOD meetings was that good quality data requires
good QA, and good QA requires good scientists, engineers, and technicians applying consistent practices.
Generally, QA practices relate to observing systems’ sensors (the hardware) and include things like
appropriate sensor selection, calibration, sensor handling and service, and evaluation of sensor performance.
A.1 Sensor Calibration Considerations
Observations must be traceable to one or more accepted standards such as NIST through a calibration
performed by the manufacturer and/or the operator. If the calibration is conducted by the manufacturer, the
operator must also conduct some form of an acceptable calibration check.
An often-overlooked calibration or calibration check can be performed by choosing a consensus standard.
For example, deriving the same answer (within acceptable levels of data precision or data uncertainty) from
four different sensors of four different manufacturers, preferably utilizing several different technologies,
constitutes an acceptable check. Because of the trend toward corporate conglomeration, those wishing to
employ a consensus standard should ensure that the different manufacturers are truly independent.
Wet chemical sensors also have defined reagent stability and storage considerations that should be accounted
for. For example, if reagents are beyond a “best-by date” the data are likely suspect. If reagents drift (NH4 or
NO3 reagent degradation), that drift must be known or monitored.
A.2 Sensor Comparison
An effective QA effort continually strives to ensure that end data products are of high value and to prove
they are free of error. Operators should seek out partnering opportunities to inter-compare systems by co-
locating differing sensors, thereby demonstrating high quality by both to the extent that there is agreement
and providing a robust measure of observation data uncertainty by the level of disagreement. If possible,
operators should retain an alternate sensor or technology from a second manufacturer for similar in-house
checks. For resource-constrained operators, however, it may not be possible to spend the time and funds
needed to procure and maintain two systems. For those who do so and get two different results, the use of
alternate sensors or technologies provide several important messages: a) a measure of corporate capabilities;
b) a reason to investigate, understand the different results, and take corrective action; and c) increased
understanding that, when variables are measured with different technologies, different answers can be correct;
they must be understood in order to properly report results. For those who succeed in obtaining similar
results, the additional sensors provide a highly robust demonstration of capability. Such efforts form the basis
of a strong QA/QC effort. Further, sensor comparison provides the operator with an expanded supply
source, permitting less reliance upon a single manufacturer and providing competition that is often required
by procurement offices.
Gas-segmented continuous flow auto-analyzers are the standard instrument/method for routine nutrient
measurement onboard the ship and in the shore-based laboratory. The most important check for the DN

Dissolved Nutrients
A-2
sensor’s performance is taking samples from DN sensor deployment sites, analyzing them using a nutrient
auto-analyzer in the lab, and comparing the results with those from the DN sensors.
For nitrate sensors using the cadmium reduction method, the reduction efficiency of the cadmium
coil/column should be tested before and after the sensor deployment. Preparation of the cadmium column
should follow the method established in the literature. A threshold (e.g., 95%) should be defined for an
acceptable cadmium reduction efficiency before deployments.
Users often take samples during deployment, recovery, or service. These times are risky for ensuring quality
sensor data—often due to initial stabilization, sensor/environment disturbance, or high fouling near the end
of the deployment. At least one sample should be obtained mid-deployment without disturbing the sensor.

Dissolved Nutrients
A-3
A.3 Bio-fouling and Corrosion Prevention Strategies
Bio-fouling is a frequent cause of DN sensor failure, so the following strategies may be useful for ameliorating the problem:
• Use anti-fouling paint with the highest copper content available (up to 75%) when possible (but not
on aluminum).
• Tributyltin oxide (TBTO) anti-foulant systems, often used in conjunction with a pumped system, are
highly effective (e.g., Sea-Bird SBE 43)
• To help with post-deployment clean-up (but not as an anti-foulant), wrap the body of the sensor with
clear packing tape for a small probe or plastic wrap for a large instrument, followed by PVC pipe
wrap tape. (This keeps the PVC tape from leaving a residue on the sensor.) Wrap the sensor body
with copper tape (again, beware of aluminum).
• Coat with zinc oxide (Desitin ointment).
• Use brass door/window screen around opening to sensor. The combination of copper and zinc is a
great anti-foulant and is significantly cheaper than copper screen.
• Remember that growth is sensor, depth, location, and season dependent.
• Maintain wipers on DN sensors per manufacturers’ recommendation.
• Flush out with chlorine gas pumped through the system. This technique requires a lot of battery power.
• Plan for routine changing or cleaning of sensor as necessary.
• Check with calibration facility on which anti-foulants will be handled (allowed) by the calibrators.
• Use copper plates as shutters, which keep the sensor open for limited time. This is ideal over wipers
in oceanic environments with encrusting organisms like barnacles. Wipers do not work well in
southern Florida during the summer. Sediment and particles that become embedded in the wipers
can scratch the lens on optical DN sensors.
• Store the sensor in the dark when not in use.
• Avoid or isolate dissimilar metals.
• Maintain sacrificial anodes and ensure they are properly installed (good electrical contact).
• Maximize the use of non-metallic components.
• Use UV-stabilized components that are not subject to sunlight degradation.
• Mount sensors vertically to minimize sediment buildup – employ filters for sensors with flow-
through tubes.
• Where applicable, maintain sensor surfaces by gentle cleaning (e.g., using a baby toothbrush).
• Store the device above the surface between measurements.
• Make use of a pumped system where the sensor is kept above water and the sample is pumped
through a flow chamber just before a reading is required.
• Use petroleum-based lubricants as biocides (using care in the vicinity of optics and other sensitive
components).
• Carefully maintain and clean filters.
• Obtain mid-deployment validation field samples.

Dissolved Nutrients
A-4
A.4 Common QA Considerations
The following lists suggest ways to ensure QA by using specific procedures and techniques:
• Perform pre-deployment calibrations on every sensor.
• Perform post-deployment calibrations on every sensor, plus in-situ comparison before recovery.
• Calibrate ready-to-use spares periodically.
• Monitor with redundant sensors whenever possible.
• Collect in-situ water samples to compare with the sensor.
• Take photos of sensor fouling for records.
• Record all actions related to sensors – calibration, cleaning, deployment, etc.
• Compare the first day or less of readings from newly deployed sensor to last sensor deployed. Large shifts in median values can indicate a problem with one of the sensors. A post calibration of a previously deployed sensor may help to determine if it is the source of the discontinuity in readings.
• Monitor battery voltage and watch for unexpected fluctuations.
When evaluating which instrument to use, consider these factors:
• Selection of a reliable and supportive manufacturer and appropriate model
• Measurable data concentration range (including detection limit) o Lowest and highest possible readings
• Operating range (i.e., some instruments won’t operate at certain temperatures) o Could be depth or pressure range o Salinity correction
• Resolution/precision required
• Sampling frequency – how fast the sensor can take measurements
• Reporting frequency – how often the sensor reports the data
• Response time of the sensor – sensor lag – time response
• Power source limitations
• Clock stability and timing issues
• Internal fault detection and error reporting capabilities
When evaluating which specifications must be met:
• State the expected accuracy.
• Determine how the sensor compared to the design specifications.
• Determine if sensor met those specifications.
• Determine whether the result is good enough (fit for purpose: data are adequate for nominal use as
preliminary data).
General comments regarding QA procedures:
• A diagram (http://www.ldeo.columbia.edu/~dale/dataflow/), contributed by Dale Chayes (LDEO)
provides a visual representation of proper QA procedures.
• Require serial numbers and model ID from the supplier.
• Develop useful checklists and update them as needed.
• Do not assume the calibration is perfect (could be a calibration problem rather than a sensor
problem).
• Keep good records of all related sensor calibrations and checks (e.g., conductivity and temperature).
• Use NIST-traceable standards when conducting calibrations or calibration checks.

Dissolved Nutrients
A-5
• Keep good maintenance records. Favor sensors that maintain an internal file of past calibration
constants, which is very useful since it can be downloaded instead of transcribed manually, thus
introducing human error.
• Plot calibration constants or deviations from a standard over time to determine if the sensor has a
drift in one direction or another. A sudden change can indicate a problem with the sensor or the last
calibration.
• Don’t presume that anomalous values are always problems with a sensor. Compare measurements
with other sensors to help determine if the reading is real; then examine the possibility of problems
with a sensor.
• Follow the manufacturer’s recommendations and best practices established by knowledgeable users
to ensure proper sampling techniques. For example, in a non-pumped sensor in a turbulent
environment, bubbles can adhere to the surface of a sensor resulting in anomalous readings. Cycle
the wipers or shutter before the reading to brush off the bubbles from the face of the instrument.
For a pumped system in a turbulent environment, a degassing “Y” may limit bubbles adhering to the
face of the sensor.
A.5 QA Levels for Best Practices
A wide variety of techniques are used by operators to assure that DN sensors are properly calibrated and
operating within specifications. While all operators must conduct some form of validation, there is no need to
force operators to adhere to one single method. A balance exists between available resources, level of
proficiency of the operator, and accuracy. The various techniques span a range of validation levels and form a
natural hierarchy that can be used to establish levels of certification for operators (table A-1). The lists in the
following sections suggest ways to ensure QA by using specific procedures and techniques.
Table A-1. Best practices indicator for QA
QA Best Practices Indicator
Description
Good Process DN sensors are swapped and/or serviced at sufficiently regular intervals so as to
avoid data steps (unexpected offsets) upon swap/service. Pre- and post-
deployment calibration checks are conducted on each sensor.
Better Process The good processes are employed, plus pre- and post-deployment calibration
checks are conducted using alternative sensors to confirm performance.
Best Process The better processes are employed, following a well-documented protocol,
or alternative sensors are used to validate in-situ deployments. Or, pre-
and post-calibrations are conducted by the manufacturer.

Dissolved Nutrients
A-6
A.6 Additional Sources of QA Information
Operators using DN sensors also have access to other sources of QA practices and information about a
variety of instruments. For example, the Alliance for Coastal Technologies (ACT) serves as an unbiased, third
party testbed for evaluating sensors and platforms for use in coastal and ocean environments. ACT conducts
instrument performance demonstrations and verifications so that effective existing technologies can be
recognized, and promising new technologies can become available to support coastal science, resource
management, and ocean observing systems (ACT 2012). The NOAA Ocean Systems Test and Evaluation
Program (OSTEP) also conducts independent tests and evaluations on emerging technology as well as new
sensor models. Both ACT and OSTEP publish findings that can provide information about QA, calibration,
and other aspects of sensor functionality. The following list provides links to additional resources on QA
practices.
• Manufacturer specifications and supporting Web pages/documents
• QARTOD - https://ioos.noaa.gov/project/qartod/
• ACT - http://www.act-us.info/
• USGS - http://water.usgs.gov/owq/quality.html
• USGS - http://pubs.usgs.gov/tm/2006/tm1D3/
• USGS - http://or.water.usgs.gov/pubs/WRIR01-4273/wri014273.pdf
• WOCE - https://www.nodc.noaa.gov/woce/
• NWQMC - http://acwi.gov/monitoring/
A.7 Sample Checklists
The following samples provide hints for development of deployment checklists taken from QARTOD IV:
General QA Checklist:
Read the manual.
Establish, use, and submit (with a reference and version #) a documented sensor preparation
procedure (protocol). Should include cleaning sensor according to the manufacturer’s procedures. Calibrate sensor against an accepted standard and document (with a reference and version #). Compare the sensor with an identical, calibrated sensor measuring the same thing in the same area (in
a calibration lab).
View calibration specifications with a critical eye (don’t presume the calibration is infallible). Execute
detailed review of calibrated data.
Check the sensor history for past calibrations, including a plot over time of deviations from the
standard for each (this will help identify trends such a progressively poorer performance). Check the
sensor history for past repairs, maintenance, and calibration.
Consider storing and shipping information before deploying.
o Heat, cold, vibration, etc.
Record operator/user experiences with this sensor.
Search the literature for information on your particular sensor(s) to see what experiences other
researchers may have had with the sensor(s).
Establish and use a formal pre-deployment checklist.
Ensure that technicians are well-trained. Use a tracking system to identify those technicians who are
highly trained and then pair them with inexperienced technicians for training purposes.

Dissolved Nutrients
A-7
Deployment Checklist
Scrape bio-fouling off platform.
Verify sensor serial numbers.
Perform visual inspection; take photos if possible (verify position of sensors, connectors, fouling,
and cable problems).
Verify instrument function at deployment site just prior to site departure. Monitor sensors for issues
(freezing, fouling).
Use established processes to confirm that the sensor is properly functioning, before departing the
deployment site.
Specify date/time for all recorded events. Use GMT or UTC.
Check software to ensure that the sensor configuration and calibration coefficients are correct. Also
check sampling rates and other timed events, like wiping and time averaging.
Visually inspect data stream to ensure reasonable values.
Compare up and down casts and/or dual sensors (if available).
Note weather conditions and members of field crew.
Post-deployment Checklist
Take pictures of recovered sensor prior to cleaning.
Check to make sure all clocks agree or, if they do not agree, record all times and compare with NIST.
Post-calibrate sensor before and after cleaning, if possible. Perform in-situ side by side check using
another sensor, if possible
Use standard procedures to provide feedback about possible data problems and/or sensor
diagnostics.
Clean and store the sensor properly or redeploy.
Visually inspect physical state of instrument.
Verify sensor performance by:
o Checking nearby stations;
o Making historical data comparisons (e.g., long-term time-series plots, which are particularly
useful for identifying long-term bio-fouling or calibration drift.)

Dissolved Nutrients
B-1
Appendix B Dissolved Nutrients Manual Committee and Reviewers
Dissolved Nutrients Manual Committee and Reviewers, Version 1.1
Name Organization
Mark Bushnell Brett Johnston
Vince Kelly Matthias Lankhorst
Ana Lara-Lopez Robert Maxfield
Margaret McManus Jim Potemra
Brian Pellerin Cassie Schwanger
U.S. IOOS USGS Green Eyes LLC University of California San Diego University of Tasmania Environmental Protection Agency University of Hawaii University of Hawaii USGS CSIRO Oceans and Atmosphere
QARTOD Board of Advisors, Version 1.1 Name Organization
Kathleen Bailey, Project Manager
Julie Bosch
Eugene Burger
Matt Howard
Bob Jensen
Shannon McArthur
Chris Paternostro
Mario Tamburri
Julie Thomas, BOA Chair
U.S. IOOS
NOAA/National Centers for Environmental Information
NOAA/Pacific Marine Environmental Laboratory
GCOOS/Texas A&M University
U.S. Army Corps of Engineers
NOAA/National Data Buoy Center
NOS/Center for Operational Oceanographic Products and Services
University of Maryland Center for Environmental Science / Chesapeake Biological Laboratory
SCCOOS/Scripps Institution of Oceanography/Coastal Data Information Program
U.S. IOOS Regional Associations, Version 1.1
Name Organization
Josie Quintrell
Clarissa Anderson
Debra Hernandez
Melissa Iwamoto
Barbara Kirkpatrick
Gerhard Kuska
Molly McCammon
Julio Morell
Ru Morrison
Jan Newton
Kelli Paige Henry Ruhl
IOOS Association
SCCOOS
SECOORA
PacIOOS
GCOOS
MARACOOS
AOOS
CariCOOS
NERACOOS
NANOOS
GLOS CeNCOOS
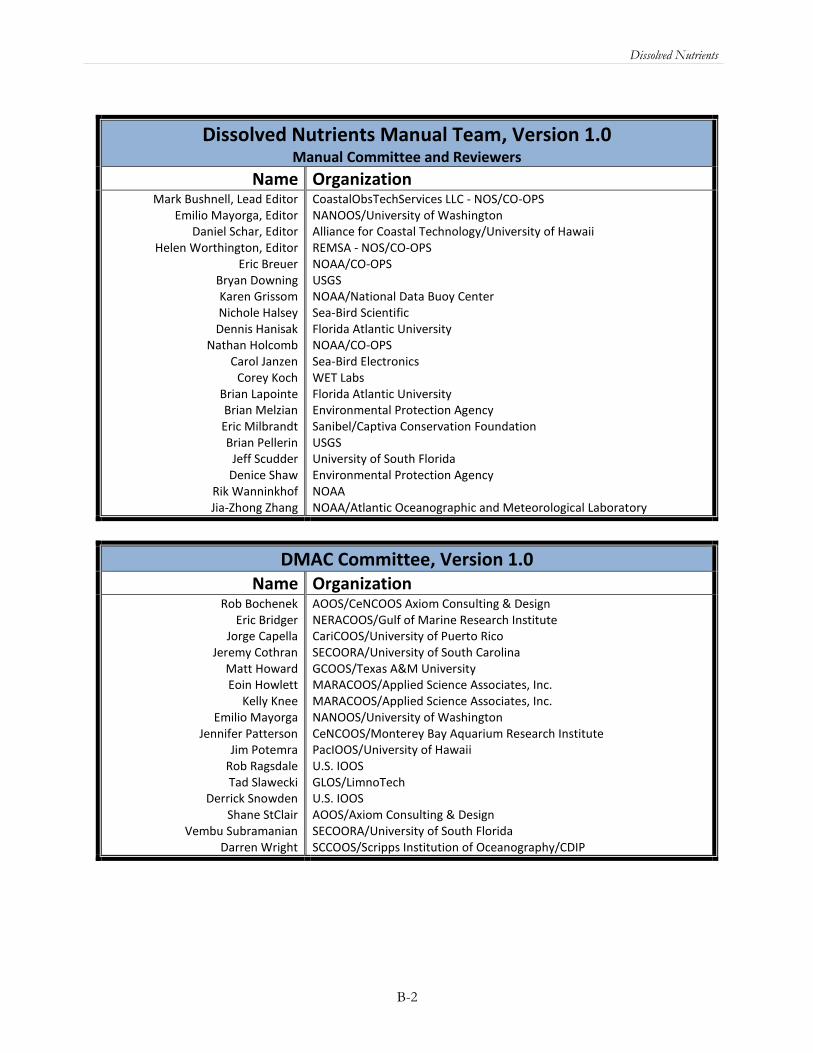
Dissolved Nutrients
B-2
Dissolved Nutrients Manual Team, Version 1.0 Manual Committee and Reviewers
Name Organization
Mark Bushnell, Lead Editor Emilio Mayorga, Editor
Daniel Schar, Editor Helen Worthington, Editor
Eric Breuer Bryan Downing Karen Grissom Nichole Halsey Dennis Hanisak
Nathan Holcomb Carol Janzen
Corey Koch Brian Lapointe Brian Melzian Eric Milbrandt Brian Pellerin
Jeff Scudder Denice Shaw
Rik Wanninkhof Jia-Zhong Zhang
CoastalObsTechServices LLC - NOS/CO-OPS NANOOS/University of Washington Alliance for Coastal Technology/University of Hawaii REMSA - NOS/CO-OPS NOAA/CO-OPS USGS NOAA/National Data Buoy Center Sea-Bird Scientific Florida Atlantic University NOAA/CO-OPS Sea-Bird Electronics WET Labs Florida Atlantic University Environmental Protection Agency Sanibel/Captiva Conservation Foundation USGS University of South Florida Environmental Protection Agency NOAA NOAA/Atlantic Oceanographic and Meteorological Laboratory
DMAC Committee, Version 1.0
Name Organization
Rob Bochenek Eric Bridger
Jorge Capella Jeremy Cothran
Matt Howard Eoin Howlett
Kelly Knee Emilio Mayorga
Jennifer Patterson Jim Potemra
Rob Ragsdale Tad Slawecki
Derrick Snowden Shane StClair
Vembu Subramanian Darren Wright
AOOS/CeNCOOS Axiom Consulting & Design NERACOOS/Gulf of Marine Research Institute CariCOOS/University of Puerto Rico SECOORA/University of South Carolina GCOOS/Texas A&M University MARACOOS/Applied Science Associates, Inc. MARACOOS/Applied Science Associates, Inc. NANOOS/University of Washington CeNCOOS/Monterey Bay Aquarium Research Institute PacIOOS/University of Hawaii U.S. IOOS GLOS/LimnoTech U.S. IOOS AOOS/Axiom Consulting & Design SECOORA/University of South Florida SCCOOS/Scripps Institution of Oceanography/CDIP
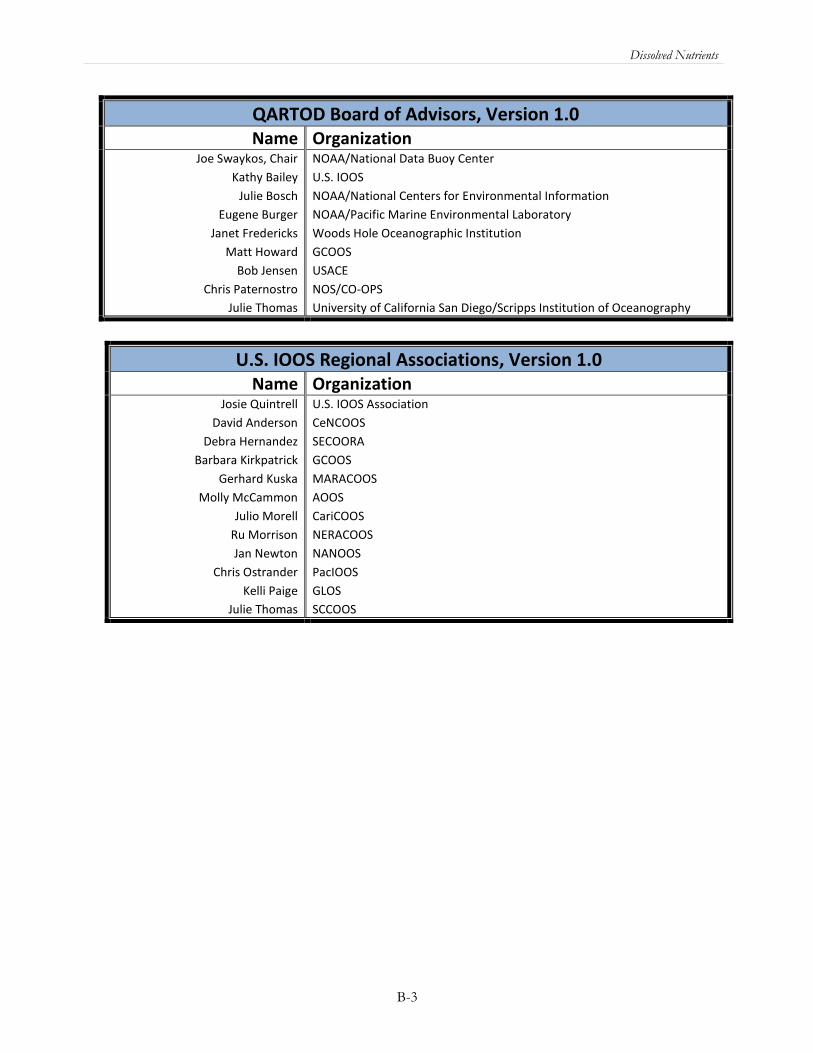
Dissolved Nutrients
B-3
QARTOD Board of Advisors, Version 1.0
Name Organization
Joe Swaykos, Chair
Kathy Bailey
Julie Bosch
Eugene Burger
Janet Fredericks
Matt Howard
Bob Jensen
Chris Paternostro
Julie Thomas
NOAA/National Data Buoy Center
U.S. IOOS
NOAA/National Centers for Environmental Information
NOAA/Pacific Marine Environmental Laboratory
Woods Hole Oceanographic Institution
GCOOS
USACE
NOS/CO-OPS
University of California San Diego/Scripps Institution of Oceanography
U.S. IOOS Regional Associations, Version 1.0
Name Organization
Josie Quintrell
David Anderson
Debra Hernandez
Barbara Kirkpatrick
Gerhard Kuska
Molly McCammon
Julio Morell
Ru Morrison
Jan Newton
Chris Ostrander
Kelli Paige
Julie Thomas
U.S. IOOS Association
CeNCOOS
SECOORA
GCOOS
MARACOOS
AOOS
CariCOOS
NERACOOS
NANOOS
PacIOOS
GLOS
SCCOOS