manufacturing in the uk - institute for public policy … · manufacturing in the uk 3 1 2 3 4. ......
TRANSCRIPT

manufacturing inthe uk
Richard Brooks& Peter Robinson

Institute for Public Policy Research30-32 Southampton StreetLondon WC2E 7RATel: 020 7470 6100 Fax: 020 7470 [email protected]
Registered Charity No. 800065
The Institute for Public Policy Research (IPPR) is Britain’s leading progressive think tank. Its purpose isto contribute to a greater public understanding of social, economic and political questions throughresearch, discussion and publication. Established as an independent charity in 1988, the IPPR hasdeveloped a proud and influential record. Through its well researched and clearly argued policyanalysis, its strong networks in government, academia, and the corporate and voluntary sector, and itshigh media profile, IPPR plays a vital role maintaining the momentum of progressive thought.
trustees
Chris Powell (Chairman) Neil KinnockChai Patel (Secretary) Richard LambertJeremy Hardie (Treasurer) Professor David Marquand
Frances O’GradyProfessor Kumar Bhattacharyya David Pitt-WatsonLord Brooke Dave PrentisLord Eatwell Lord PuttnamLord Gavron Gail RebuckChris Gibson Smith Sir Martin Rees Professor Anthony Giddens Jan RoyallLord Hollick Ed SweeneyJane Humphries Baroness Williams
production & design by E M P H A S I S
ISBN 1 86030 222 X
© IPPR 2003
acknowledgements
about the authors
executive summary
what has been happening to UK manufacturing? 12
why does manufacturing matter? 20
the public policy response: 26the economic framework
investment
skills
innovation and enterprise
conclusion: 60
references
manufacturing in the uk 3
1
2
3
4

acknowledgements
The Institute for Public Policy Research would like to thank our project partners andsponsors: the Engineering Employers’ Federation; the Institution of Electrical Engineers; andthe Design Council. Without their willingness to invest in and contribute to our research thisproject could not have been undertaken. The findings of our research are, however, theresponsibility of the authors alone and do not necessarily represent the views of ourfunding partners or any other individual or organisation involved with the project.
We are particularly grateful for extensive involvement and assistance from Stephen Radley,Douglas Peedle and Martin Temple at the Engineering Employers’ Federation; NicholasMoiseiwitsch and Alf Roberts at the Institution of Electrical Engineers; and MatthewKennedy-Martin at the Design Council. Others have also read and commented on the draftincluding: Samuel Brittan; Rupert Harrison; Mike Gregory; and Dr K Rajagopal. Our thanksgo to them and the usual disclaimer applies. The speakers at our project seminars, who haveprovided us with vital material and insights, included: Steve Bond from Nuffield CollegeOxford; Mike Campbell from the Sector Skills Development Agency; Mike Emmott from theChartered Institute of Personnel and Development; David Storey from Warwick BusinessSchool; Alan Hughes from the Cambridge Centre for Business Research; Tom Riordan fromYorkshire Forward; Peter Bunn from the Department of Trade and Industry; Steven Casperfrom the Judge Institute of Management at Cambridge; Jonathan Haskel from the Centre forResearch into Business Activity; John Barber from the Department of Trade and Industry;David Charles from the Centre for Urban and Regional Development Studies; Chris Pywellfrom One NorthEast Regional Development Agency; and Christine Greenhalgh from OxfordUniversity. Mike Baunton of Perkins Engines provided a useful practitioner perspective onmany issues. Too many members of the Department of Trade and Industry (DTI) have beenhelpful to list individually, and we hope this report is useful for them. Within ippr the authorshave been aided by John Adams, Anthony Vigor, Matthew Taylor, Liz Kendal, Beatrice Stern,Helena Scott, Nina Bolognesi and Rachel O’Brien. Finally, our apologies go to those whomwe have failed to mention.
4 manufacturing in the uk

about the authors
Richard Brooks is Research Fellow in Economics at the Institute for Public Policy Research.His research interests include pensions and asset policy, long-term care, tax and benefitreform, manufacturing industry, local government and public-private partnerships. He wasa co-author of ippr’s 2002 report on pensions and long term care, and has previously workedat the Prime Minister’s Strategy Unit, the Labour Party Policy Unit, and the Corporate Financearm of the United Bank of Switzerland. He is a Labour Councillor in the London Borough ofTower Hamlets where he is the cabinet member with responsibility for Finance and Audit.
Peter Robinson has been Senior Economist at the Institute for Public Policy Research since1997. He leads the ippr team dealing with economic and employment policy issues and is alsoclosely involved in the institute’s work on education and training policy. He was a co-authorof ippr’s 2002 report on the funding and structure of post 16 education; co-author of ippr’s2002 report on pensions and long term care; and co-author of the final report resulting fromippr’s Commission on Public Private Partnerships. He is editor of New Economy, ippr’squarterly journal. He is a Research Associate at the Centre for Economic Performance at theLondon School of Economics, where he jointly taught a Masters course in the Social PolicyDepartment. He will shortly be taking up a position as Senior Economist at the GreaterLondon Assembly.
5

6 manufacturing in the uk

executive summary
Manufacturing industry has long held a special position for the centre-left in Britishpolitics. There has been a long discourse that sees the relative decline of UK manufacturingas a metaphor for the decline of the UK economy. Despite the recent difficult period thatmanufacturing has faced, we believe it is time to put an end to such unwavering pessimism.A period of macro-economic stability, with the exchange rate at an appropriate level,combined with an equivalent period of micro-economic stability, should create the conditionsfor a relatively successful manufacturing sector in the UK.
What has been happening to manufacturing?
It is important to distinguish between long term trends and the recent history of UKmanufacturing. The long-term process sometimes called ‘de-industrialisation’, wherebymanufacturing’s share of output and employment falls over time, is common across theadvanced industrial economies. There is no reason to believe that these long-term trends willhalt or reverse, and achieving such a reverse should not be a goal of public policy. However,this is certainly not to say that we should be unconcerned about the manufacturing sector.
The experience of UK manufacturing since its emergence from the recession of the early1990s has not been in line with experience elsewhere in the industrialised world. In mostcomparable countries manufacturing output has been steadily growing, even if not as fastas the rest of the economy. UK manufacturing output has grown very little in real terms overthe last ten years, not at all in the last five, and the sector has performed poorly byinternational standards in the late 1990s on a range of other measures such as productivitygrowth, investment and Research and Development (R&D). The correct objective for the UKis not a larger manufacturing sector but a more successful manufacturing sector.
Why does it matter?
A successful manufacturing sector will contribute towards a high and stable level ofemployment, steadily growing incomes and an equitable distribution of income andemployment across the UK. Manufacturing is a significant sector of the economy, directlyemploying over 4 million people and producing nearly a fifth of UK GDP in 2002. This is theprimary reason for its importance. The size of the sector alone does not imply a higher priorityfor manufacturing than for any other sector of a similar size. However, manufacturing doeshave some distinctive and important characteristics.
Over the 1990s manufacturing accounted for an average of 62 per cent of UK exports ofgoods and services, and 40 per cent of current account credits. Given the consistently highsterling exchange rate from 1997 to mid 2002 we might expect the UK current accountdeficit to have been steadily widening over this period. In fact this was not the case, and thecurrent account deficit stood at around one per cent of GDP in 2002. These levels are a farcry from those at the end of the unsustainable late 1980s boom, when the deficit reachedmore than five per cent of GDP. The explanation of these trends is partly that manufacturing
7

exports have proved more robust than expected to the high exchange rate, and partly thatexports of services have grown relatively rapidly. Over the very long run we may expectexports of services to slowly catch up with and eventually overtake exports of manufacturedgoods. It is important that this is a gradual process, but it no longer seems credible to claimthat a manufacturing sector of a certain size is imperative to avoid an unsustainable currentaccount position.
Manufacturing activity is very unevenly distributed around the UK, and is concentrated inareas of relatively poor economic performance. The Midlands, the North East and North West,Yorkshire and the Humber and Wales form a distinct group of regions with a particularly highshare of manufacturing in total output and employment. Poor performance by the sector islikely to contribute to worsening regional inequalities. However, the appropriate policyresponse may not consist primarily of measures related to manufacturing in the lessprosperous regions. The key challenge for public policy is to help the less advantaged regionsattract a greater share of traded services such as business and financial services.
Does manufacturing matter especially because of its contribution to productivity?
Manufacturing productivity is a component part of whole economy productivity, but this isnot a reason to focus on manufacturing productivity in particular. Although manufacturingis a high productivity sector, and productivity growth does tend to be faster in manufacturingthan in the rest of the economy, this is precisely one of the key reasons why the share ofmanufacturing in total output and employment tends to fall over time. If manufacturingoutput continues to grow at a slower rate than the economy as a whole, then thecontribution of manufacturing productivity to total economy productivity will decrease overtime. In addition, the available evidence suggests that the ‘productivity gap’ may be biggerin many service sectors than in the manufacturing sector. However, this is not to say that weshould be unconcerned with manufacturing firm productivity: it is likely to be a keycontributor to firm competitiveness, profitability and success.
The external environment and the economic framework
The external environment for manufacturing has been difficult, first in relation to a highsterling exchange rate from late 1996 to mid 2002, and from 2000 to 2003 in relation torelatively low demand growth from international markets. It may be the case that uncertaintyover the future exchange rate has retarded manufacturing investment in recent years.However, the central problem has not been volatility, rather it has been a consistently highexchange rate which has impacted upon the competitiveness of UK exports.
The Government can justifiably claim a significant degree of success for its post-1997 macro-economic regime, and over the past ten years the UK as a whole has experienced a periodof relatively low and relatively stable inflation with steadily rising employment. The UKcompetition regime has also been strengthened since 1997 and this represents an importantgain. However, there are a number of related imbalances within the UK economy. Therelatively poor performance of manufacturing; the imbalance between the growth ofconsumption, government expenditure and investment; the relatively modest currentaccount deficit; and differences in regional growth rates all present greater or lesserconcerns to policy makers. The fall in the sterling/euro rate from mid 2002 to mid 2003, whilstnot a panacea, represents an important opportunity for some of these imbalances tounwind.
8 manufacturing in the uk

Investment
UK manufacturing industry operates with a significantly lower capital stock than thesector in some comparable countries. This materially affects its relative productivity. Twothirds of the UK manufacturing productivity gap with France and nearly one third of the gapwith Germany can be accounted for by higher levels of physical capital in these countries.This is the result of very long-term trends, but in the recent past the UK appears to have beenmoving in the wrong direction rather than catching up. It is not appropriate to think in termsof a crude target for raising UK levels of investment: instead our response should be toestablish the right macro- and micro-economic environment within which firms can makethe appropriate investment choices.
The most important drivers of manufacturing investment are demand and profitability. Thehigh sterling exchange rate has played a key role in affecting both of these in the latter partof the 1990s and the first years of the new decade. Thus one of the most important issuesfor manufacturing investment is one over which the Government has relatively limitedinfluence. The depreciation of sterling from mid 2002 to mid 2003 is likely to improve theprospects for manufacturers, as long as exchange rate movements remain benign over themedium term.
The UK corporate tax regime has been and continues to be relatively favourable byinternational standards, with the UK enjoying the lowest marginal and average effectivecorporate tax rates in the G5. The tax regime thus fails to explain either the long-term capitalgaps between the UK and these other countries or more recent low UK manufacturinginvestment levels. Whilst the UK regime could be further adjusted to encourage investment,there appears to be little scope to do so without compensating tax increases elsewhere in theeconomy. This suggests caution both in relation to arguments for more generous capitalallowances and the Government’s own suggestions set out in August 2002 for further reformsof the corporation tax system. At the same time we would urge that the corporate tax systemis kept under careful review so that its benefits are not eroded as a result of emerging fiscalpressures in the UK. Given the role that uncertainty plays in retarding investment, theGovernment should strive to match its commitment to macro-economic stability with aperiod of micro-economic policy stability in this area.
An area which does require revisiting is the provision of specific investment supportinitiatives, where existing evaluation work is often extremely weak. In the absence of robustevaluation we do not know whether to shift the balance of spending between schemes, orwhether to increase or decrease total spending. We welcome the DTI review of businesssupport, but to be effective it must require that evaluation is capable of standing up toindependent academic scrutiny, and that the failure of schemes to demonstrate appropriatebenefits should result in their closure.
Skills
The commonly quoted data on the UK’s relative lack of ‘intermediate’ skills compared toFrance and Germany conceals a complex picture. When wage differentials are used toquantify relative skills, we discover that the level of UK skills capital is very similar to thatin the US, and around five per cent higher in France and Germany. Skills deficiencies makeonly a very small direct contribution to the UK’s relative manufacturing productivity gap withthe US, but account for a quarter of the gap with Germany, although this is likely tounderstate the contribution of skills to productivity via levels of innovation and enterprise.
executive summary 9

Overall levels of skills shortages and skills gaps are very similar for manufacturing firms andother areas of the UK economy. However, the pattern of these shortages and gaps is verydifferent in the manufacturing sector, with a high proportion accounted for by craftworkers and operatives. The response to these deficiencies should not be to compelemployers to increase levels of workforce training. What international evidence there issuggests that UK employers already provide relatively high levels of training, and there is noguarantee that compulsion would effectively address the existing deficiencies.
Government action to increase the level of education and training should build on theexisting incentive mechanisms by which firms and individuals choose to train. TheGovernment can play a role in ensuring that education and training providers, for examplefurther education institutions, are sufficiently flexible and well informed to meet the needsof employers and individuals. Public funding should follow the learner. At the firm level theappropriate government role is not ‘predict the requirements of the industry/region/localityand provide’ but rather to help firms adopt best practice in planning their own personnel andtraining needs. This implies that government efforts to address skills issues at the firm levelshould be set within the context of business support.
Sector Skills Councils could fulfil their existing objectives more effectively, and could playan important role in the rationalisation of other aspects of business support, if theybecame Sector Councils whose key role was assisting firms to plan for and meet their businessneeds more widely, including their skills needs. Many of the roles and characteristics of SectorCouncils would be similar to those of Sector Skills Councils but they would be businesssupport networks rather than planning organisations, drawing together the skills andenterprise agendas. We support the business-led and sector-focused nature of theseinstitutions.
Modern Apprenticeships are another specific policy area where we feel a change is justified.Revising the age limit upwards would seem to be a reasonable policy goal, so we welcomethe Government’s commitment in the 2003 Skills White Paper to removing the age cap.However, there is currently no timetable for extension of the age limit, and there is no detailabout the level of funding individuals will receive at different ages. We would encourage theSector Skills Development Agency, the DTI and the DfES to give priority to SEMTA, the SectorSkills Council for Science, Engineering and Manufacturing Technologies, in developing andimplementing their proposals in this area. This might allow some well regarded MAs inmanufacturing generally and engineering in particular, which have relatively low drop-outrates, to recruit from a wider base.
Innovation
The bulk of the manufacturing productivity gap between the UK and the US, as well as asignificant proportion of the gap with Germany and France, is accounted for by differencesin total factor productivity (TFP). Whilst we cannot be sure about its precise contribution,differences in innovation are likely to be one of the key factors affecting levels of TFP. Whilstthere is a degree of consensus about some of the appropriate policies to promote innovation,an enormous amount remains unknown and disputed. The recent increases in the sciencebudget should be welcomed, but it is important to distinguish between the objectives ofscience spending and business support.
Research and development (R&D) is an important factor in technological change andimprovements in productivity. Manufacturing industry is the most important location of R&Dactivity and its funding: in 2000 two thirds of all UK expenditure on R&D occurred in businessenterprises, of which the manufacturing sector was responsible for 80 per cent. However, at
10 manufacturing in the uk
the UK level R&D intensity has fallen through the 1980s and 1990s relative to the other G7countries. The explanation of this decline is complex, but in the 1990s declining R&D intensitywithin manufacturing sectors was very significant. Many of the factors that are likely toaffect general investment are likely to play a role in the level of R&D: current and expecteddemand, the tax regime, external factors such as the exchange rate, uncertainty, creditconstraints and the availability of skilled labour. A competitive environment is also likely toact as a spur to innovative activity.
We should recognise that there are severe data problems in this area and there are goodreasons to believe that the rate of innovative activity may change relatively slowly. We aresupportive of the recently introduced R&D tax credit, but these issues mean that it will bedifficult to judge its impact for some time. Once again, a period of micro policy stability andrigorous evaluation is called for. Some historical innovation initiatives appear to have hadpoor quality evaluation. The DTI’s Innovation Review, due in the latter half of 2003, shouldtake a very tough line on the evaluation of programmes of innovation support.
Enterprise
Enterprise can be most generally considered as the process by which inputs are broughttogether to generate outputs. Enterprise is thus another contributor to total factorproductivity growth, and in this sense is as relevant to large businesses as it is to start ups.The best policies to promote enterprise within the manufacturing sector are likely to bemacro policies: a robust competition environment and a stable macro-economic framework.
It is widely understood that product market regulation and employment legislation impactsupon levels of enterprise and productivity growth, and that governments need to exercisesensitivity in this respect. However, on the basis of international comparisons the UK performsstrongly in terms of having a regulatory regime which is conducive to business success. Thereis little evidence that the regulatory regime could help explain the UK manufacturing sector’srelatively poor performance in the late 1990s by international standards.
A potentially important micro level enterprise policy is the support of best practice, wherethere are sound theoretical reasons for a government role. As we have noted earlier, the SectorSkills Councils offer a potentially valuable mechanism as a gateway to best practice advice.What we lack at the moment is evidence of the link between government action and thespread of good management practice and the scale of the resulting effects. It is possible thatrigorous evaluation across all existing programmes of support for investment, skills formation,innovation and enterprise could suggest a radically different allocation of resources.
A ten point plan for manufacturing?
One of the themes that has emerged from our analysis is the need for a period of micro-economic policy stability in many areas. In any report of this kind there is the temptationto present a ‘ten point plan’ listing a series of key policy changes that would assist the sector.That we have not is quite deliberate. Our aim has been to provide a judicious view of theprospects for UK manufacturing and the policy instruments available to us. We have madesome specific policy proposals, particularly regarding the currently unsatisfactory agerestrictions on Modern Apprenticeships, and regarding the provision of support for bestpractice via refocused Sector Councils. However, in many areas we have been circumspect.UK manufacturing would benefit in many ways from a period of micro-economic policystability, coupled with much better evaluation of the policy instruments that we arealready using.
executive summary 11
what has been happening to UKmanufacturing?
UK manufacturing: a troubled decade
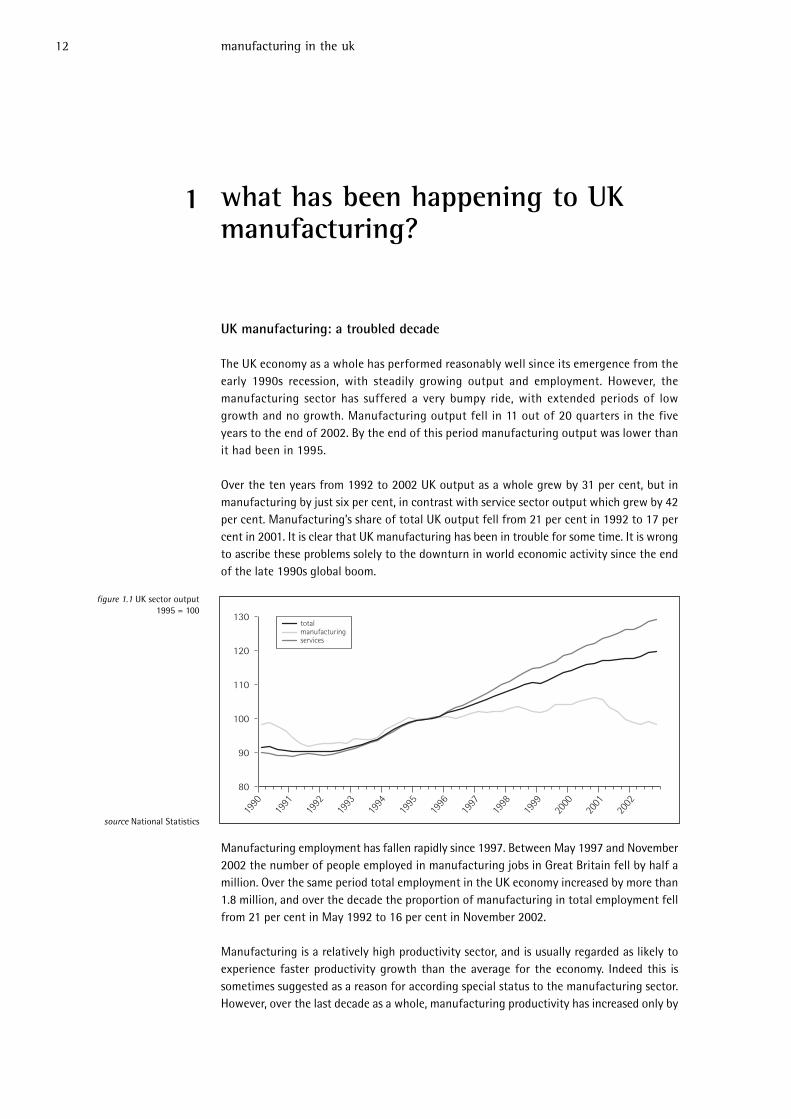
The UK economy as a whole has performed reasonably well since its emergence from theearly 1990s recession, with steadily growing output and employment. However, themanufacturing sector has suffered a very bumpy ride, with extended periods of lowgrowth and no growth. Manufacturing output fell in 11 out of 20 quarters in the fiveyears to the end of 2002. By the end of this period manufacturing output was lower thanit had been in 1995.
Over the ten years from 1992 to 2002 UK output as a whole grew by 31 per cent, but inmanufacturing by just six per cent, in contrast with service sector output which grew by 42per cent. Manufacturing’s share of total UK output fell from 21 per cent in 1992 to 17 percent in 2001. It is clear that UK manufacturing has been in trouble for some time. It is wrongto ascribe these problems solely to the downturn in world economic activity since the endof the late 1990s global boom.
Manufacturing employment has fallen rapidly since 1997. Between May 1997 and November2002 the number of people employed in manufacturing jobs in Great Britain fell by half amillion. Over the same period total employment in the UK economy increased by more than1.8 million, and over the decade the proportion of manufacturing in total employment fellfrom 21 per cent in May 1992 to 16 per cent in November 2002.
Manufacturing is a relatively high productivity sector, and is usually regarded as likely toexperience faster productivity growth than the average for the economy. Indeed this issometimes suggested as a reason for according special status to the manufacturing sector.However, over the last decade as a whole, manufacturing productivity has increased only by
12 manufacturing in the uk
source National Statistics
80
90
100
110
120
130
1990
1991
1992
1994
1995
1996
1997
1998
1999
2001
2002
1993
2000
totalmanufacturingservices
1
figure 1.1 UK sector output1995 = 100

a very similar amount to whole economy productivity. This conceals significantly highervolatility within the decade in the growth of manufacturing productivity than in theeconomy as a whole. The employment falls in the early 1990s and the upturn inmanufacturing output of 1994 correspond to more rapid increases in productivity over thisperiod. Relatively stable output and employment between 1995 and 1998 were associatedwith a period of stagnation in productivity growth. In the late 1990s falling sectoremployment generated further productivity increases. 2000-02 saw productivity growth leveloff again, principally due to very weak output growth in the sector.
UK manufacturing in international context
There is a large amount of literature in the UK describing the process of ‘de-industrialisation’,whereby manufacturing’s share of the total economy declines. This literature sometimes givesthe impression that the UK experience has been unique. In fact, as the following chartsindicate, the process has been a longstanding feature of the development of all the majorindustrial economies. Some aspects of the UK story have been distinctive, such as theunusually severe recession and associated industrial shakeout of the early 1980s which canbe clearly identified on the charts below. In other respects the UK manufacturing sector hasdeveloped over time in a similar way to the sector in many other advanced industrialeconomies: its productivity tends to rise whilst its share of output and employment tends tofall over time.
what has been happening to UK manufacturing? 13
figure 1.3 UK manufacturing andwhole economy productivity
(output per hour worked, 1992Q2=100)
figure 1.2 Manufacturing employmentin Great Britain (millions)
4.0
4.5
5.0
5.5
1993
1994
1995
1997
1998
1999
2000
2001
2002
1996
2003
90
95
100
105
110
115
120
125
130
2003
1993
1994
1996
1997
1998
1999
2000
2001
1995
2002
manufacturingwhole economy
source Labour Force Survey
source National Statistics

There are longstanding structural reasons why the share of manufacturing is declining in theadvanced industrial economies. Perhaps the most important explanation of the long rundecline in manufacturing’s share of the total economy is a shift in consumer demand fromgoods to services. As the Government’s Manufacturing Strategy states, ‘As prosperity grows,consumers spend more on labour-intensive services like healthcare, entertainment, restaurantmeals and holidays. In step, the relative importance of spending on goods, particularlyconsumable goods, tends to fall’. (DTI 2002) In addition, relatively high productivity growthin the manufacturing sector allows the prices of goods to fall relative to the price of services,further reducing the measured output of the sector.
Competition from emerging economy producers is another of the key drivers of this process,with input costs including land and labour significantly higher in industrial countries suchas the UK compared with regions such as South America and Asia. These emerging economiesare no longer just producers of low quality goods: they are increasingly competitive on thebasis of quality as well as cost. Many UK manufacturers have expanded their supplier baseto include companies in these regions. China’s recent accession to the WTO signals asignificant increase in competition for UK manufacturers.
A further widely discussed reason for the decline of manufacturing as a share of the economyis the shift towards higher levels of service inputs into manufacturing firms. Over the period1992 to 2000, National Statistics input-output tables indicate that the share of services inUK manufacturing firms’ gross inputs rose from 17 per cent to 20 per cent. In part this is a
14 manufacturing in the uk
figure 1.5 Manufacturing share ofemployment in the G6
10%
15%
20%
25%
30%
35%JapanGermanyUKItalyFranceUS
1970
1973
1976
1982
1985
1988
1991
1994
1997
1979
2000
1971
1974
1977
1983
1986
1989
1992
1995
1998
1980
2001
1972
1975
1978
1984
1987
1990
1993
1996
1999
1981
note Germany is shown postunification only
source OECD STAN database
figure 1.4 Manufacturing share ofvalue added in the G6
10%
15%
20%
25%
30%
35%JapanGermanyUKItalyFranceUS
1970
1973
1976
1982
1985
1988
1991
1994
1997
1979
2000
1971
1974
1977
1983
1986
1989
1992
1995
1998
1980
2001
1972
1975
1978
1984
1987
1990
1993
1996
1999
1981
note Germany is shown postunification only
source OECD STAN database

measurement issue: some services that used to be produced and consumed withinmanufacturing firms are now out-sourced, reducing the measured value of themanufacturing sector’s output. However, it is important to note that whilst a significantportion of service sector activity depends upon manufacturing, the reverse is also true: 20per cent of UK service sector inputs in 2000 were manufactured goods.
Whilst the long run trends in the UK reflect international patterns, the experience of UKmanufacturing since its emergence from the recession of the early 1990s has not been in linewith trends elsewhere in the industrialised world. It was supposed to have emerged ‘leanerand fitter’ in the early 1990s after two periods of recession and shakeout. But output trendshave been disappointing and manufacturing has been buffeted by a further shock in the late1990s associated with a high sterling exchange rate.
How big a problem is lower UK manufacturing productivity?
UK manufacturing productivity on a per worker basis is similar to the average for a groupof comparable industrialised countries. Figure 1.6 shows that whilst there is a positiverelationship between manufacturing productivity and GDP per capita, there is also a widedistribution of manufacturing productivity levels between countries with similar GDP percapita. The US is a clear outlier with very high GDP per capita and very high manufacturingproductivity.
UK manufacturing productivity is significantly lower than in France, Germany and the US,the countries for which the best data is available and with which the UK is most frequentlycompared. However, levels of GDP per capita in France, Germany and the UK are very similar,with higher productivity in France and Germany being almost exactly offset by lower levelsof employment. It is not therefore clear why the higher productivity of, for example, Frenchmanufacturing relative to the UK is seen to be particularly advantageous when it does notresult in overall higher levels of income per head. This is not to deny the obvious point thatif UK productivity was higher and all other things were equal, then UK GDP per capita wouldbe higher. The point here is simply that material living standards are not higher in France thanin the UK as a result of higher levels of manufacturing productivity.
what has been happening to UK manufacturing? 15
figure 1.6 Manufacturing productivityvs GDP per capita, 1999(UK=100)
50 75 100 125 150 17560
70
80
90
100
110
120
130
140
150
160
Manufacturing productivity
GDP
per
cap
ita
Greece
Portugal Spain
US
Belgium
Ireland
Finland
Denmark
Netherlands
France
Sweden
Austria
EU total
ItalyGermany
UK
source O’Mahony, NIESR 180

Understanding the UK’s manufacturing productivity gap
Table 1.1 presents recent work by the National Institute for Economic and Social Research(NIESR) using an accounting framework to analyse productivity, measured as value added perhour worked in the UK, US, France and Germany, and providing a decomposition of thefactors contributing to the relatively poor performance of manufacturing productivity in theUK at the end of the 1990s.
In 1999, output per hour worked in manufacturing was 55 per cent higher in the US than in theUK, 32 per cent higher in France and 29 per cent higher in Germany. In this accounting framework,lower UK productivity performance in manufacturing compared to France and Germany is to asignificant extent explained by lower UK capital/labour ratios. Indeed, fully two thirds of themanufacturing productivity gap with France and nearly one third of the gap with Germany canbe accounted for by higher levels of physical capital, that is the accumulation of past investment
16 manufacturing in the uk
table 1.1 Decomposition of relativelabour productivity in the
manufacturing sector, 1999
What is productivity and why does it matter?
‘Productivity’ is frequently used as shorthand for labour productivity, a measure of output per unitof labour input. It is normally expressed either in terms of output per worker employed or outputper hour worked. Due to problems with data on actual hours worked, output per worker is easierto calculate, and is therefore more often used by the current UK government for internationalcomparisons. It is also a relatively intuitive measure that can easily be converted into total outputby multiplying by total employment. However, output per hour worked may be considered a purermeasure of the efficiency with which inputs are converted into valuable outputs, and is a bettermeasure to use when the data is available.
Productivity matters principally because it is a key driver of GDP per capita, which is the bestsummary measure of economic performance, the improvement of which is usually seen as a firstorder policy goal. Productivity is also important at the firm level: other things being equal moreproductive firms are likely to have a competitive advantage and generate higher profits. The term,however, does not seem to resonate with business people, many of whom think primarily in terms ofprofitability or ‘competitiveness’, a term which looses its meaning when comparing the macro-economic performance of national economies.
Improved productivity is best seen as a means rather than an end in itself. Output and income mayalso be raised by increasing the labour supply, either through higher employment or throughincreased working hours of those already in employment. Reduced hours of work for some seems tobe a goal of public policy in the UK, but this is likely to reduce output per worker employed even ifit results in some improvement in output per hour worked as labour is more efficiently utilised.Similarly, we may wish to see employment rise at the bottom end of the labour market even if thisholds back productivity growth, although whether it in fact does so is an empirical issue.
In addition to there being different measures of productivity, there are also formidable difficultiesin acquiring accurate data with which to produce the various measures. This applies particularly tointernational comparisons given different currencies and accounting conventions. Discussion ofproductivity differences, especially between different countries, should thus be informed byrealism about the margin of error attached to the reported measures.
US France Germany
Value added per hour worked
Relative levels, UK = 100 155 132 129
Percentage contributions
Total capital 25 54 Physical capital 21 68 29 Skills capital 4 25
Total factor productivity 75 32 46
note Skills capital is includedwith TFP for France
source O’Mahony & de Boer (2002)Table 16

in plant and machinery. However, we should be careful about inferring from this that if the UKhad the same levels of physical capital as France then the productivity gap with that countrywould be reduced by 68 per cent. This would depend upon the additional UK investment beingused productively. There is some evidence in NIESR’s work of rather poor utilisation of the generousphysical capital stocks in Germany and France, reflected in low levels of capital productivityrelative to the US. It is not appropriate to think in terms of a crude target for raising UK levelsof investment. However, we can see that levels of physical capital and to a somewhat lesser extentskill levels are important drivers of productivity performance.
The explanation for poor UK manufacturing productivity performance relative to the US, orperhaps more accurately the explanation of the very strong productivity performance of theUS, is more elusive. Only 25 per cent of the very large gap is explained by relative levels of skillsand physical capital, of which physical capital is much the most important. Indeed, in thisaccounting framework little of the productivity gap with the US is explained by differences inskill levels, although given the formidable data issues in this kind of calculation it is dangerousto assert this with absolute confidence. It should be noted that some of the impact of skills willnot be directly identified by the growth accounting framework. A significant impact frommanagement skills is likely to be hidden within the total factor productivity residual.
Fully three quarters of the UK’s manufacturing productivity gap with the US, and half thegap with Germany, is explained by differences in total factor productivity (TFP, sometimesalso called Multi-Factor Productivity: MFP). TFP measures labour productivity afteraccounting for the measured contribution of capital, usually physical capital only but in someanalyses skills capital also. It attempts to capture the impact of how an economy isorganised to bring together the factors of production in an efficient manner. Key factors suchas how ‘innovative’ and ‘enterprising’ an economy is, how competitive its markets and howrobust its economic institutions are, all contribute to raising TFP. A key difficulty is that itis not possible to use the accounting framework applied to skills and physical capital toquantify the contribution of these various hidden factors. The importance of TFP inexplaining much of the UK’s manufacturing productivity gap, especially with the US,emphasises the difficulty of explaining the causes of that gap. If we cannot be sure aboutthe causes of the gap it is difficult to know where to focus our efforts to close it.
Is the UK catching up with or falling further behind comparable industrial countries? WhilstUK manufacturing productivity grew only marginally slower than in the US, France andGermany over the decade to 1999, comparing only the beginning and end of this periodconceals a worrying pattern. UK Productivity growth in the early part of this period was fasterthan in the US and France, and Germany’s very fast productivity growth can be explained bythe effects of re-unification of the former East and West. However, UK manufacturingproductivity growth from 1995-99 was less than one per cent per annum: far behind rates
what has been happening to UK manufacturing? 17
source O’Mahony & de Boer (2002)
figure 1.7 Manufacturing productivitygrowth rates, % per annum
0%
1%
2%
3%
4%
5%
1989-99 1989-95 1995-99
US
France
Germany
UK
in France and Germany and a fraction of the very strong US performance of the late 1990s.It is this pause in UK manufacturing productivity growth that is both puzzling and troubling.
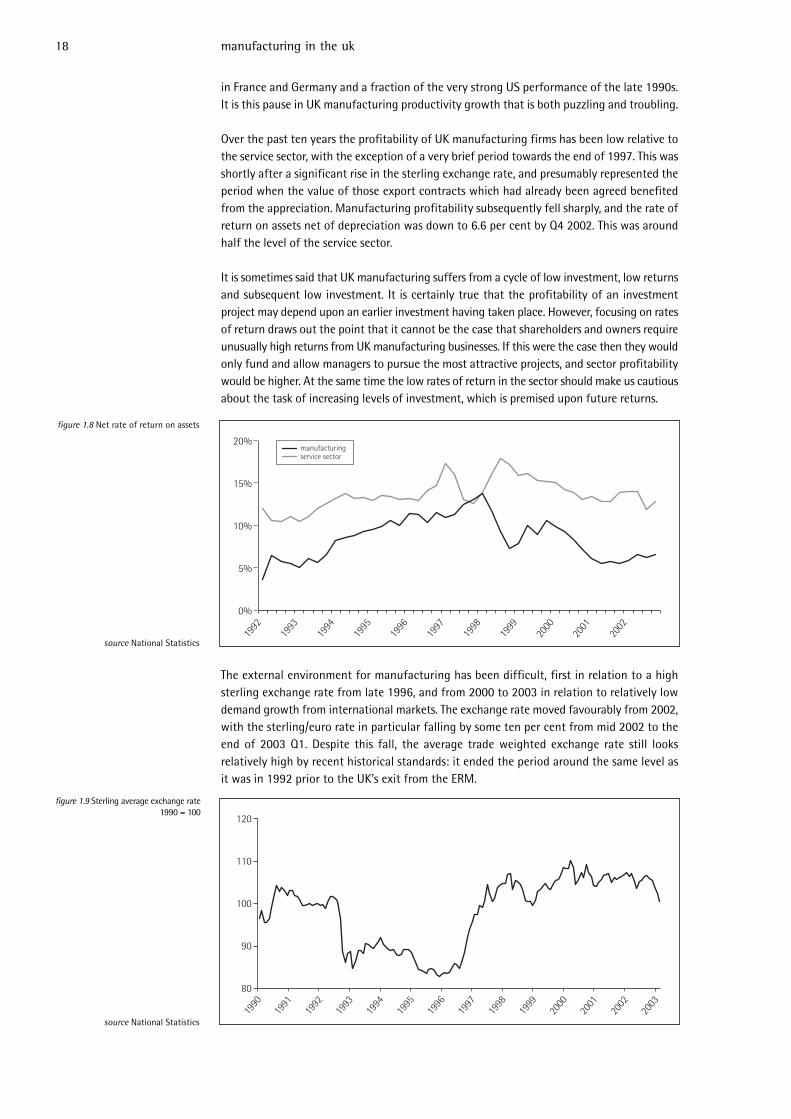
Over the past ten years the profitability of UK manufacturing firms has been low relative tothe service sector, with the exception of a very brief period towards the end of 1997. This wasshortly after a significant rise in the sterling exchange rate, and presumably represented theperiod when the value of those export contracts which had already been agreed benefitedfrom the appreciation. Manufacturing profitability subsequently fell sharply, and the rate ofreturn on assets net of depreciation was down to 6.6 per cent by Q4 2002. This was aroundhalf the level of the service sector.
It is sometimes said that UK manufacturing suffers from a cycle of low investment, low returnsand subsequent low investment. It is certainly true that the profitability of an investmentproject may depend upon an earlier investment having taken place. However, focusing on ratesof return draws out the point that it cannot be the case that shareholders and owners requireunusually high returns from UK manufacturing businesses. If this were the case then they wouldonly fund and allow managers to pursue the most attractive projects, and sector profitabilitywould be higher. At the same time the low rates of return in the sector should make us cautiousabout the task of increasing levels of investment, which is premised upon future returns.
The external environment for manufacturing has been difficult, first in relation to a highsterling exchange rate from late 1996, and from 2000 to 2003 in relation to relatively lowdemand growth from international markets. The exchange rate moved favourably from 2002,with the sterling/euro rate in particular falling by some ten per cent from mid 2002 to theend of 2003 Q1. Despite this fall, the average trade weighted exchange rate still looksrelatively high by recent historical standards: it ended the period around the same level asit was in 1992 prior to the UK’s exit from the ERM.
18 manufacturing in the uk
source National Statistics
figure 1.8 Net rate of return on assets
0%
5%
10%
15%
20%
1992
1993
1994
1996
1997
1998
1999
2000
2001
1995
2002
manufacturingservice sector
80
90
100
110
120
1990
1991
1992
1994
1995
1996
1997
1998
1999
2001
2002
1993
2000
2003
source National Statistics
figure 1.9 Sterling average exchange rate1990 = 100

The international demand picture is worse now than it was in 2000 when the manufacturingsector was already in difficulty. We should thus be very cautious about assuming that themodest weakening of the exchange rate will be a panacea. Table 1.2 compares forecasts bythe National Institute for Economic and Social Research made in April 2000 and April 2003.It indicates that projections of GDP growth in the US and EU are now significantly lessoptimistic than they were three years ago. A comparison of the National Institute’s April 2000and April 2003 forecasts of world trade growth indicates a similar pattern. Despite this,consensus forecasts are for better performance from UK manufacturing from 2003 onwardsthan was experienced from 2000-2003. In April 2003, NIESR forecast manufacturing outputgrowth of 2.3 per cent in 2003-04 and 2.5 per cent in 2004-05.
As we have seen, UK manufacturing is not alone in shrinking as a proportion of output: thepattern is common to most developed economies. However, in most comparable countriesmanufacturing output has been steadily growing, even if not as fast as the rest of theeconomy. Figure 1.10 shows that despite entering recession in the early 1990s at differenttimes, the overall increase in manufacturing output from 1990 to 1997 was remarkablysimilar in France, Germany and the UK. It is from 1998 that the trends sharply diverge asthe appreciation of sterling takes its toll. UK manufacturing output has grown very littlein real terms over the last ten years, and not at all in the last five. In addition, the sectorhas performed poorly by international standards in the late 1990s on a range of othermeasures such as productivity growth, investment and R&D. We need an explanation ofwhat has been different in the UK, and an understanding of what difference governmentaction could make to the sector.
what has been happening to UK manufacturing? 19
source Eurostat/EEF
table 1.2 Forecast GDP growth:contrasting 2000 with 2003April 2000 April 2003
GDP growth % pa GDP growth % pa
World EU World EU
2000 4.1 3.4 2003 3.2 1.3
2001 4.1 3.1 2004 3.2 2.0
2002 3.9 2.7
2003-06 4.0 2.8 2005-09 3.5 2.6
GermanyFranceUK
80
90
100
110
120
130
1990
1991
1992
1994
1995
1996
1997
1998
1999
1999
1999
1999
1999
1999
2001
2002
1993
2000
source National Institute EconomicReview April 2000 and April 2003
figure 1.10 Manufacturing output inthe UK, France and Germany (1995 = 100)
why does manufacturing matter?
A high and stable level of employment, steadily growing incomes, and an equitabledistribution of income and employment across the UK are first order goals for a progressivegovernment. The first two are certainly explicit Government objectives, whilst the DTI, HMTreasury and ODPM share a Public Service Agreement target to reduce over the long termthe persistent gap in growth rates between the regions. How does manufacturing fit into thisframework, and are there other reasons why we might care especially about this particularsector?
Manufacturing is a significant sector of the economy, both in terms of output andemployment, and this is the primary reason for its importance. We should certainly care abouta sector which directly employs over 4 million people and produces nearly a fifth of UK GDP.However, the size of the sector alone does not imply a higher priority for manufacturing thanfor any other industrial sector of a similar size, nor is it what representatives ofmanufacturing businesses such as the Engineering Employer’s Federation argue for.
A number of arguments have been advanced in support of the special importance ofmanufacturing:
� its contribution to the current account of the balance of payments
� its importance to the less prosperous regions
� its role as the location of the majority of business expenditure on research anddevelopment
� its significance in terms of whole-economy productivity and growth levels
Manufacturing and the current account
Manufacturing exports make a significant contribution to the current account of the UKbalance of payments. Over the 1990s manufacturing accounted for an average of 62 per centof UK exports of goods and services, and 40 per cent of current account credits. These figureshave been on a gentle downwards trend since 1997, and at the end of 2002 stood at relativelows of 55 per cent and 36 per cent respectively, although we should not draw strongconclusions from a single quarter’s data. As shown by Figure 2.1, the historical trend is forthese shares to reflect economic cycles. The current falls appear somewhat more severe thanthose experienced during and following the early 1990s recession, although much lesspronounced than the experience of the early 1980s.
The UK current account deficit is principally funded by foreign investment which balancescurrency flows. Whilst the US experience of consistently high current account deficitsindicates the difficulty of predicting when the situation will deteriorate, we should expectthere to be limits to the willingness of foreign investors to fund the domestic consumptionof imported goods. The process of correction can be extremely painful, with capital flight and
20 manufacturing in the uk
2

a rapid depreciation of the currency followed in certain circumstances by rising inflation. Insuch a situation the lower exchange rate eventually stimulates export growth and a returnto equilibrium. This is the kind of cycle we should strenuously seek to avoid in the UK.
Given the consistently high sterling exchange rate we might expect the UK current accountdeficit to have been steadily widening from 1997 to 2003. It is true that the balance of tradein manufactures worsened significantly from 1998 to historically high levels in 2001.However, as figure 2.2 shows, the current account as a whole does not reflect this pattern.From 1997 Q1 the current account moved from close to balance to a deficit of 2.5 per centof GDP by 1999 Q1. The deficit then fluctuated around two per cent of GDP until 2000 Q4and then fell back to around one per cent of GDP from 2001 Q3 to 2002 Q4 as reported inearly 2003. Whilst we should be cautious about drawing inferences from such a volatile andproblematic indicator, these deficit levels are a far cry from those at the end of theunsustainable late 1980s boom, when the current account deficit reached more than five percent of GDP. These are the sort of levels currently being experienced by the US economy, andin comparison the UK position appears far less threatening.
There are at least two possible explanations for the resilience of the UK current account.One is that manufacturing exports have proved more robust than expected to the highexchange rate. Alternatively, other income items in the current account may have taken theplace of lost exports of manufactured goods. In fact both explanations find some supportfrom the available evidence. Over the period 1973-1996 exports of goods grew at anaverage rate of 4.6 per cent per annum whilst exports of services grew at an average rateof 3.1 per cent per annum. More recently, exports of services have grown more rapidly thanexports of goods, but nonetheless goods exports have held up relatively well. Between 1996and 2002 exports of goods grew at an average rate of 4.2 per cent per annum whilst exports
why does manufacturing matter? 21
source National Statistics
figure 2.1 Manufacturing as % totalexports and current account credits
20%
30%
40%
50%
60%
70%
1970
1973
1976
1982
1985
1988
1991
1994
1997
1979
2000
1971
1974
1977
1983
1986
1989
1992
1995
1998
1980
2001
1972
1975
1978
1984
1987
1990
1993
1996
1999
1981
2002
% exports% current account credits
-6%
-4%
-2%
0%
2%
4%
6%
1982
1985
1988
1991
1994
1997
2000
1983
1986
1989
1992
1995
1998
1980
2001
1984
1987
1990
1993
1996
1999
1981
2002
source National Statistics
figure 2.2 Current account balance as% GDP

of services grew at an average rate of 5.3 per cent per annum. Over the long run, asmanufacturing gradually declines as a proportion of GDP, this pattern is consistent with astable current account deficit. We would expect exports of services to slowly catch up withand eventually overtake exports of goods as the structure of the economy changes over time(Hawksworth 2001). For the reasons outlined above, it is important that this is a gradualprocess generated by a smooth structural adjustment. However, it no longer seems credibleto claim that a manufacturing sector of a certain size is imperative to avoid anunsustainable current account.
Manufacturing and the regions
Manufacturing activity is very unevenly distributed around the UK, and is concentrated inareas of relatively poor economic performance. Both manufacturing output and employmentaccount for widely different shares of the regional economies. The Midlands, the North Eastand North West, Yorkshire and the Humber and Wales form a distinct group of regions witha particularly high share of manufacturing in total output. Manufacturing employment issomewhat more evenly distributed, but the rankings of the regions are very similar. The mostprosperous and fastest growing areas of London, the East and South East are the regions withthe lowest share of manufacturing activity.
22 manufacturing in the uk
source Labour Force Survey/Nomis
figure 2.3 Regional share ofmanufacturing in output
10%
15%
20%
25%
30%
35%
1989 1990 1991 1992 1993 1994 1995 1996 1997 1998
L
SE
E
NISWS
NWY&HWNE
WMEM
5%
10%
15%
20%
25%
30%
May 92 May 93 May 94 May 95 May 96 May 97 May 98 May 99 May 00 May 01 May 02
L
SE
ESWS
NW
Y&H
W
NE
WM
EM
note Regional GVA figures have beendelayed, 1997 and 1998 figures are
still provisional
source National Statistics
figure 2.4 Manufacturing employmentas % of total by region

We should be careful about arguing that the relative economic success of the southernregions is a result of their relatively low share of manufacturing industry. The structure ofsuch an argument is roughly that the greater extent of the service sector in the southernregions, combined with the stronger performance of the service sector as a whole, explainsthe higher growth rates of the more economically successful regions. In fact, less than a thirdof the difference in growth rates between the Southern regions (London, the South East andthe South West) and the rest of the UK in the late 1990s is explained by the share ofmanufacturing in regional output (Morris 2001). Further, despite a higher proportion of‘high-tech’ manufacturing in the southern regions, growth of manufacturing output was verysimilar over this period in the two regions, although it should be noted that this is a very highlevel of geographical aggregation. The most important factors in explaining the differencein growth rates were faster growth within the service sector and faster population growthin the southern regions. This type of analysis is still difficult to perform due to thelimitations of regional output and inflation data. There is some relationship between thegrowth of manufacturing and total output in individual regions over the period 1989 to1998, for example the North East and North West, the two regions with the weakest totalgrowth, were also the regions with weakest manufacturing output growth.
Because of the uneven distribution of manufacturing activity, poor performance by thesector as a whole is likely to contribute to worsening regional inequalities. However, theappropriate response may not consist principally of policy measures related to manufacturingindustry in the less prosperous regions. If we expect manufacturing’s share of output andemployment to decline steadily over time, the key challenge for public policy is to help theless advantaged regions attract a greater share of traded services such as business andfinancial services. The economic base of regions such as the North East and Wales needs tobe diversified. This does not necessarily mean less support for manufacturing from such policyinstruments as Regional Selective Assistance, but it does mean more support for tradedservices from such instruments (Adams, Robinson & Vigor 2003 forthcoming).
Manufacturing and innovation
Manufacturing is the location of the majority of UK business expenditure on research anddevelopment activity, and R&D is thought to have wider benefits to the economy thanare captured by the innovating firm. New products and processes embody knowledge andvalue which is difficult to entirely retain within the innovating firm. Individuals who carryout R&D, or who simply participate in innovative activity, move between firms spreadingthese benefits. This is a potentially important mechanism by which manufacturing cancontribute to better aggregate economic performance and living standards. UK R&Dperformance has been relatively poor since the mid 1990s, and this can be largelyexplained by low levels of manufacturing R&D (Griffith and Harrison 2003). This is anissue we will turn to in the next section.
Manufacturing and productivity
Does manufacturing matter especially because of its contribution to productivity?Manufacturing productivity is a component part of whole economy productivity, but this isnot a reason to focus on manufacturing productivity in particular. We already know thatthere is not a close correlation between manufacturing productivity and GDP per capitaamongst the advanced industrial economies. Although productivity growth does tend to befaster in manufacturing than in the rest of the economy, as already noted this is preciselyone of the key reasons why the share of manufacturing in total output and employmenttends to fall over time. There are real productivity gains in manufacturing which are
why does manufacturing matter? 23

difficult to achieve in some service industries. In competitive markets consumers are likelyto secure the benefits of these gains, and thus the price of manufactured goods tends to fallagainst, for example, the price of a haircut. A significant part of the fall in manufacturing’sshare of the economy is thus attributable to the falling price of manufactured goods, orequivalently to increases in quality which are not reflected in higher prices.
If manufacturing output continues to grow at a slower rate than the economy as a whole,then the contribution of manufacturing productivity to total economy productivity willdecrease over time. In addition, the available evidence suggests that the ‘productivity gap’may be bigger in many service sectors than in the manufacturing sector. Whilst there is a verysignificant gap between UK and US manufacturing productivity, the measured gap withFrance and Germany is almost as big for the market services sector as it is for manufacturingindustry. The UK market services sector is more than two and a half times larger in termsof its share of output and more than three times larger in terms of its share of employmentthan the UK manufacturing sector. If we are particularly worried about the whole economyproductivity gap we should be at least as concerned about the productivity of the servicesector as with manufacturing industry. In particular, the significant measured productivitygap in financial and business services and in the distribution sector seem worthy of furtheranalysis and possibly attention by policy makers.
One reason why we should care particularly about manufacturing productivity is that weexpect it to be associated with improved manufacturing competitiveness and profitability:in short, with firm success. The Government should change its rhetoric here: the argumentthat it is manufacturing productivity especially that must improve so that whole economyproductivity can improve is unconvincing. Manufacturing productivity must improve so thatmanufacturing firms can be successful, delivering our first order policy goals concerned withemployment and output.
Manufacturing’s contribution understated
The impact of manufacturing on UK economic performance is likely to be understated by themeasured size of the sector. As indicated earlier, manufacturing industries create significantdemand for market services, and there are complex links between manufacturing and non-manufacturing businesses. Whilst recognising these inter-relations we should also be awareof double counting problems and the way in which service sector firms create demand formanufactured goods. As discussed earlier, the trend towards contracting out may mean thatsome of the measures of de-industrialisation are exaggerated. In addition there aresignificant classification problems in measuring output. For example, should we considerproduct design or software companies to be manufacturing businesses? There is a clear needto keep these categories up to date, and the lengthy process of international negotiationaround revision of the Standard Industrial Classification System is currently ongoing.
24 manufacturing in the uk
table 2.1 Relative productivityand shares of output and
employment, 1999
Share of UK ProductivityUK = 100
Output Employment US France Germany
Manufacturing 19.6 15.7 155 132 129
Market services 51.3 53.4 132 125 125
Distributive trades 15.6 22.4 161 150 112
Financial & business services 21.0 18.6 153 126 161 source O’Mahony & de Boer(2002)

Manufacturing in the long run
There is no reason to believe that the long-term trends for the manufacturing sector to shrinkas a proportion of the advanced industrial economies will halt or reverse, and achieving sucha reverse should not in any case be a goal of public policy. The US, for example, has a smallermanufacturing sector in relation to its total economy than the UK at the same time assignificantly higher GDP per capita and levels of whole economy productivity, and amongsta large group of industrialised countries there is a limited relationship betweenmanufacturing’s share of an economy and GDP per capita.
What will happen if the long-term trends we have identified continue over the nextseveral decades? Hawksworth (2001) maps out a long-term scenario where UK manufacturingoutput grows by its 20-year historical average of one per cent per annum, manufacturingproductivity grows by 3 per cent per annum, and GDP grows by 2.5 per cent per annum. Thiswould result in a UK manufacturing sector accounting for some 10 per cent of output andless than 5 per cent of employment by 2050. If the long-term growth rate of manufacturingoutput rises to 1.5 per cent per annum, and we keep the other assumptions constant, thenthe sector will account for around 12.5 per cent of output by 2050. Should we face such afuture with equanimity? The answer is: only if such a transition can be managed smoothly,without harmful impacts on particular regions where manufacturing is concentrated,without any sudden worsening of the current account balance, and without unacceptablenegative effects on the high return activities related to manufacturing such as research anddevelopment.
Such a transition is entirely compatible with, and in fact to some extent relies upon, thecontinued success of the firms that make up the UK manufacturing sector. To accept thatthe UK manufacturing sector will continue to shrink as a share of the UK economy is not tosay that we should not care about it. The correct objective is not a larger manufacturingsector but a successful manufacturing sector.
This conclusion may still dismay some of those, especially on the centre-left, who havehistorically emphasised the unique importance of manufacturing. A long literature hassuggested that manufacturing’s too rapid decline posed a real threat to the progressive’s firstorder policy objectives in relation to output and employment, and has especially emphasisedthe importance of manufacturing to the current account of the balance of payments. It isthe absence of any real pressure on this front that should lead one to question this story.
why does manufacturing matter? 25
the public policy response
UK manufacturing has suffered an extended period of relatively poor performance. Our desirefor high and stable levels of employment, steady growth in GDP per capita, an acceptableregional pattern of economic activity and, as a necessary concomitant, a sustainableexternal account, all motivate a concern to improve the position of the sector. This does notmean that manufacturing should receive specially favourable treatment from public policy,and as noted earlier this is not what the representatives of manufacturing businesses arguefor. Instead we want a consistent strategy for business which is supportive of manufacturing.Manufacturing is not a special case, but it is an important case.
At times the Government’s broad economic agenda seems to boil down to a focus on the‘productivity gap’ between the UK and comparable industrialised countries and an associated‘productivity agenda’ as the policy response. There is no question that higher productivity,other things being equal, is a worthwhile intermediate goal. However, it is important to keepproductivity in perspective. It is an important component of our first order economic policygoal of steady growth in GDP per capita. However, a focus on productivity alone does notdirectly address other first order objectives such as high and stable levels of employment anda balanced pattern of regional development. Indeed, the relationship between productivityand these other objectives may be complex and at times antagonistic. Whether there areconflicts between higher productivity, levels of employment and the economic developmentof under-performing regions is an important question, and one that the Government shouldrecognise and seek to answer rather than avoid. There are also indications that the languageof the productivity agenda is attractive neither to the public, who associate it with‘rationalisation’ and job losses, nor to businesses who think in terms more immediatelyapplicable to their success such as competitiveness and profitability.
Despite these caveats, the rest of this chapter will be structured around a set of issues whichare often referred to by the Government as the key ‘productivity drivers’. This will be donefor three reasons. Firstly, it is accepted that productivity is closely related to the issues whichmatter for individual manufacturing businesses and which determine company success. Ina sense it does not matter if we start by discussing competitiveness or productivity: eitherway we will arrive at the other. Secondly, the productivity agenda is relevant to our widerobjectives, notably steady growth in GDP per capita, and other supporting goals such as asuccessful export sector and a sustainable current account. Finally, because governmentpolicy is structured around a productivity agenda it is helpful to frame our discussion in thesame way for ease of cross reference.
The Government’s productivity agenda is most clearly set out in a series of joint Treasury/DTIpublications beginning with Productivity in the UK: The Evidence and the Government’sApproach (HM Treasury 2000) and continuing with a series of productivity themed reportsin every subsequent year. These documents identify five drivers as central to improvingproductivity performance. Macro-economic stability can be considered a sixth driver, theimportance of which is continually emphasised by the government as the foundation for alleconomic success. UK policy for the manufacturing sector was set out in The Government’sManufacturing Strategy (DTI 2002). This document is also focused strongly on productivityimprovement, and identifies seven pillars, rather than drivers, for manufacturing success.
26 manufacturing in the uk
3
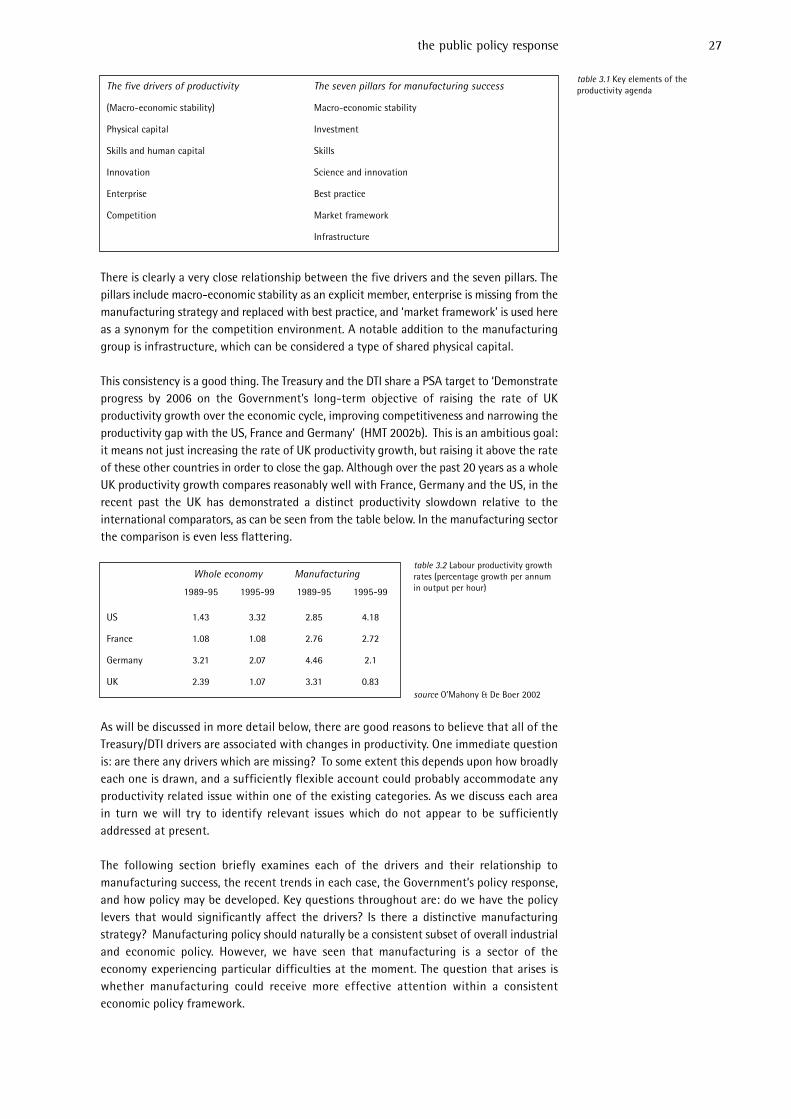
There is clearly a very close relationship between the five drivers and the seven pillars. Thepillars include macro-economic stability as an explicit member, enterprise is missing from themanufacturing strategy and replaced with best practice, and ‘market framework’ is used hereas a synonym for the competition environment. A notable addition to the manufacturinggroup is infrastructure, which can be considered a type of shared physical capital.
This consistency is a good thing. The Treasury and the DTI share a PSA target to ‘Demonstrateprogress by 2006 on the Government’s long-term objective of raising the rate of UKproductivity growth over the economic cycle, improving competitiveness and narrowing theproductivity gap with the US, France and Germany’ (HMT 2002b). This is an ambitious goal:it means not just increasing the rate of UK productivity growth, but raising it above the rateof these other countries in order to close the gap. Although over the past 20 years as a wholeUK productivity growth compares reasonably well with France, Germany and the US, in therecent past the UK has demonstrated a distinct productivity slowdown relative to theinternational comparators, as can be seen from the table below. In the manufacturing sectorthe comparison is even less flattering.
As will be discussed in more detail below, there are good reasons to believe that all of theTreasury/DTI drivers are associated with changes in productivity. One immediate questionis: are there any drivers which are missing? To some extent this depends upon how broadlyeach one is drawn, and a sufficiently flexible account could probably accommodate anyproductivity related issue within one of the existing categories. As we discuss each areain turn we will try to identify relevant issues which do not appear to be sufficientlyaddressed at present.
The following section briefly examines each of the drivers and their relationship tomanufacturing success, the recent trends in each case, the Government’s policy response,and how policy may be developed. Key questions throughout are: do we have the policylevers that would significantly affect the drivers? Is there a distinctive manufacturingstrategy? Manufacturing policy should naturally be a consistent subset of overall industrialand economic policy. However, we have seen that manufacturing is a sector of theeconomy experiencing particular difficulties at the moment. The question that arises iswhether manufacturing could receive more effective attention within a consistenteconomic policy framework.
the public policy response 27
source O’Mahony & De Boer 2002
table 3.1 Key elements of theproductivity agendaThe five drivers of productivity The seven pillars for manufacturing success
(Macro-economic stability) Macro-economic stability
Physical capital Investment
Skills and human capital Skills
Innovation Science and innovation
Enterprise Best practice
Competition Market framework
Infrastructure
Whole economy Manufacturing
1989-95 1995-99 1989-95 1995-99
US 1.43 3.32 2.85 4.18
France 1.08 1.08 2.76 2.72
Germany 3.21 2.07 4.46 2.1
UK 2.39 1.07 3.31 0.83
table 3.2 Labour productivity growthrates (percentage growth per annumin output per hour)

i) The economic framework
a) Macro-economic policyThe Government can justifiably claim a significant degree of success for its post 1997 macro-economic regime, building on a framework that was developed after sterling’s exit from theERM in 1992. The key elements of this regime are operational independence for the Bank ofEngland in pursuing its symmetrical 2.5 per cent inflation target, the fiscal rules and the Codefor Fiscal Stability. These will not be discussed in any detail here. Whilst commentators havenoted various ways in which the rules may be sub-optimal or ambiguous (for example,Emmerson & Frayne 2002) there is general consensus that they represent an importantcontribution to macro-economic stability in the UK. Over the past ten years the UK hasexperienced a period of relatively low and relatively stable inflation with steadily risingemployment, testament to the success of the post-1992 macro-economic framework.
There is good evidence that both monetary policy stability and output stability are beneficialfor output growth (Ramey and Ramey 1995; Kroft and Lloyd-Ellis 2002; Holmes et al 2001).It is a relatively short step to imply that such stability should be good for manufacturingindustry as part of the wider economy. In fact, even if stability was not a factor promotinghigher growth, it should still be a central goal of government policy because of the very highpersonal impact of employment instability on personal well being (Donovan & Halpern 2002).
On the other hand, during the period from the end of the Second World War to the first oilshock in 1973, growth rates in the UK lagged behind many comparable countries eventhough UK output volatility was relatively low. The period 1979 to 1993 then saw the UK gothrough two severe recessions with an unsustainable boom in between. Problems such as theproductivity gap, or the low levels of physical capital stock in the UK economy, were alreadyapparent by 1979 after a long period during most of which the UK had not experiencedexcessive macro-economic volatility relative to comparable industrial countries. Macro-economic stability is a necessary rather than sufficient condition for better outcomes inmanufacturing.
b) The unbalanced economyAs the first section of this report has indicated, whilst the UK economy as a whole hasperformed reasonably well since 1993 in terms of output growth, employment, and pricestability, manufacturing has presented a stark exception to the overall picture. There are anumber of serious and related imbalances in the UK economy, of which the weakness ofmanufacturing relative to the service sector is one.
Another key related imbalance is that between the different categories of domesticexpenditure. In a simple national accounting framework, domestic expenditure is dividedbetween private consumption, government spending and investment. Business investmentgenerally and manufacturing investment specifically have been squeezed since the late1990s. In a simple accounting sense this has been a necessary counterpart to strong growthin private consumption and government spending. The corollary is that the rate of growthof one of these must fall if private investment is to recover. Specifically, either privateconsumption or government expenditure must grow more slowly than the trend rate ofgrowth of the economy for the share of business investment to increase. Given theimportance of the Government’s commitment to the key public services, there is little scopefor reductions in the rate of growth of public spending in the short or medium term. Theimplication must be that the rate of growth of consumer spending must abate if investmentis to recover.
An alternative scenario is that a recovery of business investment, which is relatively importintensive, is reflected in a widening current account deficit. This imbalance is itself related
28 manufacturing in the uk
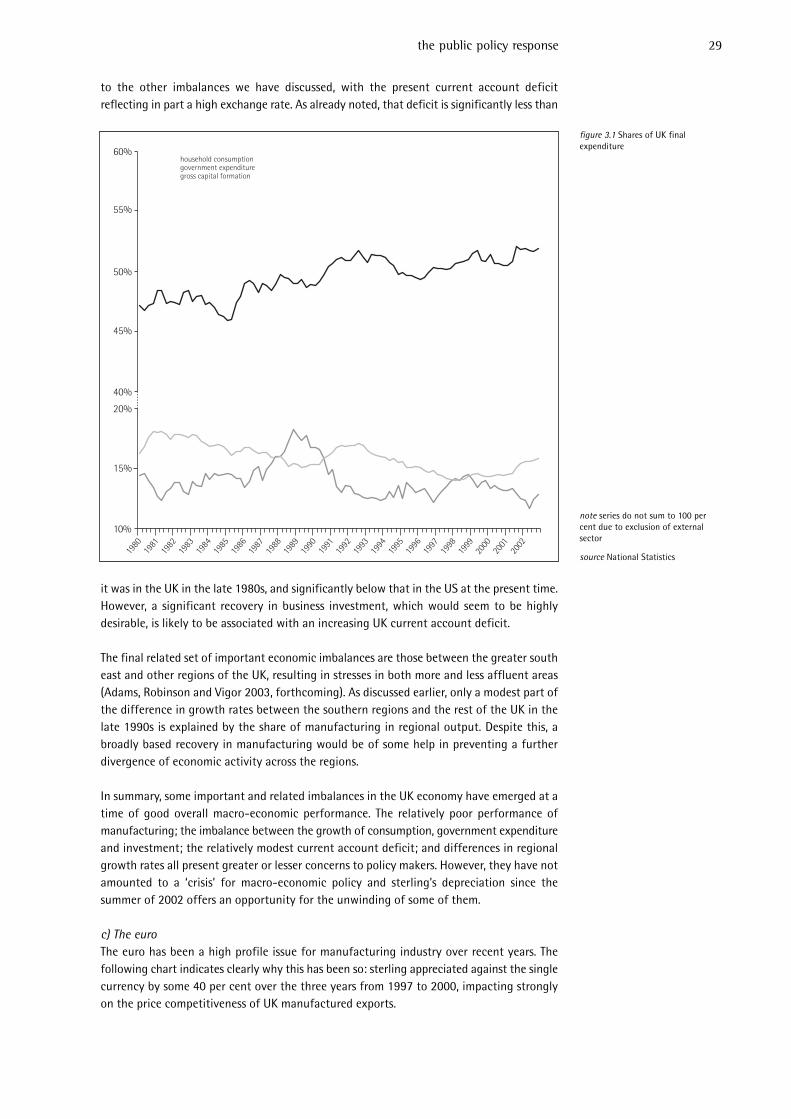
to the other imbalances we have discussed, with the present current account deficitreflecting in part a high exchange rate. As already noted, that deficit is significantly less than
it was in the UK in the late 1980s, and significantly below that in the US at the present time.However, a significant recovery in business investment, which would seem to be highlydesirable, is likely to be associated with an increasing UK current account deficit.
The final related set of important economic imbalances are those between the greater southeast and other regions of the UK, resulting in stresses in both more and less affluent areas(Adams, Robinson and Vigor 2003, forthcoming). As discussed earlier, only a modest part ofthe difference in growth rates between the southern regions and the rest of the UK in thelate 1990s is explained by the share of manufacturing in regional output. Despite this, abroadly based recovery in manufacturing would be of some help in preventing a furtherdivergence of economic activity across the regions.
In summary, some important and related imbalances in the UK economy have emerged at atime of good overall macro-economic performance. The relatively poor performance ofmanufacturing; the imbalance between the growth of consumption, government expenditureand investment; the relatively modest current account deficit; and differences in regionalgrowth rates all present greater or lesser concerns to policy makers. However, they have notamounted to a ‘crisis’ for macro-economic policy and sterling’s depreciation since thesummer of 2002 offers an opportunity for the unwinding of some of them.
c) The euroThe euro has been a high profile issue for manufacturing industry over recent years. Thefollowing chart indicates clearly why this has been so: sterling appreciated against the singlecurrency by some 40 per cent over the three years from 1997 to 2000, impacting stronglyon the price competitiveness of UK manufactured exports.
the public policy response 29
figure 3.1 Shares of UK finalexpenditure
40%
50%
60%household consumptiongovernment expendituregross capital formation
10%
20%
1982
1985
1988
1991
1994
1997
2000
1983
1986
1989
1992
1995
1998
1980
2001
1984
1987
1990
1993
1996
1999
1981
2002
15%
45%
55%
note series do not sum to 100 percent due to exclusion of externalsector
source National Statistics
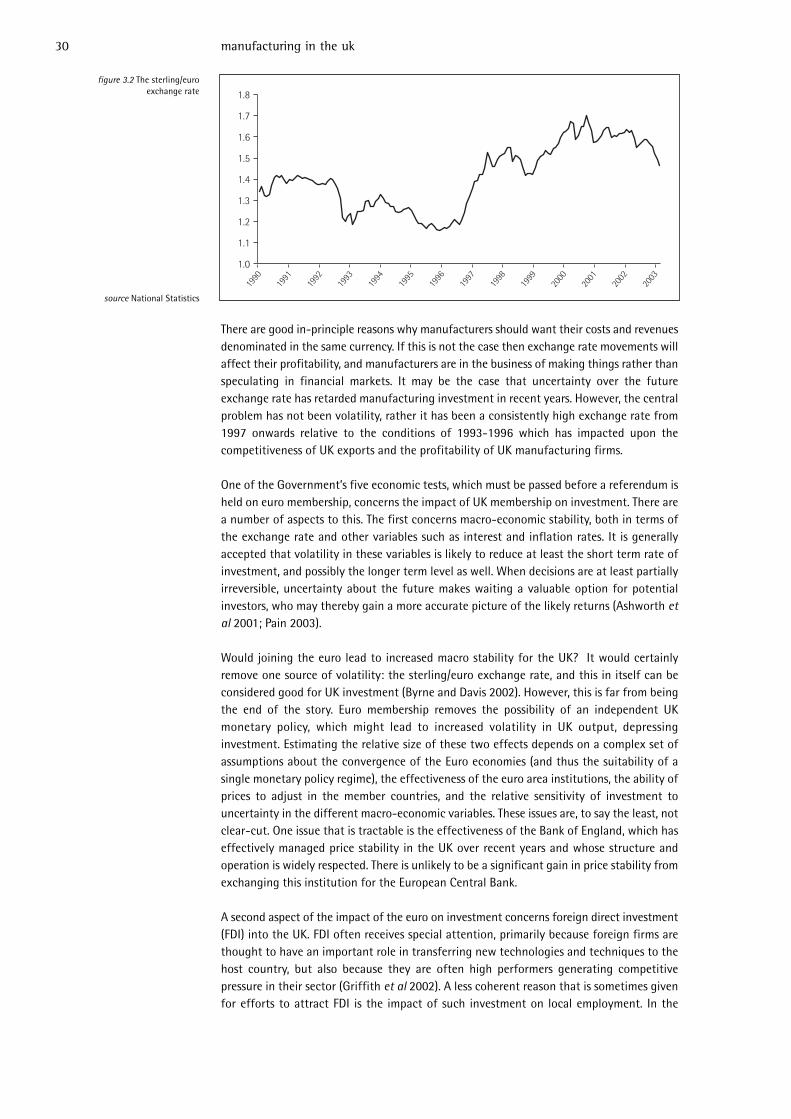
There are good in-principle reasons why manufacturers should want their costs and revenuesdenominated in the same currency. If this is not the case then exchange rate movements willaffect their profitability, and manufacturers are in the business of making things rather thanspeculating in financial markets. It may be the case that uncertainty over the futureexchange rate has retarded manufacturing investment in recent years. However, the centralproblem has not been volatility, rather it has been a consistently high exchange rate from1997 onwards relative to the conditions of 1993-1996 which has impacted upon thecompetitiveness of UK exports and the profitability of UK manufacturing firms.
One of the Government’s five economic tests, which must be passed before a referendum isheld on euro membership, concerns the impact of UK membership on investment. There area number of aspects to this. The first concerns macro-economic stability, both in terms ofthe exchange rate and other variables such as interest and inflation rates. It is generallyaccepted that volatility in these variables is likely to reduce at least the short term rate ofinvestment, and possibly the longer term level as well. When decisions are at least partiallyirreversible, uncertainty about the future makes waiting a valuable option for potentialinvestors, who may thereby gain a more accurate picture of the likely returns (Ashworth etal 2001; Pain 2003).
Would joining the euro lead to increased macro stability for the UK? It would certainlyremove one source of volatility: the sterling/euro exchange rate, and this in itself can beconsidered good for UK investment (Byrne and Davis 2002). However, this is far from beingthe end of the story. Euro membership removes the possibility of an independent UKmonetary policy, which might lead to increased volatility in UK output, depressinginvestment. Estimating the relative size of these two effects depends on a complex set ofassumptions about the convergence of the Euro economies (and thus the suitability of asingle monetary policy regime), the effectiveness of the euro area institutions, the ability ofprices to adjust in the member countries, and the relative sensitivity of investment touncertainty in the different macro-economic variables. These issues are, to say the least, notclear-cut. One issue that is tractable is the effectiveness of the Bank of England, which haseffectively managed price stability in the UK over recent years and whose structure andoperation is widely respected. There is unlikely to be a significant gain in price stability fromexchanging this institution for the European Central Bank.
A second aspect of the impact of the euro on investment concerns foreign direct investment(FDI) into the UK. FDI often receives special attention, primarily because foreign firms arethought to have an important role in transferring new technologies and techniques to thehost country, but also because they are often high performers generating competitivepressure in their sector (Griffith et al 2002). A less coherent reason that is sometimes givenfor efforts to attract FDI is the impact of such investment on local employment. In the
30 manufacturing in the uk
figure 3.2 The sterling/euro exchange rate
1.0
1.1
1.2
1.3
1.4
1.5
1.6
1.7
1.8
1991
1994
1997
2000
1992
1995
1998
2001
1990
1993
1996
1999
2002
2003
source National Statistics
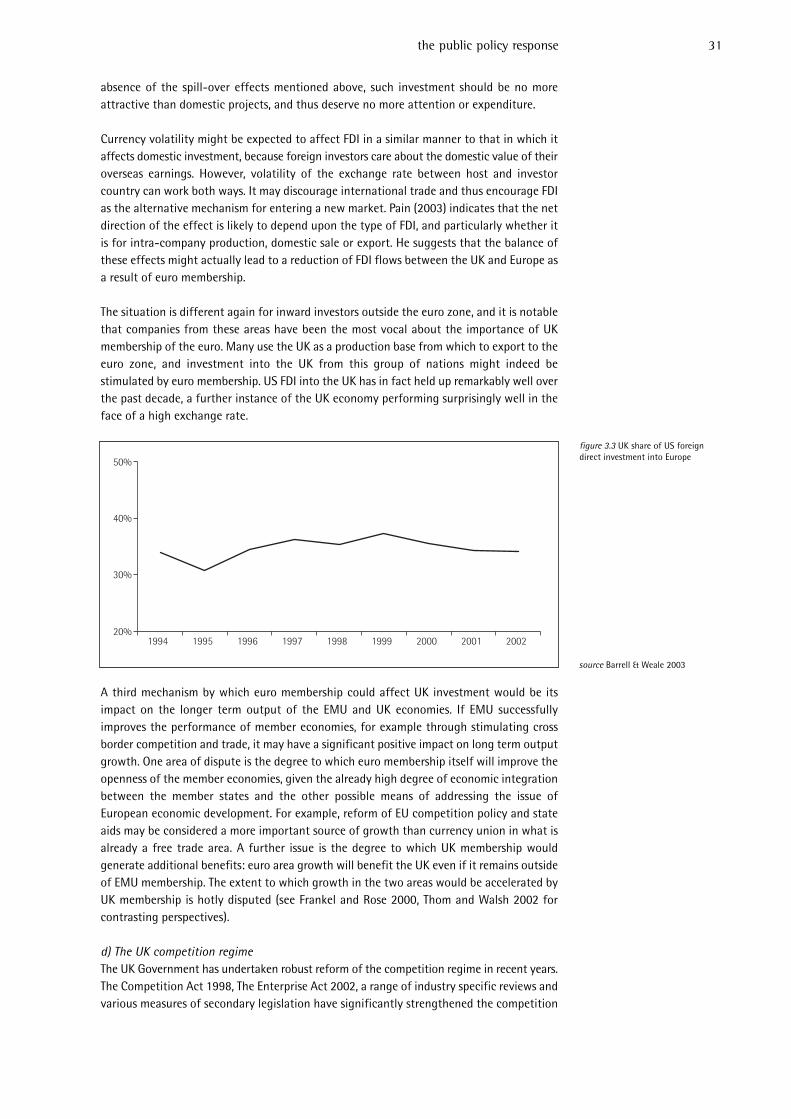
absence of the spill-over effects mentioned above, such investment should be no moreattractive than domestic projects, and thus deserve no more attention or expenditure.
Currency volatility might be expected to affect FDI in a similar manner to that in which itaffects domestic investment, because foreign investors care about the domestic value of theiroverseas earnings. However, volatility of the exchange rate between host and investorcountry can work both ways. It may discourage international trade and thus encourage FDIas the alternative mechanism for entering a new market. Pain (2003) indicates that the netdirection of the effect is likely to depend upon the type of FDI, and particularly whether itis for intra-company production, domestic sale or export. He suggests that the balance ofthese effects might actually lead to a reduction of FDI flows between the UK and Europe asa result of euro membership.
The situation is different again for inward investors outside the euro zone, and it is notablethat companies from these areas have been the most vocal about the importance of UKmembership of the euro. Many use the UK as a production base from which to export to theeuro zone, and investment into the UK from this group of nations might indeed bestimulated by euro membership. US FDI into the UK has in fact held up remarkably well overthe past decade, a further instance of the UK economy performing surprisingly well in theface of a high exchange rate.
A third mechanism by which euro membership could affect UK investment would be itsimpact on the longer term output of the EMU and UK economies. If EMU successfullyimproves the performance of member economies, for example through stimulating crossborder competition and trade, it may have a significant positive impact on long term outputgrowth. One area of dispute is the degree to which euro membership itself will improve theopenness of the member economies, given the already high degree of economic integrationbetween the member states and the other possible means of addressing the issue ofEuropean economic development. For example, reform of EU competition policy and stateaids may be considered a more important source of growth than currency union in what isalready a free trade area. A further issue is the degree to which UK membership wouldgenerate additional benefits: euro area growth will benefit the UK even if it remains outsideof EMU membership. The extent to which growth in the two areas would be accelerated byUK membership is hotly disputed (see Frankel and Rose 2000, Thom and Walsh 2002 forcontrasting perspectives).
d) The UK competition regimeThe UK Government has undertaken robust reform of the competition regime in recent years.The Competition Act 1998, The Enterprise Act 2002, a range of industry specific reviews andvarious measures of secondary legislation have significantly strengthened the competition
the public policy response 31
figure 3.3 UK share of US foreigndirect investment into Europe
20%
30%
40%
50%
1994 1995 1996 1997 1998 1999 2000 2001 2002
source Barrell & Weale 2003

framework. Whilst increased competition makes life more difficult for incumbent firms, thereis evidence that increased measures of competitive pressure lead to improved firmperformance (Nickell 1996). There is even stronger evidence that competition drivesproductivity growth through the process of firm entry, exit and changing market share.Disney et al (2000) found that such processes accounted for 50 per cent of productivitygrowth on a per employee basis in UK manufacturing over the period 1980-1992.
It is important to continue pressing for more openness to trade and competitioninternationally with our European partners. However, the OECD has now stressed for sometime that the UK has one of the strongest product market competition regimes and broadlysensible levels of product and labour market regulation by international standards (OECD2002; Nicoletti 1999). It is therefore difficult to ascribe any shortfall in the UK’s comparativeproductivity performance to relatively low levels of competition or relatively high levels ofregulation, a point we will return to later. This is not to say that further measures to stimulateproduct market competition are not welcome. Those that suggest the agenda of productmarket liberalisation has run its course exaggerate their case (Porter and Ketels 2003).However, it is true that we need to look elsewhere for explanations of the performance ofUK manufacturing.
i) Investment
Capital investment is a crucial determinant of firm productivity, profitability andcompetitiveness. However, it is certainly not the case that investment must always lead tohigher profitability. Indeed, periods of low corporate profitability are frequently associatedwith earlier periods of over-investment following which projects fail to generate anadequate return. Aggregate UK business investment levels are determined by the sum of firmlevel investment decisions, and our discussion of investment will be framed by thisconsideration.
In 1999, levels of capital per hour worked in manufacturing industry were 30 per cent higherin the US and Germany than in the UK, while the corresponding figure for France was 80 percent (O’Mahony & De Boer 2002). As we have seen, these differences in capital stocksaccounted for 21 per cent of the gap between UK and US manufacturing productivity, 29per cent of the gap between the UK and Germany, and fully two thirds of the gap betweenthe UK and France. These gaps are the result of extended historical periods of higher capitalstock growth in these countries compared to the UK. Closing them will be a long-termendeavour.
Explaining the recent pattern of UK manufacturing investmentInvestment by UK manufacturing firms in the 1990s has been relatively low in comparisonto manufacturing investment in some comparable advanced industrial countries, particularlythe US. Figure 3.4, created from the NIESR productivity dataset, indicates rates ofmanufacturing capital accumulation in the US, Germany, France and the UK. It should benoted that the choice of comparator countries is important. For example, the inclusion ofItaly, for which consistent data is unavailable, would probably flatter the UK’s investmentperformance. The sharp downturn in capital accumulation rates in 1999 is worrying, as morerecent UK investment data show further falls in UK manufacturing investment levels in 2000-2002.
A rational decision to invest depends upon the cost of the investment and an assessment ofthe future cash flow generated by that investment, which in turn will depend on the demandfor the goods and services which the investment is designed to deliver. Expectations of futuredemand are thus central to the investment decision: this reinforces the importance of macro-
32 manufacturing in the uk

economic policy relative to specific policy instruments aimed at boosting investment.Current demand and the current rate of demand growth is likely to provide an importantsignal of future demand, and thus we would expect levels of manufacturing investment tobe influenced by the rate of sector output growth, with higher output growth leading tohigher investment levels and periods of output contraction leading to lower investmentlevels. Naturally, this extremely simple formulation is far from explaining the pattern of UKmanufacturing investment in the 1990s, but by placing demand at the centre it tells ussomething important about the relevance of different public policies.
Manufacturing investment indeed fell rapidly during the early 1990s as the sector and thewider economy moved into recession. Manufacturing output returned to growth in 1993, andinvestment slowly began to pick up from a low of nine per cent of sector output in 1993 toan average of 12 per cent for 1996-1998, throughout which period sector output wasgrowing. At this stage the simple pattern breaks down. Sector output was still growingslightly in 1999 and more strongly in 2000, yet manufacturing investment fell sharply in 1999and failed to recover in 2000. From 2001 to the end of 2002 both sector output andinvestment as a proportion of output fell significantly, with investment intensity ending theperiod back at its mid 1993 level. It is worth noting that using current rather than constantprice data tells a slightly different story, with somewhat lower investment levels from 1997but a similar pattern to that described here.
What caused the sharp fall in UK manufacturing investment at the end of the 1990s? Oneclue can be gained from our information on rates of return in the sector (see figure 1.8 p18).The net rate of return on manufacturing assets grew steadily from a trough of 5.3 per centin 1992 to a peak of 13.7 per cent at the beginning of 1998, but then fell sharply to 9.3 percent for 1999, 8.6 per cent for 2000, 5.7 per cent for 2001 and 6.3 per cent for 2002. It
the public policy response 33
note constant prices are used for ratios
source National Statistics
figure 3.4 Per annum growth rates ofmanufacturing sector capital stocks(constant prices)
-2%
-1%
0%
1%
2%
3%
4%
5%
6%
1989 1990 1991 1992 1993 1994 1995 1997 1998 19991996
USGermanyUKFrance
8%
9%
10%
11%
12%
13%
14%
1991
1994
1997
2000
1992
1995
1998
2001
1990
1993
1996
1999
2002
source NIESR productivity data set 2002
figure 3.5 Manufacturing investmentas % manufacturing output
appears that UK manufacturers read the writing on the wall in 1998 and cut back investmentin the face of lower expected future demand and profitability. With the wider UK and globaleconomies growing relatively strongly in 1999 at the time UK manufacturers started toreduce investment levels, the most obvious explanation is our now familiar culprit: thesterling exchange rate. The strong appreciation of sterling from late 1997 would havegenerated a period of abnormally high profits as confirmed export orders generatedunexpectedly high receipts, explaining the spike in sector profitability in late 1997 and early1998. However, the impact of the high rate on export competitiveness would quickly havebeen felt on future orders and is reflected in the decline in sector profitability, with knockon effects for investment.
The corollary of this story is that the recent shift in the sterling exchange rate, if it provesdurable, may be expected to contribute to a similar pattern of effects in reverse. Other thingsbeing equal, manufacturing profitability may fall briefly as sterling export receipts aredepressed, but the improved competitiveness of UK goods should result in increased foreigndemand, higher projected returns to UK manufacturers and a consequent recovery inmanufacturing investment. The National Institute projections in April 2003 for exports ofgoods, manufacturing output and sector investment were consistent with such a scenario.However, much depends upon external factors such as the trade weighted sterling exchangerate either stabilising or falling further from its current level, and external demandstrengthening or at least remaining robust.
The role of uncertaintyThe economic literature attempting to explain investment behaviour is extremely complexand has somewhat limited predictive power (Driver 2002). However, it is worth pausing todiscuss the stream of work which highlights the role of uncertainty in investment decisions(for example, Dixit & Pindyck 1994). Most capital investment is at least partially irreversible:plant cannot usually be sold at its purchase price if it turns out to be unneeded. Thus in thepresence of uncertainty there is a value to firms in waiting to gain more information aboutthe factors that will affect project returns. The key result is that uncertainty means firms willnot invest when the net present value of an investment just marginally exceeds its cost: theoption value of waiting means that the returns must be greater than the costs by someextent. Whilst this process should retard the accumulation of capital, the same effect inreverse should also retard its disposal: uncertainty about a projected fall in demand shouldretard the process of selling unneeded capital.
If the two effects are symmetrical then uncertainty would affect only the short term rateof change in the capital stock rather than its long term level. However, there is nocompelling theoretical reason for the two effects to be symmetrical: uncertainty may havemore effect on capital accumulation than on disposal. The empirical evidence is somewhatmixed, but the general conclusion is that whole economy long run investment levels arenegatively correlated with various measures of uncertainty. A similar conclusion holds, withmore mixed empirical support, for the manufacturing sector specifically (Carruth et al 1998).
These results suggest that the Government’s aims of achieving stable output, inflation andinterest rates, all of which are correlated with uncertainty, should have positive effects oninvestment levels. Other key variables contributing to uncertainty are outside the control ofthe government, specifically foreign demand, with the exchange rate remaining a difficultcase. Another lesson of the literature on investment and uncertainty is that in the presenceof significant uncertainty, pro-investment government policies such as changes in thecorporate tax regime may not immediately lead to changes in investment levels if firmscontinue to use their option to ‘wait and see’. In addition, frequent changes to such policiesmight make things worse by generating additional uncertainty.
34 manufacturing in the uk
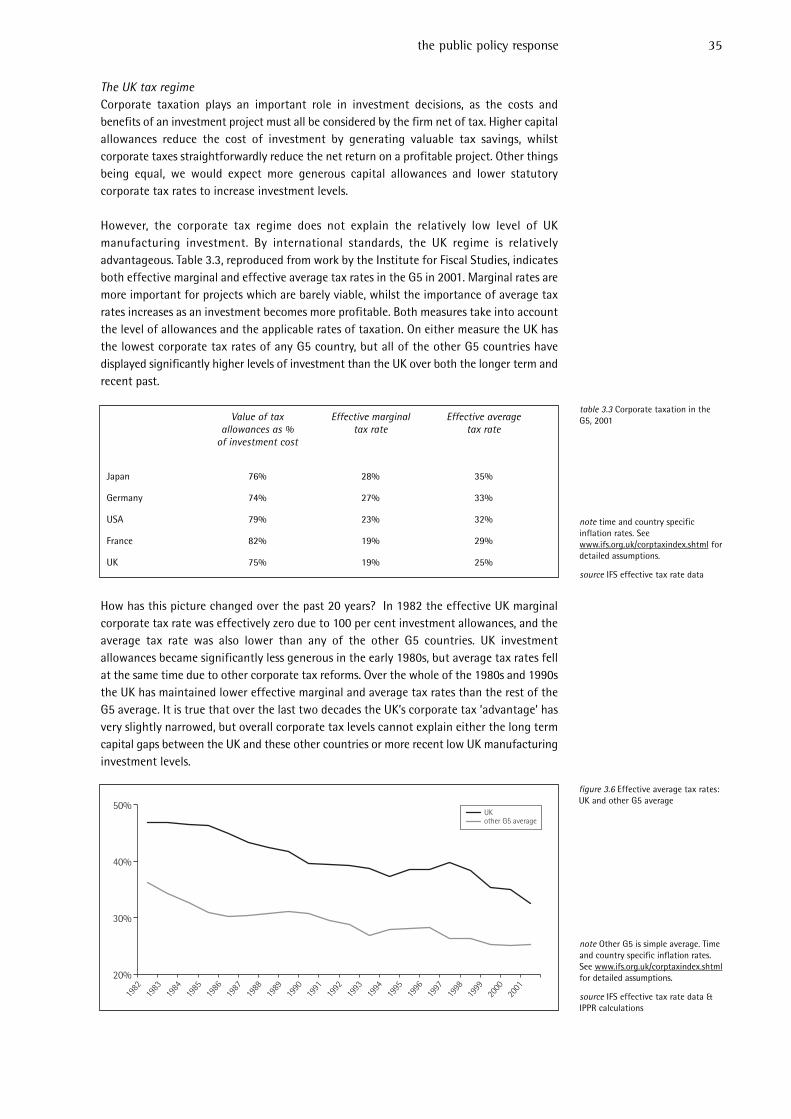
The UK tax regimeCorporate taxation plays an important role in investment decisions, as the costs andbenefits of an investment project must all be considered by the firm net of tax. Higher capitalallowances reduce the cost of investment by generating valuable tax savings, whilstcorporate taxes straightforwardly reduce the net return on a profitable project. Other thingsbeing equal, we would expect more generous capital allowances and lower statutorycorporate tax rates to increase investment levels.
However, the corporate tax regime does not explain the relatively low level of UKmanufacturing investment. By international standards, the UK regime is relativelyadvantageous. Table 3.3, reproduced from work by the Institute for Fiscal Studies, indicatesboth effective marginal and effective average tax rates in the G5 in 2001. Marginal rates aremore important for projects which are barely viable, whilst the importance of average taxrates increases as an investment becomes more profitable. Both measures take into accountthe level of allowances and the applicable rates of taxation. On either measure the UK hasthe lowest corporate tax rates of any G5 country, but all of the other G5 countries havedisplayed significantly higher levels of investment than the UK over both the longer term andrecent past.
How has this picture changed over the past 20 years? In 1982 the effective UK marginalcorporate tax rate was effectively zero due to 100 per cent investment allowances, and theaverage tax rate was also lower than any of the other G5 countries. UK investmentallowances became significantly less generous in the early 1980s, but average tax rates fellat the same time due to other corporate tax reforms. Over the whole of the 1980s and 1990sthe UK has maintained lower effective marginal and average tax rates than the rest of theG5 average. It is true that over the last two decades the UK’s corporate tax ‘advantage’ hasvery slightly narrowed, but overall corporate tax levels cannot explain either the long termcapital gaps between the UK and these other countries or more recent low UK manufacturinginvestment levels.
the public policy response 35
note Other G5 is simple average. Timeand country specific inflation rates.See www.ifs.org.uk/corptaxindex.shtmlfor detailed assumptions.
source IFS effective tax rate data &IPPR calculations
table 3.3 Corporate taxation in theG5, 2001Value of tax Effective marginal Effective average
allowances as % tax rate tax rate of investment cost
Japan 76% 28% 35%
Germany 74% 27% 33%
USA 79% 23% 32%
France 82% 19% 29%
UK 75% 19% 25%
20%
30%
40%
50%
1982
1985
1988
1991
1994
1997
2000
1983
1986
1989
1992
1995
1998
2001
1984
1987
1990
1993
1996
1999
UKother G5 average
note time and country specificinflation rates. Seewww.ifs.org.uk/corptaxindex.shtml fordetailed assumptions.
source IFS effective tax rate data
figure 3.6 Effective average tax rates:UK and other G5 average

It is also true that the value of UK investment allowances is lower than in some othercomparable countries. However, the present discounted value of UK allowances is now onlyvery slightly less than the average for the other G5 countries. Because of lower statutory taxrates, effective marginal rates in the UK remain the lowest in the G5. Given these two factors,it is hard to ascribe low levels of UK investment to ungenerous investment allowances.
Should the UK Government change the UK tax regime further, or would disruption to theexisting regime be more harmful than any likely benefit? Every one of the G5 countries, andmany other OECD states, reduced statutory corporate tax rates between 1982 and 2001. Atthe same time most have reduced the value of investment allowances. The result of thesetrends has been that effective marginal tax rates in these countries have tended to remainrelatively stable over the 1980s and 1990s, falling somewhat at the end of the period. At thesame time effective average tax rates have fallen consistently, and the impact on governmentrevenues has been to hold corporate tax receipts as a proportion of GDP relatively stable. Theresult of this is to shift the burden of corporate taxation, reducing the value to firms of thetax allowances from marginal projects and increasing the value of the cash flow fromprofitable ones (Devereux et al 2002). One interpretation of this is that countries arecompeting for profitable internationally mobile investment. Another is that they areseeking to shift the incentives for firms towards investments which are more profitable beforetax but were previously equally attractive due to the corporate tax structure.
The case for further significant changes to the UK corporate tax regime seems weak. Thecurrent UK arrangements are relatively advantageous and do not help explain the UK’srelatively poor manufacturing investment performance. Firms dislike uncertainty and thereis a strong argument for a period of micro-economic policy stability to accompany the hardwon macro-economic stability that the UK economy may now be enjoying. This suggestscaution both in relation to arguments for more generous capital allowances and theGovernment’s own suggestions set out in August 2002 for further reforms of the corporationtax system (HMT 2002c; Bond et al 2003). Moreover, given the Government’s ambitiousspending plans for the public services and the relatively difficult fiscal position facing theUK in the medium term from 2003, it will be very difficult to cut corporate taxes withoutraising taxes elsewhere, with the attendant uncertainty that would bring. At the same time,it will be important to keep corporate tax levels under close review and to avoid weakeningthe incentives for firms to invest, particularly in a tightening fiscal environment where theGovernment may soon be seeking means of increasing overall tax revenues.
Specific investment support initiativesOne area where there has been little stability in the UK is in the provision of specificgovernment support initiatives for business investment. The longest standing policy tool inthis area is Regional Selective Assistance, which subsidises investment in economically
36 manufacturing in the uk
figure 3.7 Present discounted value ofinvestment allowances: UK and other
G5 average
60%
70%
80%
90%
100%
1982
1985
1988
1991
1994
1997
2000
1983
1986
1989
1992
1995
1998
2001
1984
1987
1990
1993
1996
1999
UKother G5 average
note Other G5 is simple average. Timeand country specific inflation rates.
See www.ifs.org.uk/corptaxindex.shtmlfor detailed assumptions.
source IFS effective tax rate data &IPPR calculations

deprived areas. This scheme formally has three aims: to create or safeguard jobs; to attractor retain internationally mobile investment; and to improve the competitiveness of firms indisadvantaged areas. The objectives of regional policy and the role of RSA are addressed indetail in Adams, Robinson and Vigor (2003, forthcoming). Our point here is to note thatcompared to other investment support schemes RSA has been subject to relatively extensivescrutiny. Harvey Armstrong described this situation at an IPPR seminar as one of ‘asymmetricevaluation’.
Many government schemes aimed at businesses are more appropriately discussed in thecontext of support for innovation or enterprise. A common characteristic, however, is the lackof robust evaluation of these schemes, with the quality of the analysis critically compromisedby the extensive use of interview survey data rather the econometric analysis of performancedata. We are not saying that these schemes are a bad thing: the point is that in many caseswe do not know whether they are a good thing. Rigorous evaluation across the field ofbusiness support schemes could imply a very different pattern of expenditure, and the failureof schemes to demonstrate benefits should result in their closure. We welcome the DTI reviewof business support, due to reach its conclusions in the latter half of 2003, but it will haveto take a much more robust approach to the issue of evaluation than the Department hasin the past.
This discussion also allows us to pass some comment on the argument that UK manufacturingis held back by lower spending on state aids in the UK than in other EU countries. Whilst itis true that the UK spends less on such programmes, it is not clear that these othercountries evaluate their business support schemes any more effectively than we do here inthe UK. It is entirely unclear, therefore, that such expenditure has any beneficial effect whichmight help account for the more successful manufacturing sector performance of some ofthese countries. In the absence of robust research on the impact of other countries’schemes, the argument that we should spend more because they spend more is very weak.
Do manufacturing firms suffer from finance gaps?A frequently considered explanation of low UK investment levels is the possibility offinance gaps which prevent firms undertaking projects which would otherwise yield positivereturns. Firms can finance projects from internal cash flow or from external sources such asbank debt and public equity, but UK firms seem especially reliant on internal cash flow tofinance investment, a factor that would make firm profitability an even more importantvariable. Where firms do not have access to sufficient internal cash flow, imperfections inthe financial markets might retard investment through raising the cost of capital, thusreducing the number of viable projects.
The structure of such capital market imperfections is relatively well understood. Borrowersare likely to be better informed about the risks and returns of possible investment projectsthan lenders. This generates an adverse selection problem: lenders will charge a risk premiumwhich will incentivise firms with less risky projects to finance them through internal cashflow, thus increasing the average risk of projects seeking external finance. There is also amoral hazard problem: lenders are generally unable to perfectly monitor the behaviour ofborrowers, and are unlikely to be able to write and enforce contracts governing suchbehaviour. These considerations are likely to generate significant risk premia for borrowers.Similar information problems apply in the case of equity finance, and in addition equitypurchasers can reasonably expect firms to issue new shares when they are overvalued, andwill attempt to charge a compensating premium as a result.
There are a number of reasons why finance problems are more likely to affect smaller ratherthan larger firms. The first is the relative availability of cash flow: small and especially start-up firms are likely to require external finance to a much greater extent relative to their size
the public policy response 37
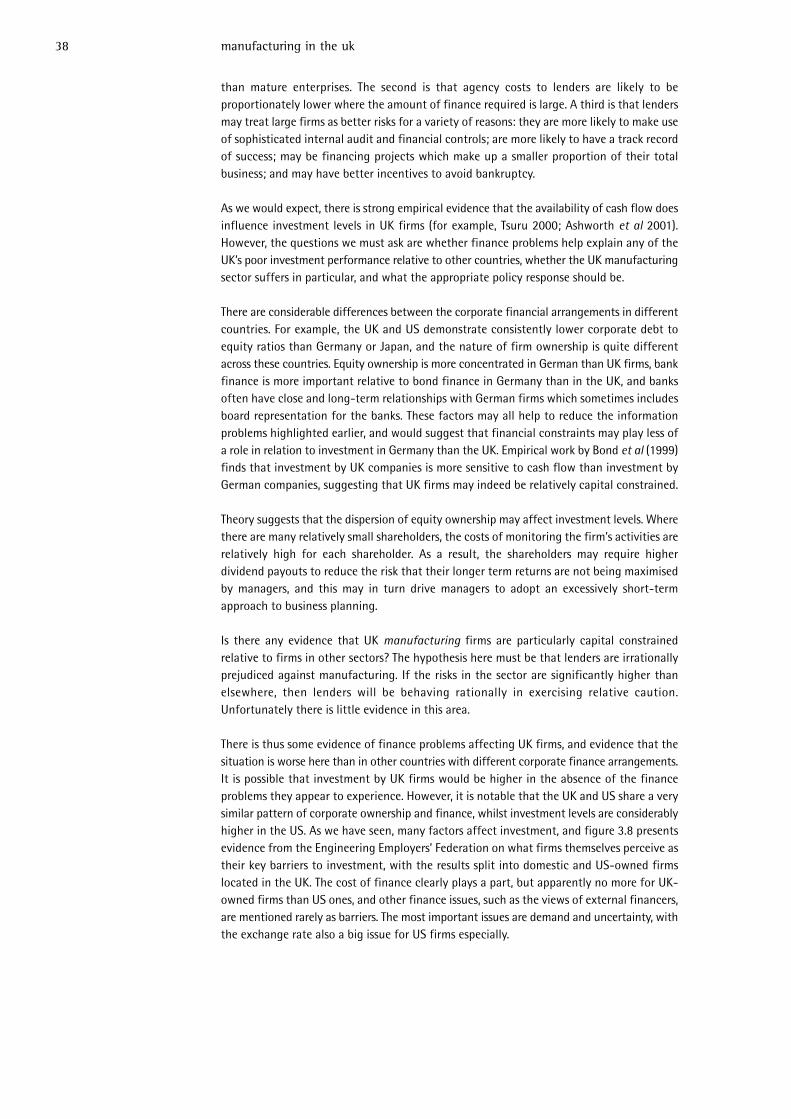
than mature enterprises. The second is that agency costs to lenders are likely to beproportionately lower where the amount of finance required is large. A third is that lendersmay treat large firms as better risks for a variety of reasons: they are more likely to make useof sophisticated internal audit and financial controls; are more likely to have a track recordof success; may be financing projects which make up a smaller proportion of their totalbusiness; and may have better incentives to avoid bankruptcy.
As we would expect, there is strong empirical evidence that the availability of cash flow doesinfluence investment levels in UK firms (for example, Tsuru 2000; Ashworth et al 2001).However, the questions we must ask are whether finance problems help explain any of theUK’s poor investment performance relative to other countries, whether the UK manufacturingsector suffers in particular, and what the appropriate policy response should be.
There are considerable differences between the corporate financial arrangements in differentcountries. For example, the UK and US demonstrate consistently lower corporate debt toequity ratios than Germany or Japan, and the nature of firm ownership is quite differentacross these countries. Equity ownership is more concentrated in German than UK firms, bankfinance is more important relative to bond finance in Germany than in the UK, and banksoften have close and long-term relationships with German firms which sometimes includesboard representation for the banks. These factors may all help to reduce the informationproblems highlighted earlier, and would suggest that financial constraints may play less ofa role in relation to investment in Germany than the UK. Empirical work by Bond et al (1999)finds that investment by UK companies is more sensitive to cash flow than investment byGerman companies, suggesting that UK firms may indeed be relatively capital constrained.
Theory suggests that the dispersion of equity ownership may affect investment levels. Wherethere are many relatively small shareholders, the costs of monitoring the firm’s activities arerelatively high for each shareholder. As a result, the shareholders may require higherdividend payouts to reduce the risk that their longer term returns are not being maximisedby managers, and this may in turn drive managers to adopt an excessively short-termapproach to business planning.
Is there any evidence that UK manufacturing firms are particularly capital constrainedrelative to firms in other sectors? The hypothesis here must be that lenders are irrationallyprejudiced against manufacturing. If the risks in the sector are significantly higher thanelsewhere, then lenders will be behaving rationally in exercising relative caution.Unfortunately there is little evidence in this area.
There is thus some evidence of finance problems affecting UK firms, and evidence that thesituation is worse here than in other countries with different corporate finance arrangements.It is possible that investment by UK firms would be higher in the absence of the financeproblems they appear to experience. However, it is notable that the UK and US share a verysimilar pattern of corporate ownership and finance, whilst investment levels are considerablyhigher in the US. As we have seen, many factors affect investment, and figure 3.8 presentsevidence from the Engineering Employers’ Federation on what firms themselves perceive astheir key barriers to investment, with the results split into domestic and US-owned firmslocated in the UK. The cost of finance clearly plays a part, but apparently no more for UK-owned firms than US ones, and other finance issues, such as the views of external financers,are mentioned rarely as barriers. The most important issues are demand and uncertainty, withthe exchange rate also a big issue for US firms especially.
38 manufacturing in the uk
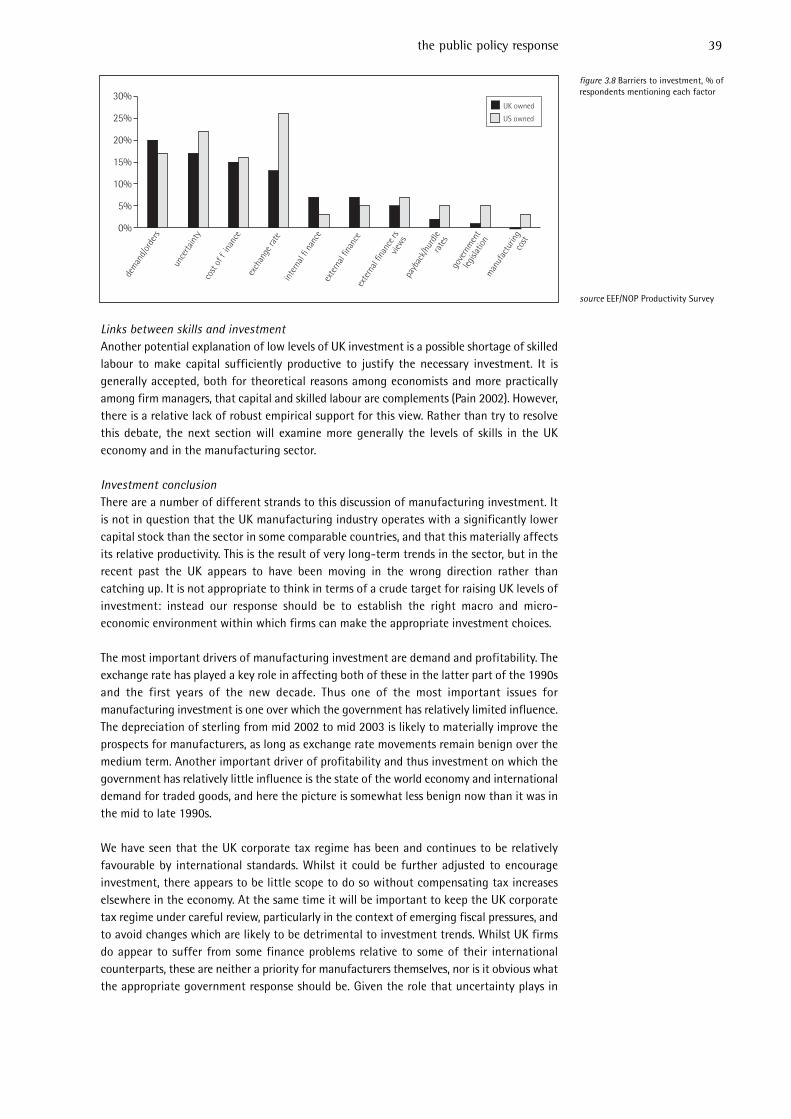
Links between skills and investmentAnother potential explanation of low levels of UK investment is a possible shortage of skilledlabour to make capital sufficiently productive to justify the necessary investment. It isgenerally accepted, both for theoretical reasons among economists and more practicallyamong firm managers, that capital and skilled labour are complements (Pain 2002). However,there is a relative lack of robust empirical support for this view. Rather than try to resolvethis debate, the next section will examine more generally the levels of skills in the UKeconomy and in the manufacturing sector.
Investment conclusionThere are a number of different strands to this discussion of manufacturing investment. Itis not in question that the UK manufacturing industry operates with a significantly lowercapital stock than the sector in some comparable countries, and that this materially affectsits relative productivity. This is the result of very long-term trends in the sector, but in therecent past the UK appears to have been moving in the wrong direction rather thancatching up. It is not appropriate to think in terms of a crude target for raising UK levels ofinvestment: instead our response should be to establish the right macro and micro-economic environment within which firms can make the appropriate investment choices.
The most important drivers of manufacturing investment are demand and profitability. Theexchange rate has played a key role in affecting both of these in the latter part of the 1990sand the first years of the new decade. Thus one of the most important issues formanufacturing investment is one over which the government has relatively limited influence.The depreciation of sterling from mid 2002 to mid 2003 is likely to materially improve theprospects for manufacturers, as long as exchange rate movements remain benign over themedium term. Another important driver of profitability and thus investment on which thegovernment has relatively little influence is the state of the world economy and internationaldemand for traded goods, and here the picture is somewhat less benign now than it was inthe mid to late 1990s.
We have seen that the UK corporate tax regime has been and continues to be relativelyfavourable by international standards. Whilst it could be further adjusted to encourageinvestment, there appears to be little scope to do so without compensating tax increaseselsewhere in the economy. At the same time it will be important to keep the UK corporatetax regime under careful review, particularly in the context of emerging fiscal pressures, andto avoid changes which are likely to be detrimental to investment trends. Whilst UK firmsdo appear to suffer from some finance problems relative to some of their internationalcounterparts, these are neither a priority for manufacturers themselves, nor is it obvious whatthe appropriate government response should be. Given the role that uncertainty plays in
the public policy response 39
figure 3.8 Barriers to investment, % ofrespondents mentioning each factor
0%
5%
10%
15%
20%
25%
30%
dem
and/
orde
rs
cost
of f
inan
ce
exch
ange
rate
inte
rnal
fina
nce
exte
rnal
finan
ceex
tern
al fin
ance
rsvie
wspa
ybac
k/hur
dle
rate
sgo
vern
men
tleg
islat
ion
man
ufac
turin
gco
st
unce
rtain
ty
UK owned
US owned
source EEF/NOP Productivity Survey

retarding investment, the government should strive to match its commitment to macro-economic stability with a period of micro-economic policy stability.
An area which does require revisiting is the provision of specific investment supportinitiatives, where existing evaluation work is often extremely weak. In the absence of robustevaluation we do not know whether to shift the balance of spending between schemes, orwhether to increase or decrease total spending. As we have said, we welcome the DTI reviewof business support, but to be effective it must require that evaluation is capable of standingup to independent academic scrutiny, and that the failure of schemes to demonstrateappropriate benefits should result in their closure.
Skills
Managerial and workforce skills are a crucial input into the production process. Specificaspects of managerial skills will be considered in more depth in the later sections of thisdocument which focus on enterprise and innovation. This section will discuss workforce skillsmore generally, and looks at the direct impact skills may have on productivity. However, giventhe importance of certain skills in relation to enterprise and innovation, there also is likelyto be an indirect impact in terms of the influence of these drivers on total factor productivitythrough levels of innovation and enterprise.
Qualification levels and their contribution to productivityIt is common practice to use workforce qualifications as a proxy for workforce skills. As aresult of data limitations, it is also common practice to divide qualifications into threecategories for the purposes of international comparison, although further research willhopefully allow for a finer categorisation. Higher level qualifications are degree level orequivalent, the ‘intermediate’ category covers a wide range of academic and vocationalqualifications, and the lower category includes those with basic schooling only and thosewith no qualifications at all. Figure 3.9 indicates the proportions of the workforce in the US,France, Germany and the UK with different qualification levels in 1999.
It is well known that a much lower proportion of UK employees have ‘intermediate’qualifications compared to France and especially Germany. The US has a similar proportionof low qualification workers and an even smaller intermediate segment compared to the UK.Levels of higher qualification are similar across the UK, France and Germany, but significantlyhigher in the US.
‘Intermediate’ qualifications, which may be held by many people performing skilled craft andtechnical jobs, could be of particular importance to manufacturing businesses. However, the
40 manufacturing in the uk
source O’Mahony & de Boer (2002)
0
20
40
60
80
100low
intermediate
higher
US UK France Germany
figure 3.9 Qualification levels (% ofemployees)
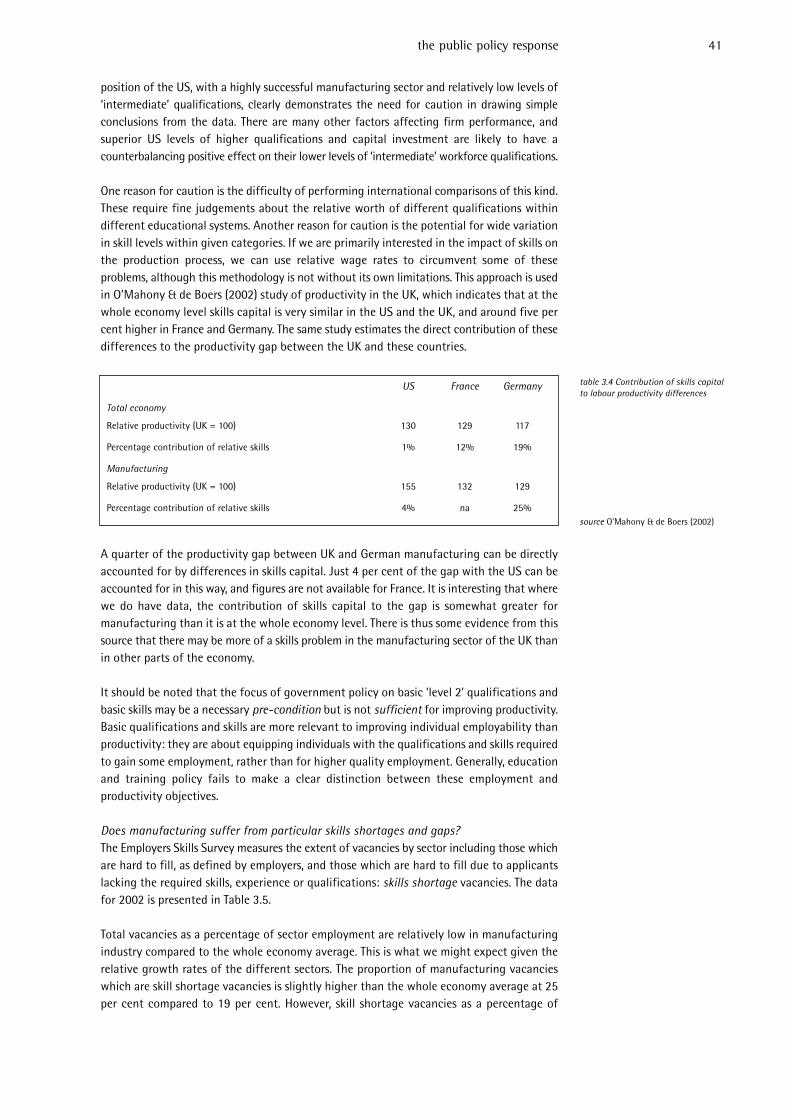
position of the US, with a highly successful manufacturing sector and relatively low levels of‘intermediate’ qualifications, clearly demonstrates the need for caution in drawing simpleconclusions from the data. There are many other factors affecting firm performance, andsuperior US levels of higher qualifications and capital investment are likely to have acounterbalancing positive effect on their lower levels of ‘intermediate’ workforce qualifications.
One reason for caution is the difficulty of performing international comparisons of this kind.These require fine judgements about the relative worth of different qualifications withindifferent educational systems. Another reason for caution is the potential for wide variationin skill levels within given categories. If we are primarily interested in the impact of skills onthe production process, we can use relative wage rates to circumvent some of theseproblems, although this methodology is not without its own limitations. This approach is usedin O’Mahony & de Boers (2002) study of productivity in the UK, which indicates that at thewhole economy level skills capital is very similar in the US and the UK, and around five percent higher in France and Germany. The same study estimates the direct contribution of thesedifferences to the productivity gap between the UK and these countries.
A quarter of the productivity gap between UK and German manufacturing can be directlyaccounted for by differences in skills capital. Just 4 per cent of the gap with the US can beaccounted for in this way, and figures are not available for France. It is interesting that wherewe do have data, the contribution of skills capital to the gap is somewhat greater formanufacturing than it is at the whole economy level. There is thus some evidence from thissource that there may be more of a skills problem in the manufacturing sector of the UK thanin other parts of the economy.
It should be noted that the focus of government policy on basic ‘level 2’ qualifications andbasic skills may be a necessary pre-condition but is not sufficient for improving productivity.Basic qualifications and skills are more relevant to improving individual employability thanproductivity: they are about equipping individuals with the qualifications and skills requiredto gain some employment, rather than for higher quality employment. Generally, educationand training policy fails to make a clear distinction between these employment andproductivity objectives.
Does manufacturing suffer from particular skills shortages and gaps?The Employers Skills Survey measures the extent of vacancies by sector including those whichare hard to fill, as defined by employers, and those which are hard to fill due to applicantslacking the required skills, experience or qualifications: skills shortage vacancies. The datafor 2002 is presented in Table 3.5.
Total vacancies as a percentage of sector employment are relatively low in manufacturingindustry compared to the whole economy average. This is what we might expect given therelative growth rates of the different sectors. The proportion of manufacturing vacancieswhich are skill shortage vacancies is slightly higher than the whole economy average at 25per cent compared to 19 per cent. However, skill shortage vacancies as a percentage of
the public policy response 41
table 3.4 Contribution of skills capitalto labour productivity differences
US France Germany
Total economy
Relative productivity (UK = 100) 130 129 117
Percentage contribution of relative skills 1% 12% 19%
Manufacturing
Relative productivity (UK = 100) 155 132 129
Percentage contribution of relative skills 4% na 25%source O’Mahony & de Boers (2002)
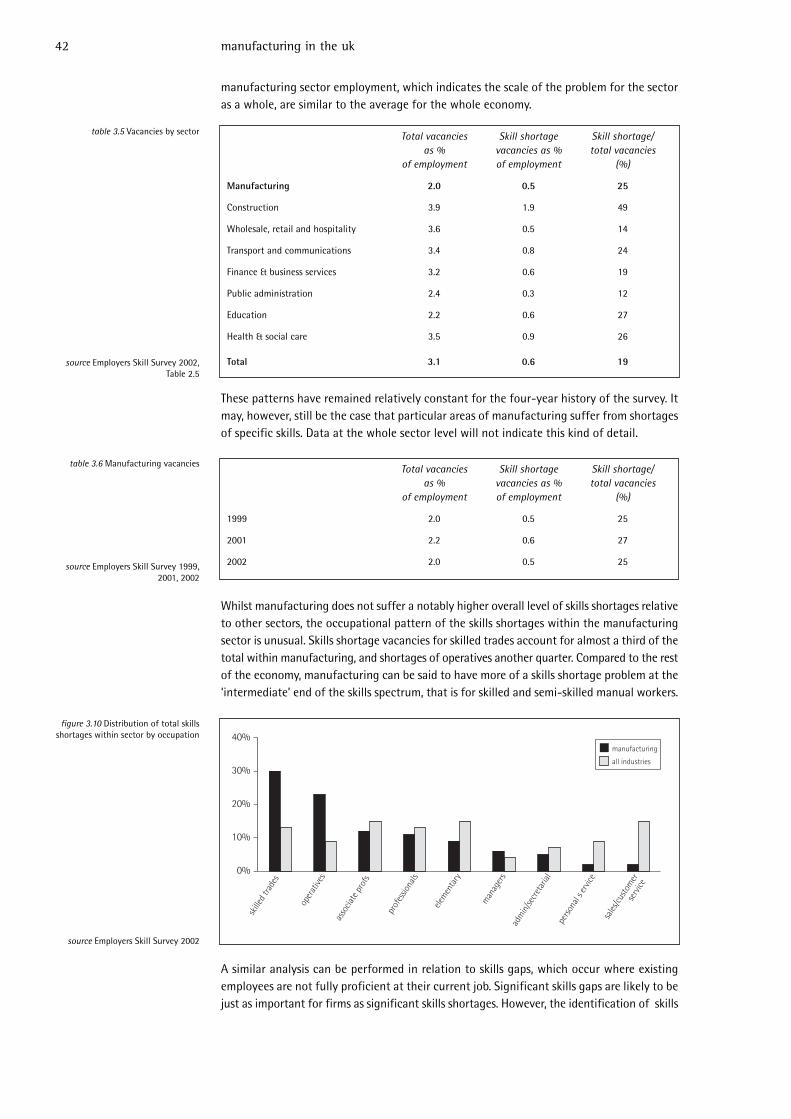
figure 3.10 Distribution of total skillsshortages within sector by occupation
manufacturing sector employment, which indicates the scale of the problem for the sectoras a whole, are similar to the average for the whole economy.
These patterns have remained relatively constant for the four-year history of the survey. Itmay, however, still be the case that particular areas of manufacturing suffer from shortagesof specific skills. Data at the whole sector level will not indicate this kind of detail.
Whilst manufacturing does not suffer a notably higher overall level of skills shortages relativeto other sectors, the occupational pattern of the skills shortages within the manufacturingsector is unusual. Skills shortage vacancies for skilled trades account for almost a third of thetotal within manufacturing, and shortages of operatives another quarter. Compared to the restof the economy, manufacturing can be said to have more of a skills shortage problem at the‘intermediate’ end of the skills spectrum, that is for skilled and semi-skilled manual workers.
A similar analysis can be performed in relation to skills gaps, which occur where existingemployees are not fully proficient at their current job. Significant skills gaps are likely to bejust as important for firms as significant skills shortages. However, the identification of skills
42 manufacturing in the uk
source Employers Skill Survey 1999,2001, 2002
table 3.5 Vacancies by sector Total vacancies Skill shortage Skill shortage/as % vacancies as % total vacancies
of employment of employment (%)
Manufacturing 2.0 0.5 25
Construction 3.9 1.9 49
Wholesale, retail and hospitality 3.6 0.5 14
Transport and communications 3.4 0.8 24
Finance & business services 3.2 0.6 19
Public administration 2.4 0.3 12
Education 2.2 0.6 27
Health & social care 3.5 0.9 26
Total 3.1 0.6 19
Total vacancies Skill shortage Skill shortage/as % vacancies as % total vacancies
of employment of employment (%)
1999 2.0 0.5 25
2001 2.2 0.6 27
2002 2.0 0.5 25
0%
10%
20%
30%
40%manufacturing
all industries
skille
d tra
des
asso
ciate
pro
fs
prof
essio
nals
perso
nal s
ervic
e
sales
/custo
mer
serv
ice
oper
ative
s
man
ager
sad
min
/secr
etar
ial
elem
enta
ry
source Employers Skill Survey 2002,Table 2.5
table 3.6 Manufacturing vacancies
source Employers Skill Survey 2002
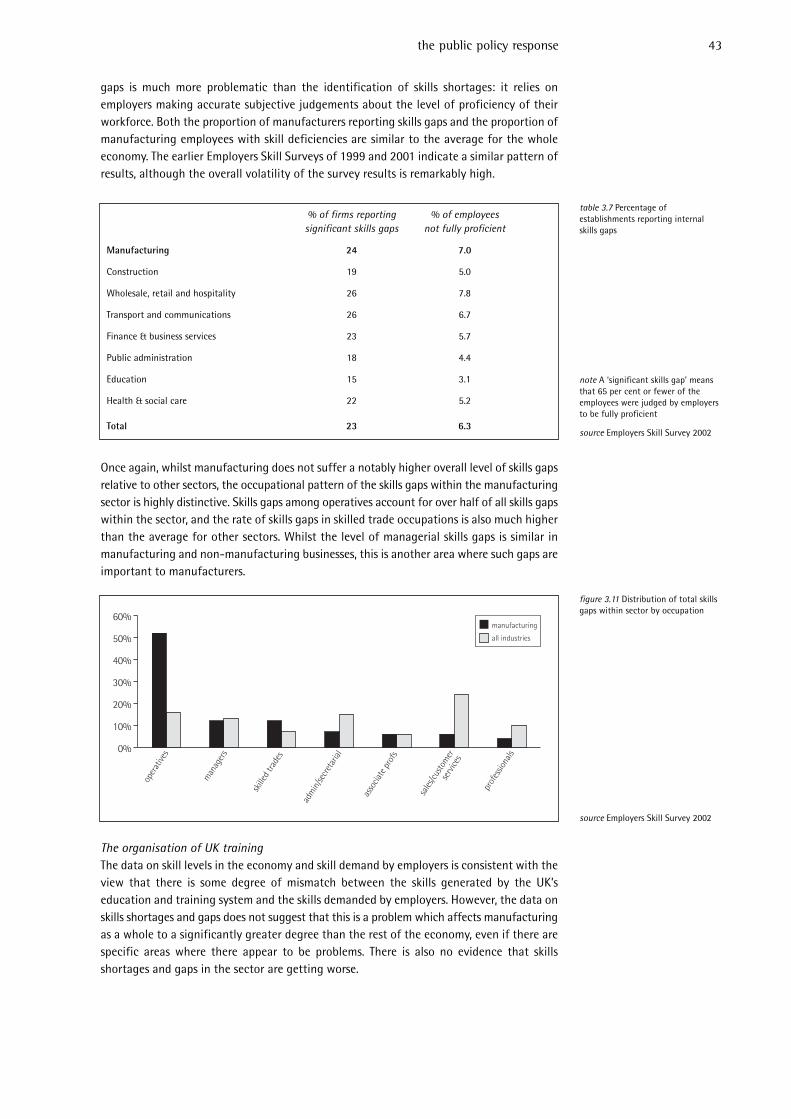
gaps is much more problematic than the identification of skills shortages: it relies onemployers making accurate subjective judgements about the level of proficiency of theirworkforce. Both the proportion of manufacturers reporting skills gaps and the proportion ofmanufacturing employees with skill deficiencies are similar to the average for the wholeeconomy. The earlier Employers Skill Surveys of 1999 and 2001 indicate a similar pattern ofresults, although the overall volatility of the survey results is remarkably high.
Once again, whilst manufacturing does not suffer a notably higher overall level of skills gapsrelative to other sectors, the occupational pattern of the skills gaps within the manufacturingsector is highly distinctive. Skills gaps among operatives account for over half of all skills gapswithin the sector, and the rate of skills gaps in skilled trade occupations is also much higherthan the average for other sectors. Whilst the level of managerial skills gaps is similar inmanufacturing and non-manufacturing businesses, this is another area where such gaps areimportant to manufacturers.
The organisation of UK trainingThe data on skill levels in the economy and skill demand by employers is consistent with theview that there is some degree of mismatch between the skills generated by the UK’seducation and training system and the skills demanded by employers. However, the data onskills shortages and gaps does not suggest that this is a problem which affects manufacturingas a whole to a significantly greater degree than the rest of the economy, even if there arespecific areas where there appear to be problems. There is also no evidence that skillsshortages and gaps in the sector are getting worse.
the public policy response 43
note A ‘significant skills gap’ meansthat 65 per cent or fewer of theemployees were judged by employersto be fully proficient
source Employers Skill Survey 2002
% of firms reporting % of employees significant skills gaps not fully proficient
Manufacturing 24 7.0
Construction 19 5.0
Wholesale, retail and hospitality 26 7.8
Transport and communications 26 6.7
Finance & business services 23 5.7
Public administration 18 4.4
Education 15 3.1
Health & social care 22 5.2
Total 23 6.3
figure 3.11 Distribution of total skillsgaps within sector by occupation
0%
10%
20%
30%
40%
50%
60%manufacturing
all industries
oper
ative
s
skille
d tra
des
adm
in/se
cret
arial
prof
essio
nals
man
ager
s
sales
/custo
mer
serv
ices
asso
ciate
pro
fs
table 3.7 Percentage ofestablishments reporting internalskills gaps
source Employers Skill Survey 2002
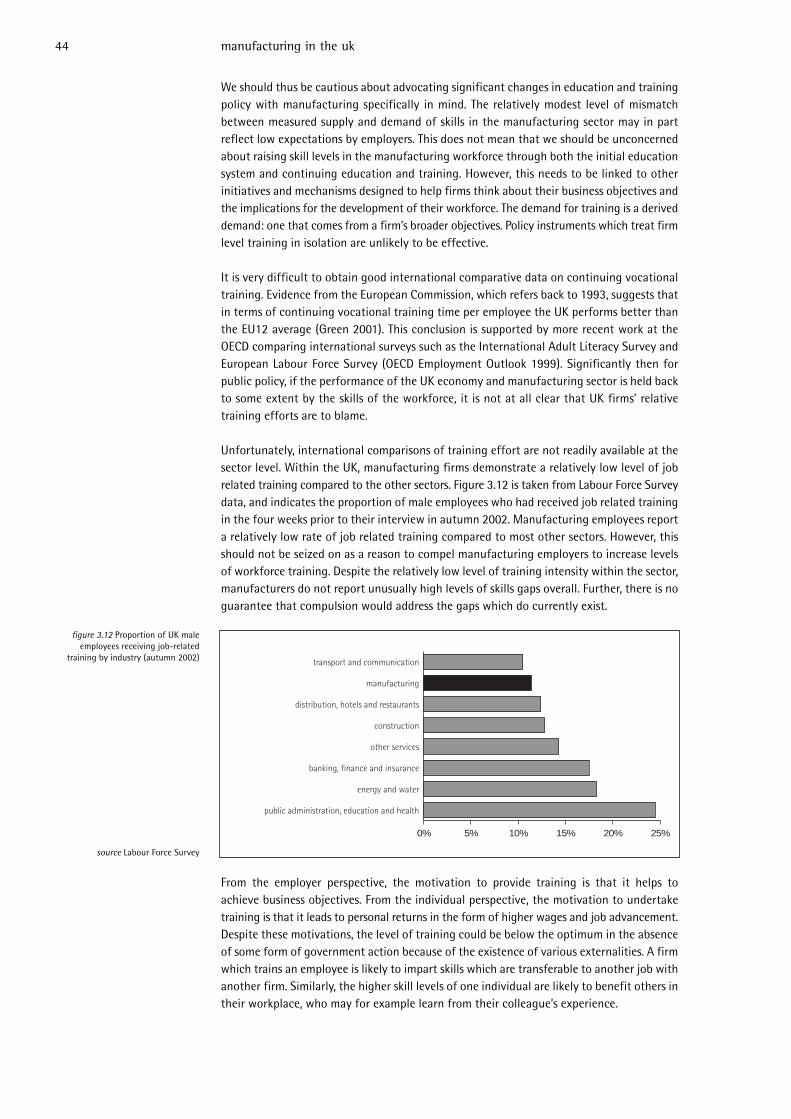
We should thus be cautious about advocating significant changes in education and trainingpolicy with manufacturing specifically in mind. The relatively modest level of mismatchbetween measured supply and demand of skills in the manufacturing sector may in partreflect low expectations by employers. This does not mean that we should be unconcernedabout raising skill levels in the manufacturing workforce through both the initial educationsystem and continuing education and training. However, this needs to be linked to otherinitiatives and mechanisms designed to help firms think about their business objectives andthe implications for the development of their workforce. The demand for training is a deriveddemand: one that comes from a firm’s broader objectives. Policy instruments which treat firmlevel training in isolation are unlikely to be effective.
It is very difficult to obtain good international comparative data on continuing vocationaltraining. Evidence from the European Commission, which refers back to 1993, suggests thatin terms of continuing vocational training time per employee the UK performs better thanthe EU12 average (Green 2001). This conclusion is supported by more recent work at theOECD comparing international surveys such as the International Adult Literacy Survey andEuropean Labour Force Survey (OECD Employment Outlook 1999). Significantly then forpublic policy, if the performance of the UK economy and manufacturing sector is held backto some extent by the skills of the workforce, it is not at all clear that UK firms’ relativetraining efforts are to blame.
Unfortunately, international comparisons of training effort are not readily available at thesector level. Within the UK, manufacturing firms demonstrate a relatively low level of jobrelated training compared to the other sectors. Figure 3.12 is taken from Labour Force Surveydata, and indicates the proportion of male employees who had received job related trainingin the four weeks prior to their interview in autumn 2002. Manufacturing employees reporta relatively low rate of job related training compared to most other sectors. However, thisshould not be seized on as a reason to compel manufacturing employers to increase levelsof workforce training. Despite the relatively low level of training intensity within the sector,manufacturers do not report unusually high levels of skills gaps overall. Further, there is noguarantee that compulsion would address the gaps which do currently exist.
From the employer perspective, the motivation to provide training is that it helps toachieve business objectives. From the individual perspective, the motivation to undertaketraining is that it leads to personal returns in the form of higher wages and job advancement.Despite these motivations, the level of training could be below the optimum in the absenceof some form of government action because of the existence of various externalities. A firmwhich trains an employee is likely to impart skills which are transferable to another job withanother firm. Similarly, the higher skill levels of one individual are likely to benefit others intheir workplace, who may for example learn from their colleague’s experience.
44 manufacturing in the uk
figure 3.12 Proportion of UK maleemployees receiving job-related
training by industry (autumn 2002)
0% 5% 10% 15% 20% 25%
public administration, education and health
energy and water
banking, finance and insurance
other services
construction
distribution, hotels and restaurants
manufacturing
transport and communication
source Labour Force Survey

Government action to increase the level of education and training should build on theexisting mechanisms by which firms and individuals choose to train. This means making useof the market mechanisms of supply and demand rather that setting crude targets fororganisations in terms of expenditure or hours of training. The key principle governing publicfunding of continuing education and training should be that the funds should follow thelearner (Piatt and Robinson 2001): the individual should be subsidised for acquiringtransferable skills where we believe the education or training generates positive externalities.It is now widely understood that this may involve a public role in stimulating informeddemand from individuals (Cabinet Office 2002), but government lacks the information toplan the specific courses or qualifications that individuals might wish to aim for.
Government may also have a role to play in supporting firms’ training activities. However,the term ‘workforce development’ needs to be reclaimed for the process whereby businessesact to meet their personnel and skills needs and make them congruent with their businessobjectives. It should not be a catch-all phrase for all aspects of post-compulsory training andeducation outside of higher education. The appropriate government role here is not insubsidising employers to provide job specific skills, but in helping firms adopt best practicein planning to meet their personnel and training needs. This could help address the issue oflow expectations and thus low demand from employers for skills, and is an issue we willreturn to in the section on enterprise below. However, if firm level training is not especiallylow in the UK compared with other countries, a statutory framework for firm level trainingseems designed to address a problem that does not really exist. On the other hand, it is alsonot clear that there should be a significant shift of resources that subsidise individuals ontheir various education and training routes to funding streams that directly subsidisefirms.
The logic of making use of existing market mechanisms should also apply to the organisationof public training and skills related organisations. We should not build up public organisationswhose purpose is to predict the supply and demand of skills by sector, region, sub-sector andsub-region and then to intervene to correct imbalances before they occur. Making thefunding follow the learner cuts across arguments about how best to organise training, andwhether a sector or regional or local focus is more appropriate.
Modern ApprenticeshipsModern Apprenticeships (MAs) are one specific area of education and training policy wherea discrete policy change is warranted. This programme supports young people on the workbased training route to gain level 2 (Foundation MAs) and level 3 (Advanced MAs)qualifications whilst in paid work or at least placed with an employer. Whilst MAs are widelyavailable across sectors and not just in manufacturing, the scheme would seem to bedesigned to address precisely some of the problems which manufacturing employers inparticular report, namely skills shortages and skills gaps amongst craft workers andoperatives.
Prior to the publication of the 2003 Skills White Paper (DfES 2003), central funding for MAswas available only to those aged 16 to 24, and courses had to be completed before thetrainee’s 25th birthday. There seems to be no clear logic to an age restriction of this type: ifthe programme generates benefits that exceed the public cost in the case of a 21-year-oldit is difficult to see why the same should not be true for a 26 year old. Indeed Scotland andWales, some Local Authorities and Regional Development Agencies have used their ownfunding to allow older workers in the 25 to 40 age bracket, often with relevant experience,to access MAs in specific sectors such as shipbuilding.
Revising the age limit for Modern Apprenticeships upwards would seem to be a reasonablepolicy goal, so we welcome the Government’s commitment in the 2003 Skills White Paper
the public policy response 45

(DfES 2003) to removing the age cap. After all, such age restrictions are not applied to Higherand Further education courses. In the end individuals will vote with their feet to access thecourses they believe will pay off. Many do not vote for the MA route because of doubts aboutthe quality and labour market value of some MAs. However, a level playing field between thedifferent post-compulsory education and training routes is a worthy aspiration.
The Government’s proposal is for a staged lifting of the age cap. Young people who join thescheme before their 25th birthday will now be able to complete their courses. However, thereis currently no timetable for further extension of the age limit, and there is no detail aboutthe level of funding individuals will receive at different ages. We would encourage the SectorSkills Development Agency, the DTI and the DfES to give priority to SEMTA, the Sector SkillsCouncil for Science, Engineering and Manufacturing Technologies, in developing andimplementing their proposals in this area. This might allow some well regarded MAs inmanufacturing generally and engineering in particular, which have relatively low drop-outrates, to recruit from a wider base.
Skills conclusionThe commonly quoted data on the UK’s relative lack of ‘intermediate’ skills compared toFrance and Germany conceals a complex picture. When wage differentials are used toquantify relative skills, we discover that the level of UK skills capital is very similar to thatin the US, and around five per cent lower than in France and Germany. Relative skills makeonly a very small direct contribution to the UK’s relative manufacturing productivity gap withthe US, but account for a quarter of the gap with Germany. We have already noted thesignificant data problems in this area and the potential for these figures to under-emphasisethe contribution of skills to productivity through improved levels of innovation andenterprise. There is certainly evidence that improving workforce skills may improvemanufacturing performance, but once again we must be careful of adopting crude targetsin this area. It is important to create the right environment in which the incentives forindividuals and firms to acquire valuable skills can operate most effectively.
Overall levels of skills shortages and skills gaps are very similar for manufacturing firms andother areas of the UK economy. However, as is well known the pattern of these shortages andgaps is very different in the manufacturing sector, with a high proportion accounted for bycraft workers and operatives. The response to these deficiencies should not be to compelemployers to increase levels of workforce training, firstly because what internationalevidence there is suggests that UK employers already provide relatively high levels of training,and secondly because there is no guarantee that compulsion would effectively address theexisting deficiencies. From the firm’s perspective the demand for training derives from widerbusiness objectives: this should be our understanding of the term ‘workforce development’.Government may have a role to play in assisting firms in this process, potentially helping toaddress the issue of low expectations and thus low demand for skills from employers and thisis an issue we will return to in the section on enterprise. The key principle governing publicfunding of continuing education and training, whether this is performed within or outsideof firms, should be that the funds should follow the learner.
Revising the age limit for Modern Apprenticeships upwards is a reasonable policy goal, so wewelcome the Government’s commitment in the 2003 Skills White Paper to removing the agecap. The Sector Skills Development Agency, the DTI and the DfES should give priority toSEMTA, the Sector Skills Council for Science, Engineering and Manufacturing Technologies,in developing and implementing proposals for extending the age limits for these courses.
46 manufacturing in the uk
iv) Innovation and enterprise
Innovation
Innovation can be considered most broadly as the generation of new products and processes,or new ways of combining the factors of production. It has long been understood thatinnovation is the critical ingredient in long term economic growth: in its absence diminishingreturns to capital and labour eventually set in (Solow 1970). In the early literature,innovation, or technological change, was an unexplained variable which determined the longrun rate of economic growth. Whilst more is now known about innovation, and there is adegree of consensus about some of the appropriate policies to promote innovation, anenormous amount remains unknown and disputed in this area.
As discussed earlier, the bulk of the manufacturing productivity gap between the UK and theUS, as well as a significant proportion of the gap with Germany and France, is accounted forby differences in total factor productivity (TFP). Whilst we cannot be sure about its precisecontribution, differences in innovation are likely to be one of the key factors affecting levelsof TFP. One important reason we cannot be precise about this contribution is that innovationbroadly considered does not have a strict definition which is susceptible to a growthaccounting analysis. We can measure the contribution to growth of certain types of inputwhich are associated with innovation, but there is no measure which captures all innovativeactivity. This is not surprising given the very wide range of activities which can be consideredinnovative, from the design of new products, to advances in human resource management,to minor improvements in management practice at a single firm.
Partly because of these conceptual issues, and partly because of a desire to generate resultswhich are relevant to policy, research has tended to concentrate on a subset of inputs toinnovation and indicators of innovative activities. Among the most studied inputs areresearch and development (R&D) activity, basic research and highly skilled labour. Outputmeasures which have attracted attention more recently include patents, trademarks and newproducts. True outcome measures of innovation are somewhat conceptually difficult. In asense, we can only know ex-post which activities were innovative and valuable as opposedto novel but unproductive. The measurement of innovation is a relatively young science.
Manufacturing R&DThere is a large body of empirical evidence that expenditure on R&D is an important factorin technological change and improvements in productivity (for example Griliches 1998). Ina multi-country study for the OECD, Guellec and van Pottelberghe (2001) find that at thewhole economy level a one per cent increase in business R&D expenditure generates 0.13 percent total factor productivity growth. These are powerful results: R&D does not onlyrepresent a form of investment but is associated with the more effective use of resources.Recent work also suggests that R&D plays an important role in allowing firms, and byextension countries, to catch up to the leading edge of performance elsewhere. This may beparticularly important in the UK, which in many areas lags relatively far behind thetechnology frontier that is usually represented by the US (Griffith et al 2001).
It is also widely accepted that the social returns to R&D are significantly above the privatereturns to firms, even though the private returns are generally quite high (for example,Griffith 2000 for a survey). The reasons for this are relatively well understood: it is difficultfor the innovating firm to appropriate all the benefits of their own research becauseknowledge spills over into other firms. Once a product has been developed and released intothe market it can be copied by others, even if intellectual property laws prevent itsimmediate commercialisation by rival firms. In addition, individuals working in innovatingfirms may change employer, transferring knowledge between firms as they move. The net
the public policy response 47
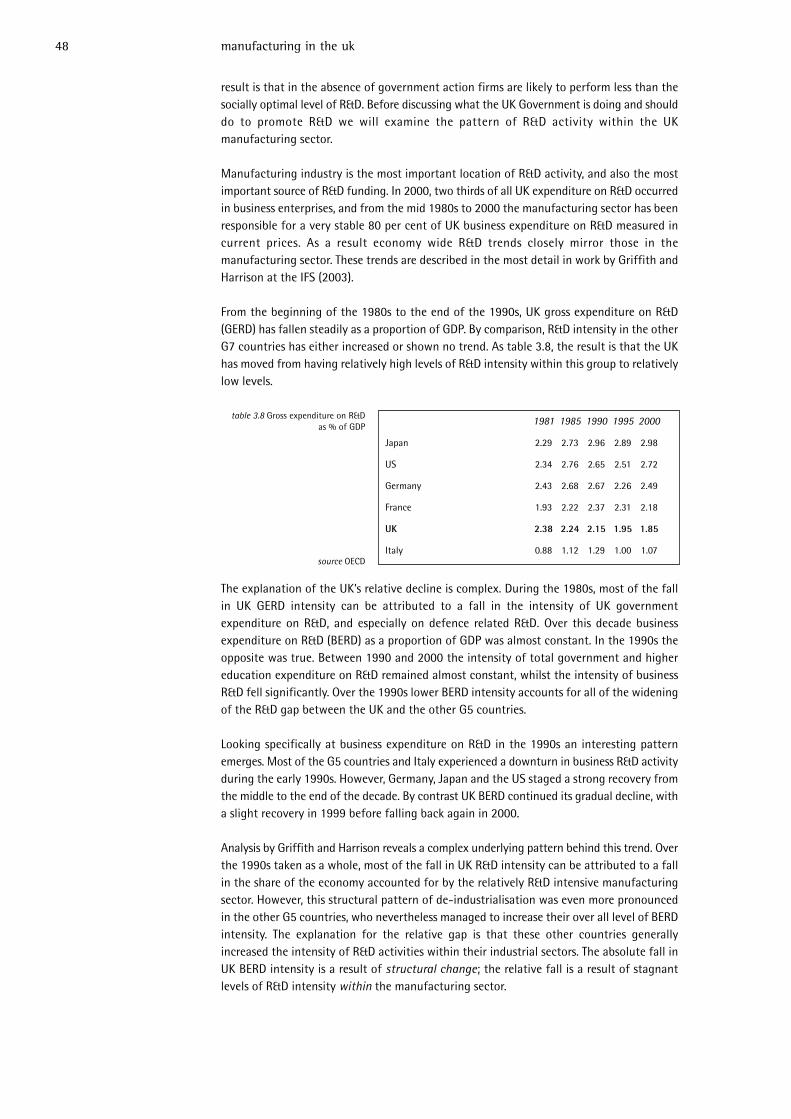
result is that in the absence of government action firms are likely to perform less than thesocially optimal level of R&D. Before discussing what the UK Government is doing and shoulddo to promote R&D we will examine the pattern of R&D activity within the UKmanufacturing sector.
Manufacturing industry is the most important location of R&D activity, and also the mostimportant source of R&D funding. In 2000, two thirds of all UK expenditure on R&D occurredin business enterprises, and from the mid 1980s to 2000 the manufacturing sector has beenresponsible for a very stable 80 per cent of UK business expenditure on R&D measured incurrent prices. As a result economy wide R&D trends closely mirror those in themanufacturing sector. These trends are described in the most detail in work by Griffith andHarrison at the IFS (2003).
From the beginning of the 1980s to the end of the 1990s, UK gross expenditure on R&D(GERD) has fallen steadily as a proportion of GDP. By comparison, R&D intensity in the otherG7 countries has either increased or shown no trend. As table 3.8, the result is that the UKhas moved from having relatively high levels of R&D intensity within this group to relativelylow levels.
The explanation of the UK’s relative decline is complex. During the 1980s, most of the fallin UK GERD intensity can be attributed to a fall in the intensity of UK governmentexpenditure on R&D, and especially on defence related R&D. Over this decade businessexpenditure on R&D (BERD) as a proportion of GDP was almost constant. In the 1990s theopposite was true. Between 1990 and 2000 the intensity of total government and highereducation expenditure on R&D remained almost constant, whilst the intensity of businessR&D fell significantly. Over the 1990s lower BERD intensity accounts for all of the wideningof the R&D gap between the UK and the other G5 countries.
Looking specifically at business expenditure on R&D in the 1990s an interesting patternemerges. Most of the G5 countries and Italy experienced a downturn in business R&D activityduring the early 1990s. However, Germany, Japan and the US staged a strong recovery fromthe middle to the end of the decade. By contrast UK BERD continued its gradual decline, witha slight recovery in 1999 before falling back again in 2000.
Analysis by Griffith and Harrison reveals a complex underlying pattern behind this trend. Overthe 1990s taken as a whole, most of the fall in UK R&D intensity can be attributed to a fallin the share of the economy accounted for by the relatively R&D intensive manufacturingsector. However, this structural pattern of de-industrialisation was even more pronouncedin the other G5 countries, who nevertheless managed to increase their over all level of BERDintensity. The explanation for the relative gap is that these other countries generallyincreased the intensity of R&D activities within their industrial sectors. The absolute fall inUK BERD intensity is a result of structural change; the relative fall is a result of stagnantlevels of R&D intensity within the manufacturing sector.
48 manufacturing in the uk
table 3.8 Gross expenditure on R&Das % of GDP 1981 1985 1990 1995 2000
Japan 2.29 2.73 2.96 2.89 2.98
US 2.34 2.76 2.65 2.51 2.72
Germany 2.43 2.68 2.67 2.26 2.49
France 1.93 2.22 2.37 2.31 2.18
UK 2.38 2.24 2.15 1.95 1.85
Italy 0.88 1.12 1.29 1.00 1.07 source OECD
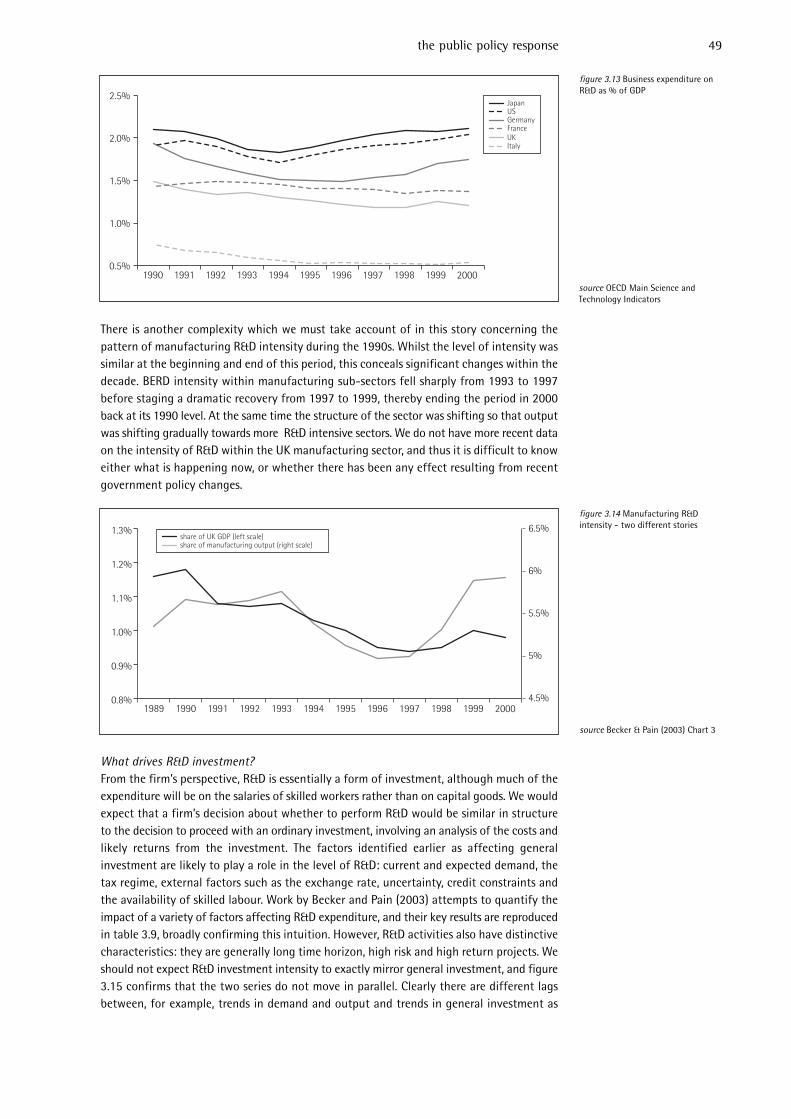
There is another complexity which we must take account of in this story concerning thepattern of manufacturing R&D intensity during the 1990s. Whilst the level of intensity wassimilar at the beginning and end of this period, this conceals significant changes within thedecade. BERD intensity within manufacturing sub-sectors fell sharply from 1993 to 1997before staging a dramatic recovery from 1997 to 1999, thereby ending the period in 2000back at its 1990 level. At the same time the structure of the sector was shifting so that outputwas shifting gradually towards more R&D intensive sectors. We do not have more recent dataon the intensity of R&D within the UK manufacturing sector, and thus it is difficult to knoweither what is happening now, or whether there has been any effect resulting from recentgovernment policy changes.
What drives R&D investment?From the firm’s perspective, R&D is essentially a form of investment, although much of theexpenditure will be on the salaries of skilled workers rather than on capital goods. We wouldexpect that a firm’s decision about whether to perform R&D would be similar in structureto the decision to proceed with an ordinary investment, involving an analysis of the costs andlikely returns from the investment. The factors identified earlier as affecting generalinvestment are likely to play a role in the level of R&D: current and expected demand, thetax regime, external factors such as the exchange rate, uncertainty, credit constraints andthe availability of skilled labour. Work by Becker and Pain (2003) attempts to quantify theimpact of a variety of factors affecting R&D expenditure, and their key results are reproducedin table 3.9, broadly confirming this intuition. However, R&D activities also have distinctivecharacteristics: they are generally long time horizon, high risk and high return projects. Weshould not expect R&D investment intensity to exactly mirror general investment, and figure3.15 confirms that the two series do not move in parallel. Clearly there are different lagsbetween, for example, trends in demand and output and trends in general investment as
the public policy response 49
source Becker & Pain (2003) Chart 3
figure 3.13 Business expenditure onR&D as % of GDP
0.5%
1.0%
1.5%
2.0%
2.5%
1990 1991 1992 1993 1994 1995 1996 1998 1999 20001997
JapanUSGermanyFranceUKItaly
4.5%
5%
5.5%
6%
6.5%
1990 1991 1992 1993 1994 1995 1996 1998 1999 2000199719890.8%
0.9%
1.0%
1.1%
1.2%
1.3%share of UK GDP (left scale)share of manufacturing output (right scale)
source OECD Main Science andTechnology Indicators
figure 3.14 Manufacturing R&Dintensity - two different stories

opposed to trends in R&D intensity. In addition, UK business R&D is highly concentrated inthe aerospace and pharmaceutical sub sectors, and these are likely to be subject to specificpressures and trends.
Innovation policyIt is fairly clear that the Government should promote R&D, and indeed it does so throughdirect funding of research as well as spending on the education and training of the skilledindividuals who perform R&D. At the same time, we should be clear that science policy is notthe same thing as innovation policy. The primary purpose of the research funded by, forexample, the Medical Research Council is to improve the health and quality of life of the UKpopulation, not to assist pharmaceutical companies to develop profitable products. Similarconsiderations apply to all seven UK research councils. Indeed, one could venture theproposition that only by concentrating on wider public policy outcomes such as better healthor a better physical environment can the government’s science budget be sure to fund thekind of research that firms would not fund themselves.
In addition, the Government also has numerous schemes, initiatives and fiscal incentives tohelp firms with their own innovation. We will not address here the important issue ofimproving links between the research institutions and business which will be covered by theLambert review, due in the second half of 2003.
R&D has in fact long benefited from favourable tax treatment compared to generalinvestment, and this has been augmented by the recently introduced UK R&D tax credits forsmall to medium-sized enterprises (from April 2000) and larger companies (from April 2002).The previous regulations allowed 100 per cent of R&D costs to be deducted from taxableprofits in the year the costs were incurred. The new regulations mean that SMEs can deduct150 per cent of qualifying R&D costs against profits in the same year, and if they have
50 manufacturing in the uk
source Becker & Pain (2003)
figure 3.15 Comparing R&D intensitywith general investment intensity in
UK manufacturing
4.5%
5%
5.5%
6%
6.5%
1990 1991 1992 1993 1994 1995 1996 1998 1999 2000199719898%
9%
10%
11%
12%
13%
14%investment intensity (left scale)R&D intensity (right scale)
Impact on R&D volume of a 1 per cent rise in:
Output +0.71% to +1.08%
Impact on R&D volume of a 1 per cent rise in:
Real exchange rate -1.16% to -1.58%
Import penetration +0.47% to +1.21%
Real interest rate -11.9% to -13.4%
Government funding share +0.62% to +1.70%
Foreign funding share +0.46% to +0.66%
Skilled employment share +16.3% to +18.6%
source Becker & Pain (2003) andNational Statistics
table 3.9 Factors affecting R&Dexpenditure
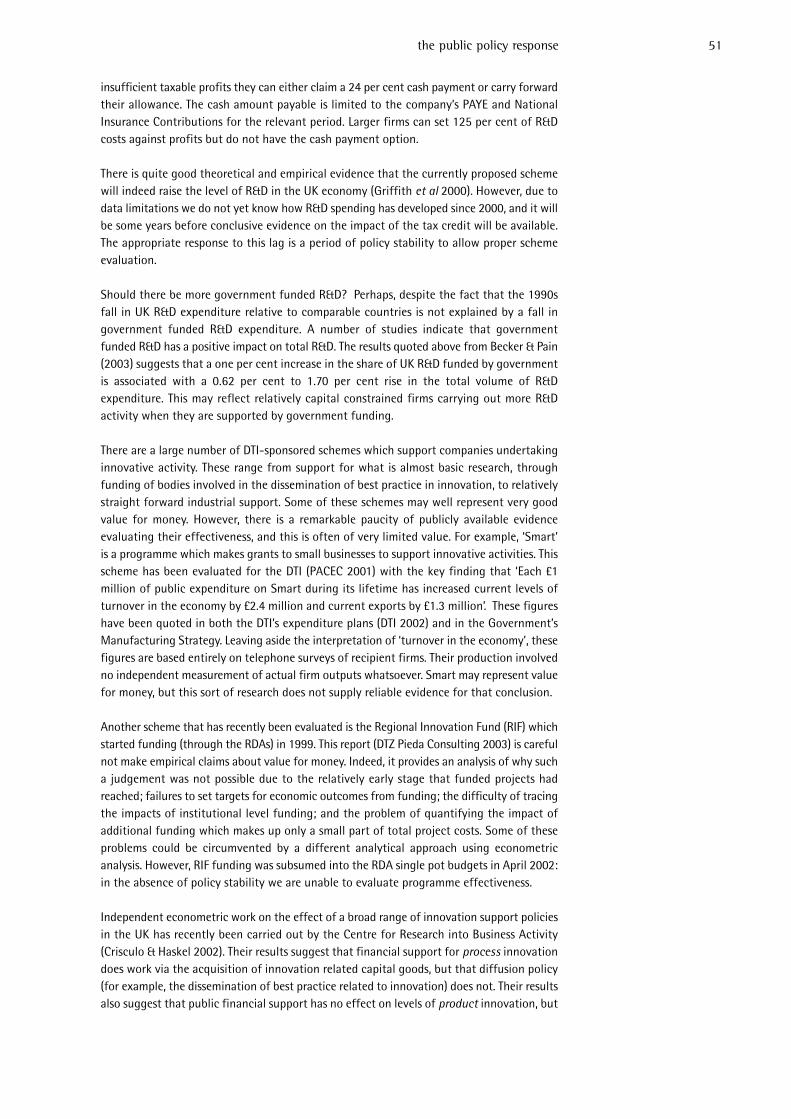
insufficient taxable profits they can either claim a 24 per cent cash payment or carry forwardtheir allowance. The cash amount payable is limited to the company’s PAYE and NationalInsurance Contributions for the relevant period. Larger firms can set 125 per cent of R&Dcosts against profits but do not have the cash payment option.
There is quite good theoretical and empirical evidence that the currently proposed schemewill indeed raise the level of R&D in the UK economy (Griffith et al 2000). However, due todata limitations we do not yet know how R&D spending has developed since 2000, and it willbe some years before conclusive evidence on the impact of the tax credit will be available.The appropriate response to this lag is a period of policy stability to allow proper schemeevaluation.
Should there be more government funded R&D? Perhaps, despite the fact that the 1990sfall in UK R&D expenditure relative to comparable countries is not explained by a fall ingovernment funded R&D expenditure. A number of studies indicate that governmentfunded R&D has a positive impact on total R&D. The results quoted above from Becker & Pain(2003) suggests that a one per cent increase in the share of UK R&D funded by governmentis associated with a 0.62 per cent to 1.70 per cent rise in the total volume of R&Dexpenditure. This may reflect relatively capital constrained firms carrying out more R&Dactivity when they are supported by government funding.
There are a large number of DTI-sponsored schemes which support companies undertakinginnovative activity. These range from support for what is almost basic research, throughfunding of bodies involved in the dissemination of best practice in innovation, to relativelystraight forward industrial support. Some of these schemes may well represent very goodvalue for money. However, there is a remarkable paucity of publicly available evidenceevaluating their effectiveness, and this is often of very limited value. For example, ‘Smart’is a programme which makes grants to small businesses to support innovative activities. Thisscheme has been evaluated for the DTI (PACEC 2001) with the key finding that ‘Each £1million of public expenditure on Smart during its lifetime has increased current levels ofturnover in the economy by £2.4 million and current exports by £1.3 million’. These figureshave been quoted in both the DTI’s expenditure plans (DTI 2002) and in the Government’sManufacturing Strategy. Leaving aside the interpretation of ‘turnover in the economy’, thesefigures are based entirely on telephone surveys of recipient firms. Their production involvedno independent measurement of actual firm outputs whatsoever. Smart may represent valuefor money, but this sort of research does not supply reliable evidence for that conclusion.
Another scheme that has recently been evaluated is the Regional Innovation Fund (RIF) whichstarted funding (through the RDAs) in 1999. This report (DTZ Pieda Consulting 2003) is carefulnot make empirical claims about value for money. Indeed, it provides an analysis of why sucha judgement was not possible due to the relatively early stage that funded projects hadreached; failures to set targets for economic outcomes from funding; the difficulty of tracingthe impacts of institutional level funding; and the problem of quantifying the impact ofadditional funding which makes up only a small part of total project costs. Some of theseproblems could be circumvented by a different analytical approach using econometricanalysis. However, RIF funding was subsumed into the RDA single pot budgets in April 2002:in the absence of policy stability we are unable to evaluate programme effectiveness.
Independent econometric work on the effect of a broad range of innovation support policiesin the UK has recently been carried out by the Centre for Research into Business Activity(Crisculo & Haskel 2002). Their results suggest that financial support for process innovationdoes work via the acquisition of innovation related capital goods, but that diffusion policy(for example, the dissemination of best practice related to innovation) does not. Their resultsalso suggest that public financial support has no effect on levels of product innovation, but
the public policy response 51
that diffusion policies do. They do not investigate the costs or benefits of these programmes,but we can safely assume that those which have no statistically significant effects are notgood value for money. There is a pressing need for more of this sort of research to evaluatespecific innovation related policies.
Competition policy is also likely to have an effect on levels of innovative activity. Influentialearly work by Schumpeter (1942) suggested that innovation may be positively related tomarket power, putting forward a range of arguments including the importance of economiesof scale in carrying out R&D; greater availability of finance for risky projects; and the abilityof such firms to appropriate a greater share of the total benefits of their innovative activities.More recent empirical work has tended to suggest that whilst larger firms do tend to performa disproportionately high quantity of R&D, competition is in fact a valuable spur toinnovation (Griffith 2000). Picking winners, even if these are to be technologies rather thanspecific companies, has never worked for the UK.
UK firms may choose to carry out their R&D activities within or outside the UK, and foreignfirms also carry out some of their R&D activities within the UK. There are likely to be benefitsto the UK economy from all of these: research carried out by UK firms abroad may be ableto make use of expertise not available in the UK and transfer this to the home company.Workers performing R&D within foreign firms located in the UK may transfer knowledge todomestic companies, and there are likely to be benefits for domestic firms working withforeign research programmes. There is some evidence that R&D by foreign firms actually hasmore impact on domestic productivity growth than R&D by domestic firms. In a long termcross country study Guellec and van Pottelberghe (2001) find that a one per cent increasein foreign R&D generates 0.46 per cent TFP growth: more than three times the effect ofdomestic business R&D expenditure in this study. At present we cannot be sure about theappropriate policy response to these considerations, and this is an important area for furtherinvestigation.
Innovation: conclusionUK science policy and UK innovation policy should be clearly distinguished. We are verysupportive of the higher levels of science spending that have been announced in recent years.However it is neither appropriate to describe this as support for business innovation, norshould we confuse the legitimate objectives of publicly funded scientific research withbusiness support. This is not to say that the two cannot sometimes support each other, butthis will not always be the case and it is dangerous to assume that they usually will.
We are also supportive of the R&D tax credit, for which we see good theoretical reasons anda good chance of success. However, we have seen that there are severe data problems in thearea of innovation: the use of output measures such as patents and trademarks is relativelyrecent development; we are only just beginning to understand the pattern of UK innovationspending in the 1990s; and we do not have detailed R&D data at the sub-sectoral level morerecent than 2000. At the same time there are good reasons to believe that the rate ofinnovative activity may change relatively slowly, both in response to external factors suchas the exchange rate and in response to policy measures. The combination of these issuesmeans that it is hazardous to judge the impact of recent policy interventions. Once again,a period of micro policy stability and rigorous evaluation is called for. The DTI’s InnovationReview, due in the latter half of 2003, should take a very tough line on the evaluation ofprogrammes of innovation support.
52 manufacturing in the uk
Enterprise
Enterprise is a widely misunderstood concept. It can be most generally considered as theprocess by which the factors of production such as labour and capital are brought togetherto generate output. Enterprise is thus another contributor to productivity growth. In thisgeneral sense enterprise is as relevant to large businesses as it is to start ups, and enterprisepolicy would include all measures designed improve the capacity of managers and employeesto create value out their available resources. However, enterprise policy is often associatedspecifically with small businesses, and ‘entrepreneurs’ are often associated specifically withstarting new ventures. There is considerable evidence that too much support for ‘enterprise’is aimed at relatively unproductive start ups with a very high failure rate (Adams, Robinsonand Vigor 2003 forthcoming). However, here we will consider enterprise in its wider sense.One aspect of enterprise in this wider sense is the process by which resources are broughttogether in new firms or projects. Another aspect of enterprise is the rapid adoption ofinnovative and effective management techniques sometimes described as ‘best practice’.
In its wider sense, enterprise has a clear role in driving up total factor productivity. However,as in the case of innovation, it is impossible to precisely quantify the contribution ofenterprise because its diffuse nature means that it is not susceptible to the growthaccounting methodology. Measuring enterprise is even more difficult than measuringinnovation, as there are fewer obvious inputs or outputs: observing business start up ratesonly provides information about one aspect of enterprise, and probably not the one mostrelevant to UK manufacturers. The DTI’s manufacturing strategy implicitly recognises this:whilst enterprise with a distinct small business focus is one of the five Treasury drivers ofproductivity, the DTI focuses on ‘best practice’ among manufacturers, which is a moreappropriate application of this concept in the context of the sector.
Best practice‘Best practice’ is another term with many interpretations, and it is used by different peoplein different ways. Sometimes this is simply a matter of context: best practice in supply chainmanagement is likely to be quite different from best practice in relation to customer service.Sometimes views of what constitutes best practice will vary for technical reasons, and wewould expect the consensus understanding of many issues to develop over time. Moreproblematically, there are cases where disagreements about what constitutes ‘best practice’are actually political disagreements. Despite the significantly improved industrial relationsclimate of recent years, we can still expect trades unions and employers to have differentviews about what constitutes ‘best practice’ in relation to many employment relatedmatters.
To some degree ‘best practice’ must remain a portmanteau term, with different meanings indifferent contexts. However, it should never be used simply as a tag to give an air of authorityto one set of views on an issue. The definition we will adopt here, and it is not the onlypossible definition, is that best practice constitutes the techniques and methods oforganisation that enable an individual firm to achieve its corporate objectives mosteffectively. Best practice tools are generalised techniques and methods that may be adoptedby different firms, and their application involves a wide range of activities by those firms,from reductions in technical inefficiency to more effective strategic planning, but all withthe central objective of improving the firm’s success measured by its own corporate goals.‘Fit for the future’ and the Manufacturing Advisory Service are two government sponsoredbest practice initiatives which appear to adopt this understanding: they are focused onimproving firm performance rather than on other valid public policy goals. This seems to bea sensible approach.
the public policy response 53
‘Fit for the future’ identifies a range of issues relevant to firm performance includingleadership, people, customer service, supply chain, performance measurement and processimprovement. Other initiatives tend to identify a similar set of issues, and there arenumerous institutes and organisations playing a role in the diffusion of best practice inindividual areas, such as the Design Council and the Chartered Institute of Personnel andDevelopment. A common understanding across all of these varied bodies is that organisationscan, if they apply enough corporate effort, improve their performance through the adoptionof the right techniques. This immediately begs the question of why, if information about bestpractice is valuable to individual firms, private firms do not supply this information for profitand what the government’s role is in relation to its provision.
The theoretical argument for government to at least fund the provision of corporate bestpractice advice and information is that these are to some extent public goods. One firm’sadoption of a particular technique does not mean there is any less of that technique to goaround for other firms. In addition, it is hard to exclude non-paying firms from acquiringgeneric information, and therefore private firms will find it difficult to profit from providingit. There are many private providers of best practice advice such as the major managementconsultancy companies, but these tend to deliver a relatively bespoke service to avoid theproblem of non-excludability referred to above. There are thus likely to be significant gainsfrom publicly funded best practice resources, which is not to say that such services shouldbe directly provided by public sector bodies. The provision of best practice advice inpartnership with the many existing professional and industry associations appears to be theright way forward, and has been a feature of recent government initiatives in this area.
There are other arguments for the public funding of best practice initiatives. A firm’s adoptionof new techniques has similarities to both investment and training. As with an investmentin capital, the firm will invest resources in considering and then adopting a new practice inthe expectation of an adequate return in terms of improved corporate performance. On theone hand, firms may lack sufficient information about the potential benefits of adopting bestpractice: this may justify government funded promotion of these benefits. On the other hand,firms may not be able to retain all the benefits of the changes they implement: staff mayleave the company taking their knowledge and experience with them to another firm. In thiscase, the fact that the wider benefits outweigh the private benefits may justify directgovernment subsidy to increase the quantity of best practice initiatives undertaken.
What is the extent of the use of best practice techniques in the UK? This is a difficult issueboth theoretically and empirically. As well as considering whether a firm is applying atechnique, we need to consider how extensively and effectively practices are applied withinfirms, as this has been shown to have a strong bearing on whether they do or do not theyresult in improved firm outcomes (for example, Guest et al 2000). Most of the research inthis area is based on surveys of management, and even where questions are framed toproduce a quantitative response (such as, what proportion of non-managerial workers receiveregular performance appraisals?) this may mask very divergent implementation practices(such as, how seriously are these appraisals taken by those concerned?) Researchers in thisarea are acutely aware of these problems, but the fundamental issue remains that workingpractices are difficult to describe quantitatively.
Recent work has been undertaken by the Engineering Employers’ Federation in relation tolean manufacturing techniques and workplace initiatives in UK manufacturing firms (EEF2002). Their survey results show that although a third of UK manufacturers use leanmanufacturing across the whole of their organisation, 42 per cent do not use lean at all andhave no plans to do so. In addition, although the majority of manufacturers have someinitiatives in place to encourage employees to contribute to the company’s goals, the uptakeof practices such as employee involvement and incentive pay are used by less than half of
54 manufacturing in the uk
firms. In both lean manufacturing and workplace initiatives the survey data indicate thatdomestically owned manufacturing firms in the UK make less use of best practice techniquesthan US-owned manufacturing firms in the UK. However, these two groups may not bestrictly comparable: the US-owned firms are part of multinational enterprises, whereas theUK sample includes domestic firms which may be much smaller and less sophisticated. Workby the Centre for Research Into Business Activity (Crisculo and Martin 2003) indicates thatmuch, but not all, of the total factor productivity gap between domestic owned and US firmsin the UK can be explained by this multinational effect. It would be interesting to comparethe extent of best practice in domestic UK and US manufacturers and in multinational UKand US manufacturers. This is an important area for further research.
Measurement of the effect of best practice initiatives is another fraught area. There iswidespread survey evidence that firms implementing initiatives believe them to be successful.It is somewhat harder to demonstrate empirically that the adoption of a specific practiceleads to improved performance, for example as measured by profitability or shareholderreturns. In particular, it is often difficult to know whether improved performance stems fromthe adoption of the technique or from some other characteristic of the firm, or indeed fromcharacteristics that might be associated with the adoption of best practice techniques suchas leadership and the capacity to accept organisational change.
This pamphlet will not investigate these extensive issues, but proceeds on the relativelycautious assumption that improvements in UK manufacturing management practice are bothpossible and could lead to improvements in aggregate sector performance, without assertingthat current UK practice is necessarily worse than that in other comparable countries. If UKmanagers were systematically less effective than those in other countries we would be facedwith a real puzzle as to why the market in skilled personnel apparently fails to operateeffectively in this area. We also proceed on the assumption that there is a worthwhile rolefor government in funding and supporting best practice initiatives.
Human resources managementAn area where there is a growing body of relatively robust evidence is the link betweenhuman resources management (HRM) practices and organisational performance. Forexample, work by Huselid (1995) demonstrates positive relationships between an index of theextent of a range of ‘progressive’ HRM practices and results for firm turnover, productivityand financial performance. This kind of result is echoed by a range of studies in the UK andUS which demonstrate links between firm performance and the implementation of variouspersonnel related practices (CIPD 2001 for a survey). Some of these results also suggest adirection of causality: that certain practices may result in improved performance, and it isnot just the most successful organisations adopting them (for example, Black & Lynch 2001).It is fair to say that the argument in this area is no longer about whether human resourcemanagement plays a role in firm success, but about how its benign influence is maximised.
It is certainly not the case that there is a tightly defined list of specific HRM techniques thatshould be adopted by every firm. However, there is remarkable consistency across many UKand US studies over some of the key characteristics of what have come to be know as highperformance workplace practices. These include: the importance of organisations focusingon the acquisition and development of employee skills; the development of a ‘psychologicalcontract’ between employee and employer; and organisational design that allows employeesa high level of autonomy. It is increasingly the case that firms are unable to instructemployees in detail how to do their jobs most effectively. High performance workingpractices are in part designed to address this problem by creating an environment whichencourages and allows appropriate discretionary behaviour by employees.
the public policy response 55

One aspect of high performance working practices is effective employee representation andconsultation. Recent work on US manufacturing firms suggests that plants which recogniseunions and have adopted practices such as joint decision-making and performance relatedpay performed significantly better than otherwise similar non-unionised plants (Black andLynch 2001). Their key results are reproduced in table 3.10. The explanation of this patternmay be that employees are reassured by the presence of the union that their interests willbe protected despite the introduction of new working practices, and thus co-operatebetter with the reforms. Recent work by the EEF (2002) indicates that ‘attitudes to change’are by far the most important barrier to the adoption of workplace initiatives, and this iscongruent with the relative success of unionised firms in making such practices productive.
Having said this, there are still vigorous disagreements over the issue of whether trade unionsthemselves make a positive difference to firm performance. Whilst it is generallyacknowledged that employee involvement builds valuable relationships of trust, there isdisagreement over whether this should be direct involvement of employees in workplacedecisions, indirect involvement through mechanisms such as trades unions, or a mixture ofthe two. The ‘business case’ for formal representative mechanisms is two fold. Firstly, thepresence of unions is associated with higher overall levels of employee involvement (Coats2001), which are associated with improved performance. Secondly, if unions provideemployees with the security that their interests are being represented, then they may improveemployee buy-in to workplace decisions and initiatives. Work by organisations such as CIPDhas emphasised the importance from a business perspective of employees feeling that theyare fairly treated: it is reasonable to believe that unions have a part to play in that process.At the same time it is important to note that there is no proven ‘one size fits all’ approachto this issue. The DTI partnership fund has a potentially useful role in supporting thedevelopment of employee involvement mechanisms, but has experienced relatively lowdemand from firms and employee representatives and could usefully be revisited with theseconsiderations in mind.
Sector Skills Councils to Sector CouncilsOur earlier discussion of skills concluded that government action to increase the level ofeducation and training should build on the existing incentive mechanisms by which firms andindividuals choose to train. There is an important role for government in ensuring thateducation and training providers, for example further education institutions, are sufficientlyflexible to meet the needs of employers and individuals. However, at the firm level theappropriate government role is not ‘predict the requirements of the industry/region/localityand provide’ but rather to help firms adopt best practice in planning their own personnel andtraining needs. This implies that government efforts to address skills issues at the firm levelshould be set within the context of business support.
The recent withdrawal of funding from National Training Organisations and establishmentof Sector Skills Councils may be welcomed for a number of reasons. It was heralded bygovernment as a mechanism for making post-compulsory training and learning moreresponsive to employer requirements. However, this reform does not go far enough. SectorSkills Councils could fulfil their existing objectives more effectively, and could play animportant role in the rationalisation of other aspects of business support, if they became
56 manufacturing in the uk
table 3.10 The interaction of unions withhigh-performance working practices
High-performance No high-performanceworking practices working practices
Unionised 113.5 90plant
Non-unionised 104.5 100plant
note high performance working practices =all of: benchmarking; total quality
management (TQM); profit sharing for non-managerial workers; 50 per cent of workers
meeting on a regular basis.
source Black & Lynch (2001)
Sector Councils whose key role was assisting firms to plan for and meet their business needsmore widely, including their skills needs.
It is important to emphasise that this would not mean going back to the drawing board forSector Skills Councils, which are of course still in their infancy. Many of the roles andcharacteristics of Sector Councils would be similar to those of Sector Skills Councils. Theywould continue to develop evidence of effective employer skills strategies and promote these,and they would also generate skills demand by supporting the workforce developmentprocess of employers. They would continue to make links between employers and trainingproviders, and would play a role in informing individuals about the market for skills. Therewould be no reason to change from the current model of the organisations being run andowned by employers. However, Sector Councils would be business support networks ratherthan planning organisations. They would not attempt to ‘develop a forward looking skills andproductivity agenda and action plan for the sector’ and then seek to directly influence thesupply of skills by provider organisations.
If Sector Councils, or indeed Sector Skills Councils, are to perform their functions effectively,then their role will involve assisting firms to plan their business needs, from which their skillsneeds are derived. They will thus be well placed to act as a dissemination mechanism foraspects of best practice other than those which relate solely to skills directly. SectorCouncils should continue the model of championing best practice in a range of areas andreferring firms to specialised bodies for detailed advice and assistance. The Sector Councilscould carry forward the work of such initiatives as Fit for the Future at a more targeted level.It is not at all obvious why the best practice in relation to skills is promoted at the sectorallevel, whilst the Manufacturing Advisory Service has been set up on a regional basis toaddress other best practice issues in the sector. This report focuses on the need to sensitivelyevaluate what works rather than proposing widespread institutional reorganisation ofbusiness support. Nevertheless, there will come a time when the structures will need to berevisited in the light of a better understanding of what does work. We hope that Sector SkillsCouncils, being business led and sector focused, will prove to be a valuable institution aroundwhich other functions may be organised.
As in other areas of business support, government funding of the Sector Councils shouldbe contingent on the demonstration of their effectiveness in delivering clear policy goals.This would involve rigorous independent evaluation with the minimum possible relianceon survey data. If Sector Councils are designed to deliver improvements in businessperformance then there is no justification for evaluating them by asking firms for theirviews: this is cheap but ineffective. Instead, firm level performance data should be usedand firm involvement with Sector Councils should be tested as an explanatory variable. Inthe absence of a robust link, government funding should be withdrawn. It should be notedthat if Sector Skills Councils are evaluated on the basis of sector rather than firmperformance as is currently proposed (DfES 2001), it will be extremely difficult to resolvewhether or not they are effective, as it will be difficult to establish causal links betweensector performance and the actions of the institutions.
How heavily is the UK economy regulated?It is widely understood that product market regulation and employment legislationimpacts upon levels of enterprise and productivity growth (Scarpetta et al 2002). Does theUK have a business environment conducive to enterprise in this general sense? Perhapsthe best international comparative data is produced by the OECD, which collects thisinformation precisely because of the perceived link with productivity growth. The two keysummary charts are reproduced below. It is immediately striking that on these measuresthe UK performs extremely strongly in terms of having a regulatory regime which isconducive to business success. On the basis of product market regulation the UK is
the public policy response 57

considered by the OCED to have the least burdensome regime out of all the advancedindustrial economies. On the basis of employment protection legislation the UK is secondonly to the US, although it is notable that many other countries improved their situationover the 1990s, reducing the relative advantage of the UK in this respect. These resultsprovide evidence against the argument that UK manufacturing suffers from an excessivelyburdensome regulatory regime, and especially strong evidence against the theory that theregulatory regime could help explain the sector’s relatively poor performance in the late1990s by international standards.
The comparative data presented here refer to 1998. Has the Labour Government had anegative impact on the UK regulatory environment since then? It is possible to point to anumber of high profile initiatives that may have impacted on business even if they have beenintroduced to achieve other perfectly legitimate and worthwhile objectives. In the area ofemployment legislation, Labour has introduced a minimum wage, the working time directive,modest trade union reforms and various ‘family friendly’ policy initiatives. It is very difficultto quantify the impact of these measures. However, one source of indirect evidence is thelevel of employment. We would expect inappropriately designed employment measures tocause firms to be more cautious about taking on new workers, retarding employment growth.In fact, as is well known the UK labour market at the aggregate level performed strongly overthe period 1997 to 2002, with the employment rate for those of working age rising from 72.7per cent to 74.4 per cent. There is no strong economic argument for widespread de-regulationat the expense of other important policy goals such as the promotion of rights at work andenvironmental sustainability. At the same time there is an economic case for maintaining asensitively regulated environment without disproportionate costs or burdens on business.
58 manufacturing in the uk
source OECD/Nicoletti et al (1999)
figure 3.16 OECD index of productmarket regulation (0 = least) 1998
0.0
0.5
1.0
1.5
2.0
2.5UK
Denm
ark
Neth
erlan
ds
Fran
ceUS
Cana
da
Irelan
d
Germ
any
Swed
en
Italy
Austr
ia
Japa
n
Switz
erlan
d
Finlan
d
Belg
ium
0
1
2
3
4
5
US
Switz
erlan
d
Belg
ium
Fran
ce
Cana
da
Austr
iaUK
Denm
ark
Finlan
d
Italy
Irelan
d
Neth
erlan
ds
Japa
n
Swed
en
Germ
any
1998
1990
source OECD/Nicoletti et al (1999)
figure 3.17 OECD employmentprotection legislation (0 = least)
Enterprise: conclusionThis pamphlet has addressed enterprise in the sense in which it is applicable to large as wellas small businesses: as the process by which the factors of production are brought together,rather than the process by which new firms are created. That we have not identified a distinctenterprise strategy for manufacturing should come as no surprise: there was no mention ofmanufacturing in ‘Enterprise Britain’, the Treasury’s November 2002 statement of enterprisepolicy, and there is no explicit discussion of enterprise in The Government’s ManufacturingStrategy. The explanation of this may be that the best policies to promote enterprise withinthe manufacturing sector are likely to be macro policies: a robust competition environmentand a stable macro-economic framework.
There are sound theoretical reasons for a government role in funding the dissemination ofbest practice, which can be considered a form of enterprise policy. There is also empiricalsupport for the proposition that good management practice can be shared across firms andcan improve corporate performance. What we lack at the moment is evidence of the linkbetween government action and the spread of good management practice. In the absenceof robust evidence about existing government initiatives it is difficult to know whether theseare effective or not, and therefore whether we should be spending more or less on them. Itis possible that rigorous evaluation across all existing programmes of support for investment,skills formation, innovation and enterprise policy could suggest a radically differentallocation of resources.
the public policy response 59

conclusion
One of the themes of this pamphlet has been to distinguish between the long term and shortterm story about manufacturing. One key long-term trend is the process, sometimes called‘de-industrialisation’, by which manufacturing gradually shrinks as a proportion of totaloutput in the advanced economies. This is partly the result of another long-term trend: thetendency for productivity to grow more rapidly in the manufacturing sector than in theeconomy as a whole. The combination of the two implies that manufacturing employmentin the UK will tend to fall over the long term. We should face these trends with equanimitybut not complacency, as they are compatible with continued growth in manufacturingoutput, rising prosperity and high levels of employment in the economy as a whole. Thecrucial caveat is that this process should occur gradually, and as far as possible without anysudden and unwelcome shocks to regional employment, the current account of the balanceof payments, and high return activities such as R&D. To a great extent this requires thecontinued success of the manufacturing sector.
The recent negative experience of UK manufacturing and its short term prospects are notexplained by these long term processes. The very difficult experience of the sector in the late1990s, 2001 and 2002 is most convincingly attributed to an unfavourable sterling exchangerate from 1997 onwards. Profitability, investment and productivity are all causally related toeach other and to the exchange rate. The recent correction of the rate does not represent apanacea for the sector, but if the level of sterling in mid 2003 proves durable, or if there issome further depreciation of sterling, then this offers a basis for a more positive assessmentof the sector’s prospects than has been possible over the last few years. We can beconsiderably more up-beat about manufacturing now than when work commenced on ourresearch in early 2002.
Many of the most important policies for manufacturing industry are relevant across thewhole of the economy. Macro-economic stability and a strong competition regime arenecessary conditions for the success of the manufacturing sector, and the currentgovernment’s performance in these respects should be applauded. However, there are somesignificant imbalances in the UK economy, of which the manufacturing sector’s recentweakness has been one. One of these concerns the balance between the various categoriesof domestic expenditure. If business investment is to recover from its current levels then therate of growth of consumer spending will have to abate. Another imbalance concerns theregional distribution of manufacturing. Here the key long term challenge is to help thoseregions which remain more dependent on manufacturing make a smooth transition intohaving a more diversified economic base.
Another theme that has emerged from our analysis is the need for a period of micro-economic policy stability in many areas relevant to manufacturing. In any report of this kindthere is the temptation to present a ‘ten point plan’ listing a series of key policy changes thatwould assist the sector. That we have not done so is quite deliberate. We have, however, madesome specific policy proposals, particularly regarding the age restrictions on ModernApprenticeships, and regarding the provision of support for best practice via refocused SectorCouncils. The detailed conclusions are drawn earlier, in the sections on skills and enterpriserespectively.
60 manufacturing in the uk
4
In other areas we have been circumspect. In relation to investment, we do not see strongarguments for changing the corporate tax system. The UK arrangements are relativelyadvantageous by international standards, and changes would bring unwelcome uncertaintyfor businesses. Given the government’s ambitious public spending plans, it is hard to see howreductions in corporate taxation would be possible except with counterbalancingadjustments elsewhere in the tax system, which would generate further uncertainty. Indeed,we would urge that the corporate tax system is kept under careful review so that its benefitsare not eroded as a result of emerging fiscal pressures in the UK.
In the area of innovation, we are supportive of the recently developed R&D Tax Credit andwould now like to see a period of stability, coupled with a recognition that there is much westill do not know about innovation and that there may be long lags between changes ininnovation policy and witnessing the effects at firm level. We are also supportive of thehigher level of science spending that has been pursued in recent years, although we are keento distinguish clearly the objectives of such spending from the objectives business support.
We do not see any compelling or particularly coherent argument for a programme ofextensive de-regulation of UK labour or product markets. On the other hand, we are generallywary of crude targets and compulsion on firms in relation to business decisions over issuessuch as investment and training.
A final, important theme throughout our work has been the need for much better evaluationof business support policy instruments, whether these are aimed at investment, skills,innovation, enterprise or any other factor contributing to business success. It is simply notpossible to say with any confidence that the existing pattern of public funding is appropriate,or whether total public expenditure on business support is too low or too high. Allprogrammes of business support should be designed with robust and independent evaluationin mind. Such evaluations should make the maximum practicable use of high qualityeconometric analysis. The failure of schemes to demonstrate appropriate benefits shouldresult in their closure. Robust evaluation is not possible where schemes are substantiallyredesigned whilst they are underway, and is made more difficult where schemes are short andnumerous. We are fully supportive of the DTI reviews of business support and innovation, andhope that they will address this important issue effectively.
conclusion 61
Modern Apprenticeships
Current arrangements: central funding available only for those who start courses before trainee’s25th birthday.
Proposal: SSDA, DTI and DfES to prioritise working with SEMTA to develop proposals for lifting ofage restrictions and provision of funding.
Sector Skills Councils
Current arrangements: develop sector skills strategies, make links between employers and trainingproviders, plan for sector requirements and influence the supply of skills by provider organisations.
Proposal: refocus Sector Skills Councils as facilitators of best practice advice for firms, recognisingthat business demand for skills is derived from business needs. Remove planning role, but continueas link between employers and training providers. Route other best practice initiatives throughrenamed Sector Councils as they become well established.
references
Adams J, Robinson P and Vigor A (2003 forthcoming) A new regional policy for the UK London:Institute for Public Policy Research
Ashworth P, Hubert F, Pain N and Riley R (2001) UK Fixed Capital Formation: Determinantsand Constraints London: National Institute of Economic and Social Research
Becker B and Pain N (2003) What Determines Industrial R&D Expenditure in the UK? NIESRdiscussion paper no.210 London: National Institute of Economic and Social Research
Black S and Lynch L (2001) ‘How to compete: the impact of workplace practices andinformation technology on productivity’ The review of economics and statistics 63.3 Harvard: TheMIT Press
Bond S, Harhoff D and Van Reenen J (1999) Investment, R&D and Financial Constraints inBritain and Germany IFS Working Paper W99/5 London: Institute for Fiscal Studies
Bond S, Harrison R, Hawkins M, Klemm A and Simpson H (2003) Company taxation andinnovation policy IFS Green Budget 2003 London: Institute for Fiscal Studies
Byrne J and Davis E (2002) Investment and uncertainty in the G7 NIESR Discussion Paper 198London: National Institute of Economic and Social Research
Cabinet Office (2002) In demand: Adult skills in the 21st century Part 2 Strategy Unit ReportLondon: Cabinet Office
Cabinet Office (2001) In demand: Adult skills in the 21st century Performance and InnovationUnit Report London: Cabinet Office
Carruth A, Dickerson A and Henley A (1998) What do we know about investment underuncertainty? Studies in Economics no 9804 Canterbury: University of Kent
Chartered Institute for Personnel and Development (2001) The case for good people managementLondon: Chartered Institute for Personnel and Development
Coats D (2001) ‘Response to “Employee involvement and organisational performance”(Emmott M)’ in (ed) Burkitt N A Life’s Work London: IPPR
Criscuolo C and Haskel J (2002) Policy effects on Innovation: a preliminary note London: Centrefor Research into Business Activity
Criscuolo C and Martin R (2003) Multinationals, foreign ownership and productivity in UKbusinesses London: Centre for Research into Business Activity
Department for Education and Skills (2003) 21st Century Skills, realising our potential London:Department for Education and Skills
Department for Education and Skills (2001) Meeting the Sector Skills and Productivity ChallengeLondon: Department for Education and Skills
Department of Trade and Industry (2002) The Government’s Manufacturing Strategy London:Department of Trade and Industry
Devereux M, Griffith R and Klemm A (2002) ‘Corporate Income Tax Reforms and InternationalTax Competition’ Economic Policy 35 London: Centre for Economic Policy Research
Disney R, Haskel J and Heden Y (2000) Restructuring and Productivity Growth in UKManufacturing CEPR Discussion Paper 2463 London: Centre for Economic Policy Research
Dixit A and Pindyck R (1994) Investment Under Uncertainty Princeton: Princeton University Press
62 manufacturing in the uk
Donovan N and Halpern D (2002) Life Satisfaction: the state of knowledge and implications forgovernment London: Cabinet Office
Driver C (2002) ‘Fine words spin no yarn: capital investment in the UK’ New Economy 9.4Oxford: Blackwell
DTZ Pieda Consulting (2003) Regional Innovation Fund interim evaluation Edinburgh: DTZPieda Consulting
Emmerson C and Frayne C (2002) The Government’s Fiscal Rules IFS Briefing Note 16London: Institute for Fiscal Studies
Emmot M (2001) ‘Employee involvement and organisational performance’ in (ed) Burkitt NA Life’s Work London: IPPR
Engineering Employers’ Federation (2002) Bridging the continental divide, The EEF comparativestudy of EU and UK manufacturing productivity London: Engineering Employers’ Federation
Engineering Employers’ Federation (2001) Catching up with Uncle Sam, The EEF final report onUS and UK manufacturing productivity London: Engineering Employers’ Federation
Frankel J and Rose A (2000) Estimating the Effect of Currency Unions on Trade and OutputNBER Working Paper 7857 Cambridge MA: National Bureau of Economic Research
Green F (2001) ‘Training in work – the evidence’ (ed) Burkitt N A Life’s Work London: IPPR
Griffith R (2000) How important is business R&D for economic growth and should the Governmentsubsidise it? IFS Briefing Note 12 London: Institute for Fiscal Studies
Griffith R and Harrison R (2003) Understanding the UK’s poor technological performance IFSBriefing Note 37 London: Institute for Fiscal Studies
Griffith R, Redding S and Van Reenen J (2000) Measuring the cost effectiveness of an R&D TaxCredit for the UK London: Centre for Economic Performance
Griffith R, Redding S and Van Reenen J (2001) Mapping the Two Faces of R&D: Productivity Growthin a Panel of OECD Industries IFS Working Paper 02/00 London: Institute for Fiscal Studies
Griffith R, Redding S and Simpson H (2002) Productivity Convergence and Foreign Ownership atthe Establishment Level IFS Working Paper 02/22 London: Institute for Fiscal Studies
Griliches Z and Klette J (1998) Empirical Patterns of Firm Growth and R&D Investment: aQuality Ladder Model Interpretation University of Oslo Department of EconomicsMemorandum 23 Oslo: University of Oslo
Griliches Z (1991) The search for R&D spillovers NBER working paper 3768 Cambridge MA:Harvard University
Griliches Z (1998) R&D and Productivity: the Econometric Evidence National Bureau ofEconomic Research Monograph Chicago: University of Chicago Press
Guellec D and Van Pottelsberge B (2001) R&D and Productivity Growth: Panel Data Analysis of16 OECD Countries OECD Economic Studies Paris: Organisation for Economic Co-operationand Development
Guest D, Michie J, Sheehan M, Conway N, Metochi M (2000) Effective People ManagementLondon: Chartered Institute of Personnel and Development
Hawksworth J (2001) Long-term outlook for UK manufacturing PricewaterhouseCoopers UKEconomic Outlook October 2001 London: PricewaterhouseCoopers
HM Treasury (2002a) Budget Report 2002:The Strength to Make Long-term Decisions: investing inan enterprising, fairer Britain HC 592 London: HM Treasury
HM Treasury (2002b) Spending Review 2002:Public Service Agreements London: HM Treasury
HM Treasury (2002c) Reform of Corporation Tax Consultation London: HM Treasury
HM Treasury (2001) Budget Report 2001:Investing for the Long Term: Building Opportunity andProsperity for All HC 279 London: HM Treasury
HM Treasury (2000) Productivity in the UK: The Evidence and the Government’s ApproachLondon: HM Treasury
HM Treasury and Department of Trade and Industry (2001a) Productivity in the UK: Enterpriseand the Productivity Challenge London: HM Treasury
references 63

HM Treasury and Department of Trade and Industry (2001b) Productivity in the UK: TheRegional Dimension London: HM Treasury
Holmes M, Pentecost E and Wang P (2001) Monetary Policy Uncertainty and Economic Growthin the UK draft prepared for the WEA International’s 76th Annual Conference
Huselid M (1995) ‘The impact of human resource management practices on turnover,productivity, and corporate financial performance’ Academy of Management Journal 38.3Briacliff Manor NY: Academy of Management
Kroft K and Lloyd-Ellis H (2002) ‘Further Cross-country Evidence on the link BetweenGrowth, Volatility and Business Cycles’ under revision at the Canadian Journal of Economics
Morris B (2001) ‘Can differences in industrial structure explain divergences in regionaleconomic growth?’ Bank of England Quarterly Bulletin Summer 2001 London: Bank of England
National Institute of Economic and Social Research (2000) National Institute Economic Review172 London: SAGE
National Institute of Economic and Social Research (2003) National Institute Economic Review184 London: SAGE
Nickell S (1993) Competition and Corporate Performance CEP Discussion Paper 0182 London:Centre for Economic Performance
Nicoletti G, Scarpetta S and Boylaud O (1999) Summary Indicators of Product MarketRegulation with an extension to Employment Protection Legislation OECD Economics DepartmentWorking Paper 226 Paris: Organisation for Economic Co-operation and Development
OECD (2002) OECD Reviews of Regulatory Reform, United Kingdom: Challenges at the CuttingEdge Paris: Organisation for Economic Co-operation and Development
OECD (1999) OECD Employment Outlook 1999 Paris: Organisation for Economic Co-operation and Development
O’Mahony M (2002) ‘Productivity and convergence in the EU’ National Institute EconomicReview 180 London: SAGE
O’Mahony M and De Boer W (2002) Britain’s relative productivity performance: Updates to 1999London: National Institute of Economic and Social Research
PACEC (2001) Evaluation of Smart (including SPUR) 2001 DTI Evaluation Report Series 3Sheffield: Small Business Service
Pain N (2002) Fixed Investment in the UK: Determinants and Constraints presented at NIESRMembers Forum Meeting, June 2002 London: National Institute of Economic and SocialResearch
Pain N (2003) ‘Proceed with caution’ New Economy 10.2 Oxford: Blackwell
Piatt W and Robinson P (2001) Opportunity for whom? Options for funding and structure of post-16 education London: IPPR
Porter M and Ketels C (2003) UK Competitiveness: moving to the next stage DTI EconomicsPaper 3 London: Department of Trade and Industry
Ramey G and Ramey V (1995) ‘Cross-country Evidence on the Link between Volatility andGrowth‘ American Economic Review 85.5 Nashville: American Economic Association
Scarpetta S, Hemmings P, Tressel T and Woo J (2002) The role of policy and institutions forproductivity and firm dynamics: evidence from micro and industry data OECD Economics DepartmentWorking Paper 329 Paris: Organisation for Economic Co-operation and Development
Schumpeter J (1942) Capitalism, Socialism and Democracy
Solow R (1970) Growth Theory: An exposition Oxford: Oxford University Press
Thom R and Walsh B (2002) The effect of a currency union on trade: Lessons from the Irishexperience Dublin: University College Dublin
Tsuru K (2000) Finance and Growth: some theoretical considerations, and a review of the empiricalliterature OECD Economics Department Working Paper 228 Paris: Organisation forEconomic Co-operation and Development
64 manufacturing in the uk