manufacturing strategy incorporated in aggregate
TRANSCRIPT
Brazilian Journal of Operations & Production ManagementVolume 4, Number 1, 2007, pp. 23-37
23
Manufacturing strategy incorporated in aggregate production planning through a multi-objective linear programming model
Adiel Teixeira de Almeida Filho Universidade Federal de Pernambuco – UFPERecife, PE, BrazilE-mail: [email protected]; atalmeidafi [email protected]
Fernando Menezes Campello de Souza Universidade Federal de Pernambuco – UFPERecife, PE, BrazilE-mail: [email protected]
Adiel Teixeira de Almeida Universidade Federal de Pernambuco – UFPERecife, PE, BrazilE-mail: [email protected]
AbstractAggregate Planning activity is a relevant stage of the production planning process and has been regularly discussed in the literature for almost 50 years. It seeks to suggest a production strategy in order to meet demand, given capacity constraints. This paper presents a model based on multi criteria decision analysis to overcome the problem of aggregate planning. This decision model takes into account performance objectives obtained in the manufacturing strategy planning process. To do so, the decision maker chooses the most appropriate combination of resources to meet foreseen demand, in accordance with trade-offs amongst the performance objectives. Therefore the resulting aggregate plan refl ects the competitive factors of the business. That is, the proposed decision model allows the implementation of the manufacturing strategy by the production function.
Keywords: Aggregate Planning, Manufacturing Strategy, Multi Criteria Decision Analysis, Multiple Objective Linear Programming, Step Method.

Brazilian Journal of Operations & Production ManagementVolume 4, Number 1, 2007, pp. 23-37
24
INTRODUCTIONAggregate Planning is an important topic that has been regularly discussed in
the literature for almost 50 years. Despite several works having been published in this area, most of the models developed that consider multiple objectives only consider different kinds of production costs. Recently, some papers have used new objectives in their models of aggregate planning, by considering new criteria such as variations in manpower, the tangible and intangible costs associated with the planning alternatives, and so forth.
Recently published models for aggregate planning problem use concepts of fuzzy sets (WANG & FANG, 2001; WANG & LIANG, 2005), stochastic programming (KIRA et al., 1997), multi-objective tabu search (BAYKASOGLU, 2001), genetic algorithms and multi-objective genetic algorithms (STOCKTON et al., 2004th; STOCKTON et al. 2004b; LI & MAN, 1998) and accounting consequences of the losses in aggregated planning (PIPER & VACHON, 2001).
In spite of some authors having used a multiple criteria approach for the aggregate planning problem, no-one has sought to integrate the objectives or goals defi ned in manufacturing strategy to the objectives and strategies (aspects of manpower, stock costs, regular production regime, outsourcing regime and other intangible costs) of aggregate planning. In this paper, a multi-objective model for aggregate planning that includes the context of manufacturing strategy in the aggregate planning of production will be presented.
In order for aggregate planning to be aligned with the manufacturing strategy adopted by the company, the winning aspects of orders (performance objectives) will be optimized to increase the company s competitive advantage. So the production alternative chosen will help the production function to implement the manufacturing strategy.
In this paper, an expression (Equation 3) is proposed to quantify those winning aspects of orders. This expression will be maximized to achieve the best performance in these winning aspects, so that, in the end, it will be possible to choose a compromise solution, considering all the winning aspects, which implies best sales.
AGGREGATE PLANNINGAggregate Planning represents one of the most important decisions in the
medium term, by forming a connection between Capacity Planning and Production Programming and Control (PPC) (SLACK et al., 2003; MONKS, 1982; HEIZER & RENDER, 1993; GAITHER & FRAZIER, 1999; DAVIS et al., 2004).
Aggregate Planning consists of drawing up a strategy to meet demand. To make it feasible, several changes in production level will be necessary to follow demand
Brazilian Journal of Operations & Production ManagementVolume 4, Number 1, 2007, pp. 23-37
25
forecast in the horizon planning. This horizon planning takes place in intervals between six and twelve months in most of cases. This balancing can be undertaken by acting on the productive resources capable of infl uencing and changing production capacity in the short and very short term. It seeks to combine these productive resources in a way to meet the demand and simultaneously reach the minimum cost possible.
To keep production in balance with demand, several options are used such as hiring and fi ring employees, making use of overtime, subcontracting a part of production, accumulating stocks in the months of low demand and using them to cover excess demand in months of high demand, and so on.
However, Aggregate Planning can be used as an inverse guide, when the problem to be tackled is not a defi cit in production, but rather a defi cit in demand. In this sense, the search will be to eliminate loss-making resources, by seeking to reduce production costs so that these might be adapted to periods of insuffi cient demand.
Each one of these alternatives can be related directly and / or indirectly to a cost. In considering these costs, the models of Aggregate Planning seek a solution that minimizes the total production cost for the horizon of time over which the planning is made. To do so, an analysis is made of the costs involved in compiling a set of production alternatives to change the production levels in each period t, where these costs are represented by PCt (Production Cost in the period t). In this way, the total production cost for the n periods is:
(1)
The Production Cost in each period t includes costs that vary according to the number of employees hired/ fi red (At, Dt), the number of units stored in the stock (STt) and the number of units produced in each of the respective production regimes (Rt, Ot, St). This cost can be expressed as in Equation 2:
(2)
An Aggregate Planning solution determines the combination of each combination of production alternatives in each period such that, at the same time that production meets demand, the total production cost (PC) is minimized to the smallest possible amount.
Among the models that assume that the variation of costs is linear, the literature presents the Model of Trial and Error and the Linear Programming Model as the most well-known. Eilon (1975) presents three other models. However, the two models previously mentioned appear in the literature as the best known.
Brazilian Journal of Operations & Production ManagementVolume 4, Number 1, 2007, pp. 23-37
26
MANUFACTURING STRATEGYManufacturing strategy is defi ned in the literature as a collection of decision
models to determine structure, resources and infra-structure of a production system. However, Miller & Hayslip (1989) defi ne manufacturing strategy as a projected pattern to production alternatives made to improve results on the performance objectives and support the business strategy.
For Wheelwright (1984), the main objective of manufacturing strategy is to develop and support durable competitive advantages. Thus, an effi cacious strategy may not imply production with maximum effi ciency, but production which fi ts in with business needs. For this reason, it can be concluded that decisions made in this fi eld might consider a multi-criteria approach, because it does not make sense to consider only one single objective optimal solution (for example, Cost), but a compromise solution where all objectives which represent the business needs have been considered (which may not lead to maximum effi ciency), and all objectives have obtained the best results considering the proportional importance to business needs so that, in the end, durable competitive advantage can be achieved.
There are many concepts and classifi cations about the aspects that bring competitive advantage in manufacturing. Miller & Roth (1994) summarized and developed one taxonomy for manufacturing strategy. Miller & Roth (1994) used cluster analysis to identify eleven aspects to competitive advantage in manufacturing strategy. These aspects are Low Price, Design Flexibility, Volume Flexibility, Conformance, Product Performance, Delivery Speed, Dependability, After-Sales Service, Publicity, Broad Distribution and Broad Product Line.
Performance ObjectivesIn the literature, lists of these competitive aspects (capabilities) can generally be
summarized into fi ve performance objectives to achieve competitive advantage based on manufacturing. These objectives are Cost, Quality, Dependability, Flexibility and Speed (HILL, 1993; SLACK et al., 2003; SLACK, 1992).
As to Quality, manufacturing strategy basically seeks to improve product quality through the reduction of the non-conformance item index. Making “better products” can mean several things, from “deluxe products” and “built-in quality” discussed lately for all dimensions proposed by Garvin (1987).
The objective Speed seeks to make minimize the lead time to produce and deliver an order. To achieve good results for Speed, it is necessary to improve acquisition processes and all logistics operations. In manufacturing strategy, the speed and dynamics of releasing a new product is also related to this performance objective. This approach is considered very often in technology industry.
Brazilian Journal of Operations & Production ManagementVolume 4, Number 1, 2007, pp. 23-37
27
Dependability means the capability of the production system to estimate and accomplish order / delivery deadlines, keeping the product’s integrity until it is under the client’s responsibility.
The objective Flexibility can have many meanings like Quality, because there is a wide fi eld where fl exible capabilities are needed in a production system, so Flexibility can take into account the number of models on offer, its capability for adapting to different production levels, being able to adapt orders to special client requests and being able to handle special clients, for example. In the end, what should be expected from a good performance in Flexibility is the capability to satisfy different needs in production.
For Cost, there is only one meaning: to minimize production costs and consequently to minimize product price for customers or to maximize profi ts for the company. Maybe that is the oldest objective, or in other words, the “natural objective” of any industry. That is why, in most cases, it is one of the most important objectives in production systems.
Performance Objectives Classifi cationTo support the decisions made in a manufacturing strategy context, it is necessary
to establish the priority between the performance objectives. Hill (1993) proposed a performance objectives classifi cation which gives one easy way to prioritize these objectives, taking into account the competitive value or utility, given an improvement in each objective.
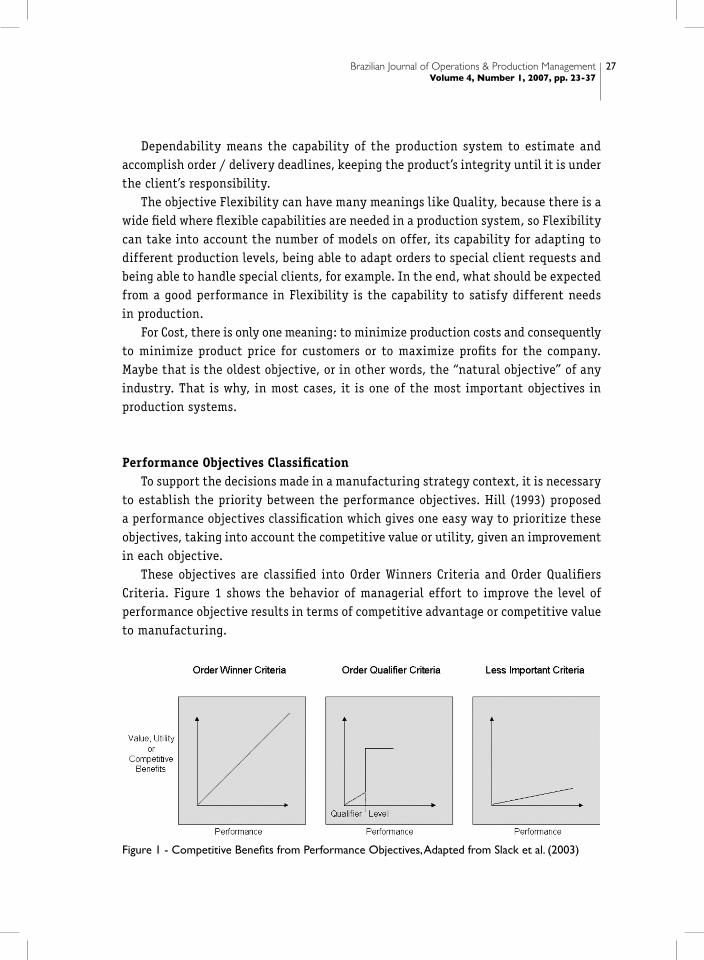
These objectives are classifi ed into Order Winners Criteria and Order Qualifi ers Criteria. Figure 1 shows the behavior of managerial effort to improve the level of performance objective results in terms of competitive advantage or competitive value to manufacturing.
Figure 1 - Competitive Benefi ts from Performance Objectives, Adapted from Slack et al. (2003)
Brazilian Journal of Operations & Production ManagementVolume 4, Number 1, 2007, pp. 23-37
28
An object is an Order Qualifi er Criterion if it has a critical level to be achieved. After satisfying this level, no improvement on this objective will be considered a competitive advantage. In other words, the customers will be satisfi ed when the manufacturing system achieves this critical level and any extra effort to give improvements in this objective will be a waste of managerial effort.
Some objectives do not have this property that makes customers satisfi ed. Each improvement in the objective will be perceived by customers and will represent competitive advantage. It can be used for resolving an evenly split outcome, making the decision favorable to the company which provides best levels for this kind of objective. So if a relevant objective follows this property, it is considered an Order Winner Criterion.
STEM – STEP METHODSTEM (Step Method) is a method of progressive reduction of the feasible region. It
was developed by Benayoun et al. (1971). This method is part of the set of interactive methods of multiple objective linear programming that is an extension of the classical model of linear programming for the case in which more than one objective function is considered.
The procedures for this method consist of ensuring that for each interaction, the decision maker specifi es an amount which he is willing to sacrifi ce in a given objective function, the one for which the decision maker is satisfi ed with the result obtained. Therefore, what is sought is to improve the result of those other functions, the values of which do not satisfy him.
The search for satisfactory solutions in STEM is made through minimizing Tchebycheff s weighted distance to the “ideal” solution. This “ideal” solution is a fi ctitious alternative represented by a solution that assumes in each objective function the optimum value of these functions when optimized. It is hard to imagine such an alternative might exist, since this combination of values becomes infeasible due to the confl icts that almost always exist when multiple objectives are considered. This is a characteristic found in multi-criteria problems.
At each iteration of the method, an optimization problem is solved, into which are incorporated the decision maker s preferences. Each one of these calculation stages refl ects the choices that the decision maker made previously, and in which the decision maker s preferences can be noticed since the feasible region has been reduced.
At the end of iteration, the decision maker fi nds a compromise solution obtained through the minimization of Tchebycheff s weighted distance to the “ideal” solution. The decision to maintain this compromise solution or to discard it is made by the decision maker, and this decision determines if another iteration should begin or if the process should fi nish.
Brazilian Journal of Operations & Production ManagementVolume 4, Number 1, 2007, pp. 23-37
29
PROPOSED MODELThe proposed model seeks to ensure that a typical problem from the context of
production planning allows the production function to implement the manufacturing strategy adopted.
A cost will associated with each alternative for meeting demand. Therefore, the proposed model seeks to fi nd a strategy for meeting demand (obtained through Aggregate Planning) that is aligned with the defi ned manufacturing strategies, with regard to the priority and the established relationships among the performance objectives.
Thus, the manager (decision maker) can undertake the planning of the resources to be used in order to meet demand by prioritizing the performance objectives that best refl ect the competitive factors of the business, and which represent consumers´ needs.
After defining the business strategy, the production managers define a manufacturing strategy so that the production function can develop the objectives and policies appropriate to their resources, by supplying the conditions necessary for allowing the company to reach its strategic objectives. Therefore, the performance objectives (HILL, 1993; SLACK, 1992) will be defi ned which will act as constraints (Order Qualifi er Criteria, the production function should always satisfy a given minimum level of performance) and the others that should be maximized or minimized through an objective function (Order Winner Criteria).
The performance objective Cost appears traditionally in Aggregate Planning models through minimizing the total cost of production.
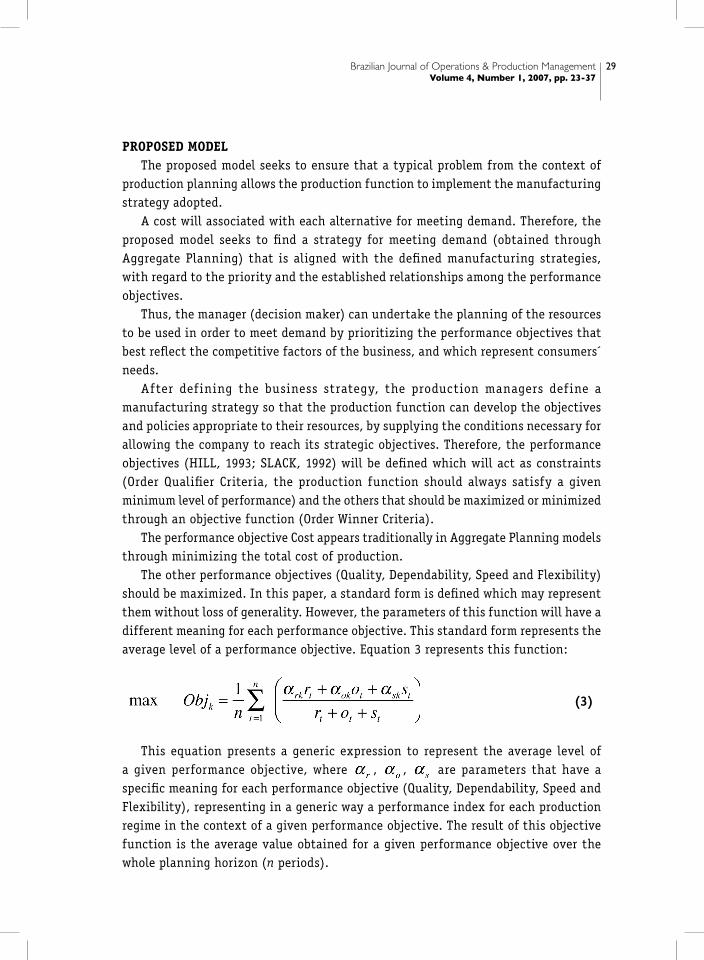
The other performance objectives (Quality, Dependability, Speed and Flexibility) should be maximized. In this paper, a standard form is defi ned which may represent them without loss of generality. However, the parameters of this function will have a different meaning for each performance objective. This standard form represents the average level of a performance objective. Equation 3 represents this function:
(3)
This equation presents a generic expression to represent the average level of a given performance objective, where , , are parameters that have a specifi c meaning for each performance objective (Quality, Dependability, Speed and Flexibility), representing in a generic way a performance index for each production regime in the context of a given performance objective. The result of this objective function is the average value obtained for a given performance objective over the whole planning horizon (n periods).

Brazilian Journal of Operations & Production ManagementVolume 4, Number 1, 2007, pp. 23-37
30
However, the expression of Equation 3 is not a linear expression, which violates the linearity hypothesis considered for the model, which leads us to a simplifi cation that guarantees linearity. Instead of using the expression suggested above, a similar expression should be used that maximizes the expression suggested previously.
(4)
This expression gives a measure of the global performance regarding the accumulated performance in the whole planning period. Through Equation 4, it is possible to use linear programming, so allowing the choice of one among the several methods of multiple objective linear programming, optimizing the global measures of the performance objectives considered, and keeping the specifi c meaning (for each performance objective) defi ned for the parameters.
The parameters , , are established through the company s knowledge regarding relative performance among different production regimes in the performance objective analyzed.
The equations below represent the proposed aggregate planning model, where the fi rst constraint represents the smallest level admitted for the Order Qualifi er Criteria.
(5)
Brazilian Journal of Operations & Production ManagementVolume 4, Number 1, 2007, pp. 23-37
31
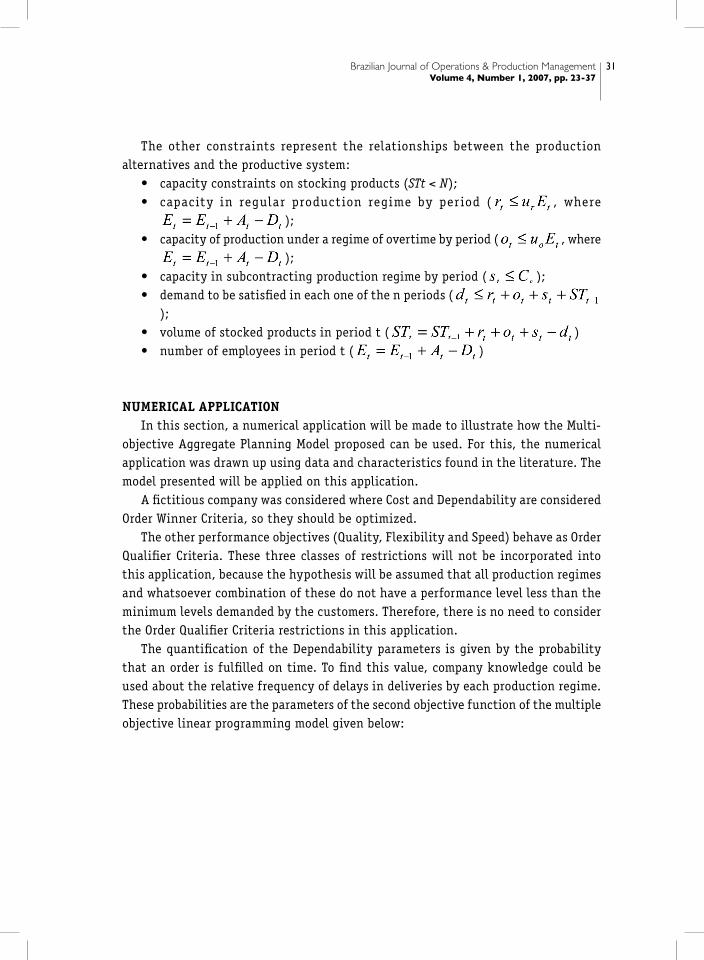
The other constraints represent the relationships between the production alternatives and the productive system:
capacity constraints on stocking products (• STt < N);capacity in regular production regime by per iod (• , where
);capacity of production under a regime of overtime by period (• , where
);capacity in subcontracting production regime by period (• );demand to be satisfi ed in each one of the n periods (• );volume of stocked products in period t (• )number of employees in period t (• )
NUMERICAL APPLICATIONIn this section, a numerical application will be made to illustrate how the Multi-
objective Aggregate Planning Model proposed can be used. For this, the numerical application was drawn up using data and characteristics found in the literature. The model presented will be applied on this application.
A fi ctitious company was considered where Cost and Dependability are considered Order Winner Criteria, so they should be optimized.
The other performance objectives (Quality, Flexibility and Speed) behave as Order Qualifi er Criteria. These three classes of restrictions will not be incorporated into this application, because the hypothesis will be assumed that all production regimes and whatsoever combination of these do not have a performance level less than the minimum levels demanded by the customers. Therefore, there is no need to consider the Order Qualifi er Criteria restrictions in this application.
The quantifi cation of the Dependability parameters is given by the probability that an order is fulfi lled on time. To fi nd this value, company knowledge could be used about the relative frequency of delays in deliveries by each production regime. These probabilities are the parameters of the second objective function of the multiple objective linear programming model given below:

Brazilian Journal of Operations & Production ManagementVolume 4, Number 1, 2007, pp. 23-37
32
where t=1,2,...,12.
(6)
The data on the problem can be visualized in the equations that comprise the model above, except for the demand foreseen which is described in table 1 below:
Table 1 – Foreseen Demand
Month (t) 1 2 3 4 5 6 7 8 9 10 11 12
Demand (d) 1200 1500 1250 1800 1350 2200 2100 2300 1580 1470 1350 1100
Several methods of multiple objective linear programming can be used to fi nd a compromise solution to this problem. However, choosing STEM is justifi ed because it is an interactive method that can be implemented easily (which adds greatly to the viability of using it) in order to minimize Tchebyneff s weighted distance to the “ideal” solution independently of the decision maker, thus leaving subjectivity only to the stage of exploring the frontier of effi cient or non-dominated solutions. During this stage, the decision maker looks for a solution to the problem by making trade-offs among the values obtained for each objective. By being about a numerical application of a fi ctitious example, only a few points will be considered in order to demonstrate how an effi cient compromise solution can be chosen for this problem through this method of multiple objective linear programming.
In order to examine the problem thoroughly, the fi rst stage of STEM consists of optimizing each one of the objective functions. The optimum value of each objective

Brazilian Journal of Operations & Production ManagementVolume 4, Number 1, 2007, pp. 23-37
33
function represents a “goal” which one desires to reach. This “goal” should be an “ideal” alternative, which has the greatest performance in all its objective functions.
The optimum found for the Cost objective function was a total annual cost of R$ 6,158,500.00. If this solution were chosen, the Dependability level would be 85.8%, i.e. an expected value of 16,490 units delivered within schedule.
When Dependability was optimized, the maximum result was 91.4% i.e. an expected value of 17.550 units delivered within schedule. To reach this performance level of Dependability, a total annual cost of R$ 6,913,600.00 is necessary. This increase of the index of Dependability is achieved due to the increase of stock levels, which provide a safety margin for the company.
In this stage, the decision problem consists of fi nding an intermediate alternative that is more balanced between the two criteria defi ned for this problem. The following stage of applying the STEM method consists of fi nding a feasible solution that minimizes Tchebycheff s weighted distance to the “ideal” alternative. The weightings used were obtained through the STEM procedure for calculating weightings. However, the alternative that minimizes Tchebycheff s weighted distance is the alternative that minimizes the total annual cost, not taking the Dependability objective into account. This is due to the fact that the variations occurring in the total annual cost are much greater than those occurring in Dependability.
Moving on to the following stage of STEM where there is interaction with the decision maker, the objective function of total annual cost was relaxed to improve the values of the objective function of Dependability that were not considered satisfactory
A decision maker could evaluate the trade-off between the losses arising from the increase of costs and the strategic earnings obtained by increasing the number of products delivered within schedule. In looking for an intermediate solution and evaluating the cost possibilities, it was arbitrated that a maximum cost of R$ 6,550,000.00 would be considered satisfactory since this promoted a performance increase in Dependability that justifi ed this cost increase.
The solution obtained by relaxing the total annual cost function was that, at a total cost of R$ 6,550,000.00, it is possible to obtain a Dependability level of 89.1%, making it viable to expect a value of 17,106 items delivered on schedule. The solution obtained for the recommendation is described in table 2 below:

Brazilian Journal of Operations & Production ManagementVolume 4, Number 1, 2007, pp. 23-37
34
Table 2 – Final solution after the relaxation of the Total CostA
ltern
ativ
es t
o A
ssis
t D
eman
d
Reg
ular
Pro
duct
ion
Reg
ime
Ove
rtim
e Pr
oduc
tion
Reg
ime
Out
sour
cing
Reg
ime
New
Em
ploy
ees’
Adm
issi
on
Empl
oyee
s’ D
ism
issa
l
Uni
ts in
Sto
ck
Num
ber
of E
mpl
oyee
s
Dem
and
Mon
th
0 - - - - - 0 8 -
1 900 300 0 2 0 0 10 1200
2 900 300 500 0 0 200 10 1500
3 900 300 600 0 0 750 10 1250
4 900 300 600 0 0 750 10 1800
5 900 300 600 0 0 1200 10 1350
6 900 300 600 0 0 800 10 2200
7 900 300 600 0 0 500 10 2100
8 900 300 600 0 0 0 10 2300
9 900 300 380 0 0 0 10 1580
10 900 300 270 0 0 0 10 1470
11 900 300 316 0 0 166 10 1350
12 900 300 600 0 0 866 10 1100
13 - - - - 0 866 10 -
This solution was considered satisfactory for illustrating the approach proposed in this paper in order to obtain a solution for Aggregate Planning Problem that is aligned with the manufacturing strategy adopted.
CONCLUDING REMARKSThis paper has presented a multicriteria decision model to tackle the problem of
Aggregate Production Planning that seeks to extend the priorities of manufacturing strategy for decision making in the context of Aggregate Production Planning. The proposed model quantifi es the performance of the production alternative chosen in the aspects considered priority ones for a manufacturing strategy.
The application of this model allows the decisions taken in Aggregate Planning context (the amount of items to be produced in each production alternative for each period of the planning horizon, the stock levels along the planning horizon and the variations in manpower so that the demand foreseen is met) to be aligned with the manufacturing strategy adopted by the company, generating results that allow the production function to offer competitive advantage to the organization.

Brazilian Journal of Operations & Production ManagementVolume 4, Number 1, 2007, pp. 23-37
35
In the numerical application, use was made of an interactive method of multiple objective linear programming that could be implemented easily, thus making it viable to solve the problem contained in Microsoft Excel. Furthermore, this problem can be solved using LINDO, GAMS or any other optimization tool.
ACKNOWLEDGMENTSThis work was partially supported by CNPQ (Brazilian Research Council).
REFERENCESBaykasoglu, A. (2001) “MOAPPS 1.0: Aggregate Production Planning Using the Multiple
Objective Tabu Search”, International Journal of Production Research, Vol. 39, pp. 3685-3702.
Benayoun, R., Montgolfi er, J., Tergny, J. and Larichev, O. (1971) “Linear Programming with Multiple Objective Functions: Step Method (STEM)”, Mathematical Programming, Vol. 1, pp. 366-375.
Davis M.M., Aquilano N.J. and Chase R.B. (2004), Fundamentals of Operations Management, McGraw-Hill Ryerson Higher Education.
Eilon, S. (1975) “Five Approaches to Aggregate Production Planning”, AIIE Transactions, Vol. 7, pp. 118-131.
Gaither N. and Frazier G. (1999), Production and Operations Management, South-Western Pub.
Garvin, D. A. (1987) “Competing on the eight dimensions of quality”, Harvard Business Review, Vol. 65, No. 6, pp. 101-9.
Heizer, J. and Render, B. (1993), Production and Operations Management: Strategies and Tactics, Prentice Hall, New Jersey.
Hill, T. (1993), Manufacturing Strategy, Ed Macmillan.Kira, D., Kusy, M. and Rakita, I. (1997) “A Stochastic Linear Programming Approach
to Hierarchical Production Planning”, Journal of the Operational Research Society, Vol. 48, pp. 207-211.
Li, Y. and Man, K. F. (1998) “Scheduling and Planning Problem in Manufacturing Systems with Multiobjective Genetic Algorithm”, In: Proceedings of the 24th Annual Conference of IEEE (IECON ´98), pp. 274-279.
Miller, J. G. and Hayslip, W. (1989) “Implementing Manufacturing Strategic Planning”, Planning Review, Vol. 17, No 4, pp.22.
Miller, J. G. and Roth, A. V. (1994) “A taxonomy of manufacturing strategies”, Management Science, Vol. 40, No 3, pp. 285-304.
Monks J. G. (1982), Operations Management, Mcgraw-Hill, 2nd Ed.

Brazilian Journal of Operations & Production ManagementVolume 4, Number 1, 2007, pp. 23-37
36
Piper, C. J. and Vachon, S. (2001) “Accounting for Productivity Losses in Aggregate Planning”, International Journal of Production Research, Vol. 39, pp. 4001-4012.
Slack, N., Chambers, S. and Johnston, R. (2003), Operations Management, Pearson Education Canada, 4th Ed.
Slack, N. (1992), The Manufacturing Advantage: Achieving Competitive Manufacturing Operations, Mercury Books.
Stockton, D. J., Quinn, L. and Khalil, R. A. (2004a) “Use of Genetic Algorithms in Operations Management Part 1: Applications”, Proceedings of the Institution of Mechanical Engineers Part B: Journal of Engineering Manufacture, Vol. 218, pp. 315-327.
Stockton, D. J., Quinn, L. and Khalil, R. A. (2004b) “Use of Genetic Algorithms in Operations Management Part 2: Results”, Proceedings of the Institution of Mechanical Engineers Part B: Journal of Engineering Manufacture, Vol. 218, pp. 329-343.
Wang, R.-C. and Fang, H.-H. (2001) “Aggregate Production Planning with Multiple Objectives in a Fuzzy Environment”, European Journal of Operational Research, Vol. 133, pp. 521-536.
Wang, R.-C. and Liang, T.-F. (2005) “Aggregate Production Planning with Multiple Fuzzy Goals”, International Journal Adv. Manufacturing Technology, Vol. 25, pp. 589-597.
Wheelwright, S. C. (1984) “Manufacturing Strategy: Defi ning the Missing Link”, Strategic Management Journal, Vol. 5, pp. 77-91.
BiographyAdiel T. de Almeida Filho received his B.Sc. degree in production engineering from
the Universidade Federal de Pernambuco (UFPE), Recife, Brazil and MSc degree in production engineering from the same (UFPE), Brazil. Currently, He is a PhD student in the same institution (UFPE). His research interests include Production Planning, Decision Analysis, Multi Criteria Decision Aid and Manufacturing Strategy.
Fernando Menezes Campello de Souza received his B.Sc. degree in electrical engineering from the Universidade Federal de Pernambuco (UFPE), Recife, Brazil and post graduation course in séction spéciale dÁutomatique from École Nationale Superieure dÉlectrotechnique, dÉlectronique, dÍnformatique, Enseeiht, France, and MSc degree in systems and computer engineering from Universidade Federal do Rio de Janeiro, Brazil and PhD in electrical engineering from Cornell University, United States. He has been a professor at the Universidade Federal de Pernambuco since 1995. His main research area is Auto Adaptive Control.
Brazilian Journal of Operations & Production ManagementVolume 4, Number 1, 2007, pp. 23-37
37
Adiel T. de Almeida is professor in the Production Engineering Department at Federal University of Pernambuco (UFPE) and director of the research group on information and decision systems (UFPE). He received his PhD degree in Management Engineering from The University of Birmingham, UK, in 1995. He received BSc and MSc degrees in engineering. His research interest includes multi-criteria decision methods, decision theory, project management, information systems, reliability, maintenance, quality, and risk management.
