mapping and assessment of urban ecosystems and...
TRANSCRIPT
Sara Maia Rocha, Grazia Zulian, Joachim Maes, Martijn Thijssen
Mapping and assessment of urban ecosystems and their services
2015
EUR 27706 EN
This publication is a Technical report by the Joint Research Centre, the European Commission’s in-house science
service. It aims to provide evidence-based scientific support to the European policy-making process. The scientific
output expressed does not imply a policy position of the European Commission. Neither the European
Commission nor any person acting on behalf of the Commission is responsible for the use which might be made
of this publication.
JRC Science Hub
https://ec.europa.eu/jrc
JRC100016
EUR 27706 EN
ISBN 978-92-79-54589-4 (PDF)
ISSN 1831-9424 (online)
doi:10.2788/638737 (online)
© European Union, 2015
Reproduction is authorised provided the source is acknowledged.
All images © European Union 2015, except: front page, Source Municipality of Padova 2015
How to cite: Sara Maia Rocha, Grazia Zulian, Joachim Maes, Martijn Thijssen; Mapping and assessment of urban
ecosystems and their services; EUR 27706 EN; doi:10.2788/638737

i
Contents Abbreviations ........................................................................................................................................ ii
Summary ............................................................................................................................................... 1
1 Introduction ................................................................................................................................... 2
1.1 Objectives of the MAES urban pilot ...................................................................................... 3
1.2 Terminology ............................................................................................................................ 3
2 Methods .......................................................................................................................................... 5
2.1 Online survey .......................................................................................................................... 5
2.2 Literature review .................................................................................................................... 7
3 Results of the survey and the literature review ......................................................................... 9
3.1 Section I of the survey: profile of the respondents ............................................................... 9
3.2 Section II of the survey: policy related questions ............................................................... 10
3.3 Section III of the survey and literature review: data collection and mapping ................. 20
3.3.1 Urban Green Infrastructure ........................................................................................... 20
3.3.2 Condition of urban ecosystems and biodiversity ........................................................... 21
3.3.3 Ecosystem services .......................................................................................................... 22
3.4 The relation between policy and scientific evidence .......................................................... 24
4 Elements for an EU wide indicator framework for mapping and assessing urban ecosystems
and their services ................................................................................................................................ 26
4.1 Mapping urban green infrastructure .................................................................................. 26
4.2 Indicators for condition of urban ecosystems and urban biodiversity .............................. 27
4.3 Indicators for urban ecosystem services ............................................................................. 29
5 Conclusions and further steps for the MAES urban pilot ........................................................ 34
References ........................................................................................................................................... 36
Annex 1. Structure and contents of the online-survey ...................................................................... 1
Annex 2. Survey and literature data on ecosystems and ecosystems services collected and
mapped .................................................................................................................................................. 6
Annex 3. List of articles used in the literature study ...................................................................... 13
Annex 4. List of indicators collected from literature review ........................................................... 17

ii
Abbreviations
CICES: Common International Classification of Ecosystem Services
CLC: Corine Land Cover; Corine means 'coordination of information on the environment'
GI Green Infrastructure
EU: European Union
JRC: Joint Research Centre of the European Commission
OECD Organisation for Economic Co-operation and Development
MAES: Mapping and Assessment of Ecosystems and their Services
UN United Nations
1
Summary
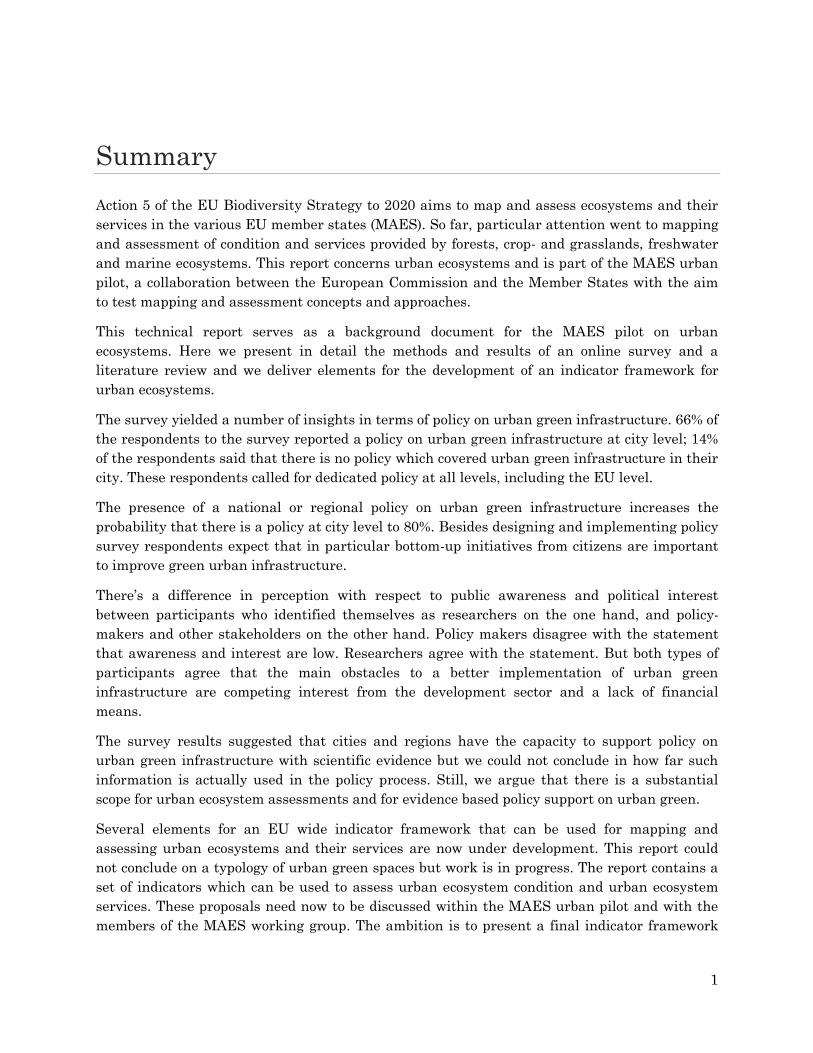
Action 5 of the EU Biodiversity Strategy to 2020 aims to map and assess ecosystems and their
services in the various EU member states (MAES). So far, particular attention went to mapping
and assessment of condition and services provided by forests, crop- and grasslands, freshwater
and marine ecosystems. This report concerns urban ecosystems and is part of the MAES urban
pilot, a collaboration between the European Commission and the Member States with the aim
to test mapping and assessment concepts and approaches.
This technical report serves as a background document for the MAES pilot on urban
ecosystems. Here we present in detail the methods and results of an online survey and a
literature review and we deliver elements for the development of an indicator framework for
urban ecosystems.
The survey yielded a number of insights in terms of policy on urban green infrastructure. 66% of
the respondents to the survey reported a policy on urban green infrastructure at city level; 14%
of the respondents said that there is no policy which covered urban green infrastructure in their
city. These respondents called for dedicated policy at all levels, including the EU level.
The presence of a national or regional policy on urban green infrastructure increases the
probability that there is a policy at city level to 80%. Besides designing and implementing policy
survey respondents expect that in particular bottom-up initiatives from citizens are important
to improve green urban infrastructure.
There’s a difference in perception with respect to public awareness and political interest
between participants who identified themselves as researchers on the one hand, and policy-
makers and other stakeholders on the other hand. Policy makers disagree with the statement
that awareness and interest are low. Researchers agree with the statement. But both types of
participants agree that the main obstacles to a better implementation of urban green
infrastructure are competing interest from the development sector and a lack of financial
means.
The survey results suggested that cities and regions have the capacity to support policy on
urban green infrastructure with scientific evidence but we could not conclude in how far such
information is actually used in the policy process. Still, we argue that there is a substantial
scope for urban ecosystem assessments and for evidence based policy support on urban green.
Several elements for an EU wide indicator framework that can be used for mapping and
assessing urban ecosystems and their services are now under development. This report could
not conclude on a typology of urban green spaces but work is in progress. The report contains a
set of indicators which can be used to assess urban ecosystem condition and urban ecosystem
services. These proposals need now to be discussed within the MAES urban pilot and with the
members of the MAES working group. The ambition is to present a final indicator framework

2
for mapping and assessment of urban ecosystems and their services in a new MAES report
which should be published in the course of 2016.
1 Introduction
Action 5 of the EU Biodiversity Strategy to 2020 aims to “Improve knowledge of ecosystems and
their services in the EU”. It calls the EU Member States, with the assistance of the
Commission, to map and assess the state of ecosystems and their services in their national
territory by 2014.
In 2014 the MAES working group provided an operational framework, addressed to Member
States, on how to map and assess the state of the ecosystems and their services. The framework
was based on the outcomes of six pilot studies: four on Europe’s main ecosystems, one on the use
of conservation status and one on natural capital accounting (Maes et al. 2014).
In these pilots EU services worked hand in hand with Member States to make a review of
national and European data and indicators to assess the condition of ecosystems, to quantify
biodiversity and to map and assess their services. The pilot studies contributed indicators,
which can be used for mapping and assessing biodiversity, ecosystem condition and ecosystem
services according to the Common International Classification of Ecosystem Services (CICES
v4.3).
Urban ecosystems were not considered in the first series of pilot studies but they are proposed
as new pilot in a second phase of the MAES work (March 2015).
The focus on the urban environment is particularly relevant in Europe: in 2010 around 320
million people lived in so called functional urban areas (OECD 2013), accounting for 65% of the
European population. Different international institutions including the OECD, the UN and the
European Commission expect this number to further increase.
Cities and artificial urbanized areas have a strong environmental impact (Newman 2006). The
high population density results in a high demand for ecosystem services including nature-based
recreation, local climate regulation or clean air (Baró et al. 2015). This demand is likely to
increase in the future; in absolute terms, as the size of cities will increase, as well as relatively
due to climate change. Urban green infrastructure improves the quality of life through urban
ecosystem services (Strohbach et al.; Haase et al. 2014; Beumer and Martens 2015; Snep et al.
2015). It may also reduce the environmental impact of cities by reducing energy demand or
increasing local food production and water storage capacity. Ecosystem services should
therefore be more systematically incorporated into urban planning and policy, to ensure a more
sustainable development (Rall et al. 2015).
This systematic incorporation requires a framework based on an integrated and
multidisciplinary research effort which includes a comprehensive involvement of stakeholders
for the translation of scientific findings into actionable knowledge (Colding et al. 2013; Haase et
al. 2014; Andersson et al. 2014a; Luederitz et al. 2015). In addition, the use of a common

3
framework should support coordination between multiple planning scales
(national/regional/urban) and should thus include scale-independent level indicators which help
understand where and how to implement policy strategies.
1.1 Objectives of the MAES urban pilot
The MAES urban pilot aims build such an operational framework for the mapping and
assessment of urban ecosystem and their services. In this framework we hereto collected
information directly from the most representative stakeholders: policy makers and researchers
who are active at a local and regional scale.
The MAES urban pilot will pinpoint the data and indicators that can be used to develop GI
policy in cities. The pilot aims to provide guidance and examples on:
1) mapping urban green infrastructure (GI);
2) mapping ecosystem conditions and services relevant for cities;
3) translation of concepts for the enhanced delivery of multiple ecosystem services into
concrete action.
The pilot study follows closely the common assessment framework presented in the second
MAES report (Maes et al. 2014) and was set up using similar working methods. Countries,
research projects and cities were invited to join the pilot. The Joint Research Centre and the
Dutch representative of the MAES working group coordinate the pilot and ensure the final
delivery.
Methodologically the pilot was divided in three parts. Firstly, an online survey was developed
which links policy on urban ecosystems and GI with data collection and indicators related to GI,
urban ecosystem conditions and services. Secondly, the set of indicators derived from this study
was complemented by a literature review. Both sources of information were the basis to draw a
framework for mapping and assessment of urban ecosystems and their services. At the same
time, as a third element, different cities were contacted to compare the proposed framework
with the implementation of policies on urban green, data and indicators on urban ecosystems
and their services in different case studies. The MAES report on urban ecosystems will describe
all these developments and include working guidance for member states on how to implement
Action 5 in urban areas.
This JRC technical report considers the first part of the pilot. Here we present in detail the
methods and results of the online survey and the literature review and we propose the indicator
framework. This report will serve as a background document for the MAES report on the pilot
on urban ecosystems that will be published in the course of 2016.
1.2 Terminology
There are many terms used to indicate urban ecosystems including urban green infrastructure,
urban green, green urban areas, or urban green spaces. Sometimes they refer to the same
concept but they target different audiences.

4
For the purpose of Action 5 and MAES we mostly use the term urban ecosystems. They are
defined as areas where most of the human population lives. Urban ecosystems represent mainly
human habitats but they usually include significant areas for synanthropic species, which are
associated with urban habitats. Urban ecosystems include urban, industrial, commercial, and
transport areas, green urban areas (urban green spaces), mines, dumping and construction
sites.
Green urban areas and urban green spaces are synonyms for urban areas which are partly or
completely covered with vegetation such as grass, shrubs or trees.
Green infrastructure is a strategically planned network of natural and semi-natural areas with
other environmental features designed and managed to deliver a wide range of ecosystem
services. It incorporates (urban) green spaces (or blue if aquatic ecosystems are concerned) and
other physical features in terrestrial (including coastal) and marine areas. On land, GI is
present in rural and urban settings.
Urban green infrastructure is the green infrastructure inside urban and peri-urban areas. But
notice that rural green infrastructure can also deliver relevant ecosystem services to urban
citizens (i.e. flood prevention) (Holt et al. 2015).
It is not always possible to clearly discriminate between these terms. But it is interesting to
keep in mind that urban ecosystems, green urban areas and urban green spaces constitute a
structural component while green infrastructure has a functional connotation. When talking
about green infrastructure, we usually think of a certain purpose that it fulfills.
In the report we also refer to urban blue infrastructure which we consider a part of the overall
urban green infrastructure.

5
2 Methods
2.1 Online survey
The survey was designed to collect information on urban ecosystems, related policies and
planning instruments. The design was made by the MAES Urban Pilot working group,
composed by representatives from the Joint Research Centre, the National Institute for Public
health and Environment (The Netherlands) and the European Commission's Directorate
General for the Environment. The survey was addressed to researchers and stakeholders in
order to gather different kind of opinions and experiences.
We developed a semi-structured questionnaire, with a few open questions and with the option to
add detailed material and auxiliary documents along the process of answering.
The questionnaire was divided in three sections; see Annex 1 for the complete list of questions:
Section I – Basic information of the interviewee;
Section II – Policy related questions;
Section III – Mapping related questions,
a) Features of urban green infrastructure,
b) Condition of the natural state of urban ecosystems,
c) Ecosystem services delivered by urban ecosystems.
The survey was administrated through an online platform and was carried on a voluntary basis.
(https://ec.europa.eu/eusurvey/runner/MAES_UrbanPilot_survey_2015).
In a first stage a group of 5 experts were invited to test a preliminary version. The final version
was launched on 01/06/2015 and closed on 30/11/2015.
Policy-makers, stakeholders and researches were invited through:
E-mailing;
Presentation of the initiative during conferences and seminars;
Personal contacts.
64 answers were submitted originating from 15 European countries and 42 cities or regions
(Figure 1). Given the substantial effort needed to complete the survey (between 1.5 and 2 hours)
we believe that this number represents a good response.

6
Figure 1. Location of case studies of the survey

7
2.2 Literature review
In addition to the survey, we performed a literature survey of articles that focus on urban
ecosystems and their services
The purpose of the literature review was to assemble information regarding methods and
indicators used to:
Map urban green infrastructure;
Assess the condition of urban ecosystems;
Measure ecosystem services delivered by urban ecosystems.
Information was collected from published scientific articles only. The following search key words
were used for a literature search using Science Direct in order to identify suitable case studies:
(i) urban AND ecosystem*, (ii) urban AND ecosystem service*, (iii) urban AND ecosystem* OR
urban AND ecosystem service* AND case stud*, (iv) urban AND green infrastructure. Generally
these terms cover the main search area of urban ecosystem services and urban green
infrastructure. Due to the interdisciplinary nature of the subject, results arose from a varied
range of scientific disciplines (ecology, geography, geology, land use planning, forestry, and
others).
After an initial screening, the resulting scientific papers were checked for relevance. The
process of selection was based on the following criteria:
Are urban ecosystem services explicitly stated?
What types of ecosystem services are studied (provisioning, regulating and maintenance,
cultural)?
What are the main objectives of the study?
Which indicators are used? (with reference to indicators and units)
In which city or region is the case study located?
54 scientific papers were selected, and they were divided in three groups:
How to map the structural elements which contribute to urban green infrastructure;
Indicators to assess ecosystem condition;
Urban ecosystem services and their indicators.
For each group we collected different types of information; Table 1 shows the structure of
collected data and Figure 2 presents the location of the case studies of the literature review.

8
Table 1: Structure of the collected data.
Topic Collected data
Urban green infrastructure
Type of green infrastructure
Indicators
Units of measure
Ecosystem condition
Urban ecosystem typology
Indicators
Output types (raster map, vector map, statistic)
Ecosystem services
Type of ecosystem service
Indicators
Output types (raster map, vector map, statistic)
Units of measure
Primary source
Figure 2. Location of the case studies derived from a review of the international
literature.

9
3 Results of the survey and the literature review
3.1 Section I of the survey: profile of the respondents
Most of the respondents were researchers (44%), followed policy makers (34%) who are involved
in the design or the implementation of policy on urban ecosystems or urban green
infrastructure. 22% of the respondents were other interested stakeholders including a national
data producer, a conservation officer, a government regulator, a forest and city public parks
manager, and a collaborator of an NGO.
The group of policy-makers included:
City administration – 14%
Management of urban parks – 6%
Head of unit of the green department -8%
Design of green urban areas – 2%
Other – 20%
No answer – 50%
Among other respondents indicated:
o Advocacy
o Enable evidence-based decision making
o Institution responsible for urban policy
o Management of urban trees
o Technician in regional environmental and land management
o Regional territorial management and planning department
o Regional administration
o Regional stakeholder
o Land use Planning
o City ecologist
o Researcher on urban agriculture
About 50% of the policy makers has been working in the current position for more than five years
(49%) and is thus considered as experienced in this matter.
When asked to the researchers about the main objectives and focuses of their studies the
majority of the respondents referred to ecosystem services management and assessment related
issues. Some examples include:
Assess inequalities in spatial distribution of urban ecosystem services;
Developing high quality urban patterns for a region under pressure considering
ecosystem services;
Assessment of the potential of green infrastructure (private and public) to provide
ecosystem services;

10
Review of available knowledge on the effectiveness of urban green infrastructure of
ecosystem services;
Design principles to optimize urban green infrastructure for a healthy city;
Development of method to map and assess ecosystem services in urban areas;
Development of indicators that enhanced expert-based assessment of ecosystem services;
Comparison of spatial data accuracy and their influence on ecosystem services
assessment;
Evaluation of current state of the ES framework implementation;
To quantify the structure of the urban forest and to estimate delivery of ecosystem
services provided by the urban forest.
3.2 Section II of the survey: policy related questions
Section II of the survey focuses on policies related to urban ecosystems in cities or regions where
the respondents are active.
Two third of the respondents affirmed that there is a policy in place at city level to improve
green urban areas. One third of the replies indicated that such policy is in place at regional
level, 32% at national level, 16% beyond the municipality delineation in cooperation with other
municipalities (inter-city), 14% reports that there is no policy in place and 2% of the
respondents didn’t answer to this question (Figure 3). In 80% of the cases where there is a
national policy, respondents also indicated a policy at city level. Similarly, in 75% of the cases
where there is a regional policy in place there is also a policy at city level.
In case of no policy in place, an additional question was posed as to which policy level should
support the implementation, enhancement and improvement of green urban areas. The results
suggest that all policy levels are relevant with equal shares assigned to different levels.
Policy on urban green area is sometimes covered by other policies or strategies so that in reality
there is a dedicated policy on green urban areas but it is perhaps less visible. Sometimes urban
areas are considered in climate planning, in environmental protection or in sustainable
development.
“For example at National level issues concerning urban green can be found in National Urban
Policy (accepted on 20th November 2015), Adaptation Plan for Sectors and Areas Sensitive to
Climate Change 2020. At regional and city level issues concerning enhancement of green areas
can be found in Environmental Protection Programs and Strategies of Development. Green areas
are planned in local planning documents (city level) such as Studies of Condition and Direction
of Development and can be protected in local plans.” (Poznan, Poland)
As to other developments which can help enhance and improve green urban areas,
44% of the respondents considered that such other initiatives should come from bottom-up
initiatives from citizens (e.g. greening the neighborhood, maintaining common gardens), 23%
attributes it to private sector initiatives (e.g. shops and business that green their surroundings

11
such as parking lots or business parks), 17% to new cooperation between private sector and
NGO’s (e.g. nature conservation organization with a company create together an urban green
space), 11% to other initiatives and 5% did not answer to this question (Figure 3)
Is there a specific policy to
enhance or improve green urban
areas in the territory for which
you work?
If there is no specific policy, on
which policy level would support
on implementation,
enhancement of improvement of
green urban areas needs to be
given?
In your opinion are there other
developments that help enhance
or improve green urban areas in
the area where you work?

12
If there is a specific policy in
place, indicate here to whom
this policy is directed or who is
involved? (multiple choice)
What type of policy instruments
are being used to enlarge or
improve green urban areas? You
can select multiple choices
Figure 3. Survey results on policies related to urban ecosystems.
Some examples were given on other helpful initiatives to improve urban green areas, such as:
Promotion of urban horticulture by municipalities;
Creation of a specific department where arborists and landscape planners are involved,
inside the city administration;
Participatory budgeting - a process of democratic deliberation and decision-making, in
which ordinary people decide how to allocate part of a municipal or public budget in
several including green areas;
Governmental activities to stimulate private actions and optimization of design of public
green spaces;
Local government launched initiatives;
Activities organized by local NGO’s such as “green guerrilla marketing campaigns,
greening local areas in vicinity of schools and fundamentally, rising public awareness
about green areas”;
Monitoring of urban species and understanding the behaviour of species in cities.

13
On the subject of policies currently in place, the respondents were asked what is the aim and
what is the issue being addressed. The policies in place support the quality of life in terms of
social function and biodiversity. Here are some examples of the purposes of the policies and
opinions:
“A green infrastructure policy was applied, the aims of which are to ensure quality
development and safeguard and enhance quality of life”;
“A set of policies is in place to develop ecological networks and avoid deterioration of
biodiversity” (West and South Yorkshire);
“In our municipality we defined a future perspective called 'the green template'. This
template is the carrier of main green and blue structures and spots. All efforts are
concentrated on realization of this template. Also we do have a landscape inspiration
book to support and inspire initiatives” (Apeldoorn, The Netherlands);
Maintaining the multi-functionality of public parks and encouragement for the social
function with the greater involvement of citizens and associations (Trieste, Italy);
“The city development goals are sustainable development of the city and enhancing urban
quality. At regional level the structural plans are related to coordinated development, and
sustainable land use. And at national level the biodiversity strategy focuses on enhancing
urban quality, habitat connectivity and conservation” (Limmattal region, Switzerland);
“Creation of ecological networks - territorial system of ecological stability” (Trnava region,
Slovakia);
“The aim of our local policy is based on how green urban spaces contribute to quality of
life, mobility grids and ecosystem services” (Oeiras, Portugal);
“Gateshead Council has a Green Infrastructure Delivery Plan in place. It contains a
strategic green infrastructure (GI) network, and a series of 'opportunity areas', which are
areas with particular potential for improving GI. It consists of a series of GI projects,
spread across the borough”. (Gateshead borough, England)
“Lisbon´s green infrastructure program is underway since 2008. New Master Plan in
2012 had been approved and a consistent greenway´s strategy continued its progress
towards increasing 20% green areas in 10 years, focusing on more urban quality, climate
adaptation goals and urban biodiversity targets” (Lisbon, Portugal).
“Promoting access to nature, guarantee spaces to enable the population to carry out
outdoor activities that can contribute to quality of life and healthy lifestyles. In addition
to access to leisure and enjoyment, it is intended to also ensure the possibility of providing
urban gardens” (Torres Vedras, Portugal);
“The Regional Territory Management and Planning Plan establish that the
municipalities, at a local level, must identify the Municipal Ecological Network, in
accordance with the rules of the regional network of protection and environmental
enhancement” (Alentejo, Portugal);

14
“Biodiversity Action Plans are in place at national - city levels. Other planning
documents also have nature conservation requirements” (Newcastle, UK)
“To enhance urban biodiversity in various ways”;
“To ensure the maintenance of biodiversity in the city” (Helsinki, Finland);
“Green template as a framework for urban development, landscape-inspiration books for
project developers to encourage green identity of the city and rural area, compensation of
green loss, principle: every house has a garden or a green area in walking distance”
(Apeldoorn, Netherlands);
“The city of Malmö (Malmö, Sweden) has a green structure plan. Moreover, it is
developing a new green plan, as well as a strategy for urban ecosystem service provision”;
“Blue and green network development, nature development” (Brussels, Belgium);
“From several directions the quality of green urban spaces is being addressed. The
challenges to be met consist of budgetary restrictions and settings priorities in the
political agenda and the willingness of stakeholders (public, private and business) to
contribute, financially or otherwise” (The Hague, The Netherlands);
“The metropolitan areas of big cities in Europe is usually much degraded. In this case the
policy is environmental restoration and benefit for people from ecosystem services”
(Barcelona, Spain);
“Participation of inhabitants, creation of awareness for biodiversity and climate change”
(Delft, The Netherlands);
Some problems were also identified:
“Lack of public land to install new parks and lack of support from the European Union
for this purpose”.
Concerning specific policies currently applied we asked to whom the policies are directed to
or who is involved. The results show that 26% is to the municipalities, 24% to the citizens,
16% to companies, 14% to NGO’s, 10% of the respondents didn’t answer this question, 9% to
provinces or regions and only 1% answered other type of target (Figure 3) referring to
prospective developers seeking planning consent.
When asked about what kind of policy instruments are being used to enlarge or improve
green urban areas, 29% of the respondents selected information (e.g. information meeting on
the city council for citizens), 28% chose legislation (e.g. local strategy on urban green
infrastructure), 19% identified support and training (e.g. information and training sessions of
urban gardening), 14% selected subsidies (e.g. payments and incentives to purchase and plant
trees or hedges in the garden), 8% said other policy instruments and 2% replied that there is no
policy on green urban areas in their city/region (Figure 3).

15
Related to the previous question a collection of answers was gathered regarding other types of
policy instruments that are currently being applied to improve green urban areas, and here are
some examples:
Municipality's improvement of urban forests;
Development of control policies building on national planning policy guidance;
Beyond the Municipal Master Plan, there is work done in other strategic sectorial themes,
like green corridors, riparian corridors, urban reforestation and endogenous plants;
Local governments have possibility to restrict areas from built-up by enact master plans
(spatial planning tool) that can exclude land (green area or land designated for green
area) from built-up (based on Spatial Planning and Development Act).
In area of subsidies Poznan finances activities (also concerning green areas) proposed in
civic budget and also subsidize selected activities proposed in competition for realization
of public tasks.
Though there is no recognition as a policy instrument, the City Council of Porto has been
recently promoting a cycle of free public sessions with experts in urban green topics.
With respect to the main obstructions to enhance or improve green urban areas, the
respondents were asked to give their opinions on seven possible obstacles (Figure 4). The
questions on the obstacles were negatively framed which is, in hind cast, perhaps an
unfortunate choice because it complicates the interpretation.
In Figure 4 the results are reported separately for researchers and policy makers.
More researchers than policy makers believe that public awareness on the important role of
green space is low. Almost two thirds of the policy makers disagrees that there is no public
awareness on the role of urban green areas.
A similar result was observed for the question on political interest. Researchers were more
pessimistic than policy makers. Half of the researchers think that political interest in urban
green areas is low.
On possible knowledge gaps, opinions are divided over the different options and do not differ
much between researchers and policy makers.
Both researchers and policy makers agree that urban green space suffers from competing
interest, such as development projects. They also largely agree that budgets are insufficient to
develop green urban areas.
There is in both groups strong disagreement with the statement that urban green spaces have
poor reputation and that physical conditions do not allow development of more urban green
space.

16
Figure 4. Survey results on the main obstructions to enhance or improve green urban
areas.
Additionally, in the question “If other” (obstructions to improve green urban areas) other
reasons where added by the respondents. Some commented in the free text box in more detail on
previously asked questions. For example, financial restrictions are mentioned and some other
reasons were given as well, for example:
Cooperation between stakeholders – “Cities are multi-stakeholder environments, in
which cooperation in urban ecosystem enhancement is needed but difficult to organize”;
“Structure of cooperation between local authorities, NGO’s and private-public cooperation
are not enough developed”;
Political factors – “Difference between party's that develop and benefit (e.g. health
improvement by green development) private estate owners don't get enough benefits”;

17
Understanding on the role of green urban areas – “Stakeholders having a little
understanding of the importance and the role of green urban areas”; “There is not enough
knowledge about the social and environmental role of urban green spaces, specifically
regarding the importance of using and locating different typologies in order to improve
specific aspects like biodiversity and social demand”;
Lack of awareness of the benefits of green urban areas – “Lack of understanding of the
benefits / services provided by urban green spaces. Much more knowledge and hard data
are needed to convince decision makers”;
Limitations caused by land ownership – “Possibilities of activities are limited on private
land”;
Regulation – “Serious obstacles are financial consequences of planning decisions”;
“Limitations in law regulation (and gaps in law) in spatial planning system that allow
for built-up development in places that should not be built up (for examples in areas of
high ecological value, far away from existing built-up tissue etc.)”.
After giving their opinion on the obstacles to improve green urban areas, the respondents were
asked to express their point of view on what they thought what could be helpful to minimize
these obstructions (“What would in your opinion be helpful to reduce these obstructions or
what can be helpful to enhance green urban areas?”). Six main topics were identified as the
most common features or tools that can be helpful to reduce obstructions to improve green
urban areas.
Geographical planning:
Good spatial planning policy including a long term vision;
Changes in spatial planning system could improve current problems;
Urban plans that clearly define areas for housing and areas for green infrastructure;
Financial complications:
Increased investment in the care, maintenance and future use and sustainability of
urban green spaces by councils and spatial planners;
Costs of implementation and maintenance of green areas are the most important
barriers to a fast implementation;
The main obstacle to the construction and improvement of supply of green areas are
financial constraints;
Cooperation between different sectors:
The development of strategies resulting from a participatory meetings with
policymakers, stakeholders, NGOs and the public;
Cooperation with other neighbouring Municipalities in other to establish a continuum
of green spaces;
Implement the participation of the public and NGOs in the management of green
spaces;

18
Policy:
Implementation of urban ecological structure in the process of urban planning and
management;
Specific legislation and stronger regulation;
Implement a legal framework for a municipal strategy for urban green areas, allocating
specific funding to insure the full accomplishment of the main goals;
Scientific knowledge:
The involvement of expert (foresters, arborists, landscape architects) in urban areas
administration;
More accessible scientific knowledge to be applied in public administration at local
level;
More research on how to manage urban green spaces sympathetically for biodiversity,
including an understanding of how to overcome social norms in management;
Citizen participation and public awareness:
Citizen participation programs for improvement of green areas and campaigns to
promote activities in green spaces;
Improve the awareness of the importance of public green for the quality of life in urban
environments and the protection of public health;
More awareness rising among public and decision-makers.
The last question of the survey, related to expectations, allowed us to understand the
prospects of the respondents regarding the delivery of the MAES Pilot on Urban Ecosystems.
Generally all of the proposals were almost equally accepted, with a slight preference for:
Scientific information about indicators to map and assess urban ecosystem services and
their services (27%),
Ready to use models to calculate benefits of urban green infrastructure (20%);
Elements of communication about policies on green urban areas or green infrastructure
(19%),
A list of measures that can be taken to improve green urban areas (16%);
Success stories (15%);
Other expectations (3%).
Other thoughts were suggested including guidance on sources of funding and financial
encouragement, guidelines for improving and maintaining green urban spaces. The design of an
evaluation tool on how to integrate ecosystem services maps into decision-making processes was
also suggested. In order to set priorities for action in countries with little development in this
field, a comparison of heterogeneity in urban ecosystem assessments across Europe was
suggested, as well as a set of common indicators to evaluate and compare different
performances and establishing common goals concerning local policies. The creation of a
European network to enhance knowledge and communication between cities was also

19
recommended to facilitate partnerships and mutual support in addressing issues related with
urban ecosystems.

20
3.3 Section III of the survey and literature review: data
collection and mapping
The aim of the third section of the survey was to collect information on:
The features of the urban areas which constitute the urban green infrastructure (i.e.:
street trees, green roofs, urban parks, gardens, green belts, rivers, etc.) and the type of
information regarding those features;
Indicators that are currently being used to measure and monitor the condition of the
urban ecosystems and biodiversity;
Indicators that are currently being used to measure ecosystem services.
A complete list of data and indicators is presented in Annex 2.
The third section has been integrated with information collected through the literature review
(the list of papers selected is available in Annex 3; the complete list of data and indicators is
presented in Annex 4).
A general observation was that the participants of the survey contributed particularly
indicators for ecosystem condition and ecosystem services. However, the section where
participants could fill in the (spatial) features of urban green infrastructure appeared to be
more difficult. Perhaps the information to complete the table was unclear or too technical. Some
participants contributed indicators for ecosystem services (e.g. tree carbon) hereby focusing on
the functional aspect of urban green infrastructure while we actually wanted to collect
information on the structural components of urban green infrastructure.
In any case, it demonstrates the need for clear definitions and for distinguishing between
structure and function, which is not always easy for researchers and policy makers.
3.3.1 Urban Green Infrastructure
In the survey participants were asked what features of urban ecosystems are mapped and what
kinds of data are used for mapping. This part of the survey did not deliver the wanted
information. As explained above, the question allowed perhaps for multiple interpretations. The
list of answers in Annex 2 suggests that we probably did not use the correct terminology either.
Under features, participants typically included structural components of urban green
infrastructure such as street trees, green areas, green roofs and walls, urban gardens and
parks. When asked for the data used to map these components, participants typically listed
indicators used to assess biodiversity, condition or ecosystem services.

21
3.3.2 Condition of urban ecosystems and biodiversity
Regarding the condition and biodiversity of urban ecosystems the findings of both the survey
and the literature review are reasonably similar, differing only to a certain extent in the detail
of the information collected. However, ultimately, both reflect the same knowledge.
From the outcomes of this section it seems that the information gathered from the survey has a
higher level of detail and contains more specifics, compared to the literature review results.
This is probably due to the level of familiarity of the respondents of the survey within their local
administrative areas on the subject and the result of the application of urban planning policies
regarding biodiversity and ecosystem state standards.
The indicators collected from both the survey and the literature review were studied and
grouped in three sets. For condition the indicators are presented by:
Drivers and pressures;
State;
Biodiversity.
The complete tables with the indicators and units can be found in Annex 4.
From the specific outcomes of the survey, 37% of the total indicators are from biodiversity
related indicators, 34% are from ecosystems state and 29% from drivers and pressures (Figure
5). While from the literature review, 50% are indicators of drivers and pressures, 33% of
biodiversity indicators and 17% of ecosystems state indicators (Figure 5).
Figure 5: Condition of urban ecosystems and biodiversity indicators obtained from the
overall study (literature review and survey).

22
3.3.3 Ecosystem services
Regarding ecosystem services our results confirm previous comprehensive literature reviews for
what concerns the types of ecosystem services considered in urban areas (Carvell et al. 2012;
Gómez-Baggethun et al. 2013; Hernandez-Morcillo et al. 2013; Haase et al. 2014; Luederitz et
al. 2015). The choice of the service to be assessed is determined by data availability and policy
or research objectives. 60% of the reported indicators referred to regulating services.
Provisioning and cultural services accounted for 20 % each.
Figure 7 provides more detail on the importance of particular urban ecosystem services as can
be derived from their occurrence in both studies.
More than 30 % of the indicators reported for regulating services refer to the micro and regional
climate regulation class. The majority of the indicators reported for cultural ecosystem services
are related to recreation. This is, indeed, the cultural ES easier to be mapped and quantified
(Andersson et al. 2014; La Rosa et al. 2015; Wolff et al. 2015). As for provisioning services,
timber is most frequently mentioned. In CICES, timber is classified under fibers and other
materials from plants, algae and animals for direct use or processing.

23
Figure 6. Ecosystem services types (%) reported in the literature review and the online
survey using CICES classes as classification.
24
3.4 The relation between policy and scientific evidence
The survey was not really designed to conclude if and how scientific evidence including maps,
data and indicators were used to support policy on urban green infrastructure. Still, we can link
sections 2 and 3 of the survey. We simply cross tabulated the presence or absence of a policy
(asked for in section 2) with the submission of data and indicators in section 3. We did this
exercise using the location of the study site to join both pieces of information since sometimes
the survey was completed by different persons.
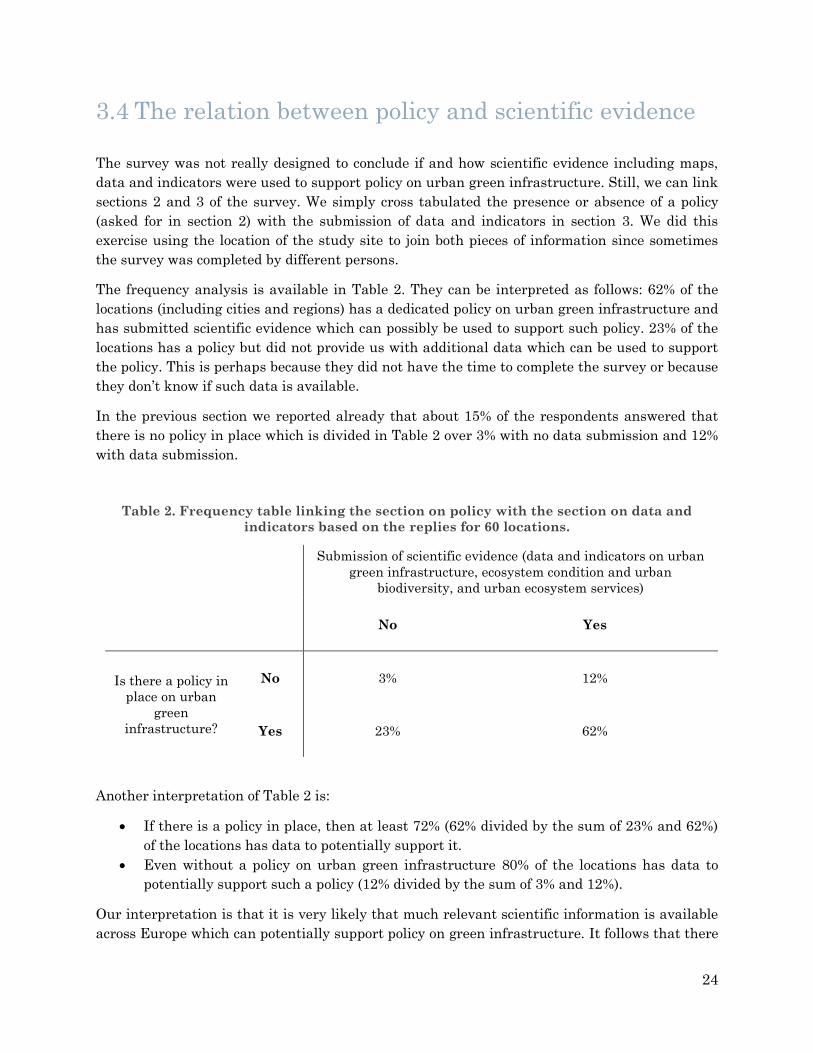
The frequency analysis is available in Table 2. They can be interpreted as follows: 62% of the
locations (including cities and regions) has a dedicated policy on urban green infrastructure and
has submitted scientific evidence which can possibly be used to support such policy. 23% of the
locations has a policy but did not provide us with additional data which can be used to support
the policy. This is perhaps because they did not have the time to complete the survey or because
they don’t know if such data is available.
In the previous section we reported already that about 15% of the respondents answered that
there is no policy in place which is divided in Table 2 over 3% with no data submission and 12%
with data submission.
Table 2. Frequency table linking the section on policy with the section on data and
indicators based on the replies for 60 locations.
Submission of scientific evidence (data and indicators on urban
green infrastructure, ecosystem condition and urban
biodiversity, and urban ecosystem services)
No Yes
Is there a policy in
place on urban
green
infrastructure?
No 3% 12%
Yes 23% 62%
Another interpretation of Table 2 is:
If there is a policy in place, then at least 72% (62% divided by the sum of 23% and 62%)
of the locations has data to potentially support it.
Even without a policy on urban green infrastructure 80% of the locations has data to
potentially support such a policy (12% divided by the sum of 3% and 12%).
Our interpretation is that it is very likely that much relevant scientific information is available
across Europe which can potentially support policy on green infrastructure. It follows that there

25
is probably much scope for urban ecosystem assessments in Europe as well as for evidence
based policy support on urban green infrastructure. However, it is also possible and likely that
data sources and scientific information is scattered and thus not always available where it is
needed most (although we cannot base this statement on the survey results).
We also realize that the results are probably biased towards positive couples in the survey (yes,
yes) as we may not have reached a sufficient number of respondents who have nothing to report
(only 3% of no, no couples).

26
4 Elements for an EU wide indicator framework
for mapping and assessing urban ecosystems
and their services
Based on the outcome of the survey and the literature research we list here a number of
elements which will be used to construct a framework for mapping and assessment of urban
ecosystems and their services which can be used at EU level.
Following the common assessment framework for the ecosystem pilots, also this indicator
framework should contain three components: mapping urban green infrastructure, assessing
the condition of urban ecosystems based on indicators for pressure, state and biodiversity, and
assessing the delivery of ecosystem services using the CICES typology for reporting.
A next step will be to finalize the framework based on these elements and report in the MAES
report on urban ecosystems which will be prepared during the course of 2016.
4.1 Mapping urban green infrastructure
Urban green infrastructure (GI) is composed of various types of different features, which may
function at different scales and levels delivering ecosystem services, depending on their degree
of complexity.
Recently, the GreenSurge project, funded under the 7th framework program for research, has
proposed a typology of urban green spaces1. This typology may be useful for the purposes of
MAES, but also for natural capital accounting which requires a detailed mapping of such green
spaces. But there is a need to align it with the MAES typologies on ecosystems and ecosystem.
This work still needs to be done during 2016.
Therefore we opted not to present a typology for mapping in this report but prepare one for the
MAES working group meetings of 2016.
1 http://greensurge.eu/working-packages/wp3/files/D3.1_Typology_of_urban_green_spaces_1_.pdf

27
4.2 Indicators for condition of urban ecosystems and
urban biodiversity
At EU level the assessment of urban ecosystem condition is based on the knowledge regarding
drivers, which can be direct (overexploitation of natural resources and urban growth and
sprawl) or indirect (sustainability policies and geopolitical drivers), as well as pressures such as
land use change, pollution and climate change. By combining both drivers and pressures
information and their resulting impacts on the function and composition of the urban
environment it is possible to successfully assess ecosystems condition.
The proposed list of indicators to assess condition and biodiversity of urban ecosystems aims at
delivering a concise and coherent approach to assess condition across EU. Although the
presented work seeks to provide a common framework at EU level, differences at national and
regional level may occur due to specific drivers and pressures and particular urban planning
regulations and limitations.
Table 3 provides indicators to assess condition of urban ecosystems. They have been classified in
three categories:
Urban green areas, linear elements and trees;
Urban and peri-urban agriculture;
Urban blue infrastructure.

28
Table 3. Indicators to assess condition and biodiversity of urban ecosystems. Indicators
for condition have different colors codes which indicate if they relate to urban green
infrastructure (●) or to urban blue infrastructure (●).
Blue/Green
structure
Condition Biodiversity
Drivers and pressures State
Urban green areas,
linear elements and
trees
● Land use change
● Land take intensity
● Land use intensity
● Urban sprawl
● Population density
● Road density
● Concentration of Air
pollutants (NO2, PM10
and PM2.5)
● Proportion of
natural areas*
● Proportion of
protected natural
areas*
● Urban forest
pattern indicators :
connectivity,
morphology, habitat
fragmentation
● Trees damage
indicators
Presence /
Abundance of
selected species
(country/zone
specific)
Presence /
Abundance of
Species of
conservation
interest
(country/zone
specific)
(see Red List Index
for European
species)
Urban and peri-
urban agriculture2
● Soil sealing
● Consumption of
pesticides (AEI 17)
● Mineral fertilisers
consumption (AEI 5)
● Irrigation (AEI 7)
● Gross nitrogen balance
(AEI 15)
● Ammonia emissions
(AEI 18)
● GHG emissions (AEI
19)
● Degree of
fragmentation
● Isolated patches
● Presence of
landscape features
● Proportion of
protected areas (i.e.
NATURA2000)
● Organic farming
(AEI 4)
Presence /
Abundance of
selected species
(country/zone
specific)
Presence /
Abundance of
Species of
conservation
interest
(country/zone
specific)
(see Red List Index
for European
species)
2 Examples refer to the Glossary of Agri-environmental indicators (AEI)
http://ec.europa.eu/eurostat/statistics-explained/index.php/Glossary:Agri-
environmental_indicator_(AEI)

29
Inland freshwater
(rivers and lakes)
and marine
ecosystems
● Concentration of water
pollutants
● Modification of river
system
● Ecological status
(WFD)
● Environmental
status (MSFD)
Specific indicators
to assess the
ecological status
(WFD Annex V,
Table 1.1,)
*from CBI (https://www.cbd.int/doc/meetings/city/subws-2014-01/other/subws-2014-01-
singapore-index-manual-en.pdf)
4.3 Indicators for urban ecosystem services
The purpose of this section is to provide a guideline for classification and development of
indicators of urban ecosystem services.
Using the literature review and the analysis of the survey we identified the most important and
used classes of ES for provisioning, regulating/maintenance and cultural services. They are
described in Table 4, Table 5 and Table 6. Alongside the indicators suggested, they are
identified as supply or demand type of indicators, and the units of measured and the scale
(regional and/or urban level) are also presented.
Information regarding supply and demand is specified for each indicator: ● supply ● demand.
We also specify an Extent, that is the boundary to be used for the computation of indicators or
models (i.e. Regional refers to the NUTS 3 boundary, Urban refers to the Municipality). The
level of details of indicators depends on the data availability.
Table 4: Indicators for provisioning services provided by urban ecosystems
Division Group Class Indicators Units Extent
Nu
trit
ion
Bio
mass
Cu
ltiv
ate
d C
rop
s
● Agriculture production
● Yield
ton/ha/year;
euro/ha
Regional
● Net primary
production
ton C/ha; kJ/ha Regional
● Total area of
cultivable/ agricultural
land and orchards
ha Regional
● Harvested crops ton/ha Regional
● The ratio of gross
output value of
agriculture to GDP
% Regional
Wa
ter
Su
rfa
ce w
ate
r
for
dri
nk
ing
● Drinking water
provision
m3/ha/year Urban
● Water consumption by
sectors
m3 Urban
● Cost for unit volume of
water
euro/m3 Urban

30
Gro
un
d w
ate
r
for
dri
nk
ing
● Water consumption m3 Urban
● Drinking water
extracted
m3/ha/ year Regional
Ma
teri
als
Bio
mass
Fib
ers
an
d o
ther
ma
teri
als
from
pla
nts
, a
lga
e a
nd
an
ima
ls f
or
dir
ect
use
or
pro
cess
ing
● Amount of large and
mature trees per ha of
dense forest
ton/ ha Regional
● Harvestable amount of
wood
m3/ha/year Regional
● Timber in forest
plantations
m3/ha Regional
● No. of species of
medical value per ha;
harvestable amount
number/ha
euro/ha
(kg or ton) per
ha
Regional
● Market value of timber euro/ha Regional
Wa
ter
Su
rfa
ce w
ate
r fo
r n
on
-
dri
nk
ing p
urp
ose
s
● Cover of natural forest % Regional
● Water retention of
forest
% of runoff Regional
● Hydropower
production
kWh ha/year Regional
● Daily rainfall mm Regional
● Storm water runoff
rate
mg/L Regional
● Presence of water
bodies such as no. of
springs, ponds and
streams; no. of projects
using water
m3/ha/year Regional
Gro
un
d w
ate
r fo
r n
on
-
dri
nk
ing p
urp
ose
s
● Change in ground
water level
m Regional
● Soil water storage
capacity
mm Regional
● Soil water infiltration
capacity
cm/h Regional
● Ground water recharge
rate
m3/ ha Regional
● Water consumption by
sectors
m3 Urban

31
Table 5. Indicators for regulating and maintenance services delivered by urban
ecosystems
Division Group Class Indicators Units Extent
Me
dia
tio
n o
f
wa
ste
, to
xic
s
an
d o
the
r
nu
isa
nce
s
Me
dia
tio
n b
y
eco
sy
ste
ms
Fil
tra
tio
n/s
eq
ue
str
ati
on
/
sto
ra
ge
/
accu
mu
lati
on
by
eco
sy
ste
ms ● Carbon stored in vegetation
and soil
kg/ha
/year
Regional
● Amount of carbon stored in
the tree canopies
ton/ha Regional
● Pollutants removed by trees
and shrubs (PM10 and PM2.5,
SO2, NO2, CO, O3, CO2)
ton
/ha/year
Regional
Me
dia
tio
n o
f fl
ow
s
Liq
uid
flo
ws
Hy
dro
log
ica
l cy
cle
an
d
wa
ter f
low
ma
inte
na
nce
● Soil water storage capacity mm Regional
● Soil water infiltration
capacity
cm/h Regional
● Cost for unit volume of water euro/m3 Regional
● Water retention capacity by
vegetation and soil
ton/km2 Regional
● Intercepted rainfall m3/ year Regional
● Surface runoff mm Regional
● Daily Rainfall mm Regional
Ma
inte
na
nce
of
ph
ysic
al,
ch
em
ica
l, b
iolo
gic
al
co
nd
itio
ns
Atm
osp
he
ric
co
mp
osit
ion
an
d c
lim
ate
re
gu
lati
on
Glo
ba
l cli
ma
te r
eg
ula
tio
n b
y r
ed
ucti
on
of
gre
en
ho
use
ga
s c
on
ce
ntr
ati
on
s
● CO2 sequestration ton/ha/
year
Regional
● CO2 tradable emission permit
value
euro/ton
CO2
Regional
● Carbon storage in soil ton C /ha Regional
● Carbon storage in vegetation
kg C/ ha Regional
● Global warming potential kg CO2/
ha/year
Urban
and
Regional
● Annual pollutant absorption
rates
kg/ha Urban
and
Regional
● Cooling by vegetation °C Regional
● Reduction of emission of
greenhouse gases
% Urban
and
Regional
Mic
ro
an
d r
eg
ion
al
cli
ma
te r
eg
ula
tio
n
● Tree shade area (urban
temperature regulation)
m2 Regional
● Tree cooling potential ton C/ha Urban
and
Regional
● Evapotranspiration Mm Regional
● Soil carbon stocks (climate
regulation)
kg/ m2 Regional
● Forest cover (Carbon
sequestration)
ton/ ha/
year
Urban
and
Regional

32
● Change in biomass (carbon
sequestration)
ton /ha Regional
● Amount of Carbon captured
by tree cover and tree biomass
ton C/ ha/
year ; ton
CO2
Urban
and
Regional
● Carbon stored in vegetation
and soil
kg/ha
/year
Urban
and
Regional
● Total area of public green
spaces
m2 Urban
and
Regional
● Biomass average growth m3/ha Urban
and
Regional
● Wood density of trees ton/m3 Regional
● Coarse and fine vegetated
area by average storage rate
Kg C/m2 Regional
● Soil area by carbon density Kg C/m2 Regional
● Dry deposition rate cm/s Regional
● Carbon footprint of the town ton CO2 Urban
● Local climate mitigating
effect
°C Urban
Table 6. Indicators for cultural services delivered by urban ecosystems
Division Group Class Indicators Units Extent
Ph
ysic
al
an
d i
nte
lle
ctu
al
inte
ra
cti
on
s
wit
h b
iota
, e
co
sy
ste
ms, a
nd
la
nd
-
/se
asca
pe
s [
en
vir
on
me
nta
l se
ttin
gs]
Ph
ysic
al
an
d e
xp
erie
nti
al
inte
ra
cti
on
s
Ex
pe
rie
nti
al
use
of
pla
nts
, a
nim
als
an
d
lan
d-/
se
asca
pe
s i
n d
iffe
re
nt
en
vir
on
me
nta
l se
ttin
gs
● Land suitable for outdoor
recreation
% Urban
and
Regional
● Number of recreation sites number Urban
and
Regional
● Proximity of green
infrastructure to green travel
routes
km Urban
● Recreation potential dimension-
less (between
0 and 1)
Regional
● Recreation opportunities qualitative Regional
● Surface of parks per
inhabitant
ha
/inhabitant
Regional
● Playgrounds for children
m2 Urban

33
● Accessibility3 to public
recreation sites
Inhabitants
within 1 km
from a public
park
Urban
and
Regional
● Spatial distribution of
runners and bikers
number of
bikers or
runners/hour
/km
Urban
● Number of visitors per year number/year Regional
● Frequency of visits to parks number/ year Urban
and
Regional
● Entry fees to parks euro Urban
and
Regional
● Number of walkers number/ha
/year
Urban
● Number of excursions and
number of visiting researchers
number/year Urban
● Density of rural tourism
establishments
number/km2 Urban
and
Regional
3 Accessibility measures can be based on: Travel cost (based on travel frictions or impediments.
Travel impediments measures can include: Physical or Network distance (also computed by
mode of transportation); Travel Time (by mode or by network status – congestion, free-flow,
etc.); Service Quality (eg. public transport frequency).
Cumulative opportunity models (Defines catchment areas by drawing one or more travel time
contours around a node, and measures the number of opportunities within each contour
(inhabitants within 1 km from a park).
Potential accessibility models (Defines catchment areas by measuring travel impediment on a
continuous scale).

34
5 Conclusions and further steps for the MAES urban
pilot
Urban policy becomes more important in the EU. The Dutch presidency (The Netherlands
presided the Council of the European Union in the first halve of 2016) will present an urban
agenda for the EU. Through the EU Urban Agenda, national governments, cities, European
institutions and other stakeholders will be working together for a sustainable, innovative and
economically powerful Europe that offers a good quality of life. The MAES urban pilot can serve
as an excellent example of how such collaboration can be set up.
This report serves as a first technical input to the MAES urban pilot and contains the necessary
elements to draft an indicator framework for the mapping and assessment of urban ecosystems
and their services. This framework should enable a consistent and harmonized assessment of
urban ecosystems at multiple spatial scales.
The survey yielded a number of insights in terms of policy on urban green infrastructure. 66% of
the respondents reported a policy on urban green infrastructure at city level; 14% of the
respondents said that there is no policy whatsoever which covered urban green infrastructure in
their city. These respondents called for dedicated policy at all levels, including the EU level. The
presence of a national or regional policy on urban green infrastructure increases the probability
that there is a policy at city level to 80%. Besides designing and implementing policy survey
respondents expect that in particular bottom-up initiatives from citizens are important to
improve green urban infrastructure. Participants who identified themselves as researchers
differed with policy-makers and other stakeholders with respect to public awareness and
political interest; in that policy makers disagree with the statement that awareness and interest
are low. But both types of survey participants agree that the main obstacles to a better
implementation of urban green infrastructure are competing interest from the development
sector and a lack of financial means.
The survey results suggested that cities and regions have the capacity to support policy on
urban green infrastructure with scientific evidence but we could not conclude in how far such
information is actually used in the policy process. Still, we argue that there is a substantial
scope for urban ecosystem assessments and for evidence based policy support on urban green.
Several elements for an EU wide indicator framework that can be used for mapping and
assessing urban ecosystems and their services are now under development. This report could
not conclude on a typology of urban green spaces but work is in progress. The report contains a
set of indicators which can be used to assess urban ecosystem condition and urban ecosystem
services. Herby we observed that indicators for condition and biodiversity are less specific than
indicators for ecosystem services. There is thus a further need to deliver condition indicators
which can effectively be monitored.
These proposals need now to be discussed within the MAES urban pilot and with the members
of the MAES working group. The ambition is to present a final indicator framework for mapping

35
and assessment of urban ecosystems and their services in a new MAES report which should be
published in the course of 2016.

36
References
Andersson E, Tengö M, McPhearson T, Kremer P (2014) Cultural ecosystem services as a gateway
for improving urban sustainability. Ecosyst Serv. doi: 10.1016/j.ecoser.2014.08.002
Carvell C, Jordan WC, Bourke AFG, et al (2012) Molecular and spatial analyses reveal links between
colony-specific foraging distance and landscape-level resource availability in two bumblebee
species. Oikos 121: 734–742.
Gómez-Baggethun E, Gren Å, Barton DN, et al (2013) Urbanization, Biodiversity and Ecosystem
Services: Challenges and Opportunities: A Global Assessment. In: Elmqvist T, Fragkias M,
Goodness J, et al. (eds). Springer Netherlands, Dordrecht, pp 175–251
Haase D, Larondelle N, Andersson E, et al (2014) A Quantitative Review of Urban Ecosystem
Service Assessments: Concepts, Models, and Implementation. Ambio 43(4): 413–433. doi:
10.1007/s13280-014-0504-0
Hernandez-Morcillo M, Plieninger T, Bieling C (2013) An empirical review of cultural ecosystem
service indicators. Ecol Indic 29: 434–444. doi: http://dx.doi.org/10.1016/j.ecolind.2013.01.013
Holt AR, Mears M, Maltby L, Warren P (2015) Understanding spatial patterns in the production of
multiple urban ecosystem services. Ecosyst Serv 16: 33–46. doi: 10.1016/j.ecoser.2015.08.007
La Rosa D, Spyra M, Inostroza L (2015) Indicators of Cultural Ecosystem Services for urban
planning: A review. Ecol Indic. doi: 10.1016/j.ecolind.2015.04.028
Luederitz C, Brink E, Gralla F, et al (2015) A review of urban ecosystem services: six key challenges
for future research. Ecosyst Serv 14: 98–112. doi: 10.1016/j.ecoser.2015.05.001
Wolff S, Schulp CJE, Verburg PH (2015) Mapping ecosystem services demand: A review of current
research and future perspectives. Ecol Indic 55: 159–171. doi: 10.1016/j.ecolind.2015.03.016

1
Annex 1. Structure and contents of the online-
survey
This part of the survey is about your role and asks for details about the location of the city,
region or country for which you can provide information
Question Structure answers dependencies mandatory
2.1 Who are you? Single
choice
1. A policy maker
2. A researcher
3. Other type of
stakeholder
YES YES
1. if a policy maker or
3. If other type of stakeholder
2.2 If other type stakeholder Open
question
NO NO
2.3
If you work as policy maker
or in a position related to the
implementation of policy,
describe your role? Single
choice
- city administration
- management of urban
parks
- head of unit of the
green department
- design of green urban
areas
- other
2.4 If other define your role Open
question //
2.5
How long have you been
engaged in this sector or how
long are you working in your
current position?
Single
choice
- Less than one year
- Between one and five
years
- More than five years
2.6 If other type of stake holder
define your role
Open
question //
2.7
What is the location for
which you will provide
information?
Open
question //
2.8
If a brochure, a document, a
publication or promotional
material is already available
on your green urban areas,
you can upload it here.
upload //
2. if a researcher
2.9
If you intend to base this
survey on a case study, what
is the name of the location?
and what were its main
objectives?
Open
question // YES NO
2.10
If your case study is
published, please cite your
study or eventually provide a
link to an online document.
upload // NO NO
2.11
If you want to share your
published work on urban
green areas (publication,
report, power point), you can
upload // NO NO

2
upload it here.
Structure of section 2: Policy-related questions. “The questions of this part relate to the policy
on urban ecosystems of the city, region or country where you are active (as stakeholders or
researcher). They are best completed by someone working in a policy department or with the
city administration. If it is more convenient to address these questions on a separate document,
then use the upload option.”
Question Structure answers dependencies mandatory
3.1
As an alternative to this
questionnaire, you can also
upload a text file which
addresses the questions on
Part 2.
upload // NO NO
3.2
Is there a specific policy to
enhance or improve green
urban areas in the territory
for which you work?
Multiple
choice
1. Yes, there is such a policy
at national level
2. Yes, there is such a policy
at regional level
3. Yes, there is such a policy
at city level
4. Yes, there is such a policy
beyond the municipality
delineation in cooperation
with other municipalities
5. No
YES NO
5. If no
3.3
If there is no specific policy,
on which policy level would
support on implementation,
enhancement of
improvement of green
urban areas need to be
given?
Multiple
choice
- European level
- National level
- Regional level
- Metropolitan level
- Local level
- On all of these levels
- Others
YES NO
3.4 If others provide an
example
Open
question // NO NO
3.5
In your opinion are
there other
developments that help
enhance or improve
green urban areas in the
area where you work?
Multiple
choice
- Bottom-up initiatives from
citizens (e.g. greening the
neighborhood, maintaining
common gardens)
- Private sector initiatives
(e.g. shops and business
that green their
surroundings such as
parking lots or business
parks)
- New cooperation between
private sector and NGO's
(e.g. a nature conservation
organization with a
company create together
an urban green space)
- Other initiatives
YES NO
3.6 If other initiatives
provide an example
Open
question // NO NO
3.7
If there is a specific policy
in place, what is the aim of
this policy or what type of
Open
question // NO NO
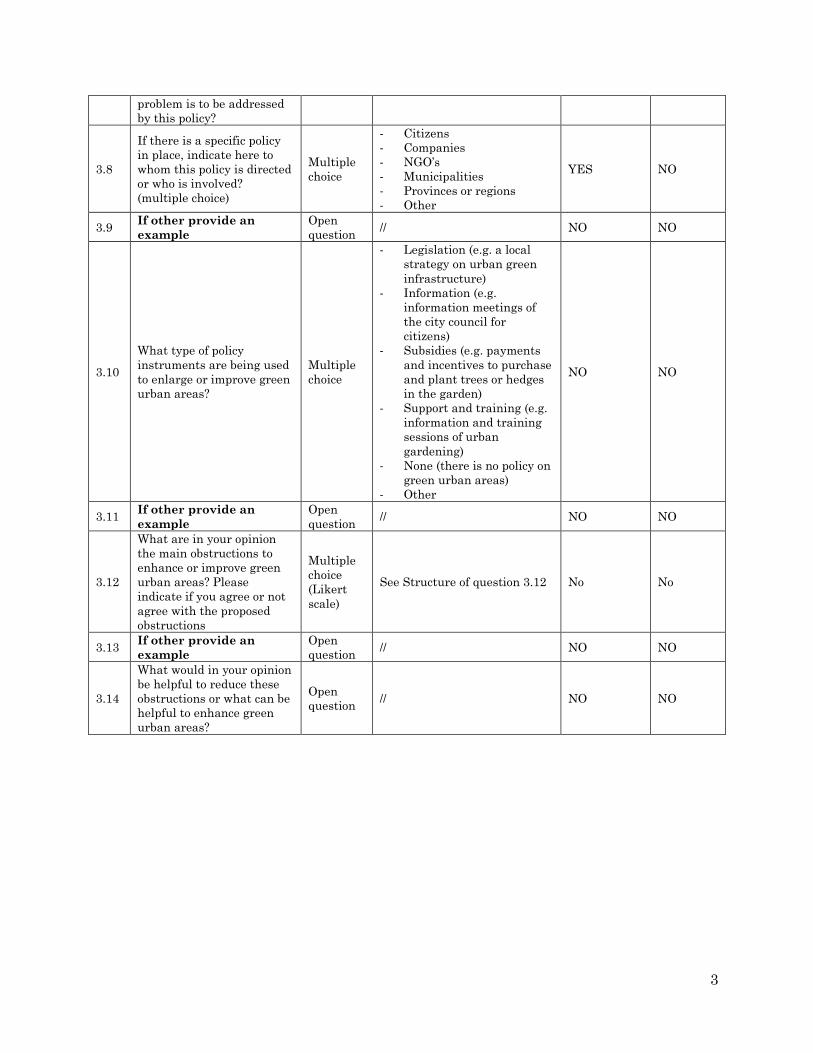
3
problem is to be addressed
by this policy?
3.8
If there is a specific policy
in place, indicate here to
whom this policy is directed
or who is involved?
(multiple choice)
Multiple
choice
- Citizens
- Companies
- NGO’s
- Municipalities
- Provinces or regions
- Other
YES NO
3.9 If other provide an
example
Open
question // NO NO
3.10
What type of policy
instruments are being used
to enlarge or improve green
urban areas?
Multiple
choice
- Legislation (e.g. a local
strategy on urban green
infrastructure)
- Information (e.g.
information meetings of
the city council for
citizens)
- Subsidies (e.g. payments
and incentives to purchase
and plant trees or hedges
in the garden)
- Support and training (e.g.
information and training
sessions of urban
gardening)
- None (there is no policy on
green urban areas)
- Other
NO NO
3.11 If other provide an
example
Open
question // NO NO
3.12
What are in your opinion
the main obstructions to
enhance or improve green
urban areas? Please
indicate if you agree or not
agree with the proposed
obstructions
Multiple
choice
(Likert
scale)
See Structure of question 3.12 No No
3.13 If other provide an
example
Open
question // NO NO
3.14
What would in your opinion
be helpful to reduce these
obstructions or what can be
helpful to enhance green
urban areas?
Open
question // NO NO

4
Structure of question 3.12
Totally
agree
Agree Neutral Disagree Totally
disagree
There is no public awareness of the
important role of green urban areas
There is no political interest in green urban
areas
There is not enough knowledge on the way
to make use of urban green space
There are competing interests (e.g. from the
private sector for housing development)
Urban green areas have a poor reputation
(or image)
The physical conditions do not permit the
development of more urban green spaces
Budget and funding restrictions
other
Structure of section 3: “Mapping urban ecosystems”
Question Structur
e
Information
asked
dependencie
s
mandator
y
4.1
In this section, we are trying to find out what are
the features of your urban area that you collect
data on (like street trees, green roofs, urban
parks, gardens, green belts, rivers), and what
type of data you collect in relation to these. We
would also like to know if you represent this data
in maps or not.
If you are collecting specific data, please provide a
list. A maximum of ten entries is foreseen. You
can also provide us with an excel table using the
upload function at the bottom of the page.
Table
multiple
See: Types
of
information
asked
regarding
the mapping
session
NO NO
4.2 As an alternative you can also upload a file (*.xls
or other formats) with the different entries. Upload // NO NO
4.3
Assessing the condition of the natural state
of urban ecosystems.
In this section, we are trying to find out what
indicators you use to measure and monitor the
state of your urban ecosystem. Such indicators
could relate to biodiversity, such as numbers of
different of birds or plants, it could related to
alien species, or pollution of groundwater, or
more detailed indicators related to your
ecosystem, such as the conditions of soil.
Examples:
- indicators that measure urban biodiversity such
as species richness of urban bird or plant
communities
- indicators that measure pressures on urban
ecosystems such as alien species occurrences,
groundwater contamination or pesticide use
- indicators that assess the state of urban
ecosystems such as fragmentation, soil
compactness or foliage damage. A maximum of
ten entries is foreseen. You can also provide us
Table
multiple
See: Types
of
information
asked
regarding
the mapping
session
NO NO
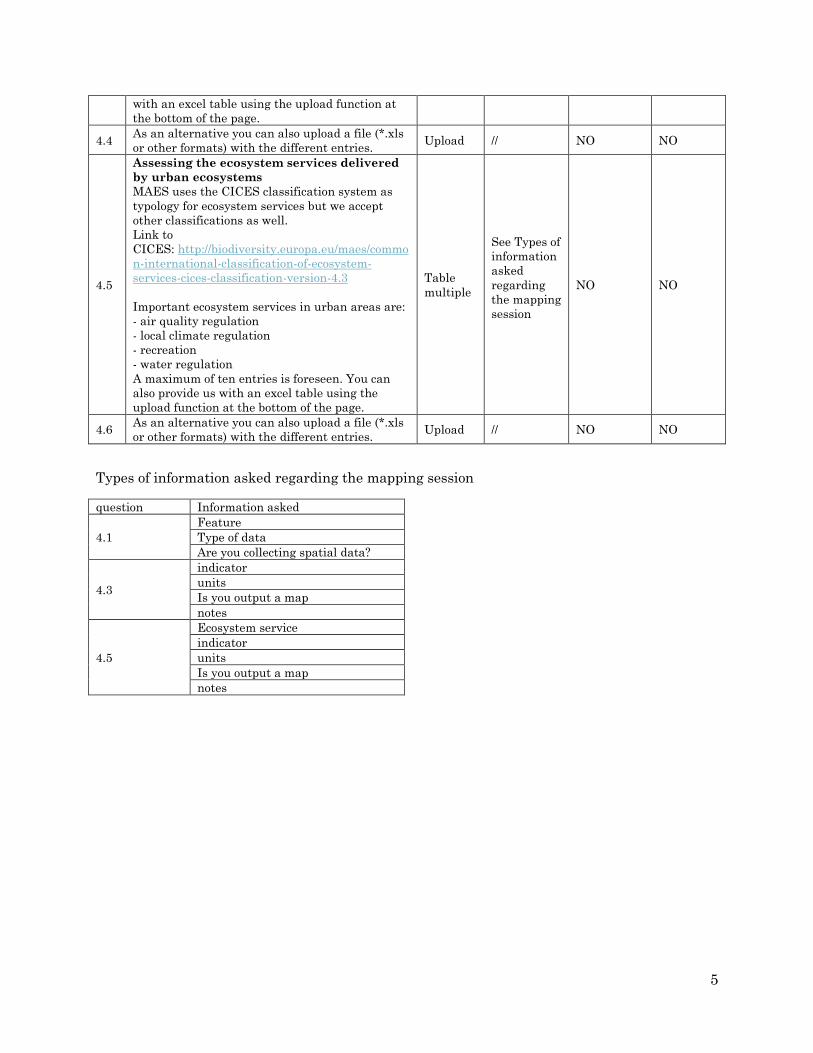
5
with an excel table using the upload function at
the bottom of the page.
4.4 As an alternative you can also upload a file (*.xls
or other formats) with the different entries. Upload // NO NO
4.5
Assessing the ecosystem services delivered
by urban ecosystems
MAES uses the CICES classification system as
typology for ecosystem services but we accept
other classifications as well.
Link to
CICES: http://biodiversity.europa.eu/maes/commo
n-international-classification-of-ecosystem-
services-cices-classification-version-4.3
Important ecosystem services in urban areas are:
- air quality regulation
- local climate regulation
- recreation
- water regulation
A maximum of ten entries is foreseen. You can
also provide us with an excel table using the
upload function at the bottom of the page.
Table
multiple
See Types of
information
asked
regarding
the mapping
session
NO NO
4.6 As an alternative you can also upload a file (*.xls
or other formats) with the different entries. Upload // NO NO
Types of information asked regarding the mapping session
question Information asked
4.1
Feature
Type of data
Are you collecting spatial data?
4.3
indicator
units
Is you output a map
notes
4.5
Ecosystem service
indicator
units
Is you output a map
notes

6
Annex 2. Survey and literature data on
ecosystems and ecosystems services collected and
mapped
Table 7. Information collected from the respondents to the survey on green
infrastructure.
Feature Type of data
Street trees
and tree
coppice
Morphological characteristics (stem perimeter, trunk size, height, type of tree well, sex);
pollination strategy; species and their variety; location; state of health of trees; type of
management; condition; geographic data; map of maintenance; tree diversity Index (Hulbert’s
Index); life form and phase; planting day; area projected to the soil by the tree coppice
Wetland Biodiversity inventory
Green areas Species; pollination strategy; sex; morphological characteristics; area and type of green space
(peri-urban park, central park, urban park, neighborhood park); national area of protected areas
and areas classified under international commitments
Urban
gardens,
Parks and
other
amenity
grassland
Number; surface area; type of management; flowering plants, pollinators and birds; plant
species diversity survey and their characteristics (also birds, amphibians, butterflies);
imperviousness change; link to hydrology; extension and type of species; furnishing elements;
number of nest boxes; presence of invasive species; type of management; tree stem perimeter;
tree height; size and frequency of maintenance; location; opening date; structural diversity
Urban
forests and
Urban
nature
reserves
Dendrometric data; remote sensing; users perception; flowering plants and pollinators
Green belts Land uses; surface and protected surface; recreation and aesthetic services; biodiversity; carbon
storage service; water flow regulation; location
Green roofs
and Walls
All physical processes involved; plant species diversity; performance of species and link to
remotely sensed data
Water bodies Water quality (pH, conductivity, organic matter, nutrients, fecal indicators); volume; uses in the
flood plains
Traffic
islands and
Road verges
Surface and type of vegetation (grass, shrub, flowers...); flowering plants and pollinators
Cemeteries Flowering plants and pollinators
Beach social
use
Relative density from high resolution satellite image
Spatial
distribution
of bikers and
walkers
From social networks and on site stratified counts
Relative
density of
ES demand
Mapping population density from different types of urbanization
Dune
response to
storms
Fieldwork
Brownfields Soil; vegetation; pollinators
Open space Land use and designations; mean nearest neighborhood distance between green infrastructure
patches (m); permeable area (%); green infrastructure edge contrast (%)

7
Recreation
areas
Location; area; type of fitness equipment; extension difficulty level of walking routes; roads,
footpaths, hiking trains and bike paths and their length; type of management;
biotic/abiotic/built features of public parks; type of play tools and condition of maintenance;
dimension of facilities
Exotic
invasive
plant species
Area, plant species
Birds Species and their diversity, conservation interest, abundance
Species Location, protection, abundance
Habitats Location, extent, condition
Autochthono
us plant
species
Number and species
Non invasive
exotic plant
species
Number, species and cultural value
Socio-
economic
strata
Socio-economic division of the city
Tree carbon Estimated C content of urban trees
Estimated
tree
decontamina
tion
potential
Estimated tree decontamination potential
Climate
sensitive
locations
and heat
stress areas
Like schools, nursery
Table 8: Indicators collected from the respondents to the survey for the assessment of
condition of the natural state of urban ecosystems
Condition
Biodiversity Drivers and
Pressures
State
Habitat
fragmentation
Ecological efficiency Species richness (Nº of
Species/surface)
Soil contaminated
(Surface (ha))
Tree health and stability status Tree diversity Index
Pesticide use (Type
and location)
Protected areas (ha) Trees species composition and
density (number of
trees/administrative unit)
Groundwater
contamination (spots
and quality)
Topography (distance from sea level) Aerial connectivity trough
coppice (ha)
Pollen emissions (Nª
pollen grains/crown
surface)
Extent of different types of green infrastructure (ha) Plant species richness (number)
Atmospheric
contamination
Condition of Local Wildlife Sites Plant abundance (number)
Air pollution (µg/m3) Soil pH (number) Tree species (Shannon/richness)
Carbon (C ton/ha) Air quality Vascular plants
(Shannon/richness)

8
Absorption pollutants
(%)
Soil contamination and former landfills Number of trees in public space
(trees for inhabitant)
Flooding (mm) Service area of green spaces (distance of residential
areas)
Number of animal and plant
species (number)
Noise Contamination
(dB)
Green typology (% cover) Population size
Nutrient reduction in
storm water (%)
Total Public Green Urban Areas (m2) Pollinator abundance (number)
Groundwater
contamination
Total of Urban Vegetable Gardens (m2) Bird abundance (number;
Shannon/richness)
Heat reduction
(degrees Celsius)
Total of Green Areas (m2) Bird species richness (number)
Susceptibility to
desertification
Share of green infrastructure (%) Mammals species (number)
Heat island effect Km of accessible green corridors (km) Reptiles species (number)
Urbanization rate (%
per year)
Historical park (area) Amphibian’s species (number)
Education rate (%
primary education)
Availability of public spaces and services (% of
inhabitants within 300 m from green spaces)
Butterflies species (number)
Political instability Spatial Ecological value Benthonic macroinvertebrates
(number)
Economic pressure
(GDP capita−1
day−1)
Insects (mainly ants) (number)
Sea level rise (%
flooded)
Surface water quality (Water Quality Index) Sparrow and swift breeding
locations (number)
Urban drainage flood
(% flooded)
Biodiversity quality Monitoring red list species
(threats)
River peak discharges
(% flooded)
Quality of the beaches Alien species occurrences
(number)
Land subsidence Regional ecological function Occurrence of endangered
species (number)
Freshwater scarcity
(% use of renewable
resource)
Conservation of priority wild species Wild plants and birds (number
of species)
Groundwater scarcity
(% use of renewable
resource)
Conservation of natural habitats Species composition alleys
(number)
Salinization and
seawater intrusion
Evolution of forest cover with native species Pollinator species richness
(number)
Flood attenuation (%) Conservation of nature and biodiversity - Integrated
area in protected areas of regional, inter-municipal
or city
Various plant-pollinator
network metrics (number)
Peak flow reduction
(%)
Water quality in bathing areas - Proportion of
bathing areas with quality acceptable or good water
face full of bathing areas
Presence of domestic predators
(on camera traps - nº
images/hour)
Storm water retention Pathogens reduction (%)
Retention capacity (m3) Biocenters (number/ area)
Biocorridor (m)

9
Table 9: Indicators for urban ecosystem services: provisioning.
Provisioning Services
Division Group Class Indicator
Nutrition Biomass Cultivated Crops
Fruit trees and potential production
(kg/ha)
Vegetables and fruits produced (kg/€
market value)
Agricultural land and orchards (ha)
Sum of agricultural areas (ha)
Materials Biomass
Fibers and other materials from
plants, algae and animals for direct
use or processing
Merchantable volume of timber (m3/ha)
Timber production (ha)
Energy
Biomass-
based energy
sources
Plant-based resources
Biofuels production (ha)
Table 10: Indicators for urban ecosystem services: regulating/maintenance.
Regulating/ Maintenance Services
Division Group Class Indicator
Mediation
of waste,
toxics and
other
nuisances
Mediation
by biota
Bio-chemical detoxification /
decomposition / mineralization in land /
soil, freshwater and marine systems
including sediments; decomposition /
detoxification of waste and toxic
materials e.g. waste water cleaning,
degrading oil spills by marine bacteria,
(phyto)degradation, (rhizo)degradation
Soil carbon content (%)
Soil carbon density and presence of
trees (ha)
Mediation
by
ecosystems
Filtration/sequestration/storage/accumul
ation by ecosystems
Pollutant removal from soil/water by
vegetation (ha)
PM10 and PM2.5 removed by trees and
shrubs (ton; Kg/ha)
SO2 removed by trees and shrubs (ton;
Kg/ha)
NO2 removed by trees and shrubs (ton;
Kg/ha)
CO removed by trees and shrubs (ton;
kg/ha)
O3 removed by trees and shrubs (ton;
kg/ha)
CO2 capture and sequestration by
vegetation (ton CO2)
Mediation of noise impacts Noise reduction by vegetation (dB)
Mediation
of flows
Mass flows Mass stabilization and control of erosion
rates
Control of erosion rates (km of sand
dunes)
Presence of green infrastructure on
surfaces prone to erosion (ha)
Liquid flows Hydrological cycle and water flow
maintenance
Fraction of the annual water flow
stored in the soil (%)
Retention capacity (m3)
Level of highest wave run-up (geocoded
points and wash over evidence)
Flooding frequency
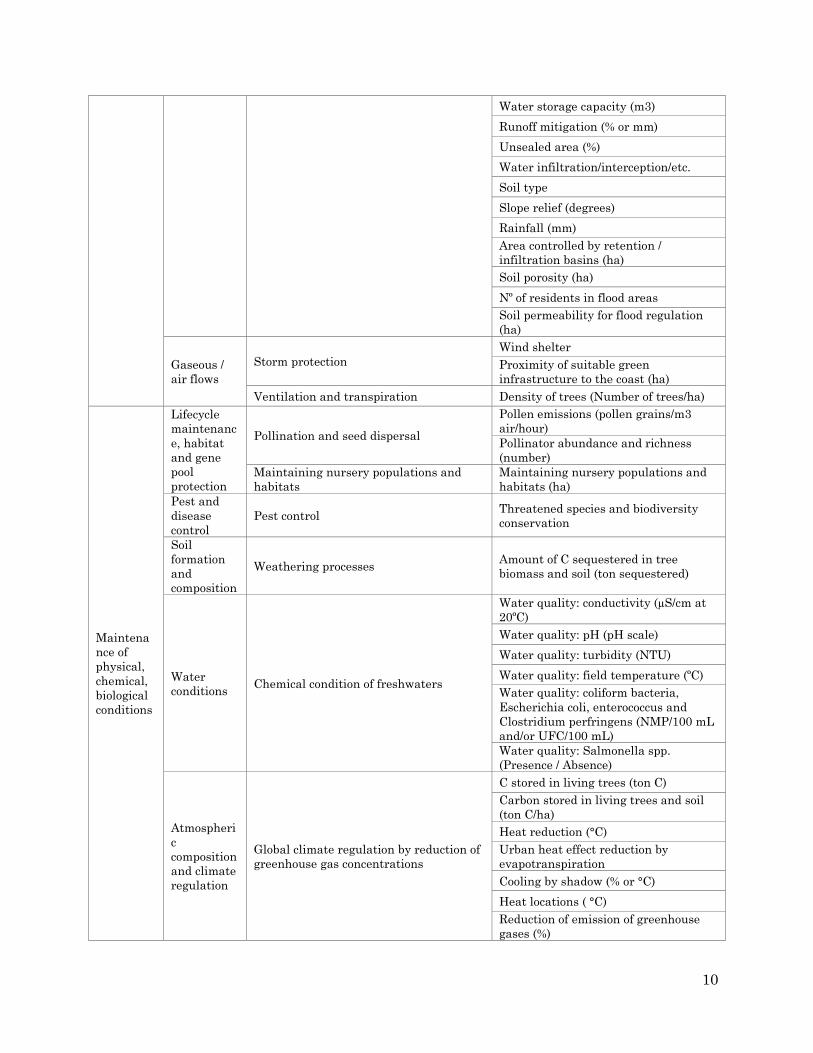
10
Water storage capacity (m3)
Runoff mitigation (% or mm)
Unsealed area (%)
Water infiltration/interception/etc.
Soil type
Slope relief (degrees)
Rainfall (mm)
Area controlled by retention /
infiltration basins (ha)
Soil porosity (ha)
Nº of residents in flood areas
Soil permeability for flood regulation
(ha)
Gaseous /
air flows
Storm protection
Wind shelter
Proximity of suitable green
infrastructure to the coast (ha)
Ventilation and transpiration Density of trees (Number of trees/ha)
Maintena
nce of
physical,
chemical,
biological
conditions
Lifecycle
maintenanc
e, habitat
and gene
pool
protection
Pollination and seed dispersal
Pollen emissions (pollen grains/m3
air/hour)
Pollinator abundance and richness
(number)
Maintaining nursery populations and
habitats
Maintaining nursery populations and
habitats (ha)
Pest and
disease
control
Pest control Threatened species and biodiversity
conservation
Soil
formation
and
composition
Weathering processes Amount of C sequestered in tree
biomass and soil (ton sequestered)
Water
conditions Chemical condition of freshwaters
Water quality: conductivity (µS/cm at
20ºC)
Water quality: pH (pH scale)
Water quality: turbidity (NTU)
Water quality: field temperature (ºC)
Water quality: coliform bacteria,
Escherichia coli, enterococcus and
Clostridium perfringens (NMP/100 mL
and/or UFC/100 mL)
Water quality: Salmonella spp.
(Presence / Absence)
Atmospheri
c
composition
and climate
regulation
Global climate regulation by reduction of
greenhouse gas concentrations
C stored in living trees (ton C)
Carbon stored in living trees and soil
(ton C/ha)
Heat reduction (°C)
Urban heat effect reduction by
evapotranspiration
Cooling by shadow (% or °C)
Heat locations ( °C)
Reduction of emission of greenhouse
gases (%)
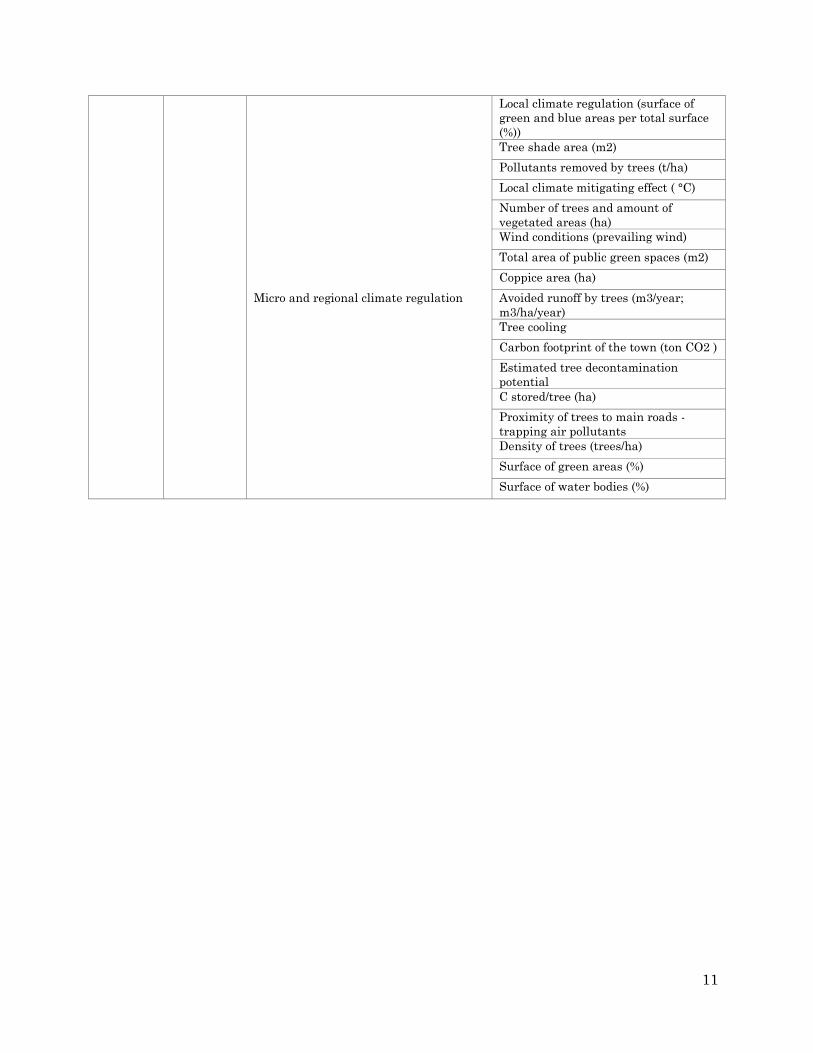
11
Micro and regional climate regulation
Local climate regulation (surface of
green and blue areas per total surface
(%))
Tree shade area (m2)
Pollutants removed by trees (t/ha)
Local climate mitigating effect ( °C)
Number of trees and amount of
vegetated areas (ha)
Wind conditions (prevailing wind)
Total area of public green spaces (m2)
Coppice area (ha)
Avoided runoff by trees (m3/year;
m3/ha/year)
Tree cooling
Carbon footprint of the town (ton CO2 )
Estimated tree decontamination
potential
C stored/tree (ha)
Proximity of trees to main roads -
trapping air pollutants
Density of trees (trees/ha)
Surface of green areas (%)
Surface of water bodies (%)

12
Table 11: Indicators for urban ecosystem services: cultural
Cultural Services
Division Group Class Indicator
Physical and
intellectual
interactions
with biota,
ecosystems,
and land-
/seascapes
Physical
and
experienti
al
interactio
ns
Experiential use of plants,
animals and land-/seascapes in
different environmental settings
Visitors rate (number of visitors per year)
Spatial distribution of runners and bikers
(nº bikers or runners/hour or per km)
Surface of parks/inhabitants
(ha/inhabitant)
Wildlife experience (number and type of
species)
Green areas (m2)
Playgrounds for children (m2)
Sports areas (m2)
Access to greens pace (distance in m)
Public and private green space (ha)
Protected areas (km2)
Demand for green spaces (users/visitor per
year)
Distance to nearest green with different
characteristics (seconds or meters to travel)
Accessibility of public and private sites (ha)
Proximity of green infrastructure to green
travel routes (ha)
Recreation potential and opportunity (1-5
scale)
Recreation opportunity
Intellectu
al and
representa
tional
interactio
ns
Educational and Scientific
Environmental education - number of
infrastructures ( Number/ inhabitant)
Number of environmental education
activities in parks (Number/ inhabitant)
Participation in green actions (Number)
Impact of green on housing values (% value
increase)
Proximity to educational establishments
(ha)
Aesthetic
Aesthetic quality (1-5 scale)
Flowering plant abundance and richness
(Number)
Opportunity to hear more natural sound -
Distance from roads (ha)
Compliance with desired landscape
character (ha)
Spiritual,
symbolic and
other
interactions
with biota,
ecosystems,
and land-
/seascapes
Spiritual
and/or
emblemati
c
Spiritual and religious values
Heritage designations (ha)
Cultural value of sites (ha)

13
Annex 3. List of articles used in the literature
study
1. Andersson E, Colding J (2014) Understanding how built urban form influences
biodiversity. Urban For Urban Green 13(2): 221–226. doi: 10.1016/j.ufug.2013.11.002
2. Angela C-B, Javier C-J, Teresa G-M, Marisa M-H (2015) Hydrological evaluation of a
peri-urban stream and its impact on ecosystem services potential. Glob Ecol Conserv 3:
628–644. doi: 10.1016/j.gecco.2015.02.008
3. Aslaksen I, Nybø S, Framstad E, et al (2015) Biodiversity and ecosystem services: The
Nature Index for Norway. Ecosyst Serv 12: 108–116. doi: 10.1016/j.ecoser.2014.11.002
4. Baró F, Haase D, Gómez-Baggethun E, Frantzeskaki N (2015) Mismatches between
ecosystem services supply and demand in urban areas: A quantitative assessment in five
European cities. Ecol Indic 55: 146–158. doi: 10.1016/j.ecolind.2015.03.013
5. Broekx S, Liekens I, Peelaerts W, et al (2013) A web application to support the
quantification and valuation of ecosystem services. Environ Impact Assess Rev 40: 65–
74. doi: 10.1016/j.eiar.2013.01.003
6. Calzolari C, Ungaro F, Filippi N, et al (2016) A methodological framework to assess the
multiple contributions of soils to ecosystem services delivery at regional scale. Geoderma
261: 190–203. doi: 10.1016/j.geoderma.2015.07.013
7. Castro AJ, Verburg PH, Martín-López B, et al (2014) Ecosystem service trade-offs from
supply to social demand: A landscape-scale spatial analysis. Landsc Urban Plan 132:
102–110. doi: 10.1016/j.landurbplan.2014.08.009
8. Colding J, Barthel S, Bendt P, et al (2013) Urban green commons: Insights on urban
common property systems. Glob Environ Chang 23(5): 1039–1051. doi:
10.1016/j.gloenvcha.2013.05.006
9. Dallimer M, Davies ZG, Diaz-porras DF, et al (2015) Historical influences on the current
provision of multiple ecosystem services. Glob Environ Chang 31: 307–317. doi:
10.1016/j.gloenvcha.2015.01.015
10. de Juan S, Gelcich S, Ospina-Alvarez A, et al (2015) Applying an ecosystem service
approach to unravel links between ecosystems and society in the coast of central Chile.
Sci Total Environ 533: 122–132. doi: 10.1016/j.scitotenv.2015.06.094
11. de Wit M, van Zyl H, Crookes D, et al (2012) Including the economic value of well-
functioning urban ecosystems in financial decisions: Evidence from a process in Cape
Town. Ecosyst Serv 2: 38–44. doi: 10.1016/j.ecoser.2012.08.002
12. Development CG (2010) Slovakia : Development of open space standards Case study
location. : 1–7.
13. Dizdaroglu D, Yigitcanlar T (2014) A parcel-scale assessment tool to measure
sustainability through urban ecosystem components: The MUSIX model. Ecol Indic 41:
115–130. doi: 10.1016/j.ecolind.2014.01.037
14. Dobbs C, Escobedo FJ, Zipperer WC (2011) A framework for developing urban forest
ecosystem services and goods indicators. Landsc Urban Plan 99: 196–206. doi:
http://dx.doi.org/10.1016/j.landurbplan.2010.11.004

14
15. Evans CD, Bonn A, Holden J, et al (2014) Relationships between anthropogenic
pressures and ecosystem functions in UK blanket bogs : Linking process understanding
to ecosystem service valuation. Ecosyst Serv 9: 5–19. doi: 10.1016/j.ecoser.2014.06.013
16. Fontana V, Radtke A, Walde J, et al (2014) What plant traits tell us: Consequences of
land-use change of a traditional agro-forest system on biodiversity and ecosystem service
provision. Agric Ecosyst Environ 186: 44–53. doi: 10.1016/j.agee.2014.01.006
17. Frélichová J, Vačkář D, Pártl A, et al (2014) Integrated assessment of ecosystem services
in the Czech Republic. Ecosyst Serv 8: 110–117. doi: 10.1016/j.ecoser.2014.03.001
18. García-Nieto AP, García-Llorente M, Iniesta-Arandia I, Martín-López B (2013) Mapping
forest ecosystem services: From providing units to beneficiaries. Ecosyst Serv 4: 126–
138. doi: 10.1016/j.ecoser.2013.03.003
19. García-Nieto AP, Quintas-Soriano C, García-Llorente M, et al (2015) Collaborative
mapping of ecosystem services: The role of stakeholders׳ profiles. Ecosyst Serv 13: 141–
152. doi: 10.1016/j.ecoser.2014.11.006
20. Grêt-Regamey A, Brunner SH, Altwegg J, Bebi P (2013a) Facing uncertainty in
ecosystem services-based resource management. J Environ Manage 127: S145–S154. doi:
10.1016/j.jenvman.2012.07.028
21. Grêt-Regamey A, Celio E, Klein TM, Wissen Hayek U (2013b) Understanding ecosystem
services trade-offs with interactive procedural modeling for sustainable urban planning.
Landsc Urban Plan 109(1): 107–116. doi: 10.1016/j.landurbplan.2012.10.011
22. Harmáčková Z V, Vačkář D (2015) Modelling regulating ecosystem services trade-offs
across landscape scenarios in Třeboňsko Wetlands Biosphere Reserve, Czech Republic.
Ecol Modell 295: 207–215. doi: 10.1016/j.ecolmodel.2014.10.003
23. Hölzinger O, Horst D Van Der, Sadler J (2014) City-wide Ecosystem Assessments-
Lessons from Birmingham. Ecosyst Serv 9: 98–105. doi: 10.1016/j.ecoser.2014.05.003
24. Hou Y, Burkhard B, Müller F (2013) Uncertainties in landscape analysis and ecosystem
service assessment. J Environ Manage 127: S117–S131. doi:
10.1016/j.jenvman.2012.12.002
25. Hou Y, Zhou S, Burkhard B, Müller F (2014) Socioeconomic influences on biodiversity,
ecosystem services and human well-being: A quantitative application of the DPSIR
model in Jiangsu, China. Sci Total Environ 490: 1012–1028. doi:
10.1016/j.scitotenv.2014.05.071
26. Jantz C a., Manuel JJ (2013) Estimating impacts of population growth and land use
policy on ecosystem services: A community-level case study in Virginia, USA. Ecosyst
Serv 5: 110–123. doi: 10.1016/j.ecoser.2013.07.005
27. Jim CY, Chen WY (2008) Assessing the ecosystem service of air pollutant removal by
urban trees in Guangzhou (China). J Environ Manage 88(4): 665–676. doi:
10.1016/j.jenvman.2007.03.035
28. Kandziora M, Burkhard B, Müller F (2013) Mapping provisioning ecosystem services at
the local scale using data of varying spatial and temporal resolution. Ecosyst Serv 4: 47–
59. doi: 10.1016/j.ecoser.2013.04.001
29. Koschke L, Fürst C, Frank S, Makeschin F (2012) A multi-criteria approach for an
integrated land-cover-based assessment of ecosystem services provision to support
landscape planning. Ecol Indic 21: 54–66. doi: 10.1016/j.ecolind.2011.12.010

15
30. Larondelle N, Haase D (2012) Valuing post-mining landscapes using an ecosystem
services approach - An example from Germany. Ecol Indic 18: 567–574. doi:
10.1016/j.ecolind.2012.01.008
31. Lauf S, Haase D, Kleinschmit B (2014) Linkages between ecosystem services
provisioning, urban growth and shrinkage - A modeling approach assessing ecosystem
service trade-offs. Ecol Indic 42: 73–94. doi: 10.1016/j.ecolind.2014.01.028
32. Löfvenhaft K, Björn C, Ihse M (2002) Biotope patterns in urban areas: A conceptual
model integrating biodiversity issues in spatial planning. Landsc Urban Plan 58(2-4):
223–240. doi: 10.1016/S0169-2046(01)00223-7
33. McPhearson T, Kremer P, Hamstead Z a. (2013) Mapping ecosystem services in New
York City: Applying a social-ecological approach in urban vacant land. Ecosyst Serv 5:
11–26. doi: 10.1016/j.ecoser.2013.06.005
34. Morri E, Pruscini F, Scolozzi R, Santolini R (2014) A forest ecosystem services
evaluation at the river basin scale: Supply and demand between coastal areas and
upstream lands (Italy). Ecol Indic 37(PART A): 210–219. doi:
10.1016/j.ecolind.2013.08.016
35. Ninan KN, Inoue M (2013) Valuing forest ecosystem services: Case study of a forest
reserve in Japan. Ecosyst Serv 5: 78–87. doi: 10.1016/j.ecoser.2013.02.006
36. Onur a. C, Tezer A (2015) Ecosystem services based spatial planning decision making for
adaptation to climate changes. Habitat Int 47: 267–278. doi:
10.1016/j.habitatint.2015.01.008
37. Outeiro L, Häussermann V, Viddi F, et al (2015) Using ecosystem services mapping for
marine spatial planning in southern Chile under scenario assessment. Ecosyst Serv : 1–
13. doi: 10.1016/j.ecoser.2015.03.004
38. Partidario MR, Gomes RC (2013) Ecosystem services inclusive strategic environmental
assessment. Environ Impact Assess Rev 40: 36–46. doi: 10.1016/j.eiar.2013.01.001
39. Paudyal K, Baral H, Burkhard B, et al (2015) Participatory assessment and mapping of
ecosystem services in a data-poor region: Case study of community-managed forests in
central Nepal. Ecosyst Serv 13: 81–92. doi: 10.1016/j.ecoser.2015.01.007
40. Pauleit S, Jones N, Garcia-Martin G, et al (2002) Tree establishment practice in towns
and cities – Results from a European survey. Urban For Urban Green 1(2): 83–96. doi:
10.1078/1618-8667-00009
41. Pinto R, De Jonge VN, Marques JC (2014) Linking biodiversity indicators, ecosystem
functioning, provision of services and human well-being in estuarine systems:
Application of a conceptual framework. Ecol Indic 36: 644–655. doi:
10.1016/j.ecolind.2013.09.015
42. Posthumus H, Rouquette JR, Morris J, et al (2010) A framework for the assessment of
ecosystem goods and services; a case study on lowland floodplains in England. Ecol Econ
69(7): 1510–1523. doi: 10.1016/j.ecolecon.2010.02.011
43. Radford KG, James P (2013) Changes in the value of ecosystem services along a rural-
urban gradient: A case study of Greater Manchester, UK. Landsc Urban Plan 109(1):
117–127. doi: 10.1016/j.landurbplan.2012.10.007

16
44. Remme RP, Edens B, Schröter M, Hein L (2015) Monetary accounting of ecosystem
services: A test case for Limburg province, the Netherlands. Ecol Econ 112: 116–128. doi:
10.1016/j.ecolecon.2015.02.015
45. Remme RP, Schröter M, Hein L (2014) Developing spatial biophysical accounting for
multiple ecosystem services. Ecosyst Serv 10: 6–18. doi: 10.1016/j.ecoser.2014.07.006
46. Rodríguez-Loinaz G, Alday JG, Onaindia M (2015) Multiple ecosystem services
landscape index: A tool for multifunctional landscapes conservation. J Environ Manage
147: 152–163. doi: 10.1016/j.jenvman.2014.09.001
47. Schmidt JP, Moore R, Alber M (2014) Integrating ecosystem services and local
government finances into land use planning: A case study from coastal Georgia. Landsc
Urban Plan 122: 56–67. doi: 10.1016/j.landurbplan.2013.11.008
48. Terrado M, Acuña V, Ennaanay D, et al (2014) Impact of climate extremes on
hydrological ecosystem services in a heavily humanized Mediterranean basin. Ecol Indic
37(PART A): 199–209. doi: 10.1016/j.ecolind.2013.01.016
49. Tratalos J, Fuller R a., Warren PH, et al (2007) Urban form, biodiversity potential and
ecosystem services. Landsc Urban Plan 83(4): 308–317. doi:
10.1016/j.landurbplan.2007.05.003
50. Van Oudenhoven APE, Petz K, Alkemade R, et al (2012) Framework for systematic
indicator selection to assess effects of land management on ecosystem services. Ecol
Indic 21: 110–122. doi: 10.1016/j.ecolind.2012.01.012
51. Vejre H, Jensen FS, Thorsen BJ (2010) Demonstrating the importance of intangible
ecosystem services from peri-urban landscapes. Ecol Complex 7(3): 338–348. doi:
10.1016/j.ecocom.2009.09.005
52. Verkerk PJ, Mavsar R, Giergiczny M, et al (2013) Assessing impacts of intensified
biomass production and biodiversity protection on ecosystem services provided by
European forests. Ecosyst Serv 9: 155–165. doi: 10.1016/j.ecoser.2014.06.004
53. Vidal-Abarca MR, Suárez-Alonso ML, Santos-Martín F, et al (2014) Understanding
complex links between fluvial ecosystems and social indicators in Spain: An ecosystem
services approach. Ecol Complex 20: 1–10. doi: 10.1016/j.ecocom.2014.07.002
54. Villa P (2012) Mapping urban growth using Soil and Vegetation Index and Landsat data:
The Milan (Italy) city area case study. Landsc Urban Plan 107(3): 245–254. doi:
10.1016/j.landurbplan.2012.06.014
55. Vimal R, Geniaux G, Pluvinet P, et al (2012) Detecting threatened biodiversity by
urbanization at regional and local scales using an urban sprawl simulation approach:
Application on the French Mediterranean region. Landsc Urban Plan 104(3-4): 343–355.
doi: 10.1016/j.landurbplan.2011.11.003
56. Yang G, Ge Y, Xue H, et al (2015a) Using ecosystem service bundles to detect trade-offs
and synergies across urban–rural complexes. Landsc Urban Plan 136: 110–121. doi:
10.1016/j.landurbplan.2014.12.006
57. Yang L, Zhang L, Li Y, Wu S (2015b) Landscape and Urban Planning Water-related
ecosystem services provided by urban green space : A case study in Yixing City (China).
Landsc Urban Plan 136: 40–51. doi: 10.1016/j.landurbplan.2014.11.016
58. Zapparoli M (1997) Urban development and insect biodiversity of the Rome area, Italy.
Landsc Urban Plan 38(1-2): 77–86. doi: 10.1016/S0169-2046(97)00020-0

17
Annex 4. List of indicators collected from
literature review
Table 12: List of indicators for urban green infrastructure
Green infrastructure
feature or element
Indicator
Street and park trees Area (m2 )
Mean tree density (trees m2)
Number of trees (number)
Carbon stored in trees (kg)
Size of trees
Average costs of street trees
Proportionate of tree cover
Relation between number of street trees and population
Tree species
Herbaceous Vegetation and
Shrub
Area (m2 )
Mean tree density (trees m2)
Parks, public gardens and
urban forests
Green Urban area(m2 inhab.1)
Total area (km2)
Population density (inhabit.km-2)
Minimum park area (m2/inhabitant)
Accessibility (m (local level); km (district and city level))
Vegetation surfaces (%)
Tree cover (ha)
Playgrounds and sport
facilities
min. area/ 1000 inhabitants (ha per inhabitant)
Accessibility (m)
Vegetation surfaces (%)
Index of impermeableness (%)
Total area an type of biota (fauna and flora)
Cemeteries Area
Residential, commercial or
industrial landscape
Area/ land cover (km2)
Agricultural fields, pastures,
forests, wetlands
Total area (ha)
Water bodies Total area (km2)
Water environment
Type of biota (fauna and flora)
Natural areas and reserves Total area an type of biota (fauna and flora)
Broad-leaved, coniferous and
mixed forest
Area/ land cover (km2)
Landownership parcels
Total area (km2)
Buffer distance from wetlands and creeks
Vulnerability to storms and floods
Developed open space Total area
Artificial woodland :
Settlement woodland; Traffic
woodland; Garden woodland;
community parks
Area (ha)
Artificial lawn: Traffic lawn;
Garden lawn; community
parks
Area (ha)
Vacant lots Area (ha)
Number of lots (Total population)

18
Table 13: Indicators used in the studies to assess condition and biodiversity
Condition Biodiversity
Drivers and Pressures State
Dir
ect
Driv
ers
Land use change Air quality Species abundance
Overexploitation of
natural resources
Biodiversity state and
quality
Number and diversity of species (Shannon Diversity
Index)
Pollutants emissions Water quality Species richness
Urban growth and
sprawl
Habitats conservation
status Local rarity of a specific species
Industrialization
Ecological and
environmental status Species of conservation interest
Suburbanization
development
Conservation of
natural habitats Number of threatened species
Ind
irect
Driv
ers
Economics Soil condition Mean percentage of threatened sites for each species
Geopolitical
Protection of
endangered species Spatial distribution and status of group species
Social issues Control and managing of the pest species
Sustainability policies
Competition processes (Predator-prey; Parasite-
transmitter-host; Pollinator and plant)
Demography Proportion cover of green space
Science and technology Diversity of ecosystem types
Culture and religion Habitat diversity and organisms
Pressu
res
Habitat changes: Land
use changes Total biomass
Habitat changes:
Change of species Presence of endangered species
Climate change:
Extreme events Monitoring of invasive species
Invasive alien species
Over-exploitation
Atmospheric pollution
Nutrient enrichment
Water pollution
Habitats fragmentation
Soil contamination
Noise contamination

19
Table 14: List of indicators of Provisioning ecosystem services used in the studies
Sectio
n
Divi
sion
Group Class Frequency
(times
mentioned)
Indicators Units
(// = not
reported)
Provi
sioni
ng
Nut
ritio
n
Biomass Cultivated Crops 10 Agriculture production ton/ha/year;
ton/ha;
kg/produce
Harvested crop ton/ha ; kJ/ha
Net primary production Ton C/ha ;
kJ/ha
Yield €/ha
Cultivable land; ha
Amount of food materials ton/ha
Standing crop(at the time of harvest) kg/ha/year
Total food crops output ton
The ratio of gross output value of agriculture
to GDP
%
Reared animals and their outputs 3 Milk production m3/ha
Density of head of cattle N/100 ha
The amount of beef, mutton and pork Million
ton/km2
Wild plants, algae and their outputs 4 Authorized area for mushroom harvesting //
Amount of harvested mushrooms and
berries
kg
Tea yield ton/km2
Wild animals and their outputs 1 Consumable meat (wild boar and European
roe deer)
kg/km2/year
Animals from in-situ aquaculture 2 Total annual production in aquiculture ton/year
Aquaculture and fishing products Million $/km2
Water Surface water for drinking 9 Cost for unit volume of water euro/m3
Drinking water provision m3/ha/year
Surface water harvesting for human use //
Surface water harvesting for agriculture //
Water consumption m3
Yield of annual water Billion
ton/km2
Ground water for drinking 3 Water consumption m3

20
Drinking water extracted m3/ha/year
Mat
erial
s
Biomass Fibers and other materials from plants,
algae and animals for direct use or
processing
18 Harvestable amount of wood m3/ha/year
Harvest/Yield (wood and timber) m3/ha
Timber in forest plantations m3/ha
Volume of harvest (timber) m3
Number of large and mature trees per ha of
dense forest
Ton/ha
Market value of timber $/ha
Number of species of medical value per
ha/harvestable amount (kg or ton) per ha
Number/ha;
ton/ha
Materials from plants, algae and
animals for agricultural use
7 Fodder plant harvest ton/ha;
kJ/ha
Net primary production ton C/ha;
kJ/ha
Yield €/ha
Area used for harvesting fodder ha
Number of fodder producing species per ha
and hectares of grassland
Ton/ha
Standing grass (consumed by animals) t dm/ha/yr
Genetic materials from all biota 7 Number of vascular plant species Number
Pest insect predation %
Bird species richness //
Plant species richness //
Species conservation value //
Total bird density birds/ha
Number of species of medical value per
ha/harvestable amount (kg or ton) per ha
no./ha; ton/ ha
Water Surface water for non-drinking purposes 10 Runoff = renewable water supply mm
Cover of riparian forest in river margins % in 25 m
buffer
Cover of natural forest % of
municipality's
surface
Water retention of forest % of runoff
Hydropower production kWh/ ha/year
Daily Rainfall mm
Storm water runoff rate mg/L
Presence of water bodies such as no. of
springs, ponds and streams; no. of projects
using water
ML/ha/year
Ground water for non-drinking purposes 9 Aquifer recharge Hm-3 year

21
N-export with seepage water kg N /ha
Change in ground water level m
Soil water storage capacity mm
Soil water infiltration capacity cm/h
Groundwater harvesting for agriculture //
Water harvesting for industry use //
Ground water recharge rate m3/ha
Ene
rgy
Biomass-
based energy
sources
Plant-based resources 2 Amount of wood fuel for bioenergy m3
Amount of firewood for heating private
houses
m3
Table 15: List of indicators of regulating ecosystem services used in the studies
Section Division Group Class Frequency
(# times
mentioned)
Indictors Units
(// = not
reporte
d)
Regulation
&
Maintenan
ce
Mediation of
waste, toxics
and other
nuisances
Mediation by
biota
Bio-chemical detoxification / decomposition /
mineralization in land / soil, freshwater and
marine systems including sediments;
decomposition / detoxification of waste and
toxic materials e.g. waste water cleaning,
degrading oil spills by marine bacteria,
(phyto)degradation, (rhizo)degradation etc.
3 Organic C in soil (Maintenance
of soil fertility)
ton
C/ha
Water purification by cover of
riparian forest in river margins
%
Total quantities of pollutants
removed by green space (water
purification)
ton/
year
Mediation by
ecosystems
Filtration/sequestration/storage/accumulatio
n by ecosystems
3 Carbon stored in vegetation
and soil
kg/ha/ye
ar
Amount of carbon stored in the
tree canopies
ton/ha
Amount of carbon sequestered
by tree biomass
tonCO2
Mediation of noise impacts 4 Leaf area and distance to roads
(noise reduction)
//
Type of foliage (noise
reduction)
//
Percentage of tree cover (noise
buffering)
%
Absence of noise and Physical
attempts to buffer noise
//
Mediation of
flows
Mass flows Mass stabilization and control of erosion
rates
6 Soil loss (control of erosion) Ton/ha/
year
Net savings in soil loss per ha Ton/a/

22
year
Forest areas protecting against
natural hazards
ha
Erosion control Mg/ha/
year
Soil bearing capacity
Buffering and attenuation of mass flows 7 Tree structure (storm
protection)
//
Net savings in soil loss per ha
(soil protection)
Ton/ha/
year
Capacity of the vegetation
cover to retain soil
ton/km2
Value of storm protection for
estuarine marshes
//
Erosion difference between
forest land and non-forest land
ha
Forest area ha
Soil density g/cm3
Liquid flows Hydrological cycle and water flow
maintenance
15 Aquifer recharge H/m3/
year
Soil water storage capacity mm
Soil water infiltration capacity cm/h
Water retention of forest % of
runoff
Cost for unit volume of water euro/m3
Forest area ha
The water retention capability
of the litter layer and soil
Million
ton/km2
Intercepted rainfall m3/ year
Surface runoff mm
Daily Rainfall mm
Gaseous / air
flows
Storm protection 10 Forest areas protecting against
natural hazards
ha
Tree structure //
Capacity of the vegetation
cover to retain soil
ton/km2
Estimate of the cost of damages
avoided from natural assets
$
Estimate of the costs associated
with additional preventative
management measures
$

23
Number of landslides and other
natural hazard cases per year
Number
/ year
Net savings in soil loss per ha Ton/ha/
year
Frequency of storms
Ventilation and transpiration 10 CO2 sequestration by trees Ton/
year
Forest area ha
Filtering dust particles (PM10
removal)
//
Above ground biomass volume m3/ha/
year
Trees pollution absorption
capacity
//
Annual absorption rates Kg/h
Dry deposition rate cm/s
Total leaf area (TLA) TLA/ ha
PM10 capture by vegetation Mg/m2
Maintenance
of physical,
chemical,
biological
conditions
Lifecycle
maintenance,
habitat and
gene pool
protection
Pollination and seed dispersal 6 Nesting and food space for bees
Extent/abundance of flowering
plants
Apollo butterfly, oil beetle as
indicators
Amount of food (crop
pollination)
Ton/ha
Number of pollinators Number
/ ha
Maintaining nursery populations and
habitats
6 Number of vascular plant
species
Number
Special protection area % of
municip
ality's
surface
Habitat of community interest % of
municip
ality's
surface
Threat density km
Fragmentation km
Connectivity ha
Pest and
disease control
Pest control 7 Threatened species
conservation
BCI

24
Pest insect predation %
Special protection area % of
municip
ality's
surface
Threat density km
Habitat-conservation value Score
Species conservation value Score
Number of new plants and wild
animals
Number
/ ha
Disease control 1 Number of people affected by
water and air borne diseases
Incident
s/ year
Soil formation
and
composition
Weathering processes 9 Organic C in soil Ton
C/ha
Erosion difference between
forest land and non-forest land
ha
Forest area ha
Soil density g/cm3
Soil carbon stock kgC/ha
Soil nutrients
Capacity of the vegetation
cover to retain soil
ton/km2
Above ground biomass ton/ha/y
ear
Forest area ha
Decomposition and fixing processes 16 Total above ground biomass Ton/yea
r
N assimilation: percent N
assimilation
%
Nitrogen loading level kg/ha/ye
ar
Phosphorous loading levels kg/ha/ye
ar
Cycling path density m/ha
N and P - sequestration soil kg/year
N and P -sequestration forest
biomass
kg/year
Denitrification kg/year
Forest area ha
Soil density g/cm3
Net primary production g/m2
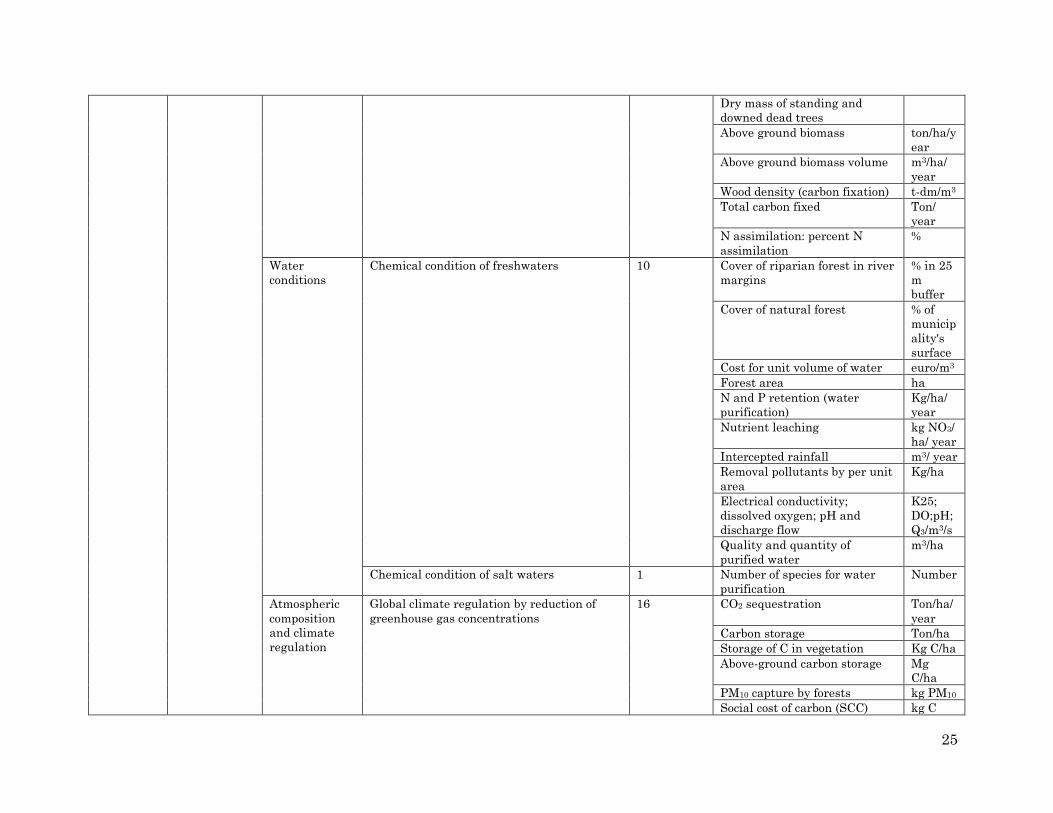
25
Dry mass of standing and
downed dead trees
Above ground biomass ton/ha/y
ear
Above ground biomass volume m3/ha/
year
Wood density (carbon fixation) t-dm/m3
Total carbon fixed Ton/
year
N assimilation: percent N
assimilation
%
Water
conditions
Chemical condition of freshwaters 10 Cover of riparian forest in river
margins
% in 25
m
buffer
Cover of natural forest % of
municip
ality's
surface
Cost for unit volume of water euro/m3
Forest area ha
N and P retention (water
purification)
Kg/ha/
year
Nutrient leaching kg NO3/
ha/ year
Intercepted rainfall m3/ year
Removal pollutants by per unit
area
Kg/ha
Electrical conductivity;
dissolved oxygen; pH and
discharge flow
K25;
DO;pH;
Q3/m3/s
Quality and quantity of
purified water
m3/ha
Chemical condition of salt waters 1 Number of species for water
purification
Number
Atmospheric
composition
and climate
regulation
Global climate regulation by reduction of
greenhouse gas concentrations
16 CO2 sequestration Ton/ha/
year
Carbon storage Ton/ha
Storage of C in vegetation Kg C/ha
Above-ground carbon storage Mg
C/ha
PM10 capture by forests kg PM10
Social cost of carbon (SCC) kg C

26
Global Warming Potential kg
CO2/.ha/
year
Carbon sequestration of forest
and green space
kg
C/km2
Annual pollutant absorption
rates
Kg/h
Cooling by vegetation degree
Celsius
CO2 tradable emission permit
value
euro/tC
O2
Micro and regional climate regulation 57 Tree shade area (urban
temperature regulation)
%
Tree cooling potential MgC/ha
Evapotranspiration mm
Cool air production m3/h/h
Soil carbon stocks (climate
regulation)
Kg/ m2
Increasing hectares of forest
cover (Carbon sequestration)
Ton/ha/
year
% of large trees per ha (Carbon
sequestration)
Mg/ha/
year
Change in biomass (carbon
sequestration)
ton/ha
Amount of Carbon captured by
tree cover and tree biomass
tonC/
ha
Carbon stored in vegetation
and soil
kg/ha/ye
ar
Change in atmospheric fine
dust concentration
PPM,
g/m3
C-sequestration in forest
biomass
ton/year
Biomass average growth m3/ha
Wood density of trees ton/m3
Forest and woodland area ha
Street length km
Coarse vegetated area by
average storage rate
kgC/m2
Fine vegetated area by average
storage rate
kgC/m2
Soil area by carbon density kgC/m2
Dry deposition rate cm/s

27
PM10, SO2, NO2 removal rate Mg/year
Removal of carbon monoxide,
ozone, nitrogen dioxide, sulfur
dioxide, and particulate matter
(PM10)
kg/km2
PM10 capture by vegetation Mg/m2

28
Table 16: List of indicators of Cultural ecosystem services used in the studies
Section Division Group Class
Frequency
(# times
mentioned) Indicators Units
Cultural Physical and intellectual
interactions with biota,
ecosystems, and land- /seascapes
[environmental settings]
Physical and
experiential
interactions
Experiential use of plants,
animals and land-/seascapes in
different environmental settings
38 (Suitability for outdoor
recreation)
Number of walkers
Number/
ha/ year
Number of excursions
and number of visiting
researchers
Number/
year
Density of rural
tourism
establishments
Number/
km2
Recreational area ha
Recreational area per
capita
ha/popul
ation
size
Number of recreation
sites Number
Number of visitors
h/year/h
a
Number of visitors per
year
Number/
year
Number of hunters Permits
Number of permits for
mushroom picking Permits
Frequency of visits
Visits/
week
Annual visits per ha 1000/ha
Accessibility of
recreational area
use of the recreational
infrastructure
Potential recreational
use Score
Landscape value Score

29
Potential recreational
use Score
Entry fees $
Travel costs $
Cycling path density m/ha
Bird watching
Kayaking, sailing,
scuba diving
marine mammal
observation
Ratio of protection
zones under pressure
of built-up area
Ratio of wild life under
pressure of built-up
area
Ratio of loss in
endemic plants under
pressure of built-up
area
Intellectual and
representational
interactions
Educational and Scientific 4 Number of excursions
and number of visiting
researchers
Number/
year
Number of PhD Theses
on water
Number of scientific
publication on aquatic
ecosystems
Number of university
students
Persons/
km2
Aesthetic 3 No. of visitors
appreciating the visual
quality of the
landscape
Number/
year
coastal attributes:
“scenic beauty”,
“biological diversity”
Scenic beauty, visual
quality
Spiritual, symbolic and other Spiritual and/or Spiritual and religious values 2 Locations of temples Number

30
interactions with biota,
ecosystems, and land- /seascapes
[environmental settings]
emblematic and spiritual sites
Number of people
visiting these locations
Visitors/
year
Other cultural
outputs Existence 1
Reflection; Attachment;
Continuity with past

How to obtain EU publications
Our publications are available from EU Bookshop (http://bookshop.europa.eu),
where you can place an order with the sales agent of your choice.
The Publications Office has a worldwide network of sales agents.
You can obtain their contact details by sending a fax to (352) 29 29-42758.
Europe Direct is a service to help you find answers to your questions about the European Union
Free phone number (*): 00 800 6 7 8 9 10 11
(*) Certain mobile telephone operators do not allow access to 00 800 numbers or these calls may be billed.
A great deal of additional information on the European Union is available on the Internet.
It can be accessed through the Europa server http://europa.eu

2
doi:10.2788/638737
ISBN 978-92-79-54589-4
LB-N
A-2
7706-E
N-N
JRC Mission
As the Commission’s
in-house science service,
the Joint Research Centre’s
mission is to provide EU
policies with independent,
evidence-based scientific
and technical support
throughout the whole
policy cycle.
Working in close
cooperation with policy
Directorates-General,
the JRC addresses key
societal challenges while
stimulating innovation
through developing
new methods, tools
and standards, and sharing
its know-how with
the Member States,
the scientific community
and international partners.
Serving society Stimulating innovation Supporting legislation