mapping digital media: mobile tv: … tv: challenges and opportunities beyond 2011 mapping digital...
TRANSCRIPT

MOBILE TV: CHALLENGES AND OPPORTUNITIES BEYOND 2011
MAPPING DIGITAL MEDIA:
REFERENCE SERIES NO. 3
By Ronan de Renesse

Mobile TV: Challenges and Opportunities Beyond 2011W R I T T E N B Y
Ronan de Renesse1
Media consumption has changed drastically over the past decade. With TV content now accessible everywhere
at any time, consumer behaviour and trends are evolving fast. Online TV is a new platform that brings
instant free access to favorite content and signifi cantly disrupted the conventional TV business as a result.
Given the success of smart phones and application stores, how will mobile aff ect the TV ecosystem? What
opportunities and dangers does it hold? Th is paper addresses these questions while providing an overview of
the mobile TV sector.
As originally defi ned and designed (linear TV streaming on handsets), mobile TV is on the brink of extinction.
Yet, demand for video content on mobile is stronger than ever. Mobile TV will have to be reborn and
transformed in terms of format, content and business model. Th e guardians of the TV and mobile ecosystem
should facilitate this transformation while protecting customers’ interests.
1. Senior Analyst and Head of Mobile Media at Screen Digest.
March 2011

3O P E N S O C I E T Y M E D I A P R O G R A M 2 0 1 1
Mapping Digital Media
Th e values that underpin good journalism, the need of citizens for reliable and abundant information, and
the importance of such information for a healthy society and a robust democracy: these are perennial, and
provide compass-bearings for anyone trying to make sense of current changes across the media landscape.
Th e standards in the profession are in the process of being set. Most of the eff ects on journalism imposed
by new technology are shaped in the most developed societies, but these changes are equally infl uencing the
media in less developed societies.
Th e Media Program of the Open Society Foundations has seen how changes and continuity aff ect the media in
diff erent places, redefi ning the way they can operate sustainably while staying true to values of pluralism and
diversity, transparency and accountability, editorial independence, freedom of expression and information,
public service, and high professional standards.
Th e Mapping Digital Media project, which examines these changes in-depth, aims to build bridges between
researchers and policy-makers, activists, academics and standard-setters across the world.
Th e project assesses, in the light of these values, the global opportunities and risks that are created for media
by the following developments:
the switchover from analog broadcasting to digital broadcasting
growth of new media platforms as sources of news
convergence of traditional broadcasting with telecommunications.
As part of this endeavour, Open Society Media Program has commissioned introductory papers on a range
of issues, topics, policies and technologies that are important for understanding these processes. Each paper
in the Reference Series is authored by a recognised expert, academic or experienced activist, and is written
with as little jargon as the subject permits.

M A P P I N G D I G I T A L M E D I A M O B I L E T V4
Th e reference series accompanies reports into the impact of digitization in 60 countries across the world.
Produced by local researchers and partner organizations in each country, these reports examine how these
changes aff ect the core democratic service that any media system should provide – news about political,
economic and social aff airs. Cumulatively, these reports will provide a much-needed resource on the
democratic role of digital media.
Th e Mapping Digital Media project builds policy capacity in countries where this is less developed,
encouraging stakeholders to participate and infl uence change. At the same time, this research creates a
knowledge base, laying foundations for advocacy work, building capacity and enhancing debate.
Th e Mapping Digital Media is a project of the Open Society Media Program, in collaboration with the
Open Society Information Program.
MAPPING DIGITAL MEDIA EDITORS
Marius Dragomir and Mark Thompson (Open Society Media Program).
EDITORIAL COMMISSION
Yuen-Ying Chan, Christian S. Nissen, Dusan Reljic, Russell Southwood, Michael Starks, Damian
Tambini.
The Editorial Commission is an advisory body. Its members are not responsible for the information
or assessments contained in the Mapping Digital Media texts.
OPEN SOCIETY MEDIA PROGRAM TEAM
Biljana Tatomir, deputy director; Meijinder Kaur, program assistant; Morris Lipson, senior legal
advisor; Miguel Castro, special projects manager; and Gordana Jankovic, director
OPEN SOCIETY INFORMATION PROGRAM TEAM
Vera Franz, senior program manager; Darius Cuplinskas, director
Th e views expressed in this publication do not represent, or necessarily refl ect, the views of the Open Society
Foundations.

5O P E N S O C I E T Y M E D I A P R O G R A M 2 0 1 1
Contents
I. Introduction ............................................................................................................................. 6
II. Technology Primer and Defi nitions ........................................................................................... 7
III. Market Overview ..................................................................................................................... 11
IV. Trends To Look Out For ........................................................................................................... 16
V. Conclusion ............................................................................................................................... 20
Glossary ............................................................................................................................................ 21

M A P P I N G D I G I T A L M E D I A M O B I L E T V6
I. Introduction
Combining two of the most popular and widely available services in the world, mobile and television has
always been an interesting proposition. However, after many attempts by mobile operators, broadcasters and
handset manufacturers, the business case for mobile TV still remains unproven, even in cases of high levels of
adoption, as observed in South Korea and Japan.
Th e emergence of high-end handsets with large touch screens and advanced multimedia capabilities has
boosted the demand for video on mobile. Yet demand does not necessarily translate into usage or revenues.
Several challenges regarding delivering technologies, content availability and business models still need to be
addressed.
In the advent of the digital switchover and its corresponding digital spectrum dividend, regulators ought to
adopt the right decisions to facilitate the roll-out and operation of mobile TV services across Europe.

7O P E N S O C I E T Y M E D I A P R O G R A M 2 0 1 1
II. Technology Primer and Defi nitions
Th ere are four diff erent ways in which to deliver video content to mobile handsets: sideloading, Bluetooth
sharing, 3G streaming and mobile broadcasting.
A vast majority of video content present on mobile handsets has been either transferred from the PC (i.e.
sideloading) or from a friend’s handset via Bluetooth. Both delivery methods are particularly popular, simply
because it is entirely free to the consumer and it isn’t controlled by anyone.
As opposed to sideloading and Bluetooth, 3G streaming (unicast) and mobile broadcasting are designed for
‘anywhere anytime’ content access rather than content portability. Both delivery mechanisms in turn defi ne
the breadth of content that can be delivered and whether the business model applies to niche or mass market
relationships with consumers.
Unicast for Niche Market
Unicast mobile TV follows a one-to-one communication process where content is directly transmitted to
mobile handsets through conventional cellular networks. Multimedia streaming applications are extremely
demanding in terms of network resources.
Although third generation (3G) cellular networks have been deployed in most markets, this would never be
enough to accommodate a mass market. Most 3G cells can sustain approximately 16 simultaneous mobile
TV users for the poorest video streaming format (i.e. 64Kbps or 6.5 frames per second). However, the
number of available channels does not aff ect network activity. Consequently, unicast mobile TV can off er an
unlimited number of channels which is ideal to address the long-tail market.
Figure 1.
Unicast (one-to-one)
ContentOwner Operator
2.5G2.75G3G3G+

M A P P I N G D I G I T A L M E D I A M O B I L E T V8
Broadcast for Mass Market
Broadcast mobile TV is a one-to-all communication process where content is broadcast to mobile handsets.
Th e main advantage of this approach is that it can accommodate an infi nite number of users, making it
more appropriate for mass market conditions. However, the number of channels transmitted over the mobile
broadcast network is limited. Five to 50 channels can be broadcast to mobile devices according to the amount
of frequency spectrum made available for mobile services as well as the quality of those services. Additionally,
there is no return path, so interactive TV is not possible without some additional communication channel.
Figure 2.
Broadcast (one-to-all)
Th ere are numerous mobile TV broadcast technologies and the major ones are DMB, DVB-H, ISDB-T – all
nationally open standards – and MediaFLO, a proprietary system of Qualcomm. What these systems have
in common is the potential to reach mobile phone owners without the network operator being involved.
However, the investment required to reach an unproven market is considerable, and a foray into mobile TV
could prove a very costly gamble for the companies which build these alternative networks.
Figure 3.
ContentOwner
Operator
DVB–HDMBMediaFLOISDB–TDABMB MS
Analog
Analog
Analog
Analog

9O P E N S O C I E T Y M E D I A P R O G R A M 2 0 1 1
Table 1.
IP broadcast
(IMB)
DMB DVB-H DVB-SH and
S-DMB
MediaFLO ISDB-T, ASTSC-
M/H & Analog
Regions in
Operation
— South Korea, Norway, Germany (ended 2008), UK (ended 2008)
Italy, Finland, Austria, Hungary, India, Kenya, Morocco, Namibia, Netherlands, Nigeria, Ghana, Philippines, Russia and a few others
South Korea US ISDB-T: Japan, Brazil, Peru, Argentina and Chile.
Regions in Trial UK — Part of Europe, Asia and Middle East
Inmarsat and Solaris Mobile to launch services in Europe before May 2011.
Japan, Hong-Kong, Taiwan
ATSC M/H: USA
Operators
partners
O2, Orange and Vodafone
— Hutchison, DNA, Orange Austria, KPN
South Korea Telecom
Verizon, AT&T —
Emitter Operator’s cellular tower
Terrestrial tower
Terrestrial tower Satellite and terrestrial tower
Terrestrial tower
Terrestrial tower (owned by TV station)
Platform
operator
Mobile operator
Broadcasters Mobile operator and/or broadcaster
TU Media, Solaris Mobile
Qualcomm Broadcasters
Investment
required
Medium Low High High High Low/Medium
Advantages No need to buy new spectrum. Avoids network congestion. Part of 3GPP standard.
Existing transmitter infrastructure and DAB frequencies can be used.
Good quality of service and spectrum effi cient. Open standard.
100% outdoor coverage and offers a wider range of TV channels.
Good quality of service and spectrum effi cient.
Does not require new spectrum or new infrastructure.
Disadvantages The entire network is reduced slightly in capacity at all times. No major quality improvement
Small number of channels, Poor indoor coverage.
Expensive to deploy and lacks compatible handsets.
Requires direct line of sight for reception and expensive to launch. No compatible handsets.
Proprietary technology. Expensive to deploy and lacks compatible handsets
Lacks conditional access and interactivity features. Diffi cult to monetize.

M A P P I N G D I G I T A L M E D I A M O B I L E T V1 0
Technology Winners and Losers
In the Western world, the leading access technology for mobile video services is 3G (including HSDPA)
with a subscriber market share above 80 percent. Mobile broadcasting technologies such as DVB-H and
MediaFLO have struggled to take off due to the lack of compatible handsets, expensive deployment costs
and an inadequate regulatory environment. Since the beginning of 2010, more DVB-H based services have
closed down than have launched.
Outside Western markets, mobile broadcast is, on the contrary, the most popular technology to access video
on the move. Th e main reason for this is that mobile broadcasting has been introduced as a handset feature
– accessible for free, similar to the camera or FM radio, rather than a paid-for service. While corresponding
mobile video services enjoy a very large audience, soaring past the tens of millions in Korea, Japan, China and
Latin America, no one has yet managed to successfully monetize it.
Th e current winning standards for mobile broadcast TV are ISDB-T and Analog. ISDB-T is enjoying massive
adoption level in Japan where it is embedded in 80 percent of new handsets. Analog portable TVs have been
around for decades but never really worked while on the move and tend to have very poor battery life. Fabless
semiconductor company Telegent Systems has managed to overcome those issues by developing effi cient
low-power semiconductor chips for analog mobile TV reception. Telegent Systems has shipped more than 80
million analog mobile TV receivers worldwide since mid 2007.
Another technology that had almost no presence in the mobile TV market until 2009 is WiFi. With mobile
video usage in the home or offi ce accounting for over 50 percent of total usage, WiFi represents a good
opportunity for operators to offl oad expensive 3G traffi c. However, in this case, content rights often have to
be renegotiated, adding yet another cost to the complex mobile video business case.
Figure 4.
Mobile TV subscribers by technology* (m)
Note: * Global fi gures only – includes Western World, Czech Republic, Hungary, Poland, Slovakia, Slovenia, North America,
China, India, South Korea and Japan.
2006 2007 2008 2009 2010 2011 2012 2013
200
180
160
140
120
100
80
60
40
20
0
ISDB-TAnalogATSC M/HMediaFLOCMMBS-DMBT-DMBDVB-TDVB-H

1 1O P E N S O C I E T Y M E D I A P R O G R A M 2 0 1 1
III. Market Overview
Video services on mobile have been made available in parallel to 3G launches back in 2003 and 2004.
Although many operators have had services operational since the fi rst half of the decade, uptake has been
mixed at best, and in most cases failed to live up to operator expectations. In 2009, mobile TV and video
made up less than 1 percent of total mobile content revenue in Western Europe and North America.
Th e failure of operators’ traditional TV and video services can be put down to a number of factors aff ecting
both the technical and content sides of the service.
Technical inhibitors:
Limited handset capabilities which, combined, resulted in a sub-par viewing experience. Th ese include:
low memory, power constraints and small screen size.
Poor quality of service provision on the networks resulting in unreliable video quality
High delivery costs which were often passed onto consumers in the form of high service prices.
Fragmentation: thousands of handset profi les (diff erent screen sizes, etc.) and complex DRM
implementations which required multiple implementations, signifi cantly increasing operating costs for
service providers.
Content inhibitors:
Th e linear format does not fi t with the mobile context, particularly for conventional TV programming.
Sport where there is a premium on live content is arguably something of an exception.
Long-form and catch-up content rights are too expensive or simply unavailable. Again this is particularly
true for conventional TV shows, although it applies to sports content for the major events.
Dedicated, made-for-mobile content does not work and has consistently met with low consumption.
Th e market conditions are, however, slowly changing as those challenges are increasingly being addressed
by the industry. Apple and its App Store have given a much needed boost to the mobile video industry by

M A P P I N G D I G I T A L M E D I A M O B I L E T V1 2
facilitating the development of compelling services and opening the market to third party service providers.
Overall, the App Store/iPhone combination has set a new benchmark for mobile video services, leading some
mobile operators with a strong content focus such as Orange or Vodafone to make additional investment in
their own services or embrace Apple’s approach to content.
Figure 5.
Europe – Mobile TV market
Regional Analysis: Emerging Markets Lead the Pack
According to Screen Digest, emerging and developing markets like Brazil, Russia, India and China represent
one of the greatest growth opportunities for the mobile industry with the number of subscriptions expected
to double to 2 billion between 2007 and 2013. With a content ARPU several times lower than their Western
counterparts, mobile operators in emerging countries are still heavily relying on voice and messaging services
to generate profi ts. Nevertheless, against all expectations, emerging markets are where mobile TV has become
the most popular. With a predicted mobile population of over 1.5 billion users by the end of 2013, China
and India are set to generate more revenues from mobile TV services than Europe and North-America
combined.2
Mobile TV is successful in emerging and developing markets for several reasons:
Greater variance between TV and mobile penetrations: Th e number of TV households is much lower
than in developed markets, so there are considerably more mobile phones than TV sets.
Less competition from alternative mobile content services: Mobile games, music and other applications
and services are thriving in developed markets and generate a high amount of competition for mobile
0
2
1
4
3
5
6
2005 2006 2007 2008 2009 2010
4.0%
3.5%
3.0%
2.5%
2.0%
1.5%
1.0%
0.5%
0.0%
ARPU (€/month) Adoption (% of 3G)
AR
PU (€/
mon
th)
Ado
ptio
n ra
te (
%)
2. Screen Digest Mobile Media Intelligence database – August 2010.

1 3O P E N S O C I E T Y M E D I A P R O G R A M 2 0 1 1
TV services. With 3G networks not yet fully deployed and a very small number of high-end devices, the
level of competition from other services is much lower.
Lower expectations: Th e TV audience in emerging markets is used to crammed conditions and old, low
quality television sets. Th e mobile TV experience is comparatively better. Th e threshold at which the
quality of mobile TV stream or broadcast becomes unacceptable is therefore much harder to reach.
Lack of information sources in nearby environment: With small internet and TV penetration rates, the
number of ways in which to access information is fairly limited and tedious. Mobile TV off ers a much
simpler way to access news.
Appropriate technologies: “in-band” technologies are the best option for emerging and developing
markets because they can be rolled-out in synch with the digital terrestrial television infrastructure at a
minimum cost like ISDB-T in Latin America. Handset manufacturers can also opt to embed an analog
TV receiver in their devices.
Figure 6.
BRIC global mobile subscriber forecast (bn)
Figure 7.
China and India – Mobile TV forecasts
0.0
0.5
1.0
1.5
2.0
2002 2003 2004 2005 2006 2007 2008 2009 2010 2011 2012 2013
China India Russia Brazil
0
100
50
200
150
250
300
2007 2008 2009 2010 2011 2012 2013
90
80
70
60
50
40
30
20
10
0
China revenues
China subscribers
India revenues
India subscribers
Subs
crib
ers
(m)
Rev
enue
s (€
m)

M A P P I N G D I G I T A L M E D I A M O B I L E T V1 4
Business Models: Mobile TV Ought To Be Free
While unicast mobile TV is typically dominated by subscription models inherited from the mobile industry,
broadcast mobile TV, although requiring a substantial level of investment, is clearly taken over by the free-to-
air (FTA) model. Japan and South-Korea are leading the way with FTA services which now nearly count 75
million mobile viewers, 90 percent of the global broadcast mobile TV market.
With regard to paid-for services, the subscription model largely prevails and generates in excess of 93 percent
of revenues globally. Subscription is a business model with which consumers feel comfortable as it is already
widely used in both mobile and television industries. For countries where the proportion of mobile users on
prepay packages is very high, such as Italy, subscriptions have proved less successful. On several occasions
mobile operators in those markets have bundled mobile TV services with expensive long-term contracts in a
move to increase ARPU and boost the number of long-term mobile contracts (i.e. 12 to 24 months), but this
strategy has not paid off as expected. In France, however, mobile operators Orange and SFR have adopted
a similar strategy but bundled mobile TV with mobile internet access and other mobile content services
instead. Th is has proved to be better approach, and France now enjoys the highest number of mobile TV
subscribers in Europe.
Th rough all those business model experiments it has been quite clear that, for consumers, mobile TV does
not justify a monthly subscription as a stand-alone service. Mobile users see mobile TV as a device feature like
the camera mode or FM radio rather than an actual service. Bringing mobile TV on the top of other services
in a properly priced TV or mobile content bundle tends to be the best approach.

1 5O P E N S O C I E T Y M E D I A P R O G R A M 2 0 1 1
Figure 8.
Global mobile TV revenues by platform* (€m)
Note: * Global fi gures only – includes Western World, Czech Republic, Hungary, Poland, Slovakia, Slovenia, North America,
China, India, South Korea and Japan.
2005 2006 2007 2008 2009 2010 2011 20132012 2014
800
700
600
500
400
300
200
100
0
80
90
100
70
60
50
40
30
20
10
0
Pay Per View Subscription % Free
Rev
enue
s (€
m)
Free
sub
scri
ptio
ns (
%)
2004 2005 2006 2007 2008 2009 2010 2011 20132012 2014
800
700
600
500
400
300
200
100
0
Unicast Broadcast

M A P P I N G D I G I T A L M E D I A M O B I L E T V1 6
IV. Trends To Look Out For
Mobile TV in the Spectrum Debate
Spectrum is a key resource for all services relying on over-the-air transmissions. Unicast mobile TV services
use the existing 3G spectrum while broadcast mobile TV services require additional chunks of frequencies to
operate. New spectrum is generally sold or awarded by the local telecommunication or/and media regulator(s).
With analog switch-off , spectrum previously being used by broadcasters is being freed and redistributed
to provide additional capacity for HD TV channels or mobile broadband services. Consequently, mobile
operators and broadcasters are vying for the same pieces of spectrum, leading to an aggressive lobbying war.
A key example of this is in the U.S. where several broadcasters have launched a mobile TV joint venture
called Pearl and made a commitment to provide spectrum, content, marketing and fi nancial resources for the
launch, development and operation of a nationwide mobile video delivery platform based on ATSC M/H.
According to this group of broadcasters, the ATSC-M/H network off ers an alternative option for the delivery
of content to mobile devices, off -loading cellular networks from data-heavy traffi c and therefore indirectly
bringing additional capacity for mobile broadband services. Consequently, mobile TV is not necessarily just
seen by broadcasters as an opportunity to generate additional revenues or eyeballs, but also, and maybe more
importantly, as a way to defend their spectrum ownership.
Mobile TV spectrum has too often been allocated by regulators to broadcasters without considering the role
of the operator, often leading to bad consequences. Th is was partly why DVB-H never took off in Germany
and France. Without handset subsidies, mobile billing, nationwide marketing campaigns, retail outlets and
customer support, broadcasters will fi nd it very diffi cult to bring content and new technology to mobile
handsets.
The Emergence of Mobile VoD Catch-up Services
Th e mobile video market is currently dominated by the consumption of short-form content such as news
and sports highlights, comedy and user generated content. Full-length TV series and movies have not gained
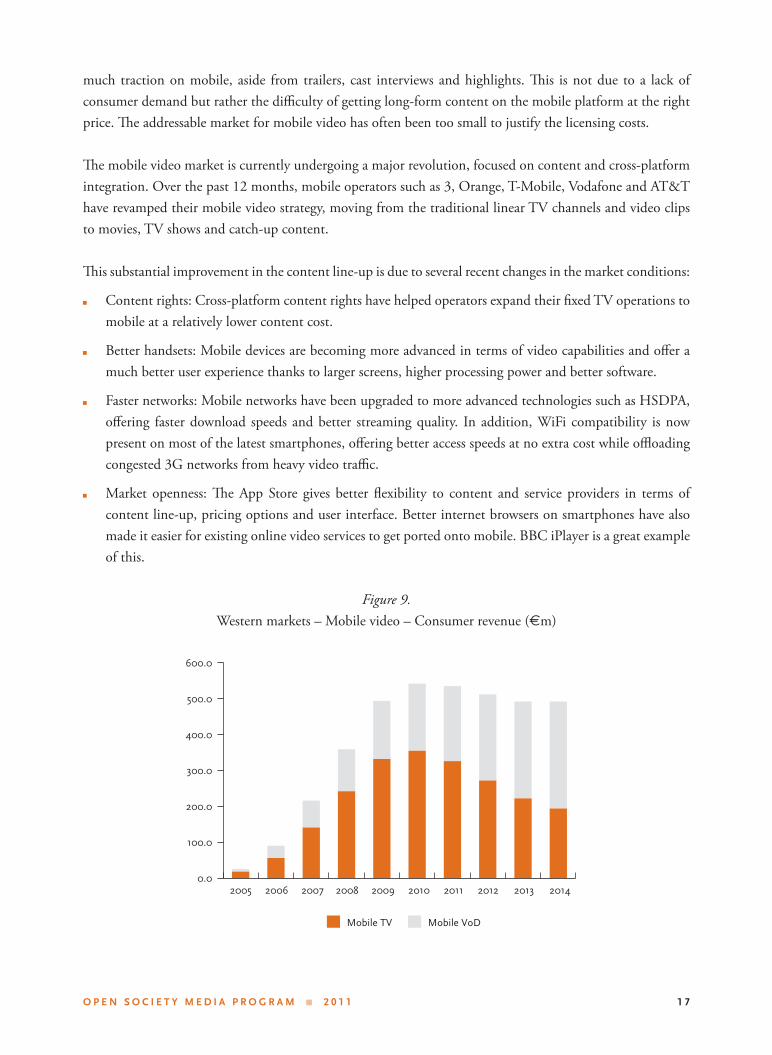
1 7O P E N S O C I E T Y M E D I A P R O G R A M 2 0 1 1
much traction on mobile, aside from trailers, cast interviews and highlights. Th is is not due to a lack of
consumer demand but rather the diffi culty of getting long-form content on the mobile platform at the right
price. Th e addressable market for mobile video has often been too small to justify the licensing costs.
Th e mobile video market is currently undergoing a major revolution, focused on content and cross-platform
integration. Over the past 12 months, mobile operators such as 3, Orange, T-Mobile, Vodafone and AT&T
have revamped their mobile video strategy, moving from the traditional linear TV channels and video clips
to movies, TV shows and catch-up content.
Th is substantial improvement in the content line-up is due to several recent changes in the market conditions:
Content rights: Cross-platform content rights have helped operators expand their fi xed TV operations to
mobile at a relatively lower content cost.
Better handsets: Mobile devices are becoming more advanced in terms of video capabilities and off er a
much better user experience thanks to larger screens, higher processing power and better software.
Faster networks: Mobile networks have been upgraded to more advanced technologies such as HSDPA,
off ering faster download speeds and better streaming quality. In addition, WiFi compatibility is now
present on most of the latest smartphones, off ering better access speeds at no extra cost while offl oading
congested 3G networks from heavy video traffi c.
Market openness: Th e App Store gives better fl exibility to content and service providers in terms of
content line-up, pricing options and user interface. Better internet browsers on smartphones have also
made it easier for existing online video services to get ported onto mobile. BBC iPlayer is a great example
of this.
Figure 9.
Western markets – Mobile video – Consumer revenue (€m)
0.0
100.0
200.0
300.0
400.0
500.0
600.0
2005 2006 2007 2008 2009 2010 2011 2012 2013 2014
Mobile TV Mobile VoD
M A P P I N G D I G I T A L M E D I A M O B I L E T V1 8
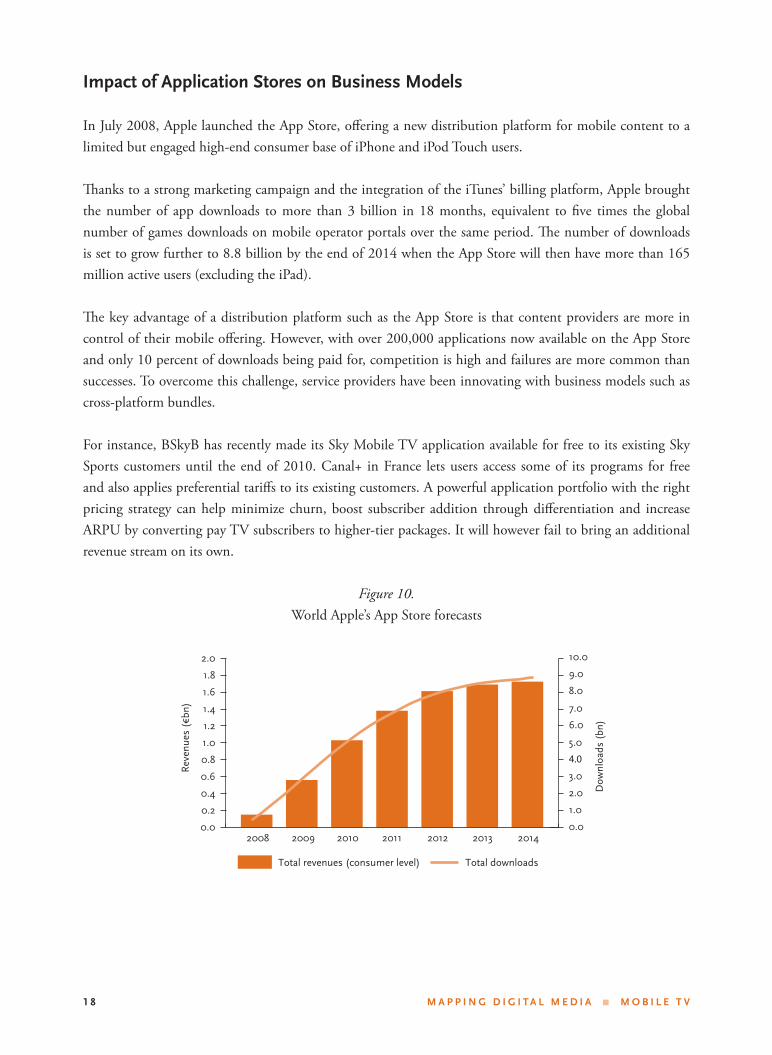
Impact of Application Stores on Business Models
In July 2008, Apple launched the App Store, off ering a new distribution platform for mobile content to a
limited but engaged high-end consumer base of iPhone and iPod Touch users.
Th anks to a strong marketing campaign and the integration of the iTunes’ billing platform, Apple brought
the number of app downloads to more than 3 billion in 18 months, equivalent to fi ve times the global
number of games downloads on mobile operator portals over the same period. Th e number of downloads
is set to grow further to 8.8 billion by the end of 2014 when the App Store will then have more than 165
million active users (excluding the iPad).
Th e key advantage of a distribution platform such as the App Store is that content providers are more in
control of their mobile off ering. However, with over 200,000 applications now available on the App Store
and only 10 percent of downloads being paid for, competition is high and failures are more common than
successes. To overcome this challenge, service providers have been innovating with business models such as
cross-platform bundles.
For instance, BSkyB has recently made its Sky Mobile TV application available for free to its existing Sky
Sports customers until the end of 2010. Canal+ in France lets users access some of its programs for free
and also applies preferential tariff s to its existing customers. A powerful application portfolio with the right
pricing strategy can help minimize churn, boost subscriber addition through diff erentiation and increase
ARPU by converting pay TV subscribers to higher-tier packages. It will however fail to bring an additional
revenue stream on its own.
Figure 10.
World Apple’s App Store forecasts
0.0
0.2
0.4
0.6
0.8
1.0
1.2
1.4
1.6
1.8
2.0
0.0
1.0
2.0
3.0
4.0
5.0
6.0
7.0
8.0
9.0
10.0
Total revenues (consumer level) Total downloads
2008 2009 2010 2011 2012 2013 2014
Rev
enue
s (€
bn)
Dow
nloa
ds (
bn)

1 9O P E N S O C I E T Y M E D I A P R O G R A M 2 0 1 1
Table 2.
Owner Store Launch
date
Platform/ OS support Countries Revenue
share
Total
Catalogue
Apple App Store Jul-08 iPhone OS 77 70% +200,000
Nokia Ovi May-09 Symbian, Maemo, Java, Flash 180 70% 13,000
Orange Orange Applications Shop
Mar-09 Android, Symbian, Windows, Blackberry
UK, France
not disclosed
5,000
GetJar GetJar Dec-04 Java, Symbian, WinMo Global Free 69,147
Handango Handango Apr-99 Multi Global 190,000
Handmark Handmark Aug-00 Multi Global
SonyEricsson PlayNow Arena Aug-09 Java, Symbian, WinMo 69 70% 160
Vodafone Vodafone 360 Jun-09 LiMo Global 70% 7,000
Samsung Samsung Mobile Applications
Feb-09 Multi Global 70%
LG LG Application Store
Jul-09 Java, Flash Lite, LiMo, WinMo 17 80% 1,400
Research In Motion
Blackberry App World
Apr-09 Blackberry OS (+4.2) 50+ 70% 6,000
T-Mobile web2go Apr-09 Multi USA
Microsoft Windows Marketplace
Oct-09 WinMo (+6.0) 33 70% 900
Google Android Market Oct-08 Android 25 70% +70,000
China Mobile Mobile Market Jul-09 Multi China 50%
Palm App Catalog Jun-09 WebOS 4 70%
Verizon Vcast Q4 2009
Multi USA 70%
Samsung Samsung Application Store
Sep-09 Windows, Android 7 70% 800
SK Telecom T Store Sep-09 Multi South Korea
70% +65,00
Mobango Mobango Dec-04 Java, RIM, Symbian, Android, WinMo
Global Free +9,000

M A P P I N G D I G I T A L M E D I A M O B I L E T V2 0
V. Conclusion
Mobile TV undoubtedly off ers certain benefi ts from a social and political aspect. As mobile phones bring
anywhere-anytime connectivity to individuals, it has the potential to be a key and even – in some situations
– a critical tool to access information, especially for live events. (For instance, millions of mobile users tried
to watch Barack Obama’s speech when he won the US presidential election, leading to heavy congestion in
the 3G networks and therefore many mobile video sessions were dropped.) In emerging markets, mobile TV
can become the only source of information and the viewing experience is often shared among several people
despite the small screen size.
Mobile TV today is either a niche service with adoption rates lower than 3.5 percent or a popular handset
feature generating very little revenue for operators and broadcasters providing it. It is therefore fair to
conclude that, against initial expectations, mobile TV does not represent a good business opportunity for
the industry as a stand-alone service. However, that does not necessary mean that mobile TV has reached
a dead-end. On the contrary, recent eff orts being made on the content and hardware front have shown
that the demand for video content on mobile is stronger than ever. Mobile operators, broadcasters, pay TV
operators and device manufacturers have to rework their business models as to make mobile TV a compelling
complementary service proposition rather than a stand-alone failure. Industry players focusing on bringing
premium long-form video content to mobile as part of a multi-screen strategy will be the likely winners, as
long as appropriate business models are being used.

2 1O P E N S O C I E T Y M E D I A P R O G R A M 2 0 1 1
Glossary
3G: Th ird-generation mobile technology which must allow for data peak rates of more than 200Kbps.
W-CDMA, CDMA 2000 1xEV-DO and any of the HSPA family (including HSPA, HSDPA and HSUPA)
are considered 3G. For the avoidance of doubt, Screen Digest does not consider CDMA 2000 1x networks as
3G since the maximum data transfer speed is 144Kbps. Later revisions of the EDGE technology do fulfi l this
specifi cation, but most EDGE networks are not considered 3G since most EDGE deployments are earlier
revisions.
3G streaming: Multimedia streaming over mobile networks using 3G technology.
ARPU: Average Revenue per User. Average revenue generated by each subscription (not subscriber) in a given
period, usually monthly or yearly.
ATSC M/H: Advanced Television Systems Committee Mobile/Handheld. Mobile broadcast technology
based on US home grown digital terrestrial television standard.
BBC iPlayer: Online catch-up TV service developed by the BBC in the UK.
Bluetooth: Open wireless technology standard for exchanging data over short distances between mobile
devices.
Catch-up TV: Type of multimedia service in which TV shows are made available for on-demand consumption
for a period of days after the original broadcast.
DMB: Digital Multimedia Broadcasting. Mobile TV broadcast standard particularly successful in Asia. Th e
technology development has been partly funded by the EU.
DRM: Digital Right Management. DRM technology is used to limit and control the use of digital content
on various devices.

M A P P I N G D I G I T A L M E D I A M O B I L E T V2 2
DVB-H/DVB-SH: Digital Video Broadcasting – Handheld/ Digital Video Broadcasting – Satellite services
to Handhelds. Mobile broadcast TV standard developed by Nokia and partly funded by the EU.
EDGE technology: Enhanced Data rates for GSM Evolution. Mobile technology providing data transfers of
up to 240 Kbps. It is also referred as 2.5G technology.
Fabless semiconductor company: Specializes in the design and sale of semiconductor chips while outsourcing
the actual fabrication to a third party manufacturer.
High-end handsets/Smartphones: Mobile phone that runs a complete operating system and provides third-
party software development guidelines and marketplace. Smartphones feature advanced capabilities beyond
voice calls and messaging.
HSDPA: High-Speed Downlink Packet Access. Enhanced 3G mobile technology which allows UMTS-based
networks to provide high data transfer speeds.
IMB: Integrated Mobile Broadcast. Mobile broadcast technology integrated into a cellular infrastructure
such as GSM and UMTS networks.
In-band technology: Mobile broadcast technology which developed as an extension of an existing digital
terrestrial television technology. Examples include ATSC M/H, ISDB-T and DVB-H.
ISDB-T: Integrated Services Digital Broadcasting Terrestrial. Japanese home grown digital terrestrial television
standard also used for mobile broadcasting. ISDB-T is considered has an “in-band” mobile TV technology.
Long-form video: Professionally produced content from television which lasts longer than 10 minutes. It
mainly includes movies, TV series and TV shows.
MediaFLO: Mobile broadcast technology developed by Qualcomm.
Mobile broadcasting: ‘One-to-many’ communication process where data is sent to all mobile users at once.
Broadcasting is typically used by the TV industry for transmitting television signals over the air.
Multimedia streaming: Delivery method for which multimedia content is constantly received and presented
to an end-user.
Sideloading: Transferring data directly from the PC to the handset via a cable or WiFi.
UMTS: Universal Mobile Telecommunications System. 3G technology providing transfer rates of up to
384Kbps.
Unicast: ‘One-to-one’ communication process for the delivery of mobile audiovisual content. Mobile TV
services delivered over cellular networks (i.e. using 3G technology) are considered unicast.

M A P P I N G D I G I T A L M E D I A M O B I L E T V2 3

For more information:
Open Society Media ProgramOpen Society Foundation
4th Floor Cambridge House, 100 Cambridge GroveLondon, W6 0LE, United Kingdom
mappingdigitalmedia@osf-eu.orgwww.mappingdigitalmedia.orgwww.soros.org/initiatives/media
Cover Design: Ahlgrim Design GroupDesign and Layout: Judit Kovács l Createch Ltd.
Mapping Digital Media is a project of the Open Society Media Program and the Open Society
Information Program.
Open Society Media ProgramThe Media Program works globally to support independent and professional media as crucial players for
informing citizens and allowing for their democratic participation in debate. The program provides operational
and developmental support to independent media outlets and networks around the world, proposes engaging
media policies, and engages in efforts towards improving media laws and creating an enabling legal environment
for good, brave and enterprising journalism to fl ourish. In order to promote transparency and accountability,
and tackle issues of organized crime and corruption the Program also fosters quality investigative journalism.
Open Society Information ProgramThe Open Society Information Program works to increase public access to knowledge, facilitate civil society
communication, and protect civil liberties and the freedom to communicate in the digital environment. The
Program pays particular attention to the information needs of disadvantaged groups and people in less
developed parts of the world. The Program also uses new tools and techniques to empower civil society groups
in their various international, national, and local efforts to promote open society.
Open Society FoundationsThe Open Society Foundations work to build vibrant and tolerant democracies whose governments are
accountable to their citizens. Working with local communities in more than 70 countries, the Open Society
Foundations support justice and human rights, freedom of expression, and access to public health and education.