mapping land resource potential and agricultural pressure...
TRANSCRIPT
ACRC026 (F) Page 1 Monday, June 4, 2001 11:14 AM
Mapping Land Resource Potential and
Agricultural Pressure
in Papua New Guinea
An Outline of New Methods to Assist Rural Planning
Technical Report from ACIAR Project
ASEM 1996/044
L.W. Hanson, R.M. Bourke, B.J. Allen and T.J. McCarthy
Land Management Group
Department of Human Geography
Research School of Pacific and Asian Studies
The Australian National University
May 2001
The Australian Centre for International Agricultural Research (ACIAR) was established in
June 1982 by an Act of the Australian Parliament. Its primary mandate is to help identify
agricultural problems in developing countries and to commission collaborative research
between Australian and developing country researchers in fields where Australia has
special competence.
Where trade names are used this constitutes neither endorsement of nor
discrimination against any product by the Centre.
ACIAR TECHNICAL REPORT SERIES
This series of publications contains technical information resulting from ACIAR-
supported programs, projects and workshops (for which proceedings are not
published), reports on Centre-supported fact-finding studies, or reports on other
useful topics resulting from ACIAR activities. Publications in the series are
distributed internationally to selected individuals and scientific institutions.
© Australian Centre for International Agricultural Research, GPO Box 1571, Canberra ACT
2601, Australia.
Hanson, L.W., Bourke, R.M., Allen, B.J. and McCarthy, T.J. 2001. Mapping land resource
potential and agricultural pressure in Papua New Guinea: an outline of new methods to
assist rural planning. ACIAR Technical Reports No. 50, 52 pp.
ISBN 1 86320 299 4 (print)
1 86320 300 5 (electronic)
Design:
Clarus Design
, Canberra, Australia
Cover pictures from the collection of R.M. Bourke and B.J. Allen.
ACRC026 (F) Page 2 Monday, June 4, 2001 11:14 AM
ACRC026 (F) Page 3 Monday, June 4, 2001 11:14 AM
ContentsSummary 5
Acknowledgments 6
About the Authors 6
Abbreviations 7
List of Tables 7
List of Maps 8
Introduction 9
Why Papua New Guinea? 10
Report outline 11
Assessment of Land Resource Potential 12
Applications in Papua New Guinea 13
The PNG Resource Potential Assessment technique 14
Data availability and purpose 15
Numerical classification 17
Modified resource potential (MRP) 22
Results for the highlands region 26
Results for the lowland and island provinces 33
Limitations 34
Assessment of Land-use Intensity 36
Mapping land-use intensity in PNG 36
Results for the highlands region 37
Results for the lowland and island provinces 38
Assessment of Agricultural Pressure 40
The PNG Agricultural Pressure Assessment technique 40
Results for the highlands region 43
Results for the lowland and island provinces 46
Limitations 47
Data Applications and Further Information 49
References 50
3

ACRC026 (F) Page 4 Monday, June 4, 2001 11:14 AM
ACRC026 (F) Page 5 Monday, June 4, 2001 11:14 AM
Summary
This report outlines the development of new methods to assess land resource potential and
agricultural pressure in Papua New Guinea (PNG). Land resource potential was derived
through the classification of environmental data relevant to the growth and management of
crops under village conditions. Parameters such as annual rainfall, rainfall seasonality,
temperature, light, flooding, slope gradient and soil type were classified according to crop
growth constraints. The environmental requirements for sweet potato, being the most
important staple crop throughout PNG, were used to guide the classification. Predictions were
cross-checked with known sweet potato yields in different locations. The most productive
areas are those with the best combination of optimum conditions, or the fewest constraints.
The least productive areas are those with many constraints such as high rainfall, steep slopes,
poor soils, cold temperatures and frequent flooding.
Village agriculture in PNG involves management techniques that modify micro-
environments, reduce or overcome environmental constraints, and improve productivity.
These range from low input techniques such as long bush fallows and burning, to high input
techniques such as planted fallows, legume rotations, composting, mounding, drainage, soil
retention barriers and tillage. Where such practices are present and significant, land resource
potential was adjusted to account for improved management practices.
Agricultural pressure was derived from queries of land resource potential and land-
use intensity data, to highlight mismatches between the two. The areas identified range from
those having strong pressure, defined as high land-use intensity in low potential
environments, to no pressure, defined as low land-use intensity in high potential
environments. Areas of strong pressure have severe resource degradation problems, declining
crop yields and are vulnerable to food shortages, particularly during periods of drought or
frost.
Information on land resource potential and agricultural pressure is being used to
guide and prioritise the research activities of the PNG National Agricultural Research Institute
along with the rural development activities of international development donors and all levels
of government within the country. While the work is specific to PNG, the methods presented
are generic and applicable to most situations depending on data availability.
5
M
APPING
L
AND
R
ESOURCE
P
OTENTIAL
AND
A
GRICULTURAL
P
RESSURE
ACRC026 (F) Page 6 Monday, June 4, 2001 11:14 AM
Acknowledgments
The authors acknowledge the assistance and support of a number of collaborators in Australia
and Papua New Guinea. John McAlpine, Dr Clive Hackett and Dr Geoff Humphries shared
many years of accumulated knowledge on Papua New Guinea. Paul Nanninga contributed
ideas on classification methodology and the management of complex spatial data. Dr
Raghunath Ghodake, the late Balthasar Wayi and Valentine Kambori provided important
institutional support within Papua New Guinea, without which this project would not have
been possible. Laura Vallee and Michael Pretes edited the final report. The work was funded by
the Australian Centre for International Agricultural Research (ACIAR) and the Australian
Agency for International Development (AusAID), in collaboration with the Land Management
Group, Department of Human Geography, Australian National University.
About the Authors
Luke Hanson is a consulting land resource scientist specialising in land resource evaluation,
land-use planning and spatial information systems.
Email: [email protected]
Dr Mike Bourke is a consulting agriculturist with 30 years experience in the research and
development of Melanesian agricultural systems.
Email: [email protected]
Dr Bryant Allen is a research geographer with 30 years experience in Melanesian agriculture,
health, nutrition and rural development.
Email: [email protected]
Tess McCarthy is a geographic information scientist specialising in the management and
analysis of complex spatial data.
Email: [email protected]
6

ACRC026 (F) Page 7 Monday, June 4, 2001 11:14 AM
Abbreviations
ALES Automated Land Evaluation System
CI crop impact
CSIRO Commonwealth Scientific and Industrial Research Organisation
DEC Department of Environment and Conservation (of Papua New Guinea)
FAO Food and Agriculture Organisation of the United Nations
GIS geographic information system
LOM Law of the Minimum (Liebig’s)
MASP Mapping Agricultural Systems Project
MRP modified resource potential
PNG Papua New Guinea
PNGAPA Papua New Guinea Agricultural Pressure Assessment
PNGLES Papua New Guinea Land Evaluation System
PNGRIS Papua New Guinea Resource Information System
PNGRPA Papua New Guinea Resource Potential Assessment
RDOL relative degree of limitation
RMU resource mapping unit
RP resource potential
USDA United States Department of Agriculture
List of Tables
Table 1. A generalised soil productivity index for Papua New Guinea
(modified from Bleeker 1983). 17
Table 2. Relative degree of limitation (RDOL) classification ranges for the
Papua New Guinea (PNG) Resource Potential Assessment technique
guided by the environmental requirements for sweet potato production. 18
Table 3. Worked example of the Papua New Guinea (PNG)
Resource Potential Assessment numerical classification process. 21
Table 4. Resource potential classes and general description. 22
Table 5. Worked example of the modified resource potential classification. 25
Table 6. Resource potential (RP) results for selected highlands sites. 27
Table 7. Summary of resource potential classes in the highlands region. 30
Table 8. Modified resource potential (MRP) results for selected highlands sites. 32
7

M
APPING
L
AND
R
ESOURCE
P
OTENTIAL
AND
A
GRICULTURAL
P
RESSURE
ACRC026 (F) Page 8 Monday, June 4, 2001 11:14 AM
Table 9. Summary of modified resource potential (MRP) classes
in the highlands region. 33
Table 10. Summary of modified resource potential (MRP) class areas
in the lowland and island provinces. 34
Table 11. Crop impact (CI) index based on the classification of R-values
according to altitude. 41
Table 12. Queries used to identify agricultural pressure in the
Papua New Guinea Agricultural Pressure Assessment technique. 42
Table 13. Summary of strong agricultural pressure areas in the highlands region. 45
Table 14. Summary of moderate agricultural pressure areas
in the highlands region. 46
Table 15. Summary of marginal agricultural pressure areas
in the highlands region. 46
Table 16. Summary of agricultural pressure classes in the highlands region. 46
Table 17. Summary of agricultural pressure classes for lowland
and island provinces. 48
List of Maps
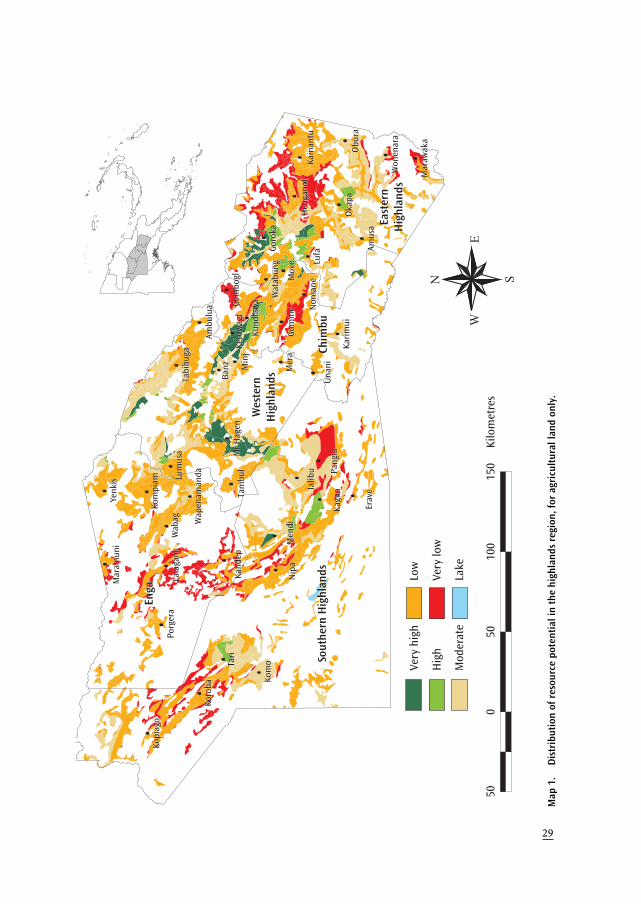
Map 1. Distribution of resource potential in the highlands region. 29
Map 2. Distribution of modified resource potential in the highlands region. 31
Map 3. Distribution of land-use intensity (R-values) in the highlands region. 39
Map 4. Distribution of agricultural pressure in the highlands region. 44
8

I
NTRODUCTION
ACRC026 (F) Page 9 Monday, June 4, 2001 11:14 AM
Introduction
Land is a dynamic and complex continuum of resources such as bedrock, soil,
vegetation, fauna and water, and processes such as precipitation, radiation,
evaporation, wind, weathering, erosion, nutrient cycling and photosynthesis.
Human utilisation of land requires some understanding of these resources and
processes, particularly their spatial and temporal distribution and variability.
Given inherent complexities, this requirement is difficult to realise when land is
considered in its entirety. For this reason, complex and often chaotic systems are
simplified into manageable categories and relationships through the process of
land classification. This process transforms the natural continuum of the
landscape into specified categories or classes with sharp boundaries.
Land classification systems are deterministic and driven by human
values, goals and objectives. They are developed to provide information for
particular purposes and needs at various scales and vary from simple, single-
parameter classifications to complex, multiple-parameter classifications.
Resource potential (RP) classifications involve the evaluation of primary
environmental parameters to determine variations in the productivity of land with
respect to the growth and management of plants. Such classifications can be
general or crop-specific and are a necessary step in the practical application of
complex environmental datasets. Agricultural pressure classifications involve the
integration of environmental and land-use information to determine areas where
land resources are degrading at present or may degrade in the future.
The concept of RP is well developed. Ecological literature relates the
concept to terms such as net primary productivity, biological productivity,
biophysical potential and biomass potential (Odum 1971; Gates 1980; Huggett
1995). Agricultural literature refers to terms such as land resource assessment,
land evaluation, land capability and land suitability (FAO 1976; Charman and
Murphy 1992; Davidson 1992; Roberts 1995).
The concept of agricultural pressure is less developed and is defined, in
this study, as a measure of the risk of resource degradation resulting from
intensive agriculture on land resources. Resource degradation is defined as
change to land resources and/or ecological processes resulting in lower crop
productivity. Examples of degradation include soil loss, soil structure decline, soil
fertility decline, altered plant succession, altered water balances and altered
micro-climates.
9
M
APPING
L
AND
R
ESOURCE
P
OTENTIAL
AND
A
GRICULTURAL
P
RESSURE
ACRC026 (F) Page 10 Monday, June 4, 2001 11:14 AM
This report outlines the development of improved methods to assess land
RP and agricultural pressure in Papua New Guinea (PNG) through the
classification of complex spatial data. The work was funded by the Australian
Centre for International Agricultural Research (ACIAR) and the Australian Agency
for International Development (AusAID) at the request of the PNG National
Agricultural Research Institute (NARI). Outcomes are being used to guide and
prioritise the research activities of NARI along with the broader rural development
activities of international development donors and planners at all levels of
government within PNG. While the work is specific to PNG, the methods presented
are generic and applicable to most situations depending on data availability.
Why Papua New Guinea?
The PNG population doubled between 1970–2000 and is presently growing at a
mean annual rate of 2.3% (Keig 1999). More than three-quarters of the total
population, or almost four million people, are smallholder semi-subsistence
farmers who are sustained by their own food production systems, supported by
some cash cropping (Allen et al. 1995).
While population growth is significant, there has been little expansion of
agricultural land (McAlpine 2001), which implies a significant intensification of
agriculture within existing boundaries. Thus, more food than ever before is being
produced from the same area of land. Allen et al. (1995) suggest that most
agricultural systems in PNG are intensifying through the combination of
shortened bush fallows and longer cropping periods supported by the adoption of
more efficient crops such as sweet potato, Chinese taro and triploid bananas.
Various soil fertility maintenance techniques such as composting, legume rotation
and improved fallows have been applied in some areas to help maintain
production. However, little is known about how effective these techniques are in
the long term. If current trends continue, the sustainability of some agricultural
systems will be threatened.
PNG has detailed spatial data that can be used to methodically assess RP
and agricultural pressure for the entire country. Over 30 years of land resource
and land-use research, predominantly by the Australian Commonwealth Scientific
and Industrial Research Organisation (CSIRO) and the Australian National
University, has resulted in two detailed spatial databases. The Papua New Guinea
Resource Information System (PNGRIS), completed in 1986, provides 1:500,000
scale data on environmental attributes such as altitude, terrain, bedrock, slope
10

I
NTRODUCTION
ACRC026 (F) Page 11 Monday, June 4, 2001 11:14 AM
gradient, relief, rainfall, temperature, soils, vegetation and inundation through
‘resource mapping units’ (RMUs) (Bellamy 1986). The Mapping Agricultural
Systems Project (MASP) database, completed in 1998, provides 1:500,000 scale
data on subsistence agriculture such as staple crops, fallow length, fallow
vegetation, cropping period, land-use intensity, soil management practices, cash
earning activities and rural population (Allen et al. 1995). While both databases
use unrelated mapping units, they can be combined through either simple
cartographic overlay or more sophisticated geographic information system (GIS)
methods.
An understanding of the spatial variability of RP and the identification of
areas vulnerable to resource degradation will assist with the research, planning
and development of more sustainable agricultural systems in PNG.
Report outline
The next section of this report discusses the evolution of RP assessment
techniques and their application in PNG. Issues include mapping scales, data
reliability, classification techniques and limitations. Next, an improved method
for PNG is presented and supported by discussion of data availability, selection of
input parameters, numerical classification and land management adjustments.
Worked examples are provided to demonstrate the classification process. Results
and limitations of RP and modified resource potential (MRP) for the five highland
provinces are discussed. Following that, the assessment and mapping of land-use
intensity in PNG is outlined, and results and limitations for the highlands region
are discussed. The last major section presents the agricultural pressure
assessment technique that combines MRP and land-use intensity data. Results
and limitations for the highlands region are discussed.
11

M
APPING
L
AND
R
ESOURCE
P
OTENTIAL
AND
A
GRICULTURAL
P
RESSURE
ACRC026 (F) Page 12 Monday, June 4, 2001 11:14 AM
Assessment of Land Resource Potential
Modern RP assessment techniques evolved midway through the twentieth century
in response to devastating land degradation throughout Australia, Africa, India
and the United States (Burrough 1978). The United States Department of
Agriculture (USDA) land capability technique (Klingebiel and Montgomery 1961)
pioneered land evaluation endeavours and is still the principal method used
worldwide, either directly or in modified forms.
The USDA method assesses the potential productivity of primary land
uses based on ecological parameters such as soil depth, soil structure, soil texture,
landform, altitude, rainfall, temperature and growing season. The technique
utilises the parametric approach to land classification, which gathers specific
ecological parameters independently and then combines them to form land
capability classes. Each of the eight capability classes within the classification are
determined by limitations to land use such as erosion hazard, flood risk, slope
gradient, stoniness, low fertility, rooting zone restriction and climate. Thus, as
limitations increase, land-use options decrease.
Limitations to techniques based on the USDA method are well
understood and documented by authors such as Moss (1978, 1985), Rowe (1980),
McKenzie (1991), Davidson (1992), Bouma et al. (1993), Gessler and McKenzie
(1995), Hollingsworth et al. (1995) and Thwaites (1995). Common criticisms
include: biased assumptions about suitable land utilisation strategies, such as
permanent annual cropping on high potential land and forestry on low potential
land only; the inadequate identification of permanent and temporary land-use
constraints; and the qualitative and often unverifiable nature of data processing
methods.
These limitations have, to some extent, been addressed by the United
Nations Food and Agriculture Organization land evaluation technique (FAO 1976,
1984a,b), which utilises ecological parameters directly relevant to crop growth
through verifiable and repeatable data-processing methods. This technique is
focused on providing levels of suitability for predefined land-use types based on
complex land qualities such as water availability, nutrient availability, oxygen
availability, rooting conditions and erosion hazard (FAO 1976). The conceptual
framework of this technique has been widely adopted and in some cases
improved.
12

A
SSESSMENT
OF
L
AND
R
ESOURCE
P
OTENTIAL
ACRC026 (F) Page 13 Monday, June 4, 2001 11:14 AM
The Site Productivity and Land Suitability Classification developed by
Laffan (1993) utilises Food and Agriculture Organisation of the United Nations
(FAO) land qualities to determine suitability for crop growth supported by
additional land qualities, such as trafficability, workability, flood hazard, erosion
hazard and landslide hazard, to determine suitability for practical land
management. The Automated Land Evaluation System (ALES) developed by
Rossiter and Van Wambeke (1991) has further improved the FAO technique
through automation of the evaluation process, use of decision trees for
classification, and ability to query outcomes. In addition, ALES can determine
economic suitability through techniques such as gross margin analysis, predicted
net present value, cost/benefit ratios and internal rates of return.
Hackett (1988, 1991) has also addressed limitations of the USDA
technique through the PLANTGRO software, which predicts the growth
performance of annual and perennial plants based on a rigorous and pragmatic
selection of soil and climate parameters. Such parameters are processed in
relation to plant response information using Liebig’s Law of the Minimum (LOM),
which states that plant yields are driven by the most limiting ecological parameter
even if all other parameters are optimal (Hackett 1991). The LOM approach is
relatively rigorous compared to numerical classifications based on weighted
additions or multiplications. The limitation, however, is that the LOM
classification used in PLANTGRO produces smoothed and simplified results that
underestimate the range and spatial variation of crop potential.
Applications in Papua New Guinea
The USDA land capability, FAO land evaluation and PLANTGRO techniques have
had some application in PNG. The notable constraint is lack of consistency, with
each technique being applied for different purposes at different scales and with
different input data.
The USDA technique was used by the CSIRO to evaluate the 1:250,000
scale Land Systems data completed between 1953–1972 for roughly one-third of
the country. While the derived RP data are the most detailed available for such a
large area, the evaluation was based on industrial agricultural values that were
biased towards high-input land-use systems, such as arable crops, improved
pastures, tree crops and flooded rice, not low-input subsistence gardening and
cash cropping (CSIRO 1965, 1968, 1970, 1972).
13
M
APPING
L
AND
R
ESOURCE
P
OTENTIAL
AND
A
GRICULTURAL
P
RESSURE
ACRC026 (F) Page 14 Monday, June 4, 2001 11:14 AM
The USDA technique was also used to generate the 1975 CSIRO 1:1,000,000
scale Land Limitation and Agricultural Land Use Potential map for the entire
country (Bleeker 1975). This evaluation was structured on land-use limitations such
as low soil fertility, rockiness, drought risk, poor soil drainage, seasonal flooding
and erosion hazard, which were derived from the CSIRO 1:1,000,000 scale
geomorphology, vegetation, soils and climate datasets. Like the previous example,
the output data were constrained by a bias towards capital-intensive land uses, not
village agriculture.
The FAO land evaluation technique was applied in the national 1:500,000
scale Papua New Guinea Land Evaluation System (PNGLES) through the ALES
software, which determined suitability for the smallholder production of 18 crops
at both low and high levels of management (Venema and Daink 1992). Input data
describing land qualities such as temperature, erosion hazard, moisture
conditions, nutrient availability, rooting conditions, oxygen availability and
toxicities were derived from PNGRIS. It is important to note that PNGRIS data are
derived from the compilation and extrapolation of various natural resource
datasets previously completed at different scales for different purposes.
Consequently, the accuracy and reliability of PNGRIS data vary with location and
attribute, particularly locally variable data such as soils and slope. This variability
is the principal limitation to PNGLES outcomes as approximately 50% of the input
data are derived from the PNGRIS soils dataset (Trangmar et al. 1995).
PLANTGRO was tested as part of the PNGLES project through a trial
evaluation of five crops in the Upper Ramu Valley. Trangmar et al. (1995) note that
an advantage of PLANTGRO outcomes is the identification of seasonal climate
limitations for each crop, while constraints include the inability to consider land
management factors, significant reliance upon PNGRIS soils data, limited
mapping facilities and the production of conservative outcomes through LOM
data processing.
The PNG Resource Potential Assessment technique
The PNG Resource Potential Assessment (PNGRPA) technique draws upon the
proven features of previous work completed by the FAO (1976, 1984a,b), Bellamy
(1986), Hackett (1988, 1991) and Laffan (1993). The technique uses reliable data,
which are relevant to the growth and management of crops under smallholder
conditions, through a verifiable LOM-based numerical classification method that
is modified to overcome previous smoothing limitations. Where poorer quality
14

A
SSESSMENT
OF
L
AND
R
ESOURCE
P
OTENTIAL
ACRC026 (F) Page 15 Monday, June 4, 2001 11:14 AM
data have been used, potential errors have been highlighted and tracked. Major
and minor environmental constraints are identified for each mapping unit.
Operation within an automated computing environment enables flexibility to
modify expert-driven data ranges depending on specific evaluation purposes.
Data availability and purpose
The PNGRPA technique draws on data from the PNG Department of Environment
and Conservation (DEC), the Australian Geological Survey Organisation, PNGRIS
and MASP.
PNGRIS parameters mapped accurately at 1:500,000 scale are those that
are relatively homogeneous over large areas. Such parameters are easy to
recognise and map. Examples include the landform and topography datasets. The
reliability of other parameters declines as either the scale of the environmental
process declines, or the level of interpretation and extrapolation increases. For
example, the slope gradient, inundation and soil type datasets are somewhat
unreliable as they are highly variable at the local scale and are thus generalised or
smoothed when mapped at the PNGRIS scale. The reliability of the annual rainfall
and rainfall seasonality datasets is variable as they are based on extrapolation
from point sources. The rainfall datasets have additional constraints as each
province was mapped individually then joined together, resulting in significant
mismatches along provincial boundaries. Where alternative data sources are not
available, PNGRIS data are generalised to reduce the potential for error
propagation through the classification process. The parameters used in the
PNGRPA technique are as follows.
� Annual Rainfall affects crop growth through soil moisture availability.
The dataset is derived from the DEC climate surfaces completed through the
World Bank-funded BioRap Project. The annual rainfall surface is based on the
interpolation of meteorological station records using the ANUDEM and
ANUSPLIN software packages (Margules and Redhead 1995). The dataset was
summarised into a PNGRIS RMU format and rounded to the nearest millimetre. It
was then added to the PNGRIS database as a revised annual rainfall field. The
dataset is considerably more reliable than the PNGRIS equivalent.
� Rainfall Seasonality affects crop growth through seasonal soil moisture
fluctuations. The dataset is derived from the DEC climate surfaces in the same way
as the annual rainfall dataset. There are no units of measurement for this field as it
represents relative variation on a monthly basis. The dataset is considerably more
reliable than the PNGRIS equivalent.
15
M
APPING
L
AND
R
ESOURCE
P
OTENTIAL
AND
A
GRICULTURAL
P
RESSURE
ACRC026 (F) Page 16 Monday, June 4, 2001 11:14 AM
� Temperature affects crop growth by influencing photosynthesis rates and
soil fertility cycles through the breakdown of humus. All plants have temperature
thresholds, within which growth rates vary and outside of which plants will not
survive. The dataset was derived from PNGRIS and covers the range of maximum
and minimum temperatures in degrees Celsius but does not cover seasonal
variations, as they are slight in PNG and considerably less than the daily range
(Bellamy 1986). The dataset is very reliable as it is based on well known
relationships between temperature and altitude, the latter being derived from the
1:100,000 PNG Topographic Series.
� Light affects crop growth through various triggers on physiological
mechanisms such as changes in life cycle. Because few PNG meteorological
stations have recorded light intensity, cloud cover has been adopted as a relatively
accurate surrogate. Cloud information was derived from the Australian Geological
Survey Organisation Drought Assessment Project (Bierwirth and McVicar 1998)
that compiled and analysed advanced very high radiometric resolution (AVHRR)
satellite data for PNG over a two-year period. A byproduct of this project was a
simple and reliable index of ‘cloudiness’ based on seasonal (January, April, July
and October) images. The dataset was summarised into a PNGRIS RMU format,
rounded to a five-level classification and added to the PNGRIS database as a ‘cloud
cover’ field. There are no units of measurement for this field as it represents
relative variation on a seasonal basis.
� Inundation affects crop growth and management through either short-
term destructive flood regimes or long-term waterlogging. The dataset was
derived from PNGRIS and is based on interpretations of landform, vegetation and
annual rainfall. The data have variable reliability due to the smoothing of local-
scale flood-free areas that can not be delineated at the PNGRIS 1:500,000 scale.
� Slope gradient affects crop growth and management through influences
on soil erosion, drainage, nutrient leaching, solar radiation receipt and labour
requirements. The dataset was derived from PNGRIS and is based on distances
between contours on the 1:100,000 PNG Topographic Series. The data have
variable reliability due to the smoothing of local-scale deviations, but PNGRIS has,
to some extent, accounted for this through the classification of up to two slope
gradient classes within each RMU.
� Soil type affects crop growth and management through influences on
nutrient availability, nutrient retention, rooting conditions, soil stability and
water availability. The dataset was derived from PNGRIS and is based on the soil
taxonomy classification of PNG soils completed by Bleeker (1983) and the CSIRO
16

A
SSESSMENT
OF
L
AND
R
ESOURCE
P
OTENTIAL
ACRC026 (F) Page 17 Monday, June 4, 2001 11:14 AM
Land Research Series (1964–76). The data have variable reliability due to the
smoothing of local scale deviations, but PNGRIS has partially accounted for this
through the classification of up to three soil-type classes within each RMU.
It is important to note that reliability problems associated with PNGRIS
soils data are controlled to some extent in the PNGRPA technique through the use
of a generalised soil productivity index, presented in Table 1, which was developed
through interpretation of the physical and chemical properties of each PNGRIS
soil type. The index is more compatible with the classification of large scale data
and reduces the chance of error propagation.
Numerical classification
Resource potential for each RMU is determined through a relatively simple
parametric technique that first classifies the seven input parameters based on
relative degrees of limitation (RDOL) to crop growth and management and then
Table 1. A generalised soil productivity index for Papua New Guinea (modified from Bleeker1983).
Soil productivity RDOLa value US soil taxonomy class
High 1 Tropofluvents, Hydrandepts, Eutrandepts, Dystrandepts, Vitrandepts, Durandepts, Hapludolls
Moderate 2 Ustifluvents, Tropopsamments, Ustipsamments, Humitropepts, Eutropepts, Dystropepts, Pelluderts, Pellusterts, Calciustolls, Natrustolls, Argiustolls, Rhodustalfs, Haplustalfs, Rhodudalfs
Low 3 Troporthents, Cryorthents, Ustorthents, Tropaquepts, Plinthaquepts, Cryandepts, Ustropepts, Argiaquolls, Haplaquolls, Rendolls, Albaqualfs, Plinthaqualfs, Tropaqualfs, Natrustalfs, Natrudalfs, Tropudalfs, Rhodudalts, Tropudalts
Very low 4 Cryaquents, Sulfaquents, Hydraquents, Fluvaquents, Tropaquents, Psammaquents, Cryofolists, Tropofolists, Sulfihemists, Cryohemists, Tropohemists, Cryofibrists, Tropofibrists, Troposaprists, Halaquepts, Cryaquepts, Andaquepts, Cryochrepts, Cryumbrepts, Paleaquults, Plinthaquults, Albaquults, Tropaquults, Palehumults, Plinthohumults, Tropohumults, Paleudults, Plinthudults, Haplohumox, Acrohumox, Haplorthox, Eutrothox
a RDOL = relative degrees of limitation
17
M
APPING
L
AND
R
ESOURCE
P
OTENTIAL
AND
A
GRICULTURAL
P
RESSURE
ACRC026 (F) Page 18 Monday, June 4, 2001 11:14 AM
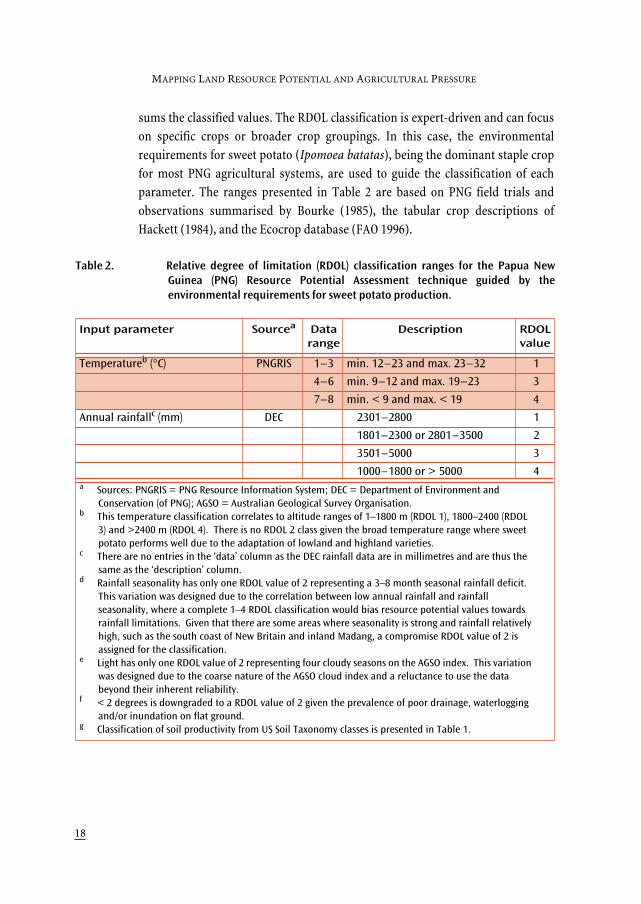
sums the classified values. The RDOL classification is expert-driven and can focus
on specific crops or broader crop groupings. In this case, the environmental
requirements for sweet potato (Ipomoea batatas), being the dominant staple crop
for most PNG agricultural systems, are used to guide the classification of each
parameter. The ranges presented in Table 2 are based on PNG field trials and
observations summarised by Bourke (1985), the tabular crop descriptions of
Hackett (1984), and the Ecocrop database (FAO 1996).
Table 2. Relative degree of limitation (RDOL) classification ranges for the Papua NewGuinea (PNG) Resource Potential Assessment technique guided by theenvironmental requirements for sweet potato production.
Input parameter Sourcea Datarange
Description RDOLvalue
Temperatureb (°C) PNGRIS 1–3 min. 12–23 and max. 23–32 1
4–6 min. 9–12 and max. 19–23 3
7–8 min. < 9 and max. < 19 4
Annual rainfallc (mm) DEC 2301–2800 1
1801–2300 or 2801–3500 2
3501–5000 3
1000–1800 or > 5000 4a Sources: PNGRIS = PNG Resource Information System; DEC = Department of Environment and
Conservation (of PNG); AGSO = Australian Geological Survey Organisation.b This temperature classification correlates to altitude ranges of 1–1800 m (RDOL 1), 1800–2400 (RDOL
3) and >2400 m (RDOL 4). There is no RDOL 2 class given the broad temperature range where sweet potato performs well due to the adaptation of lowland and highland varieties.
c There are no entries in the ‘data’ column as the DEC rainfall data are in millimetres and are thus the same as the ‘description’ column.
d Rainfall seasonality has only one RDOL value of 2 representing a 3–8 month seasonal rainfall deficit. This variation was designed due to the correlation between low annual rainfall and rainfall seasonality, where a complete 1–4 RDOL classification would bias resource potential values towards rainfall limitations. Given that there are some areas where seasonality is strong and rainfall relatively high, such as the south coast of New Britain and inland Madang, a compromise RDOL value of 2 is assigned for the classification.
e Light has only one RDOL value of 2 representing four cloudy seasons on the AGSO index. This variation was designed due to the coarse nature of the AGSO cloud index and a reluctance to use the data beyond their inherent reliability.
f < 2 degrees is downgraded to a RDOL value of 2 given the prevalence of poor drainage, waterlogging and/or inundation on flat ground.
g Classification of soil productivity from US Soil Taxonomy classes is presented in Table 1.
18
A
SSESSMENT
OF
L
AND
R
ESOURCE
P
OTENTIAL
ACRC026 (F) Page 19 Monday, June 4, 2001 11:14 AM
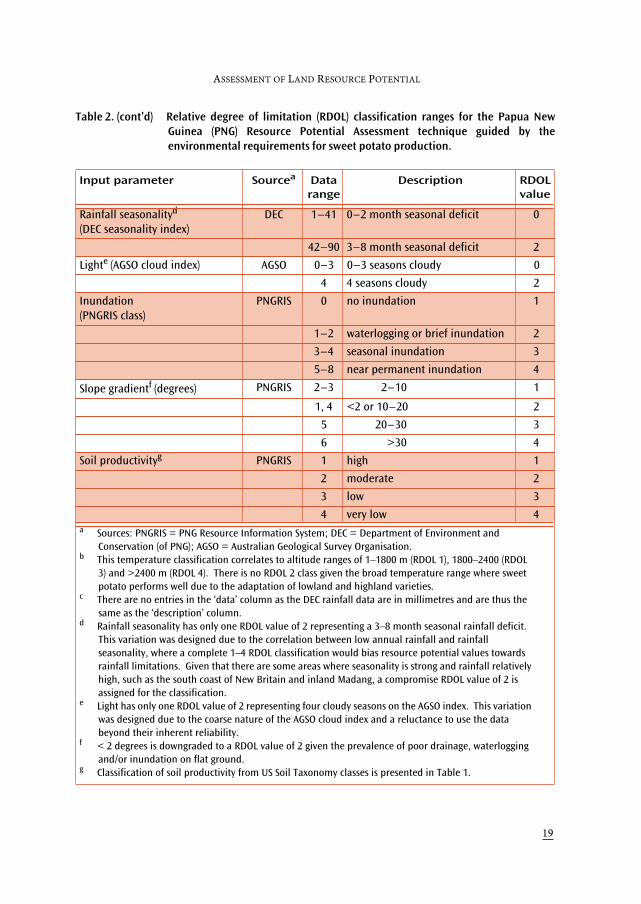
Rainfall seasonalityd
(DEC seasonality index)DEC 1–41 0–2 month seasonal deficit 0
42–90 3–8 month seasonal deficit 2
Lighte (AGSO cloud index) AGSO 0–3 0–3 seasons cloudy 0
4 4 seasons cloudy 2
Inundation(PNGRIS class)
PNGRIS 0 no inundation 1
1–2 waterlogging or brief inundation 2
3–4 seasonal inundation 3
5–8 near permanent inundation 4
Slope gradientf (degrees) PNGRIS 2–3 2–10 1
1, 4 <2 or 10–20 2
5 20–30 3
6 >30 4
Soil productivityg PNGRIS 1 high 1
2 moderate 2
3 low 3
4 very low 4
Table 2. (cont’d) Relative degree of limitation (RDOL) classification ranges for the Papua NewGuinea (PNG) Resource Potential Assessment technique guided by theenvironmental requirements for sweet potato production.
Input parameter Sourcea Datarange
Description RDOLvalue
a Sources: PNGRIS = PNG Resource Information System; DEC = Department of Environment and Conservation (of PNG); AGSO = Australian Geological Survey Organisation.
b This temperature classification correlates to altitude ranges of 1–1800 m (RDOL 1), 1800–2400 (RDOL 3) and >2400 m (RDOL 4). There is no RDOL 2 class given the broad temperature range where sweet potato performs well due to the adaptation of lowland and highland varieties.
c There are no entries in the ‘data’ column as the DEC rainfall data are in millimetres and are thus the same as the ‘description’ column.
d Rainfall seasonality has only one RDOL value of 2 representing a 3–8 month seasonal rainfall deficit. This variation was designed due to the correlation between low annual rainfall and rainfall seasonality, where a complete 1–4 RDOL classification would bias resource potential values towards rainfall limitations. Given that there are some areas where seasonality is strong and rainfall relatively high, such as the south coast of New Britain and inland Madang, a compromise RDOL value of 2 is assigned for the classification.
e Light has only one RDOL value of 2 representing four cloudy seasons on the AGSO index. This variation was designed due to the coarse nature of the AGSO cloud index and a reluctance to use the data beyond their inherent reliability.
f < 2 degrees is downgraded to a RDOL value of 2 given the prevalence of poor drainage, waterlogging and/or inundation on flat ground.
g Classification of soil productivity from US Soil Taxonomy classes is presented in Table 1.
19
MAPPING LAND RESOURCE POTENTIAL AND AGRICULTURAL PRESSURE
ACRC026 (F) Page 20 Monday, June 4, 2001 11:14 AM
Given the heterogeneous nature of PNGRIS mapping units, additional
steps are required to prepare slope gradient and soils data for the final
classification as the former has up to two and the latter up to three classes within
each RMU. Processing of these parameters is based on one class representing
100% of the RMU, two classes representing 40 and 60% of the RMU and three
classes representing 30, 30 and 40% of the RMU. Final RDOL values are derived
through a weighted addition for each RMU.
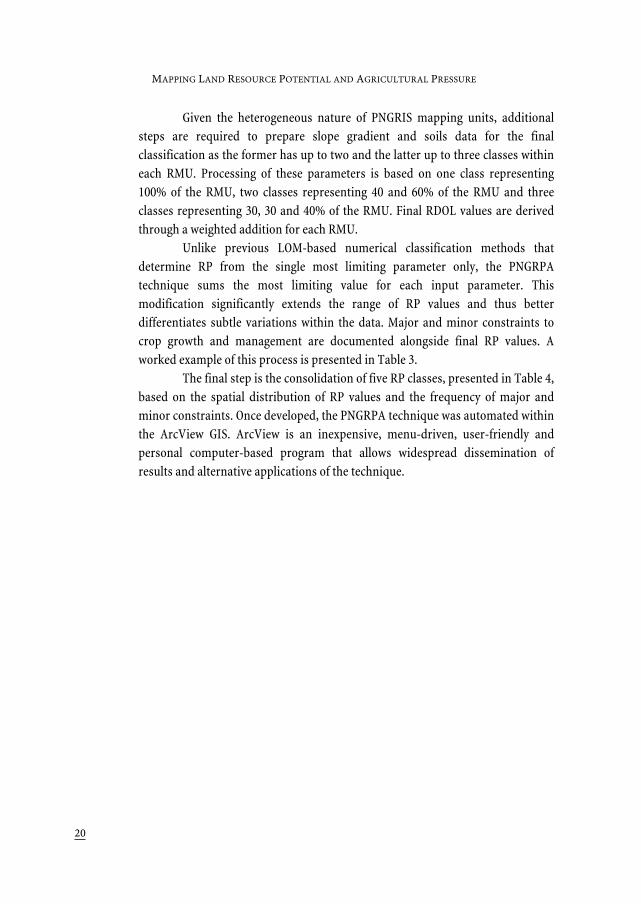
Unlike previous LOM-based numerical classification methods that
determine RP from the single most limiting parameter only, the PNGRPA
technique sums the most limiting value for each input parameter. This
modification significantly extends the range of RP values and thus better
differentiates subtle variations within the data. Major and minor constraints to
crop growth and management are documented alongside final RP values. A
worked example of this process is presented in Table 3.
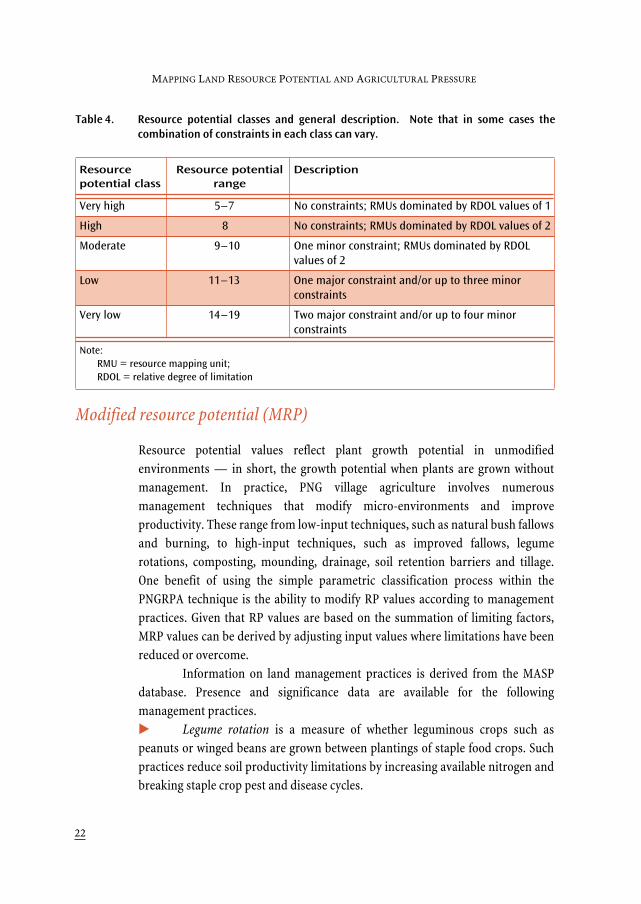
The final step is the consolidation of five RP classes, presented in Table 4,
based on the spatial distribution of RP values and the frequency of major and
minor constraints. Once developed, the PNGRPA technique was automated within
the ArcView GIS. ArcView is an inexpensive, menu-driven, user-friendly and
personal computer-based program that allows widespread dissemination of
results and alternative applications of the technique.
20
ASSESSMENT OF LAND RESOURCE POTENTIAL
ACRC026 (F) Page 21 Monday, June 4, 2001 11:14 AM
Table 3. Worked example of the Papua New Guinea (PNG) Resource Potential Assessmentnumerical classification process.
Parameter Data Workingvalue
RDOLvalue
Temperature (°C) min. 19–23max. 30–32
1 1
Annual rainfall (mm) 3650 3 3
Rainfall seasonality(DEC index)
45 2 2
Light(AGSO cloud index)
3 0 0
Inundation(PNGRIS class)
none 1 1
Slope gradient(degrees)
> 30 (60%)20–30 (40%)
4 × 0.6 = 2.43 × 0.4 = 1.2
(3.6) 4a
Soil productivity Cyrofolist (40%)Hydrandept (30%)Cyrorthent (30%)
4 × 0.4 = 1.61 × 0.3 = 0.33 × 0.3 = 0.9
(2.8)3b
Resource potential value 14c
Major constraints Slope gradient (S)d
Minor constraints Annual rainfall (a)e
Soil productivity (r)
Note: RDOL = relative degree of limitation; DEC = Department of Environment and Conservation (of PNG); AGSO = Australian Geological Survey Organisation; PNGRIS = PNG Resource Information System.
a RDOL value for slope gradient is derived from the weighted addition of the two input values (4 × 0.6 + 3 × 0.4 = 3.6) and rounding up to 4.
b RDOL value for soil productivity is derived from the weighted addition of the three input values (4 × 0.4 + 1 × 0.3 + 3 × 0.9 = 2.8) and rounding up to 3.
c Resource potential value of 14 is derived from the addition of all seven RDOL values (1 + 3 + 2 + 0 + 1 + 4 + 3 = 14).
d Slope gradient is considered a major constraint as it has the maximum limitation value of 4. Such constraints are represented by the following UPPER case letters: slope gradient (S); temperature (T); annual rainfall (A); inundation (I); and soil productivity (R). Rainfall seasonality and light can not be major or minor constraints within this classification as the maximum and only possible RDOL value is 2.
e Annual rainfall and soil productivity are considered minor constraints as they have the second highest limitation value of 3. Such constraints are represented by the following lower case letters: slope gradient (s); temperature (t); annual rainfall (a); inundation (i); and soil productivity (r).
21
MAPPING LAND RESOURCE POTENTIAL AND AGRICULTURAL PRESSURE
ACRC026 (F) Page 22 Monday, June 4, 2001 11:14 AM
Modified resource potential (MRP)
Resource potential values reflect plant growth potential in unmodified
environments — in short, the growth potential when plants are grown without
management. In practice, PNG village agriculture involves numerous
management techniques that modify micro-environments and improve
productivity. These range from low-input techniques, such as natural bush fallows
and burning, to high-input techniques, such as improved fallows, legume
rotations, composting, mounding, drainage, soil retention barriers and tillage.
One benefit of using the simple parametric classification process within the
PNGRPA technique is the ability to modify RP values according to management
practices. Given that RP values are based on the summation of limiting factors,
MRP values can be derived by adjusting input values where limitations have been
reduced or overcome.
Information on land management practices is derived from the MASP
database. Presence and significance data are available for the following
management practices.
� Legume rotation is a measure of whether leguminous crops such as
peanuts or winged beans are grown between plantings of staple food crops. Such
practices reduce soil productivity limitations by increasing available nitrogen and
breaking staple crop pest and disease cycles.
Table 4. Resource potential classes and general description. Note that in some cases thecombination of constraints in each class can vary.
Resourcepotential class
Resource potential range
Description
Very high 5–7 No constraints; RMUs dominated by RDOL values of 1
High 8 No constraints; RMUs dominated by RDOL values of 2
Moderate 9–10 One minor constraint; RMUs dominated by RDOL values of 2
Low 11–13 One major constraint and/or up to three minor constraints
Very low 14–19 Two major constraint and/or up to four minor constraints
Note:RMU = resource mapping unit;RDOL = relative degree of limitation
22
ASSESSMENT OF LAND RESOURCE POTENTIAL
ACRC026 (F) Page 23 Monday, June 4, 2001 11:14 AM
� Planted tree fallows are a measure of whether tree species such as
Casuarina oligodon are planted in final-year gardens to reduce soil productivity
limitations by increasing available nutrients, notably nitrogen, during the fallow
period.
� Compost is a measure of whether organic matter is placed in gardens to
reduce soil productivity limitations by increasing soil fertility.
� Contribution of silt from flooding is a measure of whether silt from floods
is deposited either regularly or sporadically in gardens, reducing soil productivity
limitations by increasing soil fertility.
� Animal manure is a measure of whether animal manure is placed in
gardens to reduce soil productivity limitations by increasing soil fertility.
� Inorganic fertiliser is a measure of whether inorganic fertiliser is placed in
gardens to reduce soil productivity limitations by increasing soil fertility.
� Soil retention barriers are a measure of whether planted barriers such as
tanget (Cordyline fruticosa) or structures such as pegged logs, fences or stone
walls are used to reduce the down-slope movement of topsoil.
� Soil tillage is a measure of whether soil is tilled before crops are planted to
reduce soil productivity limitations by improving soil structure, drainage and
aeration.
� Drains are a measure of whether ditches are used around and within
gardens to reduce soil productivity and annual rainfall limitations by removing
excess surface and/or groundwater.
� Mounds (small, medium and large) are a measure of whether soil is
formed into circular mounds of varying dimensions within gardens to reduce soil
productivity and annual rainfall limitations by improving soil structure, drainage
and aeration and removing excess surface water.
� Garden beds (square and long) are a measure of whether soil is raised into
elevated beds within gardens to reduce soil productivity and annual rainfall
limitations by improving soil structure, drainage and aeration and removing
excess surface water.
Given that MASP and PNGRIS have different mapping units, the first step
in the MRP classification is to overlay and join the mapping units. This ensures
that RPs are modified only where land management adjustments are made. The
result of this joining process is 40,000 unique polygons covering all provinces in
PNG.
The land management adjustments take two steps. Where the above land
management practices are present and significant (codes two and three) in the
23

MAPPING LAND RESOURCE POTENTIAL AND AGRICULTURAL PRESSURE
ACRC026 (F) Page 24 Monday, June 4, 2001 11:14 AM
MASP database, adjustments are made to RP values for each RMU. For example,
where fallow vegetation, legume rotation, animal manure, silt from flooding,
artificial fertiliser and/or soil retention barriers are present and significant, one
RDOL value per management practice is subtracted from the final RP value,
reflecting improvements to soil fertility. Where small mounds, large mounds,
square beds and long beds are present and significant, one RDOL value is
subtracted from the final RP value, reflecting improvements to soil drainage and
in some cases soil structure. Where composting is present and significant, two
RDOL values are subtracted from the final RP value, reflecting significant
improvements to soil fertility and soil structure. Note that where drains or tillage
are present and significant, one RDOL value is subtracted from the final RP value
only when mounds or beds are not present, as such management practices tend to
overcome the same environmental constraints.
The second step involves more complicated rules to correct possible
anomalies between management practices and environmental conditions. For
example, Wood (1984) demonstrated that composting and mounding on slopes
greater than 10 degrees in the Tari Basin of Southern Highlands Province often led
to erosion during intense rainfall events. Thus while the practices on one hand
improve soil fertility and soil structure, they also have negative effects that must
be accounted for. Where such practices occur on slopes over 10 degrees, one RDOL
value per practice is added back to the final RP value, negating the allocated
improvement from the first step. Where mounds, large mounds, drains or beds
are present and inundation is severe (defined as greater than ‘long term
inundation’ in PNGRIS), two RDOL values are subtracted from the final RP value,
reflecting significant improvements to soil drainage. Such adjustments account
for situations where swamps and/or floodplains have been drained, resulting in
the cropping of fertile organic soils. A worked example of the MRP classification
process is presented in Table 5.
24
ASSESSMENT OF LAND RESOURCE POTENTIAL
ACRC026 (F) Page 25 Monday, June 4, 2001 11:14 AM
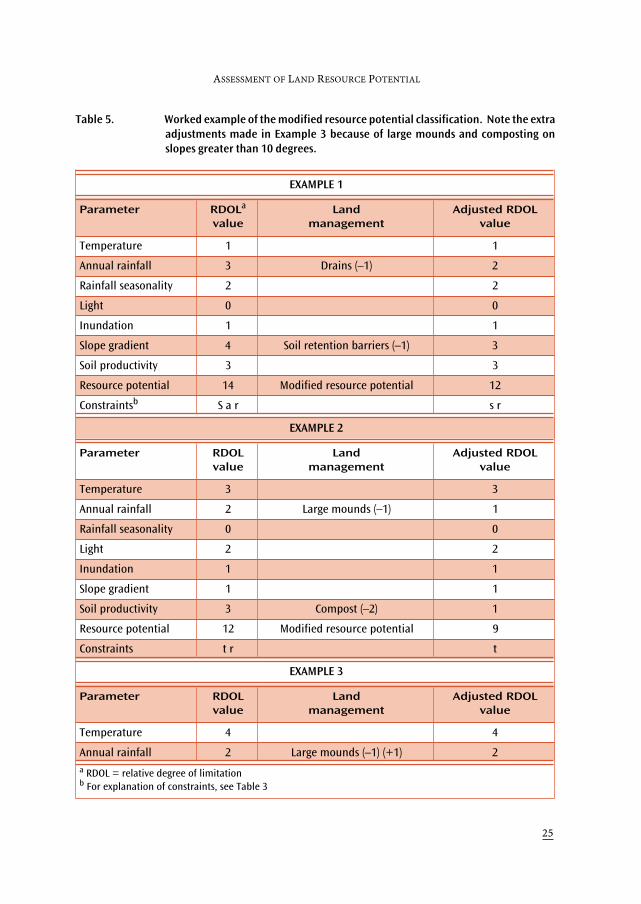
Table 5. Worked example of the modified resource potential classification. Note the extraadjustments made in Example 3 because of large mounds and composting onslopes greater than 10 degrees.
EXAMPLE 1
Parameter RDOLa
valueLand
managementAdjusted RDOL
value
Temperature 1 1
Annual rainfall 3 Drains (–1) 2
Rainfall seasonality 2 2
Light 0 0
Inundation 1 1
Slope gradient 4 Soil retention barriers (–1) 3
Soil productivity 3 3
Resource potential 14 Modified resource potential 12
Constraintsb S a r s r
EXAMPLE 2
Parameter RDOLvalue
Landmanagement
Adjusted RDOL value
Temperature 3 3
Annual rainfall 2 Large mounds (–1) 1
Rainfall seasonality 0 0
Light 2 2
Inundation 1 1
Slope gradient 1 1
Soil productivity 3 Compost (–2) 1
Resource potential 12 Modified resource potential 9
Constraints t r t
EXAMPLE 3
Parameter RDOLvalue
Landmanagement
Adjusted RDOL value
Temperature 4 4
Annual rainfall 2 Large mounds (–1) (+1) 2a RDOL = relative degree of limitationb For explanation of constraints, see Table 3
25

MAPPING LAND RESOURCE POTENTIAL AND AGRICULTURAL PRESSURE
ACRC026 (F) Page 26 Monday, June 4, 2001 11:14 AM
Ideally, the constraints that the management practices reduce or
overcome should be directly related to the structure of the RP classification. That
is, if a site is constrained by permanent inundation (RDOL value of four)
according to PNGRIS but is completely drained according to MASP, then the RDOL
value should be adjusted from four to one. This does in fact happen in the MRP
classification. The situation becomes more problematic in the case of composting,
legume rotation or improved fallows because it is difficult to quantify the impact
of such practices in terms of improvements to crop productivity and then relate
that directly to the MRP classification structure based on relative degrees of
limitation. As a result of this difficulty, the conceptual approach is cautious and
more likely to underestimate than overestimate MRP values.
Results for the highlands region
Results from the classification of unmodified RP for six example RMUs in the
highlands region are presented in Table 6.
EXAMPLE 3 (cont’d)
Parameter RDOLvalue
Landmanagement
Adjusted RDOL value
Rainfall seasonality 0 0
Light 2 2
Inundation 1 1
Slope gradient 3 Slope > 10 degrees 3
Soil productivity 3 Compost (–2) (+1) 2
Resource potential 15 Modified resource potential 14
Constraints T s r T s
Table 5. (cont’d) Worked example of the modified resource potential classification. Note the extraadjustments made in Example 3 because of large mounds and composting onslopes greater than 10 degrees.
a RDOL = relative degree of limitationb For explanation of constraints, see Table 3
26

ASSESSMENT OF LAND RESOURCE POTENTIAL
ACRC026 (F) Page 27 Monday, June 4, 2001 11:14 AM
The first example RMU is located north of Mt Hagen, Western Highlands
Province, in undulating volcanic fans and has very high unmodified RP with no
constraints. Temperature, annual rainfall, rainfall seasonality, light and
inundation conditions are optimum for subsistence sweet potato production
while slope gradient and soil productivity have RDOL values of two.
The second example RMU is located east of Tari, Southern Highlands
Province, on undulating volcanic plains and has high unmodified RP with no
constraints. In this case, annual rainfall and light are slightly limiting to crop
production while the remaining parameters are optimum with RDOL values of one
and zero.
The third example RMU is located north of Banz, Western Highlands
Province, on relatively flat depositional fans and has moderate RP limited by a
minor constraint of soil productivity. The remaining parameters have RDOL
values ranging from zero to two.
Table 6. Resource potential (RP) results for selected highlands sites.
Site details Site 1 Site 2 Site 3 Site 4 Site 5 Site 6
Provincea WHP SHP WHP SHP CHIM ENG
Location Mt Hagen Tari Banz Nipa Gembogl Kandep
PNGRIS RMUb 90050 70079 90059 70166 100002 80009
Temperature 1 1 1 3 3 4
Annual rainfall 1 2 1 1 2 1
Rainfall seasonality 0 0 0 0 0 0
Light 0 2 0 2 2 2
Inundation 1 1 2 1 1 1
Slope gradient 2 1 2 3 4 3
Soil productivity 2 1 3 3 2 3
RP value 7 8 9 13 14 14
Resource potential Very high High Moderate Low Very low Very low
Constraintsc – – r t r s S t T r sa WHP = Western Highlands Province; SHP = Southern Highlands Province; CHIM = Chimbu Province;
ENG = Enga Provinceb Papua New Guinea Resource Information System Resource Mapping Unit
27

MAPPING LAND RESOURCE POTENTIAL AND AGRICULTURAL PRESSURE
ACRC026 (F) Page 28 Monday, June 4, 2001 11:14 AM
The fourth example RMU is located south of Nipa, Southern Highlands
Province, on rugged limestone hills and has low RP with a major constraint of
temperature and minor constraints of soil productivity and slope gradient.
The fifth example RMU is located south of Gembogl, Chimbu Province, in
mountainous terrain and has very low RP with a major constraint of slope
gradient and minor constraint of temperature.
The final example RMU is located north of Kandep, Enga Province, in
mountainous terrain and has very low RP with a major constraint of temperature
and minor constraints of soil productivity and slope gradient.
Note that while some of these example RMUs have similar RP values, the
conditions within each RMU are different. It is thus important to consider both RP
values and constraints when reviewing and applying results of the PNGRPA
technique.
Map 1 presents the distribution of unmodified RP throughout the
highlands region. Areas of very high potential account for 2% of land in use for
subsistence agriculture and 10% of the rural population. Areas of high potential
account for 2% of land in use and 5% of the rural population. Areas of moderate
and low potential dominate the region with 16% and 53% of land in use and 22%
and 51% of the rural population, respectively. Areas of very low potential account
for 27% of land in use and 12% of the rural population.
Table 7 presents the area, estimated 2000 population and respective mean
population densities for each RP class. Estimated 2000 populations are based on
the growth rates for each province determined by Keig (1999) from changes
between the 1980 and 1990 PNG National Population Censuses. Mean population
densities have a near linear relationship with RP, decreasing consistently from 140
persons/km2 in the very high potential areas to 11 persons/km2 in very low
potential areas. This relationship is an important finding as it suggests that
environmental quality is a major factor in influencing where people live. The
relationship is also reassuring from a methodological point of view as it suggests
the technique used to classify RP matches the reality on the ground with respect to
crop productivity, land-use intensity and population density.
28
29
Kilo
met
res
500
5010
015
0
Sout
hern
Hig
hlan
ds
Enga
Wes
tern
Hig
hlan
ds
Chim
bu
East
ern
Hig
hlan
ds
Kopi
ago
Koro
ba
Tari
Kom
o
Porg
era
Mar
amun
i
Laia
gam
Wab
agLu
mus
a
Yenk
is
Tabi
buga
Banz M
inj
Ambu
lua Ge
mbo
glKe
row
agi
Kund
iaw
a
Wat
abun
g
Gum
ine
Mer
a
Una
ni
Kari
mui
Nom
ane
Lufa
Mov
e
Goro
ka
Hen
gano
fiKa
inan
tu
Oka
pa
Amus
a
Obu
ra
Won
enar
a
Mar
awak
a
Kom
piam
Kand
ep
Nip
aM
endi
Erav
e
Kagu
aPa
ngia
Ialib
u
Tam
bul
Mt H
agen
Wap
enam
anda
Very
hig
h
Hig
h
Mod
erat
e
Low
Very
low
Lake
Map
1.
Dis
trib
utio
n of
res
ourc
e po
tent
ial i
n th
e hi
ghla
nds
regi
on, f
or a
gric
ultu
ral l
and
only
.
ACRC026 (F) Page 29 Monday, June 4, 2001 11:14 AM

MAPPING LAND RESOURCE POTENTIAL AND AGRICULTURAL PRESSURE
ACRC026 (F) Page 30 Monday, June 4, 2001 11:14 AM
Map 2 presents the distribution of MRP throughout the highlands region.
Note that the spatial extent of very high and high potential land has doubled in
conjunction with a decrease in very low potential land. The increase in very high
potential areas is clearly related to flat land where innovative land management
practices such as composting, legume rotation and drainage are most effective.
While such practices are present on sloping land, their impact is minimised due to
side effects such as increased soil erosion. Table 8 presents MRP results for the six
example RMUs. Table 9 presents the area, estimated 2000 population and
respective mean population densities for each MRP class in the highlands region.
Note that for the following outline, (–1) denotes the subtraction of one
RDOL value from the RP value while (+1) denotes the addition of one RDOL value
to the RP value. The Mt Hagen RMU has a net improvement of one resulting from
the presence of legume rotation (–1) and square beds (–1, +1), however the effect
of the latter is negated due to the dominant slope gradient being over 10 degrees.
The Tari RMU has a net improvement of three resulting from the presence of
composting (–2) and mounds (–1). The Banz RMU has a net improvement of four
resulting from the presence of legume rotation (–1), square beds (–1) and drains
(–2), the latter completely overcoming long-term inundation defined in PNGRIS.
The Nipa RMU has a net improvement of one resulting from the presence of
compost (–2, +1) and square beds (–1, +1) on slopes greater than 10 degrees. The
Gembogl RMU has a net improvement of one resulting from the presence of soil
retention barriers (–1) and mounds (–1, +1) on slopes significantly greater than
10 degrees. Finally, the Kandep RMU has a net improvement of one resulting from
the presence of composting (–2, +1) and mounds (–1, +1) on slopes greater than
10 degrees.
Table 7. Summary of resource potential classes in the highlands region.
Resource potential
Resourcepotential
range
Total area(km2)
Estimated 2000 population
Mean 2000 population density
(persons/km2)
Very high 5–7 1210 168 500 140
High 8 1530 94 500 62
Moderate 9–10 10 300 367 000 36
Low 11–13 34 000 876 000 26
Very low 14–20 17 000 195 000 11
30

31
500
5010
015
0 K
ilom
etre
s
Sout
hern
Hig
hlan
ds
Enga
Wes
tern
Hig
hlan
ds
Chim
bu
East
ern
Hig
hlan
ds
Kopi
ago
Koro
ba
Tari
Kom
o
Porg
era
Mar
amun
i
Laia
gam
Wab
agLu
mus
a
Yenk
is
Tabi
buga
Banz M
inj
Ambu
lua Ge
mbo
glKe
row
agi
Kund
iaw
a
Wat
abun
g
Gum
ine
Mer
a
Una
ni
Kari
mui
Nom
ane
Lufa
Mov
e
Goro
ka
Hen
gano
fiKa
inan
tu
Oka
pa
Amus
a
Obu
ra
Won
enar
a
Mar
awak
a
Kom
piam
Kand
ep
Nip
aM
endi
Erav
e
Kagu
aPa
ngia
Ialib
u
Tam
bul
Mt H
agen
Wap
enam
anda
Very
hig
h
Hig
h
Mod
erat
e
Low
Very
low
Lake
Map
2.
Dis
trib
utio
n of
mod
ifie
d re
sour
ce p
oten
tial
in t
he h
ighl
ands
reg
ion,
for
agri
cult
ural
land
onl
y.
ACRC026 (F) Page 31 Monday, June 4, 2001 11:14 AM

MAPPING LAND RESOURCE POTENTIAL AND AGRICULTURAL PRESSURE
ACRC026 (F) Page 32 Monday, June 4, 2001 11:14 AM
Table 8. Modified resource potential (MRP) results for selected highlands sites. Note in sites 1,4, 5 and 6 where ‘slope’ gradient is greater than 10 degrees, extra adjustments havebeen made where ‘beds’ and ‘mounds’ are present. Also note in site 3 where‘inundation’ is greater than long term, extra adjustments have been made to ‘drains’.
Site details Site 1 Site 2 Site 3 Site 4 Site 5 Site 6
Provincea WHP SHP WHP SHP CHIM ENG
Location Mt Hagen Tari Banz Nipa Gembogl Kandep
PNGRIS RMUb 90050 70079 90059 70166 100002 80009
Resource P otentialvalue
7 8 9 13 14 14
MASPc agricultural system
905 704 902 714 1002 807
Legume rotation (–1) (–1)
Compost (–2) (–2) (+1) (–2) (+1)
Soil retention barriers (–1)
Mounds (–1) (–1) (+1) (–1) (+1)
Drains Present Present Present (–2) Present Present
Beds (–1) (+1) (–1) (–1) (+1)
Slope >10 degrees Yes Yes Yes Yes
Inundation >long term Yes
MRP value 6 5 5 12 13 13
MRP Very high Very high Very high Low Low Low
Constraints – – – t s S t T sa WHP = Western Highlands Province; SHP = Southern Highlands Province; CHIM = Chimbu Province;
ENG = Enga Provinceb Papua New Guinea Resource Information System Resource Mapping Unitc Mapping Agricultural Systems Project
32
ASSESSMENT OF LAND RESOURCE POTENTIAL
ACRC026 (F) Page 33 Monday, June 4, 2001 11:14 AM
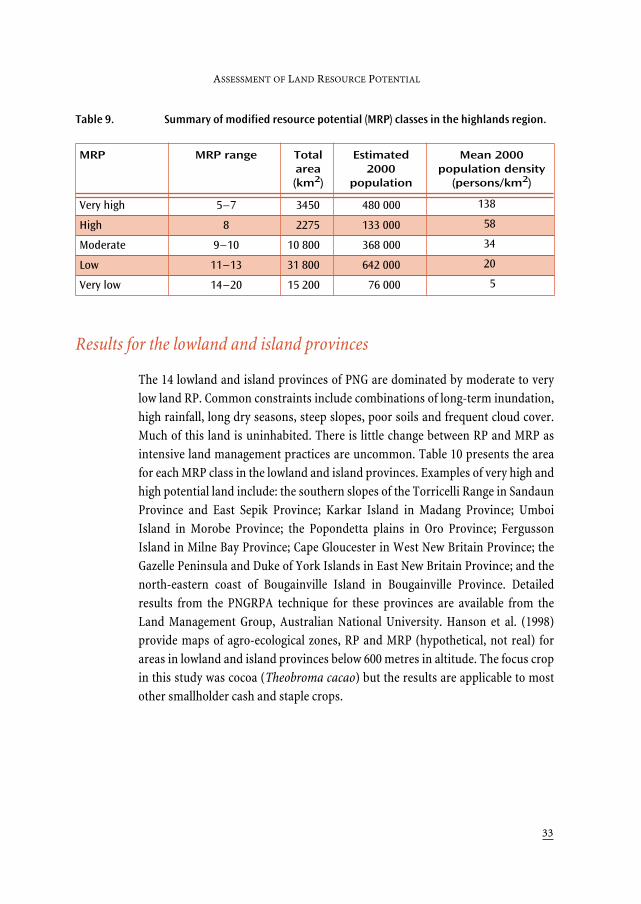
Results for the lowland and island provinces
The 14 lowland and island provinces of PNG are dominated by moderate to very
low land RP. Common constraints include combinations of long-term inundation,
high rainfall, long dry seasons, steep slopes, poor soils and frequent cloud cover.
Much of this land is uninhabited. There is little change between RP and MRP as
intensive land management practices are uncommon. Table 10 presents the area
for each MRP class in the lowland and island provinces. Examples of very high and
high potential land include: the southern slopes of the Torricelli Range in Sandaun
Province and East Sepik Province; Karkar Island in Madang Province; Umboi
Island in Morobe Province; the Popondetta plains in Oro Province; Fergusson
Island in Milne Bay Province; Cape Gloucester in West New Britain Province; the
Gazelle Peninsula and Duke of York Islands in East New Britain Province; and the
north-eastern coast of Bougainville Island in Bougainville Province. Detailed
results from the PNGRPA technique for these provinces are available from the
Land Management Group, Australian National University. Hanson et al. (1998)
provide maps of agro-ecological zones, RP and MRP (hypothetical, not real) for
areas in lowland and island provinces below 600 metres in altitude. The focus crop
in this study was cocoa (Theobroma cacao) but the results are applicable to most
other smallholder cash and staple crops.
Table 9. Summary of modified resource potential (MRP) classes in the highlands region.
MRP MRP range Total area(km2)
Estimated 2000
population
Mean 2000 population density
(persons/km2)
Very high 5–7 3450 480 000 138
High 8 2275 133 000 58
Moderate 9–10 10 800 368 000 34
Low 11–13 31 800 642 000 20
Very low 14–20 15 200 76 000 5
33

MAPPING LAND RESOURCE POTENTIAL AND AGRICULTURAL PRESSURE
ACRC026 (F) Page 34 Monday, June 4, 2001 11:14 AM
Limitations
The results from the PNGRPA technique must be interpreted with respect to
limitations in the data and methods. The principal limitation to the application of
these results is the scale at which the data are collected and presented. Any
presentation of complex environmental data at regional scales will have
generalised or smoothed micro- and meso-scale variation, and while such
variation is not present in the data, it is present on the ground. For example, flood-
free terraces with well-drained, fertile soils are often narrow land units too small
to be mapped at regional scales. Instead, such terrace land units would be
smoothed over and classified as poorly-drained flood plains. If RP was mapped in
more detail, such terraces would be delineated as there would be more spatial
variation in smaller mapping units. No comprehensive field validation was
undertaken as part of this particular project, however the MASP and PNGRIS
datasets are based on extensive field observations and were ground-truthed
according to 1:500,000 scale standards. Example areas around Gembogl in Chimbu
Table 10. Summary of modified resource potential (MRP) class areas in the lowland andisland provinces.
Province Very high High Moderate Low Very low
(km2)
Western 0 30 7300 60 100 30 000
Gulf 530 360 6900 24 200 2400
Central 700 1450 6250 13 200 8300
Milne Bay 1000 2900 5780 4180 450
Oro 1650 1300 7600 9750 2450
Morobe 450 850 9400 18 300 4700
Madang 300 650 10 500 11 500 5750
East Sepik 950 3020 9500 27 800 1900
Sandaun 4150 6050 10 200 13 500 1900
Manus 50 25 990 950 65
East New Britain 1100 550 2400 9400 1800
West New Britain 520 800 7000 9400 2650
New Ireland 220 480 2130 6590 120
Bougainville 1110 1420 3700 2900 220
34
ASSESSMENT OF LAND RESOURCE POTENTIAL
ACRC026 (F) Page 35 Monday, June 4, 2001 11:14 AM
Province and Bulolo and Salamaua in Morobe Province were used as field case
studies to examine the above limitations for training purposes.
The second limitation to these results is related to the inherent problems
of hard-edged classification on continuous datasets. When a classification range is
enforced there are always similar data that fall on either side of the break and into
different classes. This problem can then compound when classes are reclassified
and manipulated. The only way to overcome this problem, outside of more
sophisticated fuzzy classification techniques, is to view class boundaries as zones
of uncertainty and refer to the base data for clarification where necessary.
35

MAPPING LAND RESOURCE POTENTIAL AND AGRICULTURAL PRESSURE
ACRC026 (F) Page 36 Monday, June 4, 2001 11:14 AM
Assessment of Land-use Intensity
Assessment of land-use intensity requires some measure of land resource use,
depletion or change. Traditional methods have been simple and focused more
towards agricultural outputs than management processes. More recent methods
have focused on the level of management intervention into a predefined ‘natural’
condition where the most intensive land-use systems are those which most modify
the ‘natural’ condition and vice versa.
An example is the method described by Baxter and Russell (1994) where
land-use intensity increases along a landscape intervention gradient such as
gathering/hunting, native forestry, rough grazing, plantation forestry, dryland
grazing, dryland perennial cropping, dryland annual cropping, irrigated grazing,
irrigated perennial cropping and irrigated annual cropping. The problem with this
type of approach is that different management practices within each land-use type
can significantly alter the extent to which land resources are depleted or changed.
Mapping land-use intensity adds another level of complexity, given the
difficulties with mapping temporal processes such as management practices.
Efforts to map land-use intensity rely on delineation of representative spatial units
through the interpretation of air and/or satellite photographs supported by
ground validation of management practices.
Mapping land-use intensity in PNG
The first attempt to map land-use intensity consistently for all of PNG was
completed at 1:500,000 scale by Saunders (1993) based on 1973 aerial photo-
graphs. Areas of cultivated land, defined through the presence of anthropogenous
vegetation such as current gardens or various stages of fallow, were first mapped
and then classified on the basis of the total area of anthropogenous vegetation and
the percentage of current gardens within the total area. Thus, land-use intensity in
this context is based on change to non-anthropogenous vegetation and measured
according to the spatial extent of present and previously cultivated land.
The Saunders classification has seven classes of cultivated land and seven
classes of uncultivated land. The latter are of little interest to this study and
include grassland, sago stands, sub-alpine grassland, alpine grassland, savanna
woodland, urban areas, and other dryland and wetland areas. The cultivated land
classification ranges from the most intensive class, defined as greater than 75%
36
ASSESSMENT OF LAND-USE INTENSITY
ACRC026 (F) Page 37 Monday, June 4, 2001 11:14 AM
anthropogenous vegetation with greater than 20% current use, through to the
least intensive class, defined as less than 10% anthropogenous vegetation with less
than 1% current use.
While the delineated areas of cultivated and uncultivated land have
remained largely consistent since 1973 (McAlpine 2001), the levels of land-use
intensity within the cultivated areas have changed significantly given high rural
population growth over the last 25 years. This intensification of agriculture
renders much of the classification detail out-of-date, although there are good
reasons to assume that, where population growth has been consistent, areas
would have moved up the classification scale on a consistent and relative basis.
The second attempt to map land-use intensity consistently for all of PNG
was completed by Allen et al. (1995) through MASP. Land-use intensity was
defined for each agricultural system through the Ruthenburg R-value, which is
derived from the ratio of the cropping period in years (C) to the length of
cultivation cycle in years (F), the latter being the sum of the cropping and fallow
periods (Ruthenberg 1980). The formula is R = C × 100/(C + F). The R-value is a
powerful temporal measure of land-use intensity and indicator of the
intensification process when monitored over time.
The R-value measure of land-use intensity was chosen over the Saunders
classification for this study because it is process-based, more recent and
consistent with other MASP data used in the PNGRPA technique.
Results for the highlands region
Map 3 presents R-values for the highlands region. There is a strong relationship
between high land-use intensity and gentle sloping land. Examples include the
Tari Basin in Southern Highlands Province, the Kandep Basin and Lai and Tsak
valleys in Enga Province, the Kaugel and Waghi valleys in Western Highlands
Province and the Asaro Valley in Eastern Highlands Province. There is also a
strong relationship between low land-use intensity and remoteness, with the
majority of low-intensity agricultural systems occurring in the remote highland-
fringe areas. There are important exceptions to these relationships that are
discussed later in this report.
Of the six example RMUs discussed previously, the Tari and Kandep
RMUs have the highest land-use intensity with R-values of 100 derived from
cropping periods of 40 years and no significant fallow period (100 = 40 × 100/(40
+ 0)). The Mt Hagen and Gembogl RMUs have R-values of 50 derived from
37

MAPPING LAND RESOURCE POTENTIAL AND AGRICULTURAL PRESSURE
ACRC026 (F) Page 38 Monday, June 4, 2001 11:14 AM
cropping periods of 10 years and fallow periods of 10 years (50 = 10 × 100/(10 +
10)). The Banz RMU has a R-value of 29 derived from a cropping period of 4 years
and a fallow period of 10 years (29 = 4 × 100/(4 + 10)). The Nipa RMU has a R-
value of 17 derived from a cropping period of 4 years and a fallow period of 20
years (17 = 4 × 100/(4 + 20)).
Caution is needed when interpreting R-value maps given the
extrapolation of site-specific temporal data such as cropping periods, fallow
lengths and ultimately R-values to the Saunders land-in-use boundaries that
define the outer edge of MASP agricultural systems. Problems arise because
extrapolation overestimates the spatial extent of R-values given the shifting nature
of agricultural systems within the Saunders land-in-use boundaries. As R-values
increase, however, the problem is less significant as the spatial extent of gardens
within the land-in-use boundaries also increases.
Results for the lowland and island provinces
Most of the lowland and island provinces have low to very low land-use intensity.
Exceptions include the Gazelle Peninsula in East New Britain Province and much
of Bougainville Island where intensities are high to moderate, respectively. The
most important exceptions to note are the peri-urban settlement areas around the
cities of Port Moresby and Lae and the numerous small islands in Milne Bay,
Bougainville, Manus, Morobe and West New Britain provinces. Many of these
islands have permanent cropping (R-values of 100) and very high population
densities that are often greater than 200 persons/km2.
38
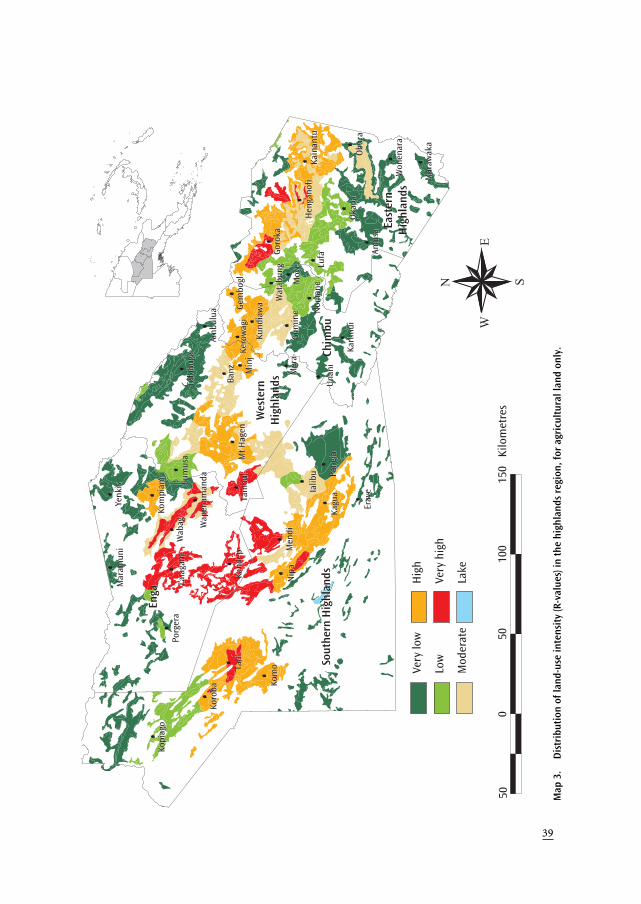
39
500
5010
015
0 K
ilom
etre
s
Sout
hern
Hig
hlan
ds
Enga
Wes
tern
Hig
hlan
ds
Chim
bu
East
ern
Hig
hlan
ds
Kopi
ago
Koro
ba
Tari
Kom
o
Porg
era
Mar
amun
i
Laia
gam
Wab
agLu
mus
a
Yenk
is
Tabi
buga
Banz M
inj
Ambu
lua Ge
mbo
glKe
row
agi
Kund
iaw
a
Wat
abun
g
Gum
ine
Mer
a
Una
ni
Kari
mui
Nom
ane
Lufa
Mov
e
Goro
ka
Hen
gano
fiKa
inan
tu
Oka
pa
Amus
a
Obu
ra
Won
enar
a
Mar
awak
a
Kom
piam
Kand
ep
Nip
aM
endi
Erav
e
Kagu
aPa
ngia
Ialib
u
Tam
bul
Mt H
agen
Wap
enam
anda
Sout
hern
Hig
hlan
ds
Enga
Wes
tern
Hig
hlan
ds
Chim
bu
East
ern
Hig
hlan
ds
Kopi
ago
Koro
ba
Tari
Kom
o
Porg
era
Mar
amun
i
Laia
gam
Wab
agLu
mus
a
Yenk
is
Tabi
buga
Banz M
inj
Ambu
lua Ge
mbo
glKe
row
agi
Kund
iaw
a
Wat
abun
g
Gum
ine
Mer
a
Una
ni
Kari
mui
Nom
ane
Lufa
Mov
e
Goro
ka
Hen
gano
fiKa
inan
tu
Oka
pa
Amus
a
Obu
ra
Won
enar
a
Mar
awak
a
Kom
piam
Kand
ep
Nip
aM
endi
Erav
e
Kagu
aPa
ngia
Ialib
u
Tam
bul
Mt H
agen
Wap
enam
anda
Very
low
Low
Mod
erat
e
Hig
h
Very
hig
h
Lake
Map
3.
Dis
trib
utio
n of
land
-use
inte
nsit
y (R
-val
ues)
in t
he h
ighl
ands
reg
ion,
for
agri
cult
ural
land
onl
y.
ACRC026 (F) Page 39 Monday, June 4, 2001 11:14 AM

MAPPING LAND RESOURCE POTENTIAL AND AGRICULTURAL PRESSURE
ACRC026 (F) Page 40 Monday, June 4, 2001 11:14 AM
Assessment of Agricultural Pressure
Previous efforts to map agricultural pressure, as defined in this study, have
focused on single issues such as soil erosion, soil salinisation, rising watertables or
soil acidification. These are commonly seen as outcomes of agricultural pressure.
An example of such efforts is the use of process models like the Universal Soil Loss
Equation (USLE) to predict potential erosion rates based on sets of predefined
conditions such as rainfall erosivity, soil erodability, slope steepness, vegetation
cover and land management practices. Results from such models are extrapolated
to similar sites or mapping units based on the occurrence of similar conditions.
Other methods have relied on image processing and GIS technology to map
conditions such as salinisation, erosion or waterlogging through the classification
of spectral signals identified on satellite photographs. The results of such efforts
provide a simple, single parameter view of the condition of particular land
resources.
The principal constraint to the mapping of agricultural pressure is the
need for large amounts of land resource and land-use data, which is expensive to
collect and maintain. Alternative approaches have avoided the issue of mapping
and focused on detailed site studies supported by assessments of environmental
indicators to determine land ‘health’ or ‘quality’. Hamblin (1998) suggests that
such indicators facilitate a site-level understanding of pressure on land resources,
present condition of resources and management responses. Examples of
indicators for soil erosion include the percentage of cultivated land with exposed
soils (pressure), surface soil loss index (condition) and percentage of cropped
land with reduced tillage and stubble retention (response). While such indicators
can be used to monitor sites over time, the problems of spatial representation and
extrapolation remain. The key concern of the environmental indicator approach
to assessing agricultural pressure is ensuring the monitoring sites are
representative of broader land resource and land-use patterns. This can only be
achieved by guidance from detailed spatial datasets.
The PNG Agricultural Pressure Assessment technique
The PNG Agricultural Pressure Assessment (PNGAPA) technique queries
combinations of land-use intensity and MRP data to highlight mismatches
between the two. The areas identified range between those that are strongly over-
40

ASSESSMENT OF AGRICULTURAL PRESSURE
ACRC026 (F) Page 41 Monday, June 4, 2001 11:14 AM
utilised, defined as high land-use intensity in low potential environments, to no
over-utilisation, defined as low land-use intensity in high potential environments.
A crop impact (CI) index was developed from R-value and altitude data,
reflecting the impact of cropping on soil resources at different altitudes. In PNG
lowland environments, sweet potato crops reach maturity roughly 50% faster than
the same crops in highland environments (Bourke 1985), resulting in a greater
impact in lowland environments per crop over time. Higher rainfall and warmer
temperatures in the lowlands also lead to faster breakdown of organic matter and
more rapid rates of nutrient leaching. Thus the assumption behind the CI index is
that where land-use intensity (R-values) is the same in lowland and highland
environments, the impact on soil resources over time is greater in the lowlands.
The CI index is presented in Table 11 and is based on the classification of R-values
according to three altitude classes. One example interpretation of Table 11 is that
R-values of 15–27 in the lowlands (0–600 m) have a similar impact on the
environment over time as R-values of 28–49 in mid-altitude areas (600–1200 m)
and R-values of 50–65 in the highland areas (1200–2500 m). Table 12 presents the
queries used to define four levels of over-utilisation that form the agricultural
pressure scale.
Areas of very strong agricultural pressure are those that have severe
resource degradation problems resulting from very high land-use intensity (in
some cases permanent agriculture) in low potential environments. These areas are
limited to the small islands in Milne Bay, Manus, Morobe and Bougainville
provinces where few innovative techniques are used to improve production. The
islands are vulnerable to reduced crop yields and food shortages.
Table 11. Crop impact (CI) index based on the classification of R-values according to altitude. Avalue of one has the lowest crop impact, while a value of five has the highest cropimpact.
R–value Lowlands(1–600 m)
Mid-altitude(601–1200 m)
Highlands(1201–2800 m)
1–14 1 (very low) 1 (very low) 1 (very low)
15–27 2 (low) 1 (very low) 1 (very low)
28–49 3 (moderate) 2 (low) 2 (low)
50–65 4 (high) 3 (moderate) 2 (low)
66–100 5 (very high) 4 (high) 3 (moderate)
41

MAPPING LAND RESOURCE POTENTIAL AND AGRICULTURAL PRESSURE
ACRC026 (F) Page 42 Monday, June 4, 2001 11:14 AM
Areas of strong agricultural pressure are those that have severe resource
degradation problems resulting from very high land-use intensity (in some cases
permanent agriculture) in low potential environments. Land resource constraints
are overcome to some extent by innovative techniques such as drainage,
composting and mounding, but often these techniques are applied beyond their
beneficial range and thus have the potential to compound existing problems. For
example, composting and mounding on steep slopes resulting in accelerated soil
loss. These areas are vulnerable to reduced crop yields and food shortages,
particularly in high altitude areas during periods of drought and frost.
Areas of moderate agricultural pressure are those with minor resource
degradation problems resulting from very high land-use intensity in moderate
potential environments through to moderate land-use intensity in very low
potential environments. The former may have some innovative management
practices, while the constraints are so severe in the latter that innovative
techniques may have little impact.
Areas of marginal pressure are those with few resource degradation
problems at present but may encounter future problems if agriculture is
intensified without suitable land improvement practices. Conditions for marginal
pressure include high land-use intensity in moderate potential environments
through to low land-use intensity in very low potential environments. The former
may have some innovative management practices, while such practices in the
latter have little impact due to the severity of the constraints.
Table 12. Queries used to identify agricultural pressure in the Papua New Guinea AgriculturalPressure Assessment technique.
Mismatch type Crop impactindex
Modified resource potential
Agricultural pressure
very strong over-utilisation high, very high (4,5) very low (14–19) very strong
very strong over-utilisation high, very high (4,5) low (11–13) very strong
very strong over-utilisation high, very high (4,5) moderate (9–10) very strong
very strong over-utilisation moderate (3) very low (14–19) very strong
strong over-utilisation moderate (3) low (11–13) strong
strong over-utilisation low (2) very low (14–19) strong
moderate over-utilisation moderate (3) moderate (9–10) moderate
moderate over-utilisation low (2) low (11–13) moderate
marginal over-utilisation low (2) moderate (9–10) marginal
42
ASSESSMENT OF AGRICULTURAL PRESSURE
ACRC026 (F) Page 43 Monday, June 4, 2001 11:14 AM
It is important to note that these agricultural pressure classes are static
and represent conditions at a particular point in time. Both the land-use intensity
and MRP datasets were finalised in the mid-1990s so the results reflect conditions
at that time. As classification input parameters change, such as fallow lengths or
cropping periods (which determine land-use intensity values), the pressure
classes will also change. The driving force behind such change is related to altered
demographic patterns such as migration and population growth and improved
land management practices such as the adoption of soil fertility maintenance
techniques. For this reason, the agricultural pressure scale is designed to be
relative and dynamic. If populations increase resulting in the intensification of
agriculture with few improved land management practices, then the areas in
question will move up the pressure scale, perhaps from none to marginal or
moderate to strong. The extent to which R-values change will determine the
change on the pressure scale. If, however, innovative management practices are
adopted, resulting in improved RP without land-use intensification, then those
areas will move down the scale. Many combinations of conditions can occur and
they can be tracked through the PNGAPA classification process and corrected over
time if necessary.
Results for the highlands region
Map 4 presents the distribution of agricultural pressure throughout the highlands
region. There are no areas with very strong pressure. Enga Province has
significant areas of strong pressure in the Lagaip, Kera, Lai, Ambum and Wage
valleys along with the Kandep Basin and Sirunki Plateau, while Southern
Highlands Province has areas of strong pressure in the Wage Valley, Lai Valley
and Nembi Plateau. Other areas of strong pressure are located in the Dunantina
Valley in Eastern Highlands Province, the upper Chimbu Valley in Chimbu
Province and the Kaugel Valley in Western Highlands Province. In most of these
areas, high-intensity village agriculture has extended beyond more suitable valley
bottoms onto land constrained by steep slopes, poor soils, cold temperatures and
frost. Areas with moderate and marginal pressure are located on the fringe of the
Tari Basin, Mendi Valley and Nembi Valley in Southern Highlands Province, the
Lai Valley in Enga Province, the upper Chimbu and Waghi valleys in Chimbu
Province and the upper Ramu Valley in Eastern Highlands Province. Areas not
classified as vulnerable are those where land-use intensity is compatible with the
MRP.
43
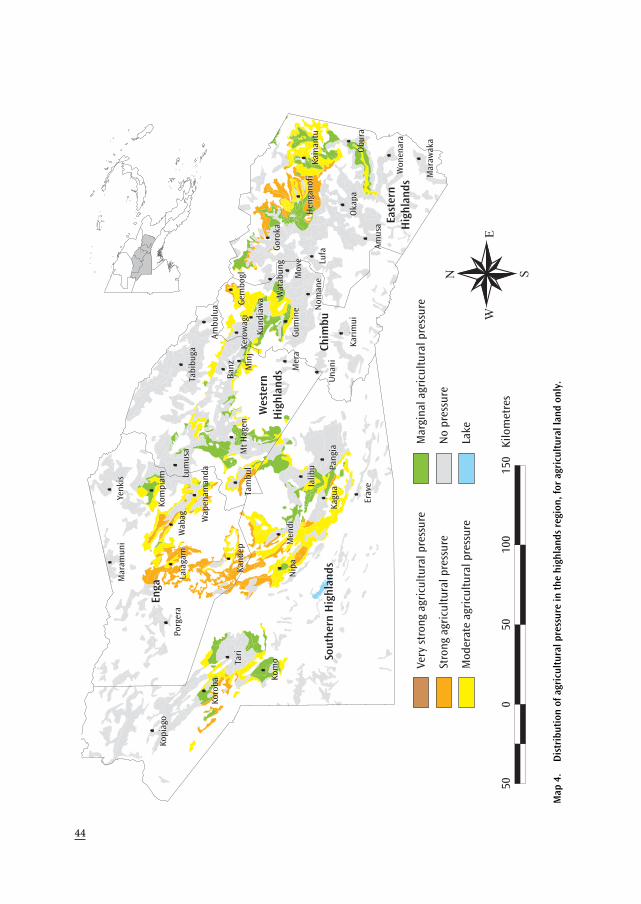
44
500
5010
015
0 K
ilom
etre
s
Sout
hern
Hig
hlan
ds
Enga
Wes
tern
Hig
hlan
ds
Chim
bu
East
ern
Hig
hlan
ds
Kopi
ago
Koro
ba
Tari
Kom
o
Porg
era
Mar
amun
i
Laia
gam
Wab
agLu
mus
a
Yenk
is
Tabi
buga
Banz M
inj
Ambu
lua Ge
mbo
glKe
row
agi
Kund
iaw
a Wat
abun
g
Gum
ine
Mer
a
Una
ni
Kari
mui
Nom
ane
Lufa
Mov
e
Goro
ka
Hen
gano
fiKa
inan
tu
Oka
pa
Amus
a
Obu
ra
Won
enar
a
Mar
awak
a
Kom
piam
Kand
ep
Nip
aM
endi
Erav
e
Kagu
aPa
ngia
Ialib
u
Tam
bul
Mt H
agen
Wap
enam
anda
Very
str
ong
agri
cult
ural
pre
ssur
e
Stro
ng a
gric
ultu
ral p
ress
ure
Mod
erat
e ag
ricu
ltur
al p
ress
ure
Mar
gina
l agr
icul
tura
l pre
ssur
e
No
pres
sure
Lake
Map
4.
Dis
trib
utio
n of
agr
icul
tura
l pre
ssur
e in
the
hig
hlan
ds r
egio
n, fo
r ag
ricu
ltur
al la
nd o
nly.
ACRC026 (F) Page 44 Monday, June 4, 2001 11:14 AM

ASSESSMENT OF AGRICULTURAL PRESSURE
ACRC026 (F) Page 45 Monday, June 4, 2001 11:14 AM
The six example RMUs have diverse results. The Mt Hagen RMU has very
high MRP and high land-use intensity (R-value of 50, CI index of 2), resulting in no
pressure. The Tari RMU has very high MRP and very high land-use intensity (R-
value of 100, CI index of 3), resulting in no pressure. The Banz RMU has very high
MRP and moderate land-use intensity (R-value of 29, CI index of 2), resulting in
no pressure. The Nipa RMU has low MRP and low land-use intensity (R-value of
17, CI index of 1), resulting in no pressure. The Gembogl RMU has low MRP and
high land-use intensity (R-value of 50, CI index of 2), resulting in moderate
pressure. Finally, the Kandep RMU has low MRP and very high land-use intensity
(R-value of 100, CI index of 3), resulting in strong pressure.
While land-use intensity in the first four examples is compatible with
MRP, they are quite different from one another, with the Tari RMU being the most
intensive and the Nipa RMU the least. A more detailed classification for different
purposes could separate these four.
Tables 13–16 present the area and estimated 2000 populations for each
agricultural pressure class. Estimated 2000 populations are based on the growth
rates for each province determined by Keig (1999) from changes between the 1980
and 1990 PNG National Population Censuses. In summary, areas with strong
pressure cover 2230 km2 and an estimated 2000 population of 214,800. Areas with
moderate and marginal pressure cover 3770 km2 and 2720 km2 and estimated
2000 populations of 312,150 and 180,700, respectively.
Table 13. Summary of strong agricultural pressure areas in the highlands region.Note that the population for Chimbu is low because people live in lowerparts of the Chimbu Valley.
Province Area (km2) Estimated 2000 population
Southern Highlands 570 35 100
Enga 920 133 900
Western Highlands 60 8450
Chimbu 36 50
Eastern Highlands 650 37 300
45

MAPPING LAND RESOURCE POTENTIAL AND AGRICULTURAL PRESSURE
ACRC026 (F) Page 46 Monday, June 4, 2001 11:14 AM
Results for the lowland and island provinces
Given the low land-use intensities in the lowland and island provinces, there are
limited areas of agricultural pressure. There is very strong pressure on the Tulun,
Nuguria, Takuu and Nukumanu islands in Bougainville Province and strong
pressure around Teptep in Madang Province, Cape Vogel in Milne Bay Province,
Malai and Tuam islands in Morobe Province, and the Bali Witu and Arawe islands
in West New Britain Province. Larger areas of moderate and marginal pressure are
Table 14. Summary of moderate agricultural pressure areas in the highlandsregion.
Province Area (km2) Estimated 2000 population
Southern Highlands 1440 116 000
Enga 680 75 550
Western Highlands 420 33 200
Chimbu 500 50 100
Eastern Highlands 730 37 300
Table 15. Summary of marginal agricultural pressure areas in the highlands region.
Province Area (km2) Estimated 2000 population
Southern Highlands 900 51 000
Enga 120 135 000
Western Highlands 595 53 600
Chimbu 260 26 300
Eastern Highlands 845 36 300
Table 16. Summary of agricultural pressure classes in the highlands region.
Agricultural pressure Area (km2) Estimated 2000 population
Strong 2236 214 800
Moderate 3770 312 150
Marginal 2720 180 700
46
ASSESSMENT OF AGRICULTURAL PRESSURE
ACRC026 (F) Page 47 Monday, June 4, 2001 11:14 AM
located on the coastal plains of Madang Province, the coast of Collingwood Bay in
Oro Province, the Namatanai area of New Ireland Province, and most of Buka and
Bougainville Islands in Bougainville Province. Table 17 presents areas and
estimated 2000 populations for all pressure classes in the lowland and island
provinces.
Limitations
The results of the PNGAPA technique share the same limitations as the PNGRPA
technique discussed previously. Extra care is needed when interpreting pressure
classes due to the potential propagation of data and classification error through
the classification stages. An example is the allocation of site-specific R-value data
to Saunders land-in-use boundaries discussed previously. When such errors are
combined with errors related to the smoothing of micro-environments in the
PNGRPA technique, such as the flood-free terrace example discussed previously,
then the pressure result could be inaccurate.
In the Kandep example RMU for instance, a particular intensive garden
(R-value of 100) with composting and mounds may be located in a flat drainage
line area with good soils and a slope gradient below 10 degrees. However, this
garden is too small to be mapped by the PNGRPA technique. When such a garden
is broadly classified as occurring in a poor soil and steep sloping RMU, as seen in
Table 6, the garden is defined as having strong pressure. If the soil productivity
and slope gradient RDOL values reflected the true conditions on the ground and
thus were reduced from three to one, then the RP value would be 10. The land
improvement adjustments would then have full effect, as the slope gradient is
below 10 degrees, resulting in a MRP value of seven. Even with an R-value of 100
this particular garden, when classified at the site scale, would have no pressure.
Furthermore, if a similar drainage line site within the same land-in-use boundary
had not been gardened for over 30 years, then it may well be defined as under-
utilised if classified at the site scale.
This example demonstrates the need to interpret the results within the
context of the regional scale conditions defined by the MASP and PNGRIS data.
Any extrapolation to local or site scales must be supported by further data
collection and validation to ensure the site conditions match those defined by
MASP and PNGRIS. If not, site adjustments can be made similar to the above
example.
47
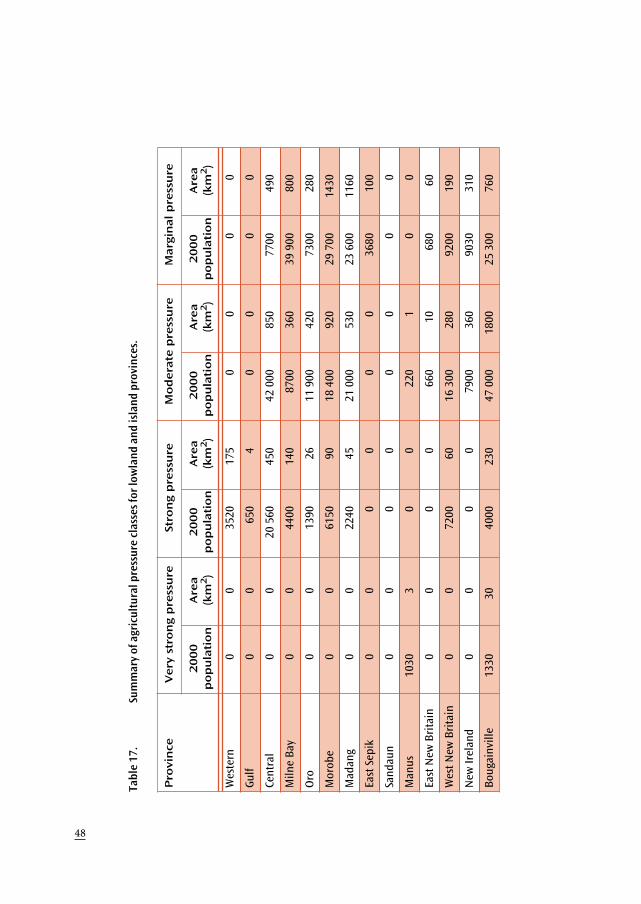
48
Tabl
e 17
.Su
mm
ary
of a
gric
ultu
ral p
ress
ure
clas
ses f
or lo
wla
nd a
nd is
land
pro
vinc
es.
Pro
vin
ceV
ery
str
on
g p
ress
ure
Stro
ng p
ress
ure
Mo
dera
te p
ress
ure
Marg
inal p
ress
ure
20
00
p
op
ula
tio
nA
rea
(km
2)
20
00
p
op
ula
tio
nA
rea
(km
2)
20
00
p
op
ula
tio
nA
rea
(km
2)
20
00
p
op
ula
tio
nA
rea
(km
2)
Wes
tern
00
3520
175
00
00
Gulf
00
650
40
00
0
Cent
ral
00
20 5
6045
042
000
850
7700
490
Miln
e Ba
y0
044
0014
087
0036
039
900
800
Oro
00
1390
2611
900
420
7300
280
Mor
obe
00
6150
9018
400
920
29 7
0014
30
Mad
ang
00
2240
4521
000
530
23 6
0011
60
East
Sep
ik0
00
00
036
8010
0
Sand
aun
00
00
00
00
Man
us10
303
00
220
10
0
East
New
Bri
tain
00
00
660
1068
060
Wes
t New
Bri
tain
00
7200
6016
300
280
9200
190
New
Irel
and
00
00
7900
360
9030
310
Boug
ainv
ille
1330
3040
0023
047
000
1800
25 3
0076
0
ACRC026 (F) Page 48 Monday, June 4, 2001 11:14 AM

DATA APPLICATIONS AND FURTHER INFORMATION
ACRC026 (F) Page 49 Monday, June 4, 2001 11:14 AM
Data Applications and Further Information
Spatial data on land RP and agricultural pressure are a consistent, transparent and
informative basis to guide rural development activities such as agricultural
extension, infrastructure development and the provision of basic social services.
Such guidance is critical where human and financial resources are limited.
At a national level, such information may help define priority regions for
international development projects such as the upper Chimbu Valley in Chimbu
Province or high altitude areas in Enga and Southern Highlands provinces. At a
provincial level, the information may determine priority areas and issues for
agricultural extension projects. Examples may include suitable soil fertility
maintenance techniques for intensive gardens on steep land or better adapted
crop varieties for particular environmental constraints. In cases where suitable
extension strategies are not known, the information can guide research activities
and enable more critical reviews of how representative existing research programs
are of high priority areas and issues. Furthermore, the structure of the agricultural
pressure classification allows the identification of longer-term research needs
where, for example, land use may be intensifying in marginal pressure areas.
Another application of agricultural pressure data can be to assist with the
design of a national network of long-term monitoring sites that are representative
of pressure classes, environment types, rural populations and land management
practices. Such a network combined with a suitable set of environmental, social
and economic indicators can monitor spatial and temporal trends, which in turn
can redirect policy, planning and research activities where necessary.
More detailed results of land RP and agricultural pressure, along with
information on agriculture, population, access to services and rural cash incomes
are available for every district in PNG. For detailed information and analysis refer to
the Papua New Guinea District Planning Handbook and for broad level analysis
refer to the large format poster Priority Areas and Issues for Rural Development in
Papua New Guinea. Both of these publications as well as digital information are
available from the Land Management Group, Australian National University. Please
contact: Land Management Group, Department of Human Geography, Research
School of Pacific and Asian Studies, The Australian National University, Canberra
ACT 0200, Australia. Telephone: + 61 2 6125 4345. Fax: + 61 2 6125 4896.
Email: [email protected] or [email protected]
49
MAPPING LAND RESOURCE POTENTIAL AND AGRICULTURAL PRESSURE
ACRC026 (F) Page 50 Monday, June 4, 2001 11:14 AM
References
Allen, B.J., Bourke, R.M. and Hide, R.L. 1995. The sustainability of Papua New Guinea
agricultural systems: the conceptual background. Global Environmental Change,
5, 297–312.
Baxter, J.T. and Russell, L.D. 1994. Land use mapping requirements for natural resource
management in the Murray Darling Basin. Project M305 Task 6. Canberra,
Murray Darling Basin Commission.
Bellamy, J.A. 1986. Papua New Guinea inventory of natural resources, population
distribution and land use handbook. Natural Resources Series No. 6. Canberra,
CSIRO Division of Water and Land Resources, 149p.
Bierwirth, P.N. and McVicar, T.R. 1998. Rapid monitoring and assessment of drought in
Papua New Guinea using satellite imagery. Canberra, Australian Geological
Survey Organisation and Commonwealth Scientific and Industrial Research
Organisation (CSIRO).
Bleeker, P. 1975. Explanatory notes to the land limitation and agricultural land use
potential map of Papua New Guinea. Land Research Series No. 36. Canberra,
CSIRO.
Bleeker, P. 1983. Soils of Papua New Guinea. Canberra, Australian National University
Press, 352p.
Bouma, J., Wagnet, R., Hoosbeek, M. and Hutson, J. 1993. Using expert systems and
simulation modelling for land evaluation at farm level: a case study from New
York State. Soil Use and Management, 9(4), 131–139.
Bourke, R.M. 1985. Sweet potato (Ipomoea batatas) production and research in Papua New
Guinea. Papua New Guinea Journal of Agriculture, Forestry and Fisheries 33(3),
89–108.
Burrough, P. 1978. Overseas national programs of land resource survey and evaluation.
Canberra, Australian Government Publishing Service.
Charman, P. and Murphy, B. 1992. Soils: their properties and management. Sydney, Sydney
University Press, 363p.
CSIRO (Commonwealth Scientific and Industrial Research Organisation) 1965. Lands of the
Wabag-Tari Area, Papua New Guinea. Land Research Series No. 15. Canberra,
CSIRO, 142p.
CSIRO (Commonwealth Scientific and Industrial Research Organisation) 1968. Lands of the
Wewak-Lower Sepik Area, Papua New Guinea. Land Research Series No. 22.
Canberra, CSIRO, 149p.
CSIRO (Commonwealth Scientific and Industrial Research Organisation) 1970. Lands of the
Goroka-Mount Hagen Area, Papua New Guinea. Land Research Series No. 27.
Canberra, CSIRO, 159p.
CSIRO (Commonwealth Scientific and Industrial Research Organisation) 1972. Lands of the
Vanimo Area, Papua New Guinea. Land Research Series No. 31. Canberra,
CSIRO, 126p.
50

REFERENCES
ACRC026 (F) Page 51 Monday, June 4, 2001 11:14 AM
Davidson, D. 1992. The evaluation of land resources. New York, Longman Scientific and
Technical, 198p.
FAO (Food and Agriculture Organization of the United Nations) 1976. A framework for
land evaluation. FAO Soil Bulletin No. 29. FAO, Rome, 72p.
FAO (Food and Agriculture Organization of the United Nations) 1984a. Guidelines: land
evaluation for rainfed agriculture. Soils Bulletin No. 32. Rome, FAO.
FAO (Food and Agriculture Organization of the United Nations) 1984b. Land evaluation for
forestry. FAO Forestry Paper No. 48. Rome, FAO.
FAO (Food and Agriculture Organization of the United Nations) 1996. ECOCROP 1. The
adaptability level of the FAO crop environmental requirements database. DOS
version 1.1. Rome, Soil Resources, Management and Conservation Service of
the FAO.
Gates, D. 1980. Biophysical ecology. New York, Springer-Verlag, 611p.
Gessler, P. and McKenzie, N. 1995. New methods for the spatial prediction of soil attributes.
In: River Murray mapping technical manual. Canberra, Murray-Darling Basin
Commission.
Hackett, C. 1984. Tabular descriptions of crops grown in the tropics. No. 1 Sweet potato.
Technical Memorandum 84/13. Canberra, CSIRO Division of Water and Land
Resources, 47p.
Hackett, C. 1988. Matching plants and land. Canberra, CSIRO Division of Water and Land
Resources, 82p.
Hackett, C. 1991. PLANTGRO: a software package for coarse prediction of plant growth.
Melbourne, CSIRO Publications.
Hamblin, A. 1998. Environmental indicators for National State of the Environment
reporting. The land. Canberra, Environment Australia, 124p.
Hanson, L.W., Bourke, R.M. and Yinil, D.S. 1998. Cocoa and coconut growing environments
in Papua New Guinea. A guide for research and extension activities. Canberra,
Australian Agency for International Development, 79p.
Hollingsworth, I., Boardman, R. and Fitzpatrick, R. 1995. Quantitative land resource
assessment for Pinus radiata (D. Don) in South Australia. Australian Collab-
orative Land Evaluation Program Newsletter, June. Canberra, CSIRO Division of
Soils.
Hugget, R. 1995. Geoecology: an evolutionary approach. New York, Routledge.
Keig, G. 1999. Rural population growth in Papua New Guinea 1980–1990. Unpublished
consulting report for the Land Management Group, Department of Human
Geography, Australian National University as part of the Australian Centre for
International Agricultural Research (ACIAR) Project ASEM 1996/044, 26p.
Klingebiel, A. and Montgomery, P. 1961. Land capability classification. Washington, United
States Department of Agriculture (USDA) Handbook No. 20.
Laffan, M. 1993. Site productivity and land suitability for eucalypt and radiata pine in
Tasmanian State Forest. Hobart, Forestry Commission Tasmania.
Margules, C.R. and Redhead, T.D. 1995. BioRap. Rapid assessment of biodiversity priority
areas. Guidelines for using the BioRap methodology and tools. Canberra, CSIRO.
51

MAPPING LAND RESOURCE POTENTIAL AND AGRICULTURAL PRESSURE
ACRC026 (F) Page 52 Monday, June 4, 2001 11:14 AM
McAlpine, J.R, Freyne, D.F. and Keig, G. 2001. Land use and rural population change in
rural PNG 1975–1995. In: Bourke, R.M., Allen, M.G. and Salisbury, J., ed.,
Proceedings of the Papua New Guinea Food and Nutrition 2000 Conference: Food
Security in Papua New Guinea. Canberra, Australian Centre for International
Agricultural Research (in press).
McKenzie, N. 1991. A strategy for coordinating soil survey and land evaluation in Australia.
CSIRO Division of Soils Report No. 114. Canberra, CSIRO.
Moss, M.R. 1978. Concept and theory in land evaluation for rural land use planning.
Occasional Publication No. 6. Birmingham, Department of Geography, University
of Birmingham.
Moss, M.R. 1985. Land processes and land classification. Journal of Environmental
Management, 20, 295–319.
Odum, E. 1971. Fundamentals of ecology. Philadelphia, WB Saunders Company, 574p.
Roberts, B. 1995. The quest for sustainable agriculture and land use. Sydney, University of
New South Wales Press, 245p.
Rossiter, D. and Van Wambeke, A. 1991. ALES version 3 user’s manual. Ithaca, New York,
Cornell University.
Rowe, J. 1980. The common denominator of land classification in Canada: an ecological
approach to mapping. The Forestry Chronicle, 56, 56–74.
Ruthenberg, H. 1980. Farming systems in the Tropics. Oxford, Clarendon Press, 366p.
Saunders, J.C. 1993. Agricultural land use of Papua New Guinea. Explanatory notes to map.
Papua New Guinea Resource Information System (PNGRIS) Publication No. 1.
Canberra, CSIRO.
Thwaites, R. 1995. An opportunity for quantitative land resource assessment in
Queensland forestry. Australian Collaborative Land Evaluation Program
Newsletter, June. Canberra, CSIRO Division of Soils.
Trangmar, B., Giltrap, D., Burgham, S. and Savage, T. 1995. Land suitability assessment for
selected crops in Papua New Guinea. Papua New Guinea Resource Information
System (PNGRIS) Publication No. 8. Canberra, Australian Agency for
International Development, 48p.
Venema, J. and Daink, F. 1992. Papua New Guinea Land Evaluation System. Port Moresby,
Papua New Guinea Department of Agriculture and Livestock, Port Moresby.
Wood, A. 1984. Land for tomorrow. Subsistence agriculture, soil fertility and ecosystem
stability in the New Guinea highlands. PhD thesis, University of Papua New
Guinea, Port Moresby.
52