mapping riparian corridor impacts on the … palmietiapsurvey_final... · mapping riparian corridor...
TRANSCRIPT

MAPPING RIPARIAN CORRIDOR IMPACTS ON THE UPPER PALMIET
RIVER
METHODS, RESULTS AND USER GUIDE
JUNE 2012
CLIENT:
GROENLAND WATER USERS ASSOCIATION
PREPARED BY:
THE FRESHWATER CONSULTING GROUP

TABLE OF CONTENTS
1. Introduction and document outline ............................................................................ 1
1.1 Project background ....................................................................................................... 1
1.2 Reporting Structure ....................................................................................................... 1
1.2.1 Mapping riparian corridor impacts on the upper Palmiet River: methods, results and user guide .......................................................................................................................... 1
1.2.2 GIS database ......................................................................................................... 2
1.2.3 Invasive Alien Species Clearing Guidelines for the Upper Palmiet River Catchment ....... 2
2. STUDY AREA AND METHODOLOGY .............................................................................. 3
2.3 Study area .................................................................................................................... 3
2.4 Mapping methodology ................................................................................................... 3
2.5 Structure of the IAP database ........................................................................................ 3
2.6 Limitations of the survey ................................................................................................ 7
2.7 Map organisation and output .......................................................................................... 7
3. IAP ASSESSMENT AND STATE OF THE RIVER .............................................................. 9
3.8 IAP assessment ............................................................................................................. 9
3.9 Wetlands assessment .................................................................................................. 11
3.10 River buffer zones .................................................................................................... 12
3.11 Bank stability ........................................................................................................... 13
4. GIS database operating instructions ......................................................................... 14
4.12 File types and management ...................................................................................... 14
4.13 Opening projects and loading shapefiles .................................................................... 15
4.14 Working with attribute data ...................................................................................... 16
4.15 Adding GPS and attribute data .................................................................................. 17
4.16 Representing species ................................................................................................ 17
4.17 Printing maps .......................................................................................................... 18

5. References ................................................................................................................ 19
APPENDICES
A. List of project and layer file names in the GIS database with their descriptions
B. Map codes for aligning landowner A4 map printouts
C. Database tables for each mapping unit

Alien Clearing Guidelines
Palmiet River
June 2012 DRAFT Page 1 of 44
1. INTRODUCTION AND DOCUMENT OUTLINE
1.1 Project background
The Palmiet River flows through one of the most intensively farmed regions of the Overberg and its natural functioning is significantly compromised by encroachment into the riparian corridor by invasive alien plants as well as agricultural lands. In addition, a number of point and non-point pollution sources reduce water quality downstream. These combined impacts reduce the natural ability of the river to provide ecosystem goods and services to human settlements in the catchment and to support natural ecological processes in the river itself.
As a first approach to addressing these problems, the Groenland Water User Association (GWUA) recommended that the following features along the riparian corridor of the mainstem of the Palmiet River be surveyed and mapped:
• Land for invasive alien vegetation eradication; • Land that requires river bank stabilisation and restoration; • Encroachment of agriculture, roads etc. into the riparian zone and floodplain; • wetlands that need protected and/or rehabilitated; • Significant point sources of pollution.
This information could then be provided to relevant landowners, together with supporting documents listing the impacts and describing clearing methodologies. A survey invasive alien plants and major impacts along the Palmiet River was undertaken by the Freshwater Consulting Group (FCG) on behalf of the Groenland Water Users Association (GWUA) between January and March 2012. This document, with the accompanying appended document (Invasive alien species clearing guidelines for the upper Palmiet River catchment) and GIS maps presents the outcome of that survey and provides guidelines for landowners who wish to undertake invasive alien plant clearing on their land.
1.2 Reporting Structure
There are three main components to the reporting of this project: (1) this report describing the main findings of the survey together with a description of the GIS database and operating instructions, (2) a GIS database containing the results of the survey superimposed on satellite imagery and (3) a step-by-step guide to clearing invasive alien plants for landowners prepared by Wetlands Solutions (appended document: Invasive alien species clearing guidelines for the upper Palmiet River catchment).
1.2.1 Mapping riparian corridor impacts on the upper Palmiet River: methods, results and user guide
This report addresses the 2012 survey undertaking by FCG which focused on the mainstem of the Palmiet River and the adjoining riparian corridor from its source in Nuweberg to the confluence of the Krom River just before the Palmiet River flows into the Kogelberg Biosphere Reserve. Within this geographical framework, the survey aimed to identify and map the features listed in Section 1.1.
The data generated from the survey was supplemented using existing Geographical Information System (GIS) information on alien vegetation, landuse, water resources infrastructure, topocadastrals, wetlands and vegetation types from the following sources:
• Palmiet River Catchment Management Plan (Paxton and Ractliffe 2010); • National Geo-Spatial Information; • Working for Water (WfW) AI vegetation maps;

Alien Clearing Guidelines
Palmiet River
June 2012 DRAFT Page 2 of 44
• Satellite imagery; • C.A.P.E Overberg Finescale Wetlands map
In addition, this report provides a brief report on the status quo with regards to the integrity of the riparian zone of the mainstem Palmiet River; wetland buffers and riparian buffers and environmental flows. A more detailed assessment is provided in Paxton and Ractliffe (2010).
1.2.2 GIS database
The output of the mapping exercise comprises a series of GIS layers of the catchment which includes invasive alien vegetation distribution together with an estimate invasion densities and plant heights to a distance of up to 2 km of the river thalweg (centre of the channel). The GIS shapefiles are contained in an open source software package Quantum GIS (QGIS) (Version 1.7.4-Wroclaw). Operating instructions for this software are included in Chapter 4 of this report.
Note: these GIS covers are meant to be ‘work-in-progress’ and additional geo-spatial information can be added once it becomes available.
1.2.3 Invasive Alien Species Clearing Guidelines for the Upper Palmiet River Catchment
This document, prepared by Wetland Solutions, is meant as a guide for landowners who wish to undertake clearing operations. It includes inter alia; an overview of alien plant species in the Palmiet catchment, how to plan and execute clearing operations, best practice guidelines for clearing, herbicide use and follow-up actions.

Alien Clearing Guidelines
Palmiet River
June 2012 DRAFT Page 3 of 44
2. STUDY AREA AND METHODOLOGY
2.3 Study area
The alien vegetation survey undertaken by FCG on the Palmiet River encompassed the mainstem of the river between the Nuweberg Forestry Station in the source zone upstream of the Nuweberg forest station to a distance of roughly 2.5 km downstream of the Krom River – in proximity to the gauging weir G4H030 (Figure 2.1). The survey did not include tributaries, or land adjacent the dams. The mainstem river was divided into five units (Figure 2.2 a—e):
a) Nuweberg (N) from the Nuweberg forestry station to the backup waters of the Eikenhof
Dam; b) Eikenhof (E) from the outlet of the Eikenhof Dam to the N2 national highway; c) Applethwaite (A) from the N2 national highway to the backup waters of the Peninsula
Dam; d) Arieskraal (Ar) from the outlet of the Arieskraal Dam to the confluence with the Huis
River; e) Krom (K) from the Huis River confluence to roughly 2.5 km downstream of the Krom River
confluence (gauging weir G4H030).
In the GIS database, the clearing plots have been assigned alphanumeric codes beginning with the abbreviations for the units listed above. For example, clearing plots in the Arieskraal mapping unit will be assigned Ar01, Ar02, etc.
2.4 Mapping methodology
Digital aerial photographs (2010) and 1:50 000 topographical vector files of the Palmiet River catchment were obtained from National Geo-Spatial Information (NGI) (Department of Rural Development and Land Reform, South Africa). Alien vegetation covers for the Groenland region were obtained from Working for Water (WfW). Since the 1:50 000 topographical vector river lines obtained from NGI weren’t sufficiently accurate for the purposes of the study, the mainstem was re-digitised using the aerial photographs. No floodlines could be sourced for this study. The above geographical data were loaded into a Geographical Information System (GIS) package (Quantum GIS, Version 1.7 Wroclaw). Cultivated lands, the edge of the riparian zone, alien vegetation and urban areas along the Palmiet River could easily be distinguished in the aerial photographs from breaks in vegetation structure and colour. Where significant breaks occurred in these features, individual plots were digitized as polygons for each of the five mapping units discussed above. If an homogenous plot adjoined the riparian zone, it was mapped to the edge of its boundary furthest from the river bank, even if it extended significantly beyond the river bank. In some instances this led to the delineation of quite large plots where pine or gum plantations adjoin the river. Fieldwork was undertaken in December 2011 and January-March 2012 to ground-truth the digitized plots. For each plot, the total percentage of the plot covered by alien vegetation was estimated, together with the percentage of each alien species and an estimate of its height. This information was entered into a Palmiet Invasive Alien Plant (IAP) database provided (2012PalmietIAP.xlsx) and linked to the GIS polygon shapefiles.
2.5 Structure of the IAP database
The IAP database is stored in MS Excel 2010. This file also provides the basis for the GIS database, and was converted into a database (*.dbf) file format. As a consequence, it has been necessary to abbreviate column headings to less than 9 characters. Rows in the database list individual plot codes (PlotCode: Ar01, Ar02 etc.). The column headings combine two types of information. The first half

Alien Clearing Guidelines
Palmiet River
June 2012 DRAFT Page 4 of 44
of the heading refers to the species name, the second (separated by an underscore) to a particular attribute, for instance, the proportion of that species in a particular plot or its height, e.g. ‘Ses_Hg’ refers to the estimated height (Hg) of Sesbania (Ses). Codes for species and their attributes are listed in Tables Table 2.1 and Table 2.2 respectively.
Figure 2.1 The Palmiet River catchment showing major tributaries, settlements, water resources
infrastructure and gauging stations (red triangles).

Alien Clearing Guidelines
Palmiet River
June 2012 DRAFT Page 5 of 44
Figure 2.2 Mapping units on the Palmiet River: (a) Nuweberg (N), (b) Eikenhof (E), (c) Applethwaite (A), (d) Arieskraal (Ar),(e) Krom (K).

Alien Clearing Guidelines
Palmiet River
June 2012 DRAFT Page 6 of 44
Table 2.1 Column headings, description and formulae in the ‘2012PalmietIAP.xlsx database.
Column Header Description Formula
PlotCode Code assigned to the plot, e.g. E1, E2, etc.
for Eikenhof, Ar1, Ar2, etc. for Arieskraal mapping units
Area_m Total area of the plot (m2)
Calculated from polygons.
Area_h Total area of the plot (hectares)
Calculated from polygons.
TotalCover Estimated total proportion of alien vegetation within a plot
Estimated as value between 0 and 1.
TotalArea Total area occupied by all invasive species in the plot
Area_h × TotalCover
Group/species code _P The common name of each species listing the estimated proportion of the invaded plot occupied by this species
Estimated as value between 0 and 1. Summing all species in any given plot will equal unity.
Group/species code _TP Total proportion of plot occupied by this species on a plot
Group/species code_TP = Totalcover × Group/species code_P
Group/species code _A Estimated area occupied by each species (hectares) on a plot
Group/species code_A = Area_h × TotalCover × SpeciesName_P
Group/species code _Hgt Estimated height of the plants 1 = 0-1 m 2 = 1-2 m 3 = 2-5 m 4 = > 5 m
Group/species code _W Species Invasion Weighting
(see Table 2.2)
Group/species code _In Species Invasion Index per species and plot
Group/species code_In = TotalCover × SpeciesName_P × Group/species code_Hgt × Group/species code_W
InvasIndex Invasion Index for the whole plot
The sum of all individual species indices to give a total Invasion index for the plot
InvasNorm Normalised Invasion Index Invasion Index expressed for all plots as a value between 0 and 1
These columns list the area of each plot (in m2 and hectares), the total cover of IAP species, the proportion of plot occupied by each species, the area (in hectares) occupied by each species, the estimated height, species weighting and individual and combined invasion indices.
Modelled 1:100 or 1:50 year floodlines could not be sourced in this survey. In the absence of floodlines therefore, it is suggested that the Overberg finescale wetlands layer be used as proxy until such floodlines become available. In addition to the proportions, invaded area, etc., a species weighting in terms of its invasion risk has been suggested in each instance as a value between 1 (low risk) and 3 (high risk) (Table 2.2). The weights are based both on the invasion potential of the species as well as its importance in the Palmiet catchmet. For example, all the Australian wattles are considered high risk and red sesbania low risk. These are suggested weightings and they are adjustable in the database. The weightings are then summed for the entire plot and adjusted (normalized) to a value between 0 and 1. The Invasion Index provides a rough prioritization for

Alien Clearing Guidelines
Palmiet River
June 2012 DRAFT Page 7 of 44
plots that are heavily invaded by high risk species. However, landowners and planners should use their own discretion and experience when interpreting these.
Table 2.2 Alien vegetation species and species group codes as they appear as column headers in the Palmiet AIP database with their respective weighting indices.
Palmiet AIP group code Common names Scientific names Weighting
AcSp Long - leaved wattle Acacia longifolia 3 Rooikrans Acacia cyclops 3 Port Jackson Acacia saligna 3 BWt Black wattle Acacia mearnsii 3 BWd Australian blackwood Acacia melanoxylon 3 Bram American bramble Rubus cuneifolius 2 Bug Bugweed Solanum mauritianum 1 Hak Sweet hakea Hakea drupacea 3 Lant Lantana Lantana camara 1 Oak Oak Quercus sp. 1 Pine Cluster pine Pinus pinaster 1 Monterey pine Pinus radiata 1 Pop White popular Populus alba 1 Gum Saligna gum Eucalyptus grandis 2 Ses Red sesbania Sesbania punicea 1
In addition to the proportions, invaded area, etc., a species weighting in terms of its invasion risk has been suggested in each instance as a value between 1 (low risk) and 3 (high risk) (Table 2.2). The weights are based both on the invasion potential of the species and well as its importance in the Palmiet catchmet. For example, all the Australian wattles are considered high risk and red sesbania low risk. These are suggested weightings and they are adjustable in the database. The weightings are then summed for the entire plot and adjusted (normalized) to a value between 0 and 1.
2.6 Limitations of the survey
Ground-truthing involved linking polygons mapped from aerial photos to vegetation patterns on the ground. Because of the natural gradation in vegetation groupings, the boundaries of polygons are occasionally arbitrarily based on manageable lengths of river. Problems of accessibility meant that some species needed to be identified from a distance and where sections of river could not be accessed, species groupings needed to be extrapolated from those that were visible to the survey team. Decisions had to be taken with regard to the distance from the banks – if the area adjoined the banks and was contiguous a single polygon was drawn. Landowners will need to decide how much of this to clear bearing in mind that leaving patches of alien vegetation uncleared will increase the risks of re-invasion. The invasive species groupings therefore provided a general guide and planning decisions should be taken on the ground.
2.7 Map organisation and output
In order to facilitate the distribution of maps to landowners, as well as to aid clearing plans, the geographical layers produced in GIS have been ordered using two separate grids superimposed on the alien vegetation plots (Figure 2.3). The larger grid consist of a 300 × 500 m matrix coded using alphabetic letters (A, B, C, AA, AB etc.). This size was selected because the aspect ratio is roughly equivalent to an A4 sheet and because it provides an adequate level of resolution for landowners to identify plots from the aerial imagery. Grid codes are provided in Appendix B to enable matching A4 sheets to be identified. Superimposed on the alphabetic grid is an additional grid divided into numbered one hectare squares. This second grid is meant as an aid to landowners when planning clearing operations. Together with the tables listing the proportions and aerial extent of plots, landowners will be able to use these to estimate the clearing effort required in each plot and assign work schedules. Separate GIS projects were created for each mapping unit (Nuweberg, Eikenhof,

Alien Clearing Guidelines
Palmiet River
June 2012 DRAFT Page 8 of 44
Applethwaite, Arieskraal and Krom). The relevant project and layer file names can be found in Appendix A.
Figure 2.3 Example of a *.pdf output from the Eikenhof Mapping unit with plot codes (yellow boundaries), the alphabetic A4 grid (thick white line, ‘F’), and numbered 1 hectare squares (thin white line).
Alien Clearing Guidelines
Palmiet River
June 2012 DRAFT Page 9 of 44
3. IAP ASSESSMENT AND STATE OF THE RIVER
This section describes the composition, relative abundances and distribution of some of the major invasive alien plant species along the mainstem of the Palmiet River and includes brief discussions on wetlands, buffers and bank stability. A more detailed assessment of river condition is given in Paxton and Ractliffe (2010).
3.8 IAP assessment
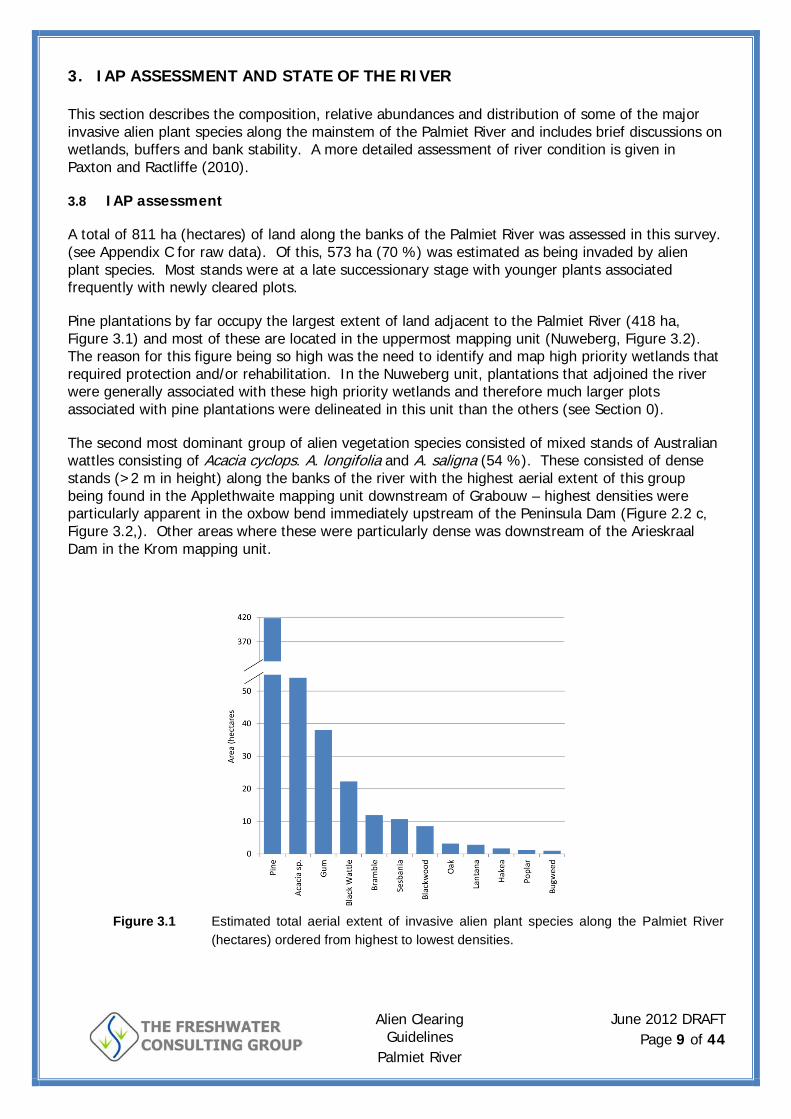
A total of 811 ha (hectares) of land along the banks of the Palmiet River was assessed in this survey. (see Appendix C for raw data). Of this, 573 ha (70 %) was estimated as being invaded by alien plant species. Most stands were at a late successionary stage with younger plants associated frequently with newly cleared plots.
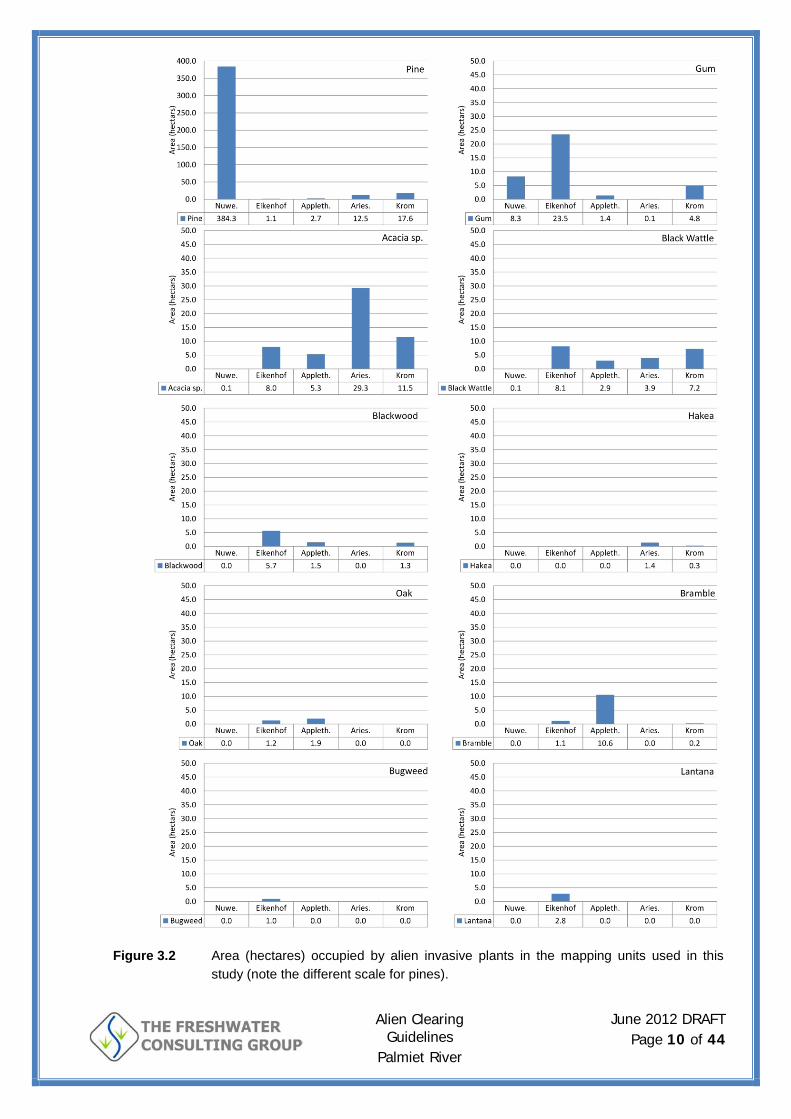
Pine plantations by far occupy the largest extent of land adjacent to the Palmiet River (418 ha, Figure 3.1) and most of these are located in the uppermost mapping unit (Nuweberg, Figure 3.2). The reason for this figure being so high was the need to identify and map high priority wetlands that required protection and/or rehabilitation. In the Nuweberg unit, plantations that adjoined the river were generally associated with these high priority wetlands and therefore much larger plots associated with pine plantations were delineated in this unit than the others (see Section 0).
The second most dominant group of alien vegetation species consisted of mixed stands of Australian wattles consisting of Acacia cyclops. A. longifolia and A. saligna (54 %). These consisted of dense stands (>2 m in height) along the banks of the river with the highest aerial extent of this group being found in the Applethwaite mapping unit downstream of Grabouw – highest densities were particularly apparent in the oxbow bend immediately upstream of the Peninsula Dam (Figure 2.2 c, Figure 3.2,). Other areas where these were particularly dense was downstream of the Arieskraal Dam in the Krom mapping unit.
Figure 3.1 Estimated total aerial extent of invasive alien plant species along the Palmiet River
(hectares) ordered from highest to lowest densities.
Alien Clearing Guidelines
Palmiet River
June 2012 DRAFT Page 10 of 44
Figure 3.2 Area (hectares) occupied by alien invasive plants in the mapping units used in this
study (note the different scale for pines).

Alien Clearing Guidelines
Palmiet River
June 2012 DRAFT Page 11 of 44
After the Australian acacias, Australian gums (predominately Eucalyptus grandis) were most common (38 %), with the largest specimens and highest densities being located in the Eikenhof mapping unit immediately downstream of the Eikenhof Dam to the N2 National Highway. The remainder of the larger tree invaders comprised black wattle (22%) and Australian blackwood (8.4%). These are often found in mixed stands with the other Australian acacia species with the black wattle favouring wetter areas closer to the river margins.
In addition to invasion of the riparian zone by alien tree species, the wet banks and floodplain areas that, under a higher flow regime would have comprised mostly palmiet (Prionium serratum) have been invaded by a combination of smaller tree and climber species including red sesbania, brambles and lantana. In many instances these occur in mixed stands with palmiet. Although Hakea was found in the catchment, it occurred in very low densities compared with the other species and primarily in the Krom mapping unit.
Note: although oak is not considered an invasive species, it has been included in this dataset because where it occurs along the riparian zone it encourages erosion and downcutting of river banks. Its elimination from the river banks is therefore encouraged.
3.9 Wetlands assessment
At the forefront of any strategy to conserve or restore river systems should be efforts to reinstate the natural functioning of their associated wetlands. In slowing the passage of water through the river system, storing and then releasing it over critical low-flow periods, wetlands play a crucial role in regulating the quantity and timing of water flowing through river catchments. They also play a similarly critical role in improving water quality by removing excess nutrients (nitrogen and phosphorous) and pollutants, increasing biological productivity and providing a habitat for wildlife. These ecosystem services become compromised in degraded wetlands that have been transformed by agriculture, forestry and urban development.
Finescale wetland maps have been produced for the Palmiet River by C.A.P.E. for the Overberg District Municipality Biodiversity Plan (Wetlands_Palmiet.shp). From these layers, it is evident that some of the most critical wetlands in the Palmiet River catchment are to be found in the Nuweberg area, Grabouw town and upper Krom River. The impact of forestry in the Nuweberg area is evident from aerial photos where pine plantations have encroached upon and in some instances directly overlie wetlands (Figure 3.3). Since evapotranspiration rates of pine plantations are much higher than wetlands, this is likely to be having a significant effect on downstream water yield. The loss or degradation of wetlands along the Klipdrift River has reduced this river’s ability to ameliorate some of the worst water quality related impacts of urbanization in its catchment.
Further downstream, the floodplains and riparian zones of the Palmiet River are mostly confined by cultivated lands and/or urban areas abutting the riparian zone. The riparian zone itself is heavily invaded by alien plant species. Thus the natural wetland functions of land adjoining the river are severely compromised. An additional factor which has contributed to the reduced quantity and quality of riparian wetlands are reduced flows as a result of impoundments. Low flows and smaller floods are important channel-forming components of natural river flow cycles. Without these, floodplains become encroached by vegetation (a process known as terrestrialisation) and the river, instead of flowing out onto the these floodplains becomes entrenched in a single deep channel. Consequently, there are few remaining reaches where the river naturally braids through floodplain/wetland areas.

Alien Clearing Guidelines
Palmiet River
June 2012 DRAFT Page 12 of 44
Figure 3.3 Aerial photograph showing pine plantations upstream of the Nuweberg Dam. Light
green shades indicate river-associated wetlands.
Palmiet (Prionium serratum), the namesake of the Palmiet River, is the ideal candidate for restoring riparian corridors because of its effectiveness at attenuating floods and stablising banks thereby increasing water infiltration and storage. It is able to filter water both mechanically through its leaves and roots and chemically through absorption of nutrients. Because of its intolerance for shade, it is easily replaced by Australian wattles and gums whereas in the macro-channel, it must compete with bramble and red sesbania.
3.10 River buffer zones
Two articles of legislation govern activities in and around rivers and wetlands. Section 144 of the National Water Act (NWA, Act No. 36 of 1998) states that:
“…no person may establish a township unless the layout plan shows, in a form acceptable to the local authority concerned, lines indicating the maximum level likely to be reached by floodwaters on average once in every 100 years.”
The National Environmental Management Act: EIA Regulations (Listed activities 386/387) places restrictions on the:
“construction of facilities or infrastructure, including associated structures or infrastructure, for any purpose in the one in ten year flood line of a river or stream, or within 32 metres from the bank of a river or stream where the flood line is unknown, excluding purposes associated with existing residential use, but including - (i) canals; (ii) channels; (iii) bridges; (iv) dams; and (v) weirs.”
However, accurate, modeled floodlines are only available for new developments. Furthermore, the full implementation of the 1:100 year floodline would have serious economic ramifications for landowners who have already cultivated land well into this zone. This is no less true of the

Alien Clearing Guidelines
Palmiet River
June 2012 DRAFT Page 13 of 44
mainstem and tributaries of the Palmiet River where the riparian zone has already been significantly modified by agricultural encroachment, modified river flows and terrestrialisation of former floodplains. In this survey it was in many instances impossible to discern the original riparian corridor and it was apparent that all available land neighboring the riparian zone has already been utilized for farming. Because of these limitations, it is suggested that the C.A.P.E finescale wetland map define the riparian buffer zone since this map incorporates riparian corridors as wetland areas. These have been provided in the GIS database that accompanies this document.
3.11 Bank stability
Bank stability was not noted as a significant problem in the catchment, primarily because of the stabilising effect of existing vegetation – in most instances alien. However should alien clearing programmes proceed, the stability of river banks may be temporarily compromised unless rehabilitation and bank stabilisation is initiated by replanting and/or the use of gabions.
Alien Clearing Guidelines
Palmiet River
June 2012 DRAFT Page 14 of 44
4. GIS DATABASE OPERATING INSTRUCTIONS
This section contains information that will allow operators to perform very basic functions in the GIS database and extract geographical information as needed. The Geographical Information System (GIS) database for this survey was developed using Quantum GIS (QGIS) software package (Version 1.7.4-Wroclaw). It is released under an open source GNU General Public License. A copy of this software has been provided as part of this project. To load the programme, double-clicking the file ‘QGIS-OSGeo4W-1.7.4-d211b16-Setup.exe’ which will run the executable setup files. However, should you wish to load the latest version, it is available at http://hub.qgis.org/projects/quantum-gis/wiki/Download. A very basic introduction to this software follows. Should you require a more detailed description, the latest manual has been provided, or can be downloaded from the QGIS website.
4.12 File types and management
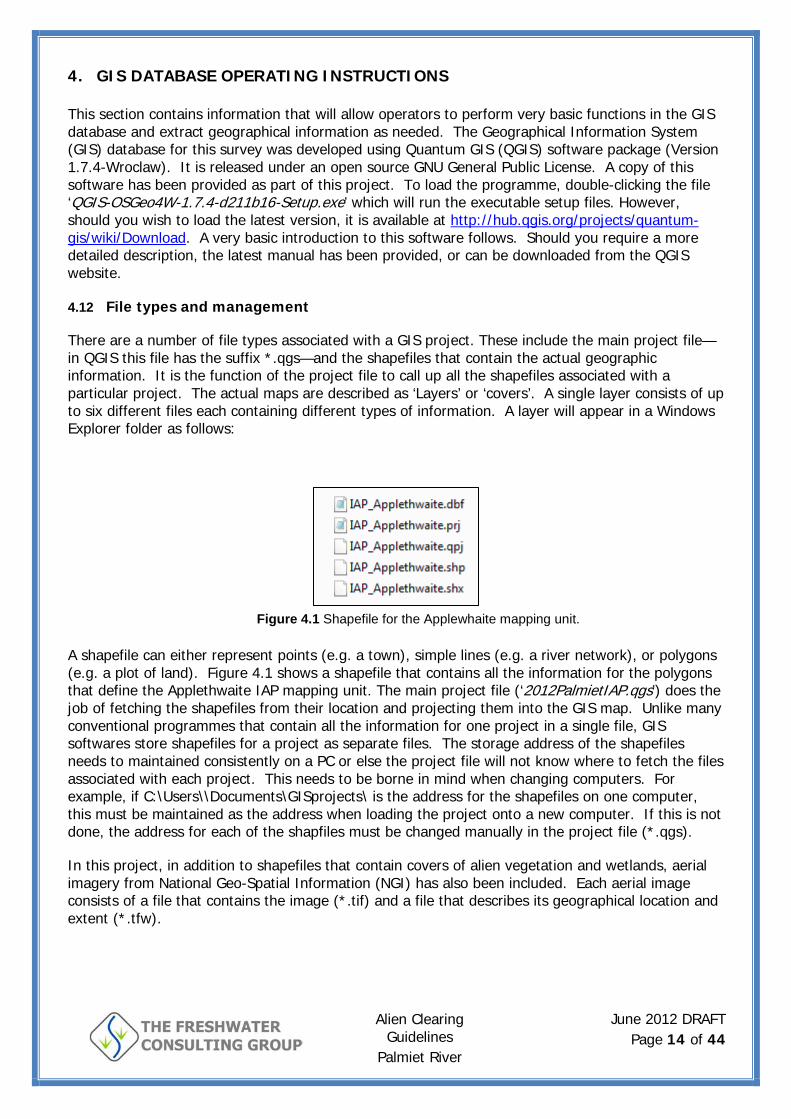
There are a number of file types associated with a GIS project. These include the main project file—in QGIS this file has the suffix *.qgs—and the shapefiles that contain the actual geographic information. It is the function of the project file to call up all the shapefiles associated with a particular project. The actual maps are described as ‘Layers’ or ‘covers’. A single layer consists of up to six different files each containing different types of information. A layer will appear in a Windows Explorer folder as follows:
Figure 4.1 Shapefile for the Applewhaite mapping unit.
A shapefile can either represent points (e.g. a town), simple lines (e.g. a river network), or polygons (e.g. a plot of land). Figure 4.1 shows a shapefile that contains all the information for the polygons that define the Applethwaite IAP mapping unit. The main project file (‘2012PalmietIAP.qgs’) does the job of fetching the shapefiles from their location and projecting them into the GIS map. Unlike many conventional programmes that contain all the information for one project in a single file, GIS softwares store shapefiles for a project as separate files. The storage address of the shapefiles needs to maintained consistently on a PC or else the project file will not know where to fetch the files associated with each project. This needs to be borne in mind when changing computers. For example, if C:\Users\\Documents\GISprojects\ is the address for the shapefiles on one computer, this must be maintained as the address when loading the project onto a new computer. If this is not done, the address for each of the shapfiles must be changed manually in the project file (*.qgs).
In this project, in addition to shapefiles that contain covers of alien vegetation and wetlands, aerial imagery from National Geo-Spatial Information (NGI) has also been included. Each aerial image consists of a file that contains the image (*.tif) and a file that describes its geographical location and extent (*.tfw).

Alien Clearing Guidelines
Palmiet River
June 2012 DRAFT Page 15 of 44
4.13 Opening projects and loading shapefiles
Open the file 2012PalmietIAP.qgs by double-clicking on it. This will open the project and load the layer files which will appear in a panel on the left as follows:
Figure 4.2 Layers panel
In the above screen capture you will see a combination of line and polygon shapefiles (RiverPalmietKrom etc.) and aerial images (3419_07_2010_325_RGB_RECT etc). A description of the each layer file in this project appears in Appendix A. By checking and unchecking each of the layers or aerial images in the checkboxes to the left you will be able to turn the associated layer on or off. By right clicking on the layer name and selecting ‘Zoom to layer extent’, you will be able view the layer at its full extent. Note that the order of the layers determines which layer will be on top. If you are unable to view a layer, it is probably because it is being hidden by a larger layer covering it. You can manipulate the order quite easily by selecting that layer and moving it up or down.
To add a layer go to the top menu and select Layer>Add Vector Layer. A window will appear that will give you the option of browsing to the location on your computer where the shapefile is located. Select ‘Browse’ and retrieve only the *.shp file listed in the set of files associated with that shapefile (Figure 4.1). Select ‘Ok’ and the file will load. To remove the file, right click in the layers panel. To navigate around the database, use the navigation and zooming tools provided (Figure 4.3). Zooming can also be performed by hitting ‘Cntrl’ on the keyboard and scrolling with the mouse.
Figure 4.3 Navigation and zooming tools
Each of the shapefiles are exactly what their name implies – shapes in the form of lines, points or polygons (closed shapes). These shapefiles are represented in the Layers Panel of QGIS as follows (Figure 4.4 - Figure 4.7):

Alien Clearing Guidelines
Palmiet River
June 2012 DRAFT Page 16 of 44
Figure 4.4 Polygon shapefiles
Figure 4.5 Line shapefiles
Figure 4.6 Point shapefiles
Figure 4.7 Aerial Images
4.14 Working with attribute data
Shapefiles include vector graphic representations of their geometry together with associated geographical information including their location, extent and projection. However, the power of the GIS database lies in the attribute data associated with each shapefile. This attribute data is contained in the *.dbf file (Figure 4.1). Any type of information you wish to associate with the file can be held in the attribute data file. By right-clicking a shapefile in the Layers Panel and selecting ‘Open attribute table’ you will be able to view this attribute data. The attribute data table consists of any number of columns with each row linking to an individual feature in the line, point or polygon shapefile to any type of information. The first column usually contains the name of the feature. The remainder of the file will contain other attribute information of relevance to the shapefile – in this instance plants species, proportion and density. Attribute data for individual lines or polygons can be retrieved by selecting the Information tool and then using it to point to the line or polygon you are interested in (Figure 4.8) – make sure the correct shapefile is also selected in the Layers Panel.
Figure 4.8 Information tool
To label shapefiles using attribute data, highlight the shapefile in the Layers Panel and select the Label Tool (Figure 4.9). This will bring up a Label Settings window. Select the ‘Label this layer’ checkbox in the top left corner and select the field you wish to use as labels in the top right corner ‘Field with Labels’.
Figure 4.9 Label Tool
Additional features of the shapefile can be controlled by right clicking the shapefile in the Layer Panel and selecting ‘Properties’. Under the Style tab you will be able select colours, outlines or

Alien Clearing Guidelines
Palmiet River
June 2012 DRAFT Page 17 of 44
transparency. In this box, individual features can also be given unique or graded colours according to their attribute values.
4.15 Adding GPS and attribute data
QGIS gives you the option of contributing GPS data to the database. With the *.gpx file that contains your Garmin waypoints and tracks downloaded on your computer, simply go to the Menu and select ‘Layer’ > ‘Add Vector Layer’ and browse to the *.gpx file. A window will appear that will require you to select which features you would like to add. Select waypoints or tracks, whichever you would like to add and they will appear as a point file in the database. Right click this point file and select ‘Save as’. Select Esri Shapefile in the pop up window and browse to a location where the shapefile is to be saved. This file can then be used as an ordinary shapefile in future. Remember not to change the location of the shapefile otherwise the project file will not be able to locate it.
To add attribute data such as landowner contact details or point-source pollution descriptions you will need the Table Manager plugin. Because QGIS is an open source platform, many of its features are contributed by users as ‘plugins’. To load the Table Manager plugin, make sure you are connected to the internet. Go to Menu > ‘Plugins’ > ‘Fetch Python Plugins’. In the Filter, type the word ‘table’ and select ‘Table Manager’ and select ‘install/upgrade plugin’. With the GPS layer with your waypoints still selected, go to the menu and select ‘Plugins’ > ‘Table’ > ‘Table Manager’. This will bring up a window that will allow you to add columns to the attribute table in your waypoint shapefile. Once you have done so and given the columns labels, save and close the window. Go back to your shapefile in the Layers Panel, right click and select ‘Toggle Editing’. Right click again and select ‘Open attribute table’. In the attribute table you will see the new column you created and with ‘toggle editing’ on you can enter your attribute information. When you select ‘Toggle Editing’ again you will be given the option of saving your work.
4.16 Representing species
To represent individual species occurrence, distribution and density through the catchment, commence the following procedure:
• Right-click the IAP_Palmiet_Combined, select ‘Properties’ and go to the ‘Style’ tab;
• In the drop-down box change ‘Single symbol’ to ‘Graduated’;
• The variables in the attributed table will appear in the ‘Column’ drop-down list; select the Total Proportion (TP) of the species you are interested in e.g. for gum, choose Gum_TP.
• Enter ‘5’ in the ‘Classes’ box to the right of the window;
• Click ‘Classify’ to the bottom left. Five coloured squares will appear below the ‘Symbol’ column together with their numerical ranges and labels.
• Double-click on the first square, select ‘Change’ in the window that opens. In next window, under ‘Fill style’, select ‘no brush’, under ‘Border style’ select ‘no pen’. Click ‘Ok’ and ‘Ok’ again.
• Adjacent the first square, double-click the values under ‘Range’. Set the ‘Lower Value’ to ‘0’ and the Upper value as ‘0.01’. Change the ‘Label’ column accordingly.
• Adjacent the second square, double-click the values under ‘Range’. Set the ‘Lower Value’ to ‘0.01’ and leave the Upper value as is. Change the ‘Label’ column accordingly. This will hide all polygons that have no gum in them.

Alien Clearing Guidelines
Palmiet River
June 2012 DRAFT Page 18 of 44
• Click ‘Ok’. You will now see only the polygons that have gum in them coloured according to proportion of the plot that is occupied by gum.
4.17 Printing maps
To print out selected areas of a map, go to ‘File’ > ‘Composer Manager’ > ‘Add’. A composer window will pop-up with a blank sheet defaulted to an A4 size. Go to the ‘Add new map’ icon (Figure 4.10) and select and drag the new map onto the empty map sheet. You will see your map appearing in a map frame.
Figure 4.10 Add new map icon
To change various aspects of your map such as it size and scale, use the ‘General’ and ‘Item’ tabs to the right of the window. To move the map frame use the ‘Select/move item’ icon and to move the map around within the map frame use the ‘Move item content’ icon (Figure 4.11). When you have set up the map for printing in the manner you wish, go to ‘File’ > ‘Export as Image’ and select the image you wish to save it as (pdf or jpeg), or go directly to the ‘Print’ command.
Figure 4.11 ‘Select/move item’ (left) and ‘Move item content’ (right) icons.

Alien Clearing Guidelines
Palmiet River
June 2012 DRAFT Page 19 of 44
5. REFERENCES
Paxton, B.R and Ractliffe, G. 2010. Palmiet River Catchment Management Plan: update and review. Report compiled by the Freshwater Consulting Group for the Groenland Water User Association. Pp 73.
Wenger, S.J. and L. Fowler. 2000. Protecting stream and river corridors: creating effective local riparian buffer ordinances. Public Policy Research Series. Carl Vinson Institute of Government, University of Georgia http://www.cviog.uga.edu/free-downloads/57.pdf. Pp. 68.

APPENDIX A
List of project and layer file names in the GIS database with their descriptions:
Project file name Description 2012PalmietIAP Project file containing all layers 2012PalmietIAP_Nuweberg Project file containing only the
Nuweberg mapping unit layers 2012PalmietIAP_Eikenhof Project file containing only the
Eikenhof mapping unit layers 2012PalmietIAP_Applethwaite Project file containing only the
Applethwaite mapping unit layers 2012PalmietIAP_Arieskraal Project file containing only the
Arieskraal mapping unit layers 2012PalmietIAP_Krom Project file containing only the Krom
mapping unit layers Aerial images Description
3418BB_09_2010_307, etc. 2010 Aerial images referenced using the 1:50 000 topographical grid (3418BB etc.)
Invasive Alien Vegetation layers Description IAP_Palmiet_Combined Invasive Alien Plant maps for all
mapping units combined (Nuweberg, Eikenhof, etc.)
IAP_Palmiet_Nuweberg Invasive Alien Plant maps for the Nuweberg mapping unit
IAP_Palmiet_Eikenhof Invasive Alien Plant maps for the Eikenhof mapping unit
IAP_Palmiet_Applethwaite Invasive Alien Plant maps for the Applethwaite mapping unit
IAP_Palmiet_Arieskraal Invasive Alien Plant maps for the Arieskraal mapping unit
IAP_Palmiet_Krom Invasive Alien Plant maps for the Krom mapping unit
River layers Description CatchmentPalmietQuartG40 Quarternary catchment boundaries for
the Palmiet River. RiverPalmietTrib1_50 Palmiet River – all rivers: 1: 50 000
topographical vector layer. RiverPalmiet1_50 Palmiet River – mainstem only: 1: 50
000 topographical vector layer. RiverPalmietHuis Huis River – mainstem only: 1: 50 000
topographical vector layer. RiverKrom Krom River – mainstem only: 1: 50
000 topographical vector layer. RiverPalmietNuweberg Mainstem Palmiet River in the
Nuweberg mapping unit RiverPalmietEikenhof Mainstem Palmiet River in the Eikenhof
mapping unit RiverPalmietKrom Mainstem Palmiet River in the
Krom/Arieskraal mapping unit
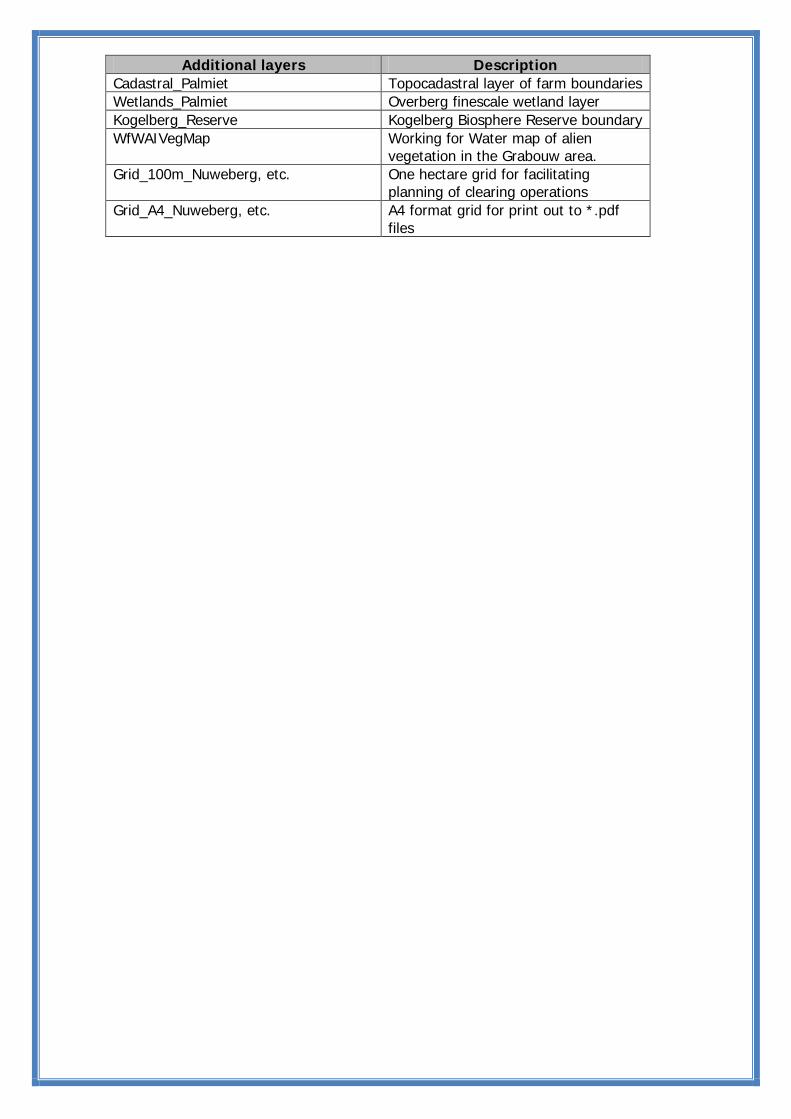
Additional layers Description Cadastral_Palmiet Topocadastral layer of farm boundaries Wetlands_Palmiet Overberg finescale wetland layer Kogelberg_Reserve Kogelberg Biosphere Reserve boundary WfWAIVegMap Working for Water map of alien
vegetation in the Grabouw area. Grid_100m_Nuweberg, etc. One hectare grid for facilitating
planning of clearing operations Grid_A4_Nuweberg, etc. A4 format grid for print out to *.pdf
files

APPENDIX B
Map codes for aligning landowner A4 map printouts:
Nuweberg Map Codes
A B C D E F G H I J K L M N O P Q R S T U V W X Y Z AA AB AC AD AE AF AG AH AI AJ AK AL AM AN AO AP AQ AR AS AT AU AV AW AX AY AZ BA BB BC BD BE BF BG BH BI BJ BK BL BM BN BO BP BQ BR BS BT BU BV BW BX BY BZ CA CB CC CD CE CF CG CH CI CJ CK CL CM CN CO CP CQ CR CS CT CU CV CW CX CY CZ DA DB DC DD DE DF DG DH DI DJ DK DL DM DN DO DP DQ DR DS DT DU DV
Eikenhof Map Codes
A B C D E F G I J K L M N O Q R S T U V W Y Z AA AB AC AD AE AG AH AI AJ AK AL AM AO AP AQ AR AS AT AU AW AX AY AZ BA BB BC BE BF BG BH BI BJ BK
Applethwaite Map Codes
A B C D E F G H I J K L M N O P Q R S T U V W X Y Z AA AB AC AD AE AF AG AH AI AJ AK AL AM AN AO AP AQ AR AS AT AU AV AW AX AY AZ BA BB
Arieskraal Map Codes
A B C D E F G H I J K L M N O P Q R S T U V W X Y Z AA AB AC AD AE AF AG AH AI AJ AK AL AM AN AO AP AQ AR AS AT AU AV AW AX AY AZ BA BB BC

Krom Map Codes
AA AB AC AD AE AF AG AH AI AJ AK AL AM AN AO AP AQ AR AS AT AU AV AW AX AY AZ BA BB BC BD BE BF BG BH BI BJ BK BL BM BN BO BP BQ BR BS BT BU BV BW BX BY BZ CA CB CC CD CE CF CG CH CI CJ CK CL CM CN CO CP CQ CR CS CT CU CV CW CX CY CZ DA DB

APPENDIX C Nuweberg Mapping Unit Proportion of plot occupied by species:
Plot Code
Area (m2)
Area (h) Total Cover
Total Area
Gum Black Wattle
Blckwd Aus. Acacia
Bram. Bugwd. Pine Lantan. Poplar Oak Sesban. Hakea
N01 7709 0.7709 1.00 0.77 1.00
N02 48875 4.8875 0.02 0.10 1.00
N03 3530605 353.0605 0.75 264.80 1.00
N04 127864 12.7864 0.00 0.00
N09 7536 0.7536 0.40 0.30
N20 86011 8.6011 0.00 0.00
N21 146552 14.6552 0.80 11.72 1.00
N23 196907 19.6907 0.80 15.75 1.00
N25 16096 1.6096 0.00 0.00
N26 23557 2.3557 0.00 0.00
N27 32742 3.2742 0.00 0.00
N29 42226 4.2226 0.90 3.80 1.00
N30 50548 5.0548 0.02 0.10 0.50 0.50
N31 10786 1.0786 0.90 0.97 1.00
N32 29518 2.9518 0.02 0.06 0.50 0.50
N33 20199 2.0199 0.02 0.04 0.50 0.50
N35 154514 15.4514 0.80 12.36 1.00
N36 21947 2.1947 0.80 1.76 1.00
N37 1589 0.1589 0.80 0.13 1.00
N38 14035 1.4035 0.80 1.12 1.00
N39 26645 2.6645 0.80 2.13 1.00
N40 31345 3.1345 0.80 2.51 1.00
N41 534332 53.4332 0.80 42.75 1.00
N42 48261 4.8261 0.00 0.00
N44 356039 35.6039 0.80 28.48 1.00
N45 179752 17.9752 0.02 0.36 1.00
N46 33590 3.359 0.90 3.02 1.00

Nuweberg Mapping Unit Total Area of the plot (hectares) comprised of: Plot Code
Area (m2)
Area (h)
Total Cover
Total Area
Gum Black Wattle
Blckwd Aus. Acacia
Bram. Bugwd. Pine Lantan. Poplar Oak Sesban. Hakea
N01 7709 0.7709 1.00 0.77 0.77
N02 48875 4.8875 0.02 0.10 0.10
N03 3530605 353.0605 0.75 264.80 264.80
N04 127864 12.7864 0.00 0.00
N09 7536 0.7536 0.40 0.30
N20 86011 8.6011 0.00 0.00
N21 146552 14.6552 0.80 11.72 11.72
N23 196907 19.6907 0.80 15.75 15.75
N25 16096 1.6096 0.00 0.00
N26 23557 2.3557 0.00 0.00
N27 32742 3.2742 0.00 0.00
N29 42226 4.2226 0.90 3.80 3.80
N30 50548 5.0548 0.02 0.10 0.05 0.05
N31 10786 1.0786 0.90 0.97 0.97
N32 29518 2.9518 0.02 0.06 0.03 0.03
N33 20199 2.0199 0.02 0.04 0.02 0.02
N35 154514 15.4514 0.80 12.36 12.36
N36 21947 2.1947 0.80 1.76 1.76
N37 1589 0.1589 0.80 0.13 0.13
N38 14035 1.4035 0.80 1.12 1.12
N39 26645 2.6645 0.80 2.13 2.13
N40 31345 3.1345 0.80 2.51 2.51
N41 534332 53.4332 0.80 42.75 42.75
N42 48261 4.8261 0.00 0.00
N44 356039 35.6039 0.80 28.48 28.48
N45 179752 17.9752 0.02 0.36 0.36
N46 33590 3.359 0.90 3.02 3.02

Nuweberg Mapping Unit Estimated height (m): Plot Code
Area (m2)
Area (h)
Total Cover
Total Area
Gum Black Wattle
Blckwd Aus. Acacia
Bram. Bugwd. Pine Lantan. Poplar Oak Sesban. Hakea
N1 7709 0.7709 1.00 0.77 >5
N2 48875 4.8875 0.02 0.10 2-5
N3 3530605 353.0605
0.75 264.80 >5
N4 127864 12.7864 0.00 0.00
N9 7536 0.7536 0.40 0.30
N20 86011 8.6011 0.00 0.00
N21 146552 14.6552 0.80 11.72 >5
N23 196907 19.6907 0.80 15.75 >5
N25 16096 1.6096 0.00 0.00
N26 23557 2.3557 0.00 0.00
N27 32742 3.2742 0.00 0.00
N29 42226 4.2226 0.90 3.80 >5
N30 50548 5.0548 0.02 0.10 0-1 0-1
N31 10786 1.0786 0.90 0.97 >5
N32 29518 2.9518 0.02 0.06 0-1 0-1
N33 20199 2.0199 0.02 0.04 0-1 0-1
N35 154514 15.4514 0.80 12.36 >5
N36 21947 2.1947 0.80 1.76 >5
N37 1589 0.1589 0.80 0.13 >5
N38 14035 1.4035 0.80 1.12 >5
N39 26645 2.6645 0.80 2.13 >5
N40 31345 3.1345 0.80 2.51 >5
N41 534332 53.4332 0.80 42.75 >5
N42 48261 4.8261 0.00 0.00
N44 356039 35.6039 0.80 28.48 >5
N45 179752 17.9752 0.02 0.36 2-5
N46 33590 3.359 0.90 3.02 >5

Eikenhof Mapping Unit Proportion of plot occupied by species:
Plot Code
Area (m2)
Area (h)
Total Cover
Total Area
Gum Black Wattle
Blckwd Aus. Acacia
Bram. Bugwd. Pine Lantan. Poplar Oak Sesban. Hakea
E1 88394 8.8394 1.00 8.84 0.40 0.20 0.20 0.20
E2 1579 0.1579 1.00 0.16 0.20 0.20 0.30 0.30
E3 3783 0.3783 1.00 0.38 0.20 0.20 0.30 0.30
E4 598 0.0598 1.00 0.06 0.20 0.20 0.30 0.30
E5 2691 0.2691 1.00 0.27 0.20 0.20 0.30 0.30
E6 55 0.0055 1.00 0.01 0.20 0.20 0.30 0.30
E7 693 0.0693 1.00 0.07 0.20 0.20 0.30 0.30
E8 15744 1.5744 1.00 1.57 0.20 0.20 0.30 0.30
E9 6933 0.6933 1.00 0.69 0.90 0.20 0.30 0.40 0.10
E10 5455 0.5455 1.00 0.55 0.90 0.20 0.30 0.40 0.10
E11 1168 0.1168 1.00 0.12 0.85 0.50 0.10
E12 9135 0.9135 0.60 0.55 0.18 0.18 0.24
E13 53198 5.3198 0.40 2.13 0.12 0.20 0.20 0.12 0.12
E14 123483 12.3483 0.30 3.70 0.60 0.60 0.60 0.12
E15 12974 1.2974 1.00 1.30 0.25 0.50 0.25
E16 2625 0.2625 1.00 0.26 1.00
E17 149 0.0149 1.00 0.01 0.99 0.10
E18 48697 4.8697 1.00 4.87 0.55 0.45
E19 32767 3.2767 1.00 3.28 1.00
E20 44194 4.4194 1.00 4.42 1.00
E21 3238 0.3238 1.00 0.32 1.00
E22 484 0.0484 1.00 0.05 1.00
E23 132763 13.2763 0.50 6.64 0.15 0.20 0.15
E24 145 0.0145 0.70 0.01 0.70 0.14 0.70 0.42
E25 1676 0.1676 1.00 0.17 1.00
E26 5538 0.5538 1.00 0.55 0.40 0.20 0.20 0.20

Eikenhof Mapping Unit Total Area of the plot (hectares) comprised of:
Plot Code
Area (m2)
Area (h)
Total Cover
Total Area
Gum Black Wattle
Blckwd Aus. Acacia
Bram. Bugwd. Pine Lantan. Poplar Oak Sesban. Hakea
E1 88394 8.8394 1.00 8.84
3.54 1.77 1.77 1.77
E2 1579 0.1579 1.00 0.16
0.03 0.03 0.05 0.05
E3 3783 0.3783 1.00 0.38
0.08 0.08 0.11 0.11
E4 598 0.0598 1.00 0.06
0.01 0.01 0.02 0.02
E5 2691 0.2691 1.00 0.27
0.05 0.05 0.08 0.08
E6 550 0.055 1.00 0.06
0.01 0.01 0.02 0.02
E7 693 0.0693 1.00 0.07
0.01 0.01 0.02 0.02
E8 15744 1.5744 1.00 1.57
0.31 0.31 0.47 0.47
E9 60933 6.0933 1.00 6.09
0.55 1.22 1.83 2.44 0.06
E10 5455 0.5455 1.00 0.55
0.05 0.11 0.16 0.22 0.01
E11 101068 10.1068 1.00 10.11
8.59 0.51 1.01
E12 9135 0.9135 0.60 0.55
0.16 0.16 0.22
E13 53198 5.3198 0.40 2.13
0.64 0.11 0.11 0.64 0.64
E14 123483 12.3483 0.30 3.70
0.74 0.74 0.74 1.48
E15 12974 1.2974 1.00 1.30
0.32 0.65 0.32
E16 2625 0.2625 1.00 0.26
0.26
E17 10490 1.049 1.00 1.05
1.04 0.01
E18 48697 4.8697 1.00 4.87
2.68 2.19
E19 32767 3.2767 1.00 3.28
3.28
E20 44194 4.4194 1.00 4.42
4.42
E21 3238 0.3238 1.00 0.32
0.32
E22 484 0.0484 1.00 0.05
0.05
E23 132763 13.2763 0.50 6.64
1.99 2.66 1.99
E24 14500 1.45 0.70 1.02
0.10 0.20 0.10 0.61
E25 16760 1.676 1.00 1.68
1.68
E26 5538 0.5538 1.00 0.55
0.22 0.11 0.11 0.11

Eikenhof Mapping Unit Estimated height (m):
Plot Code
Area (m2)
Are (h)
Total Cover
Total Area
Gum Black Wattle
Blckwd Aus. Acacia
Bram. Bugwd. Pine Lantan. Poplar Oak Sesban. Hakea
E1 88394 8.8394 1.00 8.84 >5 >5 >5 2-5
E2 1579 0.1579 1.00 0.16 >5 >5 >5 2-5
E3 3783 0.3783 1.00 0.38 >5 >5 >5 2-5
E4 598 0.0598 1.00 0.06 >5 >5 >5 2-5
E5 2691 0.2691 1.00 0.27 >5 >5 >5 2-5
E6 55 0.0055 1.00 0.01 >5 >5 >5 2-5
E7 693 0.0693 1.00 0.07 >5 >5 >5 2-5
E8 15744 1.5744 1.00 1.57 >5 >5 >5 2-5
E9 6933 0.6933 1.00 0.69 >5 >5 >5 >5 >5
E10 5455 0.5455 1.00 0.55 >5 >5 >5 >5 >5
E11 1168 0.1168 1.00 0.12 >5 >5 >5
E12 9135 0.9135 0.60 0.55 >5 >5 >5
E13 53198 5.3198 0.40 2.13 >5 0-1 2-5 >5 1-2
E14 123483 12.3483 0.30 3.70 1-2 1-2 1-2 1-2
E15 12974 1.2974 1.00 1.30 >5 >5 >5
E16 2625 0.2625 1.00 0.26
E17 149 0.0149 1.00 0.01 >5
E18 48697 4.8697 1.00 4.87 2-5
E19 32767 3.2767 1.00 3.28 >5
E20 44194 4.4194 1.00 4.42 >5
E21 3238 0.3238 1.00 0.32 >5
E22 484 0.0484 1.00 0.05 >5
E23 132763 13.2763 0.50 6.64 2-5 2-5 2-5
E24 145 0.0145 0.70 0.01 >5 1-2
E25 1676 0.1676 1.00 0.17 >5
E26 5538 0.5538 1.00 0.55 >5 >5 >5 2-5

Applethwaite Mapping Unit Proportion of plot occupied by species:
Plot Code
Area (m2)
Area (h)
Total Cover
Total Area
Gum Black Wattle
Blckwd Aus. Acacia
Bram. Bugwd. Pine Lantan. Poplar Oak Sesban. Hakea
A26 8280 0.828 1.00 0.83 0.80 0.20
A27 13806 1.3806 0.90 1.24 0.50 0.25 0.25
A28 2876 0.2876 0.80 0.23 0.50 0.25 0.25
A29 19640 1.964 1.00 1.96 0.20 0.20 0.40 0.20
A30 17101 1.7101 1.00 1.71 0.20 0.20 0.40 0.20
A31 402 0.0402 1.00 0.04 1.00
A32 328 0.0328 1.00 0.03 1.00
A34 4022 0.4022 1.00 0.40 1.00
A35 13839 1.3839 1.00 1.38 0.25 0.25 0.25 0.25
A36 4361 0.4361 1.00 0.44 0.25 0.25 0.25 0.25
A37 1653 0.1653 1.00 0.17 1.00
A38 18244 1.8244 1.00 1.82 0.20 0.30 0.50
A39 6392 0.6392 1.00 0.64 0.25 0.25 0.25 0.25
A40 1244 0.1244 0.50 0.06 0.25 0.25 0.25 0.25
A41 575 0.0575 1.00 0.06 0.25 0.25 0.25 0.25
A42 2411 0.2411 1.00 0.24 0.50 0.50
A43 206936 20.6936 0.60 12.42 0.10 0.70 0.20
A44 17376 1.7376 1.00 1.74 0.20 0.20 0.40 0.20
A45 34042 3.4042 0.70 2.38 0.30 0.40 0.30
A46 33433 3.3433 0.80 2.67 0.10 0.70 0.20

Applethwaite Mapping Unit Total Area of the plot (hectares) comprised of:
Plot Code
Area (m2)
Area (h)
Total Cover
Total Area
Gum Black Wattle
Blckwd Aus. Acacia
Bram. Bugwd. Pine Lantan. Poplar Oak Sesban. Hakea
A26 8280 0.828 1.00 0.83
0.66
0.17
A27 13806 1.3806 0.90 1.24 0.62 0.31 0.31
A28 2876 0.2876 0.80 0.23 0.12 0.06 0.06
A29 19640 1.964 1.00 1.96
0.39 0.39 0.79
0.39
A30 17101 1.7101 1.00 1.71
0.34 0.34 0.68
0.34
A31 402 0.0402 1.00 0.04
0.04
A32 328 0.0328 1.00 0.03
0.03
A34 4022 0.4022 1.00 0.40
0.40
A35 13839 1.3839 1.00 1.38 0.35 0.35
0.35
0.35
A36 4361 0.4361 1.00 0.44 0.11 0.11
0.11
0.11
A37 1653 0.1653 1.00 0.17
0.17
A38 18244 1.8244 1.00 1.82
0.36
0.55 0.91
A39 6392 0.6392 1.00 0.64 0.16 0.16
0.16
0.16
A40 1244 0.1244 0.50 0.06 0.02 0.02
0.02
0.02
A41 575 0.0575 1.00 0.06 0.01 0.01
0.01
0.01
A42 2411 0.2411 1.00 0.24
0.12
0.12
A43 206936 20.6936 0.60 12.42
1.24 8.69
2.48
A44 17376 1.7376 1.00 1.74
0.35 0.35 0.70
0.35
A45 34042 3.4042 0.70 2.38
0.71
0.95
0.71
A46 33433 3.3433 0.80 2.67
0.27 1.87
0.53

Applethwaite Mapping Unit Estimated height (m):
Plot Code
Area (m2)
Area (h)
Total Cover
Total Area
Gum Black Wattle
Blckwd Aus. Acacia
Bram. Bugwd. Pine Lantan. Poplar Oak Sesban. Hakea
A26 8280 0.828 1.00 0.83
>5 >5
A27 13806 1.3806 0.90 1.24
>5 >5 >5
A28 2876 0.2876 0.80 0.23
>5 >5 >5
A29 19640 1.964 1.00 1.96
>5 >5 >5 >5
A30 17101 1.7101 1.00 1.71
>5 >5 >5 >5
A31 402 0.0402 1.00 0.04
>5
A32 328 0.0328 1.00 0.03
>5
A34 4022 0.4022 1.00 0.40
>5
A35 13839 1.3839 1.00 1.38
>5 >5 >5 >5
A36 4361 0.4361 1.00 0.44
>5 >5 >5 >5
A37 1653 0.1653 1.00 0.17
>5
A38 18244 1.8244 1.00 1.82
>5 >5 >5
A39 6392 0.6392 1.00 0.64
>5 >5 >5 >5
A40 1244 0.1244 0.50 0.06
>5 >5 >5 >5
A41 575 0.0575 1.00 0.06
>5 >5 >5 >5
A42 2411 0.2411 1.00 0.24
2-5 >5
A43 206936 20.6936 0.60 12.42
1-2 0-1 1-2
A44 17376 1.7376 1.00 1.74
>5 >5 >5 >5
A45 34042 3.4042 0.70 2.38
2-5 2-5 2-5
A46 33433 3.3433 0.80 2.67
1-2 0-1 1-2

Arieskraal Mapping Unit Proportion of plot occupied by species:
Plot Code
Area (m2)
Area (h)
Total Cover
Total Area
Gum Black Wattle
Blckwd Aus. Acacia
Bram. Bugwd. Pine Lantan. Poplar Oak Sesban. Hakea
Ar1 3002 0.3002 0.95 0.29 0.60 0.39 0.01
Ar2 46803 4.6803 0.95 4.45 0.05 0.95
Ar3 480 0.048 0.95 0.05 0.60 0.39 0.01
Ar4 14184 1.4184 0.60 0.85 0.60 0.40
Ar5 1693 0.1693 0.60 0.10 0.60 0.40
Ar6 102504 10.2504 0.70 7.18 0.10 0.90
Ar7 3579 0.3579 0.60 0.21 0.60 0.40
Ar8 265425 26.5425 0.80 21.23 0.95 0.05
Ar9 3293 0.3293 0.80 0.26 0.95 0.05
Ar10 6378 0.6378 1.00 0.64 0.10 0.70 0.15 0.05
Ar11 56193 5.6193 1.00 5.62 0.10 0.70 0.15 0.05
Ar12 22845 2.2845 1.00 2.28 0.05 0.50 0.40 0.05
Ar14 35416 3.5416 1.00 3.54 0.60 0.40
Ar15 1765 0.1765 1.00 0.18 0.10 0.70 0.15 0.05
Ar16 5261 0.5261 0.60 0.32 0.60 0.40

Arieskraal Mapping Unit Total Area of the plot (hectares) comprised of:
Plot Code
Area (m2)
Area (h)
Total Cover
Total Area
Gum Black Wattle
Blckwd Aus. Acacia
Bram. Bugwd. Pine Lantan. Poplar Oak Sesban. Hakea
Ar1 3002 0.3002 0.95 0.29
0.17
0.11
Ar2 46803 4.6803 0.95 4.45
0.22
4.22
Ar3 480 0.048 0.95 0.05
0.03
0.02
Ar4 14184 1.4184 0.60 0.85
0.51
0.34
Ar5 1693 0.1693 0.60 0.10
0.06
0.04
Ar6 102504 10.2504 0.70 7.18
0.72
6.46
Ar7 3579 0.3579 0.60 0.21
0.13
0.09
Ar8 265425 26.5425 0.80 21.23
20.17
1.06
Ar9 3293 0.3293 0.80 0.26
0.25
0.01
Ar10 6378 0.6378 1.00 0.64
0.06
0.45
0.10
0.03
Ar11 56193 5.6193 1.00 5.62
0.56
3.93
0.84
0.28
Ar12 22845 2.2845 1.00 2.28 0.11 1.14
0.91
0.11
Ar14 35416 3.5416 1.00 3.54
2.12
1.42
Ar15 1765 0.1765 1.00 0.18
0.02
0.12
0.03
0.01
Ar16 5261 0.5261 0.60 0.32
0.19
0.13

Arieskraal Mapping Unit Estimated height (m):
Plot Code
Area (m2)
Area (h)
Total Cover
Total Area
Gum Black Wattle
Blckwd Aus. Acacia
Bram. Bugwd. Pine Lantan. Poplar Oak Sesban. Hakea
Ar1 3002 0.3002 0.95 0.29 1-2 1-2 1-2
Ar2 46803 4.6803 0.95 4.45 2-5 >5
Ar3 480 0.048 0.95 0.05 1-2 1-2 1-2
Ar4 14184 1.4184 0.60 0.85 2-5 2-5
Ar5 1693 0.1693 0.60 0.10 2-5 2-5
Ar6 102504 10.2504 0.70 7.18 1-2 >5
Ar7 3579 0.3579 0.60 0.21 2-5 2-5
Ar8 265425 26.5425 0.80 21.23 2-5 1-2
Ar9 3293 0.3293 0.80 0.26 2-5 1-2
Ar10 6378 0.6378 1.00 0.64 2-5 2-5 >5 1-2
Ar11 56193 5.6193 1.00 5.62 2-5 2-5 >5 1-2
Ar12 22845 2.2845 1.00 2.28 >5 >5 >5 >5
Ar14 35416 3.5416 1.00 3.54 >5 >5
Ar15 1765 0.1765 1.00 0.18 2-5 2-5 >5 1-2
Ar16 5261 0.5261 0.60 0.32 2-5 2-5

Krom Mapping Unit Proportion of plot occupied by species:
Plot Code
Area (m2)
Area (h)
Total Cover
Total Area
Gum Black Wattle
Blckwd Aus. Acacia
Bram. Bugwd. Pine Lantan. Poplar Oak Sesban. Hakea
K11 53786 5.3786 1.00 5.38 0.55 0.20 0.15 0.05 0.05
K12 28248 2.8248 1.00 2.82 0.70 0.30
K13 80901 8.0901 1.00 8.09 0.05 0.05 0.90
K14 14054 1.4054 0.80 1.12 1.00
K15 5010 0.501 0.05 0.03 0.10 0.90
K16 3061 0.3061 0.05 0.02 0.10 0.90
K17 21133 2.1133 0.60 1.27 0.10 0.20 0.70
K20 8448 0.8448 1.00 0.84 1.00
K21 12227 1.2227 0.05 0.06 1.00
K22 5840 0.584 0.80 0.47 0.20 0.10 0.10 0.50
K23 364 0.0364 1.00 0.04 1.00
K24 154 0.0154 1.00 0.02 1.00
K25 217 0.0217 1.00 0.02 1.00
K26 294 0.0294 1.00 0.03 1.00
K27 24436 2.4436 0.05 0.12 1.00
K28 3806 0.3806 0.05 0.02 1.00
K29 13903 1.3903 0.80 1.11 0.10 0.10 0.70 0.10
K30 5071 0.5071 0.05 0.03 1.00
K31 1145 0.1145 0.80 0.09 0.10 0.10 0.70 0.10
K32 7414 0.7414 0.05 0.04 1.00
K33 3138 0.3138 0.05 0.02 1.00
K34 716 0.0716 0.05 1.00
K35 43130 4.313 1.00 4.31 0.45 0.05 0.45 0.05
K37 1450 0.145 0.05 0.01 1.00
K38 11067 1.1067 1.00 1.11 0.20 0.10 0.65 0.05
K40 59016 5.9016 0.80 4.72 1.00
K41 41581 4.1581 0.80 3.33 1.00
K42 20388 2.0388 0.60 1.22 0.10 0.20 0.70
K43 3382 0.3382 0.05 0.02 0.10 0.90

K46 16869 1.6869 0.05 0.08 1.00
K47 39845 3.9845 1.00 3.98 0.20 0.10 0.65 0.05
K48 6740 0.674 0.05 0.03 1.00
K49 25616 2.5616 0.90 2.31 0.25 0.05 0.60 0.10
K50 4529 0.4529 0.30 0.14 0.50 0.50
K51 2811 0.2811 0.30 0.08 0.33 0.33 0.33

Krom Mapping Unit Total Area of the plot (hectares) comprised of:
Plot Code
Area (m2)
Area (h)
Total Cover
Total Area
Gum Black Wattle
Blckwd Aus. Acacia
Bram. Bugwd. Pine Lantan. Poplar Oak Sesban. Hakea
K11 53786 5.3786 1.00 5.38 2.96 1.08 0.81 0.27 0.27
K12 28248 2.8248 1.00 2.82 1.98 0.85
K13 80901 8.0901 1.00 8.09 0.40 0.40 7.28
K14 14054 1.4054 0.80 1.12 1.12
K15 5010 0.501 0.05 0.03 0.02
K16 3061 0.3061 0.05 0.02 0.01
K17 21133 2.1133 0.60 1.27 0.13 0.25 0.89
K20 8448 0.8448 1.00 0.84 0.84
K21 12227 1.2227 0.05 0.06 0.06
K22 5840 0.584 0.80 0.47 0.09 0.05 0.05 0.23
K23 364 0.0364 1.00 0.04 0.04
K24 154 0.0154 1.00 0.02 0.02
K25 217 0.0217 1.00 0.02 0.02
K26 294 0.0294 1.00 0.03 0.03
K27 24436 2.4436 0.05 0.12 0.12
K28 3806 0.3806 0.05 0.02 0.02
K29 13903 1.3903 0.80 1.11 0.11 0.11 0.78 0.11
K30 5071 0.5071 0.05 0.03 0.03
K31 1145 0.1145 0.80 0.09 0.01 0.01 0.06 0.01
K32 7414 0.7414 0.05 0.04 0.04
K33 3138 0.3138 0.05 0.02 0.02
K34 716 0.0716 0.05
K35 43130 4.313 1.00 4.31 1.94 0.22 1.94 0.22
K37 1450 0.145 0.05 0.01 0.01
K38 11067 1.1067 1.00 1.11 0.22 0.11 0.72 0.06
K40 59016 5.9016 0.80 4.72 4.72
K41 41581 4.1581 0.80 3.33 3.33
K42 20388 2.0388 0.60 1.22 0.12 0.24 0.86
K43 3382 0.3382 0.05 0.02 0.02

K46 16869 1.6869 0.05 0.08 0.08
K47 39845 3.9845 1.00 3.98 0.80 0.40 2.59 0.20
K48 6740 0.674 0.05 0.03 0.03
K49 25616 2.5616 0.90 2.31 0.58 0.12 1.38 0.23
K50 4529 0.4529 0.30 0.14 0.07 0.07
K51 2811 0.2811 0.30 0.08 0.03 0.03 0.03

Krom Mapping Unit Estimated height (m):
Plot Code
Area (m2)
Area (h)
Total Cover
Total Area
Gum Black Wattle
Blckwd Aus. Acacia
Bram. Bugwd. Pine Lantan. Poplar Oak Sesban. Hakea
K11 53786 5.3786 1.00 5.38 2-5 2-5 >5 >5 1-2
K12 28248 2.8248 1.00 2.82 2-5 2-5
K13 80901 8.0901 1.00 8.09 2-5 2-5 >5
K14 14054 1.4054 0.80 1.12 >5
K15 5010 0.501 0.05 0.03 2-5 2-5
K16 3061 0.3061 0.05 0.02 2-5 2-5
K17 21133 2.1133 0.60 1.27 >5 >5 2-5
K20 8448 0.8448 1.00 0.84 >5
K21 12227 1.2227 0.05 0.06 1-2
K22 5840 0.584 0.80 0.47 2-5 2-5 1-2 0-1
K23 364 0.0364 1.00 0.04 >5
K24 154 0.0154 1.00 0.02 >5
K25 217 0.0217 1.00 0.02 >5
K26 294 0.0294 1.00 0.03 >5
K27 24436 2.4436 0.05 0.12 1-2
K28 3806 0.3806 0.05 0.02 1-2
K29 13903 1.3903 0.80 1.11 2-5 >5 2-5 >5
K30 5071 0.5071 0.05 0.03 1-2
K31 1145 0.1145 0.80 0.09 2-5 >5 2-5 >5
K32 7414 0.7414 0.05 0.04 1-2
K33 3138 0.3138 0.05 0.02 1-2
K34 716 0.0716 0.05 1-2
K35 43130 4.313 1.00 4.31 2-5 >5 2-5 >5
K37 1450 0.145 0.05 0.01 1-2
K38 11067 1.1067 1.00 1.11 2-5 >5 2-5
K40 59016 5.9016 0.80 4.72 >5
K41 41581 4.1581 0.80 3.33 >5
K42 20388 2.0388 0.60 1.22 >5 >5 2-5
K43 3382 0.3382 0.05 0.02 2-5 2-5

K46 16869 1.6869 0.05 0.08 1-2
K47 39845 3.9845 1.00 3.98 2-5 >5 2-5
K48 6740 0.674 0.05 0.03 1-2
K49 25616 2.5616 0.90 2.31 2-5 2-5 2-5 2-5
K50 4529 0.4529 0.30 0.14 2-5 2-5
K51 2811 0.2811 0.30 0.08 1-2 2-5 2-5