mapping the structure and evolution of world wide...
TRANSCRIPT

Mapping the Structure and Evolution of World Wide Scienceof World Wide Science
Dr. Katy Börner Cyberinfrastructure for Network Science Center DirectorCyberinfrastructure for Network Science Center, DirectorInformation Visualization Laboratory, DirectorSchool of Library and Information ScienceIndiana University, Bloomington, [email protected]
Meeting at FAPESP São Paulo BrazilMeeting at FAPESP, São Paulo, BrazilJuly 20, 2009
Computational Scientometrics:S d i S i b S i ifi MStudying Science by Scientific Means
B K Ch Ch i d B k K i (2003) Vi li i K l d D i I Börner, Katy, Chen, Chaomei, and Boyack, Kevin. (2003). Visualizing Knowledge Domains. In Blaise Cronin (Ed.), Annual Review of Information Science & Technology, Medford, NJ: Information Today, Inc./American Society for Information Science and Technology, Volume 37, Chapter 5, pp. 179-255. http://ivl.slis.indiana.edu/km/pub/2003-borner-arist.pdfp // / /p / p
Shiffrin, Richard M. and Börner, Katy (Eds.) (2004). Mapping Knowledge Domains.Proceedings of the National Academy of Sciences of the United States of America, 101(Suppl_1). http://www.pnas.org/content/vol101/suppl_1/
Bö K t S l S d V pi i Al d (2007) N t k S i I Bl i Börner, Katy, Sanyal, Soma and Vespignani, Alessandro (2007). Network Science. In Blaise Cronin (Ed.), Annual Review of Information Science & Technology, Information Today, Inc./American Society for Information Science and Technology, Medford, NJ, Volume 41, Chapter 12, pp. 537-607. http://ivl.slis.indiana.edu/km/pub/2007-borner-arist.pdfp p p
Places & Spaces: Mapping Science exhibit, see also http://scimaps.org.
2
http://scimaps.org
Computational Scientometrics Opportunities
Advantages for Funding Agencies Supports monitoring of (long-term) money flow and research developments, evaluation of
funding strategies for different programs, decisions on project durations, funding patterns.g g p g , p j , g p Staff resources can be used for scientific program development, to identify areas for future
development, and the stimulation of new research areas.Advantages for Researchers Easy access to research results relevant funding programs and their success rates potential Easy access to research results, relevant funding programs and their success rates, potential
collaborators, competitors, related projects/publications (research push). More time for research and teaching.
Advantages for Industry Fast and easy access to major results, experts, etc. Can influence the direction of research by entering information on needed technologies
(industry-pull).
Ad antages for P blishersAdvantages for Publishers Unique interface to their data. Publicly funded development of databases and their interlinkage.
For SocietyFor Society Dramatically improved access to scientific knowledge and expertise.
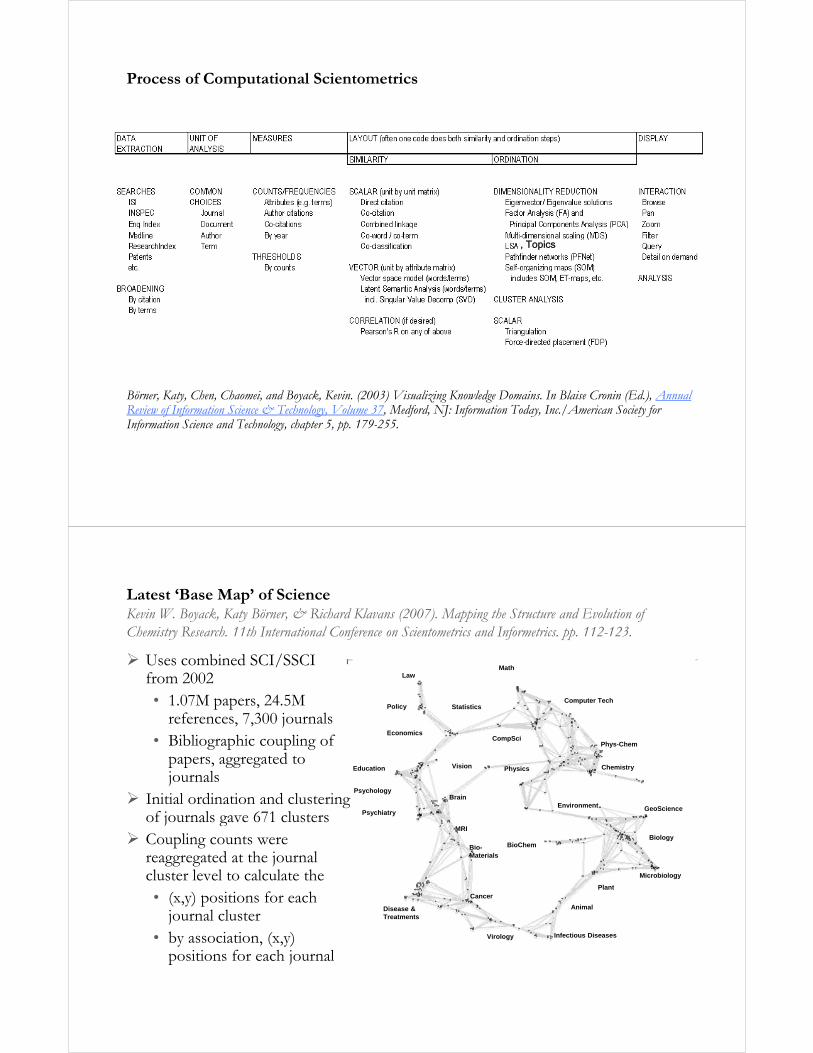
Process of Computational Scientometrics
, Topics
Börner, Katy, Chen, Chaomei, and Boyack, Kevin. (2003) Visualizing Knowledge Domains. In Blaise Cronin (Ed.), Annual Review of Information Science & Technology, Volume 37, Medford, NJ: Information Today, Inc./American Society for Information Science and Technology chapter 5 pp 179 255Information Science and Technology, chapter 5, pp. 179-255.
Latest ‘Base Map’ of ScienceKevin W. Boyack, Katy Börner, & Richard Klavans (2007). Mapping the Structure and Evolution of Ch i R h 11 h I i l C f S i i d I f i 112 123Chemistry Research. 11th International Conference on Scientometrics and Informetrics. pp. 112-123.
Uses combined SCI/SSCI from 2002
MathLaw
• 1.07M papers, 24.5M references, 7,300 journals
• Bibliographic coupling of p p r r t d t
Policy
Economics
Statistics
CompSciPhys-Chem
Computer Tech
papers, aggregated to journals
Initial ordination and clustering of journals gave 671 clusters
Physics
GeoScience
Brain
PsychiatryEnvironment
Vision Chemistry
Psychology
Education
of journals gave 671 clusters Coupling counts were
reaggregated at the journal cluster level to calculate the
Biology
Microbiology
BioChem
MRI
Bio-Materials
Pl t
• (x,y) positions for each journal cluster
• by association, (x,y) i i f h j l
Virology Infectious Diseases
Cancer
Disease &Treatments
Plant
Animal
positions for each journal
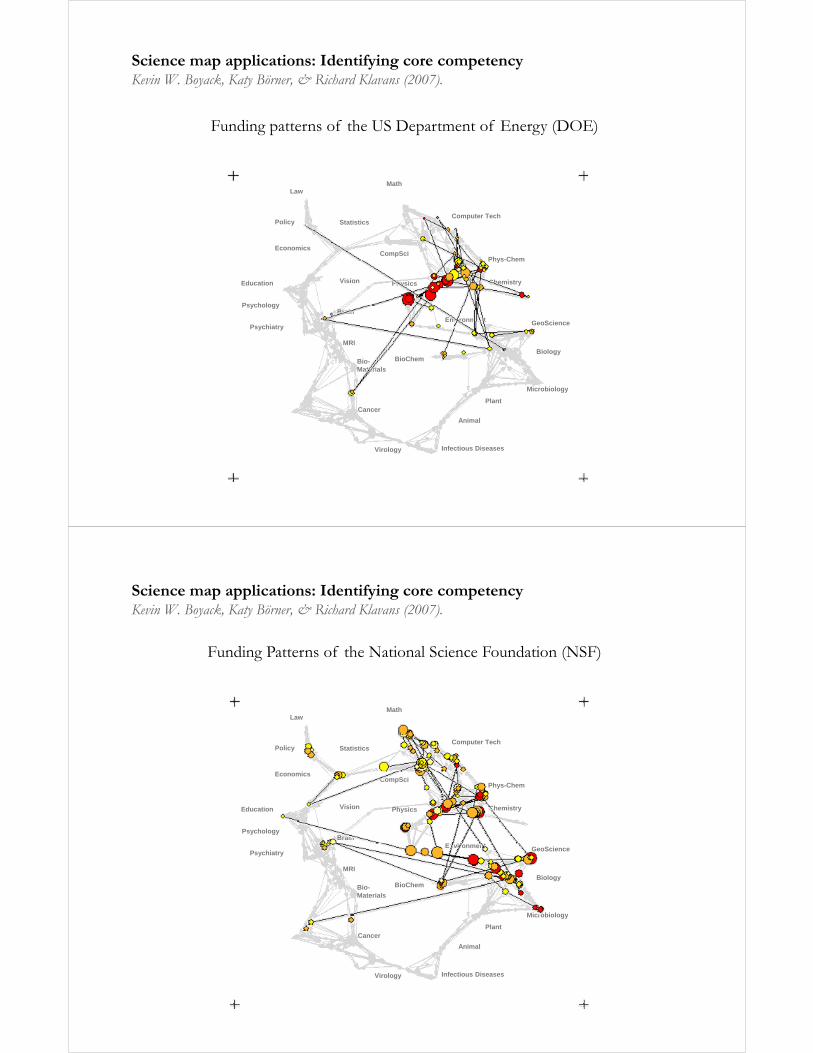
Science map applications: Identifying core competencyKevin W. Boyack, Katy Börner, & Richard Klavans (2007).
Funding patterns of the US Department of Energy (DOE)
Policy Statistics
MathLaw
Computer Tech
EconomicsCompSci
PhysicsVision
Phys-Chem
ChemistryEducation
Biology
GeoScience
BioChem
Brain
PsychiatryEnvironment
MRI
Bi
Psychology
GI
Microbiology
BioChem
Cancer
Bio-Materials
Plant
Animal
GI
Virology Infectious Diseases
Science map applications: Identifying core competencyKevin W. Boyack, Katy Börner, & Richard Klavans (2007).
Funding Patterns of the National Science Foundation (NSF)
Policy Statistics
MathLaw
Computer Tech
EconomicsCompSci
PhysicsVision
Phys-Chem
ChemistryEducation
Biology
GeoScience
BioChem
Brain
PsychiatryEnvironment
MRI
Bi
Psychology
GI
Microbiology
BioChem
Cancer
Bio-Materials
Plant
Animal
GI
Virology Infectious Diseases

Science map applications: Identifying core competencyKevin W. Boyack, Katy Börner, & Richard Klavans (2007).
Funding Patterns of the National Institutes of Health (NIH)
Policy Statistics
MathLaw
Computer Tech
EconomicsCompSci
PhysicsVision
Phys-Chem
ChemistryEducation
Biology
GeoScience
BioChem
Brain
PsychiatryEnvironment
MRI
Bi
Psychology
GI
Microbiology
BioChem
Cancer
Bio-Materials
Plant
Animal
GI
Virology Infectious Diseases
Sample Science StudiesSample Science StudiesSample Science StudiesSample Science Studies

Mapping the Evolution of Co-Authorship Networks Ke, Visvanath & Börner, (2004) Won 1st price at the IEEE InfoVis Contest.
11
12

Studying the Emerging Global Brain: Analyzing and Visualizing the Impact of Co-Authorship Teams Börner Dall’Asta Ke & Vespignani (2005) Complexity 10(4):58 67
Research question:
• Is science driven by prolific single experts
Börner, Dall Asta, Ke & Vespignani (2005) Complexity, 10(4):58-67.
s sc e ce d ve by p o c s g e e pe tsor by high-impact co-authorship teams?
Contributions:
• New approach to allocate citational credit.
• Novel weighted graph representation.
• Visualization of the growth of weighted co-author network.
• Centrality measures to identify author iimpact.
• Global statistical analysis of paper production and citations in correlation with co-authorship team size over timewith co authorship team size over time.
• Local, author-centered entropy measure.
13
113 Years of Physical Reviewhttp://scimaps.org/dev/map_detail.php?map_id=171Bruce W. Herr II and Russell Duhon (Data Mining & Visualization), Elisha F. Hardy (Graphic Design), Shashikant Penumarthy (Data Preparation) and Katy Börner (Concept)

Spatio-Temporal Information Production and Consumption of Major U.S. Research InstitutionsBörner, Katy, Penumarthy, Shashikant, Meiss, Mark and Ke, Weimao. (2006) M i h Diff i f S h l l K l d A M j U S R hMapping the Diffusion of Scholarly Knowledge Among Major U.S. Research Institutions. Scientometrics. 68(3), pp. 415-426.
Research questions:1 Does space still matter1. Does space still matter
in the Internet age? 2. Does one still have to
study and work at major research y jinstitutions in order to have access to high quality data and expertise and to produce high quality research?
3 D h I l d l b l i i3. Does the Internet lead to more global citation patterns, i.e., more citation links between papers produced at geographically distant research instructions?
Contributions: Answer to Qs 1 + 2 is YES. Answer to Qs 3 is NO. N l h l i h d l l f Novel approach to analyzing the dual role of
institutions as information producers and consumers and to study and visualize the diffusion of information among them.
Mapping Topic Bursts
Co-word space of the top 50 highly frequent and burstyfrequent and bursty words used in the top 10% most highly cited PNAShighly cited PNAS publications in 1982-2001.
Mane & Börner. (2004) PNAS, 101(Suppl. 1):5287-5290.
16

C R01 i i b d f di i h TTURC
Mapping Transdisciplinary Tobacco Use Research Centers PublicationsCompare R01 investigator based funding with TTURC Center awards in terms of number of publications and evolving co-author networks.Z & Bö f th iZoss & Börner, forthcoming.
Mapping Indiana’s Intellect al SpaceMapping Indiana’s Intellectual Space
Id ifIdentify
Pockets of innovation
Pathways from ideas to products
I l f i d d d i Interplay of industry and academia

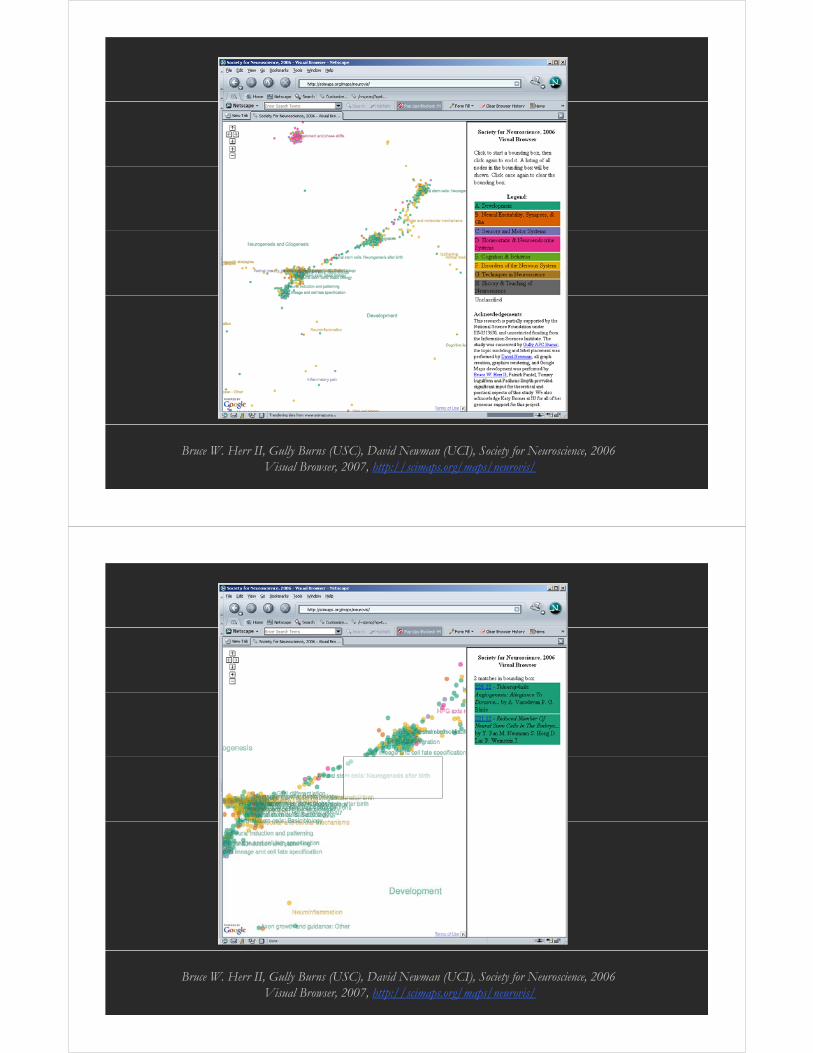
Bruce W. Herr II, Gully Burns (USC), David Newman (UCI), Society for Neuroscience, 2006 Visual Browser, 2007, http://scimaps.org/maps/neurovis/
Bruce W. Herr II, Gully Burns (USC), David Newman (UCI), Society for Neuroscience, 2006 Visual Browser, 2007, http://scimaps.org/maps/neurovis/
Bruce W. Herr II, Gully Burns (USC), David Newman (UCI), Society for Neuroscience, 2006 Visual Browser, 2007, http://scimaps.org/maps/neurovis/
Bruce W. Herr II, Gully Burns (USC), David Newman (UCI), Society for Neuroscience, 2006 Visual Browser, 2007, http://scimaps.org/maps/neurovis/

Bruce W. Herr II, Gully Burns (USC), David Newman (UCI), Society for Neuroscience, 2006 Visual Browser, 2007, http://scimaps.org/maps/neurovis/
Mapping Science ExhibitMapping Science ExhibitMapping Science ExhibitMapping Science Exhibit
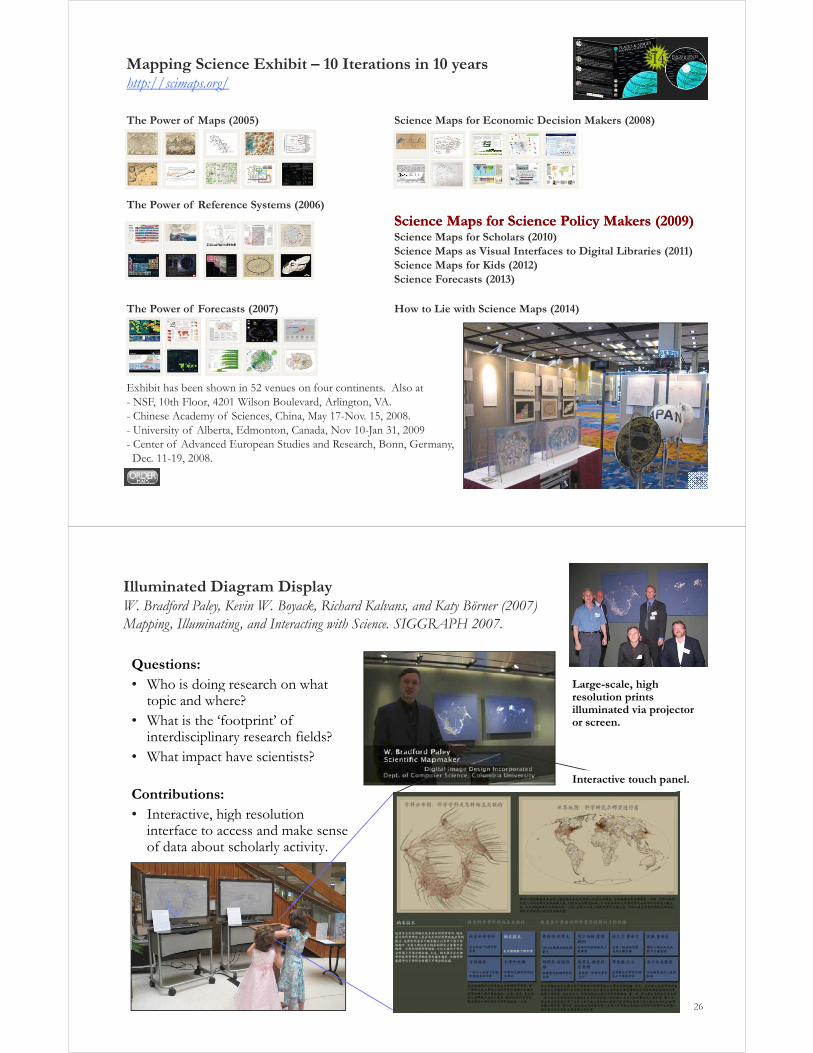
Mapping Science Exhibit – 10 Iterations in 10 yearshttp://scimaps.org/
The Power of Maps (2005) Science Maps for Economic Decision Makers (2008)
The Power of Reference Systems (2006)
Science Maps for Science Policy Makers (2009)Science Maps for Science Policy Makers (2009)Science Maps for Scholars (2010)Science Maps as Visual Interfaces to Digital Libraries (2011)Science Maps for Kids (2012)Science Forecasts (2013)
The Power of Forecasts (2007) How to Lie with Science Maps (2014)
Exhibit has been shown in 52 venues on four continents. Also at- NSF, 10th Floor, 4201 Wilson Boulevard, Arlington, VA.- Chinese Academy of Sciences, China, May 17-Nov. 15, 2008.- University of Alberta, Edmonton, Canada, Nov 10-Jan 31, 2009 - Center of Advanced European Studies and Research, Bonn, Germany, Dec. 11-19, 2008.
25
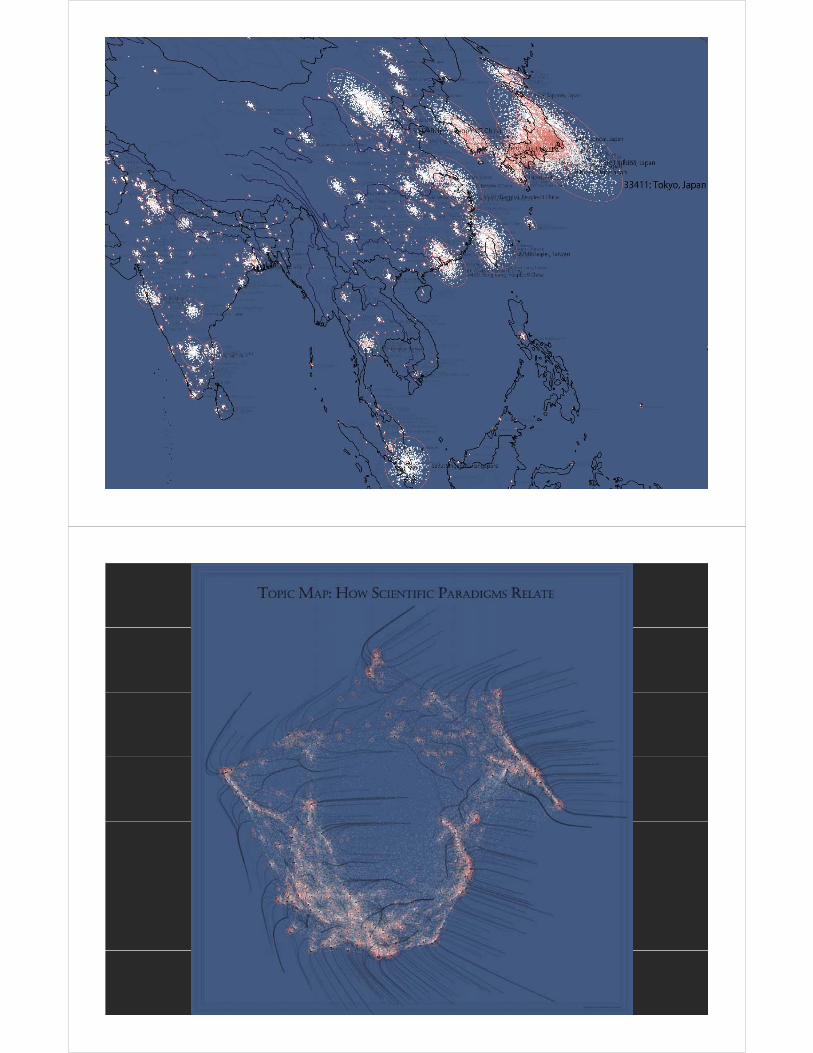
Illuminated Diagram DisplayW. Bradford Paley, Kevin W. Boyack, Richard Kalvans, and Katy Börner (2007) Mapping, Illuminating, and Interacting with Science. SIGGRAPH 2007.Mapping, Illuminating, and Interacting with Science. SIGGRAPH 2007.
Questions:• Who is doing research on what Large-scale, high g
topic and where?• What is the ‘footprint’ of
interdisciplinary research fields?• What impact have scientists?
resolution prints illuminated via projector or screen.
• What impact have scientists?
Contributions:• Interactive, high resolution
Interactive touch panel.
ginterface to access and make sense of data about scholarly activity.
26


Debut of 5th Iteration of Mapping Science Exhibit at MEDIA X on May 18, 2009 at Wallenberg Hall, Stanford Universityhttp://mediax.stanford.eduhttp://scaleindependentthought.typepad.com/photos/scimaps
36
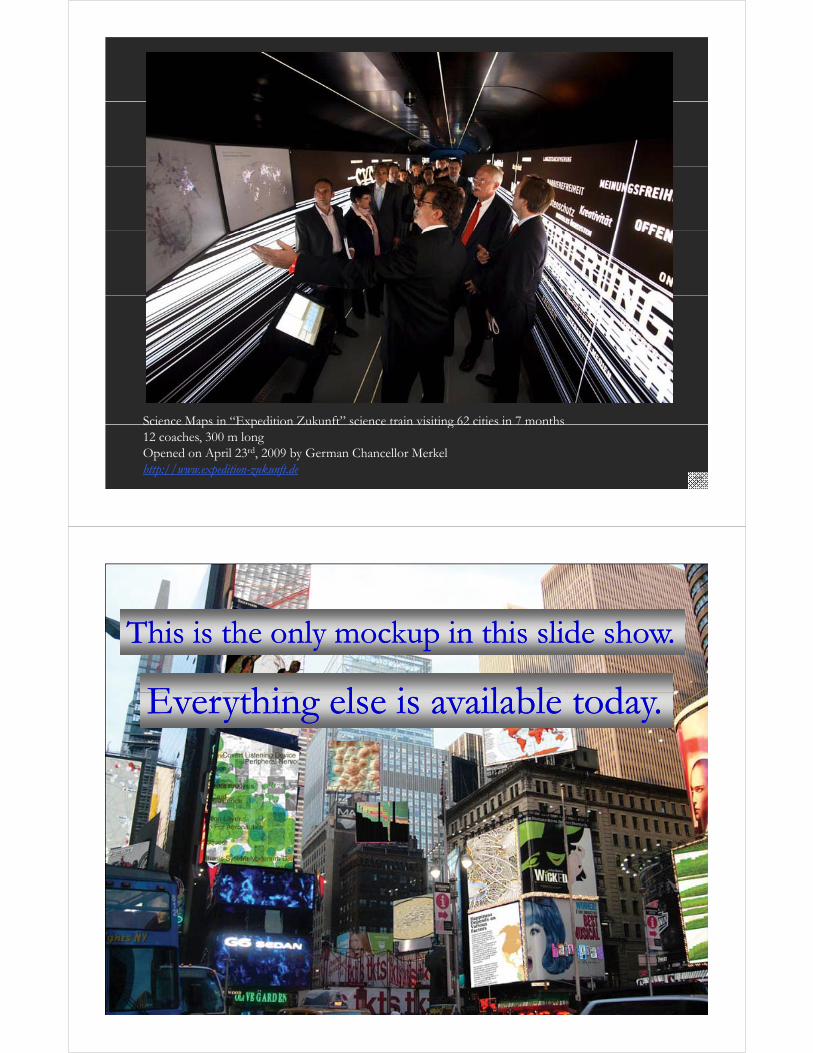
Science Maps in “Expedition Zukunft” science train visiting 62 cities in 7 monthsScience Maps in Expedition Zukunft science train visiting 62 cities in 7 months 12 coaches, 300 m longOpened on April 23rd, 2009 by German Chancellor Merkelhttp://www.expedition-zukunft.de
37
Thi i th l k i thi lid hThi i th l k i thi lid hThis is the only mockup in this slide show.This is the only mockup in this slide show.
E hi l i il bl dE hi l i il bl dEverything else is available today.Everything else is available today.
Katy Borner: Computational Scientometrics That Informs Science Policy 38

Science of Science CyberinfrastructureScience of Science CyberinfrastructureScience of Science CyberinfrastructureScience of Science Cyberinfrastructure
http://sci.slis.indiana.edu

Cyberinfrastructures for a Science of Science
Scholarly Database of 23 million scholarly records
https://sdb slis indiana eduhttps://sdb.slis.indiana.edu
Information Visualization Cyberinfrastructure
http://iv.slis.indiana.edu
Network Workbench Tool and Community Wiki
*NEW* Scientometrics plugins
http://nwb slis indiana eduhttp://nwb.slis.indiana.edu
Epidemics Cyberinfrastructure
http // pi li i di d /http://epic.slis.indiana.edu/
41
Scholarly Database: Web Interface
Search across publications, patents, grants.Download records and/or (evolving) co-author, paper-citation networks./ ( g) , p p
42Katy Börner: Mapping the Structure and Evolution of Science
Register for free access at http://sdb.slis.indiana.edu

Scholarly Database: # Records & Years Covered
Datasets available via the Scholarly Database
D #R d Y C d d R i dDataset #Records Years Coverage updated Restricted Access
Medline 16,053,495 1898-2008 Yes
PhysRev 398,005 1893-2006 Yes
PNAS 16,167 1997-2002 Yes
JCR 59,078 1974,1979,1984,19 Yes89,1994-2004
USPTO 3,710,952 1976-2007 Yes
NSF 174,835 1985-2003 Yes
NIH 1,043,804 1972-2002 Yes
Total 21,456,336 1893-2008 4 3
43Katy Börner: Mapping the Structure and Evolution of Science
Aim for comprehensive temporal, geospatial, and topic coverage.
Network Workbench (NWB) Project
Investigators: Katy Börner, Albert-Laszlo Barabasi, Santiago Schnell, Alessandro Vespignani & Stanley Wasserman, Eric Wernert
Software Team: Lead: Micah LinnemeierMembers: Patrick Phillips, Russell Duhon, Tim Kelley & Ann McCraniePrevious Developers: Weixia (Bonnie) Huang, Bruce Herr, Heng Zhang, Duygu Balcan, Bryan Hook, Ben Markines, Santo Fortunato, Felix Terkhorn, Ramya Sabbineni, Vivek S. Thakre & Cesar Hidalgo
Goal: Develop a large-scale network analysis, modeling and visualization toolkit for Go : Deve op a a ge sca e etwo a a ys s, ode g a d v sua at o too t ophysics, biomedical, and social science research.
Amount: $1,120,926, NSF IIS-0513650 awardDuration: Sept 2005 - Aug 2009
44Katy Börner: Mapping the Structure and Evolution of Science
Duration: Sept. 2005 - Aug. 2009
Website: http://nwb.slis.indiana.edu

Serving Non-CS Algorithm Developers & Users
Developers Users
CIShellIVC InterfaceCIShell Wizards
NWB Interface
45Katy Börner: Mapping the Structure and Evolution of Science
See https://nwb.slis.indiana.edu/community July 1st, 2008
46Katy Börner: Mapping the Structure and Evolution of Science

http://cns.slis.indiana.edu