maral cover & back
TRANSCRIPT

Annual Report 2006-2007
Setting Benchmarks

Having been built on solid, reliable foundations, the
LNJ Bhilwara Group has evolved beyond its rich
heritage, steeped in integrity, reliability, quality… and
most importantly, an innate ability for innovation.
This ethos has catapulted the Group onto a global
platform, having set several benchmarks along the
years, driven by a passion for excellence.
Today, the Group is driven selflessly by its dedicated
team, which constantly innovates to generate out-of-
the-box solutions, extrapolating the current market
scenarios and trends, to focus on the needs of
tomorrow.
The LNJ Bhilwara Group offers its customers, clients
and shareholders, an avalanche of success stories,
infused with perfection and practicality alike, each one
a new gem of superlative achievement.
L. N. JhunjhunwalaChairman - Emeritus
LNJ Bhilwara Group
A Passionfor Excellence

1
Maral Overseas Limited » Annual Report 2006-2007
Management Discussion & Analysis 3............................................................................................................................................................
Directors’ Report 5............................................................................................................................................................
Annexure to the Directors’ Report 7............................................................................................................................................................
Report on Corporate Governance 9............................................................................................................................................................
Shareholders’ Information 13............................................................................................................................................................
Auditors’ Report 15............................................................................................................................................................
Balance Sheet 18............................................................................................................................................................
Profit & Loss Account 19............................................................................................................................................................
Schedules 20............................................................................................................................................................
Balance Sheet Abstract 39............................................................................................................................................................
Cash Flow Statement 40............................................................................................................................................................
Financial Indicators & Statistics 42............................................................................................................................................................
CONTENTS
GROUP SALIENT FEATURES : 2006-07
GROUP FINANCIAL HIGHLIGHTS(Rs in crore)
• RSWM Limited is the new name for Rajasthan Spinning & Weaving
Mills Ltd.
• RSWM has initiated a Rs 900 crore expansion plan. Its Denim &
Captive Thermal Power Plants are nearing completion.
• RSWM, Maral Overseas and BSL Limited expand their spindle
capacities.
• RSWM was recently felicitated with Rajiv Gandhi National Quality
Award.
• RSWM announced the acquisition of Cheslind Textiles Ltd., a
Bangalore based textile unit.
• RSWM International B.V., Holland, incorporated, a 100% subsidiary
of RSWM, executes a 50:50 JV with SISA S.A., Spain. The new JV
entity is known as RSWM SISA.
• RSWM ropes in Salman Khan as brand ambassador for Mayur
Suitings.
• HEG’s 52,000 MT per annum, Graphite Electrode plant stabilised.
• HEG institutes LNJ Award for outstanding work in the field of Carbon.
• HEG initiated Rs 110 crore Capex during the year.
• Bhilwara Energy Limited incorporated as the Holding Company for
the Group’s power businesses.
• Bhilwara Energy Limited bags three Hydel Power projects in
Arunachal Pradesh.
• Bhilwara Energy formalises agreement with Punjab State Electricity
Board to develop and run a 75 MW power plant near Pathankot.
• MPCL becomes the first hydro power company in India to implement
ERP.
• Bhilwara Scribe ranked amongst the top 5 BPOs in the Healthcare
segment.
PARTICULARS 2004-2005 2005-2006 2006-2007............................................................................................................................................................
Turnover 2049 2387 2859...........................................................................................................................................................
Exports 893 1016 1361...........................................................................................................................................................
PBIDT 274 374 434...........................................................................................................................................................
PBDT 208 286 323...........................................................................................................................................................
PBT 96 156 193...........................................................................................................................................................
PAT 79 115 134...........................................................................................................................................................
Gross Fixed Assets 2494 2922 3835...........................................................................................................................................................
Net Worth 969 1382 1525...........................................................................................................................................................

2
BOARD OF DIRECTORS
L. N. Jhunjhunwala Chairman-Emeritus
Ravi Jhunjhunwala Chairman
Shekhar Agarwal Managing Director
D. N. Davar Director
Kamal Gupta Director
P. S. Dasgupta Director
KEY EXECUTIVES
• Corporate Office
R. K. Khandelwal President
• Sarovar Unit
R. K. Bhatnagar President
• Noida Unit
Anil Gandotra President
COMPANY SECRETARY
Rajat Prothi
AUDITORS
Doogar & Associates, New Delhi
Ashim & Associates, New Delhi
REGISTERED OFFICE
Maral Sarovar, V. & P.O. Khalbujurg,
Tehsil Kasrawad,
Distt. Khargone - 451 660 (M.P.)
CORPORATE OFFICE
Bhilwara Towers, A-12, Sector-1,
Noida - 201 301 (U.P.)
WORKS :
• Sarovar Unit
Maral Sarovar, V. & P.O. Khalbujurg,
Tehsil Kasrawad,
Distt. Khargone - 451 660 (M.P.)
• Noida Unit
A-11, Hosiery Complex, Phase - II (Extension),
Noida - 201 305 (U.P.)
BANKERS
Bank of Baroda
Canara Bank
Central Bank of India
Export-Import Bank of India
IndusInd Bank Limited
Industrial Development Bank of India Limited
State Bank of Bikaner & Jaipur
State Bank of Hyderabad
State Bank of India
State Bank of Indore
State Bank of Patiala
The Jammu & Kashmir Bank Limited
UTI Bank Limited
Yes Bank Limited
MARAL FINANCIAL HIGHLIGHTS(Rs in crore)
PARTICULARS 2004-2005 2005-2006 2006-2007............................................................................................................................................................
Net Turnover 248.64 245.23 289.92............................................................................................................................................................
Exports 185.53 181.79 231.51............................................................................................................................................................
Net Worth 79.38 86.20 61.93............................................................................................................................................................
Capital Expenditure 13.20 55.57 86.83............................................................................................................................................................
PBIDT 28.53 26.30 (2.86)............................................................................................................................................................
Interest 10.22 12.09 16.98............................................................................................................................................................
PBDT 18.31 14.21 (19.84)............................................................................................................................................................
Depreciation 18.25 16.46 17.02............................................................................................................................................................
Provision for Taxation (1.03) (2.74) (12.35)............................................................................................................................................................
PAT 1.09 0.49 (24.51)............................................................................................................................................................
EPS (Rs) 0.53 0.23 (11.26)............................................................................................................................................................
CEPS (Rs) 9.42 7.79 (3.44)............................................................................................................................................................
Book Value (Rs) 38.66 39.62 28.46............................................................................................................................................................

3
Maral Overseas Limited » Annual Report 2006-2007
Management Discussion and Analysis
The Textile Industry is a sunrise sector of the economy. India has a
dominant place in the global textile industry. It covers a wide range
of economic activities and thus has a significant role in the economy
of the country. Despite an obsolescence in the infrastructure, the textile
industry has shown remarkable progress in the last decade. India is
the world's second-largest producer of textiles and garments after
China, the third-largest producer of cotton (China is No. 1 and USA
is No. 2) and the second-largest consumer of cotton (China is No. 1).
At present, textiles contributes about 14% to industrial production,
4% to the Gross Domestic Product (GDP) and 17% to the country's
export earnings.
At present, India's textile sector is in the process of adapting itself to
the changes that are occurring in the global market. Dozens of Indian
textile firms are foraying into global markets for acquisition
opportunities that would bring them scale, technology and design
capabilities.
Customers now aggressively seek alternatives, compare offers and
hold out for the best option. Product portfolios have a shorter product
lifecycle and enjoy ever-growing levels of variety. The competition
for India's textile companies is becoming bigger and non-traditional.
Maral Overseas Limited (MOL) is fully geared up to meet global
challenges. The Company has undertaken capacity expansion to
ensure economies of scale and is focused on quality, prices, design,
adherence to delivery schedules, marketing skills, as well as cost-
efficient operations, to enhance the overall profitability of the
Company. It is in the process of increasing its presence across the
value-chain to capture more market share in USA and Europe.
Opportunities and Threats
Prospects for the textile industry appear healthy, provided that it
continues to modernise. This suggests that, with appropriate scale,
investment and technology, it can achieve rapid industrial growth.
To achieve growth, the Company is in the process of installing a
coal-based power generating plant and expanding its spinning
capacity, the efforts for which are progressing as per schedule.
In the post-quota regime, sales are affected as a result of abrupt shifts
in market conditions and volatile consumer behaviour. The
competition is based on price, quality, service and design. The
Company emphasises the need for cost-consciousness, consistent
quality and reliable service to customers, in order to meet challenges
and maintain a leadership position. The Company is in the process of
basing itself competitively on the certainty of implementation of the
declared capabilities, and increasing its presence in the value chain,
through systematic innovation and much higher levels of service based
activities.
The Company is flexible in its production process and has a long
operating experience in major markets like USA and the European
Union, and is fully equipped to meet global challenges.
Businesses
MOL is a leading manufacturer of cotton yarn, knitted fabric (both
grey and processed) and textile garments. It is one of the leading
exporters of cotton yarn from India and has a commanding position
in knitted fabrics and textile garments in domestic as well as
international markets.
The Company consolidated its position in cotton yarn during the year,
through a constant process of evaluation, and subsequent upgradation
and modernisation of integrated processes. During the year under
review, the Company recorded a turnover of Rs 289.92 crore, as
against Rs 245.23 crore in the previous year.
The Company is now focusing on value-addition and controlling costs
to increase margins, in order to be competitive and survive in global
markets. The Thermal Power Project, which is currently under
implementation, is expected to reduce power costs.
The Company's exports (FOB value) were to the tune of Rs 205.76
crore, against Rs 177.71 crore last year. The share of exports accounted
for 70.97% of MOL's revenues.
The yarn business accounts for 46.42% of its revenues, while
knitted fabric and textile made-ups business accounts for 14.60%
and 38.98%, respectively.
Maral was certified for ISO-9001:2000 by SGS for another three years,
from 2006 to 2009. This vindicates the commitment of the Company
on providing top quality that meets customers' expectations.
The costs at the Jammu unit had been increasing to unsustainable
levels, seriously impacting the bottom line of the Company. In order
to cut down costs, the Company closed down its Jammu unit, after
obtaining all necessary approvals.
Yarn Business
The Company expects that demand for fabric and yarn will increase
in the months to come, as exports of textiles and apparel from the
country should rise. This will eventually result in a higher demand
for yarn. The Company offers to its customers the finest quality of
yarn, which commands a premium in global markets, and an increased
demand for Indian yarn and fabric in the months to come would be
beneficial to the Company.
The yarn dyeing facility of 1000 MT per annum installed last year has
helped to increase the production capacity. The performance of the
yarn business was good during the year and it contributed more than
46% towards the turnover of the Company.
Knitted Fabric Business
The performance of the fabric business remained satisfactory during
the year. This business contributed Rs 93.53 crore towards the turnover
of the Company, out of which Rs 1.40 crore was the share of knitted
fabric and Rs 92.13 crore accrued from processed fabric.
Textile made-up Business / Garments
The units of Maral located at Sarovar and Noida are engaged in
manufacturing and exporting garments and textile made-ups. These
units manufacture global quality garments and textile made-ups. The
highly reputed international customer base of Maral demands quality,
which the Company has succeeded in providing, thereby helping it
in making its mark in the highly fashion-conscious markets across the
world. During the year, the Company exported 60.52 lac pieces of
made-ups.

4
The Company is looking at producing higher value-added products,
and is also making its presence felt in new markets, in order to achieve
substantial growth in this business.
Risk Management
Market Risk
Two and a half years into the quota-free regime, MOL operates in a
highly-competitive global environment. In recent months, the market
share of the Indian textile and clothing industry has been affected by
the rally in the value of the rupee. The rise in the value of the rupee
has eroded the competitiveness of the Indian textile industry, vis-a-
vis its major competitors, like Sri Lanka, Bangladesh, China and
Indonesia. Exports have started showing negative trends, as the country
is able to produce volumes and high quality, but is not competitive
in price terms that hamper its progress in the global market.
The Government, it is expected, will take action to arrest the rising
value of the rupee, to ensure that the textile industry remains
competitive and to boost the country's position in global textile
industry.
MOL is embarking upon various strategies to combat and minimise
these risks. The Company has undertaken expansion of the Company's
spinning capacity by 19200 spindles, at a cost of about Rs 60 crore.
This project is at an advanced stage of implementation and the
Company is expected to reap the full commercial benefits of the same
in the current financial year.
The Company is also focusing on value-addition to increase its
margins. The Company is also exploring untapped destinations to
increase its volume of exports, and is moving beyond the traditional
markets of exports.
Currency Risk
MOL, due to its higher content of exports, has considerable exposure
in foreign currency. The new currency regime that RBI is following,
has led to difficulty for Maral, as the level of the rupee / US dollar has
shifted from Rs 45 to Rs 40 per dollar, and the volatility of the exchange
rate has gone up. The new currency regime represents a qualitative
change from an RBI-controlled rate, to a market-determined exchange
rate. MOL due to its higher content of exports, may get affected due
to this upsurge in volatility.
Sometimes a currency risk is beneficial, however, Maral has in place
a well-documented and established foreign exchange risk policy,
which is reviewed by the Audit Committee on a regular basis to face
all types of risks, in view of the changing scenario of the forex market,
and currency risks are hedged accordingly.
Internal Control Systems and their adequacy
The Company has a proper and adequate system of internal controls
and policies in all its sphere of activities. The Internal controls are
supplemented by regular Internal Audit of all the units of the Company,
which helps in improving efficiency. The Company's Internal Control
Systems ensure effective monitoring of operations to make sure that
there is maximum utilisation of resources, and that all assets are
safeguarded and protected against loss from unauthorised use and
dispositions, and that all transactions are authorised, recorded and
reported diligently. The Audit Committee and the Management review
the reports of the Internal Auditors regularly, who then bring out the
deviations to the notice of the Audit Committee and recommend
suitable steps to implement their recommendations.
Human Resources
MOL continued building sustainable competitive advantage through
its human resources. Your Company facilitated learning and
development processes in a focused manner during the year. Special
emphasis was laid on IT-related training and upgrading the functional
knowledge and skills of employees. Your Company believes that the
competence and commitment of its people is the key in a competitive
world. The dedicated services tendered by the employees at all levels
resulted in significant enhancement in quality and productivity.
The total strength of MOL as at the end of the financial year 2006-07,
was 2630 employees.
Corporate Social Responsibility
Corporate Social Responsibility (CSR) is crucial in today's business
environment. MOL takes the concept of CSR very seriously. Maral
has a long tradition of community service and a strong sense of
Corporate Social Responsibility. The focus of Maral is to improve the
quality of life of the work force, the local community and society at
large. MOL has helped to build several schools, and in the area of
healthcare, it regularly conducts health education programmes and
health camps that educate people on various diseases and other health-
related issues. Maral works closely with the Government, NGOs and
charitable institutions to build a stronger community.
Cautionary Statement
Certain statements in this Management Discussion and Analysis
describing the Company's objectives, projections, estimates and
expectations may be 'forward-looking statements' within the meaning
of applicable laws and regulations. Forward-looking statements are
identified in this report, by using the words 'anticipates', 'believes',
'expects', 'intends' and similar expressions in such statements.
Although we believe our expectations are based on reasonable
assumptions, these forward-looking statements may be influenced by
numerous risks and uncertainties that could cause actual outcomes
and results to be materially different from those expressed or implied.
Some of these risks and uncertainties have been discussed in the
Section on 'Risk Management'. The Company takes no responsibility
for any consequence of decisions made based on such statements,
and holds no obligation to update these in the future.

5
Maral Overseas Limited » Annual Report 2006-2007
DIRECTORS’ REPORT
Your Directors have pleasure in presenting the Eighteenth Annual
Report of the Company and the audited financial statements for the
year ended 31st March, 2007.
Financial Results
(Rs in crore)
Current Previous
Year Year
Net Turnover 289.92 245.23.....................................................................................................................
Profit from continuing operations 4.37 1.11.....................................................................................................................
Less: Taxation 1.17 (1.58).....................................................................................................................
Profit from continuing
operations after Tax 3.20 2.69.....................................................................................................................
Loss from discontinuing
operations (net of Tax) (13.02) (2.20).....................................................................................................................
Termination costs (net of Tax) (14.69) –.....................................................................................................................
Profit / (Loss) after Tax (24.51) 0.49.....................................................................................................................
Add: Balance brought forwardfrom previous year (15.03) (15.52).....................................................................................................................
Balance carried to Balance Sheet (39.54) (15.03).....................................................................................................................
Operations
During the period under review, the operations of the Company
suffered set back mainly due to discontinuance of operations at theJammu Unit of the Company, which continued to remain economically
unviable and eventually leading to its closure. Simultaneously the
power and fuel cost increased substantially due to high petroleum
product prices. Financial cost also increased due to hardening of
interest rates as well as payment under Voluntary Retirement Scheme
and terminal benefits of the employees of Jammu Unit.
During the year, your Company has been able to achieve a production
of 11748 (11787 MT) of cotton yarn, 657 (164 MT) of dyed yarn,3041 (2849 MT) of knitted fabric, 2859 (2951 MT) of processed fabric
and 60.52 (67.62 lac) pieces of textile made-ups.
Your Directors are hopeful that with the amicable settlement at the
Jammu Unit and with the focus on increasing efficiency, stricter quality
control, the Company will be on growth track once again in the
coming years.
Dividend
Your Directors are unable to recommend any Dividend on the Equity
Shares in view of the financial position of the Company.
Industry Scenario
The opportunities in the world market have opened for the cost
efficient entities in the last couple of years since the removal of
quantitative restrictions. At present developed countries are
outsourcing their textile & clothing requirement to developing
countries, in view of the cost advantage. Consequently, spinning
capacity in USA is down by about 18% and import of cotton products
in USA up by about 6.3%. Resultantly the market share from SAARC& Asian Countries is increasing in USA. In this scenario, China
followed by India has been the front-runner in the race and hence are
the key beneficiaries.
Your Directors recognizing these opportunities had taken initiatives
and undertaken capacity expansion in the previous year to bring
economies of scale as well as cost efficient operations for enhancing
the overall profitability of the Company. Your Company is focussingon increasing its presence in value added segment to capture higher
market share of USA and Europe.
Expansion cum Modernisation
Your Directors in the last Annual Report had informed about the
installation of yarn dyeing facility of 1000 MT per annum and the
expansion of fabric knitting and processing capacities by 240 MT
and 390 MT. Your Directors are pleased to state that the operationsin the new projects installed last year have stabilized.
Your Directors in the last Annual Report had also stated about theexpansion of the Company's spinning capacity by 19200 spindles
and the installation of a 10 MW Coal Thermal Power Plant at an
aggregate cost of Rs 100 crore. Both of them are at an advanced
stage of implementation and the Company is expected to reap the
full commercial benefits of these projects in the current financial year.
Closure of Jammu unit of the Company
During the period under review, the Jammu Unit of the Companywhich had become economically unviable was closed after,
completion of a Voluntary Retirement Scheme and obtaining all
necessary approvals.
Voluntary Delisting of Equity Shares
The Company has applied for voluntary delisting of its Equity Shares
from The Calcutta Stock Exchange Association Limited, whose
response to the application made by the Company, is awaited.
Directors
Mr. D.N. Davar and Dr. Kamal Gupta, Directors, retire by rotation
and being eligible, offer themselves for reappointment.
Auditors
M/s. Doogar & Associates and M/s. Ashim & Associates, Chartered
Accountants, Auditors of the Company, retire at the conclusion of
the ensuing Annual General Meeting of the Company, and are eligible
for re-appointment.
The observations of the Auditors are explained wherever necessary,
in the appropriate notes to the accounts.
Internal Control Systems
The Company has in place adequate systems of internal control and
documented procedures covering all financial and operating functions.
The Operational Management and Audit Committee review and
ensure that the Internal Control System effectively operates in the
organization. All organizational activities are subject to internal
controls. In order to provide reasonable assurance of the Internal

6
Control System, the Audit Committee recommends to the Board any
changes in the system of Internal Controls, procedures and practices
which the Audit Committee determines to be appropriate.
Particulars of Employees
Particulars of Employees as required to be furnished pursuant to
Section 217(2A) of Companies Act, 1956 read with Companies
(Particulars of Employees) Rules, 1975 are attached hereto and form
part of the Report as Annexure - I.
Directors' Responsibility Statement
Pursuant to Section 217(2AA) of the Companies Act, 1956, theDirectors state that:
– in the preparation of the annual accounts, the applicableaccounting standards have been followed;
– appropriate accounting policies have been selected and appliedconsistently and they have made judgements and estimates that
are reasonable and prudent, so as to give a true and fair view of
the state of affairs of the Company on 31st March, 2007, and of
the profit or loss of the Company for the year ended on that date;
– proper and sufficient care has been taken for the maintenance of
adequate accounting records in accordance with the provisions
of the Companies Act, 1956, for safeguarding the assets of the
Company and for preventing and detecting fraud and otherirregularities;
– the Annual Accounts have been prepared on a going concern
basis.
Energy Conservation, Technology Absorption and Foreign Exchange
Earnings and Outgo
The particulars relating to conservation of Energy, Technology
Absorption and Foreign Exchange Earnings and Outgo as required
under Section 217(1)(e) of the Companies Act, 1956, read with
Companies (Disclosure of Particulars in the Report of Board of
Directors) Rules, 1988, are given as per Annexure-II to the Directors'Report.
Acknowledgements
Your Directors take this opportunity to express their appreciation for
the assistance and continued support of the Customers, Suppliers,
Bankers, Financial Institutions, Central and State Governments and
Shareholders. The Directors also acknowledge the dedicated service
rendered by the Employees of the Company at all levels in helpingthe Company to achieve greater levels of growth.
for and on behalf of the Board
Noida (U.P.) Ravi Jhunjhunwala
5th May, 2007 Chairman

7
Maral Overseas Limited » Annual Report 2006-2007
ANNEXURE - II TO DIRECTORS’ REPORTStatement of particulars pursuant to Companies (Disclosure of Particulars in the Report of Board of Directors) Rules, 1988.
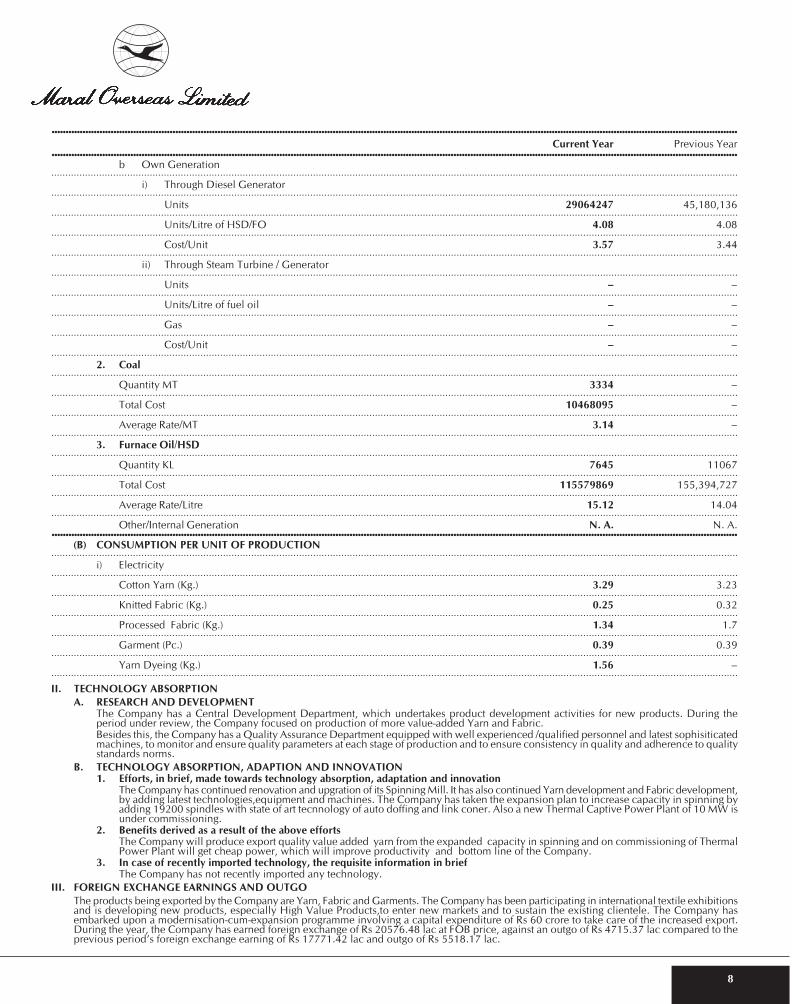
I. CONSERVATION OF ENERGY(a) Energy conservation measures taken:
1. Fixing of ERP fans in Humidity Plant.2. Installation of inverters on H-Plants Pumps & Fans.3. Reduction of light intensity in non-productive region.4. Replacement of conventional ballast with electronic ballast.5. Recycling of machine cooling water from dye house.6. Heat utilisation from effluent.7. Saving in TFO power consumption by star conversion of three motors.8. Installation of energy efficient compressed air system.9. Utilisation of waste heat from Effluent (use of hot water in Yarn dyeing & Fab dyeing).10. Saving by using coal fired boiler & Theropac.11. Hot water supply system for Fabric Dyeing.
(b) Additional Investment & proposals, if any, being implemented for reduction of consumption of energy :1. Replacement of old motor with energy-efficient motors.2. Installation of energy-efficient Air Compressor.3. Conversion of Electric heating system to Steam heating.4. Utilisation of waste heat for hot water generation.5. Replacement of H-Plant pumps with energy efficient pumps.6. Energy efficient hydro-pnumatic pressure boosting system for constant water supply pressure for process house.7. Replacement of centrifugal pumps with submersible pump for treated effluent handling to horticulture.8. Use of submerdible pump in place of monoblock pump at Narmada water supply station.9. Replacement of rewined moters with energy efficient moters.10. Installation of ved for humidification plant pumps.11. 10 MW Coal loated Thermal Power Plant.
(c) Impact of the measures at (a) & (b) for reduction of energy consumption and consequent impact on the cost of production of goods.The estimated saving on account of the above measures are expected to be about 1.50 lac units per month.
INFORMATION AS PRESCRIBED IN FORM A
(A) POWER AND FUEL CONSUMPTION....................................................................................................................................................................................................................................................
1. Electricity Current Year Previous Year....................................................................................................................................................................................................................................................
a. Purchased....................................................................................................................................................................................................................................................
Units 1,88,07,275 1,925,187....................................................................................................................................................................................................................................................
Total amount (Rs) 7,96,31,226 4,842,720....................................................................................................................................................................................................................................................
Rate / Unit (Rs) 4.23 2.52....................................................................................................................................................................................................................................................
ANNEXURE - I TO DIRECTORS’ REPORT
Statement of Particulars of Employees pursuant to the provisions of Section 217(2A) of the Companies Act, 1956 and the Companies
(Particulars of Employees) Rules, 1975.
Sl. Name Age Designation/Date Remuneration Qualification Experience Last Employment Held
No. (Years) of commencement (Rs) (Years) Organisation Position Duration
of Employment Held (Years)
A. PERSONS EMPLOYED THROUGHOUT THE FINANCIAL YEAR
1. Mr. Shekhar Agarwal 54 Managing Director 30,48,000 B. Tech. (ME), 25 Shashi Commercial Ltd. Chief Executive 2.501.01.1991 M. Sc. (Chicago)
2. Mr. R. K. Khandelwal 51 President 33,80,530 B. Com, LLB, 27 RSWM Ltd. President 407.08.2003 FCA
B. PERSONS EMPLOYED FOR PART OF THE FINANCIAL YEAR
1. Mr. R. K. Bhatnagar 57 President 6,89,419 B. Tech. 35 Ginni International Ltd. CEO 501.11.2006
2. Mr. H. S. Jha 47 Vice President-HRM 8,17,345 M. Phil, MBA 22 Bajaj Hindustan Ltd. Group GM 105.02.2007
Note: Mr. Shekhar Agarwal, Managing Director is a relative of Mr. L. N. Jhunjhunwala, Chairman Emeritus and Mr. Ravi Jhunjhunwala, Chairman.
8
b Own Generation....................................................................................................................................................................................................................................................
i) Through Diesel Generator....................................................................................................................................................................................................................................................
Units 29064247 45,180,136....................................................................................................................................................................................................................................................
Units/Litre of HSD/FO 4.08 4.08....................................................................................................................................................................................................................................................
Cost/Unit 3.57 3.44....................................................................................................................................................................................................................................................
ii) Through Steam Turbine / Generator....................................................................................................................................................................................................................................................
Units – –....................................................................................................................................................................................................................................................
Units/Litre of fuel oil – –....................................................................................................................................................................................................................................................
Gas – –....................................................................................................................................................................................................................................................
Cost/Unit – –....................................................................................................................................................................................................................................................
2. Coal....................................................................................................................................................................................................................................................
Quantity MT 3334 –....................................................................................................................................................................................................................................................
Total Cost 10468095 –....................................................................................................................................................................................................................................................
Average Rate/MT 3.14 –....................................................................................................................................................................................................................................................
3. Furnace Oil/HSD....................................................................................................................................................................................................................................................
Quantity KL 7645 11067....................................................................................................................................................................................................................................................
Total Cost 115579869 155,394,727....................................................................................................................................................................................................................................................
Average Rate/Litre 15.12 14.04....................................................................................................................................................................................................................................................
Other/Internal Generation N. A. N. A.....................................................................................................................................................................................................................................................
(B) CONSUMPTION PER UNIT OF PRODUCTION....................................................................................................................................................................................................................................................
i) Electricity....................................................................................................................................................................................................................................................
Cotton Yarn (Kg.) 3.29 3.23....................................................................................................................................................................................................................................................
Knitted Fabric (Kg.) 0.25 0.32....................................................................................................................................................................................................................................................
Processed Fabric (Kg.) 1.34 1.7....................................................................................................................................................................................................................................................
Garment (Pc.) 0.39 0.39....................................................................................................................................................................................................................................................
Yarn Dyeing (Kg.) 1.56 –....................................................................................................................................................................................................................................................
II. TECHNOLOGY ABSORPTION
A. RESEARCH AND DEVELOPMENTThe Company has a Central Development Department, which undertakes product development activities for new products. During theperiod under review, the Company focused on production of more value-added Yarn and Fabric.Besides this, the Company has a Quality Assurance Department equipped with well experienced /qualified personnel and latest sophisiticatedmachines, to monitor and ensure quality parameters at each stage of production and to ensure consistency in quality and adherence to qualitystandards norms.
B. TECHNOLOGY ABSORPTION, ADAPTION AND INNOVATION1. Efforts, in brief, made towards technology absorption, adaptation and innovation
The Company has continued renovation and upgration of its Spinning Mill. It has also continued Yarn development and Fabric development,by adding latest technologies,equipment and machines. The Company has taken the expansion plan to increase capacity in spinning byadding 19200 spindles with state of art tecnnology of auto doffing and link coner. Also a new Thermal Captive Power Plant of 10 MW isunder commissioning.
2. Benefits derived as a result of the above effortsThe Company will produce export quality value added yarn from the expanded capacity in spinning and on commissioning of ThermalPower Plant will get cheap power, which will improve productivity and bottom line of the Company.
3. In case of recently imported technology, the requisite information in briefThe Company has not recently imported any technology.
III. FOREIGN EXCHANGE EARNINGS AND OUTGO
The products being exported by the Company are Yarn, Fabric and Garments. The Company has been participating in international textile exhibitionsand is developing new products, especially High Value Products,to enter new markets and to sustain the existing clientele. The Company hasembarked upon a modernisation-cum-expansion programme involving a capital expenditure of Rs 60 crore to take care of the increased export.During the year, the Company has earned foreign exchange of Rs 20576.48 lac at FOB price, against an outgo of Rs 4715.37 lac compared to theprevious period’s foreign exchange earning of Rs 17771.42 lac and outgo of Rs 5518.17 lac.
....................................................................................................................................................................................................................................................
Current Year Previous Year....................................................................................................................................................................................................................................................

9
Maral Overseas Limited » Annual Report 2006-2007
CORPORATE GOVERNANCE REPORT
1. Company’s Philosophy on Corporate Governance
The Company has consistently been following high level of Corporate Governance. The Company believes in promoting corporate
fairness, transparency and accountability. It fundamentally believes that good Corporate Governance should be an internally driven
need and is not to be looked upon as an issue of compliance dictated by statutory/ regulatory requirements. The Company's guiding
principles are focused on attaining the highest standards of Corporate Governance and the business operations of the Company areconducted in such a manner so as not to benefit any particular interest group, but for the benefit of all the stakeholders.
2. Board of Directors
The present strength of the Board is Six Directors, comprising of the Chairman Emeritus, Chairman, Managing Director and three
Independent Directors. The Chairman Emeritus, Chairman and the Managing Director are Promoter Directors. The Managing Director
is Executive and all the other Directors are Non-Executive. All the three Independent Directors are professionals and have expertise intheir respective functional areas.
The Composition of the Board, their attendance at the Board Meetings held during the year, alongwith the number of Directorships,
Memberships held in various Committees in other Companies as on 31st March, 2007, are given below:
No. of Meetings No. of other Directorships and
Committee Membership/Chairmanship#
Sl. Held Attended Directorships* Committee Committee
No. Name Title Category Memberships Chairmanships
1. Mr. L. N. Jhunjhunwala Chairman Emeritus Promoter - Non-Executive 6 4 7 1 –
2. Mr. Ravi Jhunjhunwala Chairman Promoter - Non-Executive 6 5 9 4 2
3. Mr. Shekhar Agarwal Managing Director Promoter - Executive 6 6 7 3 1
4. Dr. Kamal Gupta Director Independent - Non-Executive 6 5 5 7 2
5. Mr. P.S. Dasgupta Director Independent - Non-Executive 6 6 5 5 –
6. Mr. D. N. Davar Director Independent - Non-Executive 6 6 14 8 5
Notes : * Excludes Directorships held in Private limited Companies# Includes Audit and Shareholders’ / Investors’ Grievance Committees only
The Board of Directors meets regularly throughout the year. During the financial year 2006-2007, the Board of Directors met six timeson the 25th April, 2006, the 23rd May, 2006, the 28th July, 2006, the 27th October, 2006, the 30th October, 2006 and the 30th January,
2007.
The previous Annual General Meeting of the Company was held on the 28th September, 2006 and was attended by Dr. Kamal Gupta,
Director and Chairman of the Audit Committee of the Company. None of the Directors is a member of more than ten Board levelCommittees or Chairman of more than five such Committees.
3. Audit Committee
The Audit Committee of members of the Board comprises of following Four Directors as on the 31st March, 2007:
1) Mr. L. N. Jhunjhunwala
2) Dr. Kamal Gupta
3) Mr. P. S. Dasgupta
4) Mr. D. N. Davar
All the members of the Audit Committee are Non-Executive Directors. Mr. L. N. Jhunjhunwala, Chairman Emeritus is a Promoter
Director. The other Directors are Independent Directors with Dr. Kamal Gupta being the Chairman of the Audit Committee.
Dr. Kamal Gupta, Chairman of the Audit Committee, possesses high degree of accounting and financial management expertise and all
members of the Committee have sound accounting and financial knowledge.
Mr. Rajat Prothi, Company Secretary is the Secretary to the Committee. Invitees to the Audit Committee include the Chief Financial
Officer, Chief Coordinator- Internal Audit and the representative of the Statutory Auditors, Internal Auditors and Cost Auditors.
The functions of the Audit Committee include the following:
• Oversight of the Company’s financial reporting process and the disclosure of its financial information to ensure that the financial
statements are correct, sufficient and credible.
• Recommending to the Board, the appointment, re-appointment and, if required, the replacement or removal of the statutory
auditor and the fixation of audit fees.
• Approval of payment to statutory auditors for any other services rendered by them.

10
• Reviewing, with the management, the annual financial statements before submission to the Board for approval, with particular
reference to:
• Matters required to be included in the Director’s Responsibility Statement to be included in the Board’s report in terms of
clause (2AA) of Section 217 of the Companies Act, 1956.
• Changes, if any, in accounting policies and practices and reasons for the same.
• Major accounting entries involving estimates based on the exercise of judgment by management.
• Significant adjustments made in the financial statements arising out of audit findings.
• Compliance with listing and other legal requirements relating to financial statements.
• Disclosure of any related party transactions.
• Qualifications in the draft audit report.
• Reviewing, with the management, the quarterly financial statements before submission to the Board for approval.
• Reviewing, with the management, performance of statutory and internal auditors and adequacy of the internal control systems.
• Reviewing the adequacy of internal audit function, if any, including the structure of the internal audit department, staffing and
seniority of the official heading the department, reporting structure coverage and frequency of internal audit.
• Discussion with internal auditors any significant findings and follow up there on.
• Reviewing the findings of any internal investigations by the internal auditors into matters where there is suspected fraud or irregularity
or a failure of internal control systems of a material nature and reporting the matter to the Board.
• Discussion with statutory auditors before the audit commences, about the nature and scope of audit as well as post-audit discussion
to ascertain any area of concern.
• To look into the reasons for substantial defaults in the payment to the depositors, debenture holders, shareholders (in case of non
payment of declared dividends) and creditors.
• Carrying out any other function as is mentioned in the terms of reference of the Audit Committee.
MOL has systems and procedures in place to ensure that the Audit Committee mandatorily reviews:
• Management discussion and analysis of financial condition and results of operations.
• Statement of significant related party transactions (as defined by the Audit Committee), submitted by management.
• Management letters / letters of internal control weaknesses issued by the statutory auditors.
• Internal audit reports relating to internal control weaknesses.
• The appointment, removal and terms of remuneration of the Chief internal auditor shall be subject to review by the Audit Committee.
• Whenever applicable, the uses/applications of funds raised through public issues, rights issues, preferential issues by major category
(capital expenditure, sales and marketing, working capital, etc), as part of the quarterly declaration of financial results.
• If applicable, on an annual basis, statement certified by the statutory auditors, detailing the use of funds raised through public
issues, rights issues, preferential issues for purposes other than those stated in the offer document/prospectus/notice.
With regard to information on related party transactions, whenever applicable, the Audit Committee is presented with the following
information:
• A statement in summary form of transactions with related parties in the ordinary course of business.
• Details of material individual transactions with related parties which are not in the normal course of business.
• Details of material individual transactions with related parties or others, which are not on an arm’s length basis along with
management’s justification for the same.
Pursuant to its terms of reference, the Audit Committee is empowered to:
• Investigate any activity within its terms of reference and to seek any information it requires from any employee.
• Obtain legal or other independent professional advice and to secure the attendance of outsiders with relevant experience and
expertise, when considered necessary.
The Audit Committee of the Company met four times during the financial year 2006-2007. The meetings were held on the 25th April,
2006, the 28th July, 2006, the 27th October, 2006 and the 30th January, 2007. The attendance of the Committee members at these
meetings was as follows:
Name of the Member No. of Meetings Attended
Mr. L. N. Jhunjhunwala 3
Dr. Kamal Gupta 3
Mr. P.S. Dasgupta 4
Mr. D. N. Davar 4

11
Maral Overseas Limited » Annual Report 2006-2007
4. Remuneration Committee
The Remuneration Committee comprised of following Three Non-Executive Independent Directors as on the 31st March, 2007:
1) Dr. Kamal Gupta
2) Mr. D. N. Davar
3) Mr. P. S. Dasgupta
Dr. Kamal Gupta is the Chairman of this Committee. The composition of the Remuneration Committee remained unchanged during the
year. In the financial year 2006-2007, no meeting of the Remuneration Committee was required to be held.
The Remuneration Committee considers, approves and recommends to the Board the remuneration payable to Managerial personnel
coming within the purview of applicable provisions of the Companies Act, 1956.
Table 1 gives details of the remuneration paid to Directors during the year 2006-2007.
1. Remuneration paid or payable To Directors for 2006-2007 (in Rs)
Name of the Director Category Sitting Salaries, Commission Total
Fee Allowancesand Perquisites#
Mr. L. N. Jhunjhunwala Promoter – Non-Executive 1,40,000 – – 1,40,000
Mr. Ravi Jhunjhunwala Promoter – Non-Executive 1,00,000 – – 1,00,000
Mr. Shekhar Agarwal Promoter – Executive – 30,48,000 – 30,48,000
Dr. Kamal Gupta Independent – Non-Executive 4,40,000 – – 4,40,000
Mr. D. N. Davar Independent – Non-Executive 2,60,000 – – 2,60,000
Mr. P. S. Dasgupta Independent – Non-Executive 2,00,000 – – 2,00,000
# Includes retirement benefits
During 2006-07, the Company did not advance any loans to any of its Directors. The Company does not have any Stock Option
Scheme.
Table 2 gives details of the shares held by the Non-Executive Directors as on 31st March, 2007.
2. Equity Shares held by Non-Executive Directors as on the 31st March, 2007
Name of the Director Category Number of Shares held
Mr. L. N. Jhunjhunwala Promoter – Non-Executive Nil
Mr. Ravi Jhunjhunwala Promoter – Non-Executive 10
Dr. Kamal Gupta Independent – Non-Executive 1000
Mr. D. N. Davar Independent – Non-Executive 1000
Mr. P.S. Dasgupta Independent – Non-Executive Nil
The Company has not issued convertible instruments to any of its Directors. The Non-Executive Directors are paid sitting fees forattending the Board meetings as well as Committee meetings. The remuneration of the Managing Director is subject to approval of the
Board and shareholders at the Annual General Meeting, and is within the ceilings laid down under the Companies Act, 1956.
5. Code Of Conduct
MOL's Board has laid down a code of conduct for all Board members and designated senior management of the Company. All Board
members and designated senior management personnel have affirmed compliance with this Code of Conduct. The code of conduct isdisplayed on the website of the Company www.maraloverseas.com. A declaration signed by Mr. Shekhar Agarwal, Managing Director
and Mr. P. S. Puri, Chief Financial Officer, to this effect, is enclosed at the end of this report.
6. Management
The Management Discussion and Analysis Report forms a part of the Annual Report.
During the financial year 2006-2007, there were no material financial or commercial transactions by the Company with its Promoters,
Directors, Management or relatives, etc. that may have potential conflict with the interests of the Company at large.

12
7. Shareholders’ Committee
The Company's Shareholders’ / Investors’ Grievance Committee comprised of following Directors as on the 31st March, 2007:
1) Dr. Kamal Gupta - Independent – Non-Executive
2) Mr. D. N. Davar - Independent – Non-Executive
3) Mr. Shekhar Agarwal – Promoter-Executive
Dr. Kamal Gupta is the Chairman of this Committee and Mr. Rajat Prothi, Company Secretary is the Compliance Officer. The terms of
reference of the Committee include redressal of Shareholders and Investors complaints relating to transfer and transmission of shares,non-receipt of Annual Reports, Dividend Warrants and other share related matters. The Committee also reviews the status of Investors'
grievances and redressal mechanism.
The Committee met four times during the year 2006-2007 on the 25th April, 2006, the 28th July, 2006, the 27th October, 2006 and the30th January, 2007.
14 Complaints were received during the financial year 2006-2007 all of which were redressed/answered to the satisfaction of the
shareholders. No Investor Grievance remained unattended/pending for more than 30 days. There were no complaints pending disposalas on the 31st March, 2007. No request for dematerialisation of Equity Shares of the Company was pending for approval as at the 31st
March, 2007.
The Company has constituted a Share Transfer Committee to look after requests for transfer/ transmission of equity shares, issue ofduplicate share certificates, consolidation/split/ replacement of share certificates and for re-materlisation of shares. The Share Transfer
Committee presently comprises of:
1) Mr. Shekhar Agarwal
2) Dr. Kamal Gupta
The Share Transfer Committee of the Company meets as often as required under the chairmanship of Mr. Shekhar Agarwal, Managing
Director. All valid requests for share transfer received during the year have been acted upon by the Company within the stipulated time
limit.
The Board of Directors has also delegated the authority to approve the share transfers to Mr. Shekhar Agarwal, Managing Director and
Mr. P. S. Puri, Chief Financial Officer, who attend and approve the share transfer requests on a fortnightly basis.
8. General Body Meetings
The details of the location and time of the last three Annual General Meetings (AGMs) of the Company are as follows:
Date of AGM Relevant Financial Year Venue/Location where held Time of Meeting
Maral Sarovar, V. & P.O. Khalbujurg,
28th September, 2004 2003-2004 Tehsil Kasrawad, Distt. Khargone 12:30 P.M.
Madhya Pradesh - 451 660
Maral Sarovar, V. & P.O. Khalbujurg,
17th August, 2005 2004-2005 Tehsil Kasrawad, Distt. Khargone 2:30 P.M.
Madhya Pradesh - 451 660
Maral Sarovar, V. & P.O. Khalbujurg,
28th September, 2006 2005-2006 Tehsil Kasrawad, Distt. Khargone 12:30 P.M.Madhya Pradesh - 451 660
No Special Resolutions were passed at the Annual General Meetings of the Company held on the 28th September, 2004, the
17th August, 2005 and the 28th September, 2006 respectively. No resolutions were passed by Postal Ballot in the year under review.
9. Compliances
The Company has complied with all the requirements of regulatory authorities. No penalties/strictures were imposed on the Company
by the Stock Exchanges or SEBI or any statutory authority on any matter related to capital market during the last three years.
The Company is fully compliant with the applicable mandatory requirements of Clause 49 of the Listing Agreement. The Company has
also complied to an extent with the non-mandatory requirements of Clause 49 of the Listing Agreement such as constitution of aRemuneration Committee and that the Company's financial statements are free from any qualifications by the Auditors.
10. Means of Communication
The quarterly, half yearly and annual audited results are sent immediately to the Stock Exchanges after they are approved by the Board
of Directors and are also uploaded on website http://sebiedifar.nic.in. The Company publishes its results in at least one prominent
national and regional newspaper. The same are also displayed on Company's website at www.maraloverseas.com.
The Annual Reports of the Company are also displayed on website, http://sebiedifar.nic.in. This website is also accessible through a
hyperlink 'EDIFAR' from SEBI's official website, http://www.sebi.gov.in.

13
Maral Overseas Limited » Annual Report 2006-2007
SHAREHOLDERS’ INFORMATION
1. Annual General Meeting
Day, Date and Time : Saturday, the 29th September, 2007 at 2:00 P.M.
Venue : Maral Sarovar, V. & P. O. Khalbujurg, Tehsil Kasrawad
Distt. Khargone - 451 660, Madhya Pradesh
2. Financial Calendar
Financial year : April - March
Quarterly Financial reporting : Within one month from the end of each quarter except fourth
quarter when annual results are published within two months
3. Dates of Book Closure : 24th Sept., 2007 (Monday) to 29th Sept., 2007 (Saturday) (Both days inclusive)
4. Dividend Payment Date : N/A
5. Listing of Shares on Stock Exchange
1) Bombay Stock Exchange Limited, Phiroze Jeejeebhoy Towers, Dalal Street, Mumbai - 400 001.
2) National Stock Exchange of India Limited, Exchange Plaza, Bandra-Kurla Complex, Bandra (East), Mumbai - 400 051.
3) The Calcutta Stock Exchange Association Limited, 7, Lyons Range, Kolkata - 700 001.
Listing fee as prescribed has been paid to the National Stock Exchange of India Limited (NSE) and Bombay Stock Exchange Limited (BSE)
upto 31st March, 2008. The Company has made application to The Calcutta Stock Exchange Association Limited for delisting and its
approval is awaited.
6. Stock Code
Bombay Stock Exchange Limited : 521018
National Stock Exchange of India Limited : MARALOVER
7. Stock Market Data: Monthly High Low closing values (in Rs) at BSE
8. Performance in comparison with BSE Sensex (Both series indexed to 100 as on April, 2006)
Source: Bombay Stock Exchange Limited
Source: Bombay Stock Exchange Limited

14
9. Registrar and Transfer Agent
M/s MCS Limited is the Share Transfer Agent of the Company. The Shareholders may contact M/s MCS Ltd. for matters related to Share
Transfers etc. at the following address:
MCS Limited, Sri Venkatesh Bhavan, W-40, Okhla Industrial Area, Phase II, New Delhi - 110 020
Phone No. : 011-41406149, Fax No. : 011-41709881, E-Mail : [email protected]
10. Share Transfer System
The matters related to Share Transfer and transmission etc. are attended by the delegated authorities on fortnightly basis. Share transfers
are registered and returned within 30 days from the date of receipt, if the documents are in order in all respects. The total number of
shares transferred during the year 2006-07 were 30,300.
11. Distribution of Shareholding as on 31st March, 2007
No. of Equity Shares held No. of Share % of Share No. of Shares % of Shareholders holders holding
1-500 18,618 88.22 28,44,027 13.07
501-1000 1,260 5.97 10,72,308 4.93
1001-10000 1,070 5.07 30,20,331 13.88
10001 and above 122 0.58 1,47,88,726 67.97
Shares in Transit 34 0.16 32,608 0.15
Total 21,104 100.00 2,17,58,000 100.00
12. Dematerialisation of Shares and Liquidity
1,57,27,570 Equity Shares were dematerialised till 31-03-2007, which is 72.28 % of the total paid up Equity Share Capital of the
Company. Trading in Shares of the Company is permitted in dematerialised form only.
The ISIN number for Equity Shares of the Company in NSDL and CDSL is INE 882A01013.
13. Outstanding GDRs/ADRs/Warrants or any Convertible instruments, conversion date and likely impact on equity
The Company has not issued any GDRs/ADRs/Warrants or any convertible instruments.
14. Plant Locations
1) Maral Sarovar, V. & P. O. Khalbujurg, Tehsil Kasrawad, Distt. Khargone - 451660, Madhya Pradesh.
2) A-11, Hosiery Complex, Phase-II (Extension), Noida - 201 305 (U.P.).
15. Address for Correspondence
Investor correspondence should be addressed to:
1. Share Transfer Agent
MCS Limited, Sri Venkatesh Bhavan, W-40, Okhla Industrial Area, Phase II, New Delhi - 110 020
Phone No. : 011-41406149, Fax No : 011-41709881, E -Mail : [email protected]
2. Company Secretary
Maral Overseas Limited, Bhilwara Towers, A-12, Sector 1, Noida- 201301 (U.P.)
Phone Nos. : 0120-2541810, 4390300 Fax No. : 0120-2531648, E-mail :[email protected]
3. Registered Office
Maral Sarovar, V. & P. O. Khalbujurg, Tehsil Kasrawad, Distt. Khargone - 451 660, Madhya Pradesh

15
Maral Overseas Limited » Annual Report 2006-2007
AUDITORS’ REPORT
To the Members of
Maral Overseas Limited
We have audited the attached Balance Sheet of Maral Overseas
Limited as at 31st March, 2007 and also the Profit and Loss Accountand the Cash Flow Statement of the Company for the year ended on
that date annexed thereto.
These financial statements are the responsibility of the Company's
management. Our responsibility is to express an opinion on these
financial statements based on our audit.
We have conducted our audit in accordance with auditing standards
generally accepted in India. These Standards require that we plan
and perform the audit to obtain reasonable assurance about whether
the financial statements are free of material misstatement. An audit
includes examining, on a test basis, evidence supporting the amounts
and disclosures in the financial statements. An audit also includesassessing the accounting principles used and significant estimates
made by management, as well as evaluating the overall financial
statement presentation. We believe that our audit provides a
reasonable basis for our opinion.
As required by the Companies (Auditors' Report) Order, 2003, issued
by the Central Government of India in terms of Section 227 (4A) of
the Companies Act, 1956 and on the basis of such checks as we
considered appropriate and according to the information andexplanations given to us, we give in the Annexure 'A' a statement on
the matters specified in paragraph 4 and 5 of the said order.
Further to our comments in the Annexure referred to above, we report
that:
a) We have obtained all the information and explanations, which
to the best of our knowledge and belief were necessary for the
purposes of our audit;
b) In our opinion, proper books of account as required by law,
have been kept by the Company so far as appears from our
examination of those books;
c) The Balance Sheet, Profit and Loss Account and Cash Flow
Statement dealt with by this report are in agreement with the
books of account;
d) In our opinion, the Balance Sheet, Profit and Loss Account and
Cash Flow Statement, dealt with by this report, comply with the
Accounting Standards referred to in sub-section (3C) of Section
211 of the Companies Act, 1956.
e) On the basis of written representations received from the
directors, as on 31st March, 2007 and taken on record by the
Board of Directors, we report that none of the directors isdisqualified as on 31st March, 2007 from being appointed as a
director in terms of clause (g) of sub-section (1) of Section 274
of the Companies Act, 1956.
f) The Company, as technically advised, had hitherto been
considering certain plant & machinery as continuous process
and charging depreciation accordingly. This being a technical
matter, we cannot form an independent opinion on such
classification of assets and are therefore unable to commentthereon. From the financial year 2000-2001, the Company has
revised, downwards, the estimated useful life of said plant &
machinery and has accordingly charged higher depreciation
(Refer Note no.4 to Schedule 16-Notes on Accounts).
Subject to above, in our opinion and to the best of our
information and according to the explanations given to us, the
said accounts read with the accounting policies and notes
thereon, give the information required by the Companies Act,
1956 in the manner so required and give a true and fair view inconformity with the accounting principles generally accepted
in India:
i) In the case of Balance Sheet, of the state of affairs of the Company
as at 31st March, 2007;
ii) In the case of the Profit and Loss Account, of the loss for the
year ended on that date; and
iii) In the case of the Cash Flow Statement, of the cash flows for theyear ended on that date.
For Doogar & Associates For Ashim & Associates
Chartered Accountants Chartered Accountants
Mukesh Goyal Ashim Agarwal
Partner PartnerMembership No. 81810 Membership No.84968
Noida (U.P.)
5th May, 2007

16
ANNEXURE ‘A’ TO AUDITORS' REPORT
(Referred to in the Auditors' Report of even date to the members of
Maral Overseas Ltd for the year ended 31st March, 2007)
1. (a) The Company has maintained proper records showing full
particulars, including quantitative details and situation of
fixed assets.
(b) The Company has a phased programme of physical
verification of its fixed assets which, in our opinion, is
reasonable having regard to the size of the Company and
the nature of its assets. Management has physically verified
certain fixed assets during the year. As informed to us, nomaterial discrepancies were noticed on such verification.
(c) Fixed assets disposed off during the year were notsubstantial and therefore do not affect the going concern
assumption.
2. (a) The inventory, except material lying with third parties, has
been physically verified by the management during the
year. In our opinion, the frequency of such verification is
reasonable.
(b) The procedures for physical verification of inventory
followed by the management are, in our opinion,
reasonable and adequate in relation to the size of the
Company and nature of its business.
(c) In our opinion, the Company is maintaining proper recordsof inventory. The discrepancies noticed on physical
verification of inventory as compared to book records were
not material and have been properly dealt with in the books
of accounts.
3. (a) The Company has not granted any loans to companies,
firms or other parties covered in the register maintained
under Section 301 of the Act. Accordingly clauses 4 (iii)
(b) to (d) of the Companies (Auditor's Report) Order, 2003are not applicable
(b) The Company has taken unsecured loans from one bodycorporate covered in the register maintained under Section
301 of the Companies Act, 1956. The maximum amount
involved during the year in this respect was Rs 1975.00
lac and the year end balance of loan taken from such party
was Rs 1975.00 lac.
(c) In our opinion, the rate of interest and other terms and
conditions on which such loans have been taken are not
prima facie prejudicial to the interests of the Company.
(d) The Company is regular in the payment of interest and
principle amount, wherever demanded during the year.
4. In our opinion, and according to the information andexplanations given to us during the course of the audit, there
are adequate internal control procedures commensurate with
the size of the Company and the nature of its business with
regard to purchase of inventory and fixed assets and for the sale
of goods & services. We did not observe any major weaknesses
in internal control during the course of our audit.
5. (a) Based upon the audit procedures applied by us and
according to the information and explanations given to
us, we are of the opinion that the particulars of contractsor arrangements referred to in Section 301 of the
Companies Act, 1956 have been entered in the register
required to be maintained under that Section.
(b) In our opinion, and according to the information and
explanations given to us, the transactions made in
pursuance of such contracts or arrangements and
aggregating during the year to Rupees five lac or more in
respect of each party have been made at prices which are
reasonable having regard to the prevailing market prices
at the relevant time, where such market prices are available.
6. The Company has not accepted any deposits from the public.
7. In our opinion, the Company has an internal audit system
commensurate with the size & nature of its business.
8. We have broadly reviewed the records, including the books of
account maintained by the Company pursuant to the rules
prescribed by the Central Government for the maintenance of
cost records under clause (d) of sub-section (1) of Section 209
of the Companies Act, 1956 in respect of Company's products
and are of the opinion that prima facie the prescribed accounts
and records have been made and maintained.
9. (a) According to the records of the Company, undisputed
statutory dues including Provident Fund, Investor Education
and Protection Fund, Employees' State Insurance, Income
tax, Sales tax, Wealth tax, Service tax, Custom Duty, Excise
Duty, Cess and other statutory dues have been regularly
deposited during the year with the appropriate authorities.
According to the information and explanations given to us
and as per the books and records examined by us, there
are no arrears of undisputed statutory dues outstanding as
on the date of balance sheet for a period exceeding six
months from the date they became payable
(b) According to the information and explanations given to us
and the records of the Company examined by us, the
particulars of statutory dues of the specified status as at
the end of the year, which have not been deposited on
account of a dispute are referred to in Annexure 'B'.
10. The accumulated losses of the Company at the end of the
financial year are less than fifty percent of its net worth. The
Company has incurred cash loss in the current financial year
though it did not incur cash loss in the immediately preceding
financial year.
11. According to the information and explanations given to us and
as per the books and records examined by us, the Company has
not defaulted in repayment of dues to any financial institution
or bank.
12. According to the information and explanations given to us, the
Company has not granted any loans and advances on the basis
of security by way of pledge of shares, debentures and other
securities.

17
Maral Overseas Limited » Annual Report 2006-2007
13. Provisions of the order applicable to chit funds, nidhi, mutual
benefit fund / societies are not applicable to the Company.
14. According to the information and explanations given to us, the
Company is not dealing or trading in shares, securities,debentures and other investments.
15. According to the information and explanations given to us andas per the books and records examined by us, the Company has
not given any guarantee for loans taken by others from bank or
financial institutions.
16. In our opinion, and according to the information and
explanations given to us, the term loans raised during the year
by the Company have been applied for the purpose for which
the said loans were obtained, where such end use has been
stipulated by the lender.
17. According to the information and explanations given to us and
as per the books and records examined by us, as on the date ofbalance sheet, the funds raised by the Company on short term
basis have not been applied for long term investments.
18. The Company has not raised any fresh share capital during the
year.
19. The Company has not issued any debentures.
20. The Company has not raised any money by way of public issue,
during the year.
21. Based on our examination of the books and records of the
Company and according to the information and explanations
given to us, no fraud on or by the Company has been noticed orreported during the year.
For Doogar & Associates For Ashim & Associates
Chartered Accountants Chartered Accountants
Mukesh Goyal Ashim Agarwal
Partner PartnerMembership No.81810 Membership No.84968
Noida (U.P.)
5th May, 2007
ANNEXURE 'B' TO AUDITORS' REPORT
Referred to in Paragraph 9 (b) of Annexure 'A' a statement on the matters specified in the Companies (Auditors' Report) Order, 2003 of
Maral Overseas Limited for the year ended 31st March, 2007
Name of the Statute Nature of Dues Amount Forum where the
Rs in lac dispute is pending
Income Tax Act Disputed regular Income Tax demands 8.35 Income Tax Tribunal
Income Tax Act Disputed regular Income Tax demands 27.64 CIT (Appeals)
Central Sales Tax Act Non submission of relevant statutory forms 0.64 Assistant Commissioner of
Sales Tax
Non submission of relevant statutory forms 7.93 Deputy Commissioner of
Sales Tax (Appeals)
Central Excise Act Duty on scrap sale 144.00 CESTAT
Duty rate on debonded goods 88.69 CESTAT
Madhya Pradesh Cess on captive power consumption 146.18 High CourtUpkar Adhiniyam
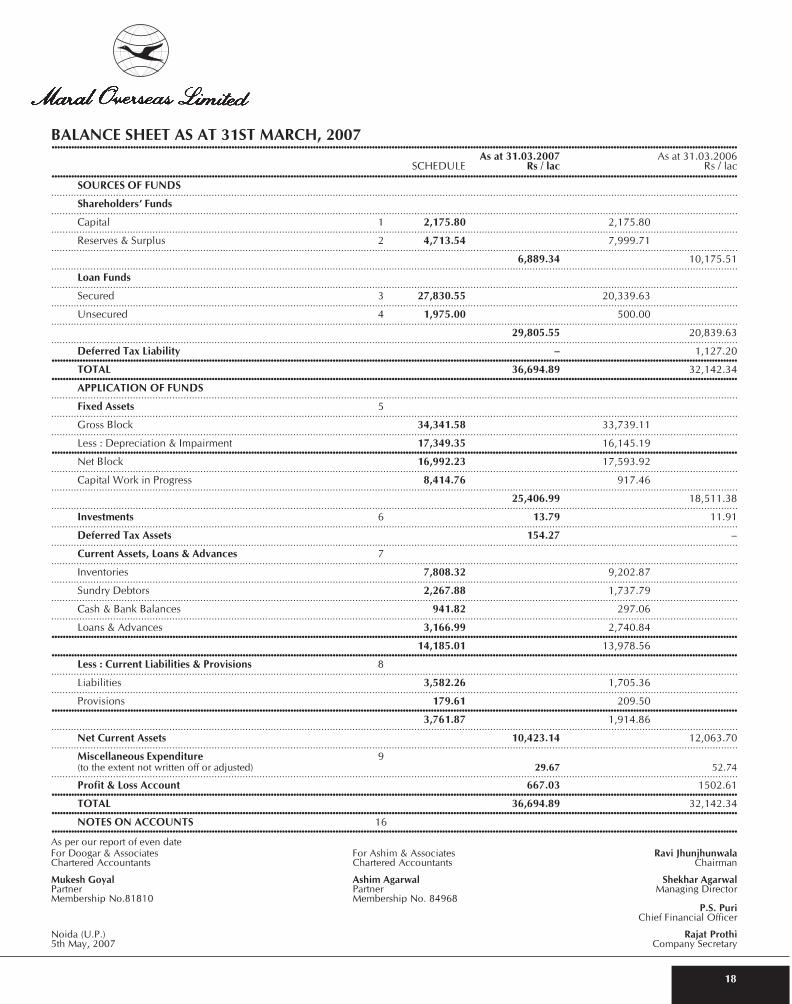
18
BALANCE SHEET AS AT 31ST MARCH, 2007....................................................................................................................................................................................................................................................
As at 31.03.2007 As at 31.03.2006SCHEDULE Rs / lac Rs / lac
....................................................................................................................................................................................................................................................SOURCES OF FUNDS
....................................................................................................................................................................................................................................................Shareholders’ Funds
....................................................................................................................................................................................................................................................Capital 1 2,175.80 2,175.80
....................................................................................................................................................................................................................................................Reserves & Surplus 2 4,713.54 7,999.71
.................................................................................................................................................................................................................................................... 6,889.34 10,175.51
....................................................................................................................................................................................................................................................Loan Funds
....................................................................................................................................................................................................................................................Secured 3 27,830.55 20,339.63
....................................................................................................................................................................................................................................................Unsecured 4 1,975.00 500.00
.................................................................................................................................................................................................................................................... 29,805.55 20,839.63
....................................................................................................................................................................................................................................................Deferred Tax Liability – 1,127.20
....................................................................................................................................................................................................................................................TOTAL 36,694.89 32,142.34
....................................................................................................................................................................................................................................................APPLICATION OF FUNDS
....................................................................................................................................................................................................................................................Fixed Assets 5
....................................................................................................................................................................................................................................................Gross Block 34,341.58 33,739.11
....................................................................................................................................................................................................................................................Less : Depreciation & Impairment 17,349.35 16,145.19
....................................................................................................................................................................................................................................................Net Block 16,992.23 17,593.92
....................................................................................................................................................................................................................................................Capital Work in Progress 8,414.76 917.46
.................................................................................................................................................................................................................................................... 25,406.99 18,511.38
....................................................................................................................................................................................................................................................Investments 6 13.79 11.91
....................................................................................................................................................................................................................................................Deferred Tax Assets 154.27 –
....................................................................................................................................................................................................................................................Current Assets, Loans & Advances 7
....................................................................................................................................................................................................................................................Inventories 7,808.32 9,202.87
....................................................................................................................................................................................................................................................Sundry Debtors 2,267.88 1,737.79
....................................................................................................................................................................................................................................................Cash & Bank Balances 941.82 297.06
....................................................................................................................................................................................................................................................Loans & Advances 3,166.99 2,740.84
.................................................................................................................................................................................................................................................... 14,185.01 13,978.56
....................................................................................................................................................................................................................................................Less : Current Liabilities & Provisions 8
....................................................................................................................................................................................................................................................Liabilities 3,582.26 1,705.36
....................................................................................................................................................................................................................................................Provisions 179.61 209.50
.................................................................................................................................................................................................................................................... 3,761.87 1,914.86
....................................................................................................................................................................................................................................................Net Current Assets 10,423.14 12,063.70
....................................................................................................................................................................................................................................................Miscellaneous Expenditure 9(to the extent not written off or adjusted) 29.67 52.74
....................................................................................................................................................................................................................................................Profit & Loss Account 667.03 1502.61
....................................................................................................................................................................................................................................................TOTAL 36,694.89 32,142.34
....................................................................................................................................................................................................................................................NOTES ON ACCOUNTS 16
....................................................................................................................................................................................................................................................
As per our report of even dateFor Doogar & Associates For Ashim & Associates Ravi JhunjhunwalaChartered Accountants Chartered Accountants Chairman
Mukesh Goyal Ashim Agarwal Shekhar AgarwalPartner Partner Managing DirectorMembership No.81810 Membership No. 84968
P.S. PuriChief Financial Officer
Noida (U.P.) Rajat Prothi5th May, 2007 Company Secretary

19
Maral Overseas Limited » Annual Report 2006-2007
PROFIT & LOSS ACCOUNT FOR THE YEAR ENDED 31ST MARCH, 2007....................................................................................................................................................................................................................................................
Year Ended Year Ended31.03.2007 31.03.2006
SCHEDULE Rs / lac Rs / lac....................................................................................................................................................................................................................................................
Income....................................................................................................................................................................................................................................................
Gross Turnover 10 29,170.70 24,765.57....................................................................................................................................................................................................................................................
Less : Excise Duty 178.82 242.69....................................................................................................................................................................................................................................................
Net Turnover 28,991.88 24,522.88....................................................................................................................................................................................................................................................
Other Income 11 587.39 570.66....................................................................................................................................................................................................................................................
Increase / (Decrease) in Stocks 12 (637.56) 935.74....................................................................................................................................................................................................................................................
28,941.71 26,029.28....................................................................................................................................................................................................................................................
Expenditure....................................................................................................................................................................................................................................................
Materials 13 15,634.69 12,903.83....................................................................................................................................................................................................................................................
Operating & Other Expenses 14 11,368.49 10,494.93....................................................................................................................................................................................................................................................
Financial Expenses 15 1,698.03 1,209.02....................................................................................................................................................................................................................................................
28,701.21 24,607.78....................................................................................................................................................................................................................................................
Profit Before Depreciation, Amortisation & Exceptional Items 240.50 1,421.50....................................................................................................................................................................................................................................................
Depreciation & Amortisation 1,701.70 1,646.24....................................................................................................................................................................................................................................................
(Loss) before Tax & Exceptional Items (1,461.20) (224.74)....................................................................................................................................................................................................................................................
Profit from continuing operations before tax (see note 10 of Schedule 16) 436.61 111.20....................................................................................................................................................................................................................................................
Taxation – Current – –....................................................................................................................................................................................................................................................
– Adjustment for earlier years – (3.00)....................................................................................................................................................................................................................................................
– Deferred (74.50) 197.18....................................................................................................................................................................................................................................................
– Fringe Benefits Tax (34.39) (36.18)....................................................................................................................................................................................................................................................
– Fringe Benefits Tax for earlier years (8.09) –....................................................................................................................................................................................................................................................
Profit from continuing operations after tax - (a) 319.63 269.20....................................................................................................................................................................................................................................................
(Loss) from discontinuing operations before Tax & Exceptional Item(see note 10 of Schedule 16) (1,897.81) (335.94)
....................................................................................................................................................................................................................................................Taxation – Deferred 599.85 126.91
....................................................................................................................................................................................................................................................– Fringe Benefits Tax (3.85) (10.73)
....................................................................................................................................................................................................................................................(Loss) from discontinuing operations before Exceptional Items (1,301.81) (219.76)
....................................................................................................................................................................................................................................................Employee Termination Costs 2,224.53 –
....................................................................................................................................................................................................................................................Less: Deferred Tax thereon (756.12) 1,468.41
....................................................................................................................................................................................................................................................(Loss) from discontinuing activities after Exceptional Items - (b) (2,770.22) (219.76)
....................................................................................................................................................................................................................................................Profit / (Loss) After Taxation (a + b) (2,450.59) 49.44
....................................................................................................................................................................................................................................................Balance brought forward from previous year (1,502.61) (1,552.05)
....................................................................................................................................................................................................................................................Balance Carried to Balance Sheet (3,953.20) (1,502.61)
....................................................................................................................................................................................................................................................Earnings Per Share (Equity Shares, par value Rs 10/- each)
....................................................................................................................................................................................................................................................Basic (11.26) 0.23
....................................................................................................................................................................................................................................................Diluted (11.26) 0.23
....................................................................................................................................................................................................................................................NOTES ON ACCOUNTS 16
....................................................................................................................................................................................................................................................
As per our report of even dateFor Doogar & Associates For Ashim & Associates Ravi JhunjhunwalaChartered Accountants Chartered Accountants Chairman
Mukesh Goyal Ashim Agarwal Shekhar AgarwalPartner Partner Managing DirectorMembership No.81810 Membership No. 84968
P.S. PuriChief Financial Officer
Noida (U.P.) Rajat Prothi5th May, 2007 Company Secretary

20
....................................................................................................................................................................................................................................................
As at As at
31.03.2007 31.03.2006
1. Share Capital Rs / lac Rs / lac....................................................................................................................................................................................................................................................
Authorised....................................................................................................................................................................................................................................................
3,00,00,000 Equity Shares of Rs 10/- each 3,000.00 3,000.00....................................................................................................................................................................................................................................................
25,00,000 Cumulative Redeemable Preference
Shares of Rs 100/- each 2,500.00 2,500.00....................................................................................................................................................................................................................................................
5,500.00 5,500.00....................................................................................................................................................................................................................................................
Issued, Subscribed & Paid-up....................................................................................................................................................................................................................................................
2,17,58,000 Equity Shares of Rs 10/- each fully paid up 2,175.80 2,175.80....................................................................................................................................................................................................................................................
2,175.80 2,175.80....................................................................................................................................................................................................................................................
As at As at
31.3.2006 Additions Deductions 31.3.20072. Reserves and Surplus Rs / lac Rs / lac Rs / lac Rs / lac..............................................................................................................................................................................................................................................................................
Capital Reserve 123.48 – – 123.48....................................................................................................................................................................................................................................................
Capital Redemption Reserve Account 2,000.00 – – 2,000.00....................................................................................................................................................................................................................................................
Share Premium Account 2,590.06 – – 2,590.06....................................................................................................................................................................................................................................................
General Reserve 3,286.17 – 3,286.17 * –....................................................................................................................................................................................................................................................
7,999.71 – 3,286.17 4,713.54....................................................................................................................................................................................................................................................
* Offset against debit balance
In Profit & Loss Account, movement in which is (1,502.61) (2,450.59) (3,286.17) (667.03)....................................................................................................................................................................................................................................................
As at As at
31.3.2007 31.3.2006
3. Secured Loans Rs / lac Rs / lac....................................................................................................................................................................................................................................................
From Financial Institutions & Banks....................................................................................................................................................................................................................................................
Rupee Term Loans 19,287.09 10,402.24....................................................................................................................................................................................................................................................
Foreign Currency Term Loans 677.90 2,410.18....................................................................................................................................................................................................................................................
19,964.99 12,812.42....................................................................................................................................................................................................................................................
From Banks....................................................................................................................................................................................................................................................
For Working Capital 7,865.56 7,527.21....................................................................................................................................................................................................................................................
27,830.55 20,339.63....................................................................................................................................................................................................................................................
Notes
1. Term loans of Rs 17,934.38 lac are secured by a first charge on all the present and future immovable properties (except those situated in
the State of Jammu & Kashmir) of the Company and hypothecation of movable assets (except book debts) ranking pari-passu, subject toprior charges in favour of the Company's bankers on stocks of raw material, semi-finished and finished goods, consumable stocks and
book debts for availing Working Capital Facilities.
2. Term loans of Rs 1,030.61 lac are secured by a first charge on all the movable / immovable properties (save & except book debts) of the
Company's Jammu unit, both present and future, subject to prior charges created in favour of the Company's bankers to secure borrowings
for working capital for the Jammu unit.
3. Term loans of Rs 1,000.00 lac are secured by a first charge on all the present and future immovable properties of the Company and

21
Maral Overseas Limited » Annual Report 2006-2007
hypothecation of movable assets (except book debts) ranking pari-passu, subject to prior charges in favour of the Company's bankers on
stocks of raw material, semi-finished and finished goods, consumable stocks and book debts for availing working capital facilities.
4. Term Loans repayable in next 12 months Rs 2,750.95 lac (Previous Year-Rs 2,671.91 lac).
5. Working Capital Facilities from banks are secured by way of hypothecation of stock in trade, stores (excluding machinery spares) and
book debts.
In respect of facilities, other than those related to the Company's Jammu unit, these are further secured by second pari-passu charge on allthe immovable properties of the Company (other than the properties in respect of the Company's Jammu unit).
In respect of Working Capital Facilities from banks for the Company's Jammu unit these are further secured by second charge on the
properties of the Company's Jammu unit.....................................................................................................................................................................................................................................................
As at 31.3.2007 As at 31.3.2006
4. Unsecured Loans Rs / lac Rs / lac....................................................................................................................................................................................................................................................
From Corporate 1,975.00 500.00....................................................................................................................................................................................................................................................
1,975.00 500.00....................................................................................................................................................................................................................................................
5. Fixed Assets (Rs / lac)
Gross Block Depreciation, Impairment & Amortisation Net Block
Particulars As at Additions Sale/ As at As at For the Sale/ As at As at As at
1.4.2006 during Adj. 31.3.2007 1.4.2006 year Adj. 31.3.2007 31.3.2007 31.3.2006the year
A Fixed Assets....................................................................................................................................................................................................................................................
Land – Lease Hold 72.35 – – 72.35 4.48 0.87 – 5.35 67.00 67.87....................................................................................................................................................................................................................................................
– Free Hold 32.48 10.37 – 42.85 – – – – 42.85 32.48....................................................................................................................................................................................................................................................
Building 5,103.26 68.13 – 5,171.39 1,191.28 142.40 – 1,333.68 3,837.71 3,911.98....................................................................................................................................................................................................................................................
Plant & Machinery 27,174.53 993.64 554.43 27,613.74 14,074.85 1,403.29 484.51 14,993.63 12,620.11 13,099.68....................................................................................................................................................................................................................................................
Furniture & Office Equip. 449.55 38.05 0.53 487.07 275.26 25.47 0.01 300.72 186.35 174.29....................................................................................................................................................................................................................................................
Vehicles 264.77 75.12 27.65 312.24 147.50 35.97 13.03 170.44 141.80 117.27....................................................................................................................................................................................................................................................
Livestock 2.34 – 0.23 2.11 – – – – 2.11 2.34....................................................................................................................................................................................................................................................
B Intangibles....................................................................................................................................................................................................................................................
Software 639.83 – – 639.83 451.82 93.71 – 545.53 94.30 188.01....................................................................................................................................................................................................................................................
Total (A + B) 33,739.11 1,185.31 582.84 34,341.58 16,145.19 1,701.71 497.55 17,349.35 16,992.23 17,593.92....................................................................................................................................................................................................................................................
C Capital Work in Progress....................................................................................................................................................................................................................................................
Building 700.77 113.41....................................................................................................................................................................................................................................................
Plant & Machinery 4,547.97 20.19....................................................................................................................................................................................................................................................
Capital Advances
(Unsecured, Considered good) 2,477.93 597.51....................................................................................................................................................................................................................................................
Pre-operative Expenses
pending allocation 688.09 186.35....................................................................................................................................................................................................................................................
Total (C) 8,414.76 917.46....................................................................................................................................................................................................................................................
Grand Total 33,739.11 1,185.31 582.84 34,341.58 16,145.19 1,701.71 497.55 17,349.35 25,406.99 18,511.38....................................................................................................................................................................................................................................................
Previous Year 28,620.22 5,536.27 417.38 33,739.11 14,902.20 1,646.24 403.25 16,145.19 18,511.38....................................................................................................................................................................................................................................................
Note: Buildings include Rs 0.02 lac paid for acquiring shares in housing society.
Fixed assets include assets belonging to the discontinued operations (Refer Note No.10 of Schedule 16 - Notes on Accounts).

22
....................................................................................................................................................................................................................................................
As at As at
31.3.2007 31.3.20066. Investments Rs / lac Rs / lac....................................................................................................................................................................................................................................................
Quoted....................................................................................................................................................................................................................................................
A. Long Term....................................................................................................................................................................................................................................................
75,000 Equity Shares of Rs 10/- each fully paid of
Bhilwara Spinners Limited 15.00 15.00....................................................................................................................................................................................................................................................
B. Current....................................................................................................................................................................................................................................................
7,700 Equity Shares of Rs 10/- each fully paid ofBPL Engineering Limited 5.78 5.78
....................................................................................................................................................................................................................................................
560 Equity Shares of Rs 100/- each fully paid of
State Bank of Bikaner & Jaipur 3.02 3.02....................................................................................................................................................................................................................................................
23.80 23.80....................................................................................................................................................................................................................................................
Less: Provision for diminution in value of Investments 10.01 11.89....................................................................................................................................................................................................................................................
13.79 11.91....................................................................................................................................................................................................................................................
Notes:
1. Market value Rs 29.51 lac (Previous Year - Rs 32.21 lac).
2. None of the Investments are trade investments.
....................................................................................................................................................................................................................................................
As at As at31.3.2007 31.3.2006
7. Current Assets, Loans & Advances Rs / lac Rs / lac....................................................................................................................................................................................................................................................
INVENTORIES
(At lower of cost or net realisable value)....................................................................................................................................................................................................................................................
Raw Materials 3,903.75 4,615.92....................................................................................................................................................................................................................................................
Packing Materials 5.37 4.64....................................................................................................................................................................................................................................................
Stores and Spares 254.67 309.45....................................................................................................................................................................................................................................................
Dyes & Chemicals 96.35 86.14....................................................................................................................................................................................................................................................
Embellishments 203.15 204.13....................................................................................................................................................................................................................................................
Finished goods 2,439.53 3,145.29....................................................................................................................................................................................................................................................
Stock in process 894.00 825.60....................................................................................................................................................................................................................................................
Waste 11.50 11.70....................................................................................................................................................................................................................................................
7,808.32 9,202.87....................................................................................................................................................................................................................................................
SUNDRY DEBTORS
(Unsecured, Considered good)....................................................................................................................................................................................................................................................
Due over six months 189.77 157.49....................................................................................................................................................................................................................................................
Others 2,078.11 1,580.30....................................................................................................................................................................................................................................................
2,267.88 1,737.79....................................................................................................................................................................................................................................................

23
Maral Overseas Limited » Annual Report 2006-2007
....................................................................................................................................................................................................................................................
As at As at
31.3.2007 31.3.2006Rs / lac Rs / lac
....................................................................................................................................................................................................................................................
Considered doubtful....................................................................................................................................................................................................................................................
Due over six months 49.30 58.93....................................................................................................................................................................................................................................................
2,317.18 1,796.72....................................................................................................................................................................................................................................................
Less : Provision for doubtful debts 49.30 58.93....................................................................................................................................................................................................................................................
2,267.88 1,737.79....................................................................................................................................................................................................................................................
CASH & BANK BALANCES....................................................................................................................................................................................................................................................
Cash, Cheques & Stamps in hand 50.64 201.48....................................................................................................................................................................................................................................................
Balances with Scheduled Banks in :....................................................................................................................................................................................................................................................
Current Account 814.99 35.57....................................................................................................................................................................................................................................................
Deposit Account # 55.36 27.60....................................................................................................................................................................................................................................................
Margin Money Account # 5.43 6.27....................................................................................................................................................................................................................................................
Dividend Account 14.58 21.02....................................................................................................................................................................................................................................................
Savings Bank Account (Employees’ Security Deposit) 0.81 5.11....................................................................................................................................................................................................................................................
Post Office Saving Account 0.01 0.01....................................................................................................................................................................................................................................................
941.82 297.06....................................................................................................................................................................................................................................................
# Includes pledged with :
Government Departments Rs 3.76 lac (Previous Year Rs 3.33 lac)
Bank as Margin Rs 8.23 lac (Previous Year Rs 8.82 lac)....................................................................................................................................................................................................................................................
LOANS AND ADVANCES
(Unsecured, considered good)....................................................................................................................................................................................................................................................
Advances recoverable in cash or
in kind or for value to be received 2,813.13 2,482.36....................................................................................................................................................................................................................................................
Excise and other deposits 353.86 258.48....................................................................................................................................................................................................................................................
3,166.99 2,740.84....................................................................................................................................................................................................................................................
14,185.01 13,978.56....................................................................................................................................................................................................................................................
8. Current Liabilities & Provisions....................................................................................................................................................................................................................................................
CURRENT LIABILITIES....................................................................................................................................................................................................................................................
Trade Creditors 2,198.11 609.07....................................................................................................................................................................................................................................................
Advance from customers 146.29 145.55....................................................................................................................................................................................................................................................
Other Liabilities 1,148.42 888.25....................................................................................................................................................................................................................................................
Unclaimed Dividend * 14.58 21.02....................................................................................................................................................................................................................................................
Interest accrued but not due 74.86 41.47....................................................................................................................................................................................................................................................
3,582.26 1,705.36....................................................................................................................................................................................................................................................
* There are no outstanding amounts which are due for deposit but not deposited in Investor Education & Protection Fund.

24
....................................................................................................................................................................................................................................................
As at As at31.3.2007 31.3.2006
Rs / lac Rs / lac....................................................................................................................................................................................................................................................
PROVISIONS....................................................................................................................................................................................................................................................
For Gratuity & other Employee Benefits 168.57 184.02....................................................................................................................................................................................................................................................
For Taxation 9.52 9.52....................................................................................................................................................................................................................................................
For Fringe Benefit Tax – 14.47....................................................................................................................................................................................................................................................
For Wealth Tax 1.52 1.49....................................................................................................................................................................................................................................................
179.61 209.50....................................................................................................................................................................................................................................................
3,761.87 1,914.86....................................................................................................................................................................................................................................................
9. Miscellaneous Expenditure....................................................................................................................................................................................................................................................
(To the extent not written off or adjusted)....................................................................................................................................................................................................................................................
Deferred Revenue Expenses
(Premium paid on resetting of interest rate on term loans) 29.67 52.74....................................................................................................................................................................................................................................................
29.67 52.74....................................................................................................................................................................................................................................................
Year Ended Year Ended31.3.2007 31.3.2006
Rs / lac Rs / lac....................................................................................................................................................................................................................................................
10. Turnover....................................................................................................................................................................................................................................................
Export Sales 22,271.26 17,871.93....................................................................................................................................................................................................................................................
Deemed Export Sales 879.87 307.35....................................................................................................................................................................................................................................................
Domestic Sales 4,114.99 4,760.02....................................................................................................................................................................................................................................................
Domestic Waste Sales 1,375.06 1,380.99....................................................................................................................................................................................................................................................
Job Charges 9.20 67.03....................................................................................................................................................................................................................................................
Export Incentives 520.32 378.25....................................................................................................................................................................................................................................................
29,170.70 24,765.57....................................................................................................................................................................................................................................................
11. Other Income....................................................................................................................................................................................................................................................
Insurance and Other Claims 17.79 170.34....................................................................................................................................................................................................................................................
Exchange Fluctuation 146.27 106.85....................................................................................................................................................................................................................................................
Miscellaneous Income 284.85 270.46....................................................................................................................................................................................................................................................
Dividend on Investment 0.36 0.56....................................................................................................................................................................................................................................................
Profit on sale of fixed assets 138.12 22.45....................................................................................................................................................................................................................................................
587.39 570.66....................................................................................................................................................................................................................................................
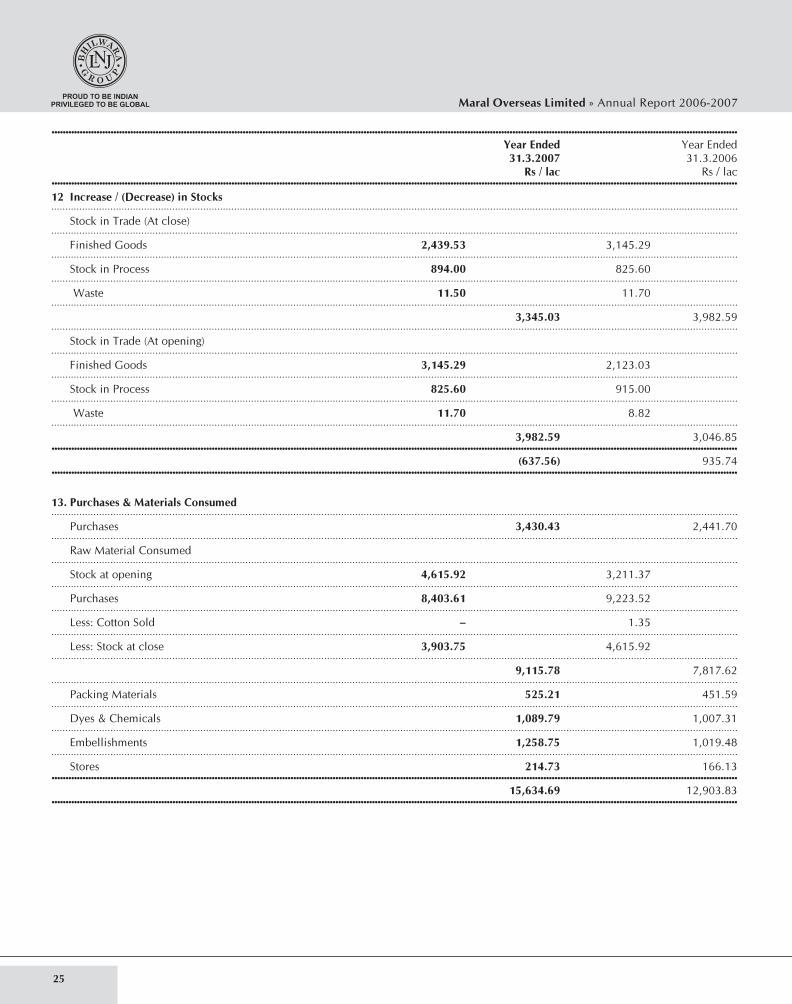
25
Maral Overseas Limited » Annual Report 2006-2007
....................................................................................................................................................................................................................................................
Year Ended Year Ended
31.3.2007 31.3.2006 Rs / lac Rs / lac
....................................................................................................................................................................................................................................................
12 Increase / (Decrease) in Stocks....................................................................................................................................................................................................................................................
Stock in Trade (At close)....................................................................................................................................................................................................................................................
Finished Goods 2,439.53 3,145.29....................................................................................................................................................................................................................................................
Stock in Process 894.00 825.60....................................................................................................................................................................................................................................................
Waste 11.50 11.70....................................................................................................................................................................................................................................................
3,345.03 3,982.59....................................................................................................................................................................................................................................................
Stock in Trade (At opening)....................................................................................................................................................................................................................................................
Finished Goods 3,145.29 2,123.03....................................................................................................................................................................................................................................................
Stock in Process 825.60 915.00....................................................................................................................................................................................................................................................
Waste 11.70 8.82....................................................................................................................................................................................................................................................
3,982.59 3,046.85....................................................................................................................................................................................................................................................
(637.56) 935.74....................................................................................................................................................................................................................................................
13. Purchases & Materials Consumed....................................................................................................................................................................................................................................................
Purchases 3,430.43 2,441.70....................................................................................................................................................................................................................................................
Raw Material Consumed....................................................................................................................................................................................................................................................
Stock at opening 4,615.92 3,211.37....................................................................................................................................................................................................................................................
Purchases 8,403.61 9,223.52....................................................................................................................................................................................................................................................
Less: Cotton Sold – 1.35....................................................................................................................................................................................................................................................
Less: Stock at close 3,903.75 4,615.92....................................................................................................................................................................................................................................................
9,115.78 7,817.62....................................................................................................................................................................................................................................................
Packing Materials 525.21 451.59....................................................................................................................................................................................................................................................
Dyes & Chemicals 1,089.79 1,007.31....................................................................................................................................................................................................................................................
Embellishments 1,258.75 1,019.48....................................................................................................................................................................................................................................................
Stores 214.73 166.13....................................................................................................................................................................................................................................................
15,634.69 12,903.83....................................................................................................................................................................................................................................................

26
....................................................................................................................................................................................................................................................
Year Ended Year Ended
31.3.2007 31.3.2006 Rs / lac Rs / lac
....................................................................................................................................................................................................................................................
14. Operating & Other Expenses....................................................................................................................................................................................................................................................
Salaries, Wages & Benefits....................................................................................................................................................................................................................................................
Salaries, Wages, Bonus & Gratuity etc. 2,882.82 3,460.37....................................................................................................................................................................................................................................................
Contribution to Provident Fund, ESI etc 281.32 289.97....................................................................................................................................................................................................................................................
Employee Welfare & Other Expenses 83.73 104.38....................................................................................................................................................................................................................................................
3,247.87 3,854.72....................................................................................................................................................................................................................................................
Job Charges 2,370.17 1,470.29....................................................................................................................................................................................................................................................
Power & Fuel 2,145.65 1,704.45....................................................................................................................................................................................................................................................
Repairs & Maintenance....................................................................................................................................................................................................................................................
Machinery (including spares) 241.49 499.48....................................................................................................................................................................................................................................................
Building 17.36 24.09....................................................................................................................................................................................................................................................
Others 78.38 88.28....................................................................................................................................................................................................................................................
337.23 611.85....................................................................................................................................................................................................................................................
Insurance Charges 151.65 165.03....................................................................................................................................................................................................................................................
Rent 124.62 119.09....................................................................................................................................................................................................................................................
Rates & Taxes 110.49 31.42....................................................................................................................................................................................................................................................
Travelling & Conveyance 178.26 216.62....................................................................................................................................................................................................................................................
Managerial Remuneration (including sitting fee) 41.88 19.62....................................................................................................................................................................................................................................................
Miscellaneous Expenses 705.84 630.29....................................................................................................................................................................................................................................................
Freight & Forwarding 1,149.03 1,008.62....................................................................................................................................................................................................................................................
Commission/Claims 509.62 414.35....................................................................................................................................................................................................................................................
Other Selling Expenses 154.99 132.05....................................................................................................................................................................................................................................................
Provision for doubtful debts 46.55 0.20....................................................................................................................................................................................................................................................
Loss on sale of fixed assets 0.28 0.16....................................................................................................................................................................................................................................................
Excise Duty 69.58 84.66....................................................................................................................................................................................................................................................
Wealth Tax 1.71 1.50....................................................................................................................................................................................................................................................
Amortisation of Deferred Revenue Expenses 23.07 30.01....................................................................................................................................................................................................................................................
11,368.49 10,494.93....................................................................................................................................................................................................................................................

27
Maral Overseas Limited » Annual Report 2006-2007
....................................................................................................................................................................................................................................................
Year Ended Year Ended
31.3.2007 31.3.2006 Rs / lac Rs / lac
....................................................................................................................................................................................................................................................
15. Financial Expenses....................................................................................................................................................................................................................................................
Interest....................................................................................................................................................................................................................................................
On Term Loans 728.55 626.91....................................................................................................................................................................................................................................................
On Working Capital 662.96 407.60....................................................................................................................................................................................................................................................
Others 110.92 22.49....................................................................................................................................................................................................................................................
1,502.43 1,057.00....................................................................................................................................................................................................................................................
Less : Interest Income (T.D.S. Rs 2.43 lacPrevious Year Rs 0.58 lac) 12.16 16.50
....................................................................................................................................................................................................................................................
1,490.27 1,040.50....................................................................................................................................................................................................................................................
Bank charges & other financial expenses 207.76 168.52....................................................................................................................................................................................................................................................
1,698.03 1,209.02....................................................................................................................................................................................................................................................

28
16. Accounting Policies & Notes on Accounts
A. Accounting Policies
1) Revenue Recognition
i) The accounts of the Company are prepared under the historical cost convention and in accordance with the applicable accounting
standards.
ii) Income is accounted for on accrual basis in accordance with Accounting Standard (AS) 9 - "Revenue Recognition".
iii) Sale is recognised on dispatch to customer.
iv) Insurance and other claims are recognised in accounts on lodgment to the extent these are measurable with reasonable certainty of
acceptance. Excess/shortfall is adjusted in the year of receipt.
2) Inventories
Inventories are valued at lower of cost, computed on a weighted average basis, and estimated net realisable value, after providing for cost
of obsolescence and other anticipated losses, wherever considered necessary. Finished goods and work-in-progress include costs of
conversion and other costs in bringing the inventories to their present location and condition.
3) Investments
Long term investments are stated at cost. Provision for diminution in the value of long-term investments is made only if such a decline is
other than temporary in the opinion of the management. The current investments are stated at lower of cost or quoted / fair value
computed categorywise.
4) Fixed & Intangible Assets
i) Fixed assets are stated at historical cost less provision for impairment losses, if any, depreciation, amortization and after adjustments
on account of foreign exchange fluctuation in respect of changes in rupee liability of foreign currency loans used for acquisition of
fixed assets.
ii) Borrowing costs eligible for capitalisation incurred, in respect of acquisition / construction of a qualifying asset, till the asset is
substantially ready for use, are capitalised as part of the cost of that asset.
iii) Pre-operative, trial run and incidental expenses relating to the projects are carried forward to be capitalised and apportioned to
various assets on commissioning of the project.
iv) Intangible assets are recognised on the basis of recognition criteria as set out in Accounting Standard (AS) 26 - "Intangible Assets".
5) Depreciation & Amortisation
Depreciation & Amortisation for the year has been accounted on the following basis:
i) Plant & machinery, building, furniture & office equipment, on straight line method at the rates specified in Schedule XIV to The
Companies Act, 1956 (Also refer note no. 4 of this Schedule-Notes on Accounts).
ii) Vehicles, on written down value method at the rates specified in Schedule XIV to The Companies Act, 1956.
iii) Leasehold land is amortised over the period of lease.
iv) Free hold land and live stock are not depreciated.
v) Assets costing upto Rs 5,000 are fully depreciated in the year of purchase.
vi) Software costs are amortised at the rate applicable for computers specified in Schedule XIV to The Companies Act, 1956, which is a
fair representation of the period of time over which the asset is expected to be used.
ix) In the case of assets where an impairment loss is recognized, the revised carrying amount is depreciated over the remaining estimated
useful life.
6) Impairment of Assets
Assets are reviewed for impairment whenever events or changes in circumstances indicate that the carrying amount may not be recoverable.
An impairment loss is recognised for the amount by which the asset's carrying amount exceeds its recoverable amount being the higher
of the asset's net selling price and its value in use. Value in use is based on the present value of the estimated future cash flows relating
to the asset. For the purposes of assessing impairment, assets are grouped at the lowest levels for which there are separately identifiable
cash flows (i.e. cash generating units).
Previously recognised impairment losses are reversed where the recoverable amount increases because of a favourable change in the
estimates used to determine the recoverable amount since the last impairment was recognised. A reversal of an asset's impairment loss is
limited to its carrying amount that would have been determined (net of depreciation or amortization), had no impairment loss beenrecognised in prior years.
7) Foreign Currency Transactions
Foreign currency transactions are recorded using the exchange rates prevailing on the dates of the respective transactions. Exchange
differences arising on foreign currency transactions settled during the year are recognized in the profit and loss account except exchange
differences related to acquisition of fixed assets which are adjusted in the carrying amount of the related fixed assets.

29
Maral Overseas Limited » Annual Report 2006-2007
Monetary assets and liabilities denominated in foreign currencies, which are outstanding as at the year end are translated at exchange
rates prevailing on the last working day of the accounting year. The resultant exchange differences (except those related to acquisition of
fixed assets) are recognized in the profit & loss account.
Forward contracts are entered into to hedge the foreign currency risk of the underlying outstanding at the balance sheet date as well as
future transactions in respect of which either firm commitments have been made or which are highly probable forecast transactions. The
premium or discount on all such contracts arising at the inception of each contract is amortised as expense or income over the life of thecontract. The exchange differences on such forward contracts are accounted for in the profit and loss account except for exchange
differences relating to acquisition of fixed assets which are adjusted in the carrying amount of the related fixed assets, being the difference
between (i) the foreign currency amount of the contract translated at the exchange rate on the reporting date, or the settlement date where
the transaction is settled during the reporting period, and (ii) the same foreign currency amount translated at the latter of the date of
inception of the forward exchange contract and the last reporting date. Any profit or loss arising on cancellation or renewal a forward
exchange contract is recognized as income or expense for the period.
8) Miscellaneous Expenditure
Premium paid on resetting of interest rate on term loans is amortised over balance period of the respective loans.
9) Retirement Benefits
Contribution to provident and superannuation funds is accounted on accrual basis. Liability for gratuity and leave encashment is provided
as determined on actuarial valuation.
10) Tax On Income
i) Current corporate tax is provided on the results for the year after considering applicable tax rates and laws.
ii) Deferred tax is provided on timing differences between tax and accounting treatments that originate in one period and are expected
to be reversed or settled in subsequent periods. Deferred tax assets and liabilities are measured using the enacted / substantively
enacted tax rates and laws for continuing operations.
Deferred tax assets arising on account of unabsorbed depreciation and carry forward losses under tax laws, that exceed the deferred
tax liability, are recognized only where there is virtual certainty of realization.
Deferred tax assets on account of other timing differences are recognized only to the extent there is reasonable certainty of realization.
The carrying amount of deferred tax assets is reviewed at each balance sheet date to reassess realization.
11) Provisions and Contingent Liabilities
Provisions are recognized for present obligations, of uncertain timing or amount, arising as a result of a past event where a reliable
estimate can be made and it is probable that an outflow of resources embodying economic benefits will be required to settle the
obligation. Where it is not probable that an outflow of resources embodying economic benefits will be required or the amount cannot be
estimated reliably, the obligation is disclosed as a contingent liability unless the possibility of outflow of resources embodying economic
benefits is remote.
Possible obligations, whose existence will only be confirmed by the occurrence or non-occurrence of one or more uncertain future
events, are also disclosed as contingent liabilities unless the possibility of outflow of resources embodying economic benefits is remote.
B. Notes on Accounts As at 31.3.2007 As at 31.3.2006Rs / lac Rs / lac
....................................................................................................................................................................................................................................................
1) Contingent Liabilities not provided for in respect of :....................................................................................................................................................................................................................................................
i) Counter guarantees given in respect of
Guarantees given by the Company's bankers 171.00 176.09....................................................................................................................................................................................................................................................
ii) Duties & tax liabilities disputed by the Company 651.20 455.16....................................................................................................................................................................................................................................................
2) Estimated value of contracts remaining
to be executed on capital account and
not provided for (net of advances) 2,226.21 5,891.81....................................................................................................................................................................................................................................................
3) Bills discounted with banks 2,742.59 3,253.00....................................................................................................................................................................................................................................................
4) Based on technical opinion, the Company was treating plant & machinery of spinning unit as continuous process plant and accordingly
charging depreciation upto financial year 1999-2000. To keep pace with changes in technology, Company has since revised estimated
useful life of the said plant & machinery to 13 years.
Had the depreciation been provided at rates applicable for triple shift operations, the depreciation charge for the year would have been
lower by Rs 85.86 lac (Previous Year - Rs 90.94 lac).

30
5) Miscellaneous income includes provision for diminution in value of investments written back during the year of Rs 1.87 lac
(Previous Year - Rs Nil). Miscellaneous expenses include provision for diminution in value of investments made of Rs Nil (Previous Year
- Rs 5.85 lac).
6) Trade creditors include outstanding dues of small scale industrial undertakings Rs 8.33 lac (Previous Year - Rs 74.69 lac). The above
information regarding small scale industrial undertakings has been determined to the extent such parties have been identified by the
Company, on the basis of information available with them. This has been relied upon by the auditors.
7) The Company is in process of identifying Micro & Small Enterprises as defined under the Micro, Small and Medium Enterprises Development
Act, 2006 ("the Act"). Consequently, as of now, it is neither possible for the Company to ascertain whether payment to such enterprises
has been made within 45 days from date of acceptance of supply of goods or services rendered by a supplier nor to give the relevantdisclosures as required under the Act.
8) During the year, the Company has capitalised borrowing costs of Rs 203.31 lac (Previous Year - Rs 112.81 lac), incurred on acquisition
of fixed assets. The allocation of interest on borrowings, for the purpose of capitalisation, in respect of funds borrowed and used for thepurpose of obtaining a qualifying asset has been done on the basis of use of funds as per the best possible estimates.
9) The following were the unadjusted foreign exchange contracts & unhedged exposures as at the balance sheet date
....................................................................................................................................................................................................................................................
Category Purpose Currency As at As at
31.03.2007 31.3.2006....................................................................................................................................................................................................................................................
A Outstanding forward exchange contracts....................................................................................................................................................................................................................................................
Exports Hedging USD 2,064,410 1,404,877....................................................................................................................................................................................................................................................
Hedging Euro 540,906 554,458....................................................................................................................................................................................................................................................
Hedging GBP 1,000,000 342,732....................................................................................................................................................................................................................................................
Imports Hedging CHF – 125,000....................................................................................................................................................................................................................................................
Hedging Euro – 174,000....................................................................................................................................................................................................................................................
Hedging GBP – 144,000....................................................................................................................................................................................................................................................
Hedging JPY – 175,000,000....................................................................................................................................................................................................................................................
Term loans Hedging USD – 3,332,909....................................................................................................................................................................................................................................................
B Unhedged foreign currency exposures....................................................................................................................................................................................................................................................
Term loans USD 1,559,456 2,069,272....................................................................................................................................................................................................................................................
Imports Euro 1,879,000 –....................................................................................................................................................................................................................................................
CHF 125,000 –....................................................................................................................................................................................................................................................
USD 29,981 –....................................................................................................................................................................................................................................................
10) (a) During May, 2005, the Board of Directors had resolved disposal of the Company's retail clothing division, which was included in
the 'Textile Made-up' business segment. The process of disposing the division was substantially completed during the same year. As
at the end of current year, the carrying amount of assets of this discontinued operation was Rs 1.77 lac (previous year Rs 27.60 lac)
and liabilities were Rs 8.31 lac (previous year Rs 18.58 lac).
(b) In July, 2006, the Board of Directors resolved to initiate steps towards substantive downsizing of the Company's manufacturing
facility at Jammu in the State of Jammu & Kashmir, due to the unit's operations continuing to remain economically unviable.
Subsequently in October, 2006, the Board of Directors approved the voluntary retirement scheme for employees at Jammu unit and
made appropriate public disclosures.
Exceptional item represents Rs 2,224.53 lac as costs of termination and voluntary retirement scheme, less deferred tax credit Rs
756.12 lac, in respect of employees whose jobs were terminated as a result of the aforesaid exercise. All payments on this account
have been settled.
Necessary approval for closure from the state regulatory authorities was obtained in March, 2007 and informed to the Stock Exchange.
In May, 2007, the Board of Directors formally approved closure of the unit and relocation/disposal of its assets.

31
Maral Overseas Limited » Annual Report 2006-2007
Being an integrated manufacturing facility, Jammu unit's operations were included in the business segments of 'Fabric' & 'Textile
Made-ups'. Company expects to complete the process of disposing the division's assets within 2007-08. On basis of the Company's
decision to relocate Jammu's manufacturing capacity, the Management has concluded that there is no impairment loss.
As at the end of current year, the carrying amount of assets & third party liabilities of this discontinued operation were as follows:
Rs / lac....................................................................................................................................................................................................................................................
As at As at
31.3.2007 31.3.2006....................................................................................................................................................................................................................................................
Fixed assets (Net Block) 1,853.71 2,214.50....................................................................................................................................................................................................................................................
Capital work in progress – 27.91....................................................................................................................................................................................................................................................
Current assets, loans & advances 533.23 2,299.71....................................................................................................................................................................................................................................................
Total Assets 2,386.94 4,542.12....................................................................................................................................................................................................................................................
Secured loans 1,094.12 2,201.71....................................................................................................................................................................................................................................................
Unsecured loans – 500.00....................................................................................................................................................................................................................................................
Current liabilities 380.06 454.57....................................................................................................................................................................................................................................................
Total Liabilities 1,474.18 3,156.28....................................................................................................................................................................................................................................................
Since disposal of the retail clothing division was substantially completed during 2005-06 itself, the current year revenues and expenses
attributable to this division, not being material in nature, have for purposes of this statement been included alongwith the operating
results of the Jammu unit.
The following statement shows the revenue and expenses of continuing operations and discontinuing operation:
Rs /lac....................................................................................................................................................................................................................................................
Continuing Operations Discontinuing Operation Total
2006-07 2005-06 2006-07 2005-06 2006-07 2005-06....................................................................................................................................................................................................................................................
Net sales from operations 27649.39 19642.21 1342.49 4880.66 28991.88 24522.87....................................................................................................................................................................................................................................................
Interunit transactions (134.95) 665.21 134.95 (665.21)....................................................................................................................................................................................................................................................
Other income 477.67 416.49 49.72 124.17 587.39 570.66....................................................................................................................................................................................................................................................
Total income 27992.11 20723.92 1527.16 4339.62 29579.27 25093.54....................................................................................................................................................................................................................................................
Operating expenses 26158.61 19603.68 3123.83 4475.58 29342.44 24109.26....................................................................................................................................................................................................................................................
Pre-tax profit / (loss) from operations 1833.50 1120.24 (1596.67) (135.96) 236.83 984.28....................................................................................................................................................................................................................................................
Financial expenses 1460.74 1042.97 237.29 166.05 1698.03 1209.02....................................................................................................................................................................................................................................................
Interunit financial transactions (63.85) (33.93) 63.85 33.93....................................................................................................................................................................................................................................................
Profit / (loss) before tax & exceptional item 436.61 111.20 (1,897.81) (335.94) (1,461.20) (224.74)....................................................................................................................................................................................................................................................
Taxation (116.98) 158.00 596.00 116.18 479.02 274.18....................................................................................................................................................................................................................................................
Profit / (loss) before exceptional item 319.63 269.20 (1301.81) (219.76) (982.18) 49.44....................................................................................................................................................................................................................................................
Employee termination costs 2224.53 2224.53....................................................................................................................................................................................................................................................
Less: Deferred tax thereon (756.12) (756.12)....................................................................................................................................................................................................................................................
Profit / (loss) after exceptional item 319.63 269.20 (2770.22) (219.76) (2450.59) 49.44....................................................................................................................................................................................................................................................

32
11) Deferred taxes
Deferred taxes arise because of difference in treatment between financial accounting and tax accounting, known as "Timing differences".
The tax effect of these timing differences is recorded as "deferred tax assets" (generally items that can be used as a tax deduction or creditin future periods) and "deferred tax liabilities" (generally items for which the Company has received a tax deduction , but have not yet
been recorded in the statement of income).
The principal components of the net deferred tax balance are as follows :
Rs / lac....................................................................................................................................................................................................................................................
As at As at
31.3.2007 31.3.2006....................................................................................................................................................................................................................................................
Deferred tax liabilities....................................................................................................................................................................................................................................................
Depreciation 2,312.70 2,360.54....................................................................................................................................................................................................................................................
Intangibles 10.08 17.75....................................................................................................................................................................................................................................................
Deferred tax assets....................................................................................................................................................................................................................................................
Employee benefits 55.87 60.52....................................................................................................................................................................................................................................................
Provisions for expenses 63.30 66.49....................................................................................................................................................................................................................................................
Voluntary Retirement Scheme 502.44 –....................................................................................................................................................................................................................................................
Unabsorbed Depreciation and carried forward loss 1,834.61 1,100.24....................................................................................................................................................................................................................................................
Others 20.83 23.84....................................................................................................................................................................................................................................................
Net deferred tax liability / (assets) (154.27) 1,127.20....................................................................................................................................................................................................................................................
Based on schedule of reversal of timing differences giving rise to deferred tax liabilities, historical pre-tax earnings and projections for
future taxable income over the periods in which the deferred tax assets are deductible, management believes there is the requisite degreeof certainty that the deferred tax assets would be realised.
....................................................................................................................................................................................................................................................
2006-2007 2005-2006
Rs / lac Rs / lac....................................................................................................................................................................................................................................................
12) Auditors' remuneration....................................................................................................................................................................................................................................................
Audit Fee 8.00 6.00....................................................................................................................................................................................................................................................
Tax Audit 1.00 1.00....................................................................................................................................................................................................................................................
Certification 1.70 1.41....................................................................................................................................................................................................................................................
Reimbursement of Expenses 0.86 1.05....................................................................................................................................................................................................................................................
13) (a) Managerial Remuneration....................................................................................................................................................................................................................................................
Salary 24.00 6.00....................................................................................................................................................................................................................................................
Provident Fund Contribution 2.88 0.72....................................................................................................................................................................................................................................................
Contribution to Superannuation 3.60 0.90....................................................................................................................................................................................................................................................
30.48 7.62....................................................................................................................................................................................................................................................
The above excludes provisions for leave encashment and gratuity which are determined based on an actuarial valuation done on an
overall basis for the Company. As no commission is payable to the Managing Director, the computation of net profits in accordancewith Section 309 (5) read with Section 349 of the Companies Act, 1956, has not been given. Previous figures in respect of managerial
remuneration were for part of the year.

33
Maral Overseas Limited » Annual Report 2006-2007
(b) Payments to Directors....................................................................................................................................................................................................................................................
Sitting fee 11.40 12.00....................................................................................................................................................................................................................................................
11.40 12.00....................................................................................................................................................................................................................................................
14) Lease Commitments
The Company leases space for office and other facilities under various operating leases for periods ranging between three to five years
along with options that permit renewals for additional periods. The total amount recognised in the profit & loss account on account of
rental expense for operating leases for the year is Rs 124.62 lac (Previous year - Rs 119.09 lac).
Future minimum commitments in respect of the operating leases that have remaining non-cancelable terms are set out below.
Rs / lac....................................................................................................................................................................................................................................................
As at As at31.3.2007 31.3.2006
....................................................................................................................................................................................................................................................
Within one year 43.74 –....................................................................................................................................................................................................................................................
One year to five years 192.30 –....................................................................................................................................................................................................................................................
15) Earnings Per Share
Basic earning per share is computed by dividing the net profit or loss for the year available to equity shareholders by the weighted
average number of equity shares outstanding during the year. Diluted earnings per share is computed by dividing the net profit or loss for
the year by the weighted average number of equity shares in issue, adjusted for the effect of all dilutive potential equity shares that were
outstanding during the year. Dilutive potential equity shares are weighted for the period they were outstanding and are deemed converted
as of beginning of the year, unless they have been issued at a later date.
The following table sets forth the computation for basic and diluted earnings per share:
Rs / lac....................................................................................................................................................................................................................................................
2006-2007 2005-2006
Basic Diluted Basic Diluted....................................................................................................................................................................................................................................................
Numerator....................................................................................................................................................................................................................................................
Net income / (loss) for the year (2450.59) (2450.59) 49.44 49.44....................................................................................................................................................................................................................................................
Add: Interest (net of tax) – – – –....................................................................................................................................................................................................................................................
Net earnings / (loss) for per share calculation (2450.59) (2450.59) 49.44 49.44....................................................................................................................................................................................................................................................
Denominator....................................................................................................................................................................................................................................................
Weighted average number of equity shares 2,17,58,000 2,17,58,000 2,11,23,601 2,11,23,601....................................................................................................................................................................................................................................................
Dilutive potential equity shares – – – –....................................................................................................................................................................................................................................................
Total average equivalent shares 2,17,58,000 2,17,58,000 2,11,23,601 2,11,23,601....................................................................................................................................................................................................................................................
Net earnings / (loss) per share (Rs) (11.26) (11.26) 0.23 0.23....................................................................................................................................................................................................................................................
Nominal value per share (Rs) 10.00 10.00 10.00 10.00....................................................................................................................................................................................................................................................
Potential equity options may arise only in the event of default in payment due on certain loan funds. For the current year, diluted earnings
per share is the same as the basic calculation, as the inclusion of any equity options would be anti dilutive, but these options could be
dilutive in future.
....................................................................................................................................................................................................................................................
2006-2007 2005-2006
Rs / lac Rs / lac....................................................................................................................................................................................................................................................

34
16) Related Party Transactions
Following information regarding related parties has been determined on the basis of criteria specified in AS-18 "Related Party Disclosures".
a) Related parties with whom transactions have taken place.
i) Group A comprises of enterprise having key management in common with the Company.
– RSWM Ltd.
ii) Group B comprises of enterprises over which the key management personnel of the Company are able to exercise significant influence
– Mayur Knits (P) Ltd.
– Raghav Knits (P) Ltd.
– Jyoti Knits (P) Ltd.
– Essay Marketing Company Ltd.
iii) Group C comprises of key management personnel and their relatives
– Mr. Shekhar Agarwal
– Mrs. Shashi Agarwal
– Mr. Shantanu Agarwal
– Miss Shuchi Agarwal
2006-2007 2005-2006b) Sales to related parties (as a proportion to total turnover)
Group A 0.46% 2.02%
c) Purchase of materials from related parties (as a proportion to materials consumed)
Group A 3.75% 2.38%
d) Outstanding 'Due to' (as a proportion of trade creditors)
Group A 6.10% 3.96%
Group B 0.28% 1.06%
e) The Company paid Rs 47.61 lac (Previous year - Rs 40.61 lac) as rent for space occupied by them in the corporate head quarters
owned by RSWM.
f) In view of common occupation of the corporate head quarters by the Company alongwith RSWM and others, certain expenses
consisting primarily of proportionate common expenses of Rs 56.02 lac (Previous year - Rs 61.01 lac) were allocated by RSWM
towards Company's share. Likewise, expenses of Rs 3.27 lac (Previous year - Rs Nil) were allocated by the Company to RSWM.
g) The Company has received commission on export sales from RSWM of Rs Nil (Previous year - Rs 22.15 lac) as consideration for
marketing of the latter's products in certain overseas markets.
h) There were minor recoveries of Rs Nil (Previous year - Rs 4.35 lac) towards use of the Company's testing & other facilities by RSWM.
i) During the year Company raised a sum of Rs Nil (Previous year Rs 612.58 lac)through private placement of equity shares on
preferential basis to the promoters comprising of group 'B' & 'C' parties.
j) Company has paid to RSWM, job charges of Rs 20.44 lac (Previous year - Rs 59.61 lac) and interest on delayed payments ofRs 0.18 lac (Previous year Rs Nil).
k) Company has paid rent for lease of office premises to group 'C' parties of Rs 6.00 lac (Previous year - Rs 6.00 lac).
l) Company has purchased fixed assets of Rs Nil (Previous year Rs 5.87 lac) from a Group B enterprise.
m) Payment of remuneration to directors is as per note no.13 of this schedule.
17) Segment Information
The Company is currently organized into three business operating segments: Yarn, Fabric and Textile Made-ups. The Company's business
segments offer different products and require different technology and marketing strategies.
Yarn, covers bought out yarn as well as production of cotton yarn over a wide range of counts, which besides being primarily exported,
is also used for further value addition in fabric and garments. Fabric includes both bought out fabric as well as the value added activities
relating to knitting, dyeing and processing. Textile Made-ups, comprise of made-ups made for renowned international brands.
The accounting principles used in preparation of the financial statements are consistently applied to record revenue and expenditure in
individual segments and are as set out in the note on significant accounting policies.
Transfer prices for inter segment revenues are generally set on an arm's length basis and are eliminated in consolidation.
Revenue and direct expenses in relation to segments are categorized based on items that are individually identifiable or allocable on a
reasonable basis to that segment. Certain corporate level revenue and expenses, besides financial costs and taxes are not allocated to
operating segments and are included in "reconciliation".
Assets and liabilities represent assets (both tangible and intangible) employed in operations and liabilities owed to third parties that are
individually identifiable or allocable on a reasonable basis to that segment. Assets and liabilities excluded from allocation to operating
segments such as investments, corporate debt and taxes etc. are included in "reconciliation".

35
Maral Overseas Limited » Annual Report 2006-2007
Segment assets employed in the Company's various business segments are all located in India. Capital expenditure includes expenditureincurred during the period on acquisition of segment fixed assets.
Geographical revenues are segregated based on location of the customer who is invoiced. North America comprises the United States ofAmerica, Canada and Mexico; Europe includes continental Europe (both the east and west), Ireland and the United Kingdom; Africaincludes Mauritius; Asian continent has been segregated into the Middle East & Gulf countries while the rest of Asia, other than India hasbeen covered under Far East & South East Asia; Rest of the World comprises all other places except those mentioned above and India.
a) Segment data Rs / lac....................................................................................................................................................................................................................................................
Yarn Fabric Textile Reconciliation ConsolidatedMade-ups Total
....................................................................................................................................................................................................................................................
Sales....................................................................................................................................................................................................................................................
External 13,459 4,231 11,302 – 28,992(11,419) (3,257) (9,847) (–) (24,523)
....................................................................................................................................................................................................................................................
Inter segment 1,325 5,122 – (-)6,447 --(2,322) (4,398) (–) (-6,720) (–)
....................................................................................................................................................................................................................................................
Total revenue 14,784 9,353 11,302 (-)6,447 28,992(13,741) (7,655) (9,847) (-6,720) (24,523)
....................................................................................................................................................................................................................................................
Segment result (Continuing) 1,162 425 185 – 1,772(1,531) (33) (-481) (1,083)
....................................................................................................................................................................................................................................................
Segment result (Discontinuing) – (471) (1,134) – (-) 1,605(–) (82) (-225) (–) (-143)
....................................................................................................................................................................................................................................................
Other income 0 0(1) (1)
....................................................................................................................................................................................................................................................
Unallocated expense (-)69 (-)69(-39) (-39)
....................................................................................................................................................................................................................................................
Employee termination costs (-)2,225 (-)2,225(–) (–)
....................................................................................................................................................................................................................................................
Financial costs (-)1,559 (-)1,559(-1,127) (-1,127)
....................................................................................................................................................................................................................................................
Taxes 1,235 1,235(274) (274)
....................................................................................................................................................................................................................................................
Net profit 1,162 (-)46 (-)949 (-)2,618 (-)2,451(1,531) (115) (-706) (-891) (49)
....................................................................................................................................................................................................................................................
Assets 25,141 6,172 6,850 1,473 39,636(18,502) (6,693) (6,773) (534) (32,502)
....................................................................................................................................................................................................................................................
Liabilities 1,899 589 1,091 181 3,760(609) (360) (866) (80) (1,915)
....................................................................................................................................................................................................................................................
Capital employed 23,242 5,583 5,759 1,292 35,876(17,893) (6,333) (5,907) (454) (30,587)
....................................................................................................................................................................................................................................................
Capital expenditure 419 379 387 – 1,185(2,485) (2,904) (147) (–) (5,536)
....................................................................................................................................................................................................................................................
Non cash expense....................................................................................................................................................................................................................................................
Depreciation & Amortisation 1,006 426 270 – 1,702(865) (450) (331) (–) (1,646)
....................................................................................................................................................................................................................................................
Other non cash expense 19 – 4 – 23(13) (9) (8) (–) (30)
....................................................................................................................................................................................................................................................
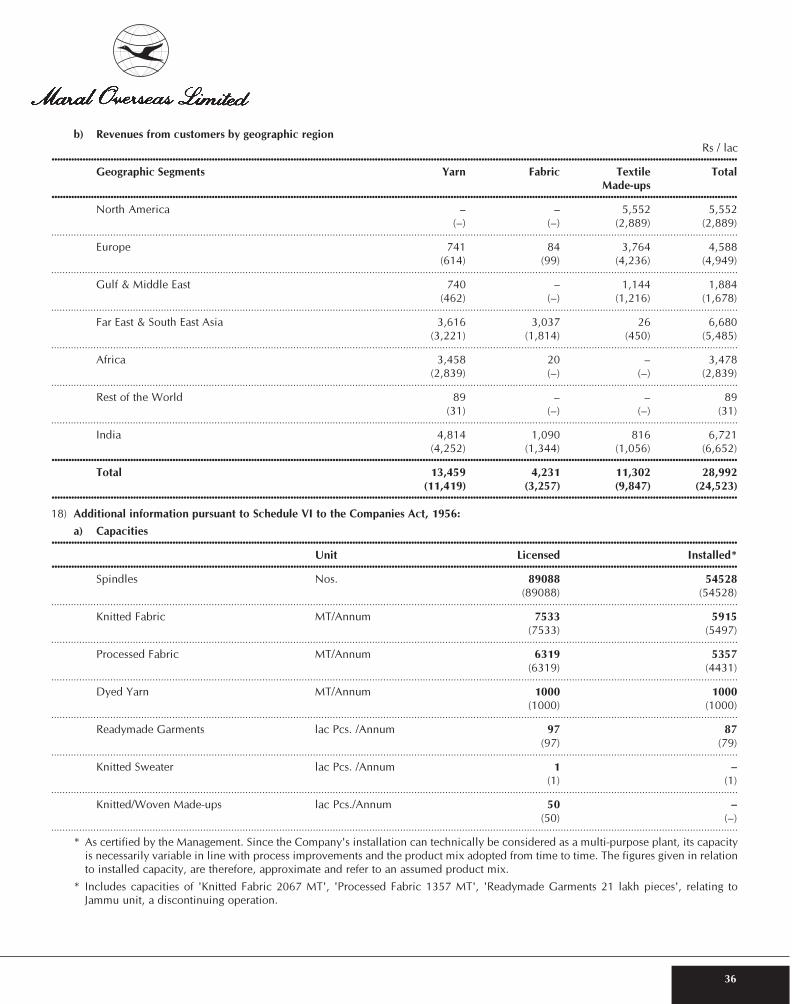
36
b) Revenues from customers by geographic region
Rs / lac....................................................................................................................................................................................................................................................
Geographic Segments Yarn Fabric Textile Total
Made-ups....................................................................................................................................................................................................................................................
North America – – 5,552 5,552
(–) (–) (2,889) (2,889)....................................................................................................................................................................................................................................................
Europe 741 84 3,764 4,588(614) (99) (4,236) (4,949)
....................................................................................................................................................................................................................................................
Gulf & Middle East 740 – 1,144 1,884
(462) (–) (1,216) (1,678)....................................................................................................................................................................................................................................................
Far East & South East Asia 3,616 3,037 26 6,680
(3,221) (1,814) (450) (5,485)....................................................................................................................................................................................................................................................
Africa 3,458 20 – 3,478
(2,839) (–) (–) (2,839)....................................................................................................................................................................................................................................................
Rest of the World 89 – – 89
(31) (–) (–) (31)....................................................................................................................................................................................................................................................
India 4,814 1,090 816 6,721(4,252) (1,344) (1,056) (6,652)
....................................................................................................................................................................................................................................................
Total 13,459 4,231 11,302 28,992
(11,419) (3,257) (9,847) (24,523)....................................................................................................................................................................................................................................................
18) Additional information pursuant to Schedule VI to the Companies Act, 1956:
a) Capacities....................................................................................................................................................................................................................................................
Unit Licensed Installed*....................................................................................................................................................................................................................................................
Spindles Nos. 89088 54528
(89088) (54528)....................................................................................................................................................................................................................................................
Knitted Fabric MT/Annum 7533 5915
(7533) (5497)....................................................................................................................................................................................................................................................
Processed Fabric MT/Annum 6319 5357(6319) (4431)
....................................................................................................................................................................................................................................................
Dyed Yarn MT/Annum 1000 1000
(1000) (1000)....................................................................................................................................................................................................................................................
Readymade Garments lac Pcs. /Annum 97 87
(97) (79)....................................................................................................................................................................................................................................................
Knitted Sweater lac Pcs. /Annum 1 –
(1) (1)....................................................................................................................................................................................................................................................
Knitted/Woven Made-ups lac Pcs./Annum 50 –
(50) (–)....................................................................................................................................................................................................................................................
* As certified by the Management. Since the Company's installation can technically be considered as a multi-purpose plant, its capacity
is necessarily variable in line with process improvements and the product mix adopted from time to time. The figures given in relation
to installed capacity, are therefore, approximate and refer to an assumed product mix.
* Includes capacities of 'Knitted Fabric 2067 MT', 'Processed Fabric 1357 MT', 'Readymade Garments 21 lakh pieces', relating toJammu unit, a discontinuing operation.

37
Maral Overseas Limited » Annual Report 2006-2007
b) Production, Turnover & Stocks
Rs / lac
Opening Production % / Captive Turnover Closing
Stock Purchases Consumption Stock
Unit Qty. Value Qty. Value Qty. Qty. Value Qty. Value
Yarn MT 686.775 742.69 13,310.469 * – 4,082.402 9,688.772 11,658.76 226.070 337.38
(462.038) (540.47) (13,143.727) (–) (3,655.242) (9,263.748) (10,145.90) (686.775) (742.69)....................................................................................................................................................................................................................................................
Dyed Yarn MT 31.564 46.56 656.562 – 305.944 346.596 605.17 35.586 50.95
(–) (–) (164.151) (–) (87.493) (45.094) (87.73) (31.564) (46.56)....................................................................................................................................................................................................................................................
Knitted Fabric MT 264.570 385.86 3,699.377 # – 3,648.500 147.588 144.44 167.859 246.10
(166.423) (235.82) (3,574.312) (–) (3,393.408) (82.757) (71.51) (264.570) (385.86)....................................................................................................................................................................................................................................................
Processed Fabric MT 302.982 726.37 3,835.326 ^ – 2,212.025 1,662.374 3,932.85 263.909 626.24
(163.075) (395.23) (3,240.781) (–) (2,139.060) (961.814) (3,145.32) (302.982) (726.37)....................................................................................................................................................................................................................................................
Woven Fabric Mtrs in lac – – – – – – – – –
(0.010) (0.44) (–) (–) (–) (0.01) (0.14) – (–)....................................................................................................................................................................................................................................................
Garments / Made-ups Lac Pcs 9.391 1,243.81 60.652 @ – – 60.518 10,859.20 9.525 1,178.86
(5.870) (951.07) (67.772) (–) – (64.251) (9,439.04) (9.391) (1,243.81)....................................................................................................................................................................................................................................................
Cotton/Other Waste MT 43.357 11.70 5,257.561 – – 5,247.460 1,440.76 53.458 11.50
(33.749) (8.82) (5,472.293) (–) – (5,462.685) (1,430.65) (43.357) (11.70)....................................................................................................................................................................................................................................................
Unit 2006-2007 2005-2006
Notes:
* Includes outside production/purchases MT 1,562.663 1,356.901
# Includes outside production/purchases MT 658.224 724.924
^ Includes outside processing/purchases MT 976.378 289.407
@ Includes purchases lac Pcs 0.133 0.150
% Production excludes quantities produced for third parties under contract with the Company
2006-2007 2005-2006
Value Value
Unit Qty. Rs / lac Qty. Rs / lac
c) Raw Material Consumed....................................................................................................................................................................................................................................................
Cotton MT 17,480.139 9,115.78 16,371.131 7,817.62....................................................................................................................................................................................................................................................
Yarn purchased MT 1,562.663 2,246.28 1,318.530 2,012.87....................................................................................................................................................................................................................................................
Fabrics purchased MT 475.641 1,184.13 215.984 402.37....................................................................................................................................................................................................................................................
12,546.19 10,232.86....................................................................................................................................................................................................................................................
d) Value of Imports calculated on CIF basis in respect of :....................................................................................................................................................................................................................................................
Raw Materials 1,785.39 754.81....................................................................................................................................................................................................................................................
Stores & Spares (including Dyes,Chemicals & Embellishments) 722.65 2,304.24....................................................................................................................................................................................................................................................
Capital Goods 1,630.34 1,984.78....................................................................................................................................................................................................................................................

38
2006-2007 2005-2006
Value Value
Rs / lac Rs / lac....................................................................................................................................................................................................................................................
e) Expenditure in Foreign Currency....................................................................................................................................................................................................................................................
Travelling 47.19 31.61....................................................................................................................................................................................................................................................
Commission and others 415.09 281.40....................................................................................................................................................................................................................................................
Interest 114.71 161.33....................................................................................................................................................................................................................................................
f) Earnings in Foreign Currency....................................................................................................................................................................................................................................................
FOB value of Exports 20,576.48 17,771.42....................................................................................................................................................................................................................................................
Others (Freight, Insurance, Claims etc.) 616.16 311.85....................................................................................................................................................................................................................................................
2006-2007 2005-2006
Value Value
Rs / lac % Rs / lac %....................................................................................................................................................................................................................................................
g) Details of imported and indigenous
Raw Material & Stores consumed....................................................................................................................................................................................................................................................
Raw Material....................................................................................................................................................................................................................................................
– Imported 733.60 5.85 754.81 7.38....................................................................................................................................................................................................................................................
– Indigenous 11,812.59 94.15 9,478.05 92.62....................................................................................................................................................................................................................................................
Stores & Spares
(including Dyes, Chemicals & Embellishments)....................................................................................................................................................................................................................................................
– Imported 514.54 19.21 47.33 1.86....................................................................................................................................................................................................................................................
– Indigenous 2,163.29 80.79 2,493.63 98.14....................................................................................................................................................................................................................................................
18) a) Figures in brackets, wherever given, are in respect of previous year.
b) Previous year's figures have been regrouped and recast wherever considered necessary.
The Schedules referred to in Balance Sheet and Profit & Loss Account form an integral part of the accounts.
Signed for identification Schedule 1 to 16
For Doogar & Associates For Ashim & Associates Ravi Jhunjhunwala
Chartered Accountants Chartered Accountants Chairman
Mukesh Goyal Ashim Agarwal Shekhar Agarwal
Partner Partner Managing Director
Membership No.81810 Membership No. 84968P.S. Puri
Chief Financial Officer
Noida (U.P.) Rajat Prothi
5th May, 2007 Company Secretary

39
Maral Overseas Limited » Annual Report 2006-2007
SCHEDULE - VI
PART - IV
BALANCE SHEET ABSTRACT & COMPANY’S GENERAL BUSINESS PROFILE
I. Registration Details
Registration No. State Code
Balance Sheet Date
II. Capital Raised during the year (Amount in Rupees Thousands)
Public Issue Right Issue
Bonus Issue Private Placement
III. Position of Mobilisation and Deployment of Funds (Amount in Rupees Thousands)
Total Liabilities Total Assets
Sources of Funds Application of Funds
Paid-up Capital Net Fixed Assets
Reserves & Surplus Investments
Secured Loans Net Curret Assets
Unsecured Loans Miscellaneous Expenditure
Deferred Tax Liability Accumulated Losses
Deferred Tax Assets
IV. Performance of Company (Amount in Rupees Thousands)
Net Turnover Total Expenditure
+/- Profit/Loss before tax +/- Profit/Loss after tax
Earning per share (in Rs) Dividend Rate (%)
V. Generic Names of Three Principal Products / Services of the Company (As per monetary terms)
Item Code No. (ITC Code) Product Description
Item Code No. (ITC Code) Product Description
Item Code No. (ITC Code) Product Description
0 0 0 0 8 2 5 5
3 1 0 3 2 0 0 7
1 0
N I L
N I L
3 6 6 9 4 8 9
2 1 7 5 8 0
4 7 1 3 5 4
2 7 8 3 0 5 5
- 3 6 8 5 7 3
2 8 9 9 1 8 8
(-) 1 1 . 2 6
N I L
1 9 7 5 0 0
N I L
N I L
3 6 6 9 4 8 9
2 5 4 0 6 9 9
1 3 7 9
1 0 4 2 3 1 4
- 2 4 5 0 5 9
3 2 6 7 7 6 1
N I L
6 6 7 0 3
2 9 6 7
Ravi Jhunjhunwala
Chairman
Shekhar Agarwal
Managing Director
P.S. Puri
Chief Financial Officer
Noida (U.P.) Rajat Prothi
5th May, 2007 Company Secretary
5 2 . 0 0 C O T T O N C O M B E D H O S I E R Y Y A R N
C O T T O N K N I T T E D F A B R I C
C O T T O N K N I T T E D G A R M E N T
6 0 . 0 0
6 1 . 0 0
1 5 4 2 7

40
CASH FLOW STATEMENT FOR THE YEAR ENDED 31ST MARCH, 2007 Rs / lac
Year Ended Year Ended31.3.2007 31.3.2006
A. CASH FLOW FROM OPERATING ACTIVITIES....................................................................................................................................................................................................................................................
Net Profit / (Loss ) before Tax & Exceptional Item (1,461.20) (224.74)....................................................................................................................................................................................................................................................
Employee Termination costs (2,224.53) –....................................................................................................................................................................................................................................................
Net Profit / (Loss ) before tax (3,685.73) (224.74)....................................................................................................................................................................................................................................................
Adjustments for:....................................................................................................................................................................................................................................................
Depreciation & Amortisation 1,701.71 1,646.24....................................................................................................................................................................................................................................................
Dividend received (0.36) (0.56)....................................................................................................................................................................................................................................................
Interest Cost 1,490.27 1,040.50....................................................................................................................................................................................................................................................
Unrealised Exchange Difference (29.99) 63.27....................................................................................................................................................................................................................................................
Diminution in value of investments (1.87) 5.85....................................................................................................................................................................................................................................................
(Profit)/Loss on sale of Fixed Assets (Net) (137.84) (22.29)....................................................................................................................................................................................................................................................
Miscellaneous Expenditure written off 23.06 30.01....................................................................................................................................................................................................................................................
Operating profit before working capital changes (640.75) 2,538.28....................................................................................................................................................................................................................................................
Adjustments for:....................................................................................................................................................................................................................................................
Trade Receivables (530.09) 666.83....................................................................................................................................................................................................................................................
Inventories....................................................................................................................................................................................................................................................
Raw Material & Packing Material 711.43 (1,396.40)....................................................................................................................................................................................................................................................
Stock in process (68.40) 89.40....................................................................................................................................................................................................................................................
Finished Goods & Waste 705.96 (1,025.15)....................................................................................................................................................................................................................................................
Stores, Spares & Others 45.54 (226.08)....................................................................................................................................................................................................................................................
1,394.53 (2,558.23)....................................................................................................................................................................................................................................................
Loans & Advances (412.85) (410.00)....................................................................................................................................................................................................................................................
Trade Payables 1,849.94 139.17....................................................................................................................................................................................................................................................
Provisions (15.42) (0.13)....................................................................................................................................................................................................................................................
1,834.52 139.04....................................................................................................................................................................................................................................................
Deferred Revenue Expenditure – (10.00)....................................................................................................................................................................................................................................................
Cash from operating activities 1,645.36 365.92....................................................................................................................................................................................................................................................
Taxes Paid (60.80) (35.44)....................................................................................................................................................................................................................................................
Net cash from operating activities 1,584.56 330.48....................................................................................................................................................................................................................................................
B. CASH FLOW FROM INVESTING ACTIVITIES:....................................................................................................................................................................................................................................................
Purchase of fixed assets (8,479.28) (5,443.34)....................................................................................................................................................................................................................................................
Sale/Adjustment of fixed assets 223.15 36.41....................................................................................................................................................................................................................................................
Interest received 15.05 14.99....................................................................................................................................................................................................................................................
Dividend received 0.36 0.56....................................................................................................................................................................................................................................................
Net Cash used in investing activities (8,240.72) (5,391.38)....................................................................................................................................................................................................................................................

41
Maral Overseas Limited » Annual Report 2006-2007
Rs / lac
Year Ended Year Ended31.3.2007 31.3.2006
As per our report of even dateFor Doogar & Associates For Ashim & Associates Ravi JhunjhunwalaChartered Accountants Chartered Accountants Chairman
Mukesh Goyal Ashim Agarwal Shekhar AgarwalPartner Partner Managing DirectorMembership No.81810 Membership No. 84968
P.S. PuriChief Financial Officer
Noida (U.P.) Rajat Prothi5th May, 2007 Company Secretary
C. CASH FLOW FROM FINANCING ACTIVITIES:....................................................................................................................................................................................................................................................
Proceeds from increase in Share Capital – 612.58....................................................................................................................................................................................................................................................
Receipts from Term & Other Borrowings 12,718.60 7,168.19....................................................................................................................................................................................................................................................
Increase/ (Decrease) in Short Term Bank Borrowings 338.35 2,545.34....................................................................................................................................................................................................................................................
13,056.95 10,326.11....................................................................................................................................................................................................................................................
Repayment of Term & Other Borrowings (4,061.05) (4,108.69)....................................................................................................................................................................................................................................................
Interest Cost (1,672.36) (1,164.26)....................................................................................................................................................................................................................................................
(5,733.41) (5,272.95)....................................................................................................................................................................................................................................................
Net Cash from financing activities 7,323.54 5,053.16....................................................................................................................................................................................................................................................
Net increase in Cash and Cash equivalents 667.38 (7.74)....................................................................................................................................................................................................................................................
Opening Cash and Cash equivalents 237.07 244.81....................................................................................................................................................................................................................................................
Closing Cash and Cash equivalents 904.45 237.07....................................................................................................................................................................................................................................................
Notes: 1. Cash and cash equivalents consist of cash on hand and demand deposits with bank.2. Cash and cash equivalents included in the cash flow statement comprise of the following amounts:
....................................................................................................................................................................................................................................................
Cash, Cheques & Stamps in hand 50.64 201.48....................................................................................................................................................................................................................................................
Balances with Bank 891.17 95.57....................................................................................................................................................................................................................................................
Post Office Saving Account 0.01 0.01....................................................................................................................................................................................................................................................
As per the Balance Sheet 941.82 297.06....................................................................................................................................................................................................................................................
Less:Deposits under lien 6.55 5.88....................................................................................................................................................................................................................................................
Margin Money Account 5.43 6.27....................................................................................................................................................................................................................................................
Unpaid Dividend Account 14.58 21.02....................................................................................................................................................................................................................................................
Employees Security – Savings Account 0.81 5.10....................................................................................................................................................................................................................................................
– Deposit Account 10.00 21.72....................................................................................................................................................................................................................................................
37.37 59.99....................................................................................................................................................................................................................................................
Closing cash & cash equivalents as restated 904.45 237.07....................................................................................................................................................................................................................................................
3. Cash flows of continuing operations and discontinuing operation are:
Continuing Operations Discontinuing Operation Total
2006-07 2005-06 2006-07 2005-06 2006-07 2005-06....................................................................................................................................................................................................................................................
Net cash from / (used in) operating activities 3,439.47 555.77 (1,854.91) (225.28) 1,584.56 330.48....................................................................................................................................................................................................................................................
Net cash from / (used in) investing activities (8,289.64) (4,684.75) 48.92 (706.63) (8,240.72) (5,391.38)....................................................................................................................................................................................................................................................
Net cash from / (used in) financing activities 9,216.39 4,303.03 (1,892.84) 750.13 7,323.55 5,053.15....................................................................................................................................................................................................................................................
4. Previous year’s figures have been rearranged wherever necessary....................................................................................................................................................................................................................................................

42
FINANCIAL INDICATORS(Rs / lac)
S.NO. DESCRIPTION 2002-2003 2003-2004 2004-2005 2005-2006 2006-2007
1 Net Turnover 26,574.48 23,824.32 24,864.12 24,522.87 28,991.88....................................................................................................................................................................................................................................................
2 PBIDT 3,544.58 (259.03) 2,853.07 2,630.52 (286.00)....................................................................................................................................................................................................................................................
3 Interest....................................................................................................................................................................................................................................................
– Long Term 766.82 681.85 592.43 626.91 728.55....................................................................................................................................................................................................................................................
– Short Term 466.40 523.81 429.18 582.11 969.48....................................................................................................................................................................................................................................................
– Total 1,233.22 1,205.66 1,021.61 1,209.02 1,698.03....................................................................................................................................................................................................................................................
4 Depreciation 2,038.93 2,142.86 1,825.44 1,646.24 1,701.70....................................................................................................................................................................................................................................................
5 PBT 272.43 (3,607.55) 6.02 (224.74) (3,685.73)....................................................................................................................................................................................................................................................
6 Provision for Income Tax (38.42) (1,288.27) (102.94) (274.18) (1,235.14)....................................................................................................................................................................................................................................................
7 PAT 310.85 (2,319.28) 108.96 49.44 (2,450.59)....................................................................................................................................................................................................................................................
8 EPS(Weighted Avg.) 1.48 (11.30) 0.53 0.23 (11.26)....................................................................................................................................................................................................................................................
9 Equity Capital 2,053.28 2,053.28 2,053.28 2,175.80 2,175.80....................................................................................................................................................................................................................................................
10 Preference Capital – – – – –....................................................................................................................................................................................................................................................
11 Return on Net Worth
(PAT/Net Worth) 3.00 (28.73) 1.37 0.57 (39.57)....................................................................................................................................................................................................................................................
12 Interest Cover #(PBIDT-Tax)/Interest 3.17 0.83 3.25 2.63 0.56
....................................................................................................................................................................................................................................................
13 Debt - Equity 0.74 1.00 1.28 1.54 3.54....................................................................................................................................................................................................................................................
14 Return on Sales 1.17 (9.73) 0.44 0.20 (8.45)....................................................................................................................................................................................................................................................
1 Total Capital Employed 26,523.72 23,888.26 24,560.94 30,586.99 35,998.19....................................................................................................................................................................................................................................................
2 Net Worth 10,129.57 8,072.98 7,938.13 8,620.16 6,192.64....................................................................................................................................................................................................................................................
3 Total Debt 13,324.72 14,034.12 15,171.52 20,839.63 29,805.54....................................................................................................................................................................................................................................................
4 Term Debt 7,511.33 8,045.61 10,189.65 13,312.42 21,939.98....................................................................................................................................................................................................................................................
5 Gross Fixed Assets 27,685.49 28,291.30 29,516.97 34,656.57 42,756.34

43
Maral Overseas Limited » Annual Report 2006-2007
FINANCIAL STATISTICS
CAPITAL ACCOUNT (Rs / lac)
YEAR CAPITAL RESERVES NETWORTH
2002-2003 2053.28 8573.56 10129.57....................................................................................................................................................................................................................................................
2003-2004 2053.28 6254.29 8072.98....................................................................................................................................................................................................................................................
2004-2005 2053.28 5957.59 7938.13....................................................................................................................................................................................................................................................
2005-2006 2175.80 6497.10 8620.16....................................................................................................................................................................................................................................................
2006-2007 2175.80 4046.51 6192.64
QUANTITATIVE DATA
PROCESSEDYEAR YARN FABRIC FABRIC GARMENT
MT MT MT LAC PCS
PRODUCTION....................................................................................................................................................................................................................................................
2002-2003 12166.63 2981.52 2463.72 65.77....................................................................................................................................................................................................................................................
2003-2004 9952.95 1920.62 1678.65 42.10....................................................................................................................................................................................................................................................
2004-2005 11846.61 2224.72 2087.67 46.21....................................................................................................................................................................................................................................................
2005-2006 11786.83 2849.39 2951.37 67.62....................................................................................................................................................................................................................................................
2006-2007 11747.81 3041.15 2858.95 60.52....................................................................................................................................................................................................................................................
SALES....................................................................................................................................................................................................................................................
2002-2003 11051.53 680.52 554.31 66.67....................................................................................................................................................................................................................................................
2003-2004 9738.05 622.96 818.84 45.42....................................................................................................................................................................................................................................................
2004-2005 10199.69 483.26 709.21 45.79....................................................................................................................................................................................................................................................
2005-2006 9263.75 82.76 961.81 64.25....................................................................................................................................................................................................................................................
2006-2007 9688.77 147.59 1662.37 60.52
REVENUE ACCOUNT(Rs / lac)
YEAR NET SALES OPERATING COST PBIDT INTEREST DEPRECIATION PBT TAX PAT
RAW PACKING VALUE
MATERIAL COST ADDED....................................................................................................................................................................................................................................................
2002-2003 26,574.48 13,918.84 560.70 12,094.94 3,544.58 1,233.22 2,038.93 272.43 (38.42) 310.85....................................................................................................................................................................................................................................................
2003-2004 23,824.32 12,853.02 421.43 10,549.87 (259.03) 1,205.66 2,142.86 (3,607.55) (1,288.27) (2,319.28)....................................................................................................................................................................................................................................................
2004-2005 24,864.12 13,419.19 350.96 11,093.96 2,853.07 1,021.61 1,825.44 6.02 (102.94) 108.96....................................................................................................................................................................................................................................................
2005-2006 24,522.88 12,452.24 451.59 11,619.05 2,630.52 1,209.02 1,646.24 (224.74) (274.18) 49.44....................................................................................................................................................................................................................................................
2006-2007 28,991.88 15,109.49 525.21 13,357.00 (286.00) 1,698.03 1,701.70 (3,685.73) (1,235.14) (2,450.59)

44
CERTIFICATION BY CHIEF EXECUTIVE OFFICER AND CHIEF FINANCIAL OFFICER OF THECOMPANY
We, Shekhar Agarwal, Managing Director and P.S. Puri, Chief Financial Officer, of Maral Overseas Limited, hereby certify to theBoard that:
(a) We have reviewed financial statements and the cash flow statement for the year and that to the best of our knowledge andbelief:
(i) These statements do not contain any materially untrue statement or omit any material fact or contain statements thatmight be misleading;
(ii) These statements together present a true and fair view of the Company's affairs and are in compliance with existingaccounting standards, applicable laws and regulations.
(b) There are, to the best of our knowledge and belief, no transactions entered into by Maral Overseas Limited during the yearwhich are fraudulent, illegal or violative of the Company's Code of Conduct.
(c) We are responsible for establishing and maintaining internal controls for financial reporting in Maral Overseas Limited andwe have evaluated the effectiveness of the internal control systems of the Company pertaining to financial reporting. Wehave disclosed to the auditors and the Audit Committee, deficiencies in the design or operation of such internal controls,if any, of which we are aware and the steps we have taken or propose to take to rectify these deficiencies.
(d) We have indicated to the auditors and the Audit Committee
(i) Significant changes in internal control over financial reporting during the year;
(ii) Significant changes in accounting policies during the year and the same have been disclosed in the notes to thefinancial statements; and
(iii) Instances of significant fraud of which we have become aware and the involvement therein, if any, of the managementor an employee having a significant role in the Company's internal control system.
(e) We affirm that we have not denied any personnel access to the Audit Committee of the Company (in respect of mattersinvolving alleged misconduct).
(f) We further declare that all Board members and designated senior management have affirmed compliance with the Code ofConduct for the current year.
Noida (U.P.) Shekhar Agarwal P. S. Puri5th May, 2007 Managing Director Chief Financial Officer
CERTIFICATE OF COMPLIANCE FROM AUDITORS AS STIPULATED UNDER CLAUSE 49 OF THELISTING AGREEMENT
To the Members ofMaral Overseas Limited
We have examined the compliance of conditions of Corporate Governance by Maral Overseas Limited, for the year ended on 31st March,2007, as stipulated in Clause 49 of the Listing Agreement of the said Company with Stock Exchanges.
The compliance of conditions of Corporate Governance is the responsibility of the Management. Our examination was limited to proceduresand implementation thereof, adopted by the Company for ensuring the compliance of the conditions of the Corporate Governance. It isneither an audit nor an expression of opinion on the financial statements of the Company.
In our opinion and to the best of our information and according to the explanations given to us, we certify that the Company has compliedwith the conditions of Corporate Governance as stipulated in the above mentioned Listing Agreement.
We state that no investor grievance is pending for a period exceeding one month against the Company as per the records maintained by theShareholders/ Investors Grievance Committee.
We further state that such compliance is neither an assurance as to the future viability of the Company nor the efficiency or effectiveness withwhich the management has conducted the affairs of the Company.
For Doogar & Associates For Ashim & AssociatesChartered Accountants Chartered Accountants
Mukesh Goyal Ashim AgarwalPartner Partner
Noida (U.P.)5th May, 2007

A. TEXTILES
RSWM Limited
1. Kharigram Synthetic, Regenerated Cellulosic Blended Grey, Dyed Yarn
2. Mayur Nagar, Banswara Synthetic, Regenerated Cellulosic & Cotton-blended Grey Yarn
3. Mandpam Cotton Melange Yarn, Cotton-blended Melange & Dyed Yarn
4. Rishabhdev Synthetic, Blended & Grey Yarn
5. Ringas Synthetic & Blended Dyed Yarn
6. Bangalore Apparel
7. LNJ Nagar, Mordi Fabric
8. LNJ Nagar, Mordi Denim
9. LNJ Nagar, Mordi Captive Thermal Power
10. Bagalur Cotton Yarn
Maral Overseas Ltd.
11. Maral Sarovar Cotton Yarn, Cotton-Knitted Fabric & Cotton Knitwears(100% EOU)
12. Maral Sarovar Captive Thermal Power
13. Noida Knitwears
14. Noida Knitwears
BSL Ltd.
15. Bhilwara Yarn, Worsted, Synthetic & Silk Fabric, Garments & Accessories
16. Jaisalmer Captive Wind Power Generation
Bhilwara Spinners Ltd.
17. Bhilwara Synthetic, Blended Grey & Dyed Yarn
BMD Pvt. Ltd.
18. LNJ Nagar, Mordi Specialised Automotive Fabric & Furnishing Fabric
Bhilwara Processors Ltd.
19. Bhilwara Processing of Synthetic & Worsted Fabric, Tops Fibre Dyeing
B. GRAPHITE
HEG Ltd.
20. Mandideep Graphite Electrodes
21. Mandideep Captive Thermal Power
22. Durg Steel Billets
23. Durg Captive Waste Heat Recovery Power
24. Tawa Captive Hydro Electric Power
C. POWER
Bhilwara Energy Ltd.
25. Pathankot UBDC Stage III Hydro Electric Power Generation
26. Tawang Nyamjung Chhu Hydro Electric Power Generation
Malana Power Company Ltd.
27. Malana (Kullu) Hydro Electric Power Generation
AD Hydro Power Ltd.
28. Allain-Duhangan Hydro Electric Power Generation(Manali)
Indo Canadian Consultancy Services Ltd.
29. Noida Power Engineering Services
D. INFORMATION TECHNOLOGY
Bhilwara Scribe Pvt. Ltd.
30. Bhopal Medical Transcription Services
Bhilwara Infotech Ltd.
31. Bangalore IT Services
E. OFFICES
Corporate Office
32. Noida (NCR - Delhi)
Regional / Marketing
33. Mumbai 34. Kolkata 35. Bangalore 36. New Delhi
37. Ludhiana 38. Amritsar 39. Bhilwara
1
3
5
2
4
9
8
7
6
12
11
1413
1516
17
18
19
21 20
24
23
22
25
26
2728
29
30
3135
32
33
37
36
38
LNJ BHILWARA GROUP
A NATIONWIDE PRESENCE
39
Thi
s is
on
ly a
n i
ndi
cati
ve m
ap
34
10

the Group Companies
Graphite Electrode
Automotive Fabric
Power Generation
Power Generation
Yarn
Suitings
LIMITED
Textilesan LNJ Bhilwara Group Company
Knitted Garments
Power Generation
Power Engineering Consultancy
the Group Brands
Yarn
Fabric
Garments
Suitings
Suitings
the Group PartnershipsCompany Partner with Activity
Statkraft Norfund Malana Power 192 MW Hydro-Power Invest A.S., Norway Co. Ltd. electric Power Project
RSW International, ICCS Ltd. Power ConsultancyCanada Services
International Finance AD Hydro Equity holders in Corporation, Washington Power Ltd. AD Hydro Power Project
Tencel, UK RSWM Ltd. Tencel Yarn (now Lenzing, Austria) Spinning
Trevira GmbH, Germany RSWM Ltd. Flame Retardant Yarn & Fabric
eScribe Inc., USA Bhilwara Scribe IT Enabled ServicesPvt. Ltd.
Enercon (India), BSL Ltd. Wind Energy Projecta subsidiary of Enercon(Germany)
SISA S.A., Spain RSWM Ltd. Yarn Marketing
Information Technology
Medical Transcription Services
Corporate Office :
Bhilwara Towers, A-12 Sector I, Noida-201301 (NCR Delhi) India
Website : www.maraloverseas.com www.lnjbhilwara.com