march 2020 – august 2020
TRANSCRIPT

NAF Report 29th PeriodMarch 2020 – August 2020
Nippon Accommodations Fund Inc. | 4-1, Nihonbashi 1-chome, Chuo-ku, Tokyo | https://www.naf-r.jp/english/


1
Contents
Strategies and Features of NAF ............................................. 2
To Our Stakeholders ............................................................. 4
Financial Highlights .............................................................. 5
Status of Portfolio ................................................................ 6
Portfolio Map ....................................................................... 7
Sustainability Initiatives ........................................................ 8
Portfolio Summary .............................................................. 10
Management’s Discussion and Analysis ............................... 13
Financial Statements ........................................................... 22
Notes to Financial Statements ............................................. 26
Independent Auditor’s Report ............................................. 38
Summary of REIT ................................................................ 41
Summary of Asset Management Company .......................... 42
Status of Unitholders .......................................................... 43
Disclaimer .......................................................................... 44
* The forecasted figures are calculated based on certain assumptions as of October 19, 2020. The actual figures may change due to various factors including fluctuations in rent revenues owing to changes in tenants and other factors, changes in properties, fluctuation in interest, and additional issuance of investment units. Accordingly, the forecasts are not a guarantee of any cash distribution amount, etc. The forecasted figures are stated based on the details announced in the Financial Results for the Fiscal Period from March 1, 2020 to August 31, 2020 released on October 19, 2020.
(Please view the above Financial Results from the NAF website (https://www.naf-r.jp/english/).)
DistributionConfirmed distribution
Expected distribution
Expected distribution
29th Period (Aug.20)
Per unit
30th Period (Feb.21)
Per unit
31st Period (Aug.21)
Per unit
¥10,108
¥10,080
¥9,910

2
Strategies and Features of NAF
1. Investment in Accommodation Assets
2. Leveraging the Mitsui Fudosan Group
NAF’s basic policy is to secure stable earnings and steady growth in the Investment Assets from the medium- and long-term view, aiming to maximize the value of unitholders.
NAF defines real estate that is mainly used/may be used for residence or hotels as “Accommodation Assets” and invests in two areas of “Rental Apartments” and “Hospitality Facilities.”NAF’s core investment strategy is to continue acquisition of “Rental Apartments” and stable operations.
NAF utilizes to the full extent comprehensive capabilities of the Mitsui Fudosan Group, such as in information gathering, planning/development and management/operation, in order to achieve its external and internal growth.
Mitsui Housing Loop– Membership services –
Provide various housing and lifestyle services for continued strong customer relationships
Market Research/Analysis
Site Acquisition
Planning andDesign
ConstructionManagement/
SupervisionLeasing
Management/Operation
Feedback to Planning/Development Comprehensive
operating systemconducted by the
Mitsui Fudosan GroupResidential Building Maintenance
Operation, Planning / Development ofResidential Leasing BusinessProvision of Property Information
Property Management
Provision of Property Information
REIT Management
Tenant Brokerage
Parent Company ofREIT Management Company
Rental Apartments
Hospitality FacilitiesDormitories, Corporate Housing Serviced Apartments
Senior Residences Hotels
Rental Apartments
Tokyo 23 Wards
Rental Apartments
Over 90% (As of August 31, 2020: 95.0%)
Tokyo 23 Wards
Over 80% (As of August 31, 2020: 85.2%)
■ Investment in Accommodation Assets ■ Proportion of Investment in Assets
■ Investment Areas
Accommodation Assets(Real estate that is primarily used as residences or hotels)
Rental Apartments: Greater Tokyo*1, mainly Tokyo 23 wards, and Other Major Cities*2
Hospitality Facilities: Major cities throughout Japan and their suburbs
*1. Tokyo, Kanagawa, Chiba and Saitama
*2. Each of the urban areas of Sapporo, Sendai, Nagoya, Osaka, Kyoto, Kobe, Hiroshima and Fukuoka cities
Portfolio share
Portfolio share
3
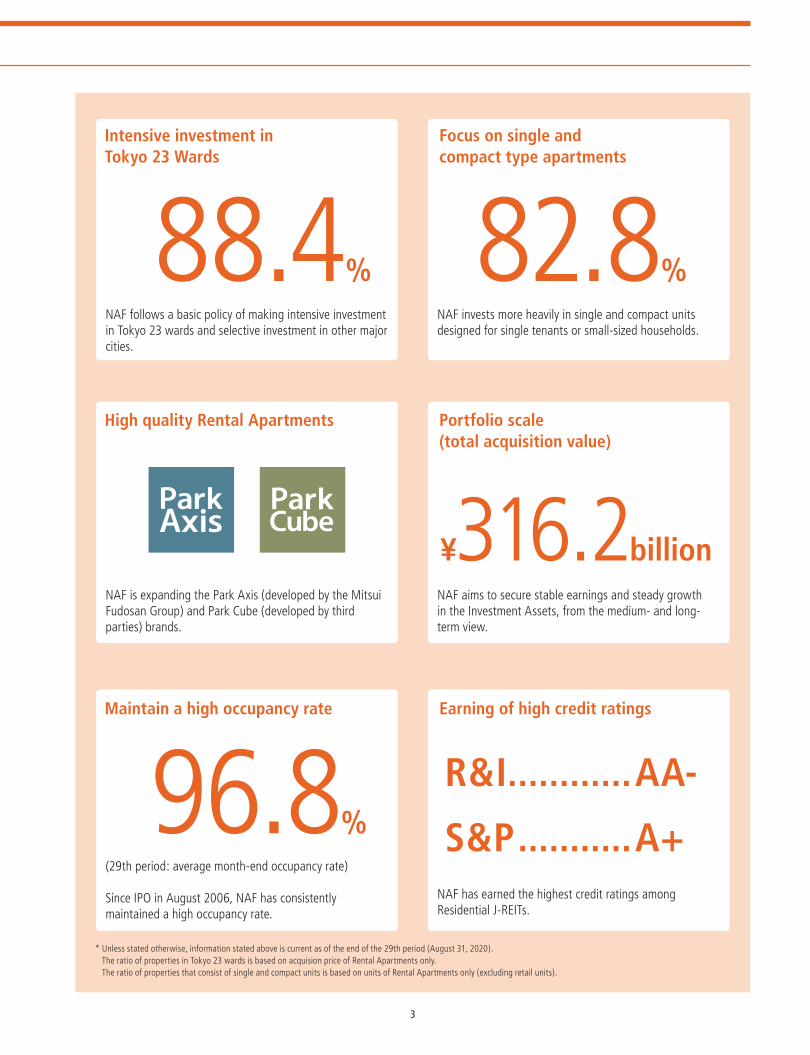
88.4%
96.8%
82.8%
¥316.2billion
R&I ............AA-
S&P ...........A+
Intensive investment in Tokyo 23 Wards
High quality Rental Apartments
Maintain a high occupancy rate
Focus on single and compact type apartments
Portfolio scale (total acquisition value)
Earning of high credit ratings
NAF follows a basic policy of making intensive investment in Tokyo 23 wards and selective investment in other major cities.
NAF is expanding the Park Axis (developed by the Mitsui Fudosan Group) and Park Cube (developed by third parties) brands.
(29th period: average month-end occupancy rate)
Since IPO in August 2006, NAF has consistently maintained a high occupancy rate.
NAF invests more heavily in single and compact units designed for single tenants or small-sized households.
NAF aims to secure stable earnings and steady growth in the Investment Assets, from the medium- and long-term view.
NAF has earned the highest credit ratings among Residential J-REITs.
* Unless stated otherwise, information stated above is current as of the end of the 29th period (August 31, 2020). The ratio of properties in Tokyo 23 wards is based on acquision price of Rental Apartments only. The ratio of properties that consist of single and compact units is based on units of Rental Apartments only (excluding retail units).

4
To Our Stakeholders
First of all, I would like to convey my sincere appreciation to you, our unitholders.
Thank you all very much for your kind support of Nippon Accommodations
Fund (NAF).
NAF was listed on the Real Estate Investment Trust Securities Market (J-REIT
Market) of the Tokyo Stock Exchange in August 4, 2006. Ever since, we have
continued to achieve a steady track record, and as of August 31, 2020, we have
completed our 29th fiscal period (fiscal period ended August 31, 2020). This is
entirely due to the support of our unitholders, and for this I would like to express my
gratitude.
At its Board of Directors’ meeting held on October 19, 2020, NAF approved
the financial statements, etc. prescribed by Article 131, paragraph 2 of the Act on
Investment Trusts and Investment Corporations. Accordingly, I am pleased to report
here an overview of our asset management and operating results for the 29th period
(ended August 31, 2020).
As of August 31, 2020, NAF’s portfolio consisted of 128 properties and a total
acquisition value of ¥316.2 billion. As a result of above operations during the period,
NAF recorded total revenues of ¥11,520 million, operating income of ¥5,332 million
and net income of ¥4,897 million. The distribution per unit was ¥10,108.
NAF will continue to leverage the strength of the Mitsui Fudosan Group to the
maximum and invest its assets to secure stable earnings and steady growth in the
Investment Assets from the medium- and long-term view.
NAF will continue working to earn the trust of our unitholders and requests your
continued support and cooperation.
Tateyuki Ikura
Executive Director of Nippon Accommodations Fund Inc.President and CEO of Mitsui Fudosan Accommodations Fund Management Co., Ltd.
Nippon Accommodations Fund Inc.Management Team
From left: Hiroaki Saito, Takashi Ikeda, Tateyuki Ikura, Tsunehisa Ota, Mitsutoshi Masuda
Takashi Ikeda Executive Director
Tateyuki Ikura Executive Director
Tsunehisa Ota(Attorney at Law)
Hiroaki Saito(Real Estate Appraiser)
Mitsutoshi Masuda(Certified Public Accountant)
Supervisory Director
Supervisory Director
Supervisory Director

5
Financial Highlights
28th Period (Actual) (Ended February 29, 2019)
29th Period (Actual)(Ended August 31, 2020)
30th Period (Forecast)(Ending February 28, 2021)
31st Period (Forecast)(Ending August 31, 2021)
Total revenues ¥11,401 million ¥11,520 million ¥11,577 million ¥11,711 million
Operating income ¥5,307 million ¥5,332 million ¥5,335 million ¥5,272 million
Net income ¥4,865 million ¥4,897 million ¥4,884 million ¥4,801 million
LTV (Loan-to-Value) ratio*1 50.8% 51.5% 51.9% 51.9%
Distribution per unit ¥10,042 ¥10,108 ¥10,080 ¥9,910
Assets under management
Acquisition price basis ¥309,723 million ¥316,208 million ¥318,441 million ¥318,441 million
Number of properties 126 128 129 129
*Amount does not include consumption tax or local consumption tax.*1 LTV (Loan-to-Value) ratio = Total interest-bearing debt / Total assets x 100
Track record of Distribution per Unit
0
2,000
4,000
6,000
8,000
10,000
12,000(Yen)
20thPeriod
(Feb.16)
8,036 8,130
21stPeriod
(Aug.16)
8,428
22ndPeriod
(Feb.17)
23rdPeriod
(Aug.17)
8,497
24thPeriod
(Feb.18)
9,179
25thPeriod
(Aug.18)
9,161
26thPeriod
(Feb.19)
27thPeriod
(Aug.19)
28thPeriod
(Feb.20)
10,449 10,042
29thPeriod
(Aug.20)
30thPeriod
(Feb.21)
31stPeriod
(Aug.21)
10,080(Forecast)
9,910(Forecast)
9,70610,108
Note: The forecasted figures are calculated based on certain assumptions as of October 19, 2020. The actual figures may change due to various factors including fluctuations in rent revenues owing to changes in tenants and other factors, changes in properties, fluctuation in interest, and additional issuance of investment units. Accordingly, the forecasts are not a guarantee of any cash distribution amount, etc. The forecasted figures are stated based on the details announced in the Financial Results for the Fiscal Period from March 1, 2020 to August 31, 2020 released on October 19, 2020. (Please view the above Financial Results from the NAF website (https://www.naf-r.jp/english/).)
・ Due to high occupancy rates, distribution per unit exceeded the forecast and came to ¥10,108.
・ Total assets at the end of the period were ¥305,840 million,
interest-bearing debt was ¥157,500 million, and LTV (Loan-to-Value) ratio was 51.5%.
・ Net assets were ¥141,213 million (up ¥32 million from the end of the previous fiscal period).

6
Status of Portfolio
New Acquisitions in the 29th and 30th Period
Stable Acquisitions of Park Axis Series Developed by the Mitsui Fudosan Group
NAF is realizing steady external growth and stable revenues by leveraging the value chain of the Mitsui Fudosan Group, acquiring stable and selective properties, and conducting suitable management of operations.
■ New Acquisitions in the 29th Period
■ New Acquisition in the 30th Period
Property name Location Acquisition date Acquisition price(Yen in millions)
Rentable units(Units)
Rental Apartments Park Axis Akatsuka Itabashi-ku, Tokyo March 30, 2020 2,420 86 residental,2 retail, etc.
Rental Apartments Park Cube Oimachi Residence Shinagawa-ku, Tokyo July 1, 2020 4,064 119 residental,1 retail, etc.
Property name Location Acquisition date Acquisition price(Yen in millions)
Rentable units(Units)
Rental Apartments Park Axis Toyocho Shinsui Koen Koto-ku, Tokyo October 1, 2020 2,233 67 residental,1 retail, etc.
NAF’s core acquis i t ion s t rategy is the s table acquisitions of Park Axis Series properties, which are Rental Apartments developed by the Mitsui Fudosan Group.
Park Axis Series have many merits. By utilizing the Mitsui Fudosan Group’s long-standing knowhow of the housing business, their location is chosen for its suitability for Rental Apartment development and the properties are planned and designed flexibly to fit with their surroundings. In addition, the properties are built to strictly comply with originally established design standards and are subject to stringent quality. Due to such high quality and strong brand awareness, the Park Axis Series has established a powerful brand presence in the Rental Apartment market.
Asset Classification of Rental Apartments
Okawabata Apartment Communities: 10.3%
Investment mainly focused on Rental Apartments developed by the Mitsui Fudosan Group
■ Developed by the Mitsui Fudosan Group
■ Developed by third-parties
Shibaura Island Air Tower: 2.6%
Park Cube Series:28.4%
Park Axis Series:58.7%
* As of the end of the 29th period (August 31, 2020).* The calculation is based on an acquisition price.
* NAF acquired 55% co-ownership of Park Axis Akatsuka, and “rentable units” are calculated by multiplying co-ownership by the total number of rooms and rounding to the nearest whole number.* NAF acquired 70% co-ownership of Park Cube Oimachi Residence, and “rentable units” are calculated by multiplying co-ownership by the total number of rooms and rounding to the nearest whole number.
* NAF acquired 35% co-ownership of Park Axis Toyocho Shinsui Koen, and “rentable units” are calculated by multiplying co-ownership by the total number of rooms and rounding to the nearest whole number.
Park Axis Akatsuka Park Cube Oimachi Residence Park Axis Toyocho Shinsui Koen

7
Adachi-ku
Kita-ku
Itabashi-ku
Nerima-ku
Toshima-ku
Bunkyo-ku
Chiyoda-ku
ImperialPalace
ImperialPalace
Minato-ku
Shinagawa-ku
Ota-ku
Chuo-ku
Shinjuku-ku
Shibuya-ku
Meguro-ku
Nakano-ku
Suginami-ku
Setagaya-ku
Katsushika-ku
Edogawa-ku
Koto-ku
5km
10km
Sumida-ku
Arakawa-ku
Taito-ku
Shinagawa-kuShinagawa-kuShinagawa-ku
Meguro-kuMeguro-kuMeguro-ku
Shinagawa-kuShinagawa-kuShinagawa-ku
Ota-ku
Meguro-kuMeguro-kuMeguro-kuMeguro-ku
10km10km10km10km10km10km10km10km
Portfolio Map
Tokyo 23 Wards 93 properties
Greater Tokyo 12 properties
Other major cities 23 properties
Rental Apartments
Hospitality Facilities
* As of the end of the 29th period (August 31, 2020).

8
Sustainability Initiatives
Sustainability Policy
Reduction of Environmental Load
Collaborations with Various Internal and External Stakeholders
Initiatives for Governance
https://www.naf-r.jp/english/profi le/3-4.html
■ Identifi cation of materialityNAF identifies materiality for relevant initiatives when promoting sustainability.
■ In-House Structure for Promotion of SustainabilitySustainabilit y Promotion Of f ice established to ensure ef fective sustainability policies
■ Consistently Acquire External Certifi cation ofSustainability
We consistently acquire external certifi cation including GRESB Real Estate Assessment as opportunities to improve NAF’s sustainability initiatives.
InvestmentCommittee
Sustainability Promotion Offi ce
All offi cers and employees
ChairpersonCEO
■ GRESB Real Estate Assessment ■ SMBC Environmental Assessment
■ Installation of LED lighting in common areasSystematically installing LED lighting promotes energy saving and reduction of CO2 emissions throughout our portfolio.
■ Environmental Performance
Okawabata Apartment Communities (Parking)
■ External Certifi cation of Investment PropertiesWe strive to acquire DBJ Green Building certifi cation to ensure the validity and objectivity of the results of our initiatives to reduce environmental impact.
Installation completed
89 properties
In the 29th Period
5 properties
Property Name Certifi cation rank
Okawabata Apartment Communities
Park Axis Toyosu
Park Cube Nishigahara Stage
Park Cube Meguro Tower
Certifi cation Details
No. of properties 4
Total fl oor space 181,579m2
Percentage of fl oor space certifi ed 25.0 %
(As of August 31, 2020)
SustainabilityDecision Maker
Objectives andimplementation plans
Share objectivesand plans
↓Implement
Status of progressand achievements
Formulate plans
Report
Decide
Review
Energy consumption, CO2 emissions from energy use CO2 emissions from energy use Water consumption
Water consumption
Average annual reduction of 1%over fi ve years using 2015 as the baseline (based on intensity)
No increase in amount used over fi ve years using 2015 as the baseline (based on intensity)
Assessment
Green Star
Rating
3 Stars
Assessment
AInitiatives with good environmental consideration
(t)6,000
4,000
2,000
0
(m3)30,000
20,000
10,000
0
(t/m2)0.06
0.04
0.02
0
(m3/m2)0.3
0.2
0.1
0
5,038 24,273 23,836 23,811 22,81624,0564,9584,509
4,0424,309
0.0249 0.1198 0.1169 0.11010.11690.11630.0243 0.0220 0.01950.0209
2015 2016 201920182017 2015 2016 201920182017
CO2 emissions Intensity Water consumption Intensity
1 Structure for Promotion and External Assessment
2 Environment
■ Targets ■ Results
(As of August 31, 2020)
Promote Energy Effi ciency and CO2 Emissions ReductionAcquire External Certifi cation and Assessment on SustainabilityDevelop Human Capital and Raise Sustainability Awareness Among Our EmployeesEnhance Tenant Satisfaction, Safety and ComfortBuild Partnerships with Property Companies and OperatorsContribute to Community DevelopmentEnsure Fairness and Transparency of Corporate Governance

9
■ Employees of the Asset Management CompanyThe Asset Management Company recognizes that human resources are its most valuable assets and has implemented various initiatives for its employees.
■ TenantsWe conduct various initiatives to improve safety, security and comfort in assets under management to enhance tenant satisfaction.
■ Local CommunitiesAs a member of local communities in which the assets we manage are located, we contribute to community formation and vitalization.
■ Supply ChainsWhen selecting/evaluating suppliers, which are important in NAF's asset management, NAF keeps in mind the promotion of sustainability throughout its supply chain by also confirming suppliers’ initiatives in consideration of society, the environment, etc.
■The Asset Management Company’s decision making process flow for acquiring or selling investment assets
Human Resource DevelopmentThe Company takes various measures to foster human resources having a high level of expertise, deep knowledge and ethical values.● Support for Acquisition of Qualifications● Support for Education and Training● Interviews for Setting Objectives of Individual Employees● Performance Evaluations
Greater SatisfactionInitiatives in collaboration with property management company (Mitsui Fudosan Residential Lease)● Toll-Free Helpline for Tenants● Chatbot to Answer Inquiries● Renovation of Common Areas● Tenant Satisfaction Surveys
Cooperation in Local EventsAt the Okawabata Apartment Communities, NAF has proactively cooperated in activities of the management association and strives to contribute to formation of a local community.
Compliance Checking System
Confirmation by Chief Compliance Officer (CCO)The following require approval of the Compliance Committee● Related-party transactions*● When CCO determines that a compliance issue has arisen *Property acquisition price from sponsor-related parties is below appraisal value
The Compliance CommitteeRequires approval by independent external professionalsMembers: CCO (Chairperson), CEO, 2 external professionals (Currently 1 lawyer and 1 CPA)External professionals: Appoint professionals independent from sponsor-related partiesResolution: Requires the votes of 2/3 or more members and at least 1 of the 2 independent external professionals
Functions as a Check on the Investment CommitteeCCO can suspend discussion when he sees any problem in the discussion process
Health and Safety, Respect for Human RightsWe maintain healthy workplaces that facilitate work so that all officers and employees can fully demonstrate their abilities.● Implementation of Periodic Medical Examinations, etc.● Work-Life Balance● Special Leave Program (maternity leave, caregiver leave and time off for sick/ injured childcare, etc.)● Consultation Service Office for Compliance● Promotion of Active Roles for Women● Support for Childcare and Nursing Care
3 Social
4 Governance
Disaster prevention event (Demonstration ofWater discharge by fire department members)
Disaster prevention event (Disaster prevention drills for local residents)
Note: When NAF acquires or sells of assets in transactions with related parties as defined by the Investment Trust and Investment Corporation Act of Japan, the Asset Management Company must obtain consent from NAF based on the approval of NAF’s Board of Directors prior to the deliberations of the Investment Committee. However, such consent is not required for property or other real estate acquisitions stipulated by Article 245-2-1 of the Investment Trust and Investment Corporation Act as having immaterial impact on NAF’s assets because the acquisition cost represents less than 10 percent of the book value of NAF’s investment properties.
Preliminary Plan
Approval of CCO
Approval of Compliance Committee
Proposal by CIO
Investment Committee
Report to Board of NAF
● Related-party transaction● When CCO determines that a compliance issue has arisen
(Note)
1
2
3
1
2
3

10
Portfolio Summary (As of August 31, 2020)
No. Name LocationAcquisition Price
(Note 1)
(Yen in millions)
Portfolio Share(%)
Rentable Area(m2)
Rentable UnitsNumber of Rooms
(Units/rooms)
PML (Note2)
(%)
1 Okawabata Apartment Communities Chuo-ku, Tokyo 30,816 9.7 43,812.41 544
River Point Tower 1.8
Park Side Wings 2.7
Pier West House 2.7
Okawabata Parking 1.7
2 Park Axis Gakugei Daigaku Setagaya-ku, Tokyo 1,760 0.6 2,437.66 64 5.0
4 Park Axis Shibuya Jinnan Shibuya-ku, Tokyo 3,230 1.0 2,766.62 75 4.1
5 Park Axis Aoyama Kotto Dori Minato-ku, Tokyo 1,730 0.5 1,537.24 40 4.5
6 Park Axis Kagurazaka Stage Shinjuku-ku, Tokyo 1,400 0.4 1,891.05 59 3.0
7 Park Axis Shirokanedai Minato-ku, Tokyo 5,140 1.6 4,704.44 99 4.2
8 Park Axis Bunkyo Stage Bunkyo-ku, Tokyo 4,440 1.4 6,078.93 154 3.6
9 Park Axis Tsukishima Chuo-ku, Tokyo 930 0.3 1,383.99 30 3.2
10 Park Axis Otsuka Toshima-ku, Tokyo 1,655 0.5 2,606.37 52 2.4
11 Park Axis Minami Azabu Minato-ku, Tokyo 3,939 1.2 3,938.14 64 3.0
13 Park Axis Nihonbashi Stage Chuo-ku, Tokyo 7,557 2.4 10,025.40 184 residential, 1 retail, etc. 4.5
14 Park Axis Hamamatsucho Minato-ku, Tokyo 2,025 0.6 2,426.45 80 3.3
15 Park Axis Hongo no Mori Bunkyo-ku, Tokyo 2,910 0.9 3,317.94 86 residential, 1 retail, etc. 4.0
16 Park Axis Tameike Sanno Minato-ku, Tokyo 2,860 0.9 2,710.69 70 3.5
17 Park Axis Roppongi Hinokicho Koen Minato-ku, Tokyo 2,170 0.7 2,054.46 46 5.8
18 Park Axis Ochanomizu Stage Bunkyo-ku, Tokyo 9,710 3.1 12,025.25 324 3.9
19 Park Axis Okachimachi Taito-ku, Tokyo 1,070 0.3 1,621.73 42 4.0
20 Park Cube Hongo Bunkyo-ku, Tokyo 1,760 0.6 2,160.12 60 3.9
21 Park Cube Kanda Chiyoda-ku, Tokyo 2,454 0.8 3,194.59 95 2.4
22 Park Cube Ichigaya Shinjuku-ku, Tokyo 1,949 0.6 2,288.46 53 2.9
23 Park Cube Asakusa Tawaramachi Taito-ku, Tokyo 2,508 0.8 4,012.68 76 2.8
24 Park Cube Ueno Taito-ku, Tokyo 2,233 0.7 3,041.61 91 2.8
29 Park Axis Meguro Honcho Meguro-ku, Tokyo 1,810 0.6 1,884.77 60 5.8
30 Park Axis Shin Itabashi Itabashi-ku, Tokyo 3,430 1.1 4,395.99 152
3.4 East
3.3 West
31 Park Axis Akihabara Chiyoda-ku, Tokyo 1,200 0.4 1,346.07 41 3.3
32 Park Axis Toyocho Koto-ku, Tokyo 3,950 1.2 5,412.40 140 5.8
33 Park Axis Takinogawa Kita-ku, Tokyo 1,820 0.6 2,924.75 48 residential, 1 retail, etc. 4.0
34 Park Axis Asakusabashi Taito-ku, Tokyo 2,717 0.9 3,400.78 78 residential, 1 retail, etc. 3.2
38 Park Axis Nihonbashi Hamacho Chuo-ku, Tokyo 5,540 1.8 6,999.83 118 4.2
39 Park Cube Yoyogi Tomigaya Shibuya-ku, Tokyo 1,975 0.6 1,929.10 38 5.8
41 Park Axis Monzen Nakacho Koto-ku, Tokyo 1,700 0.5 1,886.39 55 5.1
42 Park Cube Itabashi Honcho Itabashi-ku, Tokyo 4,170 1.3 5,317.07 165 residential, 1 retail, etc. 2.9
43 Park Cube Gakugei Daigaku Meguro-ku, Tokyo 910 0.3 957.88 24 6.8
44 Park Cube Oimachi Shinagawa-ku, Tokyo 1,440 0.5 1,511.12 65 3.2
46 Park Axis Nishigahara Kita-ku, Tokyo 840 0.3 1,435.83 46 2.4
47 Park Axis Kinshicho Sumida-ku, Tokyo 1,448 0.5 2,288.13 65 4.2
48 Park Axis Tatsumi Stage Koto-ku, Tokyo 7,464 2.4 16,474.06 299 residential, 1 retail, etc. 5.1
51 Park Axis Kameido Koto-ku, Tokyo 2,359 0.7 3,986.78 118 5.6
52 Park Axis Honancho Nakano-ku, Tokyo 745 0.2 1,231.08 31 3.0
53 Park Axis Itabashi Kita-ku, Tokyo 1,448 0.5 2,567.96 64 5.3
54 Park Axis Oshiage Sumida-ku, Tokyo 1,193 0.4 2,121.29 57 residential, 1 retail, etc. 4.9
55 Park Axis Takadanobaba Toshima-ku, Tokyo 1,222 0.4 1,463.25 36 residential, 1 retail, etc. 2.7
59 Park Axis Toyosu Koto-ku, Tokyo 14,300 4.5 25,537.94 401 residential, 2 retail, etc. 3.9

11
No. Name LocationAcquisition Price
(Note 1)
(Yen in millions)
Portfolio Share(%)
Rentable Area(m2)
Rentable UnitsNumber of Rooms
(Units/rooms)
PML (Note 2)
(%)
60 Park Axis Hatchobori Chuo-ku, Tokyo 1,760 0.6 2,416.29 63 residential, 1 retail, etc. 3.2
61 Park Axis Itabashi Honcho Itabashi-ku, Tokyo 987 0.3 2,048.31 66 4.0
62 Park Axis Sumiyoshi Sumida-ku, Tokyo 1,006 0.3 1,785.72 60 7.4
63 Park Cube Yotsuya Sanchome Shinjuku-ku, Tokyo 2,749 0.9 3,599.82 130 5.1
64 Park Cube Hatchobori Chuo-ku, Tokyo 4,200 1.3 5,191.86 118 residential, 2 retail, etc. 2.4
68 Park Axis Kamata Ichibankan Ota-ku, Tokyo 1,069 0.3 1,721.28 63 6.7
70 Park Axis Taito Negishi Taito-ku, Tokyo 672 0.2 1,283.13 40 4.2
72 Park Axis Komagome Toshima-ku, Tokyo 1,389 0.4 1,979.51 39 residential, 1 retail, etc. 2.5
74 Park Axis Itabashi Honcho Nibankan Itabashi-ku, Tokyo 1,859 0.6 3,661.58 99 3.1
75 Shibaura Island Air Tower (Note 3) Minato-ku, Tokyo 7,905 2.5 17,646.33 270 residential, 2 retail, etc.
Air Tower 1.9
Air Terrace 7.5
84 Park Cube Higashi Shinagawa Shinagawa-ku, Tokyo 6,060 1.9 10,636.67 201 3.5
86 Park Cube Sasazuka Shibuya-ku, Tokyo 2,200 0.7 2,416.00 92 residential, 1 retail, etc. 3.4
88 Park Axis Higashi Jujo Kita-ku, Tokyo 1,700 0.5 2,893.54 70 residential, 1 retail, etc. 3.1
91 Park Cube Heiwadai Nerima-ku, Tokyo 1,204 0.4 2,656.00 34 2.8
92 Park Cube Meguro Tower Meguro-ku, Tokyo 9,000 2.8 12,367.62 193 residential, 1 retail, etc. 2.2
93 Park Cube Nihonbashi Suitengu Chuo-ku, Tokyo 2,711 0.9 4,235.33 77 4.4
94 Park Cube Ginza East Chuo-ku, Tokyo 2,269 0.7 3,358.63 77 3.0
95 Park Cube Kayabacho Chuo-ku, Tokyo 1,105 0.3 1,695.06 27 residential, 1 retail, etc. 3.2
96 Park Cube Honjo Azumabashi Sumida-ku, Tokyo 1,252 0.4 2,241.63 45 4.6
97 Park Axis Kiyosumi Shirakawa Koto-ku, Tokyo 696 0.2 1,159.84 36 3.7
98 Park Axis Asakusabashi Nichome Taito-ku, Tokyo 1,079 0.3 1,569.00 48 3.4
99 Park Axis Nishi Sugamo Kita-ku, Tokyo 1,439 0.5 2,326.32 56 3.9
100 Park Axis Ueno Taito-ku, Tokyo 1,389 0.4 1,992.29 59 3.3
101 Park Axis Akihabara East Taito-ku, Tokyo 1,369 0.4 1,890.20 58 3.8
103 Park Axis Kayabacho Chuo-ku, Tokyo 1,809 0.6 2,355.07 72 3.0
104 Park Axis Kinshicho Shinsui Koen Sumida-ku, Tokyo 1,369 0.4 2,085.62 60 7.5
105 Park Cube Kasuga Andozaka Bunkyo-ku, Tokyo 2,670 0.8 3,581.09 68 2.7
106 Park Cube Kameido Koto-ku, Tokyo 3,020 1.0 4,442.09 121 residential, 1 retail, etc. 5.5
108 Park Axis Shin Okachimachi East Taito-ku, Tokyo 1,299 0.4 1,847.01 49 3.0
110 Park Axis Nihonbashi Honcho Chuo-ku, Tokyo 1,469 0.5 1,808.12 49 2.5
111 Park Cube Nishigahara Stage Kita-ku, Tokyo 4,110 1.3 19,693.35 357 residential, 1 retail, etc. 2.5
112 Park Cube Atagoyama Tower Minato-ku, Tokyo 8,650 2.7 8,389.91 165 2.4
113 Park Axis Shibaura Minato-ku, Tokyo 1,045 0.3 1,273.60 42 5.2
114 Park Axis Asakusa Kuramae Taito-ku, Tokyo 1,095 0.3 1,456.35 45 3.0
115 Park Axis Kamata Station Gate Ota-ku, Tokyo 4,144 1.3 4,582.72 157 residential, 1 retail, etc. 3.2
116 Park Axis Kinshicho Residence Sumida-ku, Tokyo 1,251 0.4 1,793.33 56 4.0
117 Park Axis Oshiage Sumida Koen Sumida-ku, Tokyo 1,055 0.3 1,610.49 49 5.2
120 Park Axis Magome Residence Ota-ku, Tokyo 1,450 0.5 1,621.94 55 9.6
121 Park Axis Higashi Ueno Taito-ku, Tokyo 1,250 0.4 1,460.10 45 4.0
122 Park Axis Higashi Koenji Suginami-ku, Tokyo 2,300 0.7 2,679.96 85 5.1
125 Park Cube Shin Itabashi Itabashi-ku, Tokyo 1,700 0.5 1,930.12 70 residential, 1 retail, etc. 2.9
126 Park Cube Nishi Shinjuku Shinjuku-ku, Tokyo 2,400 0.8 1,809.56 57 residential, 1 retail, etc. 3.4
129 Park Axis Oshiage Terrace Sumida-ku, Tokyo 2,610 0.8 2,498.08 80 6.6
130 Park Axis Ikegami Ota-ku, Tokyo 1,260 0.4 1,391.34 45 6.7
132 Park Axis Akatsuka Itabashi-ku, Tokyo 2,420 0.8 2,403.67 86 residential, 2 retail, etc. 3.2
133 Park Cube Oimachi Residence Shinagawa-ku, Tokyo 4,064 1.3 2,989.82 119 residential, 1 retail, etc. 4.0
Tokyo 23 Wards Total 265,438 83.9 381,584.00 8,442 residential, 28 retail, etc.

12
No. Name LocationAcquisition Price
(Note 1)
(Yen in millions)
Portfolio Share(%)
Rentable Area(m2)
Rentable UnitsNumber of Rooms
(Units/rooms)
PML (Note2)
(%)
26 Park Cube Keio Hachioji II Hachioji-shi, Tokyo 1,130 0.4 3,082.32 47 residential, 1 retail, etc. 4.0
40 Park Axis Nishi Funabashi Funabashi-shi, Chiba 1,020 0.3 2,074.35 55 3.2
66 Park Axis Yokohama Idogaya Yokohama-shi, Kanagawa 1,419 0.4 2,706.59 99 residential, 1 retail, etc. 6.3
67 Park Axis Chiba Shinmachi Chiba-shi, Chiba 1,679 0.5 3,318.15 77 residential, 7 retail, etc. 1.9
69 Park Axis Chiba Chiba-shi, Chiba 970 0.3 2,270.32 91 2.3
85 Park Cube Kita Matsudo Matsudo-shi, Chiba 1,200 0.4 2,358.66 108 residential, 1 retail, etc. 1.6
87 Park Cube Musashi Kosugi Kawasaki-shi, Kanagawa 2,250 0.7 3,057.36 136 3.3
102 Park Axis Yokohama Tanmachi Koen Yokohama-shi, Kanagawa 1,119 0.4 1,682.46 63 4.1
109 Park Axis Yokohama Yamashitacho Yokohama-shi, Kanagawa 1,539 0.5 2,325.92 70 residential, 1 retail, etc. 8.2
Greater Tokyo Total 12,326 3.9 22,876.13 746 residential, 11 retail, etc.
27 Park Axis Meieki Minami Nagoya-shi, Aichi 2,440 0.8 5,565.13 169 3.7
35 Park Axis Marunouchi Nagoya-shi, Aichi 1,920 0.6 3,821.75 98 residential, 1 retail, etc. 2.9
36 Park Axis Ropponmatsu Fukuoka-shi, Fukuoka 1,515 0.5 3,473.67 111 residential, 1 retail, etc. 2.5
37 Park Axis Hakataeki Minami Fukuoka-shi, Fukuoka 1,890 0.6 4,668.29 176 residential, 1 retail, etc. 3.0
45 Park Axis Naka Gofukumachi Fukuoka-shi, Fukuoka 742 0.2 2,707.88 112 2.9
49 Park Axis Shirakabe Nagoya-shi, Aichi 1,547 0.5 4,735.89 86 3.0
50 Park Axis Sendai Sendai-shi, Miyagi 2,320 0.7 8,843.17 204 2.8
56 Park Axis Hakata Minoshima Fukuoka-shi, Fukuoka 960 0.3 3,461.85 112 2.7
57 Park Axis Takamiya Higashi Fukuoka-shi, Fukuoka 605 0.2 2,289.21 70 5.1
58 Park Axis Sapporo Shokubutsuen Mae Sapporo-shi, Hokkaido 1,650 0.5 7,845.01 146 1.1
65 Park Axis Shin Sapporo Sapporo-shi, Hokkaido 827 0.3 3,729.05 84 residential, 1 retail, etc. 2.4
73 Park Axis Utsubo Koen Osaka-shi, Osaka 2,399 0.8 4,952.45 133 8.6
107 Park Cube Kitahama Osaka-shi, Osaka 1,970 0.6 4,683.33 138 5.7
127 Park Axis Kanayama WEST Nagoya-shi, Aichi 1,770 0.6 4,795.13 63 4.4
Other Major Cities Total 22,555 7.1 65,571.81 1,702 residential, 4 retail, etc.
Rental Apartments Total 300,319 95.0 470,031.94 10,890 residential, 43 retail, etc.
76 Dormy Ashiya Ashiya-shi, Hyogo 928 0.3 3,729.45 140 6.6
77 Kawaijuku Kyoto Gakushin Ryo Kyoto-shi, Kyoto 991 0.3 3,492.88 134 12.9
78 Sundai Horikawa Ryo Kyoto-shi, Kyoto 916 0.3 2,793.71 113 8.8
79 Dormy Rakuhoku Kyoto-shi, Kyoto 374 0.1 1,489.86 70 8.8
80 Rikkyo University International Dormitory (RUID) Shiki
Shiki-shi, Saitama 1,478 0.5 3,061.89 127 3.0
81 Dormy Naka Itabashi Itabashi-ku, Tokyo 1,041 0.3 2,439.17 106 5.5
82 Philosophia Nishidai Itabashi-ku, Tokyo 1,249 0.4 2,969.25 121 5.3
83 Dormy Musashi Kosugi Kawasaki-shi, Kanagawa 1,152 0.4 3,017.34 112 7.3
89 Artis Sendai Kakyoin Sendai-shi, Miyagi 540 0.2 2,234.24 60 3.0
90 Artis Sendai Kimachi Dori Sendai-shi, Miyagi 1,160 0.4 4,864.04 142 2.7
118 Medical Home Granda Sangen Jaya (Land with leasehold interest)
Setagaya-ku, Tokyo 735 0.2 — — —
119 Dormy Nishi Ogikubo Suginami-ku, Tokyo 1,100 0.3 1,616.52 71 8.8
123 Granda Kanazawa Hakkei Yokohama-shi, Kanagawa 774 0.2 1,826.29 58 9.6
124 Dormy Kamisugi Sendai-shi, Miyagi 1,050 0.3 3,151.56 124 4.6
128 Dormy Odawara Sendai-shi, Miyagi 521 0.2 2,452.14 78 0.2
131 Chisun Hotel Hiroshima Hiroshima-shi, Hiroshima 1,880 0.6 4,275.59 170 6.4
Hospitality Facilities Total 15,889 5.0 43,413.93 1,626
Grand Total 316,208 100.0 513,445.87 12,559 2.5(Portfolio PML)
Notes: 1. Acquisition Price does not include acquisition-related expenses, property tax or consumption tax. 2. PML = Probable maximum loss Portfolio PML is the PML for all NAF’s portfolio, 127 properties excluding Medical Home Granda Sangen Jaya (Land with leasehold interest). 3. Rentable units and rentable area for Shibaura Island Air Tower are calculated by multiplying NAF’s ownership (31%) by the property’s total rentable units and total rentable area and rounding to the nearest unit and one-hundredth of a square meter, respectively. 4. Rentable units and rentable area for Park Axis Akatsuka are calculated by multiplying NAF’s ownership (55%) by the property’s total rentable units and total rentable area and rounding to the nearest unit and one-hundredth of a square meter, respectively. 5. Rentable units and rentable area for Park Cube Oimachi Residence are calculated by multiplying NAF’s ownership (70%) by the property’s total rentable units and total rentable area and rounding to the nearest unit and one-hundredth of a square meter, respectively. 6. Numbers in light orange indicate properties acquired during the 29th Period.
Management’s Discussion and Analysis
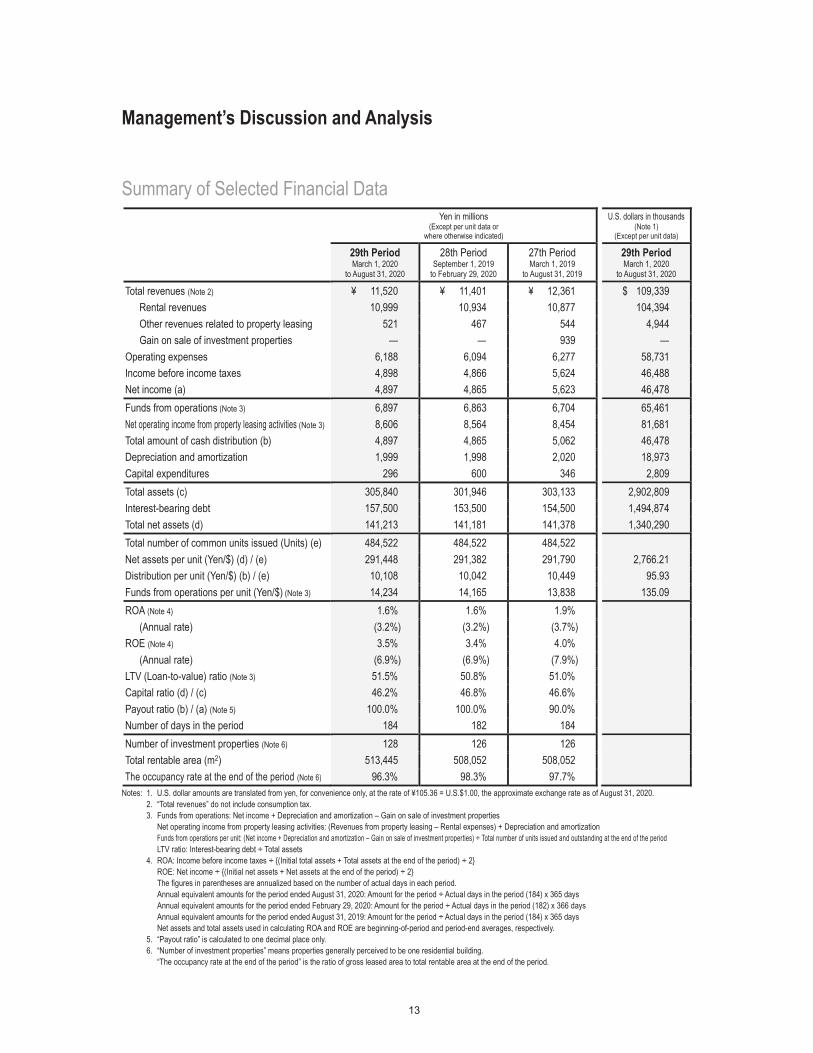
Summary of Selected Financial Data Yen in millions
(Except per unit data or where otherwise indicated)
U.S. dollars in thousands (Note 1)
(Except per unit data)
29th Period March 1, 2020
to August 31, 2020
28th Period September 1, 2019
to February 29, 2020
27th Period March 1, 2019
to August 31, 2019
29th Period March 1, 2020
to August 31, 2020
Total revenues (Note 2) ¥ 11,520 ¥ 11,401 ¥ 12,361 $ 109,339 Rental revenues 10,999 10,934 10,877 104,394 Other revenues related to property leasing 521 467 544 4,944 Gain on sale of investment properties — — 939 —
Operating expenses 6,188 6,094 6,277 58,731 Income before income taxes 4,898 4,866 5,624 46,488 Net income (a) 4,897 4,865 5,623 46,478 Funds from operations (Note 3) 6,897 6,863 6,704 65,461 Net operating income from property leasing activities (Note 3) 8,606 8,564 8,454 81,681 Total amount of cash distribution (b) 4,897 4,865 5,062 46,478 Depreciation and amortization 1,999 1,998 2,020 18,973 Capital expenditures 296 600 346 2,809 Total assets (c) 305,840 301,946 303,133 2,902,809 Interest-bearing debt 157,500 153,500 154,500 1,494,874 Total net assets (d) 141,213 141,181 141,378 1,340,290 Total number of common units issued (Units) (e) 484,522 484,522 484,522Net assets per unit (Yen/$) (d) / (e) 291,448 291,382 291,790 2,766.21 Distribution per unit (Yen/$) (b) / (e) 10,108 10,042 10,449 95.93 Funds from operations per unit (Yen/$) (Note 3) 14,234 14,165 13,838 135.09 ROA (Note 4) 1.6% 1.6% 1.9%
(Annual rate) (3.2%) (3.2%) (3.7%)ROE (Note 4) 3.5% 3.4% 4.0%
(Annual rate) (6.9%) (6.9%) (7.9%)LTV (Loan-to-value) ratio (Note 3) 51.5% 50.8% 51.0%Capital ratio (d) / (c) 46.2% 46.8% 46.6%Payout ratio (b) / (a) (Note 5) 100.0% 100.0% 90.0%Number of days in the period 184 182 184Number of investment properties (Note 6) 128 126 126Total rentable area (m2) 513,445 508,052 508,052The occupancy rate at the end of the period (Note 6) 96.3% 98.3% 97.7%
Notes: 1. U.S. dollar amounts are translated from yen, for convenience only, at the rate of ¥105.36 = U.S.$1.00, the approximate exchange rate as of August 31, 2020. 2. “Total revenues” do not include consumption tax. 3. Funds from operations: Net income + Depreciation and amortization – Gain on sale of investment properties
Net operating income from property leasing activities: (Revenues from property leasing – Rental expenses) + Depreciation and amortization Funds from operations per unit: (Net income + Depreciation and amortization – Gain on sale of investment properties) ÷ Total number of units issued and outstanding at the end of the periodLTV ratio: Interest-bearing debt ÷ Total assets
4. ROA: Income before income taxes ÷ {(Initial total assets + Total assets at the end of the period) ÷ 2} ROE: Net income ÷ {(Initial net assets + Net assets at the end of the period) ÷ 2} The figures in parentheses are annualized based on the number of actual days in each period. Annual equivalent amounts for the period ended August 31, 2020: Amount for the period ÷ Actual days in the period (184) x 365 days Annual equivalent amounts for the period ended February 29, 2020: Amount for the period ÷ Actual days in the period (182) x 366 daysAnnual equivalent amounts for the period ended August 31, 2019: Amount for the period ÷ Actual days in the period (184) x 365 days Net assets and total assets used in calculating ROA and ROE are beginning-of-period and period-end averages, respectively.
5. “Payout ratio” is calculated to one decimal place only.6. “Number of investment properties” means properties generally perceived to be one residential building.
“The occupancy rate at the end of the period” is the ratio of gross leased area to total rentable area at the end of the period.

Overview Investment Environment and Operating Performance
During the six months ended August 31, 2020 (the “29th Period”), actual GDP (the 2nd preliminary) from April to June recorded a record low of negative 28.1% (on an annualized basis) year on year as a result of the sudden decrease in personal consumption due to people refraining from going out and the government declaring a state of emergency because of the spread of the novel coronavirus disease (COVID-19) in the first half, as well as a decrease in exports and production on the backdrop of the spread of the virus. In the second half, despite signs of personal consumption, exports, production, etc. gradually recovering due to the declaration of the lifting of the state of emergency and resumption of economic activity globally, the situation continues to be difficult as the recovery of the employment situation, capital investment, etc. is sluggish.
In NAF’s main investment area, the residential rental market, despite the number of tenants signing contracts decreasing year on year due to the impact of people refraining from going out, occupancy rates generally remained high as contract cancellations also decreased.
In the real estate trading market, despite the number of contracts and sale amount temporarily decreasing, demand from investors with regard to rental apartments, where occupancy and revenue is stable, was steady and the impact of the spread of COVID-19 was limited.
During the period under review, NAF newly acquired 55% co-ownership of Park Axis Akatsuka in March 2020 and 70% co-ownership of Park Cube Oimachi Residence in July 2020 (a total of two properties with a total acquisition price of ¥6,484 million).
As a result, NAF’s portfolio as of August 31, 2020 consisted of 128 properties valued at ¥316,208 million on an acquisition price basis.
NAF has chosen Mitsui Fudosan Residential Lease Co., Ltd. as property management company on management of NAF’s rental apartments portfolio. The company and Mitsui Fudosan Accommodations Fund Management Co., Ltd., the asset management company of NAF, collaborate in the management of properties NAF owns, implementing effective management and operational activities based on regional characteristics and the individual features of each property. Specifically, NAF maintains and improves its rent levels and occupancy rate through the implementation of a leasing strategy that has been formulated for each individual property. In addition, NAF aims to reduce costs by utilizing the merits of outsourcing all property management tasks to the property management company while examining, whenever necessary, the adequacy of the grade of property management, cost of management and operation.
As a result of these initiatives, occupancy rates for rental apartments were generally at a high level this period, and the impact of COVID-19 on the management and operation of rental apartments was limited due to rent levels maintaining an upward trend when tenants change.
Meanwhile in the management of “Hospitality Facilities” (Note), NAF contracts out the management and operational activities to a professional operator or business corporation. The asset management company regularly monitors the management and operational activities, and makes adjustments through professional dialog with the operator or business corporation as necessary.
In order to maintain and improve the competitiveness of NAF’s portfolio, operations are adequately planned and carried out at the asset management company. These include appropriate renewal work according to the property age, and work to enhance the property value. In addition, NAF is not only making continuous efforts to reduce costs, but also introducing such features as environmentally friendly, energy-saving facilities in a timely manner.
In the period under review, NAF carried out renovations in private areas at Okawabata Apartment Communities. At other properties, NAF planned and implemented such works as changing the lighting in common areas to LED lighting.
As a result of these activities, the occupancy rate for NAF’s overall portfolio as of August 31, 2020 remained at a high level of 96.3%.
Consequently, for the 29th Period, NAF recorded total revenues of ¥11,520 million, operating income of ¥5,332 million, income before income taxes of ¥4,898 million and net income of ¥4,897 million.
Note: “Hospitality Facilities” is a generic term for “Accommodation Assets” that includes the four categories of “Dormitories,
Corporate Housing,” “Serviced Apartments,” “Senior Residences,” and “Hotels,” excluding “Rental Apartments.”

Changes in Assets, Liabilities and Net Assets Total assets as of August 31, 2020 increased from February 29, 2020 by ¥3,894 million to ¥305,840 million. Total current assets
decreased by ¥1,163 million to ¥13,155 million and total investment properties net of accumulated depreciation compared with February 29, 2020 increased by ¥5,038 million to ¥290,892 million as a result of NAF’s acquisition of two properties (total acquisition price ¥6,484 million) during the 29th Period, in addition to normal depreciation.
NAF’s basic policy is to carry out operations in a conservative manner that gives consideration to such matters as maintaining stable distributions in the medium and long term. During the period under review, while taking into account market trends and interest rate levels, NAF pursued financing from various sources with diversified repayment dates and an emphasis on long-term, fixed-rate loans in its procurement of funds. In July 2020, NAF issued No.3 Unsecured Bonds (¥2,000 million over 5 years) and No.4 Unsecured Bonds (¥2,000 million over 10 years), its first green bonds, and refinanced existing loans.
As a result, at the end of the period, total interest-bearing debt amounted to ¥157,500 million (¥4,000 million increase from previous period), the long-term debt ratio was 98.1%, the long-term, fixed-rate debt ratio was 95.6%, and the loan-to-value (LTV) ratio was 51.5%. The average annual current maturity of long-term interest-bearing debt was 4.6 years and the number of financial institutions was 25. Furthermore, the weighted average interest rate at the end of the period was 0.55%.
NAF also has secured a commitment line for the purpose of securing flexible and stable fund procurement methods. At the end of the period under review, its total maximum borrowable amount was ¥15,000 million.
Net assets totaled ¥141,213 million as of August 31, 2020. Unitholders’ capital was unchanged at ¥135,603 million, and retained earnings increased to ¥5,609 million from ¥5,577 million as of February 29, 2020.
Distributions to Unitholders NAF determines the amount of cash distributions such that they exceed 90 percent of NAF’s retained earnings available for
dividends as set forth in Article 67-15 of the Act on Special Measures Concerning Taxation. For the 29th Period, cash distributions totaled ¥4,897,548,376 or ¥10,108 per unit.
Yen in thousands, except per unit amounts
29th Period March 1, 2020
to August 31, 2020
28th Period September 1, 2019
to February 29, 2020
27th Period March 1, 2019
to August 31, 2019 Retained earnings ¥4,897,760 ¥4,865,756 ¥5,624,099 Reserve for reduction entry — — 561,000 Undistributed earnings 212 187 328 Total cash distribution 4,897,548 4,865,569 5,062,770
(Per unit) 10,108 10,042 10,449 Distribution of retained earnings 4,897,548 4,865,569 5,062,770
(Per unit) 10,108 10,042 10,449 Cash distribution in excess of retained earnings — — —
(Per unit) — — — Note: The above cash distributions were paid after the close of the period.
Funding Balance of Paid-in Capital
NAF was established on October 12, 2005 with initial paid-in capital of ¥100 million. NAF began investing activities on November 29, 2005 after ¥21,140 million was raised through private placement. As of August 31, 2020, NAF had issued 484,522 investment units out of 4,000,000 total authorized units. NAF’s investment units were listed on the J-REIT section of the Tokyo Stock Exchange in August 2006 upon the completion of a public offering. As the Act on Investment Trusts and Investment Corporations does not contain any provision for the issuance of more than one class of units, NAF’s investment units comprise the sole class of units authorized and issued by NAF.

Changes in Total Number of Investment Units Issued and Outstanding There are no changes in units outstanding and paid-in capital over the last five years.
Market Price of Units
High/Low (closing price) of units on the Tokyo Stock Exchange:
29th Period
March 1, 2020 to August 31, 2020
28th Period September 1, 2019
to February 29, 2020
27th Period March 1, 2019
to August 31, 2019
26th Period September 1, 2018
to February 28, 2019
25th Period March 1, 2018
to August 31, 2018
(Yen) (Yen) (Yen) (Yen) (Yen)
High ¥688,000 ¥728,000 ¥682,000 ¥582,000 ¥532,000 Low 442,000 652,000 544,000 499,000 455,500
Borrowings
Borrowings from financial institution as of August 31, 2020 are shown below. Short-term loans
Lender Balance (Yen in millions)
Interest rate (Note 1)
Date of maturity (Note 2)
Repayment method
Use of funds Notes
Sumitomo Mitsui Trust Bank, Limited ¥1,000 0.09909% November 30, 2020
Bullet payment (Note 3)
Unsecured/ unguaranteed/
pari passu (Note 4)
The 77 Bank, Ltd. 1,000 0.08000% (Note 5) November 30, 2020
Mizuho Bank, Ltd. 1,000 0.09409% (Note 6) November 30, 2020
Total short-term loans ¥3,000

Long-term loans (Note 7) Lender Balance
(Yen in millions) Interest rate
(Note 1) Date of maturity Repayment method
Use of funds Notes
Sumitomo Mitsui Banking Corporation
¥ 3,000 0.65750% May 28, 2021
Bullet payment (Note 3)
Unsecured/ unguaranteed/
pari passu (Note 4)
2,000 0.51375% November 30, 2021
1,500 0.18500% (Note 5) July 31, 2029
2,000 0.19950% August 15, 2022 2,000 0.20700% September 30, 2022 2,000 0.16000% May 31, 2023 4,500 0.18000% February 29, 2024 1,000 0.26000% February 27, 2026
Sumitomo Mitsui Trust Bank, Limited
2,000 0.44625% September 30, 2020
1,500 0.10000% (Note 5) August 31, 2023
1,000 0.14000% (Note 5) August 31, 2027
NIPPON LIFE INSURANCE COMPANY
2,000 0.93375% November 30, 2022 3,000 0.98750% May 31, 2024 1,000 0.51375% November 30, 2021
Development Bank of Japan Inc.
3,000 1.05400% April 11, 2023 2,500 1.32900% February 6, 2024 2,500 1.39800% August 6, 2024 2,500 1.17750% April 1, 2025 2,000 0.18248% December 30, 2027 4,000 0.54779% April 18, 2029 3,000 0.64293% October 21, 2030
The Hachijuni Bank, Ltd. 1,000 0.63900% April 9, 2021 1,000 0.23550% September 17, 2024 1,500 0.29000% May 29, 2026
Mizuho Bank, Ltd.
2,000 0.82500% November 30, 2021 1,000 0.11988% February 26, 2021 1,000 0.18561% May 31, 2022 1,000 0.21561% May 31, 2023 2,000 0.42456% March 31, 2027 1,000 0.48000% August 30, 2030
The Chugoku Bank, Limited
2,000 0.55000% July 31, 2023 2,000 0.21880% May 29, 2026 1,000 0.22000% November 29, 2024 1,000 0.24000% January 5, 2026
Shinsei Bank, Limited 1,000 1.22500% January 19, 2023 1,000 0.65750% May 28, 2021 1,000 0.99250% May 28, 2024
Shinkin Central Bank
2,000 0.38880% January 29, 2027 3,000 0.30950% July 31, 2025 2,000 0.12930% January 31, 2025 2,000 0.26930% January 31, 2028 3,000 0.38178% December 29, 2028

Lender Balance (Yen in millions)
Interest rate (Note 1) Date of maturity Repayment
method Use of funds Notes
The Bank of Fukuoka, Ltd.
¥ 2,000 0.43500% February 26, 2027
Bullet payment (Note 3)
Unsecured/ unguaranteed/
pari passu (Note 4)
2,000 0.33500% April 30, 2026 1,000 0.65000% January 8, 2032 1,000 0.45000% October 31, 2029 1,500 0.68000% April 30, 2032
MUFG Bank, Ltd.
2,000 0.72750% September 15, 2020 1,000 0.96250% August 23, 2021 3,000 0.79375% March 7, 2022 3,000 0.85500% September 7, 2022 3,000 0.76500% May 31, 2022 2,000 0.53250% October 1, 2021 3,000 0.62125% October 3, 2022 3,000 0.54500% April 27, 2029 2,000 0.48000% March 15, 2030
The Norinchukin Bank
3,000 0.69500% November 30, 2020 2,000 0.43250% December 30, 2021 1,000 0.27000% December 30, 2025 2,000 0.37000% April 28, 2028 2,000 0.32000% July 1, 2027
Mizuho Trust & Banking Co., Ltd.
1,000 1.04000% June 14, 2021 1,000 1.15750% June 14, 2022 1,000 1.02438% February 23, 2022 1,000 1.08625% August 23, 2022 1,500 0.38380% March 29, 2028 1,000 0.42000% February 28, 2029
The Yamaguchi Bank, Ltd.
1,000 1.26000% June 14, 2023 1,000 1.28125% July 19, 2023 1,000 0.98750% May 31, 2024 1,000 0.55500% April 27, 2029
The Daishi Bank, Ltd. 1,000 0.40062% June 30, 2021 1,000 0.09000% July 30, 2021
TAIJU LIFE INSURANCE COMPANY LIMITED 1,000 1.04375% March 28, 2024
The Ashikaga Bank, Ltd. 2,000 0.27000% December 30, 2025 DAIDO LIFE INSURANCE
COMPANY 1,000 0.57875% June 30, 2021
TAIYO LIFE INSURANCE COMPANY 2,000 0.64750% December 30, 2024
The Iyo Bank, Ltd. 1,000 0.09000% March 31, 2022
The Yamanashi Chuo Bank, Ltd.
1,000 0.31630% June 30, 2026 1,000 0.45000% December 17, 2029 1,000 0.65000% December 16, 2031
The 77 Bank, Ltd. 1,000 0.40500% June 30, 2028 1,000 0.48000% March 29, 2030
The Chiba Bank, Ltd. 1,000 0.32250% September 3, 2025
SUMITOMO LIFE INSURANCE COMPANY
1,000 0.66000% September 3, 2030 1,000 0.68000% April 30, 2032 1,000 0.48000% July 1, 2030

Lender Balance (Yen in millions)
Interest rate (Note 1) Date of maturity Repayment
method Use of funds Notes
Mitsui Sumitomo Insurance Company, Limited
¥ 1,000 0.29000% October 30, 2026 Bullet
payment (Note 3) Unsecured/
unguaranteed/ pari passu (Note 4)
1,000 0.32000% August 31, 2027
Total long-term loans ¥150,500 Total loans ¥153,500
Notes: 1. “Interest rate” is rounded to the nearest hundred-thousandth. The weighted average interest rate is presented for the outstanding balance of short-term loans if the institution has provided more than one short-term loan.
2. The earliest maturity of short-term loans is presented if the institution has provided more than one short-term loan. 3. Use of the proceeds of debt financing included purchase of property or real estate trust beneficiary interests, refinancing of other loans, and operating expenses. 4. The loan agreements between NAF and each financial institution stipulate that the above loans from all financial institutions rank pari passu to each other. 5. The interest rate is applied from August 31, 2020 to September 29, 2020. 6. The interest rate is applied from August 31, 2020 to November 29, 2020. 7. The expected annual maturities of long-term loans within five years (excluding maturities within one year) of the balance sheet date are as follows.
(Yen in millions) 1 to 2 years 2 to 3 years 3 to 4 years 4 to 5 years
Amount ¥22,000 ¥22,500 ¥15,500 ¥11,500 Bonds
Issue Issue date Balance as of
August 31, 2020 (Yen in millions)
Coupon Maturity date Redemption Use of
proceeds Notes
No.3 Unsecured Bonds (green bonds) July 16, 2020 ¥2,000 0.260% July 16, 2025
Bullet payment (Note 1) (Note 2)
No.4 Unsecured Bonds (green bonds) July 16, 2020 2,000 0.520% July 16, 2030
Total ¥4,000 Notes: 1. Use of proceeds includes repayment of borrowings.
2. These bonds are only issued to rank pari passu with other bonds issued. 3. The total amount of bonds repayable within 5 years of the date of the balance sheet and expected to be repaid by specific year(s) is as follows.
(Yen in millions) 1 to 2 years 2 to 3 years 3 to 4 years 4 to 5 years
Unsecured Bonds — — — ¥2,000

Capital Expenditures 1. Planned
NAF is planning or conducting the following capital expenditures for the renovation of its properties. The amounts below include repairs and maintenance costs that will be expensed as incurred. Moreover, in addition to a steady planning of expenditures for construction, repair and renovation of facilities, a plan of renewal construction is being implemented in order to increase competitive power in the market as well as to increase the level of tenant satisfaction.
Name of property Objective Estimated duration
Estimated amounts
Total amounts Payment for the current period
(March 1, 2020 to August 31, 2020)
Cumulative amount paid
(Yen in millions)
Okawabata Apartment Communities, Riverpoint Tower and Other
Renovation of rentable areas
From September 2020 to February 2021 ¥80 ¥— ¥—
Okawabata Apartment Communities, Okawabata Parking Lot
Renewal of car compartments for mechanical parking system
From November 2020 to December 2020 72 — —
Park Axis Naka Gofukumachi Repair of outside walls From October 2020 to January 2021 32 — —
Okawabata Apartment Communities, Okawabata Parking Lot
Replacement of parts for mechanical parking system
From July 2020 to February 2021 23 — —
2. Capital Expenditures for the Current Period
The following table sets forth the capital expenditures for the current period. NAF posted ¥296 million in capital expenditures together with ¥519 million for repairs and maintenance expenses.
Name of property Objective Period Expenditure (Yen in millions)
Okawabata Apartment Communities, Park Side Wings Renewal of air conditioners in rentable areas From September 2019
to March 2020 ¥ 76
Okawabata Apartment Communities, Riverpoint Tower and Other
Renovation of 6 rentable areas From March 2020 to August 2020 52
Park Axis Shin Itabashi Repair of outside walls From March 2020 to August 2020 18
Other capital expenditures From March 2020 to August 2020 148
Total ¥ 296

Expenses regarding Entrustment, etc. The following table sets forth the breakdown of entrustment fees, etc. paid by NAF.
Yen in millions
29th Period March 1, 2020
to August 31, 2020
28th Period September 1, 2019
to February 29, 2020
27th Period March 1, 2019
to August 31, 2019
Asset management fees ¥ 864 ¥ 856 ¥ 928 Asset custody fees 14 14 14 Agent fees (stock transfer, accounting and administrative) 28 28 35 Directors’ remuneration 7 7 7 Auditor’s fees 12 12 12 Other expenses 347 339 291
Total ¥1,274 ¥1,259 ¥1,289
Related Party Transactions 1. Transactions
Category Total amount paid
(A) (Yen in millions)
Description of transactions with related parties (Note 1) B/A
(Note 2) Paid to Amount of
payment (B) (Yen in millions)
Acquisition of real estate and real estate held in trust ¥6,484 Mitsui Fudosan Residential Co., Ltd. ¥2,420 37.3%
2. Fees Paid for the Period from March 1, 2020 to August 31, 2020
Category Total fees paid (A) (Yen in millions)
Description of transactions with related parties (Note 1) B/A
(Note 2) Paid to Amount of
payment (B) (Yen in millions)
Property management fees ¥753 Mitsui Fudosan Residential Lease Co., Ltd. ¥753 100.0%
Building management fees 380 Mitsui Fudosan Residential Lease Co., Ltd. 375 98.7% Mitsui Fudosan Realty Co., Ltd. 4 1.3%
Operation management fees 4 Mitsui Fudosan Investment Advisors, Inc. 4 100.0%
Leasing-related service fees, etc. 143
RESIDENT FIRST CO., LTD. 12 8.4% Mitsui Fudosan Realty Co., Ltd. 1 1.0% Mitsui Fudosan Realty Tohoku Co., Ltd. 1 0.8% Mitsui Home Estate Co., Ltd. 0 0.1% Mitsui Fudosan Realty Kyushu Co., Ltd. 0 0.0%
3. Other Payments to Related Parties (Note 1)
Paid to Amount of payment (Yen in millions) Item
Mitsui Fudosan Reform Co., Ltd. ¥16 Repair and maintenance costs Mitsui Fudosan Facilities Co., Ltd. 10 Repair and maintenance costs Accommodation First Co., Ltd. 7 Repair and maintenance costs Mitsui Fudosan Residential Service Hokkaido Co., Ltd. 1 Repair and maintenance costs
Notes: 1. “Related parties” means parties defined in the government ordinance regarding the Act on Investment Trusts and Investment Corporations, principally, parties related to an asset management company.
2. Figures indicate percentages of total price.

Financial Statements
Balance Sheets Nippon Accommodations Fund Inc. As of August 31, 2020 and February 29, 2020
Yen in millions U.S. dollars in thousands
(Note 1)
29th Period
As of August 31, 2020 28th Period
As of February 29, 2020 29th Period
As of August 31, 2020 Assets Current assets:
Cash and cash equivalents (Note 2, 12) ¥ 11,574 ¥ 12,741 $ 109,851 Rent receivables 1,498 1,482 14,217 Other current assets 82 94 778
Total current assets 13,155 14,319 124,857 Investment properties (Note 2, 3):
Land including trust accounts 194,747 189,792 1,848,395 Depreciable property and improvements including trust accounts 140,866 138,785 1,336,996 Accumulated depreciation (44,721) (42,723) (424,458)
Total investment properties 290,892 285,853 2,760,933 Other assets 1,793 1,773 17,017 Total Assets ¥ 305,840 ¥ 301,946 $ 2,902,809
Liabilities and Net Assets
Liabilities Current liabilities:
Short-term loans (Note 4, 12) ¥ 3,000 ¥ 3,000 $ 28,473 Long-term loans due within one year (Note 4, 12) 18,000 19,500 170,842 Accounts payable 1,354 1,490 12,851 Rent received in advance 1,854 1,846 17,596 Accrued expenses and other liabilities 235 228 2,230
Total current liabilities 24,445 26,066 232,014 Long-term liabilities:
Long-term loans (Note 4, 12) 132,500 131,000 1,257,593 Bonds (Note 4, 12) 4,000 — 37,965 Tenant security deposits (Note 12) 3,682 3,699 34,946
Total long-term liabilities 140,182 134,699 1,330,504 Total Liabilities ¥ 164,627 ¥ 160,765 $ 1,562,518
Net Assets
Unitholders’ capital (Note 5) ¥ 135,603 ¥ 135,603 $ 1,287,044 Retained earnings 5,609 5,577 53,236
Total Net Assets ¥ 141,213 ¥ 141,181 $ 1,340,290 Total Liabilities and Net Assets ¥ 305,840 ¥ 301,946 $ 2,902,809
The accompanying notes to financial statements are an integral part of these statements.

Statements of Income Nippon Accommodations Fund Inc. March 1, 2020 to August 31, 2020, September 1, 2019 to February 29, 2020 and March 1, 2019 to August 31, 2019
Yen in millions U.S. dollars in thousands
(Note 1)
29th Period March 1, 2020
to August 31, 2020
28th Period September 1, 2019
to February 29, 2020
27th Period March 1, 2019
to August 31, 2019
29th Period March 1, 2020
to August 31, 2020
Revenues Rental (Note 6) ¥ 10,999 ¥ 10,934 ¥ 10,877 $ 104,394 Other revenues related to property leasing
(Note 6) 521 467 544 4,944
Gain on sale of investment properties (Note 7) — — 939 — Total revenues 11,520 11,401 12,361 109,339
Operating Expenses Property management fees (Note 6) 1,169 1,174 1,187 11,095 Real estate taxes and insurance (Note 6) 636 621 627 6,036 Repairs and maintenance (Note 6) 519 465 513 4,925 Other rental expenses (Note 6) 588 575 638 5,580 Depreciation and amortization (Note 6) 1,999 1,998 2,020 18,973 Asset management fees 864 856 928 8,200 Other expenses 410 402 361 3,891
Total operating expenses 6,188 6,094 6,277 58,731 Operating Income 5,332 5,307 6,084 50,607 Interest and other income 12 21 6 113 Interest expense (434) (454) (456) (4,119) Other expenses (11) (8) (9) (104) Income before Income Taxes 4,898 4,866 5,624 46,488 Current and deferred income taxes (Note 9) 0 0 0 0 Net Income ¥ 4,897 ¥ 4,865 ¥ 5,623 $ 46,478
The accompanying notes to financial statements are an integral part of these statements.
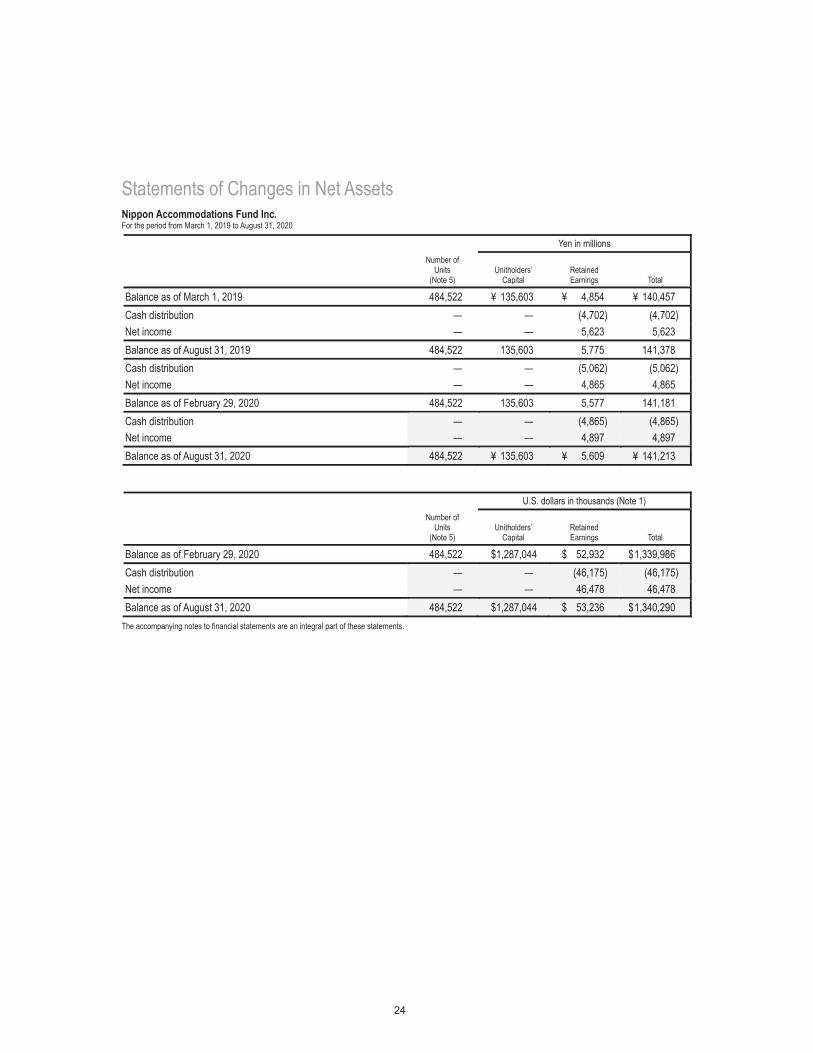
Statements of Changes in Net Assets Nippon Accommodations Fund Inc. For the period from March 1, 2019 to August 31, 2020
Yen in millions
Number of Units
(Note 5) Unitholders’
Capital Retained Earnings Total
Balance as of March 1, 2019 484,522 ¥ 135,603 ¥ 4,854 ¥ 140,457 Cash distribution — — (4,702) (4,702) Net income — — 5,623 5,623 Balance as of August 31, 2019 484,522 135,603 5,775 141,378 Cash distribution — — (5,062) (5,062) Net income — — 4,865 4,865 Balance as of February 29, 2020 484,522 135,603 5,577 141,181 Cash distribution — — (4,865) (4,865) Net income — — 4,897 4,897 Balance as of August 31, 2020 484,522 ¥ 135,603 ¥ 5,609 ¥ 141,213
U.S. dollars in thousands (Note 1)
Number of Units
(Note 5) Unitholders’
Capital Retained Earnings Total
Balance as of February 29, 2020 484,522 $1,287,044 $ 52,932 $ 1,339,986 Cash distribution — — (46,175) (46,175) Net income — — 46,478 46,478 Balance as of August 31, 2020 484,522 $1,287,044 $ 53,236 $ 1,340,290
The accompanying notes to financial statements are an integral part of these statements.

Statements of Cash Flows Nippon Accommodations Fund Inc. March 1, 2020 to August 31, 2020, September 1, 2019 to February 29, 2020 and March 1, 2019 to August 31, 2019
Yen in millions U.S. dollars in thousands
(Note 1)
29th Period March 1, 2020
to August 31, 2020
28th Period September 1, 2019
to February 29, 2020
27th Period March 1, 2019
to August 31, 2019
29th Period March 1, 2020
to August 31, 2020
Cash Flows from Operating Activities: Income before income taxes ¥ 4,898 ¥ 4,866 ¥ 5,624 $ 46,488 Depreciation and amortization 1,999 1,998 2,021 18,973 Amortization of bond issue costs 0 — — 0 Interest expense 434 454 456 4,119 (Increase) Decrease in rent receivables (16) (76) 41 (151) Increase (Decrease) in accounts payable (136) 77 259 (1,290) Increase (Decrease) in rents received
in advance 8 35 4 75 Decrease in investment properties
due to sales — — 2,086 — Cash payments of interest expense (441) (460) (450) (4,185) (Increase) Decrease in consumption tax
refund receivable 12 (12) — 113 Other, net 29 (50) 59 275
Net Cash Provided by Operating Activities 6,790 6,832 10,103 64,445 Cash Flows from Investing Activities:
Payments for purchases of investment properties (7,037) (698) (6,193) (66,790)
Proceeds from tenant security deposits 303 243 406 2,875 Payments for tenant security deposits (320) (272) (379) (3,037) Other, net (7) (3) (3) (66)
Net Cash Used in Investing Activities (7,062) (730) (6,170) (67,027) Cash Flows from Financing Activities:
Proceeds from short-term loans 4,000 13,000 50,000 37,965 Repayment of short-term loans (4,000) (16,000) (52,000) (37,965) Proceeds from long-term loans 11,500 11,500 15,500 109,149 Repayment of long-term loans (11,500) (9,500) (8,500) (109,149) Proceeds from bonds 4,000 — — 37,965 Payments for bond issue costs (30) — — (284) Payment of distribution (4,865) (5,063) (4,702) (46,175)
Net Cash Provided by (Used in) Financing Activities (895) (6,063) 297 (8,494) Net Change in Cash and Cash Equivalents (1,167) 38 4,231 (11,076) Cash and Cash Equivalents at the Beginning
of the Period 12,741 12,702 8,471 120,928 Cash and Cash Equivalents at the End
of the Period (Note 2) ¥ 11,574 ¥ 12,741 ¥ 12,702 $ 109,851 The accompanying notes to financial statements are an integral part of these statements.

Notes to Financial Statements Nippon Accommodations Fund Inc. March 1, 2020 to August 31, 2020, September 1, 2019 to February 29, 2020 and March 1, 2019 to August 31, 2019
Note 1 Organization and Basis of Presentation
Organization Nippon Accommodations Fund Inc. (hereinafter “NAF”) was established on October 12, 2005 as an investment corporation under the Act
on Investment Trusts and Investment Corporations with Mitsui Fudosan Accommodations Fund Management Co., Ltd. (hereinafter “MFAFM”) acting as a sponsor. Registration with the Kanto Local Finance Bureau of the Ministry of Finance was completed on November 11, 2005 and NAF started acquisition of properties on November 30, 2005.
NAF is an externally managed real estate fund, formed as an investment corporation. MFAFM, as NAF’s asset management company, is engaged in the acquisition, management, and renovation of accommodation assets. MFAFM is a 100% subsidiary of Mitsui Fudosan Co., Ltd.
On August 3, 2006, NAF had raised approximately ¥40,000 million through an initial public offering of investment units. Those investment units are listed on the J-REIT section of the Tokyo Stock Exchange.
As of August 31, 2020, NAF had ownership and/or beneficiary interests in 128 properties containing approximately 513,445 square meters of rentable space. As of August 31, 2020, NAF had leased approximately 494,599 square meters to tenants. The occupancy rate for the properties was approximately 96.3%.
Basis of Presentation
The accompanying financial statements have been prepared in accordance with the provisions set forth in the Act on Investment Trusts and Investment Corporations and the Financial Instruments and Exchange Act and its related accounting regulations, and in conformity with accounting principles generally accepted in Japan (hereinafter “Japanese GAAP”), which are different in certain respects as to application and disclosure requirements of International Financial Reporting Standards.
The accompanying financial statements have been restructured and translated into English from the financial statements of NAF prepared in accordance with Japanese GAAP and filed with the appropriate Local Finance Bureau of the Ministry of Finance as required by the Financial Instruments and Exchange Act. Some supplementary information included in the statutory Japanese language financial statements, but not required for fair presentation, is not presented in the accompanying financial statements. NAF does not prepare consolidated financial statements, as NAF has no subsidiaries.
Amounts less than 1 million yen have been omitted. As a result, the totals in Japanese yen shown in the financial statements do not necessarily agree with the sum of the individual amounts.
The translation of the Japanese yen amounts into U.S. dollars is included solely for the convenience of readers outside Japan, using the approximate exchange rate on August 31, 2020, which was ¥105.36 to U.S.$1.00. The convenience translation should not be construed as representation that the Japanese yen amounts have been, or could in future be, converted into U.S. dollars at this or any other rate of exchange.
Note 2 Summary of Significant Accounting Policies
Cash and Cash Equivalents NAF considers all highly liquid investments with original maturity of three months or less to be cash and cash equivalents.
Investment Properties Investment properties are recorded at cost, which includes the purchase price and related costs and expenses for acquisition of the
properties and the beneficiary interests of properties in trust. Property and equipment balances are depreciated using the straight-line method over the estimated useful lives. The estimated useful lives of the principal investment properties (including assets held in trust) are as follows:
Buildings and improvements 2-63 years Structures 2-60 years Machinery and equipment 2-45 years Tools, furniture and fixtures 2-15 years
Costs related to the renovation, construction and improvement of properties are capitalized. Expenditures for repairs and maintenance which do not add to the value or prolong the useful life of a property, are expensed as incurred.
Deferred Assets
Bond issue costs are amortized over the period of the bonds under the straight-line method.
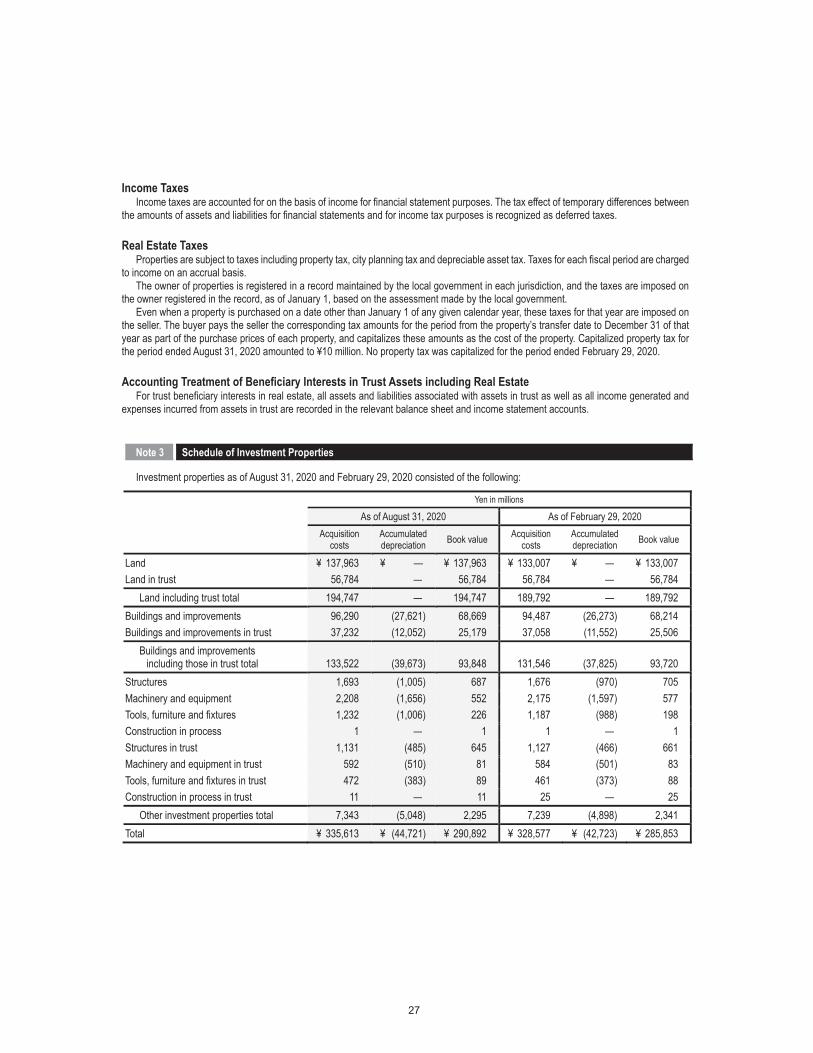
Income Taxes Income taxes are accounted for on the basis of income for financial statement purposes. The tax effect of temporary differences between
the amounts of assets and liabilities for financial statements and for income tax purposes is recognized as deferred taxes.
Real Estate Taxes Properties are subject to taxes including property tax, city planning tax and depreciable asset tax. Taxes for each fiscal period are charged
to income on an accrual basis. The owner of properties is registered in a record maintained by the local government in each jurisdiction, and the taxes are imposed on
the owner registered in the record, as of January 1, based on the assessment made by the local government. Even when a property is purchased on a date other than January 1 of any given calendar year, these taxes for that year are imposed on
the seller. The buyer pays the seller the corresponding tax amounts for the period from the property’s transfer date to December 31 of that year as part of the purchase prices of each property, and capitalizes these amounts as the cost of the property. Capitalized property tax for the period ended August 31, 2020 amounted to ¥10 million. No property tax was capitalized for the period ended February 29, 2020.
Accounting Treatment of Beneficiary Interests in Trust Assets including Real Estate
For trust beneficiary interests in real estate, all assets and liabilities associated with assets in trust as well as all income generated and expenses incurred from assets in trust are recorded in the relevant balance sheet and income statement accounts.
Note 3 Schedule of Investment Properties
Investment properties as of August 31, 2020 and February 29, 2020 consisted of the following:
Yen in millions
As of August 31, 2020 As of February 29, 2020
Acquisition costs
Accumulated depreciation Book value Acquisition
costs Accumulated depreciation Book value
Land ¥ 137,963 ¥ — ¥ 137,963 ¥ 133,007 ¥ — ¥ 133,007 Land in trust 56,784 — 56,784 56,784 — 56,784
Land including trust total 194,747 — 194,747 189,792 — 189,792 Buildings and improvements 96,290 (27,621) 68,669 94,487 (26,273) 68,214 Buildings and improvements in trust 37,232 (12,052) 25,179 37,058 (11,552) 25,506
Buildings and improvements including those in trust total 133,522 (39,673) 93,848 131,546 (37,825) 93,720
Structures 1,693 (1,005) 687 1,676 (970) 705 Machinery and equipment 2,208 (1,656) 552 2,175 (1,597) 577 Tools, furniture and fixtures 1,232 (1,006) 226 1,187 (988) 198 Construction in process 1 — 1 1 — 1 Structures in trust 1,131 (485) 645 1,127 (466) 661 Machinery and equipment in trust 592 (510) 81 584 (501) 83 Tools, furniture and fixtures in trust 472 (383) 89 461 (373) 88 Construction in process in trust 11 — 11 25 — 25
Other investment properties total 7,343 (5,048) 2,295 7,239 (4,898) 2,341 Total ¥ 335,613 ¥ (44,721) ¥ 290,892 ¥ 328,577 ¥ (42,723) ¥ 285,853

Note 4 Short-Term Loans and Long-Term Debt
The annual interest rate on short-term loans as of August 31, 2020 was 0.1% and the rate as of February 29, 2020 was 0.1%. Long-term debt consists of the following:
Yen in millions
As of August 31, 2020 As of February 29, 2020
Unsecured loans due 2020 to 2032 principally from banks and insurance companies with interest rates mainly ranging from 0.1% to 1.4% ¥150,500 ¥150,500
0.260% unsecured bonds due 2025 2,000 — 0.520% unsecured bonds due 2030 2,000 — ¥154,500 ¥150,500
The annual maturities of long-term debt as of August 31, 2020 were as follows:
Yen in millions
Due after one to two years ¥22,000 Due after two to three years 22,500 Due after three to four years 15,500 Due after four to five years 13,500 Due after five years 63,000
NAF currently has commitment line contracts of ¥15,000 million with three financial institutions. The unused amount of such commitment line was ¥15,000 million as of August 31, 2020.
Note 5 Unitholders’ Capital
As of August 31, 2020 As of February 29, 2020 As of August 31, 2019 Total number of common units authorized 4,000,000 4,000,000 4,000,000 Total number of common units issued and outstanding 484,522 484,522 484,522
NAF shall maintain minimum net assets of at least ¥50 million as required by the Act on Investment Trusts and Investment Corporations.
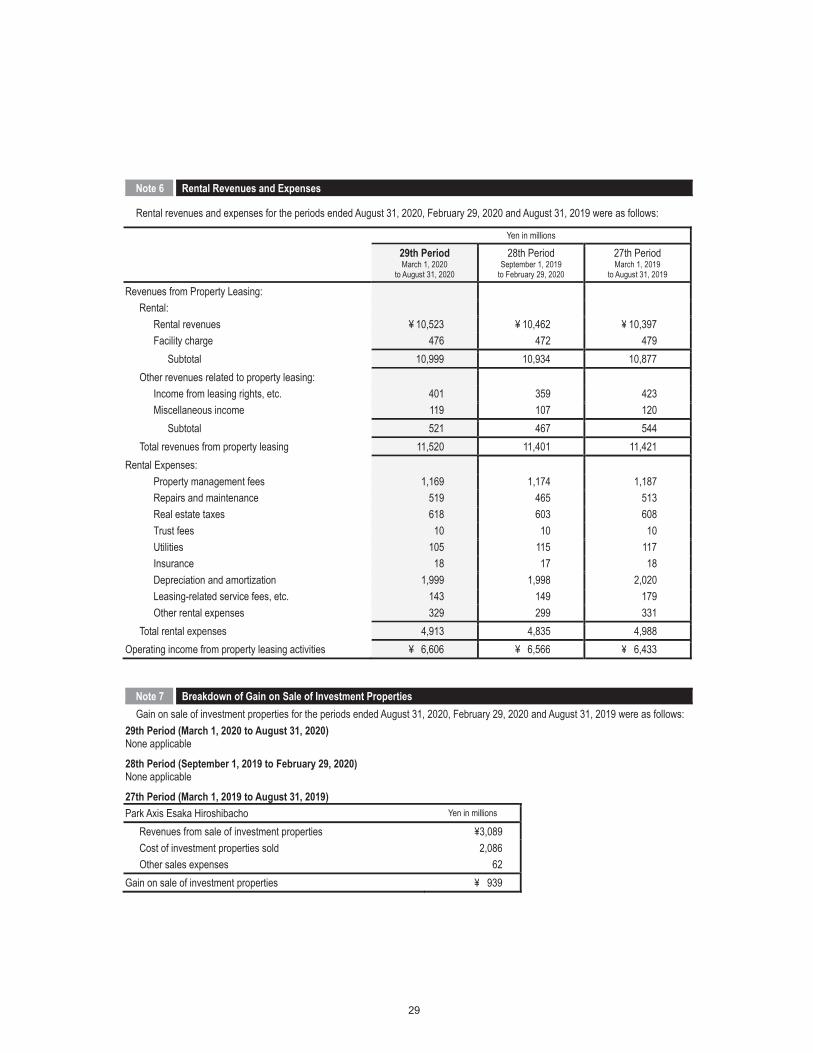
Note 6 Rental Revenues and Expenses
Rental revenues and expenses for the periods ended August 31, 2020, February 29, 2020 and August 31, 2019 were as follows:
Yen in millions
29th Period March 1, 2020
to August 31, 2020
28th Period September 1, 2019
to February 29, 2020
27th Period March 1, 2019
to August 31, 2019
Revenues from Property Leasing: Rental:
Rental revenues ¥ 10,523 ¥ 10,462 ¥ 10,397 Facility charge 476 472 479
Subtotal 10,999 10,934 10,877 Other revenues related to property leasing:
Income from leasing rights, etc. 401 359 423 Miscellaneous income 119 107 120
Subtotal 521 467 544 Total revenues from property leasing 11,520 11,401 11,421
Rental Expenses: Property management fees 1,169 1,174 1,187 Repairs and maintenance 519 465 513 Real estate taxes 618 603 608 Trust fees 10 10 10 Utilities 105 115 117 Insurance 18 17 18 Depreciation and amortization 1,999 1,998 2,020 Leasing-related service fees, etc. 143 149 179 Other rental expenses 329 299 331
Total rental expenses 4,913 4,835 4,988 Operating income from property leasing activities ¥ 6,606 ¥ 6,566 ¥ 6,433
Note 7 Breakdown of Gain on Sale of Investment Properties Gain on sale of investment properties for the periods ended August 31, 2020, February 29, 2020 and August 31, 2019 were as follows:
29th Period (March 1, 2020 to August 31, 2020) None applicable
28th Period (September 1, 2019 to February 29, 2020) None applicable
27th Period (March 1, 2019 to August 31, 2019) Park Axis Esaka Hiroshibacho Yen in millions
Revenues from sale of investment properties ¥3,089 Cost of investment properties sold 2,086 Other sales expenses 62
Gain on sale of investment properties ¥ 939

Note 8 Leases
NAF leases some of its investment properties to outside parties under non-cancelable operating leases. As of August 31, 2020 and February 29, 2020, future minimum rental revenues under the non-cancelable operating leases were as follows:
Yen in millions
As of August 31, 2020 As of February 29, 2020
Due within one year ¥ 825 ¥1,141 Due after one year 939 1,029
Total ¥1,764 ¥2,170
Note 9 Income Taxes
NAF is subject to income taxes in Japan. The effective tax rates on NAF’s income based on applicable Japanese tax law were 0.02%, 0.02% and 0.02% for the periods ended August 31, 2020, February 29, 2020 and August 31, 2019, respectively. The following table summarizes the significant differences between the statutory tax rates and NAF’s effective tax rates for financial statement purposes.
29th Period March 1, 2020
to August 31, 2020
28th Period September 1, 2019
to February 29, 2020
27th Period March 1, 2019
to August 31, 2019
Statutory effective tax rate 31.46% 31.51% 31.51% Deductible distributions paid (31.45) (31.50) (28.36) Others 0.01 0.01 (3.13) Effective tax rate 0.02% 0.02% 0.02%
The tax effects of significant temporary differences that resulted in net deferred tax assets or liabilities as of August 31, 2020, February 29, 2020 and August 31, 2019 were as follows:
Yen in thousands
As of August 31, 2020 As of February 29, 2020 As of August 31, 2019 Deferred tax assets:
Enterprise taxes ¥14 ¥10 ¥13 Total deferred tax assets 14 10 13 Net deferred tax assets ¥14 ¥10 ¥13
NAF was established as an investment corporation under the Act on Investment Trusts and Investment Corporations, and as long as an investment corporation distributes to its unitholders at least 90% of earnings available for dividends for a period and other requirements prescribed in Japanese tax regulations are met, the investment corporation is allowed to deduct the total amount of distributions paid in calculating its taxable income under Japanese tax regulations.

Note 10 Per Unit Information
Information about earnings per unit for the periods ended August 31, 2020, February 29, 2020 and August 31, 2019 and net assets per unit as of August 31, 2020, February 29, 2020 and August 31, 2019 were as follows.
The computation of earnings per unit is based on the weighted average number of common units outstanding during the period. The computation of net assets per unit is based on the number of common units outstanding at each period end.
Yen
29th Period March 1, 2020
to August 31, 2020
28th Period September 1, 2019
to February 29, 2020
27th Period March 1, 2019
to August 31, 2019
Earnings per Unit: Net income ¥ 10,108 ¥ 10,041 ¥ 11,606 Weighted average number of
common units outstanding 484,522 484,522 484,522
As of August 31, 2020 As of February 29, 2020 As of August 31, 2019
Net Assets per Unit ¥ 291,448 ¥ 291,382 ¥ 291,790
Note 11 Transactions with Related Parties
(March 1, 2020 - August 31, 2020) (1) Parent Company and Major Corporate Unitholders: None applicable (2) Affiliates: None applicable (3) Sister Companies: None applicable (4) Directors and Major Individual Unitholders
Classification Name Principal business or occupation Nature of transaction
Amount of transaction
(Yen in millions) Account
Balance at the end of the period
(Yen in millions)
Director and/or close relative Tateyuki Ikura
Executive Director of NAF and
President & CEO of MFAFM
Payment of asset management fee to MFAFM (Note 1)
¥916 (Note 2) Accounts payable ¥950
Payment for the provision of general administration relating to organizational management to
MFAFM (Note 3) ¥0 — —
Notes: 1. Tateyuki Ikura entered into this transaction as a representative of MFAFM, and this amount is subject to the conditions set forth in the by-laws of NAF. 2. The amount of asset management fees includes ¥52 million of management fees related to acquisition of properties included in the book value of each investment
property, etc. 3. Tateyuki Ikura entered into this transaction as a representative of MFAFM, and this amount is set forth in the “General Administration Agreement relating to Organizational
Management” concluded between NAF and MFAFM. 4. “Amount of transaction” does not include consumption taxes. “Balance at the end of the period” includes consumption taxes.

(September 1, 2019 - February 29, 2020) (1) Parent Company and Major Corporate Unitholders: None applicable (2) Affiliates: None applicable (3) Sister Companies: None applicable (4) Directors and Major Individual Unitholders
Classification Name Principal business or occupation Nature of transaction
Amount of transaction
(Yen in millions) Account
Balance at the end of the period
(Yen in millions)
Director and/or close relative Tateyuki Ikura
Executive Director of NAF and
President & CEO of MFAFM
Payment of asset management fee to MFAFM (Note 1)
¥856 (Note 2) Accounts payable ¥941
Payment for the provision of general administration relating to organizational management to
MFAFM (Note 3) ¥1 — —
Notes: 1. Tateyuki Ikura entered into this transaction as a representative of MFAFM, and this amount is subject to the conditions set forth in the by-laws of NAF. 2. No fees for management related to acquisition of properties included in the book value of each investment property, etc. were required to be disclosed as asset
management fees. 3. Tateyuki Ikura entered into this transaction as a representative of MFAFM, and this amount is set forth in the “General Administration Agreement relating to Organizational
Management” concluded between NAF and MFAFM. 4. “Amount of transaction” does not include consumption taxes. “Balance at the end of the period” includes consumption taxes.
(March 1, 2019 - August 31, 2019) (1) Parent Company and Major Corporate Unitholders: None applicable (2) Affiliates: None applicable (3) Sister Companies: None applicable (4) Directors and Major Individual Unitholders
Classification Name Principal business or occupation Nature of transaction
Amount of transaction
(Yen in millions) Account
Balance at the end of the period
(Yen in millions)
Director and/or close relative Tateyuki Ikura
Executive Director of NAF and
President & CEO of MFAFM
Payment of asset management fee to MFAFM (Note 1)
¥972 (Note 2) Accounts payable ¥1,002
Payment for the provision of general administration relating to organizational management to
MFAFM (Note 3) ¥6 — —
Notes: 1. Tateyuki Ikura entered into this transaction as a representative of MFAFM, and this amount is subject to the conditions set forth in the by-laws of NAF. 2. The amount of asset management fees includes ¥44 million of management fees related to acquisition of properties included in the book value of each investment
property, etc. 3. Tateyuki Ikura entered into this transaction as a representative of MFAFM, and this amount is set forth in the “General Administration Agreement relating to Organizational
Management” concluded between NAF and MFAFM. 4. “Amount of transaction” does not include consumption taxes. “Balance at the end of the period” includes consumption taxes.
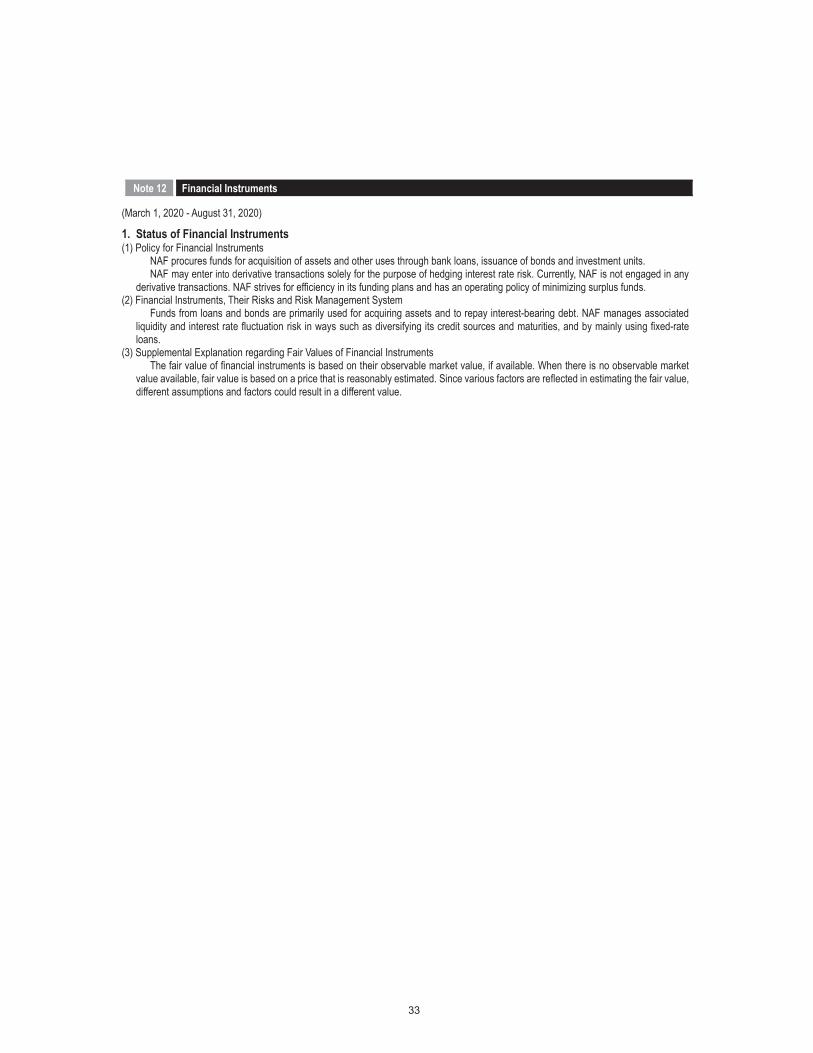
Note 12 Financial Instruments
(March 1, 2020 - August 31, 2020)
1. Status of Financial Instruments (1) Policy for Financial Instruments
NAF procures funds for acquisition of assets and other uses through bank loans, issuance of bonds and investment units. NAF may enter into derivative transactions solely for the purpose of hedging interest rate risk. Currently, NAF is not engaged in any
derivative transactions. NAF strives for efficiency in its funding plans and has an operating policy of minimizing surplus funds. (2) Financial Instruments, Their Risks and Risk Management System
Funds from loans and bonds are primarily used for acquiring assets and to repay interest-bearing debt. NAF manages associated liquidity and interest rate fluctuation risk in ways such as diversifying its credit sources and maturities, and by mainly using fixed-rate loans.
(3) Supplemental Explanation regarding Fair Values of Financial Instruments The fair value of financial instruments is based on their observable market value, if available. When there is no observable market
value available, fair value is based on a price that is reasonably estimated. Since various factors are reflected in estimating the fair value, different assumptions and factors could result in a different value.
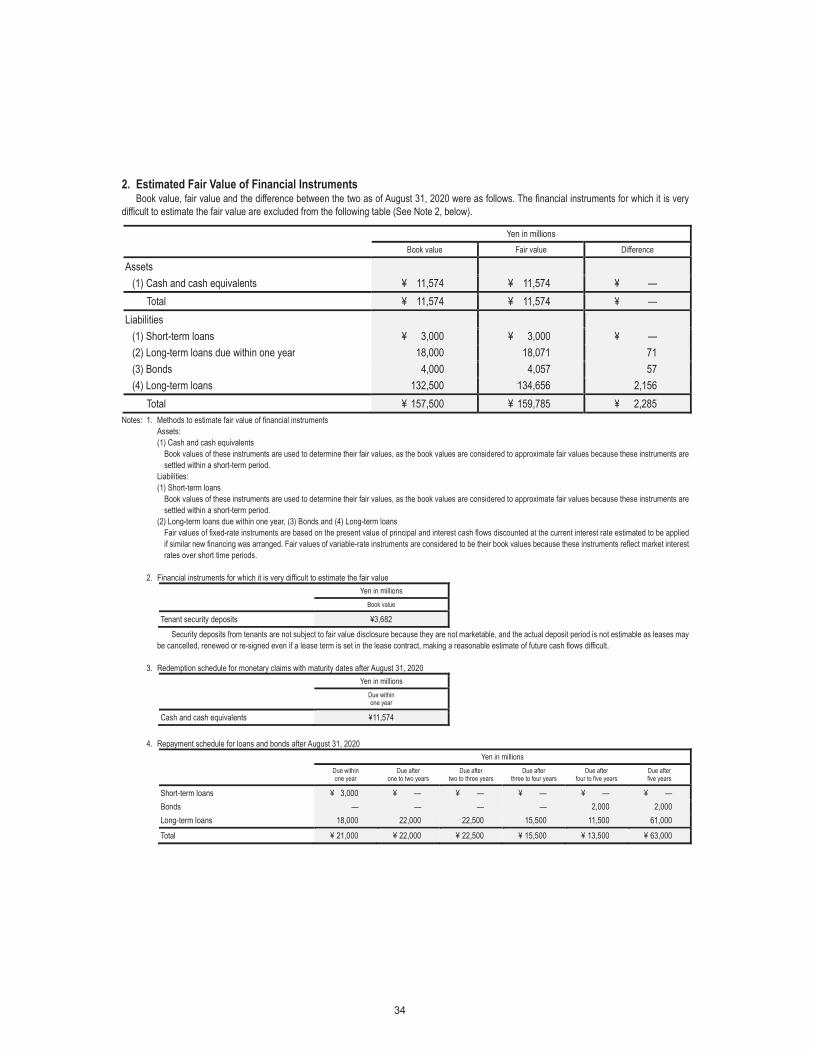
2. Estimated Fair Value of Financial Instruments Book value, fair value and the difference between the two as of August 31, 2020 were as follows. The financial instruments for which it is very
difficult to estimate the fair value are excluded from the following table (See Note 2, below).
Yen in millions Book value Fair value Difference
Assets (1) Cash and cash equivalents ¥ 11,574 ¥ 11,574 ¥ —
Total ¥ 11,574 ¥ 11,574 ¥ — Liabilities
(1) Short-term loans ¥ 3,000 ¥ 3,000 ¥ — (2) Long-term loans due within one year 18,000 18,071 71 (3) Bonds 4,000 4,057 57 (4) Long-term loans 132,500 134,656 2,156
Total ¥ 157,500 ¥ 159,785 ¥ 2,285 Notes: 1. Methods to estimate fair value of financial instruments
Assets: (1) Cash and cash equivalents
Book values of these instruments are used to determine their fair values, as the book values are considered to approximate fair values because these instruments are settled within a short-term period.
Liabilities: (1) Short-term loans
Book values of these instruments are used to determine their fair values, as the book values are considered to approximate fair values because these instruments are settled within a short-term period.
(2) Long-term loans due within one year, (3) Bonds and (4) Long-term loans Fair values of fixed-rate instruments are based on the present value of principal and interest cash flows discounted at the current interest rate estimated to be applied if similar new financing was arranged. Fair values of variable-rate instruments are considered to be their book values because these instruments reflect market interest rates over short time periods.
2. Financial instruments for which it is very difficult to estimate the fair value Yen in millions Book value
Tenant security deposits ¥3,682 Security deposits from tenants are not subject to fair value disclosure because they are not marketable, and the actual deposit period is not estimable as leases may
be cancelled, renewed or re-signed even if a lease term is set in the lease contract, making a reasonable estimate of future cash flows difficult.
3. Redemption schedule for monetary claims with maturity dates after August 31, 2020 Yen in millions
Due within one year
Cash and cash equivalents ¥11,574
4. Repayment schedule for loans and bonds after August 31, 2020 Yen in millions
Due within one year
Due after one to two years
Due after two to three years
Due after three to four years
Due after four to five years
Due after five years
Short-term loans ¥ 3,000 ¥ — ¥ — ¥ — ¥ — ¥ — Bonds — — — — 2,000 2,000 Long-term loans 18,000 22,000 22,500 15,500 11,500 61,000
Total ¥ 21,000 ¥ 22,000 ¥ 22,500 ¥ 15,500 ¥ 13,500 ¥ 63,000

(September 1, 2019 - February 29, 2020)
1. Status of Financial Instruments Same as above.
2. Estimated Fair Value of Financial Instruments Book value, fair value and the difference between the two as of February 29, 2020 were as follows. The financial instruments for which it is very
difficult to estimate the fair value are excluded from the following table (See Note 2, below).
Yen in millions Book value Fair value Difference
Assets (1) Cash and cash equivalents ¥ 12,741 ¥ 12,741 ¥ —
Total ¥ 12,741 ¥ 12,741 ¥ — Liabilities
(1) Short-term loans ¥ 3,000 ¥ 3,000 ¥ — (2) Long-term loans due within one year 19,500 19,575 75 (3) Long-term loans 131,000 133,772 2,772
Total ¥ 153,500 ¥ 156,347 ¥ 2,847 Notes: 1. Methods to estimate fair value of financial instruments
Assets: (1) Cash and cash equivalents
Book values of these instruments are used to determine their fair values, as the book values are considered to approximate fair values because these instruments are settled within a short-term period.
Liabilities: (1) Short-term loans
Book values of these instruments are used to determine their fair values, as the book values are considered to approximate fair values because these instruments are settled within a short-term period.
(2) Long-term loans due within one year and (3) Long-term loans Fair values of fixed-rate instruments are based on the present value of principal and interest cash flows discounted at the current interest rate estimated to be applied if similar new loans were entered into. Fair values of variable-rate instruments are considered to be their book values because these instruments reflect market interest rates over short time periods.
2. Financial instruments for which it is very difficult to estimate the fair value Yen in millions Book value
Tenant security deposits ¥3,699 Security deposits from tenants are not subject to fair value disclosure because they are not marketable, and the actual deposit period is not estimable as leases may
be cancelled, renewed or re-signed even if a lease term is set in the lease contract, making a reasonable estimate of future cash flows difficult.
3. Redemption schedule for monetary claims with maturity dates after February 29, 2020 Yen in millions
Due within one year
Cash and cash equivalents ¥12,741
4. Repayment schedule for loans after February 29, 2020 Yen in millions
Due within one year
Due after one to two years
Due after two to three years
Due after three to four years
Due after four to five years
Due after five years
Short-term loans ¥ 3,000 ¥ — ¥ — ¥ — ¥ — ¥ — Long-term loans 19,500 20,000 23,000 18,500 14,500 55,000
Total ¥ 22,500 ¥ 20,000 ¥ 23,000 ¥ 18,500 ¥ 14,500 ¥ 55,000

Note 13 Investment and Rental Properties
(March 1, 2020 - August 31, 2020) NAF owns rental properties including land located in Tokyo and other areas. The book value, net changes in the book value and the fair value of
the investment and rental properties were as follows.
Yen in millions Book value Fair value
As of March 1, 2020 Change during the 29th Period As of August 31, 2020 As of August 31, 2020
¥286,443 ¥5,051 ¥291,495 ¥393,549 Notes: 1. “Book value” is the acquisition cost inclusive of acquisition expenses less accumulated depreciation and excluding expenses for construction in process.
2. In “Change during the 29th Period,” the main factor for the increase in book value was the acquisition of properties for ¥6,726 million. The main factor for the decrease in book value was depreciation.
3. “Fair value as of August 31, 2020” is based on appraisals provided by independent real estate appraisers.
Information about profit and loss from investment and rental properties for the period ended August 31, 2020 is disclosed in Note 6, Rental Revenues and Expenses. (September 1, 2019 - February 29, 2020)
NAF owns rental properties including land located in Tokyo and other areas. The book value, net changes in the book value and the fair value of the investment and rental properties were as follows.
Yen in millions Book value Fair value
As of September 1, 2019 Change during the 28th Period As of February 29, 2020 As of February 29, 2020
¥287,761 (¥1,317) ¥286,443 ¥384,280 Notes: 1. “Book value” is the acquisition cost inclusive of acquisition expenses less accumulated depreciation and excluding expenses for construction in process.
2. In “Change during the 28th Period,” the main factor for the decrease in book value was depreciation. 3. “Fair value as of February 29, 2020” is based on appraisals provided by independent real estate appraisers.
Information about profit and loss from investment and rental properties for the period ended February 29, 2020 is disclosed in Note 6, Rental
Revenues and Expenses.
Note 14 Segment Information
(March 1, 2020 - August 31, 2020)
1. Segment Information Segment information has been omitted as NAF has only one segment, which is real estate leasing business.
2. Related Information (1) Information by Products and Services
Disclosure of this information has been omitted as NAF has a single product/service line that accounts for more than 90% of total revenues. (2) Information by Geographic Areas
1) Operating revenues Disclosure of this information has been omitted as total domestic revenues account for more than 90% of total revenues.
2) Investment properties Disclosure of this information has been omitted as total domestic investment properties account for more than 90% of the book value of total investment properties.
(3) Information on Major Tenants
Tenant Operating revenues (Yen in millions) Related segment
Mitsui Fudosan Residential Lease Co., Ltd. ¥10,900 Real estate leasing business

(September 1, 2019 - February 29, 2020)
1. Segment Information Segment information has been omitted as NAF has only one segment, which is real estate leasing business.
2. Related Information (1) Information by Products and Services
Disclosure of this information has been omitted as NAF has a single product/service line that accounts for more than 90% of total revenues. (2) Information by Geographic Areas
1) Operating revenues Disclosure of this information has been omitted as total domestic revenues account for more than 90% of total revenues.
2) Investment properties Disclosure of this information has been omitted as total domestic investment properties account for more than 90% of the book value of total investment properties.
(3) Information on Major Tenants
Tenant Operating revenues (Yen in millions) Related segment
Mitsui Fudosan Residential Lease Co., Ltd. ¥10,781 Real estate leasing business (March 1, 2019 - August 31, 2019)
1. Segment Information Segment information has been omitted as NAF has only one segment, which is real estate leasing business.
2. Related Information (1) Information by Products and Services
Disclosure of this information has been omitted as NAF has a single product/service line that accounts for more than 90% of total revenues. (2) Information by Geographic Areas
1) Operating revenues Disclosure of this information has been omitted as total domestic revenues account for more than 90% of total revenues.
2) Investment properties Disclosure of this information has been omitted as total domestic investment properties account for more than 90% of the book value of total investment properties.
(3) Information on Major Tenants
Tenant Operating revenues (Yen in millions) Related segment
Mitsui Fudosan Residential Lease Co., Ltd. ¥10,831 Real estate leasing business
Note 15 Significant Subsequent Events
None applicable

Independent Auditor’s Report

Independent Auditor’s Report

Independent Auditor’s Report
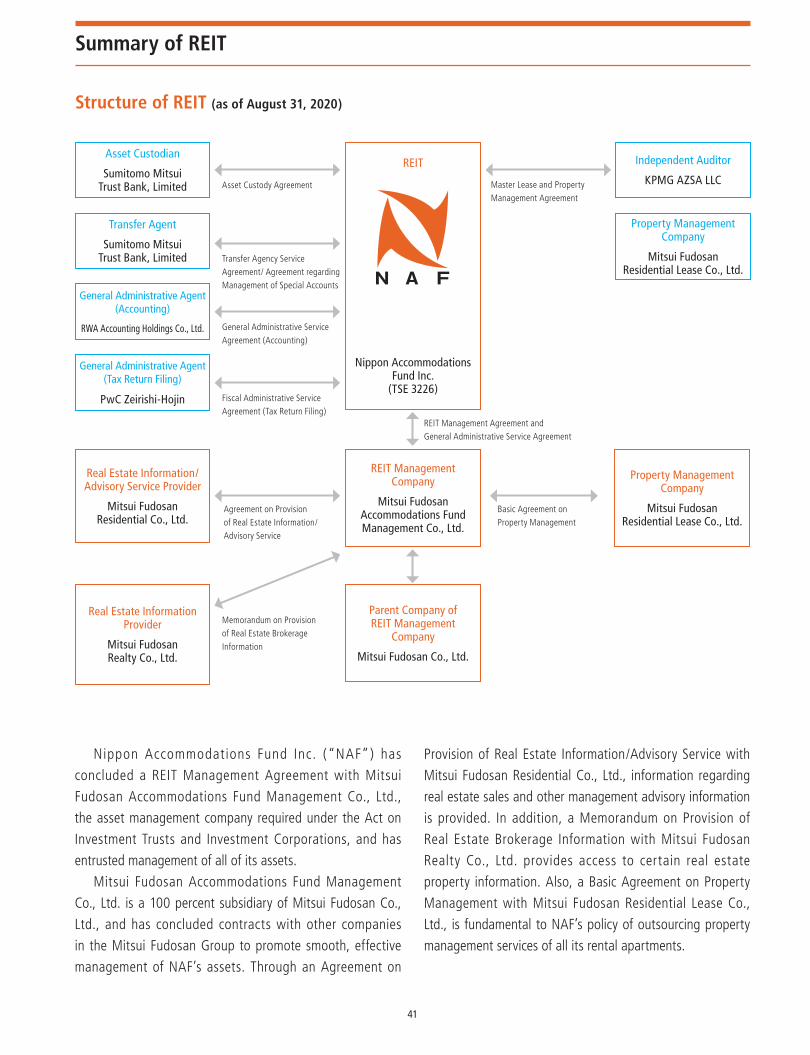
Summary of REIT
Structure of REIT (as of August 31, 2020)
Asset Custodian
Sumitomo MitsuiTrust Bank, Limited
REIT
Nippon AccommodationsFund Inc.
(TSE 3226)
Independent Auditor
KPMG AZSA LLC
Property Management Company
Mitsui FudosanResidential Lease Co., Ltd.
General Administrative Agent(Accounting)
RWA Accounting Holdings Co., Ltd.
Transfer Agent
Sumitomo MitsuiTrust Bank, Limited
General Administrative Agent(Tax Return Filing)
PwC Zeirishi-Hojin
Real Estate Information/Advisory Service Provider
Mitsui FudosanResidential Co., Ltd.
REIT ManagementCompany
Mitsui FudosanAccommodations FundManagement Co., Ltd.
Property Management Company
Mitsui FudosanResidential Lease Co., Ltd.
Parent Company ofREIT Management
Company
Mitsui Fudosan Co., Ltd.
Real Estate InformationProvider
Mitsui FudosanRealty Co., Ltd.
Asset Custody Agreement
Transfer Agency Service Agreement/ Agreement regarding Management of Special Accounts
General Administrative Service Agreement (Accounting)
Fiscal Administrative Service Agreement (Tax Return Filing)
Basic Agreement onProperty Management
Memorandum on Provision of Real Estate Brokerage Information
Agreement on Provisionof Real Estate Information/Advisory Service
Master Lease and Property Management Agreement
REIT Management Agreement andGeneral Administrative Service Agreement
Nippon Accommodations Fund Inc. (“NAF”) has
concluded a REIT Management Agreement with Mitsui
Fudosan Accommodations Fund Management Co., Ltd.,
the asset management company required under the Act on
Investment Trusts and Investment Corporations, and has
entrusted management of all of its assets.
Mitsui Fudosan Accommodations Fund Management
Co., Ltd. is a 100 percent subsidiary of Mitsui Fudosan Co.,
Ltd., and has concluded contracts with other companies
in the Mitsui Fudosan Group to promote smooth, effective
management of NAF’s assets. Through an Agreement on
Provision of Real Estate Information/Advisory Service with
Mitsui Fudosan Residential Co., Ltd., information regarding
real estate sales and other management advisory information
is provided. In addition, a Memorandum on Provision of
Real Estate Brokerage Information with Mitsui Fudosan
Realty Co., Ltd. provides access to certain real estate
property information. Also, a Basic Agreement on Property
Management with Mitsui Fudosan Residential Lease Co.,
Ltd., is fundamental to NAF’s policy of outsourcing property
management services of all its rental apartments.
41
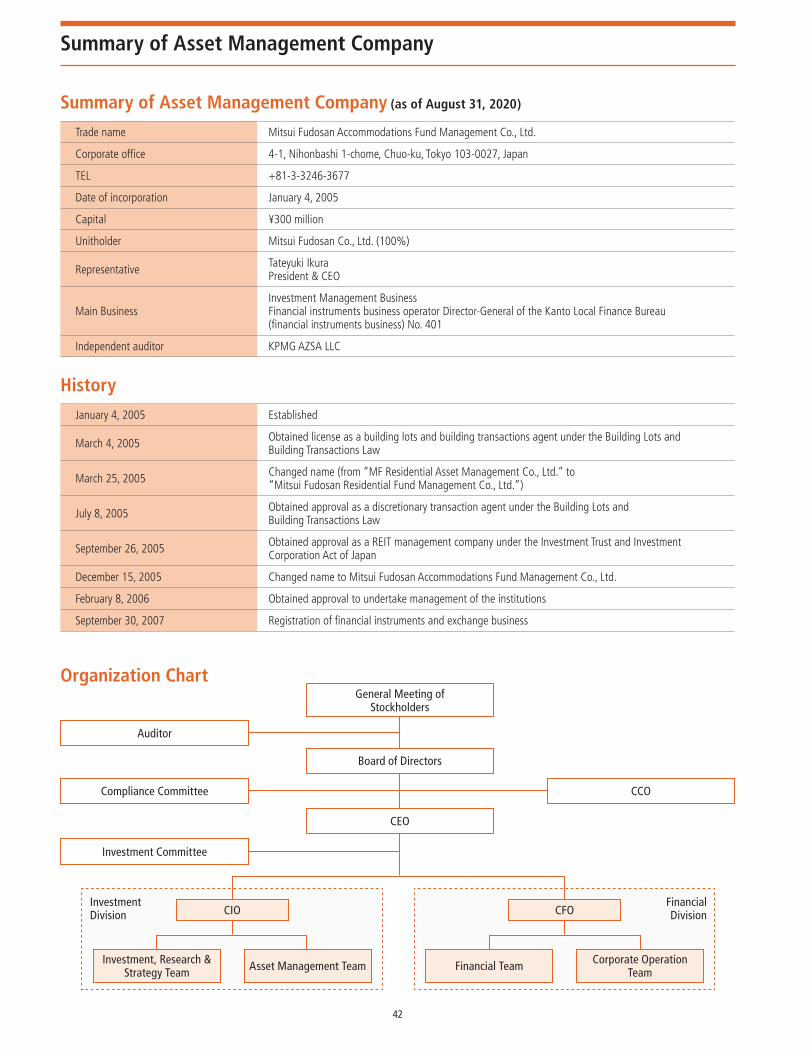
Summary of Asset Management Company
Summary of Asset Management Company (as of August 31, 2020)
History
Organization Chart
Trade name Mitsui Fudosan Accommodations Fund Management Co., Ltd.
Corporate office 4-1, Nihonbashi 1-chome, Chuo-ku, Tokyo 103-0027, Japan
TEL +81-3-3246-3677
Date of incorporation January 4, 2005
Capital ¥300 million
Unitholder Mitsui Fudosan Co., Ltd. (100%)
Representative Tateyuki Ikura President & CEO
Main BusinessInvestment Management BusinessFinancial instruments business operator Director-General of the Kanto Local Finance Bureau (financial instruments business) No. 401
Independent auditor KPMG AZSA LLC
January 4, 2005 Established
March 4, 2005 Obtained license as a building lots and building transactions agent under the Building Lots and Building Transactions Law
March 25, 2005 Changed name (from “MF Residential Asset Management Co., Ltd.” to “Mitsui Fudosan Residential Fund Management Co., Ltd.”)
July 8, 2005 Obtained approval as a discretionary transaction agent under the Building Lots and Building Transactions Law
September 26, 2005 Obtained approval as a REIT management company under the Investment Trust and Investment Corporation Act of Japan
December 15, 2005 Changed name to Mitsui Fudosan Accommodations Fund Management Co., Ltd.
February 8, 2006 Obtained approval to undertake management of the institutions
September 30, 2007 Registration of financial instruments and exchange business
InvestmentDivision
FinancialDivision
General Meeting ofStockholders
Auditor
Compliance Committee CCO
Investment Committee
CIO CFO
Investment, Research & Strategy Team Financial TeamAsset Management Team Corporate Operation
Team
Board of Directors
CEO
42

Status of Unitholders
Historical Unit Price since IPO
Composition and Distribution of Unitholders (as of August 31, 2020)
Individuals:4,276(89.38%)
Trust banks (investment trusts, etc.): 15(0.32%)
Number of unitholders (Total 4,784 people)
Number of units held (Total 484,522 units)
Regional banks: 45(0.94%)
Other financial institutions: 71(1.48%)
Other: 123(2.57%)
Overseas investors: 254(5.31%)
Individuals: 20,578(4.25%)
Trust banks (investment trusts, etc.): 255,067(52.64%)
Regional banks: 50,015(10.32%)
Other financial institutions: 28,008(5.78%)
Other: 38,256(7.90%)
Overseas investors: 92,598(19.11%)
* The Tokyo Stock Exchange calculates and presents the Tokyo Stock Exchange REIT Index, which is a weighted average aggregate market price index for all real estate investment trusts listed on the Tokyo Stock Exchange.
Index: Date of IPO (NAF: August 4, 2006) = 100
240
220
200
180
160
140
120
100
80
60
40
20
006/08 08/08 10/08 12/08 14/08 16/0807/08 09/08 11/08 13/08 15/08 17/08 18/0807/02 09/02 11/02 13/02 15/02 17/0208/02 10/02 12/02 14/02 16/02 18/02 19/08 20/02 20/0819/02
NAF Unit Price (Closing Price)
Tokyo Stock Exchange REIT Index (Closing Price)*
43

Disclaimer
44
This document was prepared solely for the convenience of
and reference by overseas investors and does not correspond
to the original Japanese documents. The information
provided in this document does not constitute the disclosure
or asset management reports required under the Financial
Instruments and Exchange Act or Act on Investment Trusts
and Investment Corporations.
This English document contains selected information
including a partial translation of the Securities Report (Yuka
shoken hokokusho) filed on November 30, 2020 pursuant to
the Financial Instruments and Exchange Law of Japan, and
the Financial Statements and Performance Information Report
for the period from March 1, 2020 to August 31, 2020 of
Nippon Accommodations Fund Inc. prepared pursuant to the
Act on Investment Trusts and Investment Corporations. This
document should not be deemed a summary of the above
mentioned Securities Report and the Financial Statements and
Performance Information Report. Nippon Accommodations
Fund Inc. has exercised due care in providing the information
in this document, but does not guarantee its accuracy or
completeness.
The contents of this document do not constitute an offer
to sell or solicitation of an offer to buy or sell any securities
of Nippon Accommodations Fund Inc. or otherwise, nor is it
advice or the recommendation of Nippon Accommodations
Fund Inc. to enter into any transaction. Factors including
changes in the price or earning capacity of real estate under
management, or worsening of the financial condition of the
issuing entity, may cause the trading price of real estate
investment securities to drop, resulting in a loss for the
investor. Investment decisions should be based on your own
judgment and responsibility. Please consult with a securities
company regarding the purchase of units or investment
corporation bonds of Nippon Accommodations Fund Inc.
English terms for Japanese legal, accounting, tax and
business concepts used herein may not be precisely identical
to the concept of the equivalent Japanese terms. If there
exist any discrepancies in the meaning or interpretation
with respect to any and all terms herein including, without
limitation, financial statements, between the original Japanese
documents and English statements contained herein, the
original Japanese documents will always govern the meaning
and interpretation. None of Nippon Accommodations Fund
Inc., Mitsui Fudosan Accommodations Fund Management
Co., Ltd. or any of their respective directors, officers,
employees, partners, unitholders, agents, parent company or
affiliates will be responsible or liable for the completeness,
appropriateness or accuracy of English translations contained
in this document. No person has been authorized to give
any information or make any representations other than as
contained in this document in relation to the matters set out
in this document, and if given or made, such information
or representation must not be relied upon as having been
authorized by Nippon Accommodations Fund Inc., Mitsui
Fudosan Accommodations Fund Management Co., Ltd. or any
of their respective directors, officers, employees, partners,
unitholders, agents, parent company or affiliates.
The financial statements of Nippon Accommodations
Fund Inc. have been prepared in accordance with generally
accepted accounting principles in Japan (Japanese GAAP),
which may materially differ in certain respects from generally
accepted accounting principles in other jurisdictions.
This document contains forward-looking statements
and information. We base these statements on our beliefs
as well as our assumptions based solely on certain limited
information currently available to us. Because these
statements reflect our current views concerning future
events, these statements involve known and unknown risks,
uncertainties and assumptions. Our future performance could
materially differ from those set out in these forward-looking
statements. We do not undertake and will not undertake to
release revisions of forward-looking statements to reflect
future events or circumstances or of any other statements or
information contained herein.
The information in this document may be changed
without prior notice.
Duplication or use of information in this document
for other purposes without the prior consent of Nippon
Accommodations Fund Inc. is prohibited.