marcos fava neves - citrus br
TRANSCRIPT

1
World Juice - Madrid
STRUCTURAL CHANGES IN
THE BRAZILIAN ORANGE
JUICE CHAIN
MARCOS FAVA NEVES
Full Professor
University of São Paulo │ USP
FEA │ Campus of Ribeirão Preto
OCTOBER │2011

2
AGENDA
1) Markestrat Presentation
2 ) The Orange Juice Chain in Brazil
3) Structural Changes in Brazil: Press Evidences of Costs
Increases
4) Structural Changes in Agricultural Costs
5) Structural Changes in Industry & Logistics Costs
6) Final Messages
3
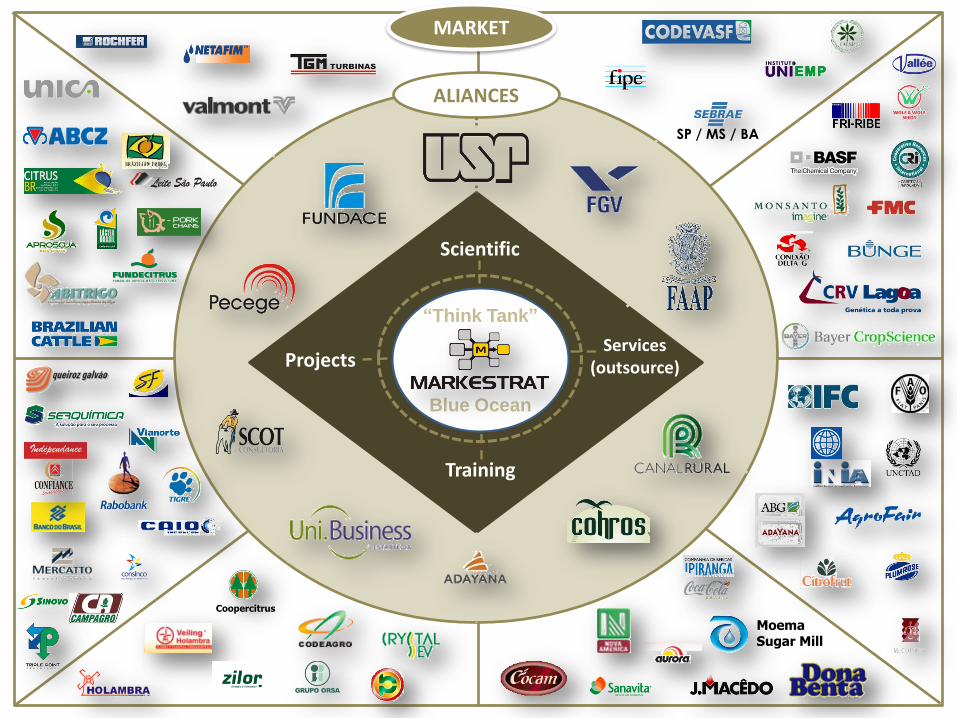
Scientific
Projects
Training
Services (outsource)
ALIANCES
MARKET
“Think Tank”
Blue Ocean
Coopercitrus
Moema Sugar Mill
SP / MS / BA

4
ANALYZING FOOD CHAINS FOR 10 YEARS
WHEAT
2004
2005
ORANGE
MILK
2006
2009
SUGAR CANE
LARANJA
2010
Sponsors: Sebrae Senar Faesp
Sponsors: Abecitrus Fundecitrus
Sponsors: J.Macedo Bunge
Sponsors: CitrusBR
Sponsors: UNICA
Wageningen Academic Publishers 2011
Coming Soon!
2011: Cotton
2011: Livestock
2012: Swine

5

6

7
AGENDA
1) Markestrat Presentation
2 ) The Orange Juice Chain in Brazil
3) Structural Changes in Brazil: Press Evidences of Costs
Increases
4) Structural Changes in Agricultural Costs
5) Structural Changes in Industry & Logistics Costs
6) Final Messages

8
CITRUS PRODUCTION CHAIN IN BRAZIL GDP: US$ 6.5 billion

9
QUANTIFICATION OF BRAZIL S CITRUS CHAIN:
Brazil s singularity and leadership in
citriculture is once again recognized in this
quantification study, completed in 2010.
GDP value of US$ 6.5 billion in the
agricultural year of 2008/09
2% of Brazil s agribusiness GDP
US$ 4.39 billion were generated in the
internal market
US$ 2.15 billion in the external market
34% came from the sales of fresh fruit in the
internal market
28% from orange juice exports (FCOJ and
NFC)
Source: Neves, Trombin and Milan from data elaborated by Markestrat
(2010)
GDP estimate for the Brazilian citrus
production chain based on final goods
Internal
Market (IM)
External
Market (IM)
Total (IM +
EM)
US$ (million) US$ (million) US$ (million)
Orange 2,323.9 19.1 2,252.0
Lemon 673.1 48.2 721.2
Tangerine 945.9 5.8 951.7
FCOJ - 1,545.9 1,545.9
NFC - 299.5 299.5
Citrus pulp 85.2 93.5 178.8
Essential oils - 72.9 72.9
Terpene - 55.2 55.2
Frozen cells - 9.1 9.1
D-Limonene - 0.9 0.9
Orange
Juice/Nectar 459.1 - 459.1
TOTAL 4,396.21 21,150.10 6,546.31
Product

10
AGENDA
1) Markestrat Presentation
2 ) The Orange Juice Chain in Brazil
3) Structural Changes in Brazil: Press Evidences of Costs
Increases
4) Structural Changes in Agricultural Costs
5) Structural Changes in Industry & Logistics Costs
6) Final Messages


13


16

18
AGENDA
1) Markestrat Presentation
2 ) The Orange Juice Chain in Brazil
3) Structural Changes in Brazil: Press Evidences of Costs
Increases
4) Structural Changes in Agricultural Costs
5) Structural Changes in Industry & Logistics Costs
6) Final Messages

19
METHODOLOGY ADOPTED TO GENERATE COMPILED DATA FOR
THE SECTOR
The data was given to Markestrat along with one of the biggest international companies for independent
auditing by the industries, individually, that compiled it confidentially and then delivered the mean values
to CitrusBR. The companies that provided the data were responsible (in 2000/01 and 2009/10 seasons)
for 98% of the Brazilian exports of FCOJ to Europe and 77% of Brazilian exports of FCOJ to North
America, then representing a significant sample of the sector.
Audit Independent
Data delivered individually
Data compiled confidentially and mean
values verified
Brazilian Association of Citrus Exporters

20
The boost in Florida’s production since the 1990s imposed new scale and productivity standards to
the citrus sector.
Even though, 44% of the harvested area in the Brazilian citrus belt show a productivity under of that
required to achieve economic viability.
In 2009, around 650
growers (5.2% of the
total) owned nearly
66% of the trees
44% of the harvested
area in the citrus belt
have a productivity of
less than 1/3 of the
others; in other words,
they show a
productivity under the
necessary to have a
profitable business.
Trees Growers Trees Growers Trees Growers
(%) (%) (%) (%) (%) (%)
> 400 16.15 0.15 23 33.65 0.35 46 39.25 0.4 51
200 to 399 7.65 0.25 38 8.05 0.55 73 7.35 0.55 69
100 to 199 10.6 0.7 105 8.1 1.05 139 8.95 1.3 164
50 to 99 12.4 1.75 263 11.45 2.7 356 10.75 2.95 372
30 to 49 12.3 3.15 473 7.7 3.35 442 7 3.5 442
20 to 29 8.95 3.9 585 5.5 3.8 502 5.3 4.1 518
10 to 19 16.45 14.5 2,175 9.45 11.35 1,498 8 11.15 1,408
<10 15.45 75.55 11,333 16.15 76.9 10,151 13.4 76.05 9,603
TOTAL 100% 100% 15,000 100% 100% 13,200 100% 100% 12,627
Source - Prepared by Markestrat based on information from CitrudBR, cons idering data obtained from member-organizations
2009
Number of
Growers
STRATIFICATION OF GROWERS IN THE BRAZILIAN CITRUS BELT, BY NUMBER OF TREES
Number of
Growers
x 1000 Trees
2001 2006
Number of
Growers
(boxes/ha)
> 1,400
1,100 - 1,399
800 - 1,099
500 - 799
200 - 499
< 200
TOTAL
TOTAL > 500
TOTAL < 499
Source - Prepared by Markestrat based on information from CitrudBR, cons idering data obtained from member-organizations
6
73
1,655
1,209
933
639
345
138
280
317.4
244.4
607
909
16
41
92
95
67
Volume of boxes produced per
productivity range (x million)Yield (boxes/ha)% of hectares % of boxes
8%
44%
5%
13%
29%
30%
21%
2%
23%
100%
56%
100%
77%
2%
7%
19%
28%
36%
STRATIFICATION BY PRODUCTIVITY RANGE (BOXES PER HECTARE) OF ORANGE PRODUCTION IN 2009/10 SEASON
Range of
Productivity

21
SUGAR CANE VERSUS ORANGE CROP
The farmer can
lease his land to the
sugar cane industry,
what will generate a
revenue without
risks of
approximately
US$ 1,000.00
/hectare/year.
If he decides to
grow oranges
instead, he must
produce 1,000
boxes/hectare in
order to obtain the
same revenue
and a profit of
US$ 1.00 per box.
Less efficient growers, both small and big ones, are leaving the citrus sector and dedicating
themselves to other cultures or activities.
The competition against sugar cane, which disputes for the same area and involves less
risks, requiring less technical and managerial capacity, has great effects in the migration of
citrus growers to this culture.

22
Source: Elaborated by Markestrat based on CitrusBR data. Production costs in 2000/01 and 2001/02 were reported by only one of CitrusBR associate companies.
The operational costs of the orange orchards owned by CitrusBR associates show a
significant increase.
R$ 3.30
R$ 4.01
R$ 4.25
R$ 5.65
R$ 4.98
R$ 5.67 R$ 5.59
R$ 5.81
R$ 7.28 R$ 7.26
US$ 1.74 US$ 1.66
US$ 1.31
US$ 1.90 US$ 1.75
US$ 2.41
US$ 2.58
US$ 3.15
US$ 3.67
US$ 3.96
US$ 0.00
US$ 1.50
US$ 3.00
US$ 4.50
R$ -
R$ 1.50
R$ 3.00
R$ 4.50
R$ 6.00
R$ 7.50
2000/01 2001/02 2002/03 2003/04 2004/05 2005/06 2006/07 2007/08 2008/09 2009/10
US
$ /
Ora
ng
e B
ox
R$
/ O
ran
ge
bo
x
FREIGHT OF THE FRUIT
HARVEST
MAINTENANCE, UPKEEP AND OTHER EXPENSES
EXPENSES WITH OWN VEHICLES AND SERVICES OF THIRD PARTIES
ELECTRIC ENERGY
FERTILIZERS
PESTICIDES AND HERBICIDES
LABOR COSTS
Total inR$
Total inUS$

23
About 65% of the orange processed by the industry is acquired through different contractual arrangements.
136123
197
148
215200
237 226
205
171
US$ 2.12
US$ 2.96 US$ 3.03 US$ 3.16
US$ 2.81
US$ 3.37
US$ 4.63
US$ 5.43 US$ 5.28
US$ 3.85
0
50
100
150
200
250
US$ 2.00
US$ 2.50
US$ 3.00
US$ 3.50
US$ 4.00
US$ 4.50
US$ 5.00
US$ 5.50
US$ 6.00
US$ 6.50
00/01 01/02 02/03 03/04 04/05 05/06 06/07 07/08 08/09 09/10
Am
ou
nt
of
ora
ng
e b
oxes
acq
uir
ed
fro
m p
rovid
ers
(in
m
illi
on
bo
xes o
f 40.8
kg
)
Avera
ge p
rice o
f th
e o
ran
ge b
ox
(US
$)
Source: Elaborated by Markestrat based on CitrusBR data.
Spot Market Orange purchase agreements during the season period, at the price of the day
Pre-determined fixed prices
With or without granted minimum prices and with participation bonus indexed to the actual
audited averages, obtained from the prices of the concentrate orange juice sold by each
industry in the external market between july and june of each season.
With or without granted mininum prices directly connected to the daily quotation and annual
commodity prices at the NYSE.
LeasingRent of agricultural properties by a pre-determined fixed price or in goods at the market price,
by a long term, in which the citrus activity is developed.
CropsharingThe grower comes with the land and the industry with the inputs and technical assistance,
and producion is divided by them. The grower freely sells its share in the production.
Relationship Typology between Brazilian Citrus Growers and Processors
Long Term
Agreements
24
AGENDA
1) Markestrat Presentation
2 ) The Orange Juice Chain in Brazil
3) Structural Changes in Brazil: Press Evidences of Costs
Increases
4) Structural Changes in Agricultural Costs
5) Structural Changes in Industry & Logistics Costs
6) Final Messages

25
Between 2002/03 and 2009/10, the average price of FCOJ has had an increase of 11%. On the other hand, the elevation of FCOJ costs (both agricultural and industrial) was 244%
(considering and exchange rate of US$ 1.83).
UNIT 2002/03 2009/10 VARIATION
R$ per US$ 1,00 US$ 3.23 US$ 1.83 -43%
US$ per TON of FCOJ 66 Brix US$ 1,045 US$ 1,162 11%
US$ per TON of FCOJ 66 Brix US$ 458 US$ 1,575 244%
US$ per Box of 40.8 Kg US$ 1.31 US$ 3.96 202%
US$ per TON of FCOJ 66 Brix US$ 165 US$ 534 224%
ITEMS / SEASON
AVERAGE EXCHANGE RATE OF DISBURSEMENT IN
PERIOD OF THE SEASON
AVERAGE PRICE OF FCOJ IN EUROPE IN THE NYSE
AVERAGE OPERATIONAL COST OF FCOJ USING
ORANGES FROM INDUSTRY-OWNED ORCHARDS
Average operational costs of orange production in the
orchards owned by the industry
Average operational costs of the orange processing;
production, storage and international logistics of FCOJ
Source: Elaborated by Markestrat based on CitrusBR data.

26
Average cost of orange processing: production, storage and logistics of FCOJ (does not include depreciation or amortization of goods or the right of fixed assets)
ITEM / SEASON UNIT 2000/01 2001/02 2002/03 2003/04 2004/05 2005/06 2006/07 2007/08 2008/09 2009/10
(I) Average costs of maritime logistics, port
operations, administrative, sales and
financing of w orking capital abroad
Dollars per ton of FCOJ U$ 130 U$ 128 U$ 118 U$ 127 U$ 120 U$ 141 U$ 160 U$ 181 U$ 179 U$ 156
(II) Average costs of overland flow ,
operations and port charges in BrazilDollars per ton of FCOJ U$ 39 U$ 35 U$ 28 U$ 33 U$ 38 U$ 48 U$ 53 U$ 66 U$ 70 U$ 79
(III) Average costs of orange processing and
production of FCOJ and by-products,
administrative and financing of w orking
capital in Brazil
Dollars per ton of FCOJ U$ 300 U$ 265 U$ 164 U$ 234 U$ 230 U$ 293 U$ 326 U$ 432 U$ 447 U$ 497
(IV) Total average costs = (I) + (II) + (III) Dollars per ton of FCOJ U$ 469 U$ 428 U$ 310 U$ 394 U$ 388 U$ 482 U$ 539 U$ 679 U$ 696 U$ 731
(V) Subtraction of by-products revenue FOB
factory plantDollars per ton of FCOJ -U$ 121 -U$ 132 -U$ 145 -U$ 173 -U$ 117 -U$ 148 -U$ 162 -U$ 219 -U$ 247 -U$ 197
(VI) Average total costs subtracting the
revenue with by-products = (IV) - (V)Dollars per ton of FCOJ U$ 348 U$ 296 U$ 165 U$ 221 U$ 271 U$ 334 U$ 377 U$ 460 U$ 449 U$ 534
Average industrial yield including the
recuperation of secondary and tertiary solids
Orange boxes needed to
obtain 1 ton of FCOJ 66 Brix246 236 224 226 242 227 232 230 255 263
Reals per 1 Dollar R$ 1.93 R$ 2.44 R$ 3.22 R$ 2.99 R$ 2.79 R$ 2.30 R$ 2.13 R$ 1.82 R$ 1.97 R$ 1.85
Dollars per 1 Euro U$ 0.90 U$ 0.89 U$ 0.99 U$ 1.08 U$ 1.14 U$ 1.13 U$ 1.15 U$ 1.22 U$ 1.26 U$ 1.23
Average disbursement exchange rate in the
period of the season
Source: Elaborated by Markestrat based on CitrusBR data.
27
AGENDA
1) Markestrat Presentation
2 ) The Orange Juice Chain in Brazil
3) Structural Changes in Brazil: Press Evidences of Costs
Increases
4) Structural Changes in Agricultural Costs
5) Structural Changes in Industry & Logistics Costs
6) Final Messages

28
FINAL MESSAGES
Brazil is the major supplier of orange juice to Europe
Due to structural changes as the economy of the country
emerges, the traditional comparative advantages that Brazil
used to have in relation to other orange producers erode.
The main problems faced by the Brazilian citrus sector are
the increase of land prices and labor costs, the spread of
citrus diseases and exchange rate. This scenario will also
happen in other countries that produce orange, as it
happened in Florida.
How to solve these problems?

29

30
HOW TO SOLVE THESE PROBLEMS?

31
HOW TO SOLVE THESE PROBLEMS?
1) INCREASE EFFICIENCY
A lot has been done, but there is room for more improvements in Brazil,
mostly at the farm level.
Source: Elaborated by Markestrat - University of São Paulo with data from IBGE (Brazilian Institute of Geography and Statistics), 2010
620.770
719.735
736.770 766.640
776.690
609.475
581.487
586.937
600.060
587.935
574.510
571.532
584.096
592.568
566.652
432,7
406,3 429,3
370,3
416,0
486,7
570,3
616,4
545,1
613,6
612,9
616,1
625,4
601,3
590,1
300,0
350,0
400,0
450,0
500,0
550,0
600,0
650,0
550000
600000
650000
700000
750000
800000
1995 1996 1997 1998 1999 2000 2001 2002 2003 2004 2005 2006 2007 2008 2009
Bo
xes/
hectare
Hectares
Area x Productivity - Oranges in the state of São Paulo (Brazil)
Area Productivity
33
HOW TO SOLVE THESE PROBLEMS?
2) INCREASE PRICES TO THE FINAL CONSUMER
The question is how to transfer the increase of production costs to the end
consumer, when there are many new beverages competing with the traditional orange
juice.
This can be a matter of marketing: orange juice could be advertised differently,
aligned to new consumer tendencies, allowing it to have a price increase.
Would it be enough an increase of 15 cents/package at the retail sector? For a
person who consumes 20 liters of OJ/year, the increase would cost less than a
cigarettes package per year.

34

35
HOW TO SOLVE THESE PROBLEMS?
3) A KEY FACTOR: SUSTAINABILITY
The price of the orange juice should be higher not only
because of the increasing costs of production, but also because
of the sustainability of the sector.
Besides complying with rigorous patterns of environmental
and social sustainability, the Brazilian citrus sector will improve
its economic viability with the Consecitrus, a mechanism that
after being implemented will help to avoid huge fluctuations in
prices.

36

37
MARKESTRAT │ Center of Research and Projects in
Marketing and Strategy
www.markestrat.org
FUNDACE │Foundation for Research and
Development of Business, Accounting, and
Economics
www.fundace.org.br