marine environmental research - ua · abesamis and russ, 2005). ... and also variations in depth...
TRANSCRIPT
Marine Environmental Research 66 (2008) 536–547
Contents lists available at ScienceDirect
Marine Environmental Research
journal homepage: www.elsevier .com/locate /marenvrev
Habitat continuity effects on gradients of fish biomass across marineprotected area boundaries
Aitor Forcada *, Just T. Bayle-Sempere, Carlos Valle, Pablo Sánchez-JerezUnidad de Biología Marina, Departamento de Ciencias del Mar y Biología Aplicada, Universidad de Alicante, P.O. Box 99, Edificio Ciencias V,Campus de San Vicente del Raspeig, E-03080 Alicante, Spain
a r t i c l e i n f o
Article history:Received 23 May 2008Received in revised form 11 August 2008Accepted 12 August 2008
Keywords:Marine protected areasFishSpilloverHabitat continuityVisual censusFisheries management
0141-1136/$ - see front matter � 2008 Elsevier Ltd. Adoi:10.1016/j.marenvres.2008.08.003
* Corresponding author. Tel.: +34 965 903 400x291E-mail address: [email protected] (A. Forcada).
a b s t r a c t
Marine protected areas (MPAs) could be useful as fisheries management tools for the exportation of pela-gic eggs, larvae and adult fish. A decreasing gradient of fish biomass across MPAs boundary may indicateexport. We determine whether gradients of decreasing biomass of fish assemblage occurred in TabarcaMarine Reserve over two habitats with different continuity across the boundaries, to test if the patchynature of the marine environment might act as a barrier for the fish export. In general, significantdecreasing gradients in total fish biomass and biomass of some species were observed on P. oceanicaand rocky substrates, independently of their different continuity through the reserve boundaries.Changes in the multivariate structure of the fish assemblage were correlated with the distance from inte-gral reserve. All of these results support the hypothesis that the exportation of adult fish from TabarcaMarine Reserve occurs, and this process may influence the surrounding fished areas.
� 2008 Elsevier Ltd. All rights reserved.
1. Introduction
In recent years, most coastal fish resources have been overex-ploited (Castilla, 2000), raising doubts about the long-term sus-tainability of certain fisheries (Pauly et al., 2002; Worm et al.,2006). In addition, fish habitats have also been strongly alteredby widely used impacting fishing gears (trawls, dredges, . . .)resulting in reduced seabed complexity and removal of macro-benthic organisms that provide shelter for others (Sumailaet al., 2000). The poor effectiveness of conventional fisheries man-agement has led to increased interest among marine resourcemanagers in marine protected areas (MPAs) (Bohnsack, 1998;Caddy, 2000), because they are considered a potential means ofenhancing the long-term sustainability of many fisheries (Gelland Roberts, 2003; Sobel and Dahlgren, 2004; Ramos-Espláet al., 2004). However, while the use of MPAs for this purposeis becoming popular, their ability to restock the fishing areas sur-rounding MPAs is also controversial (Willis et al., 2003; Hilbornet al., 2004; Sale et al., 2005).
A number of studies have explored the effect of the cessation offishing within MPAs and in general, abundance, biomass and meansize of exploited fish populations are higher within protected areasthan in nearby non-reserve areas (see Halpern, 2003 for review).However, to be useful as fisheries management tools, MPAs needto affect outside fished areas in a positive manner (Russ, 2002; Gell
ll rights reserved.
6; fax: +34 965 909 897.
and Roberts, 2003). To benefit fisheries, MPAs are predicted to sup-port adjacent fisheries through two mechanisms: net emigration ofadults and juveniles across borders, termed ‘‘spillover”, and withthe increased production and exportation of pelagic eggs and lar-vae (Rowley, 1994; Kaunda-Arara and Rose, 2004; Abesamis andRuss, 2005).
A decreasing gradient of fish biomass across MPAs boundaries,from high inside to low outside, may indicate spillover (Rakitinand Kramer, 1996). Net emigration of adult fish from the MPA,combined with fishing mortality outside, may produce such adecreasing pattern of biomass (Rakitin and Kramer, 1996;Abesamis and Russ, 2005). Protection increases the abundance ofthe most targeted species by fisheries (e.g. big serranids and bigsparids), favouring changes in the fish assemblage structure(Ojeda-Martinez et al., 2007). Therefore, if spillover occurs thestructure of fish assemblage will change related with the distancefrom the MPA. Reporting MPA effectiveness only by total or byindividual species biomass is important but not sufficient froman ecosystem-based perspective, being necessary to study thechanges in the fish assemblage structure to evaluate preciselythe recovery effects of protection. Decreasing gradients of fish bio-mass across MPA boundaries were observed in a number of studiesin tropical and temperate regions, using underwater visual census(Russ and Alcala, 1996; Ashworth and Ormond, 2005), catch rates(Kaunda-Arara and Rose, 2004; Goñi et al., 2006) or both (Rakitinand Kramer, 1996; Russ et al., 2003, 2004; Abesamis and Russ,2005). However, these studies did not account for differences inhabitat between the reserve and the fished sites. Therefore, the

A. Forcada et al. / Marine Environmental Research 66 (2008) 536–547 537
patterns could have been due to spillover or to habitat differences,which affect fish density (Chapman and Kramer, 1999; Abesamiset al., 2006). Nevertheless, it is still unclear whether a decreasinggradient of fish biomass across a reserve boundary indicates spill-over. Many environmental factors may explain spatial and tempo-ral variability of littoral fish local assemblages. Habitat structure inthe form of habitat complexity and/or heterogeneity (McCoy andBell, 1991), and also variations in depth (Bell, 1983), are often re-lated to fish population size and assemblage structure (Ruittonet al., 2000; García-Charton and Pérez Ruzafa, 2001; Letourneuet al., 2003). Thus, gradients of decreasing biomass across MPAsboundaries may reflect better habitat characteristics inside thanoutside reserves, rather than effects of protection from fishing inthe reserve. Disentangling the effects due to habitat structure willavoid ‘‘ecological confounding” in the interpretation of results(Hurlbert, 1984; Underwood, 1997), as well as increase the chanceof correctly interpreting the observed spatial and temporal hetero-geneity of fish populations due to protection.
In addition, if gradients of decreasing biomass away from MPAsare due to spillover, the availability of a continuous habitat suitablefor fish adjacent to reserves may have been important in promot-ing the net emigration of some fish from the reserves. Spilloverbenefits are more likely if reserves and their immediate surround-ings occur in relatively homogeneous habitat (Chapman andKramer, 2000; McClanahan and Mangi, 2000; Kaunda-Arara andRose, 2004), because many fishes are habitat specific and are reluc-tant to disperse across ‘‘foreign” habitats (Chapman and Kramer,2000). For this reason, spillover will also be influenced by the hab-itat bordering a reserve (Rowley, 1994).
The ideas of protecting breeding stocks, improving recruitmentto neighbouring areas, and restocking marine species of commer-cial interest, were the most important initial goals of the creationof Tabarca Marine Reserve (Ramos-Esplá, 1985). This MPA wasestablished in 1986, and it has already yielded a large backgroundof data showing the presence of higher biomass inside. Overall fishabundance and biomass were, respectively 92% and 317% higher inTabarca Marine Reserve with reference to control fished areas(Forcada, 2005). Moreover, different traditional fishing groundsare distributed around Tabarca Marine Reserve, which are mainlyused by the artisanal fleet causing a concentration of fishing effortclose to the reserve boundaries (Goñi et al., 2008).
The main objective of this work was to assess spillover examin-ing gradients of fish biomass across Tabarca Marine Reserveboundaries. As a second objective, with the aim to test if the patchynature of the marine environment might act as a barrier for themovement of fish, we investigated the gradients over two habitats:Posidonia oceanica seagrass meadow (continuous through reserveboundaries) and rocky substrate (discontinuous through reserveboundaries). Furthermore, we explored the relationship betweenthe fish assemblage and habitat structure, as an environmental fac-tor likely to account for an important part of the variability alongthe gradient. We statistically control the effects of habitat corre-lates of fish assemblage to test the hypothesis that gradients aredue to reserve protection rather than measured habitat differences.Finally, changes in the structure of the fish assemblage were as-sessed at different distances from the integral reserve to test theeffect of spillover.
2. Materials and methods
2.1. Area descriptions
This study was carried out during June–July in 2005 and 2006 inTabarca Marine Reserve (South-western Mediterranean Sea,Spain). Tabarca Marine Reserve was created in 1986 and is1400 ha. This MPA is zoned in three management zones with
different levels of protection (Ramos-Esplá, 1985; Fig. 1): (I) theIntegral reserve area (100 ha), where all human uses and activitiesare prohibited, except the scientific research; (II) the Buffer area(630 ha), in which some selective fishing methods are allowed;and (III) the Transitional area (670 ha), in which a number of activ-ities are permitted (selective fishing techniques, swimming, SCUBAdiving, mooring of yachts). The main habitat, P. oceanica meadows,is highly extended outside the borders in a continuous way, fur-thermore rocky bottoms also have a patchy distribution over thearea of study.
2.2. Study design and methods
To test our hypothesis, seven localities were positioned atincreasing distances from the core of the integral reserve and withdifferent protection status (four inside the MPA and three in fishedareas) (Fig. 1). In each locality, three sites were randomly located ata scale of 100 s of metres. Finally, six random visual counts (repli-cates) separated by 10 s of metres were done in each site. The sur-veys were carried out over one continuous habitat ( P. oceanicaseagrass meadow) and another discontinuous (rocky substrate).To assess for the temporal consistency in the results, we repeatedthis sampling procedure two times, resulting in a total of 504 rep-licates in the data set.
Fish assemblage was sampled by means of underwater visualcensus techniques. The abundance and size (total length in classesof 2 cm) of each fish species was recorded by a SCUBA diver withina 25 � 5 m transect in rocky substrate, and a 50 � 5 m transect in P.oceanica meadow as fish were more dispersed in this habitat(Harmelin-Vivien et al., 1985). This procedure is quite precise aftera training period (Bell et al., 1985). Each observation was assignedto one of nine predetermined abundance classes (Harmelin, 1987),the limits of which coincide approximately with the terms of abase two geometric series. Geometric means of each fish abun-dance class were used for further calculations. This system ofrecording numbers, which is usual for fish censuses, leads to sim-ilar degrees of error over a wide range of abundances, and insuresthe homogeneity of variances when performing analyses with log-transformed data (Frontier, 1986).
Habitat was described using substrate variables, distinguishingbetween vertical complexity (estimated as number of rocky boul-ders and verticality), horizontal heterogeneity (cover of differentsubstrate) and depth (García-Charton and Pérez Ruzafa, 2001).After counting fish, the same observer covered the transect lengthin the opposite direction to count the number of rocky bouldersclassified by the size of their major length: small (major length:50–100 cm), medium (major length: 100–200 cm), and large (ma-jor length: > 200 cm). The observer completed measuring the min-imum and maximum depth, and verticality (was estimated as thevertical distance between the deepest and the shallowest point in-side each transect). Finally, habitat heterogeneity was estimatedvisually within each transect as the relative percentage cover ofdifferent substrate types: rock, sand and P. oceanica meadow. Be-cause the location of each sampling site was randomly selected,its geographical position was denoted by means of a global posi-tioning system (GPS). Subsequently for each site, distance fromthe centre of the integral reserve and distance from Tabarca MarineReserve boundary were calculated by means of a geographic infor-mation system (GIS).
The seasonality is an important environmental variable on fishassemblage in temperate systems (Ansari et al., 1995; Magill andSayer, 2002). For this reason, the surveys were done in the sameseason to reduce the natural variance between replicates thus pro-viding better evidence of spatial patterns of distribution. The warmseason is the most suitable period for visual counts in the Mediter-ranean, as fish communities are more diverse and stable during
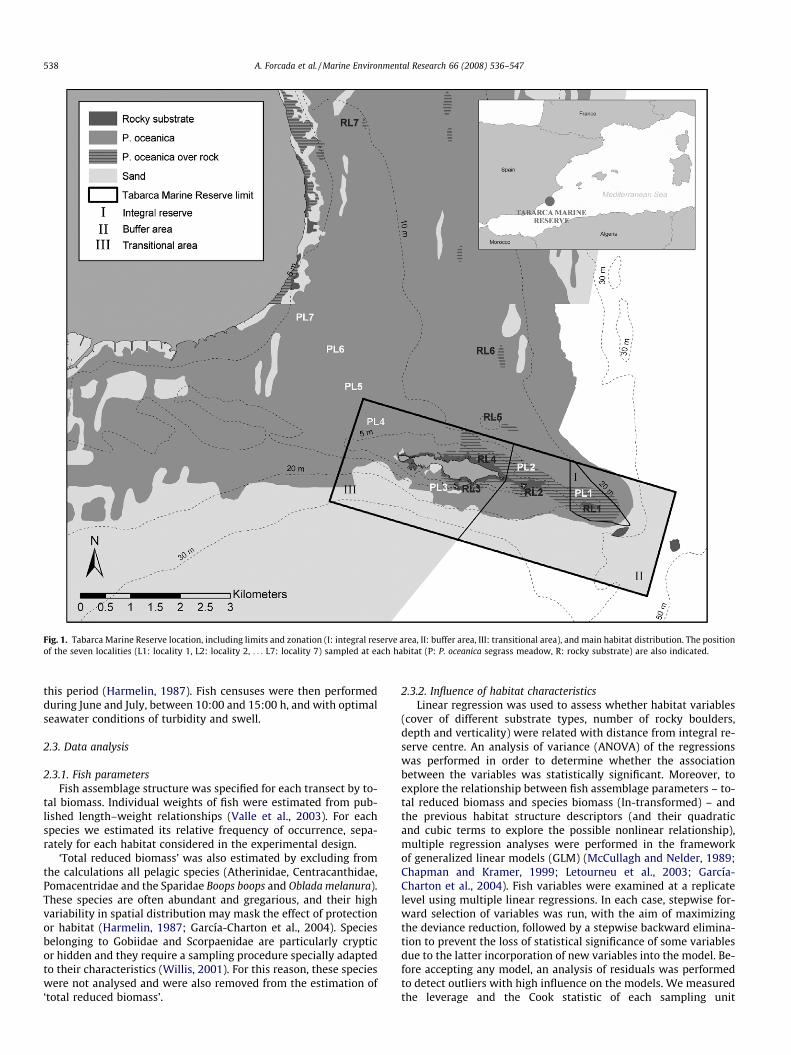
Fig. 1. Tabarca Marine Reserve location, including limits and zonation (I: integral reserve area, II: buffer area, III: transitional area), and main habitat distribution. The positionof the seven localities (L1: locality 1, L2: locality 2, . . . L7: locality 7) sampled at each habitat (P: P. oceanica segrass meadow, R: rocky substrate) are also indicated.
538 A. Forcada et al. / Marine Environmental Research 66 (2008) 536–547
this period (Harmelin, 1987). Fish censuses were then performedduring June and July, between 10:00 and 15:00 h, and with optimalseawater conditions of turbidity and swell.
2.3. Data analysis
2.3.1. Fish parametersFish assemblage structure was specified for each transect by to-
tal biomass. Individual weights of fish were estimated from pub-lished length–weight relationships (Valle et al., 2003). For eachspecies we estimated its relative frequency of occurrence, sepa-rately for each habitat considered in the experimental design.
‘Total reduced biomass’ was also estimated by excluding fromthe calculations all pelagic species (Atherinidae, Centracanthidae,Pomacentridae and the Sparidae Boops boops and Oblada melanura).These species are often abundant and gregarious, and their highvariability in spatial distribution may mask the effect of protectionor habitat (Harmelin, 1987; García-Charton et al., 2004). Speciesbelonging to Gobiidae and Scorpaenidae are particularly crypticor hidden and they require a sampling procedure specially adaptedto their characteristics (Willis, 2001). For this reason, these specieswere not analysed and were also removed from the estimation of‘total reduced biomass’.
2.3.2. Influence of habitat characteristicsLinear regression was used to assess whether habitat variables
(cover of different substrate types, number of rocky boulders,depth and verticality) were related with distance from integral re-serve centre. An analysis of variance (ANOVA) of the regressionswas performed in order to determine whether the associationbetween the variables was statistically significant. Moreover, toexplore the relationship between fish assemblage parameters – to-tal reduced biomass and species biomass (ln-transformed) – andthe previous habitat structure descriptors (and their quadraticand cubic terms to explore the possible nonlinear relationship),multiple regression analyses were performed in the frameworkof generalized linear models (GLM) (McCullagh and Nelder, 1989;Chapman and Kramer, 1999; Letourneu et al., 2003; García-Charton et al., 2004). Fish variables were examined at a replicatelevel using multiple linear regressions. In each case, stepwise for-ward selection of variables was run, with the aim of maximizingthe deviance reduction, followed by a stepwise backward elimina-tion to prevent the loss of statistical significance of some variablesdue to the latter incorporation of new variables into the model. Be-fore accepting any model, an analysis of residuals was performedto detect outliers with high influence on the models. We measuredthe leverage and the Cook statistic of each sampling unit

A. Forcada et al. / Marine Environmental Research 66 (2008) 536–547 539
(McCullagh and Nelder, 1989), so that any one with high values ofleverage and influence was removed and the model refitted to in-sure consistency.
2.3.3. Gradients of fish biomassGradients of fish biomass across MPA boundaries were analysed
using linear regressions. Average total reduced biomass and spe-cies biomass (ln-transformed) at each site were tested versus dis-tance from integral reserve centre. Analyses were performed onlyon those non-pelagic taxa sufficiently frequent throughout thestudy, i.e. with a frequency of P 10%. These regressions were per-formed separately for two times sampled at each habitat. AnANOVA of the regressions was performed in order to determinewhether the association between the variables was statisticallysignificant.
To quantify the spatial variation after extracting the variabilitydue to the influence of habitat variables, residuals of multiple lin-ear regression analyses (defined as corrected biomass) were usedas dependent variables repeating the linear regression with dis-tance from integral reserve centre. This process was done in orderto ensure that gradients were related to protection and not to dif-ferences in habitat features (Chapman and Kramer, 1999;García-Charton et al., 2004).
2.3.4. Changes in multivariate structure of fish assemblageWe used multivariate techniques that are suited for ecological
data because this allowed the production of a diagnostic on thechange of the entire fish assemblage. Therefore, non-parametricapproaches were selected by combining non-metric multidimen-sional scaling (MDS) and hierarchical cluster (Clarke, 1993; Clarkeand Warwick, 2001), to assess differences in the biomass of thestructure of the community within each locality, with regard tothe different habitats and times considered by our samplingdesign.
With the aim of incorporating the influence of environmentalvariables in the assessment of the effect of distance from integralreserve over the fish assemblage, we perform BEST and LINKTREEroutines included in PRIMER v6 software (Clarke and Gorley,2006). A first appraisal of the relationships between species bio-mass and environment was provided by BEST, which was used toselect the subset of environmental variables which best explainsthe multivariate pattern of the fish assemblage. In order to carryout a full search of all possible combinations of environmentalvariables, BIO-ENV procedure was run using Spearman coefficient(Kendall, 1970) as rank correlation method. Moreover, a globalBEST match permutation test (using 999 permutations) was ap-plied to test agreement between fish assemblage and the subsetof environmental variables selected. The associated Pearson’s cor-relation coefficient of pairs of environmental variables was exam-ined to identify variables strongly correlated. All subsets ofvariables strongly collinear (with values > 0.95 or < �0.95) werereduced to a single representative in the BEST run (Clarke andWarwick, 2001). In a second step, only the environmental variablesselected by BEST were included as explicative variables in LINK-TREE procedure (a non-parametric multivariate form of classifica-tion and regression trees; De’ath, 2002). This non-parametricmultivariate discrimination technique constructs a hierarchicaltree through successive dichotomies of the set of observations.Each division is characterised by one or more variables, and rangesof their values, that appear to be responsible for discriminatingeach different assemblage grouping. LINKTREE is capable of dem-onstrating that an environmental variable is important for internalassemblage structuring of one group of samples but not for anothergroup (with similar values range).
The ‘‘similarity profile” permutation test (SIMPROF) (Clarke andGorley, 2006), which test for significant evidence of multivariate
structure among samples that have no pre-defined grouping, wascombined with hierarchical cluster and LINKTREE to justify identi-fication and interpretation of clusters. The significance level wasconventionally taken as 5%, and 1000 permutations were used tocalculate the mean similarity profile, with 999 to generate the nulldistribution of the departure statistic, p.
For the overall multivariate testing technique, similaritiesamong fish assemblage were calculated using the Bray–Curtis sim-ilarity index (Bray and Curtis, 1957) on the log-transformed bio-mass data by species. Censuses from P. oceanica meadow andfrom rocky substrate were computed together. For protection sta-tus, a dummy variable of ‘1’ was assigned to transects inside theMPA, and ‘0’ for those in fished areas. Again, for habitat factor, an-other dummy variable of ‘0’ was assigned for transects over rockysubstrate, and ‘1’ for those carried out on P. oceanica meadow.These two dummy variables (called MPA and habitat respectively),distance from the integral reserve centre, and distance from MPAboundary were included in the environmental data matrix withthe substrate variables collected during the visual census. Environ-mental variables similarity matrix used in the prior analysis wascalculated within localities using Normalised Euclidean distance(Clarke and Warwick, 2001).
3. Results
3.1. Fish assemblage
During this study, a total of 47 fish species were observed(belonging to 16 families), of which 38 appeared in P. oceanicaand 45 on rocky substrate (Appendix A). The most representativefamily was Sparidae followed by Labridae, with 13 and 12 speciesrespectively. Total biomass averaged 2213 ± 307 (SE, standarderror) g 125 m�2 on P. oceanica, and 10225 ± 1003 (SE) g 125 m�2
in rocky substrate. Total reduced biomass – i.e. excluding fromthe summation pelagic and cryptic species – attained values of1503 ± 278 (SE) and 8874 ± 971 (SE) g 125 m�2, in P. oceanicaand rocky substrate, respectively.
3.2. Influence of habitat structure on the fish assemblage
Some variables of habitat structure showed significant lineartrends with distance from integral reserve. On P. oceanica meadow,cover of rock (Time 1: R2 = 0.433, p < 0.01; Time 2: R2 = 0.387,p < 0.01), maximum depth (Time 1: R2 = 0.221, p < 0.05), and num-ber of small (Time 1: R2 = 0.405, p < 0.01; Time 2: R2 = 0.488,p < 0.001) and medium-sized (Time 1: R2 = 0.365, p < 0.01) rockyboulders, declined significantly across the reserve boundary. Inaddition, verticality increased significantly with distance fromintegral reserve (Time 1: R2 = 0.591, p < 0.001; Time 2: R2 = 0.189,p < 0.05). On the other hand, on rocky substrate, a significant lineardecrease of rock cover was obtained across the reserve boundary(Time 1: R2 = 0.293, p < 0.05), whereas seagrass cover showed theopposite trend (Time 1: R2 = 0.315, p < 0.01). Furthermore, med-ium-sized (Time 2: R2 = 0.310, p < 0.01) and large (Time 2:R2 = 0.517, p < 0.001) rocky boulders increased significantly withdistance from integral reserve.
The parameters of fish assemblage responded to combinationsof complexity and heterogeneity of habitat. The analyses of resid-uals confirm the goodness-of-fit of the models, so that no furtherreference will be given to these procedures. The regression modelconstructed on the observed values of total reduced biomass on P.oceanica, incorporated four habitat variables to explain 32.5% of thevariation (Table 1). Biomass responded to variations in rock cover,minimum and maximum depth and number of small boulders.Similarly, on rocky substrate, the multiple regression analysis ofreduced biomass accounted for 28.4% of the variation, but the

Tabl
e1
Resu
lts
ofm
ulti
ple
linea
rre
gres
sion
anal
ysis
ofm
ean
biom
ass
(ln-
tran
sfor
med
)(l
ng/
125
m2)a
gain
stha
bita
tst
ruct
ure
desc
ript
ors
for
tota
lred
uced
biom
ass
and
the
12an
d20
spec
ies
mos
tfr
eque
nton
P.oc
eani
cam
eado
wan
don
rock
ysu
bstr
ate
resp
ecti
vely
.For
full
spec
ies
nam
esse
eTa
ble
2
Spec
ies
nA
dj.R
2Fa
Con
st.
P.oc
eP.
oce3
Roc
kR
ock
2R
ock
3Sa
ndD
.min
D.m
in2
D.m
in3
D.m
axD
.max
2D
.max
3V
ert
Ver
t2V
ert3
Smll
.bSm
ll.b
3M
ed.b
Med
.b2
Med
.b3
Larg
.bLa
rg.b
2La
rg.b
3
P.oc
eani
cam
eado
wR
edu
ced
biom
ass
252
0.32
525
.181
***
9.41
1–
–0.
176
––
––
–�
0.00
1�
0.65
7–
0.00
3–
––
0.17
9–
––
––
––
C.ju
lis25
20.
162
25.2
12**
*2.
593
–�
1.5E�
6–
––
–0.
228
––
––
––
––
––
––
––
––
D.a
nnul
aris
252
ns
––
––
––
––
––
––
––
––
––
––
––
––
D.s
arga
s25
10.
123
12.7
23**
*2.
266
––
––
––
�0.
348
––
––
0.00
2–
––
––
––
––
–0.
822
D.v
ulga
ris
250
0.04
713
.342
***
9.07
8�
0.07
6–
––
––
––
––
––
––
––
––
––
––
–L.
mer
ula
252
0.02
16.
395*
0.67
5–
––
––
––
––
––
––
––
0.22
2–
––
––
––
S.sa
lpa
252
0.12
518
.888
***
1.70
9–
–0.
320
––
––
––
––
––
––
0.46
2–
––
––
––
S.sc
riba
252
0.10
115
.141
***
1.55
0–
–0.
146
––
––
––
––
0.00
1–
––
––
––
––
––
S.ca
ntha
rus
252
0.02
84.
669*
�0.
527
––
––
––
0.20
0–
––
–�
0.00
1–
––
––
––
––
––
S.oc
ella
tus
251
0.06
39.
448**
*2.
932
–�
1.8E�
6–
––
––
––
––
––
–�
0.13
3–
––
––
––
–S.
rost
ratu
s25
20.
019
5.92
7*0.
072
––
––
––
––
2.8E�
4–
––
––
––
––
––
––
–S.
tinc
a25
20.
025
4.15
3*1.
444
––
––
––
––
–0.
138
––
––
––
––
�0.
028
––
––
T.pa
vo24
90.
156
46.9
28**
*0.
193
––
––
––
––
––
––
––
––
–0.
318
––
––
–
Roc
kysu
bstr
ate
Red
uce
dbi
omas
s25
10.
284
20.4
81**
*6.
961
––
––
1.6E�
6–
––
––
––
0.44
3–
�0.
006
––
––
––
�0.
012
0.00
1
A.i
mbe
rbis
249
0.18
710
.487
***�
1.07
5–
––
4.3E�
4�
5.0E�
6–
0.22
––
––
�3.
7E�
40.
168
––
––
––
–0.
069
––
C.ju
lis25
10.
115
33.5
61**
*3.
078
––
––
––
––
–0.
106
––
––
––
––
––
––
–D
.den
tex
250
0.07
420
.992
***�
0.18
3–
––
–2.
1E�
6–
––
––
––
––
––
––
––
––
–D
.ann
ular
is25
10.
153
23.6
03**
*3.
597
––
––
�2.
7E�
6–
––
––
––
––
––
––
–2.
7E�
4–
––
D.c
ervi
nus
252
0.29
335
.674
***
4.70
9–
�7.
4E�
6–
�0.
003
2.6E�
5–
––
––
––
––
––
––
––
––
–D
.pun
tazz
o25
20.
184
29.2
25**
*0.
611
––
–3.
6E�
4–
––
––
––
�3.
4E�
4–
––
––
––
––
––
D.s
arga
s25
20.
118
34.6
21**
*3.
506
––
––
3.0E�
6–
––
––
––
––
––
––
––
––
–D
.vul
gari
s25
20.
225
15.5
89**
*3.
141
––
0.01
7–
––
––
––
–�
0.00
10.
732�
0.07
5–
––
––
–0.
075
––
E.m
argi
natu
s25
20.
168
26.4
23**
*0.
452
––
––
3.9E�
6–
––
–�
3.4E�
4–
––
––
––
––
––
––
L.m
erul
a25
20.
148
15.5
70**
*3.
748
––
0.01
5–
––
––
–�
0.60
40.
021
––
––
––
––
––
––
S.sa
lpa
249
0.09
97.
779**
*4.
240
––
––
––
––
––
––
0.69
2–
––
�1.
9E�
4–
––
–�
0.03
60.
003
S.um
bra
248
0.14
114
.548
***
0.30
0–
––
––
––
––
––
�2.
8E�
40.
641
––
–1.
6E�
4–
––
––
–S.
scri
ba25
20.
027
8.06
4**2.
923
––
–1.
2E�
4–
––
––
––
––
––
––
––
––
––
S.ca
ntha
rus
252
0.11
116
.732
***�
0.26
2–
––
––
––
––
0.08
5–
––
––
�0.
023
––
––
––
–S.
med
iter
ran
251
0.02
36.
927**
0.11
0–
––
––
–0.
054
––
––
––
––
––
––
––
––
S.oc
ella
tus
251
0.11
28.
901**
*0.
722
––
0.04
2–
�4.
4E�
6�
0.09
7–
––
––
––
––
––
––
-0.
055
––
S.ro
issa
li25
20.
177
18.9
92**
*3.
369
––
––
�6.
9E�
7–
––
–�
0.38
60.
012
––
––
––
––
––
––
S.ro
stra
tus
252
0.03
55.
587**
0.92
8–
�1.
9E�
6–
–�
7.7E�
7–
––
––
––
––
––
––
––
––
–S.
tinc
a25
00.
074
20.9
17**
*5.
609
––
––
––
�0.
137
––
––
––
––
––
––
––
––
T.pa
vo25
20.
245
14.5
97**
*0.
730
––
–1.
6E�
4–
––
0.00
9–
––
�0.
001
0.65
1�
0.06
4–
––
0.05
3–
––
––
Hab
itat
stru
ctu
rede
scri
ptor
s:P.
oce,
P.oc
eani
caco
ver;
Roc
k,ro
ckco
ver;
San
d,sa
nd
cove
r;D
.min
,min
imu
mde
pth
;D
.max
,max
imu
mde
pth
;V
ert,
vert
ical
ity;
smll
.b,s
mal
lbou
lder
s;m
ed.b
,med
ium
-siz
edbo
uld
ers;
larg
.b,l
arge
bou
lder
s.Su
pers
crip
tsre
fer
toqu
adra
tic
and
cubi
cte
rms.
aPr
obab
ilit
y:* p
<0.
05;
**p
<0.
01;
*** p
<0.
001;
ns,
not
sign
ifica
nt.
540 A. Forcada et al. / Marine Environmental Research 66 (2008) 536–547
A. Forcada et al. / Marine Environmental Research 66 (2008) 536–547 541
model incorporated rock cover, verticality and number of largeboulders (Table 1).
Significant models were obtained for 11 of the 12 most frequentnon-pelagic species on P. oceanica, when exploring the relationshipbetween their biomass and habitat variables (Table 1). The fittedmodels accounted for 1.9–16.2% of the observed variation in spe-cies biomasses, although the explained variance was substantial(>10%) for only five species. Sand cover did not explain variationin any species biomass, while maximum and minimum depth werethe habitat variables most included in the models. On rocky sub-strate, 20 non-pelagic species had a frequency of occur-rence P 10%, and all of them showed significant models, but theproportion of variance explained exceed 10% only for 14 species(Table 1). In general, models incorporated more than two habitatvariables and explained 2.3–29.3% of total variation of speciesbiomasses.
3.3. Gradients of fish biomass
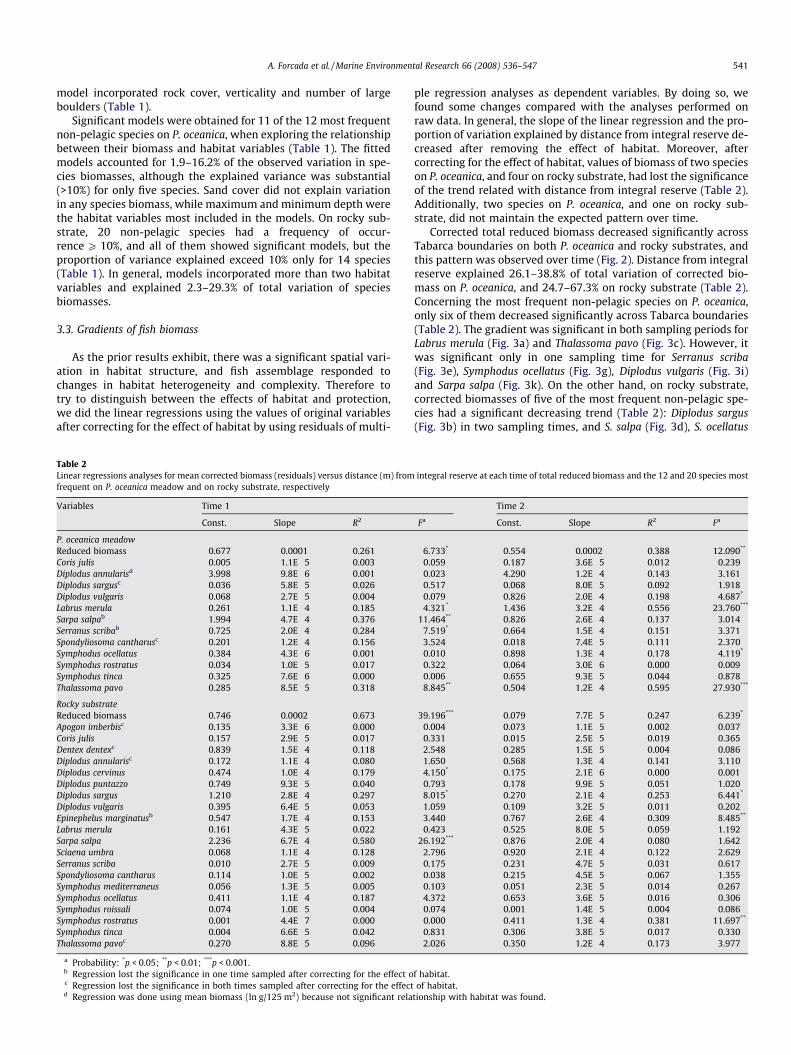
As the prior results exhibit, there was a significant spatial vari-ation in habitat structure, and fish assemblage responded tochanges in habitat heterogeneity and complexity. Therefore totry to distinguish between the effects of habitat and protection,we did the linear regressions using the values of original variablesafter correcting for the effect of habitat by using residuals of multi-
Table 2Linear regressions analyses for mean corrected biomass (residuals) versus distance (m) fromfrequent on P. oceanica meadow and on rocky substrate, respectively
Variables Time 1
Const. Slope R2
P. oceanica meadowReduced biomass 0.677 �0.0001 0.261Coris julis �0.005 �1.1E�5 0.003Diplodus annularisd 3.998 �9.8E�6 0.001Diplodus sargusc 0.036 5.8E�5 0.026Diplodus vulgaris 0.068 �2.7E�5 0.004Labrus merula 0.261 �1.1E�4 0.185Sarpa salpab 1.994 �4.7E�4 0.376Serranus scribab 0.725 �2.0E�4 0.284Spondyliosoma cantharusc �0.201 1.2E�4 0.156Symphodus ocellatus �0.384 4.3E�6 0.001Symphodus rostratus �0.034 �1.0E�5 0.017Symphodus tinca �0.325 7.6E�6 0.000Thalassoma pavo 0.285 �8.5E�5 0.318
Rocky substrateReduced biomass 0.746 �0.0002 0.673Apogon imberbisc 0.135 �3.3E�6 0.000Coris julis �0.157 2.9E�5 0.017Dentex dentexc 0.839 �1.5E�4 0.118Diplodus annularisc �0.172 1.1E�4 0.080Diplodus cervinus 0.474 �1.0E�4 0.179Diplodus puntazzo 0.749 �9.3E�5 0.040Diplodus sargus 1.210 �2.8E�4 0.297Diplodus vulgaris 0.395 �6.4E�5 0.053Epinephelus marginatusb 0.547 �1.7E�4 0.153Labrus merula �0.161 �4.3E�5 0.022Sarpa salpa 2.236 �6.7E�4 0.580Sciaena umbra 0.068 �1.1E�4 0.128Serranus scriba 0.010 2.7E�5 0.009Spondyliosoma cantharus 0.114 �1.0E�5 0.002Symphodus mediterraneus 0.056 �1.3E�5 0.005Symphodus ocellatus �0.411 �1.1E�4 0.187Symphodus roissali �0.074 1.0E�5 0.004Symphodus rostratus 0.001 �4.4E�7 0.000Symphodus tinca �0.004 �6.6E�5 0.042Thalassoma pavoc 0.270 �8.8E�5 0.096
a Probability: *p < 0.05; **p < 0.01; ***p < 0.001.b Regression lost the significance in one time sampled after correcting for the effect oc Regression lost the significance in both times sampled after correcting for the effectd Regression was done using mean biomass (ln g/125 m2) because not significant rela
ple regression analyses as dependent variables. By doing so, wefound some changes compared with the analyses performed onraw data. In general, the slope of the linear regression and the pro-portion of variation explained by distance from integral reserve de-creased after removing the effect of habitat. Moreover, aftercorrecting for the effect of habitat, values of biomass of two specieson P. oceanica, and four on rocky substrate, had lost the significanceof the trend related with distance from integral reserve (Table 2).Additionally, two species on P. oceanica, and one on rocky sub-strate, did not maintain the expected pattern over time.
Corrected total reduced biomass decreased significantly acrossTabarca boundaries on both P. oceanica and rocky substrates, andthis pattern was observed over time (Fig. 2). Distance from integralreserve explained 26.1–38.8% of total variation of corrected bio-mass on P. oceanica, and 24.7–67.3% on rocky substrate (Table 2).Concerning the most frequent non-pelagic species on P. oceanica,only six of them decreased significantly across Tabarca boundaries(Table 2). The gradient was significant in both sampling periods forLabrus merula (Fig. 3a) and Thalassoma pavo (Fig. 3c). However, itwas significant only in one sampling time for Serranus scriba(Fig. 3e), Symphodus ocellatus (Fig. 3g), Diplodus vulgaris (Fig. 3i)and Sarpa salpa (Fig. 3k). On the other hand, on rocky substrate,corrected biomasses of five of the most frequent non-pelagic spe-cies had a significant decreasing trend (Table 2): Diplodus sargus(Fig. 3b) in two sampling times, and S. salpa (Fig. 3d), S. ocellatus
integral reserve at each time of total reduced biomass and the 12 and 20 species most
Time 2
Fa Const. Slope R2 Fa
6.733* 0.554 �0.0002 0.388 12.090**
0.059 0.187 �3.6E�5 0.012 0.2390.023 4.290 �1.2E�4 0.143 3.1610.517 0.068 �8.0E�5 0.092 1.9180.079 0.826 �2.0E�4 0.198 4.687*
4.321* 1.436 �3.2E�4 0.556 23.760***
11.464** 0.826 �2.6E�4 0.137 3.0147.519* 0.664 �1.5E�4 0.151 3.3713.524 0.018 �7.4E�5 0.111 2.3700.010 0.898 �1.3E�4 0.178 4.119*
0.322 0.064 3.0E�6 0.000 0.0090.006 0.655 �9.3E�5 0.044 0.8788.845** 0.504 �1.2E�4 0.595 27.930***
39.196*** 0.079 �7.7E�5 0.247 6.239*
0.004 �0.073 �1.1E�5 0.002 0.0370.331 �0.015 2.5E�5 0.019 0.3652.548 �0.285 �1.5E�5 0.004 0.0861.650 �0.568 1.3E�4 0.141 3.1104.150* �0.175 2.1E�6 0.000 0.0010.793 �0.178 �9.9E�5 0.051 1.0208.015* 0.270 �2.1E�4 0.253 6.441*
1.059 �0.109 �3.2E�5 0.011 0.2023.440 0.767 �2.6E�4 0.309 8.485**
0.423 0.525 �8.0E�5 0.059 1.19226.192*** �0.876 2.0E�4 0.080 1.642
2.796 0.920 �2.1E�4 0.122 2.6290.175 �0.231 4.7E�5 0.031 0.6170.038 �0.215 4.5E�5 0.067 1.3550.103 0.051 �2.3E�5 0.014 0.2674.372 0.653 3.6E�5 0.016 0.3060.074 �0.001 1.4E�5 0.004 0.0860.000 �0.411 1.3E�4 0.381 11.697**
0.831 0.306 �3.8E�5 0.017 0.3302.026 0.350 �1.2E�4 0.173 3.977
f habitat.of habitat.
tionship with habitat was found.

Fig. 2. Mean corrected total biomass (residuals) at each site as a function of distance from integral reserve centre (IR) on (a) P. oceanica meadow and (b) rocky substrate. Alinear regression is showed for each time sampled when it was significant. Error bars indicate standard error.
542 A. Forcada et al. / Marine Environmental Research 66 (2008) 536–547
(Fig. 3f), Epinephelus marginatus (Fig. 3h) and Diplodus cervinus(Fig. 3j) in only one. On the contrary, corrected biomass of Symph-odus rostratus (Fig. 3l) increased across Tabarca boundaries, but itwas significant only in one sampling time.
3.4. Spatial variation in the multivariate structure of fish assemblage
MDS clearly separated the two habitats sampled, except forlocalities 1 (during both times) and 3 (only during time 1) of P. oce-anica, which had a similarity of 70% with the assemblage observedon rocky substrate (Fig. 4). SIMPROF test corroborated these results(p = 4.29, p < 0.001). The pattern related with distance from inte-gral reserve was observed only on rocky substrate. Fish assemblagein the integral reserve differed significantly (p = 1.11, p = 0.015)from that censued on the other localities. Moreover, fish assem-blages of the rest of localities were split significantly (p = 1.93,p < 0.001) in two groups: the first one enclosed localities 2, 3 and4, and the second included localities 5, 6 and 7. In the last groupwere also included the fish assemblage of the integral reserve ofP. oceanica, which had a structure different to those observed inthe other localities of seagrass.
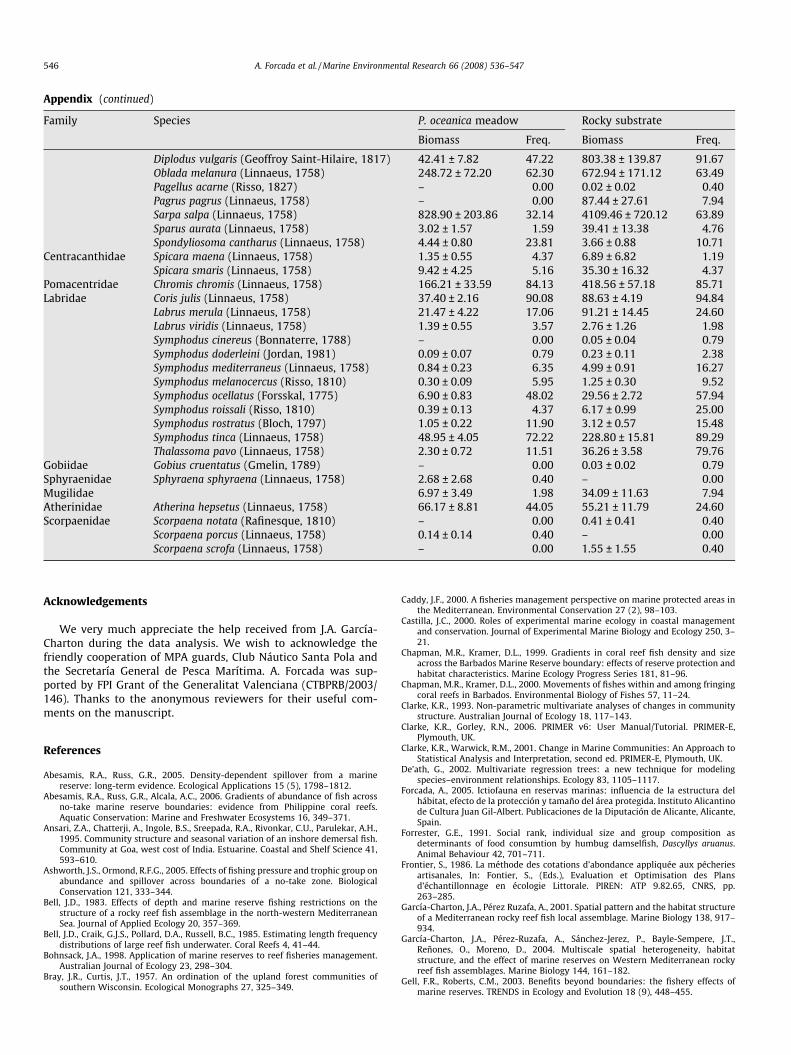
The environmental variables, habitat, rock cover and maximumdepth were strongly collinear with P. oceanica cover, number ofsmall boulders and minimum depth, respectively (Pearson’s corre-lation coefficient > 0.95). BEST results showed that the combina-tion of substrate cover, number of medium-sized boulders, anddistance from integral reserve was the most correlated with fishassemblage structure (q = 0.674, p < 0.001). The inclusion of thesevariables in LINKTREE analysis (Fig. 5) resulted that distance fromintegral reserve explained the differences found among localities ofrocky substrate. On rocky habitat, substrate cover was also impor-tant in the differences found between the integral reserve and thelocalities 2, 3 and 4.
4. Discussion
Total reduced biomass of fish assemblage and biomass of somespecific species exhibited a decreasing gradient across TabarcaMarine Reserve boundaries, which persisted even though the ef-fects of the habitat structure were removed. Changes in the multi-variate structure of the fish assemblage were also related withdistance from integral reserve. The pattern was observed on bothhabitats studied, and persisted over time for total reduced biomassand some studied species.
The exploration of the relationship among fish assemblageparameters and environmental variables in this study corroboratesthat habitat structure is an important factor likely to explain the spa-tial distribution of Mediterranean fish assemblages. Whereas visualcounts were performed on areas with habitat structure as compara-
ble as possible, multiple linear regressions demonstrated thathabitat characteristics, at the smallest spatial scale, influenced sig-nificantly the fish community parameters studied. Other studies alsoattribute a substantial part of the observed spatial variability in fishassemblages to habitat (Ruitton et al., 2000; García-Charton andPérez Ruzafa, 2001; Letourneu et al., 2003). Greater habitat heteroge-neity and complexity result in a bigger variety of substrates andgreater surface availability, therefore additional and a diversificationof resources for individual fish are provided (food, refuge against pre-dation or light, as well as resting or mating sites; García-Charton andPérez Ruzafa, 2001). We found that each of the habitat structure vari-ables considered was significant in explaining the spatial distribu-tion of the studied fish assemblage. This implies that all of themshould be taken into account because only this approach may givethe most comprehensive view of the fish assemblage-habitat rela-tionship (Ruitton et al., 2000). In this sense, Mediterranean MPAswere usually established in zones that already harbour intrinsicstructurally complex habitats (Ramos-Esplá et al., 2004), which fa-vour the development of abundant fish fauna. Additionally, protec-tion may also enhance the quality of habitat which is preservedinside MPAs from negative impacts (e.g. destructive fishing prac-tices; Sumaila et al., 2000). In fact, the present study demonstratedthat Tabarca Marine Reserve had some differences in habitat struc-ture compared to surrounding areas. Most of the habitat variablesthat explain part of the variability of the fish assemblage had signif-icant linear trends from inside to outside the marine reserve, and thisinfluence was taken into account. The decrease in the number of sig-nificant gradients related to distance from integral reserve, whencalculated after extraction of variation due to habitat, confirmed thathabitat characteristics were, in some cases, more important thanprotection in explaining the pattern of the data. Note, however, thatstatistically controlling for habitat correlates may attribute effects ofreserve protection to spuriously correlated habitat characteristics,increasing the potential for type II error when testing for significanteffects of reserve protection (Chapman and Kramer, 1999). Our re-sults indicating no significant effect of reserve status based on thisapproach should therefore be interpreted cautiously.
After extracting the effect of habitat, significant decreasing gradi-ents of total fish biomass and most of the species studied were ob-served on P. oceanica and rocky substrate, and some of them wereconsistent over time. Changes in the structure of the fish assemblagewere correlated with distance from integral reserve and not withprotection status (inside–outside MPA). These gradual changes infish assemblage related with distance from integral reserve, ratherthan a sudden change across the reserve boundary, indicate goodevidence of biomass export. About the species that did not maintainthe same pattern over time, it is part of the natural variability of thefish assemblage (Holbrook et al., 1994), which obliges to incorporatea suitable temporal replication in order to differentiate adequately
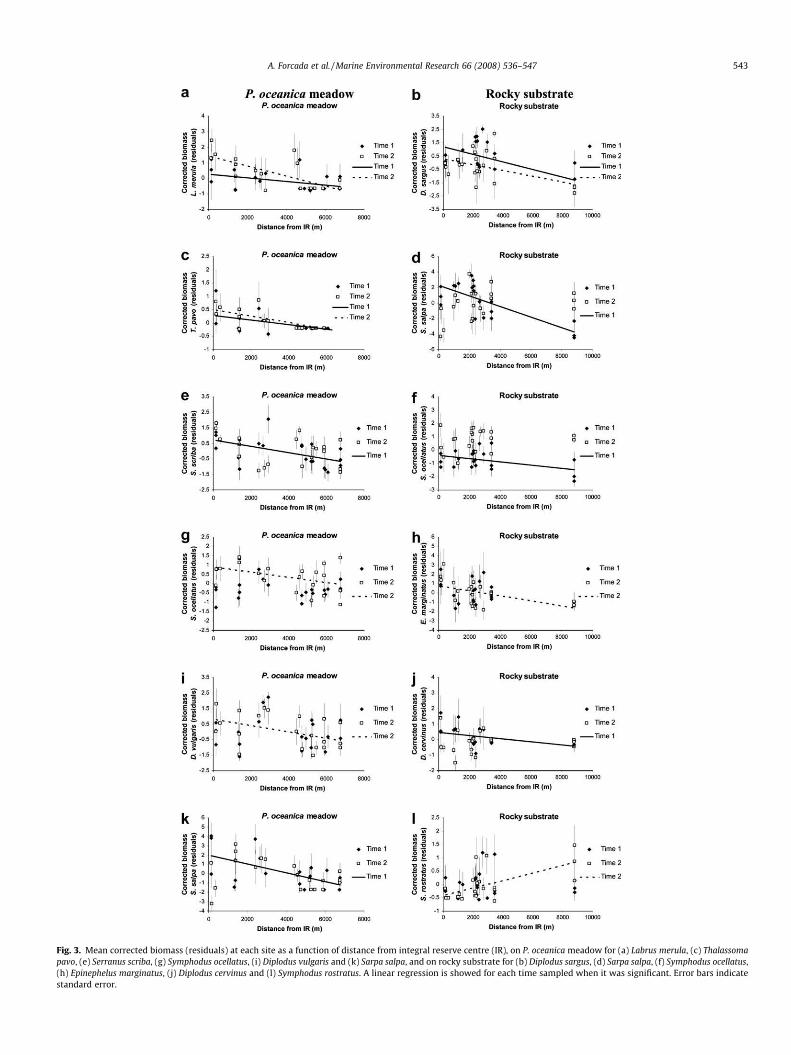
Fig. 3. Mean corrected biomass (residuals) at each site as a function of distance from integral reserve centre (IR), on P. oceanica meadow for (a) Labrus merula, (c) Thalassomapavo, (e) Serranus scriba, (g) Symphodus ocellatus, (i) Diplodus vulgaris and (k) Sarpa salpa, and on rocky substrate for (b) Diplodus sargus, (d) Sarpa salpa, (f) Symphodus ocellatus,(h) Epinephelus marginatus, (j) Diplodus cervinus and (l) Symphodus rostratus. A linear regression is showed for each time sampled when it was significant. Error bars indicatestandard error.
A. Forcada et al. / Marine Environmental Research 66 (2008) 536–547 543
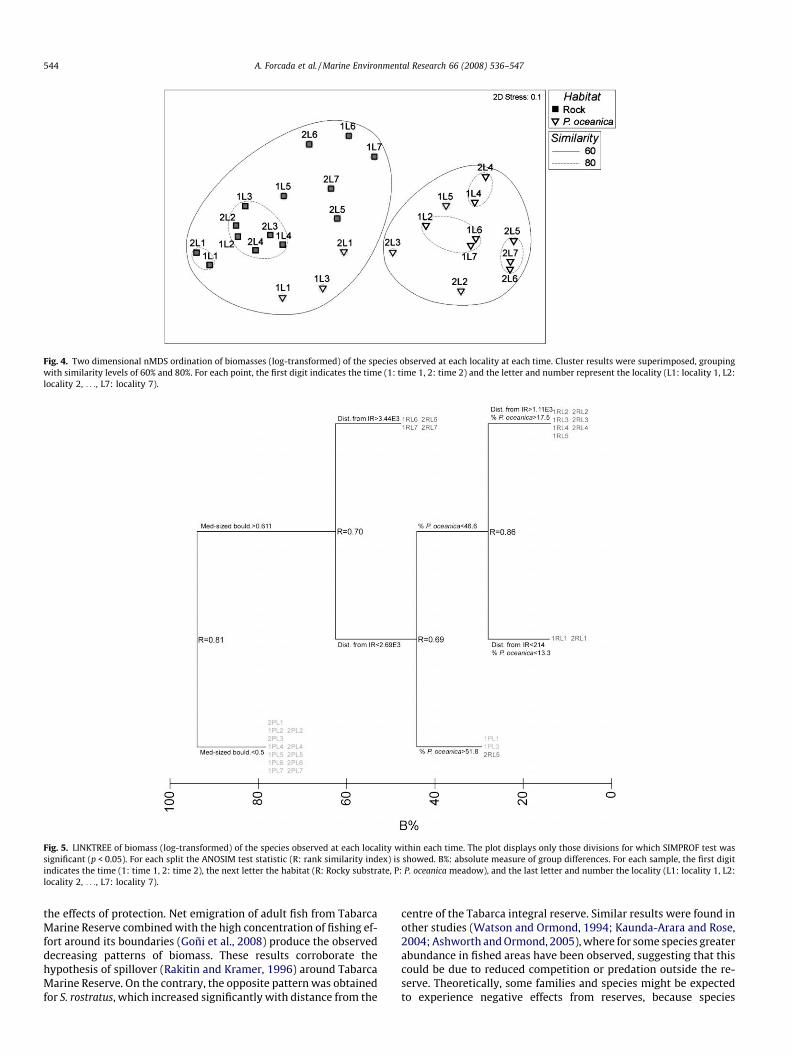
Fig. 4. Two dimensional nMDS ordination of biomasses (log-transformed) of the species observed at each locality at each time. Cluster results were superimposed, groupingwith similarity levels of 60% and 80%. For each point, the first digit indicates the time (1: time 1, 2: time 2) and the letter and number represent the locality (L1: locality 1, L2:locality 2, . . ., L7: locality 7).
Fig. 5. LINKTREE of biomass (log-transformed) of the species observed at each locality within each time. The plot displays only those divisions for which SIMPROF test wassignificant (p < 0.05). For each split the ANOSIM test statistic (R: rank similarity index) is showed. B%: absolute measure of group differences. For each sample, the first digitindicates the time (1: time 1, 2: time 2), the next letter the habitat (R: Rocky substrate, P: P. oceanica meadow), and the last letter and number the locality (L1: locality 1, L2:locality 2, . . ., L7: locality 7).
544 A. Forcada et al. / Marine Environmental Research 66 (2008) 536–547
the effects of protection. Net emigration of adult fish from TabarcaMarine Reserve combined with the high concentration of fishing ef-fort around its boundaries (Goñi et al., 2008) produce the observeddecreasing patterns of biomass. These results corroborate thehypothesis of spillover (Rakitin and Kramer, 1996) around TabarcaMarine Reserve. On the contrary, the opposite pattern was obtainedfor S. rostratus, which increased significantly with distance from the
centre of the Tabarca integral reserve. Similar results were found inother studies (Watson and Ormond, 1994; Kaunda-Arara and Rose,2004; Ashworth and Ormond, 2005), where for some species greaterabundance in fished areas have been observed, suggesting that thiscould be due to reduced competition or predation outside the re-serve. Theoretically, some families and species might be expectedto experience negative effects from reserves, because species

A. Forcada et al. / Marine Environmental Research 66 (2008) 536–547 545
interactions may also have important effects (Pinnegar et al., 2000;Jennings, 2001).
Although significant decreasing gradients has been detected inboth habitats, we found some differences between the results ob-tained in P. oceanica meadow and on rocky substrate. Distance fromintegral reserve explained greater proportion of variance of total re-duced biomass on rocky substrate than in P. oceanica meadow. More-over, the multivariate structure of the fish assemblage showed agradual change related with distance from integral reserve on rockysubstrate, meanwhile over P. oceanica only the assemblage of theintegral reserve was different to those of the other localities. Theseresults suggest that, contrary to what we expected, evidence of spill-over seem to be clearer on rocky substrate even though it has a bigdiscontinuity between inside to outside Tabarca Marine Reserve.Although the multivariate structure of fish assemblage was signifi-cantly different between P. oceanica and rocky substrate, 80% ofthe species were observed at both habitats. The relative lack of spec-ificity of most species for bottom features could be the result of thecombination of a relatively wide home range and flexibility on re-sources use in general. Although, another likely explanation is thatmost of the target species (e.g. E. marginatus, Sciaena umbra, D. cervi-nus, etc.,) seek shelter during daytime hours on rocky substrates,increasing their residence time in this habitat, hence responses toprotection would be intrinsically stronger to detect on rocky sub-strates relative to P. oceanica meadows. In this sense, the diet andpattern of space occupation of species may vary depending on age(Harmelin-Vivien et al., 1989), resulting in morphological changes,learning, social rank, reproductive state and sex (in the case ofsequential hermaphrodite species) (Forrester, 1991; McCormick,1998). Furthermore, most fish species would be sufficiently flexiblein their feeding and space requirements to adapt to resources avail-able at each site and to avoid competing for them with conspecificsor individuals of other species, as suggested by a few studies in theMediterranean Sea (Harmelin-Vivien et al., 1989; Jennings et al.,1997). Therefore, it can be suggested that movements of fish amongrocky patches could occur easily through P. oceanica meadows whichacts as a suitable path. It has been pointed out (Roberts, 2000) that
Appendix A
Mean total biomass ± standard error (g/125 m2) and percentage of freqmeadow and rocky substrate
Family Species P. o
Bio
Muraenidae Muraena helena (Linnaeus, 1758) 3.1Serranidae Anthias anthias (Linnaeus, 1758) 0.0
Epinephelus costae (Valenciennes, 1828) 3.3Epinephelus marginatus (Lowe, 1834) 187Mycteroperca rubra (Bloch, 1793) 8.3Serranus cabrilla (Linnaeus, 1758) 0.2Serranus scriba Linnaeus, 1758 32.
Moronidae Dicentrarchus labrax (Linnaeus, 1758) –Apogonidae Apogon imberbis (Lacepède, 1801) –Haemulidae Pomadasys incisus (Bowdich, 1825) –Sciaenidae Sciaena umbra (Linnaeus, 1758) 15.Mullidae Mullus surmuletus (Linnaeus, 1758) 1.9Sparidae Boops boops (Linnaeus, 1758) 218
Dentex dentex (Linnaeus, 1758) 110Diplodus annularis (Rafinesque, 1810) 81.Diplodus cervinus (Lowe, 1841) 0.2Diplodus puntazzo, (Cetti, 1789) 5.3Diplodus sargus (Linnaeus, 1758) 42.
habitat continuity through MPAs limits is important for biomass ex-port to open fished areas. An extensive tagging study carried out inApo Reserve (Chapman and Kramer, 2000) supports this assessment.When reserve boundaries are set at natural barriers where costs ofmoving increase, relocation across the boundaries should be re-duced, and conversely, fish may readily move from reserves to fishedareas when these areas are connected by continuous suitable habitat(Chapman and Kramer, 2000). However, this assumption does notseem to be useful for the fish assemblage associated to rocky patcheslocated inside P. oceanica beds. Our results suggest that fish couldmove easily among rocky patches when they are located inside P.oceanica meadows. To obtain spillover effects, habitat continuity ofrocky bottoms is not as important as their presence inside and out-side the MPA, only if they are properly connected. Defining andunderstanding the mosaic of habitats and their connection withinthe ecosystem is critical. MPAs need to be viewed in the larger con-text of the entire ecosystem and their design needs to consider thehabitat requirements and life histories of the species of interest, aswell as the extent to which these habitats interact at larger spatialscales.
5. Conclusions
This study detected gradients of decreasing biomass of fishacross the boundaries of Tabarca Marine Reserve, which continuedeven after removing the effects of the habitat structure. This pat-tern persisted over time for total reduced biomass and some stud-ied species. Decreasing gradients appeared in both habitatsstudied, P. oceanica meadow and rocky substrate, and indepen-dently of their different continuity through the reserve boundaries.These gradients ultimately culminated in progressive change in thestructure of fish assemblages, particularly on rocky substrate. All ofthese results support the hypothesis that the export of fish fromTabarca Marine Reserve occurs. This process should provide localbenefits to the artisanal fleet which operates in fishing grounds justaround Tabarca Marine Reserve, achieving the main objective ofthe creation of this MPA.
uency of occurrence (Freq.) of the species observed in P. oceanica
ceanica meadow Rocky substrate
mass Freq. Biomass Freq.
4 ± 3.14 0.40 100.66 ± 35.22 4.763 ± 0.03 0.40 0.09 ± 0.09 0.406 ± 3.36 0.40 26.91 ± 10.75 3.17.03 ± 119.46 2.78 1339.01 ± 431.57 23.41
7 ± 8.37 0.40 67.43 ± 29.87 3.170 ± 0.15 0.79 0.23 ± 0.23 0.4059 ± 5.42 71.03 80.52 ± 5.23 82.54
0.00 12.87 ± 9.41 1.980.00 15.17 ± 2.45 30.950.00 7.35 ± 2.81 3.97
75 ± 6.42 5.95 320.02 ± 61.07 23.024 ± 0.82 7.54 1.53 ± 0.64 4.37.05 ± 35.21 38.10 159.89 ± 42.83 11.90.84 ± 44.67 5.95 486.25 ± 202.24 11.90
97 ± 5.33 97.62 53.06 ± 4.77 64.682 ± 0.22 0.40 45.43 ± 10.58 11.511 ± 2.50 5.16 161.25 ± 21.38 38.1038 ± 14.91 23.41 585.50 ± 63.32 82.54
Appendix (continued)
Family Species P. oceanica meadow Rocky substrate
Biomass Freq. Biomass Freq.
Diplodus vulgaris (Geoffroy Saint-Hilaire, 1817) 42.41 ± 7.82 47.22 803.38 ± 139.87 91.67Oblada melanura (Linnaeus, 1758) 248.72 ± 72.20 62.30 672.94 ± 171.12 63.49Pagellus acarne (Risso, 1827) – 0.00 0.02 ± 0.02 0.40Pagrus pagrus (Linnaeus, 1758) – 0.00 87.44 ± 27.61 7.94Sarpa salpa (Linnaeus, 1758) 828.90 ± 203.86 32.14 4109.46 ± 720.12 63.89Sparus aurata (Linnaeus, 1758) 3.02 ± 1.57 1.59 39.41 ± 13.38 4.76Spondyliosoma cantharus (Linnaeus, 1758) 4.44 ± 0.80 23.81 3.66 ± 0.88 10.71
Centracanthidae Spicara maena (Linnaeus, 1758) 1.35 ± 0.55 4.37 6.89 ± 6.82 1.19Spicara smaris (Linnaeus, 1758) 9.42 ± 4.25 5.16 35.30 ± 16.32 4.37
Pomacentridae Chromis chromis (Linnaeus, 1758) 166.21 ± 33.59 84.13 418.56 ± 57.18 85.71Labridae Coris julis (Linnaeus, 1758) 37.40 ± 2.16 90.08 88.63 ± 4.19 94.84
Labrus merula (Linnaeus, 1758) 21.47 ± 4.22 17.06 91.21 ± 14.45 24.60Labrus viridis (Linnaeus, 1758) 1.39 ± 0.55 3.57 2.76 ± 1.26 1.98Symphodus cinereus (Bonnaterre, 1788) – 0.00 0.05 ± 0.04 0.79Symphodus doderleini (Jordan, 1981) 0.09 ± 0.07 0.79 0.23 ± 0.11 2.38Symphodus mediterraneus (Linnaeus, 1758) 0.84 ± 0.23 6.35 4.99 ± 0.91 16.27Symphodus melanocercus (Risso, 1810) 0.30 ± 0.09 5.95 1.25 ± 0.30 9.52Symphodus ocellatus (Forsskal, 1775) 6.90 ± 0.83 48.02 29.56 ± 2.72 57.94Symphodus roissali (Risso, 1810) 0.39 ± 0.13 4.37 6.17 ± 0.99 25.00Symphodus rostratus (Bloch, 1797) 1.05 ± 0.22 11.90 3.12 ± 0.57 15.48Symphodus tinca (Linnaeus, 1758) 48.95 ± 4.05 72.22 228.80 ± 15.81 89.29Thalassoma pavo (Linnaeus, 1758) 2.30 ± 0.72 11.51 36.26 ± 3.58 79.76
Gobiidae Gobius cruentatus (Gmelin, 1789) – 0.00 0.03 ± 0.02 0.79Sphyraenidae Sphyraena sphyraena (Linnaeus, 1758) 2.68 ± 2.68 0.40 – 0.00Mugilidae 6.97 ± 3.49 1.98 34.09 ± 11.63 7.94Atherinidae Atherina hepsetus (Linnaeus, 1758) 66.17 ± 8.81 44.05 55.21 ± 11.79 24.60Scorpaenidae Scorpaena notata (Rafinesque, 1810) – 0.00 0.41 ± 0.41 0.40
Scorpaena porcus (Linnaeus, 1758) 0.14 ± 0.14 0.40 – 0.00Scorpaena scrofa (Linnaeus, 1758) – 0.00 1.55 ± 1.55 0.40
546 A. Forcada et al. / Marine Environmental Research 66 (2008) 536–547
Acknowledgements
We very much appreciate the help received from J.A. García-Charton during the data analysis. We wish to acknowledge thefriendly cooperation of MPA guards, Club Náutico Santa Pola andthe Secretaría General de Pesca Marítima. A. Forcada was sup-ported by FPI Grant of the Generalitat Valenciana (CTBPRB/2003/146). Thanks to the anonymous reviewers for their useful com-ments on the manuscript.
References
Abesamis, R.A., Russ, G.R., 2005. Density-dependent spillover from a marinereserve: long-term evidence. Ecological Applications 15 (5), 1798–1812.
Abesamis, R.A., Russ, G.R., Alcala, A.C., 2006. Gradients of abundance of fish acrossno-take marine reserve boundaries: evidence from Philippine coral reefs.Aquatic Conservation: Marine and Freshwater Ecosystems 16, 349–371.
Ansari, Z.A., Chatterji, A., Ingole, B.S., Sreepada, R.A., Rivonkar, C.U., Parulekar, A.H.,1995. Community structure and seasonal variation of an inshore demersal fish.Community at Goa, west cost of India. Estuarine. Coastal and Shelf Science 41,593–610.
Ashworth, J.S., Ormond, R.F.G., 2005. Effects of fishing pressure and trophic group onabundance and spillover across boundaries of a no-take zone. BiologicalConservation 121, 333–344.
Bell, J.D., 1983. Effects of depth and marine reserve fishing restrictions on thestructure of a rocky reef fish assemblage in the north-western MediterraneanSea. Journal of Applied Ecology 20, 357–369.
Bell, J.D., Craik, G.J.S., Pollard, D.A., Russell, B.C., 1985. Estimating length frequencydistributions of large reef fish underwater. Coral Reefs 4, 41–44.
Bohnsack, J.A., 1998. Application of marine reserves to reef fisheries management.Australian Journal of Ecology 23, 298–304.
Bray, J.R., Curtis, J.T., 1957. An ordination of the upland forest communities ofsouthern Wisconsin. Ecological Monographs 27, 325–349.
Caddy, J.F., 2000. A fisheries management perspective on marine protected areas inthe Mediterranean. Environmental Conservation 27 (2), 98–103.
Castilla, J.C., 2000. Roles of experimental marine ecology in coastal managementand conservation. Journal of Experimental Marine Biology and Ecology 250, 3–21.
Chapman, M.R., Kramer, D.L., 1999. Gradients in coral reef fish density and sizeacross the Barbados Marine Reserve boundary: effects of reserve protection andhabitat characteristics. Marine Ecology Progress Series 181, 81–96.
Chapman, M.R., Kramer, D.L., 2000. Movements of fishes within and among fringingcoral reefs in Barbados. Environmental Biology of Fishes 57, 11–24.
Clarke, K.R., 1993. Non-parametric multivariate analyses of changes in communitystructure. Australian Journal of Ecology 18, 117–143.
Clarke, K.R., Gorley, R.N., 2006. PRIMER v6: User Manual/Tutorial. PRIMER-E,Plymouth, UK.
Clarke, K.R., Warwick, R.M., 2001. Change in Marine Communities: An Approach toStatistical Analysis and Interpretation, second ed. PRIMER-E, Plymouth, UK.
De’ath, G., 2002. Multivariate regression trees: a new technique for modelingspecies–environment relationships. Ecology 83, 1105–1117.
Forcada, A., 2005. Ictiofauna en reservas marinas: influencia de la estructura delhábitat, efecto de la protección y tamaño del área protegida. Instituto Alicantinode Cultura Juan Gil-Albert. Publicaciones de la Diputación de Alicante, Alicante,Spain.
Forrester, G.E., 1991. Social rank, individual size and group composition asdeterminants of food consumtion by humbug damselfish, Dascyllys aruanus.Animal Behaviour 42, 701–711.
Frontier, S., 1986. La méthode des cotations d’abondance appliquée aux pécheriesartisanales, In: Fontier, S., (Eds.), Evaluation et Optimisation des Plansd’échantillonnage en écologie Littorale. PIREN: ATP 9.82.65, CNRS, pp.263–285.
García-Charton, J.A., Pérez Ruzafa, A., 2001. Spatial pattern and the habitat structureof a Mediterranean rocky reef fish local assemblage. Marine Biology 138, 917–934.
García-Charton, J.A., Pérez-Ruzafa, A., Sánchez-Jerez, P., Bayle-Sempere, J.T.,Reñones, O., Moreno, D., 2004. Multiscale spatial heterogeneity, habitatstructure, and the effect of marine reserves on Western Mediterranean rockyreef fish assemblages. Marine Biology 144, 161–182.
Gell, F.R., Roberts, C.M., 2003. Benefits beyond boundaries: the fishery effects ofmarine reserves. TRENDS in Ecology and Evolution 18 (9), 448–455.

A. Forcada et al. / Marine Environmental Research 66 (2008) 536–547 547
Goñi, R., Quetglas, A., Reñones, O., 2006. Spillover of spiny lobsters Palinurus elephasfrom a marine reserve to an adjoining fishery. Marine Ecology Progress Series308, 207–219.
Goñi, R., Adlerstein, S., Alvarez-Berastegui, D., Forcada, A., Reñones, O., Criquet, G.,Polti, S., Cadiou, G., Valle, C., Lenfant, P., Bonhomme, P., Perez-Ruzafa, A.,Sánchez-Lizaso, J.-L., García-Charton, J., Bernard, G., Stelzenmüller, V., Planes, S.,2008. Evidence of spillover from six Western Mediterranean marine protectedareas measured from artisanal fisheries. Marine Ecology Progress Series 366,159–174.
Halpern, B.S., 2003. The impact of marine reserves: do reserves work and does sizematter? Ecological Applications 13, S117–S137.
Harmelin, J.G., 1987. Structure and variability of the ichthyofauna in aMediterranean protected rocky area (National Park of Port-Cros, France).PSZNI: Marine Ecology 8, 263–284.
Harmelin-Vivien, M.L., Harmelin, J.G., Chauvet, C., Duval, C., Galzin, R., Lejeune, P.,Barnabé, G., Blanc, F., Chevalier, R., Duclerc, J., Lasserre, G., 1985. Evaluationvisuelle des peuplements et populations de poissons. Méthodes et problémes.Revue d’écologie (Terre Vie) 40, 467–539.
Harmelin-Vivien, M.L., Kaim-Malka, R.A., Ledoyer, M., Jacob-Abraham, S.S., 1989.Food partitioning among scorpaenid fishes in Mediterranean seagrass beds.Journal of Fish Biology 34, 715–734.
Hilborn, R., Stokes, K., Maguire, J-J., Smith, T., Botsford, L.W., Mangel, M., Orensanz,J., Parma, A., Rice, J., Bell, J., Cochrane, K.L., Garcia, S., Hall, S.J., Kirkwood, G.P.,Sainsbury, K., Stefansson, G., Stefansson, G., Walters, C., 2004. When can marinereserves improve fisheries management? Ocean and Coastal Management 47,197–205.
Holbrook, S.J., Kingsford, M.J., Schmitt, R.J., Stephens, J.J.S., 1994. Spatial patterns ofmarine reef fish assemblages. American Zoologist 34, 463–475.
Hurlbert, S.H., 1984. Pseudoreplication and the design of ecological fieldexperiments. Ecological Monographs 54 (2), 187–211.
Jennings, S., 2001. Patterns and predictions of population recovery in marinereserves. Reviews in Fish Biology and Fisheries 10, 209–231.
Jennings, S., Reñones, O., Morales-Nin, B., Polunin, N.V.C., Moranta, J., Coll, J., 1997.Spatial variation in the N15 and C13 stable isotope composition of plants,invertebrates and fishes on Mediterranean reefs: implications for the study oftrophic pathways. Marine Ecology Progress Series 146, 109–116.
Kaunda-Arara, B., Rose, G.A., 2004. Effects of marine reef National Parks on fisheryCPUE in coastal Kenya. Biological Conservation 118, 1–13.
Kendall, M.G., 1970. Rank Correlation Methods. Griffin, London.Letourneu, Y., Ruitton, S., Sartoretto, S., 2003. Environmental and benthic habitat
factors structuring the spatial distribution of a summer infralittoral fishassemblage in the north-western Mediterranean Sea. Journal of MarineBiologial Association of the United Kingdom 83, 193–204.
Magill, S.H., Sayer, M.D.J., 2002. Seasonal and interannual variation in fishassemblages of northern temperate rocky subtidal habitats. Journal of FishBiology 61, 1198–1216.
McClanahan, T.R., Mangi, S., 2000. Spillover of exploitable fishes from a marine parkand its effect on the adjacent fishery. Ecological Application 10 (6), 1792–1805.
McCormick, M.I., 1998. Ontogeny of diet shifts by a microcarnivorous fish,Cheilodactylus spectabilis: relationship between feeding mechanics,microhabitat selection and growth. Marine Biology 132, 9–20.
McCoy, E., Bell, S.S., 1991. Habitat structure: the evolution and diversification of acomplex topic. In: Bell, S.S., McCoy, E.D., Mushinsky, H.R. (Eds.), HabitatStructure: The Physical Arrangement of Objects in Space. Chapman and Hall,New York, pp. 3–27.
McCullagh, P., Nelder, J.A., 1989. Generalized Linear Models, second ed. Chapmanand Hall, New York.
Ojeda-Martinez, C., Bayle-Sempere, J.T., Sánchez-Jerez, P., Forcada, A., Valle, C., 2007.Detecting conservation benefits in spatially protected fish populations withmeta-analysis of long-term monitoring data. Marine Biology 151,1153–1161.
Pauly, D., Christensen, V., Guénette, S., Pitcher, T.J., Sumaila, U.R., Walters, C.J.,Watson, R., Zeller, D., 2002. Towards sustainability in world fisheries. Nature418, 689–695.
Pinnegar, J.K., Polunin, N.V.C., Francour, P., Badalamenti, F., Chemello, R., Harmelin-Vivien, M., Hereu, B., Milazzo, M., Zabala, M., D’Anna, G., Pipitone, C., 2000.Trophic cascades in benthic marine ecosystems: lessons for fisheries andprotected area management. Environmental Conservation 27, 179–200.
Rakitin, A., Kramer, D.L., 1996. Effect of a marine reserve on the distribution of coralreef fishes in Barbados. Marine Ecology Progress Series 131, 97–113.
Ramos-Esplá, A.A., 1985. La Reserva Marina de la Isla Plana o Nueva Tabarca(Alicante). Publicación de la Universidad de Alicante-Ayuntamiento de Alicante,Alicante.
Ramos-Esplá, A.A., Valle-Pérez, C., Bayle-Sempere, J.T., Sánchez-Lizaso, J.L., 2004.Áreas Marinas Protegidas como herramientas de Gestión Pesquera en elMediterráneo (Area COPEMED). Serie Informes y Estudios COPEMED No. 11.
Roberts, C.M., 2000. Selecting marine reserve locations: optimality versusopportunism. Bulletin of Marine Science 66 (3), 581–592.
Rowley, R.J., 1994. Marine reserves in fisheries management. Aquatic Conservation:Marine and Freshwater Ecosystems 4, 233–254.
Ruitton, S., Francour, P., Boudouresque, C.F., 2000. Relationships between algae,benthic herbivorous invertebrates and fishes in rocky sublittoral communitiesof a temperate sea (Mediterranean). Estuarine, Coastal and Shelf Science 50,217–230.
Russ, G.R., 2002. Yet another review of marine reserves as reef fishery managementtools. In: Sale, P.F. (Ed.), Coral Reef Fishes, Dynamics and Diversity in a ComplexEcosystem. Academic Press, San Diego, California, pp. 421–443.
Russ, G.R., Alcala, A.C., 1996. Do marine reserves export adult fish biomass?Evidence from Apo Island, central Philippines. Marine Ecology Progress Series132, 1–9.
Russ, G.R., Alcala, A.C., Maypa, A.P., 2003. Spillover from marine reserves: the case ofNaso vlamingii at Apo Island, the Philippines. Marine Ecology Progress Series264, 15–20.
Russ, G.R., Alcala, A.C., Maypa, A.P., Calumpong, H.P., White, A.T., 2004. Marinereserve benefits local fisheries. Ecological Application 14 (2), 597–606.
Sale, P.F., Cowen, R.K., Danilowicz, B.S., Jones, G.P., Kritzer, J.P., Lindeman, K.C.,Planes, S., Polunin, N.V.C., Russ, G.R., Sadovy, Y.J., Steneck, R.S., 2005. Criticalscience gaps impede use of no-take fishery reserves. Trends in Ecology andEvolution 20, 74–80.
Sobel, J.A., Dahlgren, C.P., 2004. Marine reserves. A Guide to Science, Design and Use.Island Press, Washington, DC.
Sumaila, U.R., Guénette, S., Alder, J., Chuenpagdee, R., 2000. Addressing ecosystemeffects of fishing using marine protected areas. ICES Journal of Marine Science57, 752–760.
Underwood, A.J., 1997. Experiments in Ecology: Their Logical Design andInterpretation Using Analysis of Variance. Cambridge University Press,Cambridge.
Valle, C., Bayle, J.T., Ramos, A.A., 2003. Weight-length relationships for selected fishspecies of the western Mediterranean Sea. Journal Application Ichthyology 19,261–262.
Watson, M., Ormond, R.F.G., 1994. Effect of an artisanal fishery on the fish andurchin populations of a Kenyan coral reef. Marine Ecology Progress Series 109,115–129.
Willis, T.J., 2001. Visual census methods underestimate density and diversity ofcryptic reef fishes. Journal of Fish Biology 59, 1408–1411.
Willis, T.J., Millar, R.B., Babcock, R.C., Tolimiery, N., 2003. Burdens of evidence andthe benefits of marine reserves: putting Descartes before des horse?Environmental Conservation 30 (2), 97–103.
Worm, B., Barbier, E.B., Beaumont, N., Duffi, E., Folke, C., Halpern, B.S., Jackson, J.B.C.,Lotze, H.K., Micheli, F., Palumbi, S.R., Sala, E., Selkoe, K.A., Stachowicz, J.J.,Watson, R., 2006. Impacts of biodiversity loss on ocean ecosystem services.Science 314, 787–790.