market insight - ccr-zkr.org · industrial activity and inland navigation (p.8) economic situation...
TRANSCRIPT
MARKET INSIGHTINLAND NAVIGATION IN EUROPE
PUBLISHED IN
WINTER 2017/2018

Market InsightINLAND NAVIGATION IN EUROPE
Published in
Winter 2017/2018
Please find all our data at: www.inland-navigation-market.org


01
02
03
04
ECONOMIC CONTEXT (P.5)
Economic context in Europe (p.6)
Industrial activity and inland navigation (p.8)
Economic situation of inland navigation-related sectors (p.10)
FREIGHT TRAFFIC ON INLAND WATERWAYS & IN PORTS (P.15)
Transport performance in Europe (p.16)
Transport performance in main European IWT countries (p.20)
Dry bulk, liquid bulk and container transport (p.22)
Waterside transport in European ports (p.24)
Container transport in European ports (p.26)
OPERATING CONDITIONS (P.31)
Turnover development in Europe (p.32)
Freight rates (p.34)
OUTLOOK (P.39)
Focus on coal transport (p.40)
Forecast model and results (p.42)
World trade outlook and transport trends (p.44)
TABLE OF CONTENTS

4CCNR MARKET INSIGHT - WINTER 2017/2018 ECONOMIC CONTEXT

5CCNR MARKET INSIGHT - WINTER 2017/2018
ECONOMIC CONTEXT
ECONOMIC CONTEXT
01

6CCNR MARKET INSIGHT - WINTER 2017/2018 ECONOMIC CONTEXT
ECONOMIC CONTEXT IN EUROPEQUARTERLY REAL GDP GROWTH RATE AND OUTLOOK FOR THE EUROZONE (%)
Source: OECD – Economic outlook January 2017 and June 2017
• The pace of economic growth in Europe surpassed expectations at the beginning of this year, propelled by resilient private consumption, a synchronized global upswing, and low interest rates.
• In Germany, the largest European economy, year-on-year growth in 2017 is expected to be 2.3 %, compared to 1.9 % in the Euro area as a whole. For 2018, the projected rate is 1.9 % in Germany and 1.7 % in the Euro area.
• Growth in Germany is currently driven by exports and investments, and by rising private consumption. In the manufacturing sector, new orders and output expectations improved.
1,0
1,5
2,0
2,5
432
2018
- 1432
2017
- 1432
2016
- 1
201
5 - 4
Outlook January 2017 Outlook June 2017
7CCNR MARKET INSIGHT - WINTER 2017/2018
ECONOMIC CONTEXT
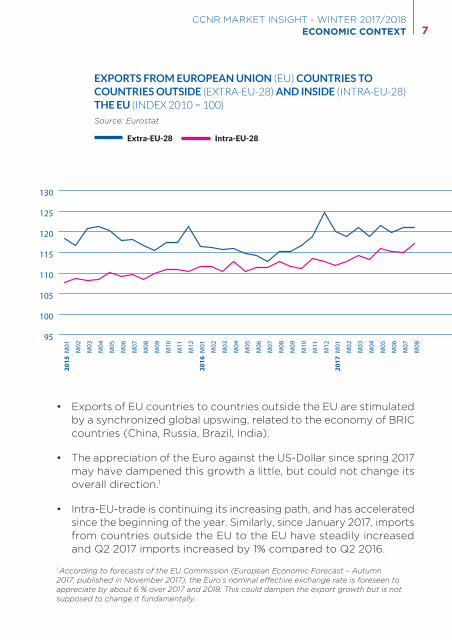
EXPORTS FROM EUROPEAN UNION (EU) COUNTRIES TO COUNTRIES OUTSIDE (EXTRA-EU-28) AND INSIDE (INTRA-EU-28) THE EU (INDEX 2010 = 100)
Source: Eurostat
Extra-EU-28 Intra-EU-28
95
100
105
110
115
120
125
130
M08
M07
M06
M05
M04
M03
M02
2017
M01
M12
M11
M10
M09
M08
M07
M06
M05
M04
M03
M02
2016
M01
M12
M11
M10
M09
M08
M07
M06
M05
M04
M03
M02
2015
M01
• Exports of EU countries to countries outside the EU are stimulated by a synchronized global upswing, related to the economy of BRIC countries (China, Russia, Brazil, India).
• The appreciation of the Euro against the US-Dollar since spring 2017 may have dampened this growth a little, but could not change its overall direction.1
• Intra-EU-trade is continuing its increasing path, and has accelerated since the beginning of the year. Similarly, since January 2017, imports from countries outside the EU to the EU have steadily increased and Q2 2017 imports increased by 1% compared to Q2 2016.
1 According to forecasts of the EU Commission (European Economic Forecast – Autumn 2017, published in November 2017), the Euro’s nominal effective exchange rate is foreseen to appreciate by about 6 % over 2017 and 2018. This could dampen the export growth but is not supposed to change it fundamentally.

8CCNR MARKET INSIGHT - WINTER 2017/2018 ECONOMIC CONTEXT
INDUSTRIAL ACTIVITY AND INLAND NAVIGATION
• In parallel to exports, industrial production growth has accelerated since the beginning of 2017. The year-on-year growth rate was 2 % in Q1 2017, 3 % in Q2 2017 and already 4 % in Q3 2017.
• IWT transport performance in the EU reached 38.5 billion TKM in Q2 2017, compared to 38.0 billion tkm in Q2 2016. The year-on-year growth rate was 1.2 %, and therefore around half as high as growth in industrial production.
• Despite the recovery of IWT traffic in Q2 2017, a gap in growth dynamics compared to the industrial production still remains.
INDEX OF INDUSTRIAL PRODUCTION IN THE EU-28 AND GOODS TRANSPORT IN THE EU
15000
20000
25000
30000
35000
40000
45000
2017
- 1
2016
- 1
2015
- 1
2014
- 1
2013
- 1
2012
- 1
2011
- 1
2010
- 1
2009
- 1
2008
- 1
2007
- 1
2006
- 1
40
60
80
100
120
2 3 4 2 3 4 2 3 4 2 3 4 2 3 4 2 3 4 2 3 4 2 3 4 2 3 4 2 3 4 2 32 3 4

9CCNR MARKET INSIGHT - WINTER 2017/2018
ECONOMIC CONTEXT
Source: Eurostat
INCREASE OF INDUSTRIAL PRODUCTION IN EU BY
3 % IN Q2 2017 VS Q2 2016
Quarterly IWT transport performance in the EU (Million TKM)
Industrial activity (Index 100 in 2010)
15000
20000
25000
30000
35000
40000
45000
2017
- 1
2016
- 1
2015
- 1
2014
- 1
2013
- 1
2012
- 1
2011
- 1
2010
- 1
2009
- 1
2008
- 1
2007
- 1
2006
- 1
40
60
80
100
120
2 3 4 2 3 4 2 3 4 2 3 4 2 3 4 2 3 4 2 3 4 2 3 4 2 3 4 2 3 4 2 32 3 4

10CCNR MARKET INSIGHT - WINTER 2017/2018 ECONOMIC CONTEXT
ECONOMIC SITUATION OF INLAND NAVIGATION-RELATED SECTORS
Mineral oil products segment
REFINERY OUTPUT IN THE EU AND CRUDE OIL PRICE
Source: Eurostat (Refinery output) and Federal Reserve Bank of St. Louis (Oil price)
• Oil prices were decreasing in the 1st half year, but this trend was reverted by a strengthening global oil demand and production disruptions due to hurricanes in the USA.
• Supply will be affected by two main points: 1. The OPEC and Russia decided to extend their production cuts until March 2018. 2. The US shale oil production keeps increasing.
• Counterbalancing these two effects, and taking into account a modestly rising oil demand, forecasts for oil prices in 2018 and 2019 point to a level of 55.7 US-$ in 2018 (average) and a similar level in 2019. 2
Refinery output (Index) Oil price WTI (US-$ /bbl)
20
40
60
80
100
120
20
40
60
80
100
120
M10
M09
M08
M07
M06
M05
M04
M03
M02
2017
M01
M12
M11
M10
M09
M08
M07
M06
M05
M04
M03
M02
2016
M01
M12
M11
M10
M09
M08
M07
M06
M05
M04
M03
M02
2015
M01
M12
M11
M10
M09
M08
M07
M06
M05
M04
M03
M02
2014
M01
M12
M11
M10
M09
M08
M07
M06
M05
M04
M03
M02
2013
M01
2 European Economic Forecast – Autumn 2017, published in November 2017

11CCNR MARKET INSIGHT - WINTER 2017/2018
ECONOMIC CONTEXT
DEVELOPMENT OF FUEL PRICES IN THE IWT SECTOR (€/100 L)Source: CBRB
• Fuel prices in inland shipping continued in an upward movement in Q2 2017, and were on average 30 % higher in Q2 2017 than in Q2 2016. For the 2nd half year and for 2018, a sideways movement is probable, based on oil price forecasts for this period.
Steel industry segment
• The German steel production increased by 1.7 % in the 1st half year of 2017, and by 2.7 % in the first nine months of 2017, compared to the same period in 2016.
• At the Upper Danube, there was an increase in Austria by 8.7 % in the 1st half of 2017 and by 10.1 % in the first nine months of 2017. 3
• In the Middle Danube, the steel production increased strongly both in Hungary and in Serbia, although on a much lower basis than in Austria and Germany. For Hungary there was a plus of 15 % for the 1st half year and of 56 % for the first nine months. The result in Serbia was +47 % in the 1st half year and +34 % in the first nine months.
• In the Lower Danube, steel production in Bulgaria grew by 30 % both in the 1st half year and also during the first nine months of 2017.
3 Source of all figures on steel production: World Steel Association
2
2017
- 1432
2016
- 1432
2015
- 1432
2014
- 1432
2013
- 1432
2012
- 1432
2011
- 1432
2010
- 10
10
20
30
40
50
60
70
80
90

12CCNR MARKET INSIGHT - WINTER 2017/2018 ECONOMIC CONTEXT
Construction sector segment
EVOLUTION OF BUILDING PERMITS FOR RESIDENTIAL HOMES IN THE EU (INDEX 2010=100)
Source: Eurostat
Austria EU - 28
Romania
Germany
FranceNetherlands
32
2017
- 1432
2016
- 1432
2015
- 1432
2014
- 1432
2013
- 1
0
20
40
60
80
100
120
140
160
180
200
• Altogether, the evolution of steel production in 2017 presented a good basis for an uptake of transport demand on European inland waterways. This was also confirmed by transport figures for many countries (see chapter 2)

13CCNR MARKET INSIGHT - WINTER 2017/2018
ECONOMIC CONTEXT
• The transport of sand, gravel and other building materials on inland waterways is promoted by rising and accelerating construction investments in 2017 and 2018. The increase is especially strong in the Netherlands.
• The investment climate in the housing sector is currently very positive, both on the demand side (rising household income, low mortgage rates) and on the supply side (rising price level attracting more investment).
Agricultural products segment
• The grain harvest in France in 2017 is estimated to surpass the 2016 season by 26 %. This will lead to rising transport volumes in the 2nd half of the year.
• According to these updated estimations 4 for France, the harvest of soft wheat is 36 % higher in 2017 than the previous year. For hard wheat an increase of 24 % is foreseen, and for barley an increase of 17 %.
• For Hungary, an important agricultural producing country in the Danube region, estimated harvest results for 2017 are lower than those of the previous year (-16 %). 5
EXPECTED FRENCH GRAIN HARVEST INCREASE IN 2017 VS 2016+26%
4 Source: French ministry for agriculture5 Source: EU 28 - 2017 Production Forecast - EU Cereals Balance sheet 2016/17 and forecast 2017/18
14CCNR MARKET INSIGHT - WINTER 2017/2018 ECONOMIC CONTEXT

15CCNR MARKET INSIGHT - WINTER 2017/2018
ECONOMIC CONTEXT
FREIGHT TRAFFIC ON INLAND WATERWAYS & IN PORTS
02
16CCNR MARKET INSIGHT - WINTER 2017/2018 FREIGHT TRAFFIC ON INLAND WATERWAYS & IN PORTS
Slovakia
Hungary
Belgium
-9%
+11%
+13%
+/-0%
-12%
+22%-45%
-8%
-50%
+33%
+4%
-2%
+5%
+2%
-19%
Germany
Switzeland
Poland
CzechRepublic
AustriaRomania
Serbia
Lithuania
Bulgaria
France
Netherlands
Luxembourg
Croatia
-23%
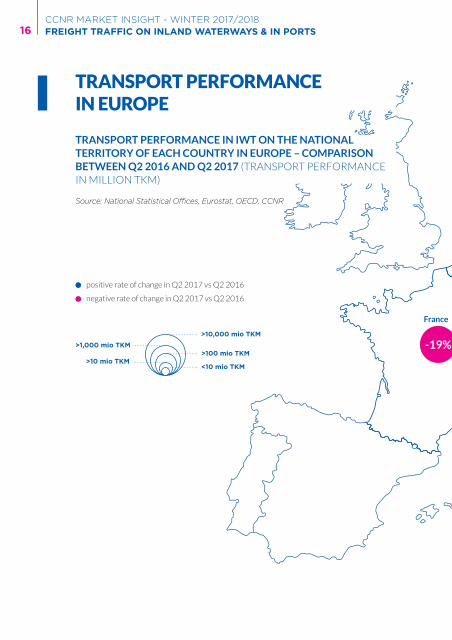
TRANSPORT PERFORMANCE IN EUROPE
TRANSPORT PERFORMANCE IN IWT ON THE NATIONAL TERRITORY OF EACH COUNTRY IN EUROPE – COMPARISON BETWEEN Q2 2016 AND Q2 2017 (TRANSPORT PERFORMANCE IN MILLION TKM)
Source: National Statistical Offices, Eurostat, OECD, CCNR
>10 mio TKM>100 mio TKM
>1,000 mio TKM
>10,000 mio TKM
<10 mio TKM
positive rate of change in Q2 2017 vs Q2 2016
negative rate of change in Q2 2017 vs Q2 2016

17CCNR MARKET INSIGHT - WINTER 2017/2018
FREIGHT TRAFFIC ON INLAND WATERWAYS & IN PORTS
Slovakia
Hungary
Belgium
-9%
+11%
+13%
+/-0%
-12%
+22%-45%
-8%
-50%
+33%
+4%
-2%
+5%
+2%
-19%
Germany
Switzeland
Poland
CzechRepublic
AustriaRomania
Serbia
Lithuania
Bulgaria
France
Netherlands
Luxembourg
Croatia
-23%
18CCNR MARKET INSIGHT - WINTER 2017/2018 FREIGHT TRAFFIC ON INLAND WATERWAYS & IN PORTS
2
2017
- 1432
2016
- 1432
2015
- 1
0
5000
10000
15000
20000
25000
30000
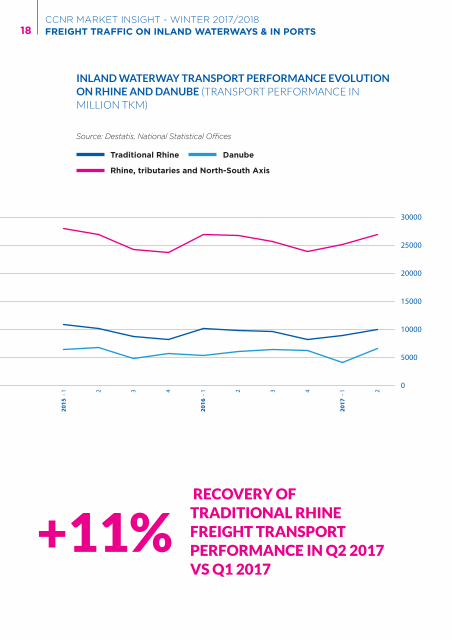
DanubeTraditional Rhine
INLAND WATERWAY TRANSPORT PERFORMANCE EVOLUTION ON RHINE AND DANUBE (TRANSPORT PERFORMANCE IN MILLION TKM)
Source: Destatis, National Statistical Offices
Rhine, tributaries and North-South Axis
RECOVERY OF TRADITIONAL RHINE FREIGHT TRANSPORT PERFORMANCE IN Q2 2017 VS Q1 2017
+11%
19CCNR MARKET INSIGHT - WINTER 2017/2018
FREIGHT TRAFFIC ON INLAND WATERWAYS & IN PORTS
• On the traditional Rhine, transport performance increased by 11 % from Q1 2017 to Q2 2017. This is mainly due to a recovery from the difficult conditions in the 1st quarter 2017 (low water levels on the Rhine). Compared to 2016, transport performance in Q2 2017 increased by 2%. But because of Q1 2017 transport performance decrease, the total result in the 1st half year 2017 was nevertheless 5 % lower than in the 1st half year 2016.
• The tributaries of the traditional Rhine (Main, Mosel, Saar, Neckar) account for 12 % of the transport performance in the Rhine basin in Germany (Main: 5 %, Mosel: 5 %, Saar: 1 %, Neckar: 1 %). In Q2 2017, traffic on the Mosel was 7 % higher than the previous year. On the Saar, the increase was even 37 %, highly supported by steel industry activity and iron ore traffic increase. The Main registered an increase of 45 %, while navigation on the Neckar stagnated.
• The sum of transport performance on the traditional Rhine, the Rhine tributaries and the North-South axis again reached the level of Q2 2016. Growth was somewhat dampened by a weakening of transport evolution in the Netherlands (see transport performance evolution by country on next pages).
• Danube navigation showed a remarkable recovery in Q2 2017, having suffered heavily from low water levels and ice in winter 2017.

20CCNR MARKET INSIGHT - WINTER 2017/2018 FREIGHT TRAFFIC ON INLAND WATERWAYS & IN PORTS
INLAND SHIPPING TRANSPORT PERFORMANCE IN MAIN EUROPEAN IWT COUNTRIES (QUARTERLY DATA – MILLION TKM)
0
2000
4000
6000
8000
10000
12000
14000
16000
2017 - 22017 - 12016 - 42016 - 32016 - 22016 - 12015 - 42015 - 3 2015 - 22015 - 1
TRANSPORT PERFORMANCE IN MAIN EUROPEAN IWT COUNTRIES
Source: Eurostat, National Statistical Offices
Netherlands RomaniaGermany
France Bulgaria
Belgium
Austria Hungary

21CCNR MARKET INSIGHT - WINTER 2017/2018
FREIGHT TRAFFIC ON INLAND WATERWAYS & IN PORTS
• In Germany, the rising water levels on the Rhine as well as an economic upswing (see chapter 1) enabled a recovery of dry mass cargo transports. The level in Q2 2017 was 15.6 % higher than in Q1 2017 and 5 % higher than in Q2 2016. A segment with a particular increase was iron ores.
• In the Netherlands, transport performance increased against Q1 2017, but not against Q2 2016. According to CBS, the reason was a long interruption of traffic due to an accident on the river Maas.
• In Romania, transport performance increased by 53 % from Q1 2017 to Q2 2017. Bulgaria showed growth rates that were a little lower than in Austria and Hungary. This is explained by the fact that ice and low water periods had not been as harsh in the southern Danube region, and so the rebound effect was not as strong.
• In Austria, transport performance in Q2 2017 increased by 73 % compared to Q1 2017, and by 33 % compared to Q2 2016. The increase of 73 % is due to better waterway conditions, while the increase of 33 % results from better economic conditions in 2017 compared to 2016 (in particular an increase in steel production in the Danube area).
• In Hungary, the growth rates are very similar to Austria, and transport evolution seems well synchronized between these two neighbouring countries.

22CCNR MARKET INSIGHT - WINTER 2017/2018 FREIGHT TRAFFIC ON INLAND WATERWAYS & IN PORTS
-6 %
-4 %
-2 %
0 %
2 %
4 %
6 %
8 %
RomaniaBelgiumNetherlandsGermany
RATE OF CHANGE IN INLAND SHIPPING TRANSPORT PERFORMANCE IN FOUR MAJOR IWT COUNTRIES (Q2 2017 VS Q2 2016 - %)
DRY BULK, LIQUID BULK AND CONTAINER TRANSPORT
Source: National Statistical Offices
Liquid CargoDry Cargo Container

23CCNR MARKET INSIGHT - WINTER 2017/2018
FREIGHT TRAFFIC ON INLAND WATERWAYS & IN PORTS
• In Germany, certain mass cargo segments showed an enormous growth rate. Iron ores had an increase of 30 % compared to Q2 2016 and an increase of 25 % compared to Q1 2017. Within the liquid cargo segment, mineral oil products grew by 12 %, while chemicals stagnated. Container transport performance (in TKM) was 2 % lower than in Q2 2016, while the TEU volumes were 2 % higher. This difference could be explained by the low water period at the beginning of the year, which had a more negative (and ongoing) impact on the transport of loaded containers than on the transport of empty containers.
• In the Netherlands, according to information from the National Statistical Office CBS, transport evolution was dampened by an accident on the river Maas. The accident caused the damage of a barrier and an interruption in navigation for a long time.
• In Belgium, container transport continued its upward trend with +6 %. Inland navigation in Belgium is promoted by a strong network of important seaports and inland ports (especially Antwerp, Gent, Liège, Brussels, Namur), and the creation of new regular container lines between them. Traffic growth during the second quarter is also partly explained by the accident that occurred in the Netherlands.
• In Romania, dry cargo segments related to agriculture and the steel industry account for 81 % of total transport performance – iron ores (36 %), agricultural products (33 %), coal (7 %), metals (4 %). Liquid goods traffic has a very small share of only 4 %, and container transport only 0.02 %.
• Iron ore transport in Romania increased by 17 % compared to Q2 2016 and by 80 % compared to Q1 2017. Agricultural products showed an increase of 14 % compared to Q2 2016 and an increase of 45 % compared to Q1 2017. The reason for an overall growth rate of only 6 % is due to the fact that there was a negative evolution for both coal and metals.

24CCNR MARKET INSIGHT - WINTER 2017/2018 FREIGHT TRAFFIC ON INLAND WATERWAYS & IN PORTS
WATERSIDE TRANSPORT IN EUROPEAN PORTS
TRANSSHIPMENT VOLUME IN (Q1+Q2) 2017,TRANSSHIPMENT VOLUME IN (Q1+Q2) 2016AND RATE OF CHANGE BETWEEN BOTH
Source: Destatis, ports mentioned
Vienna
BudapestLinzMulhouse
Strasbourg
Basel
Karlsruhe Regensburg
Ludwigshafen
Neuss
MannheimCologneBrussels
DuisburgHamburg
Paris
Antwerp
+4.0%
Rotterdam
+3.0%
Constanza
+4.0%
+0.0%
-5.0%
-6.5%
-0.1%
+15.8%
-1.2%
+2.5%
+7.8%
+6.3%
-12.4% -13.0%
Krefeld +5.8%
+26.0%+16.0%
+7.0%
Baja +76.0%
Drobeta Turnu-Severin+27.0%
Tulcea -22.0%-17.4%
-29.7%
Galati-10.0%
-4.9%
<1 mio t >1 mio t
>5 mio t >10 mio t
>50 mio t >100 mio t
>3 mio t
positive rate of change in traffic between (Q1+Q2) 2016 and (Q1+Q2) 2017
negative rate of change in traffic between (Q1+Q2) 2016 and (Q1+Q2) 2017

25CCNR MARKET INSIGHT - WINTER 2017/2018
FREIGHT TRAFFIC ON INLAND WATERWAYS & IN PORTS
• In Rotterdam, dry bulk traffic increased by 5 %, which is about the same rate as that observed for dry bulk in Germany. The port is an essential provider of commodities for the German steel industry.
• In Antwerp, dry bulk traffic increased by 1 %, but the growth was especially strong for iron ores (+27 %). A parallel with the evolution in the German hinterland in Q2 2017 is obvious.
• In Hamburg, overall maritime traffic remained constant. Dry bulk traffic was 1 % higher than the previous year, and a special driver here was also iron ore (+4 %).
• The 10 largest Rhine ports registered a waterside traffic of 57 million tonnes in the 1st half-year 2017, compared to 60 million tonnes in the same period of 2016. This meant a decrease of 5 %, which is the same rate of change as observed for the transport performance on the whole traditional Rhine.
• In the Port of Paris, sands, stones and building materials (which represent 3/4 of waterside traffic) had an increase of 8 %. The overall result was nevertheless stagnation, as the traffic of agricultural products and foodstuffs was still very negatively affected by the bad harvest results in 2016. It is expected that this negative effect will run out in the 2nd half of 2017.
• In the port of Constanza, 60 % of maritime traffic concern dry bulk, which had an increase of 3.4 % in Q2 2017. Another 15 % of the maritime traffic is liquid bulk, 16 % are containers and the rest are other cargo types. Within dry bulk, agricultural products have the highest share.
• Almost all of the upper and middle Danube ports (Regensburg, Linz, Vienna, Budapest, Baja) presented here showed a strong increase in their half-year traffic compared to the previous year. The only exception is Linz, an important centre of the steel industry.
• In Q2 2017, traffic in Linz (which contains above all iron ore, metals and coal) increased by 18 % compared to Q2 2016. The reason why the rate of change for (Q1+Q2) 2017 is nevertheless negative can be seen in the enormous reduction in Q1 2017 (-38 %), which could not be fully compensated in Q2 2017.
26CCNR MARKET INSIGHT - WINTER 2017/2018 FREIGHT TRAFFIC ON INLAND WATERWAYS & IN PORTS
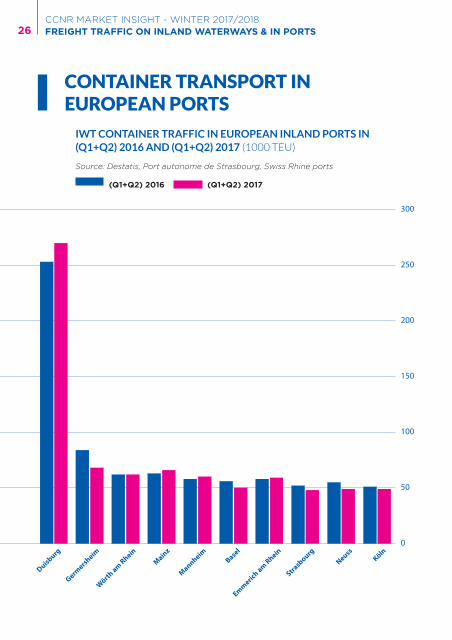
CONTAINER TRANSPORT IN EUROPEAN PORTS
IWT CONTAINER TRAFFIC IN EUROPEAN INLAND PORTS IN (Q1+Q2) 2016 AND (Q1+Q2) 2017 (1000 TEU)
KölnNeuss
Strasbourg
Emmerich am Rhein
Basel
MannheimMainz
Wörth am Rhein
Germersheim
Duisburg0
50
100
150
200
250
300
Source: Destatis, Port autonome de Strasbourg, Swiss Rhine ports
(Q1+Q2) 2016 (Q1+Q2) 2017

27CCNR MARKET INSIGHT - WINTER 2017/2018
FREIGHT TRAFFIC ON INLAND WATERWAYS & IN PORTS
MARITIME CONTAINER TRAFFIC IN EUROPEAN SEAPORTS IN (Q1+Q2) 2016 AND (Q1+Q2) 2017 (IN MIO TEU)
Source: Port of Rotterdam, Port of Antwerp, Port of Hamburg
(Q1+Q2) 2016 (Q1+Q2) 2017
0
1
2
3
4
5
6
7
HamburgAntwerpRotterdam
• The port of Rotterdam registered a 9 % increase in total maritime container traffic in the first half-year 2017, thereby increasing its market share for container traffic within the Hamburg-Le Havre range from 29 % to 31 %.
• The reasons for this strong growth are related to the high productivity of the new infrastructure (Maasvlakte 2 terminals), which attracts more maritime containers. Within total maritime container traffic, 1/3 is feeder traffic (intra-European maritime container traffic between Rotterdam and smaller European seaports).This type of transport even reached a growth rate of 22.6 %, boosted by a strong business cycle in Europe.

28CCNR MARKET INSIGHT - WINTER 2017/2018 FREIGHT TRAFFIC ON INLAND WATERWAYS & IN PORTS
• Container handling of inland vessels suffers since quite a long time under congestion problems in seaports, and this was especially the case in the 1st half of the year. The reasons were changes in the schedules of maritime shipping companies, leading to a high concentration of maritime transshipment activities and therefore an insufficient capacity for handling inland container barges. 6 Possible solutions for these congestion problems are subject of investigation.
• The waterside container traffic in the largest European inland port, Duisburg, continued its upward trend in the 1st half-year 2017, despite somewhat difficult conditions (see efficiency issues in seaports mentioned above). Waterside traffic grew by 6.5 %.
• For the 10 largest Rhine ports in container traffic, the sum of waterside container traffic amounted to 796 thousand TEU, which was 13 % below the 1st half-year 2016 result. The main reason being the cargo loss of Q1 2017 due to low water levels.
• In the ports of Paris, container traffic by IWT reached 77 446 TEU, a plus of 6.3 %. Container traffic by rail lost 0.6 % while container traffic by road increased by 4.6 %. Overall, the fastest growing segment in Paris was again the urban logistics segment.
6 Source: Information based on the press note of the European Barge Union (EBU) from July, 10th 2017 [Aanhoudende Congestie bij Containerterminals en daarmee samenhangende Kosten voor de Binnenvaart]
WATERSIDE CONTAINER TRAFFIC INCREASE IN 1ST SEMESTER 2017 VS 1ST SEMESTER 2016 IN DUISBURG
+6.5%

29CCNR MARKET INSIGHT - WINTER 2017/2018
FREIGHT TRAFFIC ON INLAND WATERWAYS & IN PORTS
30CCNR MARKET INSIGHT - WINTER 2017/2018 ECONOMIC CONTEXT

31CCNR MARKET INSIGHT - WINTER 2017/2018
ECONOMIC CONTEXT
OPERATING CONDITIONS
03

32CCNR MARKET INSIGHT - WINTER 2017/2018 OPERATING CONDITIONS
TURNOVER DEVELOPMENT IN EUROPE
TURNOVER DEVELOPMENT IN THE NETHERLANDS (2010=100) RHINE COUNTRY WITH MAINLY GOODS TRANSPORT ACTIVITYSource: CBS
40
60
80
100
120
140
160
2017 - 22017 - 12016 - 42016 - 32016 - 22016 - 12015 - 42015 - 32015 - 22015 - 1
TURNOVER DEVELOPMENT IN HUNGARY (2010=100) DANUBE COUNTRY WITH MAINLY GOODS TRANSPORT ACTIVITYSource: Eurostat
40
60
80
100
120
140
160
2017 - 22017 - 12016 - 42016 - 32016 - 22016 - 12015 - 42015 - 32015 - 22015 - 1
Note: Quarterly data about turnover in IWT are at present only available for very few countries, due to statistical limitations. EUROSTAT presents data for the NACE sector H50 (Water transport) which covers maritime and IWT transport together. Based on this dataset, it is possible to identify turnover in IWT only for countries with practically no activity in maritime shipping (Austria, Hungary). For the Netherlands, turnover data on a quarterly basis are provided by the national statistical office (CBS). Note 2: Turnover in a country stands for turnover of companies registered in this country.

33CCNR MARKET INSIGHT - WINTER 2017/2018
OPERATING CONDITIONS
TURNOVER DEVELOPMENT IN AUSTRIA (2010=100) DANUBE COUNTRY WITH MAINLY PASSENGER TRANSPORT ACTIVITY
40
60
80
100
120
140
160
2017 - 22017 - 12016 - 42016 - 32016 - 22016 - 12015 - 42015 - 32015 - 22015 - 1
Source: Statistik Austria
• Inland shipping Dutch companies’ turnover was 5 % higher in Q2 2017 than in Q2 2016. This increase was not as strong as the increase in transport prices (see page on freight rates), as the relatively weak evolution of transport performance in Q2 2017 dampened turnover evolution. The turnover evolution for other modes of transport in the Netherlands in Q2 2017 was: Maritime shipping (+3.3 %), Road transport (+6 %), Rail transport (+0.9 %), total transport sector (+ 4.7 %).
• Hungary is a middle Danube country where goods transport has a high share in IWT turnover (almost 3/4). If we compare the evolution of transport demand with the evolution of turnover, we see a very strong correlation for Hungary. Therefore, the rebound of turnover in Q2 2017 (+30 % compared to Q2 2016) is a parallel to the strong increase of transport demand in this quarter (+13 %), although stronger in magnitude.
• Austria is an upper Danube country where goods transport has a quite low share in turnover (around 1/3). This explains the strong seasonal variations, a pattern typical for passenger shipping. Turnover in Q2 2017 was 5.4 % higher than one year before and 2.7 % higher than in Q2 2015. One explanation is found in the increasing transport demand. Another important role is played by the upward trend in passenger shipping, both in terms of the number of companies and in terms of their share in turnover.

34CCNR MARKET INSIGHT - WINTER 2017/2018 OPERATING CONDITIONS
DEVELOPMENT OF FREIGHT RATES* IN THE NETHERLANDS (2015 AVERAGE=100)
Source: CBS - Centraal Bureau voor de Statistiek
*Note: Average freight rate evolution for transports of dry cargo, liquid cargo and containers in the Netherlands
0
20
40
60
80
100
120
2017 - 22017 - 12016 - 42016 - 32016 - 22016 - 1
• The average transport prices in goods transport in the Netherlands in Q2 2017 were 28 % higher than in Q2 2016.
• The differences can be explained by the evolution of the water levels during this period. Q2 2016 had seen water levels above average, while Q1 2017 had exceptionally low levels, and in Q2 2017, water levels were around average.
FREIGHT RATES

35CCNR MARKET INSIGHT - WINTER 2017/2018
OPERATING CONDITIONS
DEVELOPMENT OF FREIGHT RATES* IN THE DANUBE REGION (JANUARY 2015=100)
Source: Danube Commission *Note: Freight rates based on transports of grain and chemical products from Middle Danube ports
0
20
40
60
80
100
120
140
160
2017 - 22017 - 12016 - 42016 - 32016 - 22016 - 1
• On the Danube, freight rates in Q2 2017 were 19 % higher than in Q2 2016. The positive transport demand evolution in Danube countries was one main reason for this.
• Freight rates in tanker shipping on the Rhine were, in Q2 2017, on average 1.3 % lower than in Q1 2017, but 66 % higher than in Q2 2016; the reason was the low water period in January 2017, which had greatly reduced loading degrees of vessels (see figure), and which had not occurred in the previous year.

36CCNR MARKET INSIGHT - WINTER 2017/2018 OPERATING CONDITIONS
Source: CCNR and PJK International. * Freight rates in tanker shipping on the Rhine
Freight Rate Index (2010 = 100)
Loading Degree (3.0 Metres)Loading Degree (2.5 Metres)
MAXIMUM LOADING DEGREES AT KAUB/MIDDLE RHINE FOR VESSELS WITH A DRAUGHT OF 2.5 AND 3 METRES, COMPARED WITH FREIGHT RATES INDEX*
M09
M07
M05
M03
2017
M01
M11
M09
M07
M05
M03
2016
M01
M11
M09
M07
M05
M03
2015
M01
M11
M09
M07
M05
M03
2014
M01
M11
M09
M07
M05
M03
2013
M01
M11
M09
M07
M05
M03
2012
M01
M11
M09
M07
M05
M03
2011
M01
0
60
120
180
240
300
360
420
480
540
600
0
10
20
30
40
50
60
70
80
90
100
MAXIMUM LOADING DEGREE AT KAUB FOR 2.5 METRE DRAUGHT VESSELS IN JANUARY 2017 - LOWEST MAXIMUM LOADING DEGREE SINCE NOVEMBER 2011
59%

37CCNR MARKET INSIGHT - WINTER 2017/2018
OPERATING CONDITIONS

38CCNR MARKET INSIGHT - WINTER 2017/2018 ECONOMIC CONTEXT

39CCNR MARKET INSIGHT - WINTER 2017/2018
ECONOMIC CONTEXT
OUTLOOK
04

40CCNR MARKET INSIGHT - WINTER 2017/2018 OUTLOOK
• In this segment, inland shipping is used for delivering steam coal to power plants, and coaking coal to steel plants. 82 % of all coal transport performance in the EU takes place in Germany. Rotterdam is the main port and the Rhine is the main artery for providing the steel industry and the energy sector with coal in Germany. A smaller part of German coal imports crosses the German border via German seaports, in particular Hamburg.
• In 2016, 29 million tonnes of coal crossed the German border on inland vessels, mainly on the Rhine. This import traffic represented 81 % of total coal transport by IWT in Germany (36 million tonnes).
• Due to the heavy traffic of coal on the Rhine, Rotterdam and Amsterdam are the two main coal ports in the Hamburg-Le Havre range, with a total coal transshipment volume of 48.4 million tonnes (= share of 2/3 in the Hamburg-Le Havre range). 7
• Coal transport on inland waterways is statistically closely linked with coal imports, but the underlying drivers are the energy sector and steel production: 2/3 of all coal is used for generating electricity (and on a minor scale heat), and 1/3 for producing iron and steel.
• The following figure reveals that coal transport by IWT and by rail is clearly linked with coal consumption in the energy sector, and to a lesser extent with steel production. The rising share of imported coal is in principle beneficial to IWT and rail transport, as it creates additional long distance transport, but this effect is offset by the energy transition towards renewables.
FOCUS ON COAL TRANSPORT
7 Source: Port of Rotterdam – Brochure Facts & Key Figures

41CCNR MARKET INSIGHT - WINTER 2017/2018
OUTLOOK
Source: CCNR based on Destatis, German Working Group on Energy Balances and
Oxford Economics
Coal consumption energy sector
Coal transport by IWTCoal transport by rail
COAL CONSUMPTION AND COAL TRANSPORT BY INLAND VESSELS AND BY RAIL IN GERMANY (MILLION TONNES)
0
10
20
30
40
50
60
201620152014201320122011201020092008
65
70
75
80
85
90
95
Million tonnes Share %
Coal consumption steel industry
Share of imported coal (%)

42CCNR MARKET INSIGHT - WINTER 2017/2018 OUTLOOK
FORECAST MODEL AND RESULTS
Source: CCNR
ModelCoal transport
VOLUMES OF COAL TRANSPORTED ON THE RHINE AND FORECAST MODEL (IN 1,000 TONNES)
432
2018
- 1432
2017
- 1432
2016
- 1432
2015
- 1432
2014
- 1432
2013
- 1432
2012
- 1
4000
5000
6000
7000
8000
9000
10000
Coal transport

43CCNR MARKET INSIGHT - WINTER 2017/2018
OUTLOOK
• Transport of coal on the Rhine is positively correlated with coal imports and with energy consumption. Electricity generation now plays a larger role than the heating market, as most of the coal in Germany is used by power plants for generating base load power.
• The transport of coal on the Rhine is expected to decrease in 2017 and 2018, due to the ongoing trend of energy transition towards renewables in Germany. Coal’s share in primary energy consumption dropped from 13.3 % in 2014, to 13.0 % in 2015, and to 12.3 % in 2016. 8
• According to data provided by the German Working Group on Energy Balances, coal primary energy consumption continued to decrease also in the 1st half year of 2017, by 6.7 % compared to the 1st half year of 2016.
• The forecast takes into account a 7 % decrease of coal imports in Germany, between the average quarterly coal import level in 2016 and the end of 2018 (Q4 2018).
• According to this forecast model, coal transport on the Rhine is expected to decrease from 31 million tonnes in 2016 to 30.7 million tonnes in 2017 and 30.4 million tonnes in 2018.
8 Source: ARGE Energiebilanzen (German Working Group on Energy Balances)

44CCNR MARKET INSIGHT - WINTER 2017/2018 OUTLOOK
WORLD TRADE OUTLOOK AND TRANSPORT TRENDS
Source: Computations of RWI and ISL based on data from 82 ports; July 2017: flash estimate
Seasonnaly and working day adjustedOriginal
RWI/ISL CONTAINER THROUGHPUT INDEX
M10
M09
M08
M07
M06
M05
M04
M03
M02
2017
M01
M12
M11
M10
M09
M08
M07
M06
M05
M04
M03
M02
2016
M01
M12
M11
M10
M09
M08
M07
M06
M05
M04
M03
M02
2015
M01
M12
M11
M10
M09
M08
M07
M06
M05
M04
M03
M02
2014
M01
60
80
100
120
140
Trend-Cycle-Component
• The RWI/ISL Container throughput index is based on data from 81 world container ports covering 60 % of worldwide container handling. This index is an early indicator for world trade and maritime container shipping.
• The index data for 2017 reveal an acceleration of container throughput in the 2nd half of the year. The index reached an all-time-high value in August 2017.

45CCNR MARKET INSIGHT - WINTER 2017/2018
OUTLOOK
• In the following months, a slight reduction took place, but this should be understood as a cooling or counter-reaction to the unusual growth in the previous months.
• In November 2017, no trend reversal in the evolution of world trade is expected.
CONTAINER THROUGHPUT INDEX INCREASE BETWEEN Q1 2016 AND Q1 2017+5.5% CONTAINER THROUGHPUT INDEX INCREASE BETWEEN Q2 2016 AND Q2 2017+6.8% CONTAINER THROUGHPUT INDEX INCREASE BETWEEN Q3 2016 AND Q3 2017+7.0%

46CCNR MARKET INSIGHT - WINTER 2017/2018 OUTLOOK
Main driversTrends in demand for transport
in 2018 vs 2017
Agricultural products Harvest results Increase
Iron ores Steel production Increase
Metals Steel production Increase
CoalWeather & energy policy,
partly steel productionDecrease
Sand, soil & building materials
Construction activity Increase
Containers World trade Increase
Mineral oil products Oil prices & refinery output Stable
Chemicals Chemical production Stable
TRENDS IN DEMAND FOR TRANSPORT IN 2018 IN RHINE COUNTRIES
Source: CCNR analysis based on macroeconomic and sectorial data
AFTER BAD RESULTS IN 2016, BETTER HARVESTS IN 2017 WILL LEAD TO RISING TRANSPORT VOLUMES FOR AGRICULTURAL PRODUCTS IN 2018 COMPARED TO 2017

47CCNR MARKET INSIGHT - WINTER 2017/2018
OUTLOOK
• For the steel segment, production figures for the 2nd quarter 2017 were very positive, and the further outlook for the steel industry is far more favourable than in 2016, thanks to a synchronised global upswing (see chapter 1).
• The consumption of coal is declining further. In Germany, the use of coal decreased by 6.7 % in the first half year 2017. Coal consumption in the energy sector decreased by 9 %. The underlying trend of the energy transition towards renewables, will certainly continue.
• The upward movement in the building industry is continuing, as new figures confirm, especially for the Netherlands. The transport of sands, stones and building materials will be promoted further by this development.
• The world trade indicator (RWI/ISL index) accelerated in the 2nd half of 2017, in line with industrial production. Although the latest data expressed a slight reduction, the world trade outlook for 2018 is fundamentally positive.
• Oil prices are expected to remain rather stable or increase in a limited way in 2018. Transport demand for mineral oil products is expected to remain stable in 2018, with a positive short-term trend offsetting a negative long-term trend.
• It is expected that chemical production will grow only very modestly in 2018. Therefore, the outlook for chemical transport is also stable, with the possibility of a slight increase.
48 CCNR MARKET INSIGHT - WINTER 2017/2018
GLOSSARY
BN: Billion
DANUBE COUNTRIES: Austria, Bulgaria, Croatia, Hungary, Romania, Serbia, Slovakia
EU: European Union
EUROPE: European inland navigation in this report includes two countries not belonging to European Union, Switzerland and Serbia
FREIGHT RATE: Price at which a cargo is delivered from one point to another
GDP: Gross Domestic Product
IWT: Inland Waterways Transport
LOADING DEGREE: percentage of maximum vessel loading
MIO: Million
OECD: Organisation for Economic Co-operation and Development
PP: Percentage point
20XX- 1/20XX-Q1: First Quarter
RHINE COUNTRIES: Belgium, France, Germany, Luxemburg, Netherlands, Switzerland
RWI/ISL CONTAINER THROUGHPUT INDEX: Index of worldwide container throughput in ports
TKM: Tonne-Kilometer (unit for transport performance which represents volume of goods transported multiplied by transport distance)
TRADITIONAL RHINE: Rhine from Basel to the border between Netherlands and Germany
TURNOVER: Sales volume net of sales taxes
WTI: West Texas Intermediate (grade of crude oil used as benchmark in oil pricing)

49CCNR MARKET INSIGHT - WINTER 2017/2018
Acronym Original Name English Name Country
Statistik Statistik Austria Statistics Austria Austria
Statbel Statistics Belgium Statistics Belgium Belgium
NSIНационален статистически институт National Statistical Institute Bulgaria
DZS Državni Zavodza StatistikuCentral Bureau of Statistics of Croatia
Croatia
MDCR Ministerstvo dopravy České republikyMinistry of Transport of the Czech Republic
Czech Republic
FTA Liikennevirasto Finnish Transport Agency Finland
VNF Voies Navigables de France Navigable Waterways of France France
destatis Statistisches BundesamtFederal Statistical Office of Germany
Germany
KSH/ HCSO
Központi Statisztikai HivatalHungarian Central Statistical Office
Hungary
MITMinistero delle Infrastrutture e dei Trasporti
Ministry of Transport and Infrastructure
Italy
AIPo AgenziaInterregionale per il fiume PoInterregional Agency of the Po River
Italy
OPS Oficialiosios Statistikos PortalasStatistics Lithuania (Official Statistics Portal)
Lithuania
STATECInstitut national de la statistique et des études économiques du Grand-Duché de Luxembourg
National Institute of Statistics and Economic Studies of the Grand Duchy of Luxembourg
Luxemburg
CBS Centraal Bureau voor de Statistiek Central Statistical Office Netherlands
GUS Główny Urząd Statystyczny Central Statistical Office Poland
РЗС Републички завод за статистику Statistical Office of the Republic of Serbia
Republic of Serbia
INSSE Institutul National de Statistica National Institute of Statistics Romania
Slovstat Štatistický úrad Slovenskej republikyStatistical Office of the Slovak Republic
Slovak Republic
Trafa Trafikanalys Transport Analysis Sweden
DfT Department for Transport Department for TransportUnited Kingdom
NATIONAL STATISTICS OFFICES

50 CCNR MARKET INSIGHT - WINTER 2017/2018
Original Name English Name Country
EUROSTAT EUROSTAT EU
European Commission European Commission EU
Ports mentioned in the report Ports mentioned in the report EU
International Monetary Fund (IMF) International Monetary Fund (IMF) World
OECD OECD World
World Steel Association World Steel Association World
AG Energiebilanzen Working Group on Energy Balances Germany
Bundesamt für GüterverkehrGerman Federal Office of Goods Transport
Germany
Centraal Bureau voor de Rijn- en Binnenvaart
Central Bureau for Inland Barging Netherlands
Federal Reserve Bank of St. Louis Federal Reserve Bank of St. Louis USA
Agreste Agreste France
Institut für Seeverkehrswirtschaft und Logistik
Institute of Shipping Economics and Logistics
Germany
PJK International PJK International Netherlands
Rheinisch-Westfälisches Institut für Wirtschaftsforschung
RWI - Leibniz-Institute for Economic Research
Germany
Wirtschaftsvereinigung Stahl German Steel Industry Association Germany
Oilprice.com Oilprice.com United Kingdom
OTHER SOURCES
51CCNR MARKET INSIGHT - WINTER 2017/2018
METHODOLOGY
Freight traffic on inland waterways and in ports
Europe as defined in chapter 2 is taking into account all European countries providing quarterly data on inland waterway transport. All these countries are listed on the Transport Performance in Europe map (page with map in chapter 2).
When discrepancies on total transport performance are observed between Eurostat and National Statistics data, the information is notified to Eurostat and National Statistics Office data is taken into account.
When available, NST product classification is used in order to split transport performance on following transport segments: dry cargo, liquid cargo, containers.
When available, general cargo is included in dry cargo.
Use of the knowledge, information or data contained in this document is at the user’s own risk. The Central Commission for the Navigation of the Rhine and its secretariat and the European Commission shall in no way be liable for use of the knowledge, information or data contained in this document or any ensuing consequences.
The facts presented in the study and opinions expressed are those of the authors and do not necessarily also represent the position of the Central Commission for the Navigation of the Rhine or the European Commission and its agencies on the subject in question.
This notice does not constitute a formal commitment on the part of those organisations referred to in the report.
LIABILITY DISCLAIMER

The Market Insight of European inland navigation is a common project of the CCNR and the European Commission
CONTRIBUTORS
CCNR
Guillaume LEGEAY (Project leader)
Norbert KRIEDEL (Economist)
Lucie FAHRNER (Communication officer)
Angelika ESPENHAHN (Translation coordination)
Victoire NAGY (Intern)
Contact: [email protected]
IN PARTNERSHIP WITH
Danube Commission
Moselle Commission
Sava Commission
EBU
ESO
IVR
DESIGN BY PRESS-AGRUM
Nicolas LAURENT (coordination)
Lucie GANGLOFF (design)
www.press-agrum.com
TRANSLATION
Christophe HENER (French)
Barbara VOLLATH-SOMMER (German)
Pauline de ZINGER (Dutch)
Veronica SCHAUINGER (Proofreading English)
Imprint: February 2018
Published by the Central Commission for the Navigation of the Rhine 2, place de la République 67082 STRASBOURG cedex – www.ccr-zkr.org ISSN : 2519-1101

In partnershipwith the