market potential for organic crops in california: almonds, hay, … · 2016-01-13 · organic...
TRANSCRIPT

Market Potential for Organic Crops in California: Almonds, Hay, and Winegrapes
Sonja Brodt, Karen Klonsky, and L. Ann Thrupp
Giannini Foundation Information Series Report 09-1
June 2009
UNIVERSITY OF CALIFORNIA AGRICULTURE AND NATURAL RESOURCES

THE AUTHORS
Sonja Brodt is a senior researcher at the Agricultural Sustainability Institute and Karen Klonsky is a Cooperative Extension specialist in the Department of Agricultural and Resource Economics at University of California, Davis. L. Ann Thrupp is national director of sustainability for Fetzer Vineyards.
Contact: Karen Klonsky; [email protected]; 530.752.3563
This publication has been anonymously peer-reviewed for technical accuracy by University of California scientists and other qualifi ed professionals.
©2009 by the Regents of the University of California Division of Natural Resources All rights reserved. No part of this publication may be reproduced, stored in a retrieval system, or transmitted, in any form or by any means, electronic, mechanical, photocopying, recording, or otherwise, without the written permission of the publisher and the authors. To simplify information, trade names of products have been used. No endorsement of named or illustrated products is intended, nor is criticism implied of similar products that are not mentioned or illustrated.

Market Potential for Organic Crops in California: Almonds, Hay, and Winegrapes
TABLE OF CONTENTS
Executive Summary....................................................................................1
Introduction ..............................................................................................3
Organic Almonds......................................................................................4
Summary .......................................................................................................4 Introduction....................................................................................................4 Demand for Organic ......................................................................................4 Trends in Organic Acreage and Sales ..............................................................6 Prices and Organic Premiums .........................................................................6 Production Challenges ....................................................................................6 Business Models: Diversity of Options ..............................................................7 Constraints to Further Expansion: Pasteurization Rule Poses Marketing Challenge .............................................................................7
Organic Hay.............................................................................................9
Summary .......................................................................................................9 Introduction....................................................................................................9 Demand for Organic ......................................................................................9 Trends in Organic Acreage and Sales ............................................................10 Prices and Organic Premiums .......................................................................10 Production Challenges ..................................................................................13 Business Models: Alternative Niche Markets ...................................................13 Constraints to Further Expansion: Higher Returns from Competing Land Uses ..................................................................................13
Organic Winegrapes ...............................................................................15
Summary .....................................................................................................15 Introduction..................................................................................................15 Demand for Organic ....................................................................................15 Trends in Organic Sales and Acreage ............................................................17 Prices and Organic Premiums .......................................................................18 Production Challenges: Motivations and Constraints for Growers Moving to Organic .......................................................................................19 Business Models: Importance of Marketing Contracts .....................................19 Constraints to Further Expansion: Wine Labels and the Organic Stigma ...........20 International Certification Requirements.........................................................20 Acknowledgments ........................................................................................21
References ..............................................................................................22
i

Giannini Foundation Information Series Report 09-1
ii

Market Potential for Organic Crops in California: Almonds, Hay, and Winegrapes
TABLES
1. Respondent Characteristics – Almonds...................................................................................... 5
2. Increases in U.S. Organic Food Sales Compared to Total Food Sales .......................................... 5
3. Increases in California Organic Almond Sales Compared to Total California Almond Sales .................................................................................................. 6
4. Increases in California Organic Almond Acreage Compared to Total California Almond Acreage ............................................................................................. 7
5. Respondent Characteristics – Hay........................................................................................... 10
6. Trends in Organic Alfalfa Acreage in States Exporting Hay to California ................................... 11
7. Increases in California Organic Alfalfa Acreage Compared to Total California Alfalfa Acreage ............................................................................................. 11
8. Increases in California Farm-Level Organic Alfalfa Sales Values Compared to Total California Alfalfa Sales Values ........................................................................................ 11
9. Average Annual Organic and Conventional Hay Prices for Premium and Good Quality Alfalfa Hay for Cattle: FOB.................................................................................................... 12
10. Average Annual Organic and Conventional Hay Prices for Premium and Good Quality Alfalfa Hay for Cattle: Delivered............................................................................................. 12
11. Respondent Characteristics – Winegrapes............................................................................... 16
12. Increases in California Organic Winegrape Sales Compared to Total California Winegrape Sales ........................................................................................... 17
13. Increases in California Organic Winegrape Acreage Compared to Total California Winegrape Acreage ....................................................................................... 18
iii

Giannini Foundation Information Series Report 09-1
iv

Market Potential for Organic Crops in California: Almonds, Hay, and Winegrapes
EXECUTIVE SUMMARY
The goal of this study was to understand the market potential for three very diverse organic crops produced in California—almonds, hay,
and winegrapes. We drew data from interviews with eight to ten producers or processors of each crop and from statistics published by the California Department of Food and Agriculture (CDFA) and the U.S. Department of Agriculture (USDA).
Consistent with the continued growth in the retail organic food sector, the markets for organic almonds, hay, and winegrapes have been expanding rapidly in the last seven to ten years. Organic acreage of all three crops has doubled or more than tripled in that period. Some of this increase was spurred by organic price premiums, especially in almonds and alfalfa hay, for which premiums can vary from 5% to 300%, depending on factors such as quality and year-to-year changes in yields. Organic almonds particularly can suffer substantial yield losses during wet years when disease control is difficult under organic management. In alfalfa, yield reductions are not a major problem, but some growers find that quality can be somewhat harder to control due to weed and occasional pest pressures and prices are highly dependent on quality. The opposite holds true for winegrapes—organic management is often equated with a high quality of grapes. For this reason, many wineries are actively seeking to transition more growers to organic. Organic price premiums, however, are not as common in winegrapes as in other crops. Due to strict USDA regulations prohibiting added sulfites in wine labeled as organic, most of the wineries in the state that use organic grapes make wine that is labeled as “made with organic grapes” as opposed to “organic wine.” As a result, their products, unlike most organic foods and beverages, do not necessarily receive price premiums in the marketplace. Therefore, they are less likely to offer premiums to growers.
Business models vary among the three crops. Almond growers have the greatest diversity of models, ranging from only producing almonds to also performing simple on-site shelling and packaging to more complex processing. They also have numerous choices
of wholesalers, cooperatives, and direct marketing for sale of their products. The recently enacted food safety rule requiring pasteurization of almonds, however, may negatively impact small- and medium-scale producers and handlers who may need to invest in expensive new equipment (or contract out) and who may lose some direct-market customers who prefer “natural” almonds. Because imported almonds do not need to be pasteurized, some of these customers may be turning to organic almonds from Spain, Uzbekistan, Iran, and other countries. The hay industry has a less diverse range of business models with most producers selling direct to dairies or brokers. Some grass hays may receive relatively higher prices in the small livestock market, including horse owners, than in the dairy market, but access to these markets may be limited by growers’ lack of storage and delivery capacity. In winegrapes, most producers who do not have their own wineries enter into contracts with outside wineries. Despite the overall high demand for organic grapes, securing a contract in advance of harvest or even planting can be important given that demand and prices are highly variable depending on the specific variety and appellation of the grapes.
Potential for expansion of acreage varies among the three crops. Depending on consumer reactions to the pasteurization requirement, the organic food market overall appears to offer significant room for expansion of organic almond production. However, a few large-scale conventional producers appear poised to enter the organic market with relatively large acreages, a move that could potentially fl ood the market in the next few years. Further expansion of organic hay acreage in California is limited by competition for land from other higher value crops that can be grown in most hay-growing areas. In fact, many organic producers are using alfalfa as a rotation crop on existing acreage used for vegetables or other higher value crops and have no plans to expand. In winegrapes, the growing interest in organic grapes among wineries appears to provide significant incentive for expansion, but the lack of price premiums may dampen that incentive to some extent.
1

Giannini Foundation Information Series Report 09-1
2

Market Potential for Organic Crops in California: Almonds, Hay, and Winegrapes
INTRODUCTION
Retail sales of organic foods in the United States reached $20 billion in 2007 (Organic Trade Association (OTA) 2007) with an annual
growth rate hovering consistently around 20%. This rapid and dependable growth rate contrasts with the stagnant condition of the rest of the retail food sector, fostering the entrance of new firms and the diversifi cation of established conventional firms into organic foods. Fresh produce, nuts, and livestock products account for 58% of organic retail sales; dairy alone accounts for 16%. At the farm level, California represents a full 60% of U.S. organic produce acreage and accounts for 20% of organic dairy cows (U.S. Department of Agriculture (USDA), Economic Research Service (ERS)). Taking into account the importance of produce and livestock products at the retail level, their high value, and California’s dominance in producing these commodities, it is not surprising that California accounts for 38% of U.S. organic farmgate sales from about 150,000 acres or 12% of total U.S. organic cropland (USDA, National Agricultural Statistics Service (NASS) 2008). Farms reporting organic sales now represent 4% of all farms in California (USDA, NASS 2008), reflecting the importance of organic agriculture to California. The sustained and growing interest in organic agriculture in California is further demonstrated by 1,400 farms reporting more than
60,000 acres in some stage of the required three-year organic transition period (USDA, NASS 2008).
The purpose of this study was to explore the market potential for organic crops produced in California and to provide information for farmers considering organic production. Rather than attempting to estimate general trends, we researched individual commodities in depth to uncover the range of specifi c opportunities and challenges facing entering organic farmers. We selected three commodities for analysis, almonds, hay (primarily sold as feed to dairies), and winegrapes, because they are all grown by entering organic farmers, they collectively represent the diversity of California’s organic agriculture, and they typify important growth areas within the organic sector. We obtained information through interviews with selected individuals in each industry and from published statistics. To garner perspectives from different points within the industry, we selected interview respondents across the range of business types present in each industry, from growers of very small numbers of acres to large growers and among small- and large-scale processors, brokers, and wineries. We also especially sought out individuals with long-term experience in the organic industry to ensure a depth of perspective on trends over time.
3

Giannini Foundation Information Series Report 09-1
ORGANIC ALMONDS
Summary
Interview responses revealed a general sense in the industry that the increase in supply of domestic organic almonds lags behind increasing demand
even though organic almond acreage in California doubled in a seven-year time span. The result is high price premiums, sometimes as high as two times the conventional price or more. Despite these premiums, however, growers may be reluctant to enter into organic almond production due to the highly variable year-to-year returns. The risk is primarily due to the greater variation in yields for organic almonds compared to conventional almonds. Production challenges include difficulty controlling disease during wet years and difficulty establishing new orchards without the benefit of soil fumigation. Some growers cope with these challenges by taking orchards out of organic for a few years to treat them or establishing new orchards conventionally and then transitioning them later when they are near bearing age, causing further fl uctuations in the supply of organic almonds. Respondents also noted that organic price premiums are extremely volatile, sometimes changing from one year to the next by as much as 50% or more. A variety of business models, ranging from only growing almonds to simple shelling or more complicated in-house processing to direct or wholesale marketing, allows producers to create a business plan to suit their operations’ size and income needs. A recently implemented food safety rule that requires all California almonds destined for the North American market to be pasteurized could have wide-reaching effects on the organic almond industry. Impacts are likely to be greatest on small- and medium-scale handlers who focus on selling “natural” almonds and who have a large proportion of direct-sale customers who may prefer to switch to unpasteurized imported almonds.
Introduction
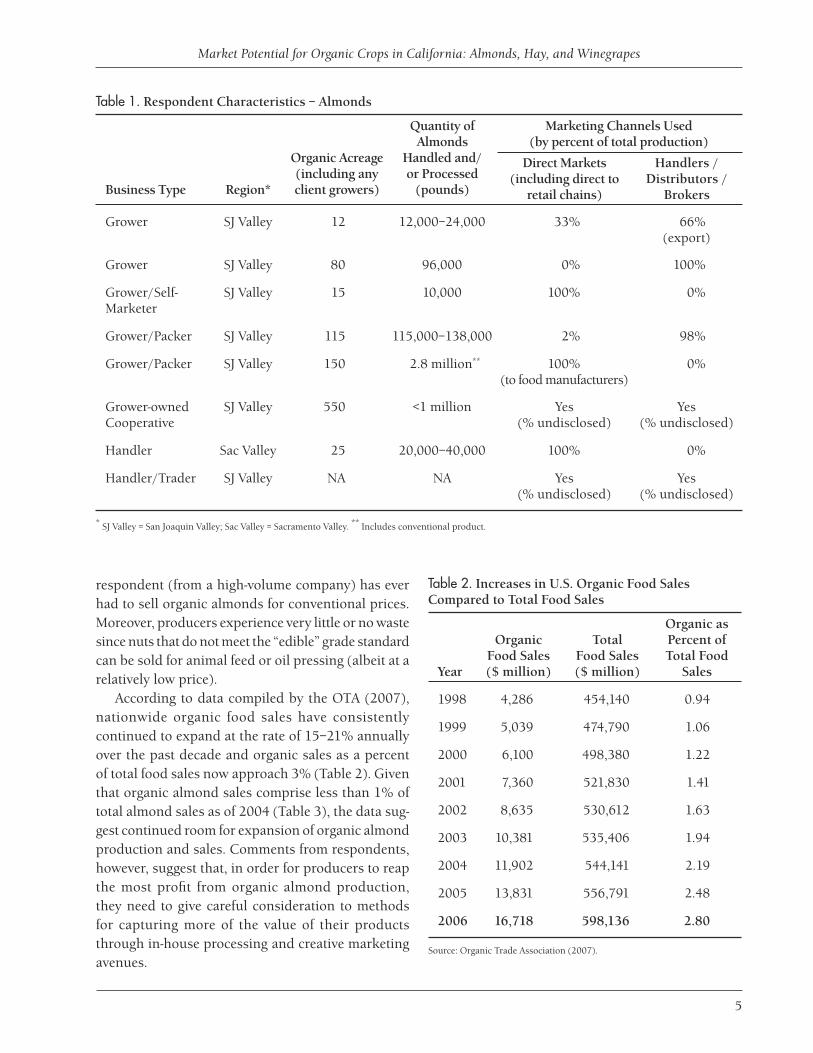
Data for this study were drawn from telephone interviews with eight individuals engaged in the California organic almond industry. The study was conducted during the fall and winter months of 2006/07. This sample was obtained from a database of California almond producers and handlers maintained by the California Almond Board (from a Web site that is updated annually; see Almond Board of California (2006)). Some respondents were drawn at random from the list while a few were recommended by other respondents for their length of experience in the organic industry. Two of the eight individuals are strictly growers; three are handlers as well as growers; the remaining three represent a processor, a company that functions as a trader only (no processing), and a grower-owned cooperative that packs and markets organic almonds. The organic acreage of producers ranged from 12 to 150 acres and the handlers’ businesses ranged in size from 10,000 to 2.8 million pounds sold annually (Table 1).
Demand for Organic
Interview responses revealed a general sense in the industry that supply of domestic organic almonds lags behind increasing demand even though one handler noted that he sometimes has to make purchasing arrangements with producers as much as six months in advance of the harvest to guarantee his supply and get ahead of the competition with other handlers. The grower-owned cooperative easily sells its relatively small output and is actively attempting to recruit more organic growers in order to benefi t from increased economies of scale. The manager estimated that the market could handle at least a 10% increase in organic volume. The relationship of demand to supply is reflected in recent organic price premiums, which have typically raised the price for organic almonds 75–200% over the price for conventional almonds (i.e., from just under double to triple the conventional price). None of the respondents has any diffi culty finding markets for products and only one
4
Market Potential for Organic Crops in California: Almonds, Hay, and Winegrapes
Table 1. Respondent Characteristics – Almonds
Quantity of Marketing Channels Used Almonds (by percent of total production)
Business Type Region*
Organic Acreage (including any client growers)
Handled and/ or Processed
(pounds)
Direct Markets (including direct to
retail chains)
Handlers / Distributors /
Brokers
Grower SJ Valley 12 12,000–24,000 33% 66% (export)
Grower SJ Valley 80 96,000 0% 100%
Grower/Self- SJ Valley 15 10,000 100% 0% Marketer
Grower/Packer SJ Valley 115 115,000–138,000 2% 98%
Grower/Packer SJ Valley 150 2.8 million** 100% 0% (to food manufacturers)
Grower-owned SJ Valley 550 <1 million Yes Yes Cooperative (% undisclosed) (% undisclosed)
Handler Sac Valley 25 20,000–40,000 100% 0%
Handler/Trader SJ Valley NA NA Yes Yes (% undisclosed) (% undisclosed)
* SJ Valley = San Joaquin Valley; Sac Valley = Sacramento Valley. ** Includes conventional product.
respondent (from a high-volume company) has ever had to sell organic almonds for conventional prices. Moreover, producers experience very little or no waste since nuts that do not meet the “edible” grade standard can be sold for animal feed or oil pressing (albeit at a relatively low price).
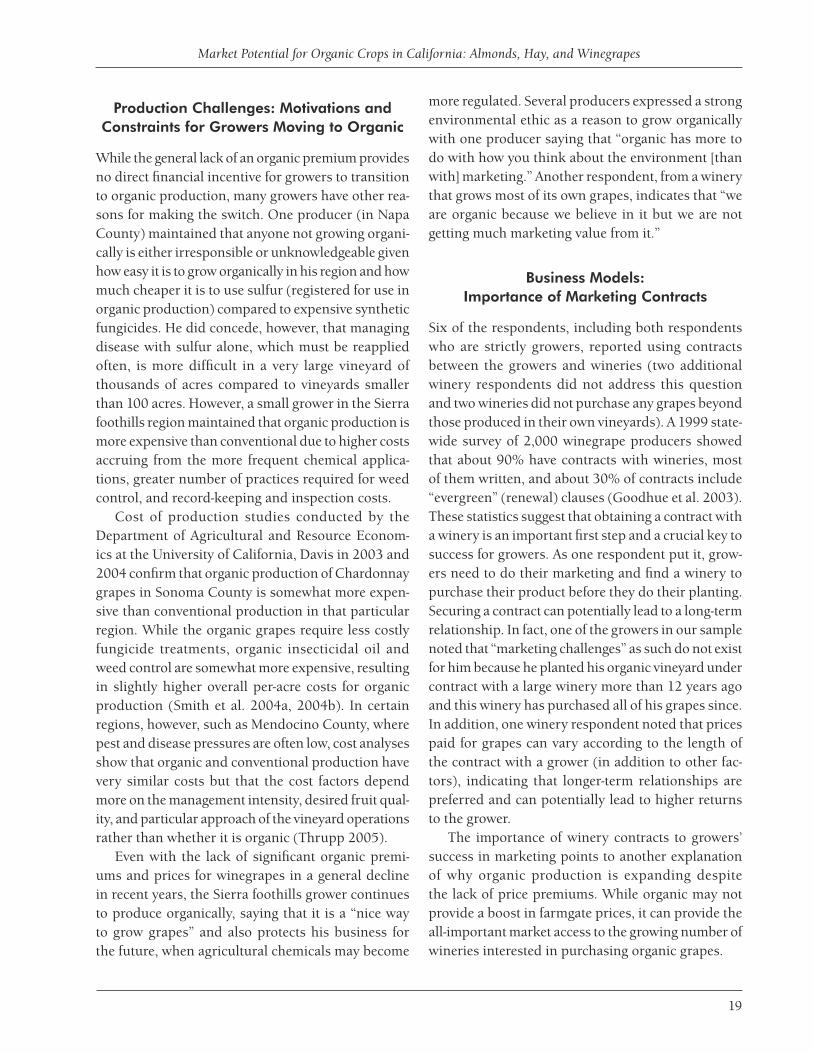
According to data compiled by the OTA (2007), nationwide organic food sales have consistently continued to expand at the rate of 15–21% annually over the past decade and organic sales as a percent of total food sales now approach 3% (Table 2). Given that organic almond sales comprise less than 1% of total almond sales as of 2004 (Table 3), the data suggest continued room for expansion of organic almond production and sales. Comments from respondents, however, suggest that, in order for producers to reap the most profit from organic almond production, they need to give careful consideration to methods for capturing more of the value of their products through in-house processing and creative marketing avenues.
Table 2. Increases in U.S. Organic Food Sales Compared to Total Food Sales
Organic as Organic Total Percent of
Food Sales Food Sales Total Food Year ($ million) ($ million) Sales
1998 4,286 454,140 0.94
1999 5,039 474,790 1.06
2000 6,100 498,380 1.22
2001 7,360 521,830 1.41
2002 8,635 530,612 1.63
2003 10,381 535,406 1.94
2004 11,902 544,141 2.19
2005 13,831 556,791 2.48
2006 16,718 598,136 2.80
Source: Organic Trade Association (2007).
5

Giannini Foundation Information Series Report 09-1
Trends in Organic Acreage and Sales
Data compiled by the California Department of Food and Agriculture (CDFA) (1998–2004, 2007) show that organic almond acreage has been increasing an order of magnitude faster than total almond acreage. From 1998 to 2004, organic acreage more than doubled while total almond acreage increased by only about 12% (Table 4).
Published data from CDFA (1998–2004, 2007) confirm that the value of organic almond sales more than tripled from 1998 to 2004 and total almond sales also nearly tripled (Table 3). This rate of increase exceeds the rate of increase in acreage, suggesting a climb in prices. The data also show a more erratic growth in organic sales as a percentage of total almond sales, contrasting with the more steady growth of organic acreage as a percentage of total almond acreage (Table 4). This erratic growth in sales value supports a concern expressed by several study respondents about yield and price volatility in organic relative to conventional almond production.
Prices and Organic Premiums
Despite the high demand and growth in organic acreage, several of the respondents cautioned against an overly optimistic picture for organic almonds. Four respondents noted that the price premiums are very volatile, sometimes changing from one year to the next by as much as 50% or more. This volatility is thought to be due at least in part to the greater variation in yields experienced with organic almonds compared to conventional almonds. With adverse weather conditions, such as an unusually heavy or prolonged rainy season, disease problems will depress organic almond yields more severely than conventional yields. Conventional yields can be sustained with synthetic fungicides (Holtz et al. 2007; Duncan et al. 2006). For example, one grower with decades of experience in organic production noted that last year’s yield was only around 500 pounds per acre, whereas in other years he had obtained yields exceeding 1,000 pounds per acre. This greater yield variation can lead to a relative shortage of organic almonds and a corresponding upward push on organic prices during those years. However, these prices may not be sustained when the
harvest is good. Several respondents were concerned that the then high price of $4 to $8 per pound, which was due to a recent spate of bad production years, could rapidly decline with just one year of good organic production even with no expansion of existing acreage. Indeed, one respondent reported that, as recently as 2004, prices were less than $3 per pound (Holtz et al. 2007). In addition to this natural source of price volatility, many of the respondents were aware of certain large-scale producers on the verge of entering the organic industry with relatively large amounts of acreage, potentially causing an even more pronounced and rapid increase in supply that could also drive prices downward.
Production Challenges
Organic production challenges coupled with the nature of a long-term tree crop sometimes lead to coping strategies that take acreage in and out of organic status at different times. For example, one respondent noted that some growers take their orchards out of organic during a bad weather year to treat disease problems and then reregister them as organic a few years later. Two respondents also noted that many growers experience great diffi culty establishing a new orchard without the benefi t of soil fumigation. One strategy to avoid this problem is to
Table 3. Increases in California Organic Almond Sales Compared to Total California Almond Sales
Organic Organic as Percent Almond Total of Total
Sales Almond Sales Almond Year ($) ($) Sales
1998 3,064,261 703,590,000 0.44
1999 3,075,036 687,742,000 0.45
2000 4,025,476 666,487,000 0.60
2001 5,300,189 740,012,000 0.72
2002 6,829,895 1,200,687,000 0.57
2003 12,322,997 1,600,144,000 0.77
2004 11,460,238 2,189,005,000 0.52
2005 NA 2,337,140,000 NA
Source: California Department of Food and Agriculture (1998–2004, 2007).
6

Market Potential for Organic Crops in California: Almonds, Hay, and Winegrapes
plant trees conventionally and then transition them to organic once established. Although transitioning back into organic still requires three years every time an orchard is taken out of organic management, these strategies may hold major implications for relatively rapid changes in the supply of organic almonds given that new orchards or re-entering, mature orchards are already close to or at full bearing capacity once they are registered or reregistered as organic. Table 4 shows a continuing trend of relatively large numbers of nonbearing acres through 2004, the most recent year of available data, indicating a large, untapped potential for increases in organic acreage.
Business Models: Diversity of Options
One notable point evident from this small sample of almond producers and handlers is the diversity of business strategies available to organic operations. Both small- and large-scale producers can choose to handle their own almonds, which can entail processing as well as marketing. Processing can involve only shelling and packaging or can also include roasting, dicing, slicing, and grinding for butter. One small-scale producer does not do any of his own processing but retains title to his almonds when contracting with processors and then handles all the marketing himself. Producers and handlers can also choose from an abundance of marketing options, ranging from direct-to-consumer to export brokers. Seven of the eight respondents include some direct marketing in their portfolios, ranging from 2% to 100% of
their product output. Their direct-sale customers range from individual consumers via local markets, telephone, and Internet (in some cases involving overseas customers) to small retail stores and chains to food manufacturers and foreign consumer food cooperatives. Five of the eight respondents sell their products to distributors and brokers and four respondents engage in both direct marketing and indirect sales through distributors and brokers.
Constraints to Further Expansion: Pasteurization Rule Poses
Marketing Challenge
As a result of two incidents of Salmonella contamination in conventional almonds in 2001 and 2004 (Centers for Disease Control 2004), the Almond Board of California (2004) approved a mandatory pasteurization rule that was published in the Federal Register and went into effect on September 1, 2007. Under this rule, all almonds destined for North American markets must undergo treatment to reduce bacterial counts before being sold to consumers. In the case of organic almonds previously sold as “raw” or “natural,” this requirement means they must be steam pasteurized for 12 seconds (almonds destined to be roasted do not require any treatment).
Opinions are mixed as to the impact of this new rule on the organic almond market. According to some industry experts, the pasteurization requirement could spell disaster for direct marketers of “natural” almonds because they believe that many
Table 4. Increases in California Organic Almond Acreage Compared to Total California Almond Acreage
Organic Almonds, All Almonds, All Almonds, Organic Almonds Bearing Acres Bearing Acres Nonbearing Acres All Almonds as Percent of All
Year Only (acres) Only (acres) Only (acres) (acres) Almond Acreage
1998 2,141 460,000 113,000 573,000 0.47
1999 2,453 485,000 105,000 590,000 0.51
2000 2,738 510,000 95,000 605,000 0.54
2001 2,949 530,000 70,000 600,000 0.56
2002 2,912 545,000 60,000 605,000 0.53
2003 3,597 550,000 60,000 610,000 0.65
2004 4,749 570,000 70,000 640,000 0.83
Note: No figures were available for organic nonbearing acreage. Source: California Department of Food and Agriculture (1998–2004, 2007).
7

Giannini Foundation Information Series Report 09-1
consumers who want organic will object to any kind of treatment. Because imported almonds do not need to be pasteurized, these consumers may be turning to organic almonds from Spain, Uzbekistan, Iran, and other countries. In fact, a cursory Web search revealed several import companies specifically advertising nonpasteurized organic almonds from these countries as a way for buyers and consumers to bypass regulation. A cooperative manager in our study reported that many of the company’s direct-sale customers inquired about the effects of pasteurization and approximately 10% or slightly fewer discontinued buying products purely as a result of pasteurization. This loss did not have a large impact on the company since direct marketing to consumers only accounts for approximately 4% of total sales and their other markets were not affected. A large-scale organic processor and handler likewise indicated that his company had not lost any customers (most are large retailers and food companies) but he was aware of some buyers in the industry turning to imported almonds to bypass pasteurization.
In both cases, it appears that good relations with customers are key to easing concerns. The cooperative began its own small-scale trials on the impacts of pasteurization on nut quality well before the rule came into effect so its management had reliable information to share with concerned customers. Both respondents also felt that pasteurization allowed them to deliver
a better product, one that was cleaner and had a potentially longer shelf life, and did not compromise other desired qualities in the nuts such as taste, texture, and chemical composition. In fact, one also reported that large retailers are in favor of pasteurization. Given the profit margin currently available in organic production, the added cost of pasteurization, approximately 6–7¢ per pound, does not appear to impose a large burden on growers or handlers. In some cases, handlers are choosing to substitute pasteurization for the freezing that they did previously to kill insects, incurring very little additional costs for the substitution. Those who might be most adversely affected by this new rule, therefore, tend to be small- and medium-scale growers and handlers who have a large proportion of direct-sale customers and/or who built their own in-house freezing facility and now need to either add an additional infrastructure or outsource the pasteurization process. According to publicity about a lawsuit filed against the USDA by 15 California almond growers and wholesalers in September 2008, the regulation has been “economically devastating to many family-scale and organic almond farmers” (Fantle 2008). Although details about the nature of this economic devastation were not available, in the case of small-scale growers and handlers doing direct marketing, loss of market access (to consumers preferring a completely raw product) may be a more critical factor than higher production costs.
8

Market Potential for Organic Crops in California: Almonds, Hay, and Winegrapes
ORGANIC HAY
Summary
The USDA regulations require organic dairy producers to exclusively provide organically produced feed rations and pasture. Failure to
meet this and a myriad of other restrictions means milk cannot legally be marketed as organic. The rapid increase in organic dairies has outstripped the supply of organic hay in most parts of California despite the more than three-fold increase in organic hay acreage in recent years. Consequently, like conventional dairies, organic dairies continue to rely on hay imported from nearby states despite higher shipping costs. The location advantage creates a relatively easy marketing environment for California organic hay producers, who often get unsolicited phone calls from dairies desperate for organic hay at certain times of the year. Organic premiums typically range from 5% to 50% over conventional prices. However, prices vary substantially according to quality and species of hay with alfalfa commanding the highest prices. While dairies comprise the bulk of the market for hay, especially alfalfa, some grass hays may receive relatively higher prices in livestock markets, including horse owners, than in the dairy market. However, access to these markets may be constrained by growers’ lack of storage, restricted delivery capacity, and the lower volume of individual sales. The biggest factor limiting further expansion of organic hay acreage in California is that other higher value crops compete with hay for land in most hay-growing areas.
Introduction
We obtained data for this study from telephone interviews with nine producers of forage crops, including alfalfa (six growers), perennial grass mixes (two growers), permanent pasture (one grower), and barley, oats, and wheat (one grower). This sample was obtained from the directory of California Certifi ed Organic Farmers (CCOF) (2007) and from recommendations from some of the farmers in the sample. One of the producers also sells hay as a broker for four other
growers. Organic acreage ranged from 2 to 2,700 acres with a median of 120 acres and a mean of 452 acres (Table 5). For most farms, this acreage includes other crops that are rotated with the hay crop, notably oats (three growers), vegetables (two growers), and cotton, barley, wheat, milo, and Sudan grass (one grower each).
Demand for Organic
Organic dairies, legally bound to provide their cows with only organically produced feed, constitute the biggest market for organic hay and the number of organic dairy cows in California more than doubled in the five years from 2000 to 2005, from 6,387 cows to 14,585 (USDA, ERS). While statewide statistics show that organic alfalfa acreage and sales (see next section) increased tremendously during the same period, the balance of supply and demand can vary on a regional scale. For example, one respondent noted that in his particular area in the North Coast region the number of organic dairies increased from only three to about forty in only five years and hay producers are not keeping up. These conditions provide for a relatively competition-free and profitable market for organic hay producers who often get inquiries from more potential customers than they are able to supply. In fact, five of the nine respondents noted that they and other producers they know get phone calls from dairies, sometimes from quite a distance, desperate to find organic hay. This observation is especially notable given that transport of bulky hay bales is costly relative to their purchase value, resulting in a general preference for closer sources when available. Four of these respondents have long-term relationships with buyers, mostly dairies, that get priority over any other potential customers who may call. One respondent also mentioned that a friend of his pre-sells all his hay before it is planted and could probably easily sell three to four times more than he currently has available. The high demand and relatively small number of producers probably account for the high percentage of direct sales in our sample (Table 5) relative to
9

Giannini Foundation Information Series Report 09-1
sales through brokers. In contrast, approximately half of conventional alfalfa hay is estimated to be sold through dealers or brokers (Hoyt 2007).
To meet their needs, some organic dairies, including the dairy respondent in this survey, are encouraging their hay suppliers to transition to organic and are also acquiring more land to produce their own hay. Another respondent described efforts by a cooperative milk processor to identify landowners whose land could potentially be used to grow organic hay. To meet the shortfall, organic hay is also being imported from surrounding states and from other regions in California. For example, a respondent in Humboldt County estimated that about one-third of the hay used by the local organic dairy industry is coming from outside the immediate area, including from eastern Oregon, Modoc and Siskiyou counties, and the Sacramento Valley. A San Joaquin Valley respondent noted that substantial quantities of organic hay in California also come from Colorado and Utah. This fi nding mirrors the conventional alfalfa hay market as well with the most imports in recent years coming from Utah and Nevada (USDA, Agricultural Marketing Service (AMS) 2006). Several states known to export conventional hay to California, especially Oregon and Colorado,
Table 5. Respondent Characteristics – Hay
show increases in organic alfalfa acreage over the last several years (Table 6).
Trends in Organic Acreage and Sales
Statewide statistics show that organic alfalfa acreage has more than tripled from 1998 to 2005 (Table 7) and the value of sales has increased by a factor of eight (Table 8). In the meantime, total alfalfa acreage has held steady while sales values have fl uctuated from year to year with a total increase of about 30% since 1998, suggesting a possible increase in prices over time. As a result, organic alfalfa as a percentage of all alfalfa has grown considerably, although it remains at less than 1% in both acreage and sales.
Prices and Organic Premiums
Respondents gave a large range of prices received, from $265 to $300 per ton from a North Coast alfalfa producer to $70 to $110 per ton from a Central Coast mixed-grass hay producer. Two San Joaquin Valley alfalfa producers reported a price of $150 to $200 per ton. Data from USDA’s AMS (2007) alfalfa hay market summary confirm regional variations in
Organic Acreage (including
Marketing Channels (by percent of total production)
rotation crops Hay and Business Type Region and fallow) Forage Crops Grown Direct Markets Brokers
Grower North Coast 2 Pasture Own use; no sale
Grower North Coast 26 Alfalfa, native grasses 100 0
Grower Central Coast 67 Mixed grasses 100 0 and legumes
Grower San Joaquin Valley 90 Alfalfa 80 20
Grower/Broker Cascade-Sierra 120 Alfalfa, oats 100 0
Grower Central Coast 150 Barley, oats, wheat 70 30
Grower San Joaquin Valley 560 Alfalfa 100 0
Grower San Joaquin Valley 350 Alfalfa 100 0
Grower/Dairy North Coast 2,700 Alfalfa Own use; no sale
10

Market Potential for Organic Crops in California: Almonds, Hay, and Winegrapes
Table 6. Trends in Organic Alfalfa Acreage in States Exporting Hay to California
Year Arizona Nevada Utah Idaho Oregon Colorado Total
2000 802 2,397 265 45,798 1,204 5,360 55,826
2001 1,002 1,335 540 39,659 1,472 4,912 48,920
2002 1,413 1,938 934 38,372 660 5,367 48,684
2003 1,413 3,425 882 35,394 1,842 4,211 47,167
2004 1,370 3,465 959 46,457 3,211 3,856 59,318
2005 487 3,000 925 49,497 6,592 8,943 69,444
Source: U.S. Department of Agriculture Economic Research Service (2007).
Table 7. Increases in California Organic Alfalfa Acreage Compared to Total California Alfalfa Acreage
Organic as Percent Organic Alfalfa All Alfalfa of All Alfalfa
Year (1,000 acres) (1,000 acres) Acreage
1998 1.8 1,050 0.17
1999 1.4 1,050 0.13
2000 1.8 1,020 0.17
2001 2.4 1,010 0.23
2002 4.0 1,160 0.34
2003 5.1 1,090 0.47
2004 6.5 1,050 0.62
2005 6.1 1,000 0.61
Sources: Klonsky and Richter (2005, 2007); California Department of Food and Agriculture (2007).
Table 8. Increases in California Farm-Level Organic Alfalfa Sales Values Compared to Total California Alfalfa Sales Values
Organic Alfalfa Total Alfalfa Organic as Percent of Year Sales ($1,000) Sales ($1,000) Total Alfalfa Sales
1998 324 679,140 0.05
1999 411 652,050 0.06
2000 334 656,880 0.05
2001 751 841,330 0.09
2002 1,294 784,390 0.16
2003 1,550 709,590 0.22
2004 2,846 867,300 0.33
2005 2,764 938,400 0.29
Sources: Klonsky and Richter (2005, 2007); California Department of Food and Agriculture (2007).
price, indicating that average annual prices have been somewhat higher in Northern California and San Joaquin Valley markets than in the southern interior desert region (Table 9). Price differences relate to differences in regional balances of supply and demand with areas with higher dairy concentrations tending toward higher hay prices. In addition, the USDA data confirm that nonalfalfa hay crops typically get lower prices with high-quality conventional alfalfa hay typically commanding a price 20–50% higher than oat, rye grass, Bermuda grass, or Sudan grass hay. Shipment costs generally vary from $15 to $45 per bale, depending on distance (Hoyt 2007). In some cases buyers pay for the delivery (FOB, free on board) while in other cases the sellers pay (delivered), in which case the freight charges are included in the reported sales price.
Respondents also reported a larger spread of price premiums for organic as compared to conventional hay— from 5% to 50% in the San Joaquin Valley and as much as 100% according to one respondent in the North Coast region. The Cascade-Sierra grower, however, reported a more modest premium of 5–10%. The USDA’s AMS alfalfa hay market summary (2007)
11

Giannini Foundation Information Series Report 09-1
confirms that organic premiums are generally higher in the northern area of the state (for example, around 40% for the Petaluma market) than in the San Joaquin Valley region, where premiums range from 10% to 26% (Tables 9 and 10). One respondent described a market climate in which extremely high prices are charged at certain times of the year given the desperation of many organic dairies to find organic hay. However, he also noted that this tendency is tempered
by the long-term nature of the relationships producers have with their customers, which encourages less volatility even if the commodity is relatively scarce. In contrast to alfalfa growers, the mixed-grass producer felt that he must keep his prices low to sell his crop at all and has been told at times that the price for his hay is lower than for conventional hay.
One important determinant of price is quality, which includes freshness (which some growers assess
Table 9. Average Annual Organic and Conventional Hay Prices for Premium and Good Quality Alfalfa Hay for Cattle: FOB*
Cascade-Sierra Region
Sacramento Valley Region San Joaquin Valley Region
Southeast Interior Region
Year Quality Type
Northern Inter-
mountain Sacramento
Valley
Western Fresno, Madera,
Firebaugh Kern County Imperial
Valley
Good Conv. 118.57 119.08 123.44 126.80 117.38
2006 Org. 153.64 150.00 150.00 NA NA
Premium Conv. 128.62 138.18 144.31 147.90 137.03 Org. 175.62 NA NA NA NA
2007 Good Conv. 137.25 141.92 169.32 169.74 138.11
through Org. 175.93 193.75 NA 190.00 NA
August Premium Conv. 147.75 154.55 180.06 178.51 143.31 Org. 203.33 NA NA 212.50 170.00
* FOB—free on board: buyer pays freight costs. Source: U.S. Department of Agriculture Agricultural Marketing Service (2006, 2007).
Table 10. Average Annual Organic and Conventional Hay Prices for Premium and Good Quality Alfalfa Hay for Cattle: Delivered*
Cascade-Sierra Region San Joaquin Valley Region
Escalon, Tulare, Visalia, Year Quality Type Petaluma Modesto, Turlock Hanford, Bakersfi eld
Good Conv. 159.86 144.79 147.08
2006 Org. NA NA 195.50
Premium Conv. 174.68 169.10 175.21 Org. 236.58 235.00 NA
2007 Good Conv. 168.44 179.72 191.28
through Org. 231.82 226.81 NA
August Premium Conv. 182.37 191.10 200.76 Org. 260.00 236.75 NA
* Delivered: seller pays freight costs. Source: U.S. Department of Agriculture Agricultural Marketing Service (2006, 2007).
12

Market Potential for Organic Crops in California: Almonds, Hay, and Winegrapes
by the smell) and the absence of weeds. Buyers also often perform a test to determine total digestible nutrient (TDN) and protein content, which can also raise or lower the price in conventional hay. The USDA recognizes the following five quality designations: supreme, premium, good, fair, and utility. These designations are assigned on the basis of quantitative test parameters commonly used in a trade area, such as TDN, relative feed value, crude protein, adjusted crude protein, and neutral detergent fiber, as well as qualitative parameters such as stage of maturity, color, damage levels, and weed and mold content (USDA, AMS 2007).
While nutrient measures such as TDN are generally important to buyers, two survey respondents implied that these do not make as significant of an impact on price in organic as in conventional hay due to the relative scarcity of organic hay of any quality. To illustrate this relationship in another way, on the one hand a producer stated that very high quality conventional hay might earn the same price as organic hay. On the other hand, another producer confi rmed that prices may be lower early in the season when the relative quality of organic hay is lower. For alfalfa overall, however, prices are generally at their lowest in July and August, when high heat in many California growing regions reduces quality and buyers turn to mountain regions and cooler states for imports.
Production Challenges
Some growers noted a decreased ability to guarantee quality in organic hay compared to conventional hay given the challenges of weed control (requiring expensive labor-intensive methods). One producer felt that the quality of his hay was fairly comparable to that of conventional hay. However, he sometimes has suffered yield losses from cutting early to control pests since there are no pesticides available to him. The sample overall, however, did not report having actually experienced substantial yield losses compared to conventional production and four respondents estimated that their yields were roughly comparable to conventional. Therefore, while quality appears to be a bigger concern than yield reductions and can occasionally cause marketing challenges, the overall
responses indicated that short supply in the organic hay market can often override poor quality in setting the price.
Business Models: Alternative Niche Markets
While dairies comprise the bulk of the hay market, two producers also mentioned selling hay to owners of horses, llamas, and goats. Some types of hay, such as alfalfa and Timothy grass, will sell for higher prices if they are in an area of high demand from horse owners (Hoyt 2007). The two producers mentioned, however, noted more marketing challenges than the other respondents. One grower relies primarily on a long-standing customer and is uncertain how he would find additional customers if he were to expand his production. The other producer advertises in local periodicals to small-scale livestock owners to sell the remaining hay that he does not sell to large regular customers. He also stores about one-third of his annual production for later sale. He noted that he could sell more of his production to small-scale livestock owners if he had the capacity to deliver it. Many of these potential customers do not own vehicles large enough to transport the bales. However, as a producer of mixed-grass hay, he feels that he would not be able to charge a price high enough to make delivery economically feasible for his business. In fact, many growers do not have storage facilities for hay and instead just leave the bales in the field to be picked up for shipment to buyers.
Constraints to Further Expansion: Higher Returns from Competing Land Uses
While the statistics on organic dairy expansion suggest that the demand for organic hay will continue to grow, several factors limit the rate of expansion of organic hay production. In many areas of the state, alfalfa and other hay crops are still not as profi table as other crop choices. Several producers in this sample noted that they do not plan to expand their hay production because they can make more money on other crops. Nevertheless, for many such producers, alfalfa maintains an important position in their production systems as a leguminous rotation crop for higher
13

Giannini Foundation Information Series Report 09-1
value crops. For example, one grower described his ideal rotation system as consisting of four years of alfalfa alternating with two years of vegetables. Less management-intensive grass crops can also serve as land reserves—earning some income while holding land in organic status for future higher value crops. For example, one respondent leases a portion of his land to two small organic mixed-vegetable, fl ower, and greenhouse operations and keeps the remainder in mixed grass. He predicts that the two tenant operations will want to expand onto additional land in the future and will benefit from the land already being certified. In this case, hay production is not necessarily the most profitable use of the land but allows this retired landowner to gain some income with minimal labor while keeping organic land in reserve for higher value uses in the future.
14

Market Potential for Organic Crops in California: Almonds, Hay, and Winegrapes
ORGANIC WINEGRAPES
Summary
With a boom in domestic and international sales of wines made with organic grapes, wineries may be playing as large a role as
growers in the rapid increase in organic winegrape acreage in California since the late 1990s. Many wineries, seeking to increase the percentage of organic grapes in their wines, are actively encouraging their growers to transition to organic. Nevertheless, high organic premiums are not the norm in this industry since prices are primarily a function of quality and appellation (region of origin). In addition, to date, very few wines are sold as “organic wine” due to a strict prohibition in the USDA National Organic Program on the use of added sulfites in organic wine. Many vintners feel that sulfite is necessary to preserve the wine’s quality over time. As a result, the majority of wineries using organic grapes make wine that can only be labeled as “made with organic grapes” and do not necessarily receive any organic price premium in the marketplace. Nevertheless, many vintners seek organic grapes from growers because they equate organic with high quality. The majority of growers maintain contracts with wineries, thereby ensuring a market for their grapes. With a large export market, growers and wineries need to be aware of alternative organic standards for which they may need to be certified in addition to the USDA standards. Standards set by the International Federation of Organic Farming Movements, Japan, Canada, and the European Union (EU) have some requirements that diverge from the USDA standards.
Introduction
Data for this study were drawn from telephone interviews of ten winegrape producers and winemakers. Five of the respondents are CCOF chapter leaders or closely involved in the CCOF “Going Organic” program as grower mentors. Of the remaining fi ve, four were recommended by one of the mentors and one was a personal contact of the researchers.
Eight of the respondents represent wineries that grow grapes and produce wine while the remaining two respondents are strictly producers (one owns his vineyard and the other works as a vineyard manager for wineries and other landowners). The organic grape acreage directly owned and managed by respondents ranged from 14 to 1,800 acres with a median of 79 acres. They have been growing grapes organically for 6 to 33 years with a median of 12.5 years. The number of cases of wine made with some percentage of organic grapes ranged from 12,000 to 3.7 million sold per year. Four wineries noted that they sell some wine made exclusively with organic grapes but in two of these cases the wines constitute only between 1% and 5% of their total annual output (Table 11).
Demand for Organic
The overall market for organic winegrapes appears to be expanding with wineries as well as growers pushing the trend toward increasing organic grape production. Four of the winery respondents specifi cally noted that they are aiming to use as high a percentage of organic grapes in all of their wines as possible and are actively trying to increase their current percentages. In fact, one of these wineries has a fi ve-year plan and its own sustainable certification program that it uses with its contract growers to transition them to using progressively fewer synthetic inputs over time. Several respondents were also aware that many other wineries, not included in this study, are seeking out organic grapes and one considered them practically “one and the same” with high-quality grapes. Several respondents also implicitly or explicitly equated organic with high quality, perhaps due to the greater degree of monitoring and general level of attention paid to the vines in a successful organic vineyard, which many people feel is the same degree of attention needed to produce high-quality grapes in any vineyard. In addition, many wineries are interested in promoting organic vineyard practices for purely environmental reasons because it is the “right thing” to do. While not all of these wineries insist on organic
15

Giannini Foundation Information Series Report 09-1
certification, some do ask growers to show proof of certifi cation.
Recent nationwide statistics indicate a current boom in sales of organic wines, a category that includes certified wines as well as wines made with organic grapes. The Natural Foods Merchandiser survey of retail stores indicated that combined sales of organic wine and beer grew by 48% from 2002 to 2003 (Spencer and Rea 2004) and sales of organic wine grew 28% in 2004 according to OTA (2007) statistics. During those same years, consumption of all wine grew by only 2.5% to 4% by volume per year according to statistics compiled by the Wine Institute (2008). The international market for organic wines is also growing rapidly. Although current detailed data are lacking, estimates indicate that both production and sales of organic wines are particularly robust in Italy, France, and the United Kingdom (UK) (Allaire
Table 11. Respondent Characteristics – Winegrapes
2005). The UK has recorded particularly strong demand for organic wines supported by aggressive organic purchasing efforts by the major food retailer companies, Sainsbury’s and Tesco. For example, during 2003 alone there was 50% growth of organic wine sales in Sainsbury’s, the main supermarket chain in the UK (Lewis 2003).
Given these global market trends, it is not surprising that an increasing amount of California’s organically produced wine is being exported, particularly to Europe, Canada, and Japan. Once again, specific data are lacking for organic wine overall, but the trends for individual brands show vibrant growth. For example, Bonterra Vineyards, the largest brand of California wine made from organically grown grapes, exports approximately one-third of its total volume of production each year. Bonterra’s total volume of sales (including both domestic and export markets)
Total Acreage (including contract Number of Cases per Year
Organic growers and any Varieties (made with any percent Region Acreage conventional acreage) (organic) organic grapes)
Vineyards
Cascade-Sierra 21 41 1 —
North Coast 500 500 10+ —
Wineries with Vineyards
North Coast 12 14 4 12,000
North Coast 37 37 3 2,000
North Coast 60 60 5 6,000–7,000
North Coast 37 137 3 40,000 (500 with 100% organic grapes)
Cascade-Sierra 160 160 20 35,000
North Coast (98)* 166 23 150,000 (organic contract
growers)
North Coast 170 170 9 25,000
North Coast 1,800 NA 9 3.7 million (180,000 with 100%
organic grapes)
* Biodynamic, not certifi ed organic.
16

Market Potential for Organic Crops in California: Almonds, Hay, and Winegrapes
more than quadrupled over the last decade, increasing from 51,000 cases in 1996 to 224,000 cases in 2007 (Thrupp 2008).
An important aspect of the winegrape market, however, is that it is highly differentiated by appellation and variety. Choosing the correct varieties in demand for a grower’s particular region, therefore, is a crucial step to success in the winegrape industry. In fact, six of the wineries reported that their primary limitation in purchasing more organic grapes is the diffi culty of finding enough grapes of the right variety and from the correct location for the particular wines that they produce. One of these respondents noted, for example, that it is hard enough to find any high-quality Sauvignon Blanc grapes at all, even conventionally grown, let alone organic. (The other two wineries in the study are not purchasing grapes because they produce enough in their own vineyards to supply their entire wine production). The respondents in our sample grow an average of eight or nine different varieties, with one small-acreage grower producing as few as two varieties and some wineries with large vineyard acreages producing more than twenty. Cabernet Sauvignon, Merlot, and Syrah were the most frequently mentioned varieties, and one grower noted that there has recently been a glut of Merlot on the market, making it more difficult to sell at a good price.
Trends in Organic Sales and Acreage
For the period from 1998 to 2004, sales of organic winegrapes initially increased but then took a dip in 2000, leveling off thereafter. Sales of all winegrapes declined slightly from a high point in 2000 (Table 12).
Organic winegrape acreage is increasing at a faster rate than organic sales (an increase of 90% in acreage compared to an increase of 39% in sales from 1998–2004), which may be an indication of large numbers of new vineyard conversions on an annual basis (Table 13). Moreover, the difference between acreage and sales increases may be even greater than what is reported because grapes that are grown as organic but not explicitly sold as such do not need to be reported as organic to the CDFA.
These statewide figures, however, obscure major differences in organic grape supply by region, which some respondents noted can vary signifi cantly. The North Coast region is thought to be most amenable to organic methods, possibly due to lower humidity than some other regions such as the Central Coast. The CDFA (2005) Organic Sales Report confirms that Mendocino County has more than twice as much organic winegrape acreage (3,766 acres) as the next biggest organic county, Napa (1,585 acres), and 23 times as much as Monterey county (158 acres). Furthermore, this acreage represents a 68% increase from 2002 acreage, compared to an increase of only 18% for Napa and a decrease of 45% for Monterey. These regional and even local distinctions may account for the fact that some respondents were uncertain whether the supply of organic grapes was increasing or thought that the rate of increase was not dramatic.
One of the significant factors contributing to the growing interest and adoption of organic production, particularly in the North Coast, is the presence of education programs that have been held by the regional winegrowing associations, including the Sonoma County Winegrape Commission (which has regular field meetings for their Organic Producers Group), the Napa Valley Winegrape Growers, the Napa Sustainable Winegrowing Group, and the Mendocino Winegrape and Wine Commission. These educational events about organic methods have generated strong
Table 12. Increases in California Organic Winegrape Sales Compared to Total California Winegrape Sales
Organic as Percent
Organic Total of Total Winegrape Winegrape Winegrape
Year Sales ($) Sales ($) Sales
1998 10,528,620 1,491,908,000 0.71
1999 15,252,842 1,556,405,000 0.98
2000 12,120,435 1,908,649,000 0.64
2001 14,650,213 1,820,106,000 0.80
2002 14,561,719 1,683,452,000 0.86
2003 14,388,001 1,542,876,000 0.93
2004 14,721,122 1,604,925,000 0.92
Source: California Department of Food and Agriculture (1998–2004, 2007).
17

Giannini Foundation Information Series Report 09-1
Table 13. Increases in California Organic Winegrape Acreage Compared to Total California Winegrape Acreage
All Winegrapes All Winegrapes Organic Bearing Organic Winegrapes Bearing Nonbearing All Winegrapes Acreage as Percent Bearing Acres Only Acres Only Acres Only Total of All Bearing
Year (acres) (acres) (acres) (acres) Acreage
1998 4,137 385,000 122,000 507,000 1.07
1999 6,304 424,000 130,000 554,000 1.49
2000 5,857 458,000 110,000 568,000 1.28
2001 6,904 480,000 90,000 570,000 1.44
2002 7,394 486,000 70,000 556,000 1.52
2003 7,875 479,000 50,000 529,000 1.64
2004 7,780 473,000 40,000 513,000 1.64
Note: No figures were available for nonbearing organic acreage. Source: California Department of Food and Agriculture (1998–2004, 2007).
attendance and interest among growers, particularly in Sonoma’s organic producers’ meetings, which offer ample opportunities for grower-to-grower exchange. The CCOF’s “Going Organic” meetings have also been well attended by winegrowers throughout the state.
Prices and Organic Premiums
The organic winegrape market is somewhat unusual compared to markets for other organic commodities. The organic nature of the grapes is seldom the primary or most important characteristic that determines the price received by the grower, and in fact it frequently commands no price premium at all. Instead, the overwhelming criteria used in purchasing grapes are the appellation of the vineyards and various quality characteristics that will affect the wine. These characteristics can vary substantially by winery and by whether the grapes are considered high-value varieties or low-value blending grapes; typically they include some combination of characteristics such as sugar content, acids, color, flavors, size of grapes, defects (such as mildew), production practices used, and location (Goodhue et al. 2003).
Only three of the eight wineries in our study reported paying a slight premium (10% according to one winery) for organic grapes because they are trying to encourage growers to move toward organic.
These three wineries range from small to very large in terms of annual output. One of the respondents noted, however, that they do not pay the premium if the grape quality does not meet their standards. Another respondent noted that, regardless of whether a premium is paid or not, the price varies a great deal by grower based on variables such as location, variety, and length of contract, again suggesting that organic is not necessarily one of the primary determinants of pricing. The remaining seven respondents all noted that they do not receive (in the case of growers) or pay (in the case of wineries) price premiums solely on the basis of grapes being certifi ed organic. Three of the winery representatives explained that organic does not offer them any marketing advantages (since they either cannot or choose not to use it on their wine labels); therefore, they cannot offer any price premiums. Finally, in the case of the many wineries that have their own vineyards, decisions about vineyard management can be made directly within the company as long as production costs are accounted for by the final sales of wines. In these cases, vintners and vineyard managers can agree on organic practices if they consider these practices to represent the best way to assure the level of quality they are seeking in their final product, and the presence or absence of price premiums at the farmgate does not play a role in these decisions.
18
Market Potential for Organic Crops in California: Almonds, Hay, and Winegrapes
Production Challenges: Motivations and Constraints for Growers Moving to Organic
While the general lack of an organic premium provides no direct financial incentive for growers to transition to organic production, many growers have other reasons for making the switch. One producer (in Napa County) maintained that anyone not growing organically is either irresponsible or unknowledgeable given how easy it is to grow organically in his region and how much cheaper it is to use sulfur (registered for use in organic production) compared to expensive synthetic fungicides. He did concede, however, that managing disease with sulfur alone, which must be reapplied often, is more difficult in a very large vineyard of thousands of acres compared to vineyards smaller than 100 acres. However, a small grower in the Sierra foothills region maintained that organic production is more expensive than conventional due to higher costs accruing from the more frequent chemical applications, greater number of practices required for weed control, and record-keeping and inspection costs.
Cost of production studies conducted by the Department of Agricultural and Resource Economics at the University of California, Davis in 2003 and 2004 confirm that organic production of Chardonnay grapes in Sonoma County is somewhat more expensive than conventional production in that particular region. While the organic grapes require less costly fungicide treatments, organic insecticidal oil and weed control are somewhat more expensive, resulting in slightly higher overall per-acre costs for organic production (Smith et al. 2004a, 2004b). In certain regions, however, such as Mendocino County, where pest and disease pressures are often low, cost analyses show that organic and conventional production have very similar costs but that the cost factors depend more on the management intensity, desired fruit quality, and particular approach of the vineyard operations rather than whether it is organic (Thrupp 2005).
Even with the lack of significant organic premiums and prices for winegrapes in a general decline in recent years, the Sierra foothills grower continues to produce organically, saying that it is a “nice way to grow grapes” and also protects his business for the future, when agricultural chemicals may become
more regulated. Several producers expressed a strong environmental ethic as a reason to grow organically with one producer saying that “organic has more to do with how you think about the environment [than with] marketing.” Another respondent, from a winery that grows most of its own grapes, indicates that “we are organic because we believe in it but we are not getting much marketing value from it.”
Business Models: Importance of Marketing Contracts
Six of the respondents, including both respondents who are strictly growers, reported using contracts between the growers and wineries (two additional winery respondents did not address this question and two wineries did not purchase any grapes beyond those produced in their own vineyards). A 1999 statewide survey of 2,000 winegrape producers showed that about 90% have contracts with wineries, most of them written, and about 30% of contracts include “evergreen” (renewal) clauses (Goodhue et al. 2003). These statistics suggest that obtaining a contract with a winery is an important first step and a crucial key to success for growers. As one respondent put it, growers need to do their marketing and find a winery to purchase their product before they do their planting. Securing a contract can potentially lead to a long-term relationship. In fact, one of the growers in our sample noted that “marketing challenges” as such do not exist for him because he planted his organic vineyard under contract with a large winery more than 12 years ago and this winery has purchased all of his grapes since. In addition, one winery respondent noted that prices paid for grapes can vary according to the length of the contract with a grower (in addition to other factors), indicating that longer-term relationships are preferred and can potentially lead to higher returns to the grower.
The importance of winery contracts to growers’ success in marketing points to another explanation of why organic production is expanding despite the lack of price premiums. While organic may not provide a boost in farmgate prices, it can provide the all-important market access to the growing number of wineries interested in purchasing organic grapes.
19

Giannini Foundation Information Series Report 09-1
Constraints to Further Expansion: Wine Labels and the Organic Stigma
As noted earlier, many wineries that prefer to buy organic grapes do not offer a price premium for organic, a fact related to regulations regarding use of the term “organic” in wine labeling as set forth by the USDA National Organic Program (NOP). The NOP offers two options of labels for wineries that use organic grapes:
• Organic wine: Certified organic grapes are used and no added sulfites are used in the winemaking.
• Made with organic grapes: Certified organic grapes are used and sulfites added in the wine are below 100 parts per million (ppm).
Wines made under both options must come only from grapes that are certified organic and the winery must follow the same specific guidelines in the winemaking process; the only difference between the two is the allowable addition of sulfites up to 100 ppm in wine labeled as “made with organic grapes.” Additionally, in both cases, the winery needs to be certified as an organic processor and have a yearly inspection by an accredited certifi er.
At least 25 of the wineries in California that are producing and/or using organic grapes in their wines have certified organic winery operations and are labeling their organic wines using one of the two labels (CCOF 2007). In this study, six wineries produce wine labeled as “made with organic grapes,” which is the option most wineries in this market use. A very small number of wineries statewide (and none in this study) produce “organic wine” made without any added sulfites and their products are marketed generally for a niche market of consumers who believe they are allergic to sulfites or have other reasons to select this type of wine. According to two respondents in this study, making good wine without any added sulfi tes to preserve it as it ages is considered to be quite difficult. Some also pointed out that European organic standards do allow added sulfites, albeit in lower concentrations than are allowed in conventionally produced wine. Finally, several wineries in California that are using organic winegrapes, including those that were selected for this study, have chosen not
to use an organic label at all and do not get organic certification for their winery operations in spite of their enthusiastic demand for organic grapes. This approach allows them more flexibility in the wine-making process.
The organic wine market is further complicated by the fact that many vintners feel wary about the poor reputation established by low-quality organic wine produced years ago, before some wineries and retailers learned how to improve the production and handling process. In fact, John Schumacher, winemaker for Organic Wine Works, is quoted in an E-Magazine article as saying that “Our organic wine nearly diminished our reputation for traditional wine” (Gleason 2006). Several respondents in this study also noted that some wineries, for the same reasons, prefer to avoid using the term “organic” anywhere on their labels even if they are using organic grapes. These comments suggest an effect, at least on a historical basis, that is almost the opposite of a price premium for organic.
However, the positive organic sales data cited previously indicate that the historical stigma may be waning, a trend that some industry players are actively trying to hasten. For example, one winery respondent reported that his only wine made with all organic grapes (and thus labeled as such) is also his most expensive wine, a strategic choice that he hopes will result in customers being impressed with the quality of the wine and, hence, developing a preference for organic over time. While the stigma may be holding back or slowing some potential expansion, the central attention on quality of grapes, the equation of organic with high quality by some vintners, and an environmental ethic are all factors that are gradually pushing more wineries, and hence more growers, toward organic grapes and toward making wine with 100% organic content.
International Certification Requirements
Growers who produce organic grapes for wineries that export certified organic wine need to comply with standards set by the International Federation of Organic Farming Movements (IFOAM), which is a coordinating body that develops guidelines at an international level. At the vineyard level, these IFOAM
20

Market Potential for Organic Crops in California: Almonds, Hay, and Winegrapes
requirements can be checked and approved by the local certifi er as long as the certifi er is accredited by IFOAM. The standards of IFOAM are very similar to those of the NOP but there are a few differences in terms of specific inputs that are restricted. Winegrowers who are producing organic grapes for exported wine need to check with their certifiers in the United States to get IFOAM certification and they generally must pay an added minimal fee to their certifi er for this service.
At the same time, individual importing countries and regions, including Japan, Canada, and the EU, have a few specific organic requirements that are somewhat distinct from IFOAM. For example, organic laws in Japan and the EU do not allow for the use of potassium bicarbonate for mildew control or humic acids in soil amendments. Winegrowers involved in this international market must be aware of and meet these requirements, and the certifiers also must oversee these rules during their inspections.
Wineries that export wine that is labeled “organic” or “made with organically grown grapes” also must comply with IFOAM standards in the winery operations and for the labeling. If they are exporting wine to the EU, Japan, and/or Canada, they must follow specific requirements for those countries and regions as well. Organic labels and logos vary from country to country, so the exporting wineries cannot use the same labels as those that they use in the United States. Although these regulations are complex, information is available about these export-related rules through certifiers and online resources (see, for example, CCOF (2008)).
Acknowledgments
This study was conducted on behalf of California Certifi ed Organic Farmers Foundation with funding from the California State Water Resources Control Board. We especially wish to thank Fred Thomas for his guidance and all of the growers, handlers, processors, and vintners who we interviewed.
21

Giannini Foundation Information Series Report 09-1
REFERENCES
Allaire, B. Slide presentation at the Napa Grape Growers Association Organic Wine Conference, Napa, CA, 2005.
Almond Board of California. “Food Quality and Safety Action Plan and Pasteurization.” Modesto, CA, 2004. Available at www.almondboard.com/ Programs/content.cfm?ItemNumber=890&snIte mNumber=450.
Almond Board of California. “Almond Handler and Trade Database.” Modesto, CA, 2006. Available at www.almondboard.com/Applications/ FindHandlerApp/HandlerList.cfm.
California Certified Organic Farmers. “Organic Directory Online.” Santa Cruz, CA, 2007. Available at www.ccof.org/directories.php (accessed in 2007).
California Certified Organic Farmers. “A Guide to CCOF Global Market Access.” Santa Cruz, CA, 2008. Available at www.ccof.org/pdf/CCOFman3. pdf (accessed in 2008).
California Department of Food and Agriculture. “State Organic Crop and Acreage Report.” Sacramento, CA, annual editions 1998–2004.
California Department of Food and Agriculture. “Organic Sales Report.” Sacramento, CA, 2005.
California Department of Food and Agriculture. “California Agricultural Resource Directory 2006. “Sacramento, CA, 2007.
Centers for Disease Control. “Outbreak of Salmonella Serotype Enteritidis Infections Associated with Raw Almonds—United States and Canada, 2003–2004.” MMWR Dispatch 53(22) (2004):484–487. Available at www.cdc.gov/ mmwr/preview/mmwrhtml/mm5322a8.htm.
DeVries, Cindy. Bonterra Vineyards. Personal communication, August 31, 2007.
Duncan, R.A., P.S. Verdegaal, B.A. Holtz, K.M. Klonsky, and R.L. De Moura. Sample Costs to Establish an Orchard and Produce Almonds: San Joaquin Valley-North, Flood Irrigated. Davis CA: University of California, Davis, Department of Agricultural and Resource Economics study AM-VN-06-1, 2006. Available at www.coststudies.ucdavis.edu/fi les/ almondfl oodvn06.pdf.
Fantle, W. “Cornucopia Institute: Almond Growers and Handlers File Federal Lawsuit to End ‘Adulteration’.” Reuters, 10 September 2008. Available at www.reuters.com/article/pressRelease/ idUS86427+10-Sep-2008+PRN20080910.
Gleason, P. “Organic Grapes, Organic Wine: The Harvest Is Bountiful, but the Labeling Controversy Is Still Fermenting.” E-Magazine 16(6) (2006). Available at www.emagazine.com/view/?3423 (accessed Aug 15, 2007).
Goodhue, R.E., D.M. Heien, H. Lee, and D.A. Sumner. “Contracts and Quality in the California Wine-grape Industry.” Review of Industrial Organization 23 (2003):267–282.
Holtz, B.A., R.A. Duncan, P.S. Verdegaal, K.M. Klonsky, and R.A. De Moura. Sample Costs to Produce Organic Almonds: San Joaquin Valley-North: Sprinkler Irrigation. Davis CA: University of California, Davis, Department of Agricultural and Resource Economics study AM-VN-07-O-R, 2007. Available at www.coststudies.ucdavis.edu./files/ almondorgvn2007r.pdf.
Hoyt, S. Senior Agricultural Economist, California Agricultural Statistics Service. Personal communication, 2007.
Klonsky, K., and K. Richter. Statistical Review of California’s Organic Agriculture 1998–2003. Davis CA: University of California Agricultural Issues Center, 2005. Available at www.aic.ucdavis.edu/ research/StatisticalReview98-03f8.pdf.
Klonsky, K., and K. Richter. Statistical Review of California’s Organic Agriculture 2000–2005. Davis CA: University of California Agricultural Issues Center, 2007. Available at www.aic.ucdavis.edu/ publications/Statistical_Review_00-05.pdf.
Lewis, R. “Earth Calling.” Drinks Business Magazine, July 2003.
Organic Trade Association. “Manufacturer Survey.” Greenfield, MA, 2007. Available at www.ota.com/ pics/documents/2007ExecutiveSummary.pdf.
Smith, R.J., K.M. Klonsky, P. Livingston, and R.L. De Moura. Sample Costs to Produce Organic Wine Grapes: Chardonnay, North Coast Region, Sonoma County. Davis CA: University of California,
22

Market Potential for Organic Crops in California: Almonds, Hay, and Winegrapes
Davis, Department of Agricultural and Resource Economics study GR-NC-04-O, 2004a. Available at www.coststudies.ucdavis.edu/files/ grapeorgnc2004.pdf.
Smith, R.J., K.M. Klonsky, P. Livingston, and R.L. De Moura. Sample Costs to Establish a Vineyard and Produce Wine Grapes: Chardonnay, North Coast Region, Sonoma County. Davis CA: University of California, Davis, Department of Agricultural and Resource Economics study GR-NC-04, 2004b. Available at www.coststudies.ucdavis.edu/fi les/ grapewinenc2004.pdf.
Spencer, M.T., and P. Rea. “Natural Product Sales Top $42 Billion.” Natural Foods Merchandiser 25(6): (2004):1.
Thrupp, L.A., National Director of Sustainability, Fetzer Vineyards, Hopland, CA. Unpublished data, 2005.
U.S. Department of Agriculture, Agricultural Marketing Service. “Livestock and Grain Market News: Alfalfa Hay: California Market Summary.” Moses Lake, WA, 2006. Available at www.marketnews. usda.gov/portal/lg.
U.S. Department of Agriculture, Agricultural Marketing Service. “Livestock and Grain Market News: Alfalfa Hay: California Market Summary.” Moses Lake, WA, 2007. Available at www.marketnews. usda.gov/portal/lg.
U.S. Department of Agriculture, Economic Research Service. “Organic Production Datasets.” Available at www.ers.usda.gov/Data/Organic (accessed July 23, 2007).
U.S. Department of Agriculture, National Agricultural Statistics Service. “2007 Census of Agriculture, Volume 1: U.S. Summary and State Reports.” Washington DC, 2008. Available at www.agcensus. usda.gov/Publications/2007/Full_Report/index. asp.
Wine Institute. “Wine Consumption in the U.S.” San Francisco, CA, 2008. Available at www.wineinstitute.org/resources/statistics/ article86.
23

Giannini Foundation Information Series Report 09-1
24

The University of California prohibits discrimination or harassment of any person on the basis of race, color, national origin, religion, sex, gender identity, pregnancy (including childbirth, and medical conditions related to pregnancy or childbirth), physical or mental disability, medical condition (cancer-related or genetic characteristics), ancestry, marital status, age, sexual orientation, citizenship, or service in the uniformed services (as defined by the Uniformed Services Employment and Reemployment Rights Act of 1994: service in the uniformed services includes membership, application for membership, performance of service, application for service, or obligation for service in the uniformed services) in any of its programs or activities. University policy also prohibits reprisal or retaliation against any person in any of its programs or activities for making a complaint of discrimination or sexual harassment or for using or participating in the investigation or resolution process of any such complaint. University policy is intended to be consistent with the provisions of applicable State and Federal laws. Inquiries regarding the University’s nondiscrimination policies may be directed to the Affirmative Action/Equal Opportunity Director, University of California, Agriculture and Natural Resources, 1111 Franklin Street, 6th Floor, Oakland, CA 94607, (510) 987-0096.
For information on obtaining copies of this publication, see the back cover.

Giannini Foundation Information Series Report 09-1
GIANNINI FOUNDATION INFORMATION SERIES REPORTS
The Giannini Foundation Information Series (ISSN 0899–3068) is designed to communicate selected research results to a lay audience. The first Information Report was issued in 1963, and reports
are numbered serially within years. The Giannini Foundation of Agricultural Economics was founded in 1930 from a grant made by
the Bancitaly Corporation to the University of California in tribute to its organizer and past president, Amadeo Peter Giannini of San Francisco. The broad mission of the foundation is to promote and support research and outreach activities in agricultural economics and rural development relevant to California. In line with those goals, the foundation encourages research in various areas of interest to agricultural and resource economists and supports dissemination of research findings to other researchers and to the public. Foundation membership includes agricultural economists (faculty and Cooperative Extension specialists) at the Department of Agricultural and Resource Economics, Davis, and at the Department of Agricultural and Resource Economics, Berkeley. Associate members include forestry economists in the College of Natural Resources, Berkeley, and economists in the Department of Environmental Sciences at Riverside.
This and other Giannini Foundation publications are available in PDF format online at http://giannini.ucop.edu/publications.htm. Hard copies of this report may be ordered from University of California Agriculture and Natural Resources Communication Services.
University of California Agriculture and Natural Resources (ANR)
Communication Services 6701 San Pablo Avenue, 2nd Floor Oakland, California 94608–1239
Telephone: 800.994.8849 / 510.642.2431 Fax: 510.643.5470
E-mail: [email protected]
Visit the ANR Communication Services Web site at http://anrcatalog.ucdavis.edu
Peter Berck Giannini Foundation Series Editor University of California, Berkeley
Julian Alston Associate Editor
University of California, Davis
Julie McNamara Managing Editor
University of California, Davis
Angie Erickson Technical Editor
University of California, Berkeley
Natalie Karst Production
Visit the Giannini Foundation Web site at http://giannini.ucop.edu