marktausblick 2018 der ubs anlageexperten
TRANSCRIPT

The big picture: global macroeconomic outlook
06 The search for attractive risk- adjusted income
08 The search for attractive risk- adjusted capital growth
26
Challenge and opportunity ahead
PanoramaInvesting in 2018 | UBS Asset Management
For professional and qualified investors only

3
The asset management industry is chang-ing quickly. Technology and regulation are driving much of that change, but the market environment and the sheer scale of the challenges facing our clients are important drivers as well.
We see those challenges increasing in intensity in 2018 rather than changing fundamentally. The rationale for this view-point is straightforward. Investors in equi-ties have enjoyed another year of strong returns globally in 2017. Realized volatility, though picking up, has remained excep-tionally low. Credit markets have enjoyed robust conditions with spreads close to or at historic lows. Outside the US, govern-ment bond yields in the developed world have generally edged higher in 2017, but remain low in an historical context and are likely to stay low amid still accommodative monetary policy and structurally low growth and inflation.
Against this backdrop, the challenge of building genuinely diversified portfolios capable of delivering growth and income efficiently and on an attractive risk- adjusted basis is becoming both more complex and acute.
This issue of Panorama sees senior mem-bers of our investment teams address the on-going quest for growth and income via the risks and opportunities within their respective worlds. Encouragingly, across both traditional and alternative asset classes there is a high level of con-viction that attractive opportunities on a risk-adjusted basis still exist, and with a healthy awareness of the potential threats to broader market equanimity.
With the equity bull market in its ninth year, our senior investors are hardly alone in looking for signs of complacency or dislocations that might preface a broader market sell off. We see this as contrasting sharply to the ‘blue sky’ consensual assumptions that have characterized the peak of many previous market cycles.
Nonetheless, in the search for evidence of complacency, a lot of discussion has focused on the very low levels of real-ized and implied volatility across devel-oped markets.
We believe that there are both structural and cyclical forces at work in the current low volatility regime and that the cyclical drivers will abate only slowly over an extended period. The argument that risk assets are likely to become more vulner-able to short-term spikes in investor risk aversion as Quantitative Easing (QE) is reversed in the US has clear logic. But the roll-off of QE is a very gradual pro-cess and one that is likely to take several years. We therefore do not expect the reversal of QE to be the catalyst to a meaningfully higher volatility regime in 2018. It is also important to note that the US Federal Reserve (Fed) is maintain-ing a significantly larger balance sheet than existed prior to the financial crisis, withdrawing only a third of the liquidity
Suni HarfordHead of Investments, UBS Asset Management
Contents
Introducing Panorama: Investing in 2018As we move into 2018, senior investors from UBS Asset Management assess the global investment landscape, highlighting the risks and opportunities across their respective asset classes. Among the topics explored in this edition are:
The quest for attractive risk-adjusted income – Income returns across the traditional asset
classes – Income opportunities within the real asset
classes – Private credit, as viewed by both our single
and our multi-manager hedge funds – A solutions based approach to income
generation
The quest for attractive risk-adjusted capital growth – Demographics and markets – The changing face of emerging markets – Sustainability and performance – Smart beta
The following pages bring you distinct viewpoints drawn from the full breadth of our global capabilities to help you meet your investment challenges.
For additional content, including previous editions of Panorama, please visit ubs.com/panorama
Foreword
We believe that there are both structural and cyclical forces at work in the current low volatility regime and that the cyclical drivers will abate only slowly over an extended period.
Publishing information
Panorama is released bi-annually by
UBS Asset Management.
Editorial deadline: end-October 2017
Contributors
Tommaso Albanese, Bruce Amlicke, Anne
Anderson, Ian Ashment, Hayden Briscoe,
Erin Browne, Luke Browne, Jonathan Davies,
Uta Fehm, Stephen Friel, Christopher
Greenwald, Paul Guest, Suni Harford, Boriana
Iordanova, Urs Raebsamen, Bin Shi, Rodrigo
Trelles, Baxter Wasson, Geoffrey Wong, and
their teams
Editor
Gill Dexter
Coordination
Gill Dexter, Beth Roberts
Foreword Suni Harford 3
The big picture Macroeconomic overview 6
The search for attractive risk-adjusted income 9
The beginning of the end? Fixed income 10
Quality and income Equity income 12
Big themes for a modest growth world Real estate 14
Q&A Infrastructure debt Infrastructure 16
Spanning the spectrum Hedge funds 18 An allocator’s perspective 20 An investor’s perspective 22
Meeting the income challenge Investment solutions 24
The search for attractive risk-adjusted capital growth 27
The age old issue Macroeconomics 28
Emerging market equities: an increasingly domestic growth story 30 Emerging market equities
Forging a new path China equities 34
Navigating China’s mini-cyclical slowdown in 2018 China fixed income 36
The beat goes on Emerging market debt 38
The SI performance debate Sustainable investing 40
Smart beta in 2018 Systematic & index investing 44
About the authors 49
Why UBS Asset Management 56

54
it created since 2008. Moreover, the QE reversal process in the US has been explicitly communicated to ensure that market expectations are managed.
More traditional monetary policy tools – interest rates – are also likely to edge higher in the US in 2018. Yet in a world where technology and demographic forces appear to be disrupting the effec-tiveness of monetary policy tools to drive inflation higher, central bankers face a difficult task. We therefore expect the rise in US rates to be gradual, not least because monetary policy around most of the globe remains accommodative.
Nonetheless, the failure of monetary policy to drive wage growth is putting growing pressure on politicians to deliver via fiscal initiatives what monetary policy seemingly cannot. It is no coincidence that income growth via tax cuts is being debated in a number of major devel-oped economies to address the rise of populism.
Looking forward, it seems self-evident that the double digit local currency returns enjoyed by index investors across developed markets in recent years can-not continue ad infinitum. But while we might caution over the scale of likely returns in the coming years there is little
from a macroeconomic perspective to suggest an elevated probability of a major drawdown in 2018. The likelihood of a global recession is low. Demand growth has accelerated rather than slowed. Equity valuations, while full on some measures, remain compelling ver-sus bonds. Earnings growth forecasts have been rising, not falling. Importantly, having largely completed the process of deleveraging, bank balance sheets are in much better shape than they were prior to the last recession.
If there is major disruption coming in global equity markets in 2018, we ascribe a greater probability to an abrupt reversal of the sustained outper-formance of Growth sectors over Value sectors in developed markets since 2008 than to a significant drawdown. Broadly speaking we believe the environment will be an attractive one for high con-viction, active managers and fully expect active managers to continue their recent outperformance. The sharp decline in stock correlations, both realized and implied, supports this view.
The search for attractive yield and improved diversification in a “lower for longer” environment is also likely to remain at the core of investment deci-sion making in 2018. After the strong
flows and capital raisings of 2017, we see continued strong investor demand for alternative asset classes in 2018 including infrastructure, real estate, pri-vate equity and hedge funds.
In part because of the likely increase in interest in how to optimize the use of alternatives within broader portfolios, but also due to the scale and complexity of the challenges facing investors, we expect a continued increase in demand for tailored solutions. The lower return environment is likely to provide further support to cost-efficient, systematic flows and to a focus on specific risk premia and factors via smart beta. Finally, we see the sustainability narrative further evolving and the integration of ESG factors into the analytical main-stream accelerating.
In the following pages you will find insights on all of these key investment themes from senior investors across UBS Asset Management. It is precisely this depth and breadth of expertise across capabilities that differentiates us. It is also at the heart of our ability to combine these capabilities to address each client’s unique investment challenges effectively and efficiently in 2018 and beyond.
After the strong flows and capital raisings of 2017, we see continued strong investor demand for alternative asset classes in 2018 including infrastructure, real estate, private equity and hedge funds.
Foreword Foreword
76
accommodative monetary policy. Additionally, we see scope for additional fiscal stimulus in Japan following prime minister Abe’s larger than expected election victory. These positive macroeconomic drivers coupled with improving corporate gov-ernance and efficiency, supports our positive view on equity prices in Japan.
In bond markets 10 year US Treasury yields remain low by historical standards, but look attractive relative to most other developed government bond markets. In the absence of a material pick-up in inflation, US yields are likely to remain range bound. Our overall assessment is neutral.
The search for yield remains a powerful force for markets, but after the significant spread compression we do not view the risk/reward trade-off as sufficiently attractive within either Investment Grade or High Yield debt to warrant a positive stance.
The one area within the credit universe that stands out to us from a more positive perspective is emerging market debt. The spreads between local currency and USD-denominated EM debt and US Treasuries also remain low by historical standards. But in a world of low rates we see continued strong demand for EM debt’s attractive real yield.
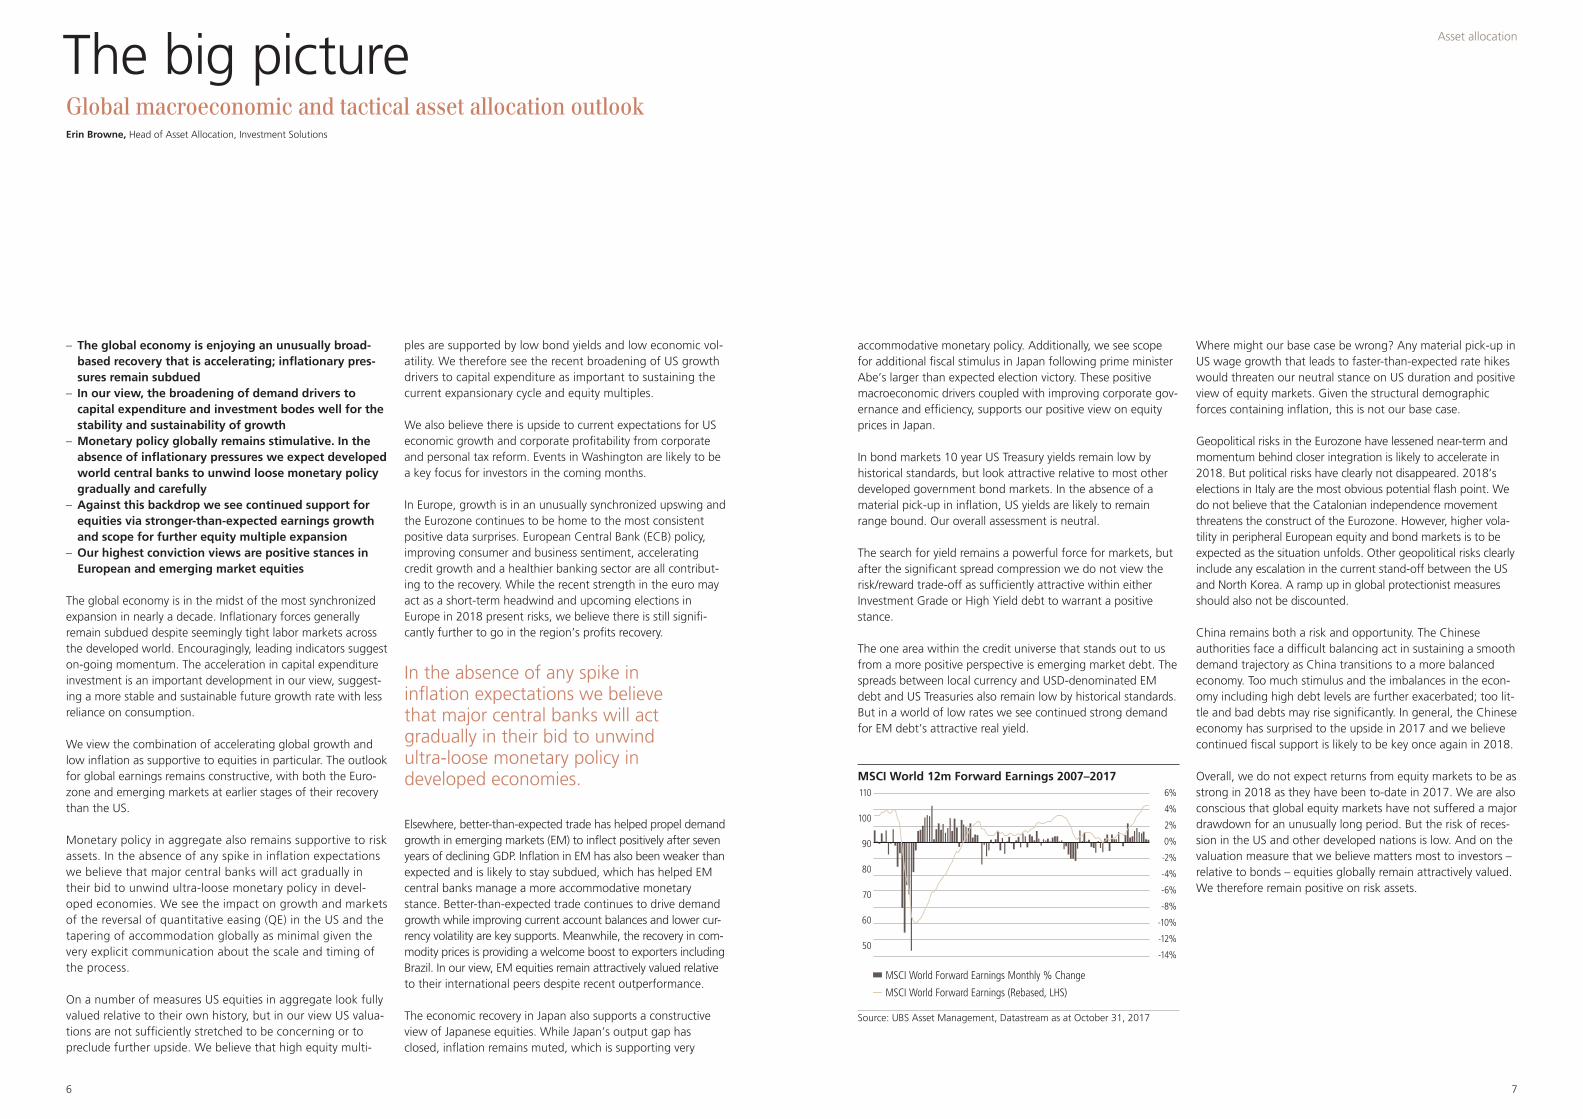
MSCI World 12m Forward Earnings 2007–2017
50
60
70
80
90
100
110
-14%
-12%
-10%
-8%
-6%
-4%
-2%
0%
2%
4%
6%
MSCI World Forward Earnings Monthly % Change
MSCI World Forward Earnings (Rebased, LHS)
Source: UBS Asset Management, Datastream as at October 31, 2017
Where might our base case be wrong? Any material pick-up in US wage growth that leads to faster-than-expected rate hikes would threaten our neutral stance on US duration and positive view of equity markets. Given the structural demographic forces containing inflation, this is not our base case.
Geopolitical risks in the Eurozone have lessened near-term and momentum behind closer integration is likely to accelerate in 2018. But political risks have clearly not disappeared. 2018’s elections in Italy are the most obvious potential flash point. We do not believe that the Catalonian independence movement threatens the construct of the Eurozone. However, higher vola-tility in peripheral European equity and bond markets is to be expected as the situation unfolds. Other geopolitical risks clearly include any escalation in the current stand-off between the US and North Korea. A ramp up in global protectionist measures should also not be discounted.
China remains both a risk and opportunity. The Chinese authorities face a difficult balancing act in sustaining a smooth demand trajectory as China transitions to a more balanced economy. Too much stimulus and the imbalances in the econ-omy including high debt levels are further exacerbated; too lit-tle and bad debts may rise significantly. In general, the Chinese economy has surprised to the upside in 2017 and we believe continued fiscal support is likely to be key once again in 2018.
Overall, we do not expect returns from equity markets to be as strong in 2018 as they have been to-date in 2017. We are also conscious that global equity markets have not suffered a major drawdown for an unusually long period. But the risk of reces-sion in the US and other developed nations is low. And on the valuation measure that we believe matters most to investors – relative to bonds – equities globally remain attractively valued. We therefore remain positive on risk assets.
– The global economy is enjoying an unusually broad-based recovery that is accelerating; inflationary pres-sures remain subdued
– In our view, the broadening of demand drivers to capital expenditure and investment bodes well for the stability and sustainability of growth
– Monetary policy globally remains stimulative. In the absence of inflationary pressures we expect developed world central banks to unwind loose monetary policy gradually and carefully
– Against this backdrop we see continued support for equities via stronger-than-expected earnings growth and scope for further equity multiple expansion
– Our highest conviction views are positive stances in European and emerging market equities
The global economy is in the midst of the most synchronized expansion in nearly a decade. Inflationary forces generally remain subdued despite seemingly tight labor markets across the developed world. Encouragingly, leading indicators suggest on-going momentum. The acceleration in capital expenditure investment is an important development in our view, suggest-ing a more stable and sustainable future growth rate with less reliance on consumption.
We view the combination of accelerating global growth and low inflation as supportive to equities in particular. The outlook for global earnings remains constructive, with both the Euro-zone and emerging markets at earlier stages of their recovery than the US.
Monetary policy in aggregate also remains supportive to risk assets. In the absence of any spike in inflation expectations we believe that major central banks will act gradually in their bid to unwind ultra-loose monetary policy in devel-oped economies. We see the impact on growth and markets of the reversal of quantitative easing (QE) in the US and the tapering of accommodation globally as minimal given the very explicit communication about the scale and timing of the process.
On a number of measures US equities in aggregate look fully valued relative to their own history, but in our view US valua-tions are not sufficiently stretched to be concerning or to preclude further upside. We believe that high equity multi-
ples are supported by low bond yields and low economic vol-atility. We therefore see the recent broadening of US growth drivers to capital expenditure as important to sustaining the current expansionary cycle and equity multiples.
We also believe there is upside to current expectations for US economic growth and corporate profitability from corporate and personal tax reform. Events in Washington are likely to be a key focus for investors in the coming months.
In Europe, growth is in an unusually synchronized upswing and the Eurozone continues to be home to the most consistent positive data surprises. European Central Bank (ECB) policy, improving consumer and business sentiment, accelerating credit growth and a healthier banking sector are all contribut-ing to the recovery. While the recent strength in the euro may act as a short-term headwind and upcoming elections in Europe in 2018 present risks, we believe there is still signifi-cantly further to go in the region’s profits recovery.
In the absence of any spike in inflation expectations we believe that major central banks will act gradually in their bid to unwind ultra-loose monetary policy in developed economies.
Elsewhere, better-than-expected trade has helped propel demand growth in emerging markets (EM) to inflect positively after seven years of declining GDP. Inflation in EM has also been weaker than expected and is likely to stay subdued, which has helped EM central banks manage a more accommodative monetary stance. Better-than-expected trade continues to drive demand growth while improving current account balances and lower cur-rency volatility are key supports. Meanwhile, the recovery in com-modity prices is providing a welcome boost to exporters including Brazil. In our view, EM equities remain attractively valued relative to their international peers despite recent outperformance.
The economic recovery in Japan also supports a constructive view of Japanese equities. While Japan’s output gap has closed, inflation remains muted, which is supporting very
The big pictureGlobal macroeconomic and tactical asset allocation outlookErin Browne, Head of Asset Allocation, Investment Solutions
Asset allocation

The search for attractive risk-adjusted income

1110
The beginning of the end?Where to find value in global rates, FX and credit markets in 2018Anne Anderson, Head of Fixed Income Australia
– We see a number of powerful factors keeping devel-oped world bond yields low overall in a long-term historical context
– But within this lower yield environment there is still scope for developed world yields to edge higher as ultra loose monetary policy is gradually withdrawn
– Risks to markets from QE reversal, change in central bank leadership and populism
– Central bank policy divergence providing tactical opportunities in interest rates
– We are attracted to higher real yields where under-lying sovereign debt levels are not extended
The question has frequently been posed over recent years ‘is the 30-year bull run in bonds over?’ As a starting point, we observe that the overall decline in global developed market yields began in 1982 and this trend has been punctuated by several episodes of increases in yields which were subsequently reversed. For this reason, we think the decline in global bond yields over the past several decades is best viewed in the con-text of the cyclical and valuation factors that have influenced longer term secular trends in the market.
It is conceivable that global bond yields may bounce around current levels for several years and there is a precedent for this as shown in the chart below. This chart illustrates that between 1930 and 1960, there was a long period where US Treasury bond yields traded around 2% to 3%.
Exhibit 1: US 10-year bond yield % 1929 to 2017 (yearly)
0
4
8
12
16
1934 1944 1954 1964 1974 1984 1994 2004 2014
An update of data shown in chapter 26 of market volatility, R. Shiller, MIT Press, 1989, and Irrational Exuberance, Princeton 2015.
We contend that global bond yields will stay relatively low but there will inevitably be periods of counter-trend movements. By discerning shifts in the global macro environment and the evo-lution of central bank policy investors can add value through the active management of interest rates across global markets.
We believe that we are currently in the midst of an important transition for central bank policy. Inflation has bottomed and a moderate but synchronized global growth pulse is now allow-ing for the gradual withdrawal of some of the exceptional pol-icy accommodation. The result will be a moderate rise in global bond yields with most developed markets having already defined a higher trading range over the past 12 months.
There is divergence across the central bank policy setting with the Fed leading the way in terms of increases in the Fed funds rate and starting the reduction in the size of their balance sheet by reducing security purchases. We believe the Fed will lift the policy rate over the coming year but in a well commu-nicated and gradual way. Their analysis shows the long-term neutral Fed funds rate has declined to 2.75%. The notion of long-term neutral or normal rate is, in our opinion, time vary-ing. What this means is that in this particular cycle, we think that inflation will take a long time to meet the Fed’s target and the growth cycle will be maturing. As a consequence the Fed policy rate will likely peak at a lower level than 2.75%.
The other dynamic at work is the size of central bank balance sheets, shown below. Even though the Fed has signaled a reduction in the size of their balance sheet and other central banks are slowing the pace of asset accumulation central bank balance sheets will remain much larger than they have historically. This will continue to suppress term premium in all bond markets not just markets where quantitative easing is part of the policy mix.
Exhibit 2: Central bank balance sheets (USD billion)
0
2’000
4’000
6’000
8’000
10’000
12’000
14’000
16’000
2006 2007 2008 2009 2010 2011 2012 2013 2014 2015 2016 2017
USD billion
Switzerland UK
Japan Euro area
USA
Source: Bloomberg
The Bank of Canada has recently lifted policy rates from 0.5% to 1.0% reversing the emergency reduction implemented dur-ing 2016 as commodity prices moved sharply lower. It is expected that the Bank of England will also lift rates over com-ing months in light of higher – mostly currency induced – infla-tion and better growth.
In Europe, the ECB has signaled a further taper, reducing the rate of expansion of their securities purchases over coming months. In our view, an increase in the key discount rate is not likely until well beyond the end of securities purchases. This will anchor yields to a certain extent although we have seen a cyclical increase in yields as inflation bottomed and growth has continued to improve.
When identifying risks, we see a confluence of factors that could disturb market sentiment at a time when a long period of low volatility has engendered a sense of complacency. There are a number of elements to consider here:
– The direction of quantitative easing is slowly reversing where central banks who are largely price insensitive buyers are reducing their financial system footprint;
– This is occurring at a time that the leadership of central banks is changing;
– The rise of popularism, unstable electorates and tenuous grips on power undermining the will to undertake critical structural reform to enhance productivity and potential growth. This is more acute when high debt to GDP requires stronger growth to arrest this trend given inflation is unlikely to deflate the debt away.
For this reason we are attracted to rates and FX markets with relatively higher levels of real yields and moderate sovereign debt levels.
Rates/FX – Trading central bank policy divergence through tactical and cross market interest rate opportunities;
– Overweight Australian, New Zealand and Canadian rates and underweight US, UK and moderately underweight Ger-man and Swedish rates, active trading in peripheral Euro-zone as politics drives volatility;
– In FX, long USD against selective markets.
Credit – Carry still expected to drive returns in both Investment Grade and High Yield; tax reform is expected to provide further price appreciation in the US where IG is a preferred credit segment;
– In High Yield, short duration strategies are preferred where yield protects against higher fundamental leverage;
– Overall we are trading up in credit and discerning in industry quality.
EMD – Markets are fully priced and we prefer high yielding local debt and FX opportunities rather than EM corporates;
– Local debt in Asia represents the most compelling risk- adjusted opportunity.
Fixed income

1312
Quality and incomeEquities that offer high dividends alongside ‘quality’ characteristics including low stock price volatility can be a compelling alternative to bonds for income seekers Urs Raebsamen, Equity Specialist, Systematic and Index Investments
– With bond yields in the doldrums, defensive dividend strategies can offer attractive alternative income sources for investors with respective risk tolerance
– A combination of dividend and quality criteria can lead to better long-term results
– Defensive portfolio construction is key Investors face a number of challenges in their pursuit of income and capital gains in 2018. Right now, yields on decent quality bonds are languishing. As a result, investors have ven-tured into equities, where dividend yields are still broadly in line with historical levels. However, equity investments come with equity-type downside risk, ie: potential significant capital loss.
Nonetheless, there are a variety of solutions available to inves-tors which can help them construct a lower risk alternative to plain dividend maximizing equity strategies.
Starting at the stock selection stage, a first consideration is to combine high dividend criteria with high quality criteria; the latter including measures such as high profitability, low finan-cial leverage, stock price stability and size amongst others. We believe the combination of dividend and quality criteria leads to better results over the long-term.
By reducing the portfolio’s beta – the sensitivity of the portfolio to market movements – it means, on average, portfolio drawdowns should be smaller than those of the broad equity market.
A second step is the construction of a defensive dividend equity portfolio. By reducing the portfolio’s beta – the sensitiv-ity of the portfolio to market movements – it means, on aver-age, portfolio drawdowns should be smaller than those of the broad equity market. That provides investors with a downside cushion.
A third route is to sell call options on stocks that the underly-ing equity portfolio holds. The primary goal of such a call overlay is to generate additional income which stems from the premium a seller of an option earns. While this income comes at the expense of foregoing some of the upside, the option overlay also adds to the defensive characteristics of the port-folio and is of particular benefit to investors in down markets. In strongly rising markets, it is likely that a number of stocks go up by more than their options’ strike prices which – while absolute returns would still be positive – leads to a negative contribution from the call overlay. Conversely, the call overlay is likely to contribute positively in down markets. In fact, as option premia are directly related to the implied volatility of their underlying, investors can earn a higher income in times of distress. For instance, during the global financial crisis, option premia would have been three or four times greater, compared to a normal environment. High implied volatilities also give the option overlay portfolio manager more leeway to earn a decent premium income or to set a higher strike price. The latter allows investors to benefit to a larger degree from a potentially v-shaped rebound after a sharp drawdown.
In conclusion, as so often in life there is more than one path to take. Defensiveness can be achieved through prudent stock picking, reduction of beta or volatility, or by selling covered call options. Perhaps, given markets seem to have entered the late stage of the cycle, a combination of all three is the most appropriate solution.
Global equity markets have posted double-digit returns in the first three quarters of 2017 supported by a benign macro environment. While a crash does not look imminent, it is unlikely that equity markets will continue to go up at the same pace in 2018. Against this backdrop and bearing in mind that volatilities are at record lows, it is worth considering adding defensiveness to one’s equity portfolio to be well positioned for the near future.
Equity income
Global equity markets have posted double-digit returns in the first three quarters of 2017 supported by a benign macro environment. While a crash does not look imminent, it is unlikely that equity markets will continue to go up at the same pace in 2018.

1514
– Income, not capital growth likely to be the key driver of real estate returns going forward
– As investors look for new drivers to power invest-ment strategies, the spotlight is falling on mega-trends such as demographics and environmental change
– The realities of a rapidly ageing population highlight new opportunities and challenges
– Sustainability standards are now mainstream in many building designs
– The next decade will likely see such mega trends greatly influence what kind of real estate is needed and where.
The real estate investment cycle has turned. After a period of exceptional capital value growth around the world, driven heavily by ultra-low interest rates and capitalization rate1 compression, we are shifting to a period of income-driven total returns. This is more in line with property’s historical behavior, but will form a sharp contrast to the past few years. In addition, income returns do not vary across markets and sectors nearly as much as capital value growth, meaning top-down strategic picks have become more difficult. Investors and strategists now are looking for drivers on which to pin their strategies for outperformance. As a result, there has been a resurgence of discussion and analysis on mega-trends like demographics or environmental change.
The Investment Property Forum (IPF) in the UK published the results of a survey in December 20162 which explored the significance and weight their members placed on several major structural trends, including both climate change and ageing populations. While overall awareness of these trends scored highly in the results, their incorporation into strategic decisions and in particular at the asset level varied widely.
While our real estate investment strategies look at mega-trends in a variety of ways, let’s focus in particular on two
long-term structural trends that will have a marked impact on how property income will evolve going forward: demograph-ics and environmental degradation. The issues are well-known and in fact are at the root of some key developments in the property investment industry, whether the increasing prevalence of institutional purchases of assisted living or medical office assets; or certain institutional investors limiting new allocations to funds who measure and improve their sus-tainability ratings. It is not only the source and durability of income that is being affected by these mega-trends but also the source and destination of investment capital.
Investors and strategists are now looking for drivers on which to pin their strategies for out performance. As a result, there has been a resurgence of discussion and analysis on mega-trends like demographics or environ mental change.
All told, sustainable initiatives are becoming much more widespread, from corporate ethics programs down to individ-ual asset enhancement initiatives. For example, the Australian government’s decision to enforce minimum sustainability standards for the buildings which it can occupy force the incorporation of environmental factors into the standard design of office buildings. Demographics and the reality of a rapidly ageing population are not yet being as widely embraced. Aged care provision is short relative to future need across much of the world, or is hampered by regulation such that private sector participation is discouraged. Shop-ping malls are generally designed for the youth bracket, which will have less money and less time than retirees in the not-too-distant future.
Big themes for a modest growth world Demographic and environmental factors to drive outperformance in real estate as focus switches from capital growth to income Paul Guest, Lead Real Estate Strategist for Real Estate Research & Strategy
1 Capitalization rate or “cap rate” is the ratio of net operating income to asset value for real estate investments 2 “Megatrends: Research Scoping Paper”, IPF Research, December 2016
The question is whether these trends will greatly influence performance? Does a sustainable building provide better returns than a less well-rated one? Do assets focused on shifting demographic preferences provide a more reliable income stream? It is reasonable to assume that they will. The typical hold period for an institutional, core asset is eight– to–ten years and over the next decade these trends will only become more important. This means that the relevant assets will be more in demand by tenants, which in turn means their income stream will be more secure. This is true whether looked at from a growth or risk mitigation perspective.
These mega trends will influence greatly what kind of real estate is needed and where. Environmental factors are being rapidly embraced with respect to what is needed at the asset level, less so as to which areas will be investable in future. In that context, think of rising sea levels and desertification. With respect to the ageing of the population, we are much earlier in the adoption curve: the challenge is readily under-stood but we are not yet incorporating it into asset design or location. For investment managers looking to outperform in an era of less capital value growth and lower returns, these might be areas in which to excel.
Real estate & private markets

1716
Q&A: Infrastructure debtAn increasingly strategic private debt alternativeTommaso Albanese, Head of Infrastructure, Real Estate & Private Markets
With strong flows from investors into infrastructure continuing, Tommaso Albanese answers key questions about why infrastructure debt is an attractive option for institutional investors to tap into – an asset class that is increasingly at the forefront of investors’ minds.
Why has infrastructure been so popular as an asset class – can it continue in 2018?We see increasing allocations to infrastructure debt in the coming year. That growth is likely to be fueled by financial constraints faced by many governments, bank structural deleveraging to comply with Basel III, plus considerable invest-ment requirements which are driving a shift towards increased private sector participation in the financing, operation and ownership of infrastructure assets. Institutional investors are filling this capital gap as they need predictable, stable, long-term cash flows – particularly in this lower for longer interest rate environment. We are seeing first time investors wanting to put more capital to work and new investors making invest-ments into infrastructure debt as they have gained more knowledge and experience of investing over the past few years, and recognize its favorable characteristics.
Those characteristics include lower default rates and higher recovery rates than comparable corporate credit. For example, the average recovery rate for infrastructure debt is about 73% compared to about 53% for corporate credit according to Moody’s data for BBB credits from 1983–2016. Over this same time period, infrastructure debt has also demonstrated more resilient credit performance with rating volatility of less than half that of corporate debt in next para.1
On the investment side, which sectors and geographies look attractive currently? Infrastructure financing in Europe has been typically dominated by banks which are now in retreat due to regulatory and finan-cial pressures. This is particularly the case for mid-size transac-tions in local European markets where the ability to provide dedicated origination and structuring capabilities by non-bank-ing investors could well result in bank disintermediation.
Is there much competition to do deals, and how is the pricing environment? Our key competitors are still banks as they have been the primary source of financing for this type of investment until asset managers and private capital started offering financing solutions. Our capital is complementary and an alternative source of financing to companies. We compete well by focusing on primary transactions where we have a direct dia-logue with the borrowers offering them favorable terms such as superior speed of execution, dedicated structuring capabil-ities, a pragmatic approach to negotiating terms and a true focus on long-term partnerships, while avoiding fee churn. This approach is critical to how we differentiate our offering from the competition and is demonstrated by our ability to generate superior returns.
How much of an impact do political and regulatory developments have on the market? Is now a particularly challenging time due to various political upheavals? Infrastructure investment is quintessentially interlinked with political and regulatory risk. The current economic environ-ment is offering a temporary and modest relief from the worst of the crisis. But the nature of this asset class means that we invest for the long-term and always think about our investments through the economic cycle. When a country’s regulation is considered to be fair and sustainable, the related infrastructure will benefit from low probability of reg-ulatory changes, although its returns could come under pres-sure. We are instead very cautious of sectors where the tariffs or subsidies are too generous and/or motivated by moving liabilities off-balance sheet, such is often the case in many PPPs (Public Private Partnerships)/PFIs (Private Finance Initiatives).
1 Source: UBS Asset Management, Real Estate & Private Markets (REPM); September 2017, Moody’s Infrastructure Default and Recovery Rates, 1983–2016
Are investors by now entirely familiar with the asset class, or is an education process still required? Investors still require further education on this asset class, especially with regards to how the risk-return profile of infra-structure debt is often more stable and sustainable over the long-term than other comparable corporate debt.
European regulators and government agencies have, for example, even pointed out themselves that infrastructure debt should deserve a greater percentage of allocations in institutional portfolios2, but we’re not yet seeing this as investors are continuing to familiarize themselves with where to allocate illiquid private debt and assess the respective capi-tal requirements.
Are there sectors that you see as potentially attractive but which you have not yet invested in? We are very open-minded as to which sectors we’re willing to invest in. To date, we have actively invested in a broad range of sectors such as ferry and port transports, elderly homes, power, motorways, renewables, liquid storage and car parks. We would have liked to increase our exposure to social infra-structure for their long-term contracted revenue aspects, but they have experienced too much credit spread compression which has deterred us for the time being.
How do you see infra debt developing over the next five years?There are growing infrastructure capital needs as well as more private investors looking for such opportunities. In the last few decades, the world’s population and economies have been growing at an ever faster pace creating bigger gaps in public spending for social services and infrastructures. As private cap-ital will keep increasing its participation in the investment and financing of infrastructure projects, we expect private capital will continue to increase for infrastructure projects and believe the sector will evolve and mature, becoming more institution-alized and transparent in the risk evaluation and available debt instruments – most probably a similar development as has been seen in the real estate market.
This is an extract from an interview with Tommaso Albanese, published in the October 2017 edition of Private Debt Investor magazine.
2 European Commission Fact Sheet September 2015
Infrastructure

1918
Spanning the spectrum
The low interest rate environment that has persisted since the global financial crisis has caused a wave of investments into private credit strategies. Investors, thirsty for yield, are willing to look outside the realm of traditional investments for differentiated ways to boost portfolio returns. At UBS Asset Management, our dedicated credit specialists are innovating within their space, leveraging the scale and size of a global bank to seek to meet investor needs.
In this article we discuss the varied approaches of our hedge fund capabilities at UBS Hedge Fund Solutions and UBS O’Connor. As a hedge fund allocator, UBS Hedge Fund Solutions is seeking risk premia by sourcing misunderstood collateral. Meanwhile, UBS O’Connor, a single-manager hedge fund, is tapping into resources across the bank to strive to deliver top tier lending strategies.
Hedge funds
The allocator: UBS Hedge Fund Solutions
UBS Hedge Fund Solutions (HFS) has over 20 years of experi-ence and offers a wide range of hedge fund solutions includ-ing commingled products, customized discretionary products, as well as portfolio advisory and strategic advisory services. As one of the world’s largest hedge fund intermediaries, HFS has developed the experience and infrastructure to support a global investment platform.
The investor: UBS O’Connor
UBS O’Connor (O’Connor) is a global single-manager hedge fund platform, offering its flagship multi-strategy fund with a 17 year track record, as well as standalone fund capabilities. O’Connor’s fundamentally-driven investment processes are supplemented with sophisticated quantitative decision support and risk management tools, seeking to protect investor capital during periods of market turmoil through active risk manage-ment.
Credit views from the hedge fund space

2120
Risk premia in credit markets comes in the form of either liquidity, or lack thereof, and complexity. In order to avoid crowding, we believe it’s necessary to canvas the world for opportunities where these risk premia converge with a dearth of capital. Liquidity, or credit availability, is plentiful, so we are typically finding these opportunities where the underlying collateral is misunderstood, difficult to source and/or expensive to originate – meaning that the true value investor must work harder make it through the crowd. At UBS Hedge Fund Solutions, we seek to benefit from our breadth of global resources to help source top tier managers and allocate capital to investments we feel offer attractive rewards relative to risk. Investing in this space is not easy, but we feel investors who have the experience and scale to efficiently vet a diverse set of opportunities will be rewarded in the long run.
Carry is King. BofA ML US High Yield Master II Index: Total Return Breakdown 2006–2017
50
100
150
200
250
2006 2007 2008 2009 2010 2011 2012 2013 2014 2015 2016 2017
Price Return Carry Return Total Return
Source: Bloomberg
Please note that the opinions expressed herein are those of UBS Hedge Fund Solutions, a subsidiary of UBS Asset Management. The following information is applicable as of the date of this report unless otherwise stated. It is believed to be reliable; however, its accuracy cannot be guaranteed. All such informa-tion and opinions are subject to change without notice.
Hedge funds
An allocator’s perspectiveFinding risk premia in late cycle credit marketsBruce Amlicke, Chief Investment Officer of UBS Hedge Fund Solutions and Head of Multi-Manager
1 Source: Bloomberg
– Years of aggressive monetary policy from central banks around the globe has yield-seeking investors moving down the credit spectrum.
– HFS believes that the “lower for longer environment” will continue for the foreseeable future; therefore, we continue to focus our credit portfolio around the “carry is king” philosophy, looking across corporate and asset-backed credit markets for the highest quality carry per unit of risk.
– We believe the ability to identify the relative attrac-tiveness between investment strategies in the Private Credit space is integral for investors today, and that in order to avoid crowding, it’s necessary to canvas the world for opportunities where risk premia converge with a dearth of capital.
Years of aggressive monetary policy from central banks around the globe has yield-seeking investors moving down the credit spectrum. Corporate high yield bonds are currently trading at the tightest spread levels seen within the past ten years. Cor-porations have taken advantage of the low-yielding environment, pushing leverage to all-time highs. We believe, however, that pockets of opportunity can exist even in the tightest conditions, and that sophisticated investors with the ability to allocate across geographies and asset classes who are also equipped to understand more complex strategies are better positioned.
Despite a strong market, the primary driver of returns across credit markets has been carry. Spread movement has added vola-tility but has failed to create value. Since 2011, carry has
accounted for over 100% of the return of the Bank of America High Yield Index.1 We believe that the “lower for longer environ-ment” will continue for the foreseeable future. Consequently, we continue to focus our credit portfolio around the “carry is king” philosophy, looking across corporate and asset-backed credit mar-kets for the highest quality carry per unit of risk.
While different credit sectors often follow the same cycles, there are divergences that can dramatically impact the quality of investor returns.
We believe there are three important factors that determine the relative health of credit markets and ultimately the quality of return that investors experience: collateral value, spreads and credit availability. While different credit sectors often fol-low the same cycles, there are divergences that can dramati-cally impact the quality of investor returns. For example, the underlying fundamentals and technicals of Residential Mort-gages and Commercial Mortgages could not be more different today; average spreads on Residential credit are wide on a rel-ative basis, the collateral value is stable to improving, and credit availability has never been tighter. The opposite could be said regarding Commercial Real Estate. We believe the ability to identify the relative attractiveness between investment strat-egies as varied as Private Corporate Lending, Peripheral Euro-pean Non-Performing Loans, and Legacy Residential Mortgage Backed Securities is integral for investors today.
Health check: credit markets
Collateral value Spreads Credit availability

2322
1 Preqin. Investor Outlook: Alternative Assets, H1 2017.
An increasingly diversified universe The private credit universe covers an increasingly broad range of illiquid debt instruments across a number of sectors. All of which provides investors with a relatively attractive and grow-ing opportunity set with diversification potential. Geographi-cally, the private credit universe also continues to broaden. Non-bank lending is well established in the U.S., though the private credit market is increasingly global in nature. Europe has also become an attractive source of deal flow as banks deleverage.
Ability to source remains key differentiatorIn our view, a rigorous and repeatable process is key to attract-ing new borrowers and in order to seek to generate consistent long-term returns. In a market where connectivity, credibility and the ability to underwrite fundamentals across a wide spec-trum of opportunities matters, scale and reputation are impor-tant drivers of success. The ability to source a diversified and differentiated pipeline of opportunities globally on an on-go-ing basis is absolutely fundamental to achieving attractive risk-adjusted returns. Therefore, private credit as a market favors strong global networks with proprietary sourcing chan-nels and strong market connections.
The complexity and lack of uniformity that makes private credit such an attractive risk-adjusted return proposition should be managed by a highly experienced and cohesive team with access to the resources of a global platform.
As we have seen, the private credit universe covers a broad array of different markets and opportunities. We believe that the optimal approach is client-specific and dependent on the end-investor’s individual requirements and attitudes to risk.
Offering diversification across sectors, asset classes, products, maturities and capital structure position – and underpinned by the relative scarcity of capital, the illiquidity premium and, on an individual security basis, further complexity and urgency premia – private credit, in our view, offers a compelling risk/reward tradeoff.
As an asset class, we see it playing an increasingly important role in a broad variety of investors’ portfolios going forward, and we think that on a risk-adjusted basis, it compares favora-bly to other more traditional alternative investments like pri-vate equity.
Hedge funds
An investor’s perspectiveDifferentiation to drive success in a private lending market gone mainstreamBaxter Wasson and Rodrigo Trelles, Co-Heads of Capital Solutions at O’Connor
– The imbalance in the supply and demand of credit caused by changing parameters for bank transactions post financial crisis has provided opportunities for pri-vate credit funds to offer faster and more tailored lending solutions.
– The private credit universe covers an increasingly broad range of illiquid debt instruments across a num-ber of sectors, providing investors with a relatively attractive and growing opportunity set with diversifi-cation potential.
– A rigorous and repeatable process, scale and reputa-tion, and a strong global network with proprietary sourcing channels and strong market connections are key components to attract new borrowers in order to seek to generate consistent long-term returns.
A new world of borrowingAs a response to the global financial crisis regulators took a more conservative approach to banking by increasing capital requirements, prohibiting certain types of transactions (e.g. proprietary trading) and changing the risk weight of different asset classes. As a result, banks pulled back and changed the parameters for transactions in certain markets. That pull back created an imbalance in the supply and demand of credit. Private credit funds are addressing that structural imbalance by offering faster and more tailored lending solutions that address the specific requests of borrowers. The ever-evolving banking lending gap is creating inefficiencies and dislocations across private credit markets. Particularly as bond yields remain at near historic lows, private credit offers attractive risk-adjusted returns and diversification potential relative to traditional publicly-traded-asset classes. Private credit also offers a poten-tial cash flow profile that is, in our view, well-suited to many pension and annuity funds where illiquidity of assets held is often less of a concern.
Attractive returns potential exceeds investor expectationsGiven these characteristics, private credit is receiving ever greater attention from institutional investors, and there has been signifi-cant fundraising in recent years. However, most of the fundrais-ing in private credit has been focused on mid-market direct cor-
porate lending. Unsurprisingly, yields in this area are under pressure as the asset class becomes more main stream.
Outside of standard mid-market corporate direct lending, a shortage of capital means that suppliers of credit are in a strong position with regard to yields, returns and deal structur-ing. Although they can vary widely depending on the bor-rower, asset backing, deal structure and position in the capital structure, coupons are typically in the 10% to 15% range.
The shortage of capital also means that deals are generally structured with more favorable terms and greater protections to the lender than is typically the case in covenant-light con-ventional bonds and loans. These protections typically include tight covenants and triggers and material overcollateralization. We believe such protections may be further enhanced by the detailed due diligence process that is undertaken prior to part-ing with capital. In a rising rate environment it is also worth noting that the majority of private credit is linked to floating rate structures.
Geographically, the private credit universe also continues to broaden. Non-bank lending is well established in the US, though the private credit market is increasingly global in nature.
According to a Preqin survey, 93% of investors feel that their private credit investments either met or exceeded expectations in 2016, an increase from 86% in 2015. In the same survey, approximately 62% of investors with existing private credit exposures revealed that they were intending to increase alloca-tions to private credit over the long-term. According to market data compiled by Preqin, private credit average net return fig-ures were positive for every annual vintage in the sample, stretching back over two decades from 2011.1

2524
Meeting the income challengeWhat are the possibilities for investors in search of more bespoke income solutions?Luke Browne, Head of Investment Specialists, Investment Solutions Stephen Friel, Investment Specialist, Investment Solutions
Ageing demographics, technology disruption, regulatory change, the ‘hangover’ from quantitative easing and almost a decade of rock-bottom base rates. These forces have funda-mentally altered the demand and supply of income. Against this backdrop, investors in pursuit of income in 2018 and beyond face substantial challenges and in some cases a difficult choice between re-adjusting income requirements in the face of low yields or accepting a higher degree of risk.
So what are the options available to income investors?
In an environment where global growth is improving and cen-tral banks are seemingly willing to look through inflation, cash may be market ‘risk-free’ but offers negative real returns and as such is not a viable long-term option.
High-quality, short-duration fixed income represents a logical next step from the negative real returns of cash in the devel-oped world. This provides a cash flow which is highly predicta-ble and, equally as important, regular. Capital volatility is pres-ently muted and the asset class remains liquid. Short-duration fixed income has many of the desirable characteristics of an income strategy – bar an attractive level of income and at the cost of opportunity for capital growth. This is exacerbated once the impact of inflation is taken into account.
By buying longer-dated fixed income instruments, it is possible to attain higher yields. Nevertheless, investors need to be mindful of the additional risks they are bearing in these circum-stances, as well as understanding that yields here too have fallen sharply in recent times.
Buying longer-dated high-quality fixed income and achieving a higher yield through earning a term premium may allow investors to retain the nominal value of their investment at maturity point in time in the future. However, should they have to sell the asset before maturity, it is possible that a mark-to-market loss could be realized. The low level of cou-pons on offer is unlikely to offer much protection to investors as rates normalize.
It is also possible to earn extra yield through bearing exposure to credit risk. That said, in addition to the risks above, this could subject investors to the lower liquidity of the corporate bond market and to trading costs that are markedly higher.
Indeed, exposure to default risk means there is no guarantee that an investor would maintain the nominal value of their investment even if they were able to hold it until maturity.
Utilizing a call-overwriting strategy is one way of bolstering the level of income received from equities while concurrently reducing sensitivity to market volatility
Equities offer a number of desirable characteristics for income strategies such as the opportunity for capital growth, and potentially higher future cash flows which may grow in-line with inflation. However, the income equities produce can be relatively infrequent and unpredictable. The underlying asset, while liquid, is vulnerable to price volatility. The most common way to generate income from investing in equities is to buy stocks with high, stable dividend payments. However, such assets carry a degree of ‘soft duration’: that is, they can exhibit some of the same price sensitivities as bonds to changes in interest rate expectations. Perhaps more importantly, such assets have been much sought after as investors chase yield and attempt to diversify their income sources away from fixed income. Given the momentum behind these allocations there are arguments that such strategies have become crowded and may not perform as desired as we navi-gate the changing macro landscape to come.
Utilizing a call overwriting strategy is one way of bolstering the level of income received from equities while concurrently reducing sensitivity to market volatility. This involves buying the underlying equity and simultaneously selling a call option writ-ten on the holding. The investor is effectively paid a premium to forego potential capital gains above a certain level thereby converting an unknown potential capital gain into a known (and frequent) cash flow. This represents a countercyclical source of income as the price of optionality, i.e. the premia earned, increases as market volatility increases.
Some real assets, such as real estate debt or infrastructure, can provide excellent sources of long-term income. Infrastructure projects are often in partnership with governments and/or are in highly regulated industries. Consequently they may offer
stable capital returns and relatively predictable levels of income that may also be inflation-linked. These assets do however carry a degree of ‘soft duration’ too. In an environment of nor-malizing bond yields, the future cash flows pre-determined in the contract may appear relatively less attractive. Additionally, accessing such asset classes can expose an investor to mean-ingful illiquidity risk.
A gamut of alternative options have proliferated to meet investor income demand. One such example is insurance- linked securities. Attractive premiums can be captured by offering reinsurance pro-tection against natural and other disasters. With insurance-linked securities, investors receive annual premia and a measure of capi-tal growth in non-event years, which is drawn on by insurers depending on the magnitude and frequency of catastrophic events. These securities are often relatively high up the capital structure and may also enjoy a degree of immunity from the effect of a rising interest rate environment. The occurrence of a natural disaster is, quite intuitively, uncorrelated with the perfor-
mance of other asset classes, so insurance-linked securities can offer substantial diversification benefits to an income-focused strategy. Ultimately, an investor is exposed to the credit and selec-tion risk of both the insured party and the insurance company. It should be noted that these types of investments can be subject to sudden and – by definition – unpredictable losses in value.
Ultimately, no single asset offers a panacea for the challenges that face income investors – different asset classes offer differ-ent characteristics which vary through the course of a market cycle. This in itself creates a governance challenge for many. The shape of an income strategy comes down to investor tol-erances to the trade-offs that exist between absolute level of income, capital growth, volatility, and liquidity amongst others.
With the challenge of delivering attractive risk-adjusted income becoming more acute, we see more diversified income strategies and tailored income solutions increasingly coming into focus across a range of client types.
Investment solutions
Considerations for a viable income solution
Income Consideration Cash
Nominal Govt Bonds
Inflation- linked Govt Bonds
Investment Grade Corporate Bonds
High Yield Corporate Bonds Real Assets Equities
Stable & predicatable cash flowFrequency of cash flowSize of cash flow
Growth considerationsCapital growthVolatility of capital
Other considerationsInflation protectionLiquidity of underlying
Low Medium High Source: UBS AM. For illustrative purposes only. Note: Color definitions are reversed for Volatility of Capital.

The search for attractive risk- adjusted capital growth

2928
The age old issueHow demographic forces are shaping the long-term investment opportunity set Jonathan Davies, Senior Portfolio Manager, Investment Solutions
– Developed markets face a dual challenge of ageing populations and declining fertility
– As Baby Boomers reach retirement, can their shift from saving to consumption relieve downward pressure on global interest rates?
– Emerging market demographics have been fundamen-tal to the long-term investment case for the region
According to the United Nations’ latest population forecasts, the number of individuals over 65 globally will grow by just under one billion people between 2015 and 2050. Perhaps more importantly, the ratio of over 65s to the working popula-tion is forecast to double globally to 32% by 2050.
In developed nations the demographic challenge of increasing longevity and falling fertility rates is particularly acute. In aggregate, the ratio of over 65s to the working population is forecast to exceed 50% by 2050, or 1 retiree for every two workers. In Japan, the UN forecasts that there will be nine retirees for every ten workers by 2050.
For longer term investors we believe these figures are impor-tant with major long-term implications for savings and con-sumption, growth, inflation, monetary policy, and on demand for asset classes.
Basic economic theory says a smaller workforce, all else being equal, reduces potential output. The most obvious takeaway from the stark UN population projections is therefore that demographic forces are likely to act as a material downward force on economic growth in the developed world as the labor force reduces both in absolute terms and relative to old and young dependents alike.
But while the impact of ageing populations on demand seems relatively straightforward in the main, the likely impact on interest rates of the Baby Boomers’ inevitable progress from working age saving to retirement consumption – and of the timing of the so-called “demographic cliff” – is more complex.
The abundance of capital globally has been driven in the main by the Baby Boomers’ savings, by wealth effects and by strong capital creation in China and oil-producing emerging countries. According to the US Federal Reserve, this savings
glut relative to labor has suppressed global interest rates by depressing the return on capital and causing aggregate investment to decline.
But with the Baby Boomers shifting to spending not saving and capital flows from these emerging market sources now reversing, are the downward pressures on global interest rates now lifting? The increasing scarcity of labor and the increased propensity of ageing populations to consume would logically, all else being equal, exert upward pressure on wage growth, inflation and therefore on long bond yields.
However, this has categorically not been the experience to date in Japan, where the proportion of over 65s to working age population has already risen sharply. Wage growth and inflation in other developed economies also remains muted despite very low unemployment rates, a shrinking workforce and the prospect of further reductions in the workforce.
Improved health, the elimination of compulsory retirement and low annuity rates all mean that people are likely to work longer in developed economies and save more – softening to an extent the “demographic cliff” of the Baby Boomers’ retirement.
The abundance of capital globally has been driven in the main by the Baby Boomers’ savings, by wealth effects and by strong capital creation in China and oil-producing emerging countries.
A key implication from Japan’s experience to date is that there may be changes to the size of the labor force rather than changes to savings that play the key role in driving investment in developed economies. With the UN forecasting further reductions in working age populations across the developed world we believe that ageing populations increase the likeli-hood that official policy rates and longer-dated market interest rate measures in developed markets will stay low for a pro-tracted period in an historical context.
These pressures may be exacerbated by demographic develop-ments elsewhere, most notably in China, where the UN expects the number of working age people in China to fall by around 160 million between 2020 and 2050.
Market impactIn emerging markets the demographics story is diverse and nuanced. Positive demographic trends in aggregate have been a fundamental part of the long-term emerging market invest-ment case at a top down level for a number of years. These trends also offer, we believe, attractive long-term opportunities on a bottom-up basis.
From an asset allocation perspective, lower growth potential in the developed world driven by demographics clearly equals lower profits growth potential without any expansion in mar-gins, a potential negative for equities that is offset by the ben-efit of a lower cost of capital. However, we believe the major impact is likely to come from the demand for asset classes.
In particular, we believe that Baby Boomer retirement savings have played a key role in supporting equity prices over the past two decades. As they retire and seek to draw down their accrued wealth in line with observed practice, it seems only logical that Baby Boomers will reduce their equity holdings in favor of cash and quasi-cash instruments and that equity risk premiums should rise.
For the same reasons we see continued downward pressure on bond risk premia relative to equities and see the forces of low growth and low investment prevailing in the long-term over any upward pressure on government bond yields due to scarce labor as the balance between capital and labor in the economy is gradually realigned.
The concepts of secular stagnation and lower for longer driven by ageing populations are hardly new, but we see demograph-ics as still having a major role across economies and markets for the foreseeable future.
In short, demographics may be an age old problem, but that does not make it old news for markets.
Exhibit 1: Developed World Retirees (Over 65s) to Working Age (25–64) Population (UN Estimates post 2015)
0%
10%
20%
30%
40%
50%
60%
1950 1960 1970 1980 1990 2000 2010 2020 2030 2040 2050 0
100,000
200,000
300,000
400,000
500,000
600,000
700,000
800,000 ,000s
25–64 65+
Percentage of over 65s to 25–64 Percentage of Over 65s to overall population
Source: United Nations Population Division, as of June 2017
Exhibit 2: Selected Emerging Countries Retirees (Over 65s) as % of Working Age (25–64) Population (UN Estimates post 2015)
0%
10%
20%
30%
40%
50%
60%
1950 1960 1970 1980 1990 2000 2010 2020 2030 2040 2050
China India
Nigeria Brazil
Source: United Nations Population Division, as of June 2017
Macroeconomics

3130
Emerging market equities: an increasingly domestic growth story The changing face of emerging marketsGeoffrey Wong, Head of Global Emerging Markets and Asia Pacific Equities
– Forecasts suggest earnings growth in emerging markets in 2017 will be strongest since 2010
– EM growth is being driven increasingly by domestic demand and intra EM trade
– Within EM equity markets, secular growth sectors such as IT and consumer are displacing ‘old EM’ commodity sectors
– Growing evidence that some EM economies are moving firmly up the value chain
The EM equities recovery that began in 2016 has continued its strong run year-to-date in 2017. While valuations have re-rated somewhat, they remain attractive relative to devel-oped markets and broadly in line with their own historical average at 1.8x Price to Book (MSCI EM). Instead, 2017 so far has been an earnings recovery story with consensus¹ earnings growth forecast to exceed 20% for year-end 2017. This would mark the strongest pace of earnings growth since 2010. While part of this uplift is attributable to a recovery in the commodity sectors, a key driver has been strong perfor-mance from domestically-oriented companies like education, e-commerce and insurance.
Exhibit 1: Earnings growth is on track for a reboundMSCI EM Trailing EPS (in USD)
0 2003 2005 2007 2009 2011 2013 2015 2017E
10
20
30
40
50
60
70
80
90
100
Source: FactSet, UBS Asset Management, estimates as of October 4, 2017
We believe the upcycle for EM will continue over the next few years – a cycle which looks set to highlight the changing face of EM. EM equities are increasingly a domestic play, fueled by secular growth sectors like internet and consump-tion. The trend is moving away from highly cyclical indus-tries; the combined weight of energy and material sectors declined from 35+% in 2008 to 14% per end of September 2017 (MSCI EM). This dynamic is also reflected in trade which is progressively intra EM (41% of total in 2016 as opposed to 26% in 2000 – FactSet). One reason for this has been the move up the value chain for certain EM economies including China’s dominant share of world high value-added exports like high-tech and services. Meanwhile demograph-ics remain supportive of EM over DM as the average working age population continues to grow and incomes rise. These changes should result in increasing EM stability (by reducing the impact from potential external shocks) and growth over the coming years.
¹ Source: FactSet as at October 2017
Exhibit 2: EM equities more of a domestic play today with bigger emphasis on secular growth sectorsMSCI EM Sector weights (in %).
5
10
15
20
25
30
35
40
2007 2008 2009 2010 2011 2012 2013 2014 2015 2016 2017
Energy and Materials IT Industrials, Utilities and Telecoms Consumers Financials and Real Estate
MSCI sector weight (in %)
Source: UBS Asset Management, FactSet, as of September 29, 2017
Looking at the countries, the Chinese economy seems to have stabilized and while many structural challenges remain, most notably the rapid increase in debt, we think they will result in lower medium-term growth rather than pose crisis risks. The rebalancing of the economic structure towards a service-led economy will continue to provide investment opportunities across service sectors such as e-commerce, e-payments, social media, education and insurance. In the near-term, there were no major surprises from the recently concluded National Peo-ple’s Congress, not least as social stability remains the number one priority of the Chinese government.
India’s measures to formalize the economy make India an attractive long-term story. These include the launch of the Goods and Services Tax (GST), the digitization of some trans-actions and processes, along with a proactive enforcement of tax evaders. In the nearer term, corporate earnings have been disappointing but markets have held up surprisingly well due to local liquidity support. We retain exposure to several businesses with solid long-term growth prospects trading at attractive valuations, including Indian financials, consumer names and refiners.
Similarly, South-East Asia displays favorable secular domestic growth drivers. We see signs of recovery in Indonesia and Thailand, particularly when infrastructure projects get under-way and the government provides more stimulus support. We currently see opportunities in both countries across quality bank franchises and in a leading beverage company.
EM equities are increasingly a domestic play, fueled by secular growth sectors like internet and consumption.
In Korea, we are monitoring progress on ‘chaebol’ reform which could translate to better corporate governance among listed corporates and the large, conglomerate ‘chaebol’ in particular. We are also watching the Sino-Korea relationship closely. We hope to see the Korean economy maintain the large current account surpluses of the recent few years – a testament to the economy’s rising technology-driven com-petitiveness. Our bottom-up research finds several businesses with solid long-term growth prospects trading at attractive valuations, including Korea’s largest IT company.
Emerging market equities

3332
Outside Asia, improving commodity prices have provided relief for many countries. Interest rates are being cut as a result of falling inflation. Meanwhile consumption and investment are picking up. This includes Russia where the cycle has turned, both in terms of economy and earnings growth thanks in part to oil price stabilization. We find value in several stocks. We believe there are potential opportunities as a result, including in Russia’s financial and food service sectors, where we see consumption buoyed by falling inflation which helps restore purchasing power. Market volatility however might remain ele-vated on the back of geo-political developments.
In Brazil, the economy is recovering. Activity indicators are picking up and low inflation continues to be supportive of fur-ther rate cuts, which in turn will boost the economy. Mean-while reforms seem on track, despite ongoing political noise and an increasing focus on next year’s presidential election. We maintain our exposure to Brazil’s financial sector via pri-vate banks which remain our favorite economic recovery play.
Mexican assets have performed well year-to-date as risks around adverse US trade policy abated and economic activity proved resilient. We continue to find opportunities in Mexico’s financial sector which have good structural growth prospects given low loan penetration vs GDP and pick-up in credit demand. Top down, the economy should see only a modest slowdown from 2016. Notwithstanding this, some risks remain given 1) we are entering an election cycle, and 2) possible trade disputes with the US.
In South Africa, stronger commodity prices did not translate to better economic momentum given elevated political uncer-tainty. Growth will remain constrained in the short to mid-term given the lack of reforms and investment. We are exposed to broader EM themes like internet plays via SA domiciled or SA listed companies.
We view EM equities as an attractive long-term proposition at current valuations. Continued improvement in corporate earn-ings and profitability, an improving economic backdrop and a transition in the fundamental forces driving EM should prove to be drivers of the asset class in the mid-term.
India’s measures to formalize the economy make India an attractive long-term story.
Emerging market equitiesEmerging market equities

3534
1 R&D: Source: OECD, Morgan Stanley Research, as of Dec 2015. Updated September 2017
Forging a new pathThe underappreciated opportunities in China equitiesBin Shi, Portfolio Manager, Greater China Fund
– Compelling opportunity set despite slowing GDP – Growth rates in new economy sectors are robust and sustainable
– Greater focus on high value-added exports; technol-ogy sector is key as China rebalances its economy
– Market liberalization and reforms offer investors greater access than ever before
When it comes to Chinese equities many investors remain on the sidelines despite what we believe are underappreciated opportunities.
To reach the next stage of economic development, China is forging a different growth path, focusing on higher-end manufacturing, innovation, domestic demand and services.
China’s GDP growth is slowing from the double digit percent-age growth rate of a few years ago to an expected 6.5%–7% in 2017. While we believe China’s GDP growth will continue slowing gradually as the economy rebalances, this should not worry investors unduly. We see these developments as evidence of the authorities’ determination to mould a more balanced economy and achieve a more sustainable and less volatile growth rate. Despite a slowing economy, the opportu-nity set within the equity universe for investors who can identify the right sectors and companies is still compelling.
Much of the structural drag on China’s economy is centered in its state-owned enterprises and their high debt levels. In con-trast, privately owned companies in China are expanding rap-idly with little or no debt. These companies are heavily concen-trated in the new economy consumer-driven sectors that we believe will continue to grow at a faster pace than developed markets over the next few years.
These tertiary (service-led) industries overtook secondary man-ufacturing industries in 2011 to make up the largest share of GDP and they continue to grow swiftly. We believe this shift is a clear indication that the Chinese economy is meeting its goal to become more balanced, driven increasingly by service and consumption. These developments bring both challenges and opportunities.
To reach the next stage of economic development, China is forging a different growth path focusing on higher-end manu-facturing, innovation, domestic demand and services. China exports its high value-added goods, including pharmaceutical, electronic data processing and office equipment around the world. Currently, the high-value added exports already make up over 50% of China’s manufacturing exports. The increasing use of technology encourages further innovation. The coun-try’s research and development as a percentage of GDP now exceeds 2%, closing the gap between the 2.8% of the US and surpassing the UK rate of 1.7% recorded in 2015.1
China is now exporting more high value-added2 goods Share of world high value-added exports
5
10
15
20
25
30
35
40
2007 2008 2009 2010 2011 2012 2013 2014 2015 2016 2017
Energy and Materials IT Industrials, Utilities and Telecoms Consumers Financials and Real Estate
MSCI sector weight (in %)
Source: UN, IMF, Morgan Stanley Research, data as of 2015. Research as of 2017. As defined by United Nations: 2 High value-added exports: pharmaceutical, electronic data processing and office equipment, telecom equipment, integrated circuits and electronic components, transport equipment and other machinery (power genera-ting, non-electrical, and electrical machinery categories). Low value-added: Non-resource: agricultural products, steel and iron; Resource: fuel and mining. Medium value-added: Textile and clothing
On top of that, China is gradually opening the doors of its capital markets, liberalizing and reforming to give foreign investors access to domestic equity and fixed income markets. These reforms include the Qualified Foreign Institutional Inves-tor (QFII) and Renminbi Qualified Foreign Institutional Investor (RQFII) designations. The Shenzhen-Hong Kong (SZ-HK) Stock Connect was launched in December 2016, following in the footsteps of the Shanghai-Hong Kong (SH-HK) Stock Connect implemented in November 2014 to enhance connectivity between the mainland and Hong Kong stock markets. In our view, these represent major steps towards the liberalization of Chinese equities.
For international investors, China is becoming more and more accessible. Due to its sheer size alone, we believe investors need to focus on China more than ever. A changing China has offered significant opportunities in the past. We do not expect the coming years to be any different.
China equities
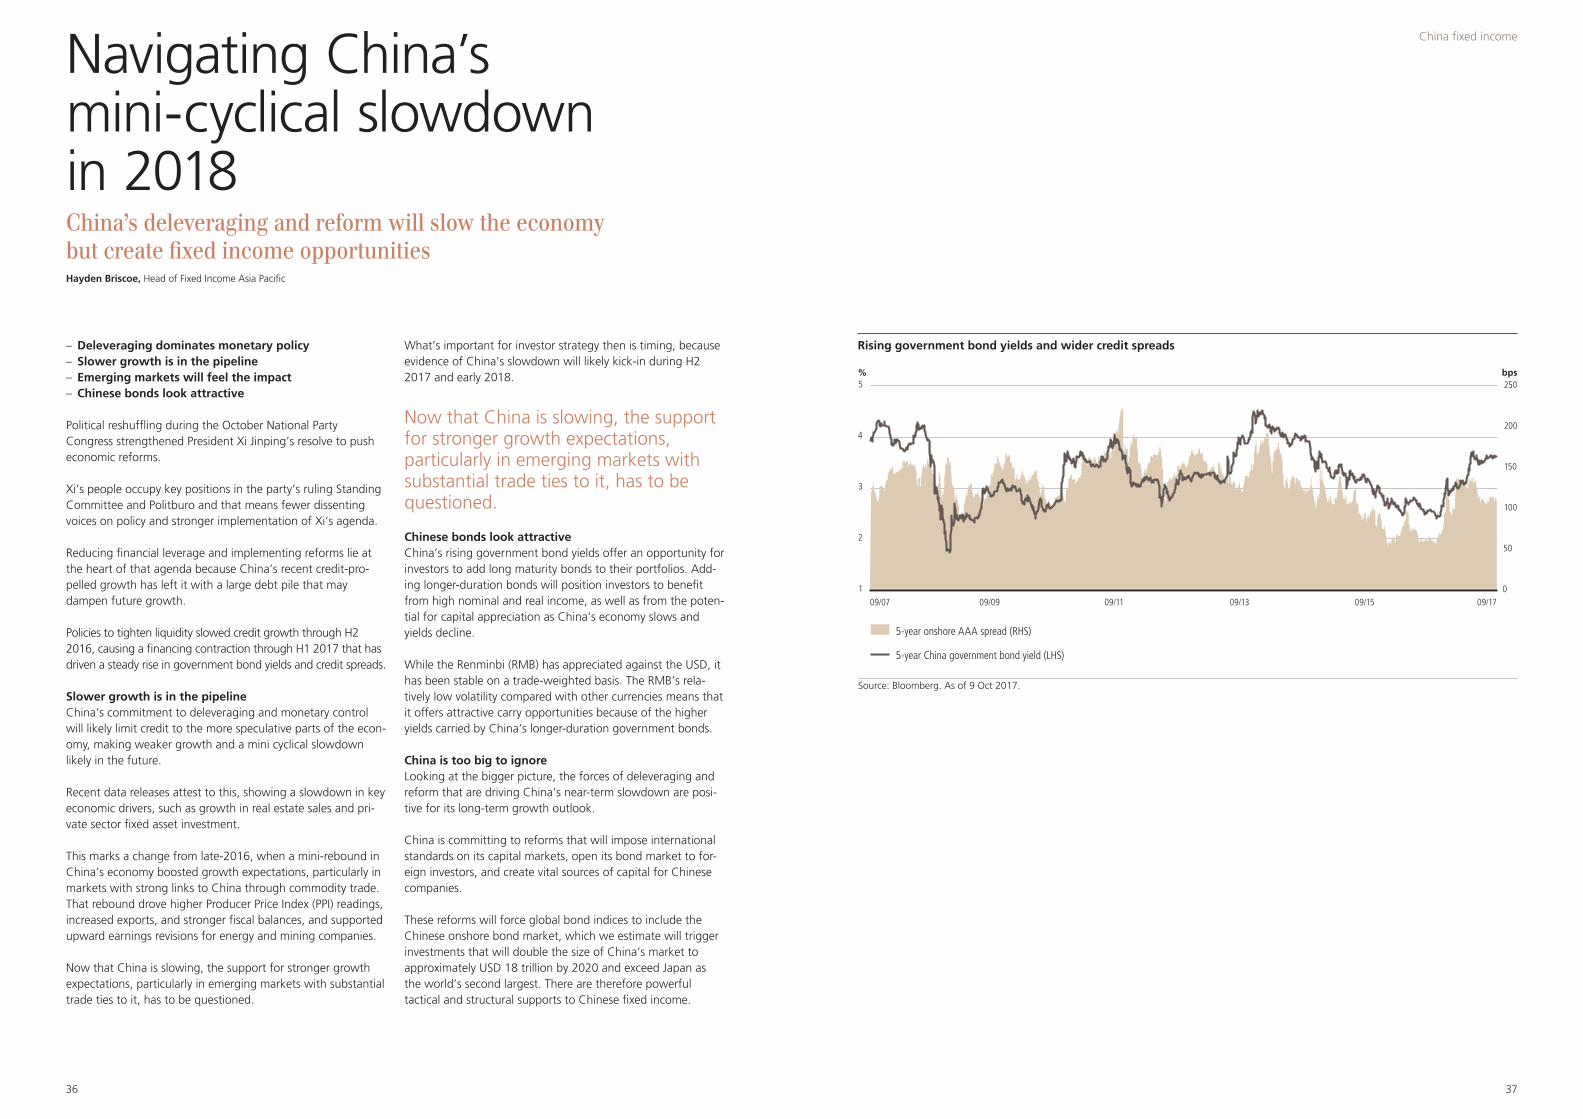
3736
Navigating China’s mini-cyclical slowdown in 2018China’s deleveraging and reform will slow the economy but create fixed income opportunities Hayden Briscoe, Head of Fixed Income Asia Pacific
– Deleveraging dominates monetary policy – Slower growth is in the pipeline – Emerging markets will feel the impact – Chinese bonds look attractive
Political reshuffling during the October National Party Congress strengthened President Xi Jinping’s resolve to push economic reforms.
Xi’s people occupy key positions in the party’s ruling Standing Committee and Politburo and that means fewer dissenting voices on policy and stronger implementation of Xi’s agenda.
Reducing financial leverage and implementing reforms lie at the heart of that agenda because China’s recent credit-pro-pelled growth has left it with a large debt pile that may dampen future growth.
Policies to tighten liquidity slowed credit growth through H2 2016, causing a financing contraction through H1 2017 that has driven a steady rise in government bond yields and credit spreads.
Slower growth is in the pipelineChina’s commitment to deleveraging and monetary control will likely limit credit to the more speculative parts of the econ-omy, making weaker growth and a mini cyclical slowdown likely in the future.
Recent data releases attest to this, showing a slowdown in key economic drivers, such as growth in real estate sales and pri-vate sector fixed asset investment.
This marks a change from late-2016, when a mini-rebound in China’s economy boosted growth expectations, particularly in markets with strong links to China through commodity trade. That rebound drove higher Producer Price Index (PPI) readings, increased exports, and stronger fiscal balances, and supported upward earnings revisions for energy and mining companies.
Now that China is slowing, the support for stronger growth expectations, particularly in emerging markets with substantial trade ties to it, has to be questioned.
What’s important for investor strategy then is timing, because evidence of China’s slowdown will likely kick-in during H2 2017 and early 2018.
Now that China is slowing, the support for stronger growth expectations, particularly in emerging markets with substantial trade ties to it, has to be questioned.
Chinese bonds look attractiveChina’s rising government bond yields offer an opportunity for investors to add long maturity bonds to their portfolios. Add-ing longer-duration bonds will position investors to benefit from high nominal and real income, as well as from the poten-tial for capital appreciation as China’s economy slows and yields decline.
While the Renminbi (RMB) has appreciated against the USD, it has been stable on a trade-weighted basis. The RMB’s rela-tively low volatility compared with other currencies means that it offers attractive carry opportunities because of the higher yields carried by China’s longer-duration government bonds.
China is too big to ignore Looking at the bigger picture, the forces of deleveraging and reform that are driving China’s near-term slowdown are posi-tive for its long-term growth outlook.
China is committing to reforms that will impose international standards on its capital markets, open its bond market to for-eign investors, and create vital sources of capital for Chinese companies.
These reforms will force global bond indices to include the Chinese onshore bond market, which we estimate will trigger investments that will double the size of China’s market to approximately USD 18 trillion by 2020 and exceed Japan as the world’s second largest. There are therefore powerful tactical and structural supports to Chinese fixed income.
Rising government bond yields and wider credit spreads
0
50
100
150
200
250
1
2
3
4
5
09/07 09/09 09/11 09/13 09/15 09/17
%
5-year onshore AAA spread (RHS)
5-year China government bond yield (LHS)
bps
Source: Bloomberg. As of 9 Oct 2017.
China fixed income

3938
The beat goes onBut careful security selection required after recent spread tightening in emerging marketsUta Fehm, Senior Portfolio Manager, Emerging Market Debt
– Positive growth dynamics and reform impetus offer continued fundamental support to the asset class
– Central bank balance sheet unwinding in developed markets could pose headwinds
– Nimble, discriminatory and opportunistic risk taking is likely to be a more productive approach going forward
Investors in emerging market (EM) debt have enjoyed strong returns in 2017 to-date. In the main we believe this reflects the global sweet spot of low inflation and synchronized economic recovery which makes the global monetary policy tightening cycle far less threatening for potentially riskier EM currency carry trades. Low and declining volatility across the asset class has further encouraged investors in an environment in which yields and spreads have continued to decline.
Tighter spreads and lower yields have not deterred record inflows of USD 91.7 billion1 into EM credit, rates and curren-cies. Clearly emerging markets are quite popular again with cross-over and dedicated investors alike.
Fundamentally, we still have a constructive view on emerging markets based on positive growth dynamics and reform impe-tus. Going forward our baseline scenario is one of positive but more subdued returns in an environment characterized by increasing volatility and relatively crowded positioning in EM.
In particular, we see a benign external environment devoid of policy shocks and volatility as the key driver to the perfor-mance of emerging market asset classes. We believe it is only in such a benign environment that carry trades are likely to continue their recent strong performance trend.
There are also risks to this low volatility environment that have the potential to derail what has been a strong year for EM debt. Developed market central banks are in the early stages of undoing one of the most unique monetary expansions in modern times, one that involved an unprecedented monetary quantitative expansion coupled with a negative nominal price for money in several parts of the world. We are skeptical that such a transition, however gradual and carefully managed it may be, will have no impact on global volatility or asset prices.
Against such a backdrop we believe that a more nimble, dis-criminatory and opportunistic risk-taking approach is likely to be more productive than a pure long beta strategy. This is because these global monetary policy trends have the potential to make emerging markets’ currency positions far more diffi-cult and volatile while also shocking rates – particularly in low carry countries. The prospect of higher interest rates in the US, the unveiling of the roadmap for the tapering of asset pur-chases by the ECB and the potential fiscal stimulus in the US are important hurdles.
In particular, we see a benign external environment devoid of policy shocks and volatility as the key driver to the performance of emerging market asset classes.
In emerging market sovereign credit, spreads have tightened and largely compensated for higher US Treasury yields. How-ever, given the starting point is already tight, credit remains vulnerable to further sell-offs. Taking the stable, but somewhat slow economic environment, political and technical pictures into account, current spreads seem tight compared to the embedded risk factors. While our longer term outlook remains positive, we are looking for opportunities to further reduce risk in EM sovereign credit on a short-term horizon.
Valuations in EM corporate debt have also become less attrac-tive based on the recent impressive tightening cycle. The next couple of months are likely to require nimble stock picking to drive returns rather than a broader and more generalized ‘beta’ exposure. Technicals should remain supportive as long as the global search for yield continues. On the supply side, we expect net new corporate issuance to be manageable in an environment of increasing maturities in 2017 and beyond.
1 Source: JPMorgan as at September 30, 2017
Emerging market debt
Fundamentally, we still have a constructive view on emerging markets based on positive growth dynamics and reform impetus.

4140
The SI performance debateDoes incorporating sustainability factors enhance investment returns?Christopher Greenwald, Head of SI Research, Sustainable and Impact Investing
– Research indicates sustainability information can lead to better risk-adjusted returns by limiting down-side risks
– The most encouraging results are seen when the impact of sustainability on financial performance is viewed over a long-term timeframe
– An integrated screening approach which combines sustainability and financial data as part of the invest-ment screening process can demonstrate a positive impact on performance
Understanding the relationship between sustainability and financial returns has been central to discussions around the integration of sustainability over the past two decades. Evi-dence from recent research into the positive impact of sustain-ability on financial performance has been encouraging. Meta-studies of the academic literature confirm that integrat-ing sustainability does not harm performance. In fact, sustaina-bility information can lead to better risk-adjusted returns by reducing the downside risks.1
The latest studies suggest the most promising results are found when the impact of sustainability on company financial perfor-mance is examined over a long-term timeframe. This fits with the longer-term nature of sustainability performance metrics.2 There has also been greater recognition of the importance of ‘materiality’, or the sector specific differences in the relative impacts of sustainability metrics on corporate financial perfor-mance3. Research suggests that integrating sustainability into the investment process can have the greatest positive impact on financial returns when it focuses on a more limited set of the most material sustainable factors per sector and industry.
While these conclusions have been encouraging and have clearly contributed to the growing interest in sustainability among investors, surveys of asset owners reveal persistent
concerns that incorporating sustainability can harm returns and is therefore inconsistent with fiduciary duty. These con-cerns are one of the main obstacles preventing institutional investors from adopting sustainable investment strategies4. We suggest they are due not to a lack of academic evidence but rather the failure of mainstream asset managers to offer insti-tutional-level quality strategies that integrate sustainability. Historically, sustainable investment products have tended to be offered by smaller, boutique asset managers, who lack the size and scale to offer institutional clients larger mandates that integrate sustainability into the core investment process. By integrating sustainability into their underlying financial research and investment processes, large, global asset manag-ers have a unique opportunity to fill this gap in the market and facilitate a wider adoption of sustainable investment strategies by providing asset owners with more opportunities to incorpo-rate sustainability into their core asset allocations.
Furthermore, we believe that integrating sustainability data with their own financial research allows asset managers to demonstrate the positive performance impact of an integrated screening approach, as opposed to viewing sustainability per-formance in isolation.
The latest studies suggest the most promising results are found when the impact of sustainability on company financial performance is examined over a long-term timeframe.
Any convincing actively managed strategy integrating sustaina-bility will employ a screening of both the sustainability and the financial performance of companies prior to investment. Within the UBS Sustainable Equity team, such a combined screening is
1 For a summary of recent academic literature, See UBS Global Research, “Academic Research Monitor: ESG Quant Investing,” 14 December, 2016. For a comprehensive recent overview of academic research, see Friede, G., Busch, T., & Bassen, A. (2015) ESG and financial performance: aggregated evidence from more than 2000 empirical studies, Journal of Sustainable Finance & Investment, 5:4, 210-233 2 See for example Eccles, Robert E., Ioannou, Ioannis, and Serafeim, George (2014) “The Impact of Corporate Sustainability on Organizational Processes and Performance.” Journal of Management Science, 60:11, 2835-2857. 3 See for example Khan, Mozaffar, Serafreim, George, and Yoon, Aaron (2016), “Corporate Sustainability: First Evidence on Materiality” The Accounting Review, Vol. 91 pp. 1697-1724 4 See OECD, “Investment governance and the integration of environmental, social and governance factors” (2017), www.oecd.org/cgfi/resources
employed by combining the proprietary UBS sustainability equity score with the alpha potential signal from the UBS global equity research framework to identify companies that are both attrac-tively valued from a relative valuation perspective and have a strong sustainability profile. These companies have the greatest upside potential given their current valuation, and less downside risk given the quality of management and best practices dis-played by their strong sustainability performance5.
Our own initial quantitative research confirms the positive perfor-mance resulting from a screening that combines both the sus-tainability performance and the financial valuation of companies.
As the chart below shows, companies with a strong sustainability profile demonstrated superior returns, with particularly strong out-performance when combined with the UBS proprietary valu-ation framework (GEVS Alpha). This relationship was stable across sectors and time periods. Most significantly, companies with strong governance profiles outperformed companies with poor governance by an average of 12 basis points per month. This research is not only consistent with more general academic research around the benefits of sustainability in mitigating downside risks, it also illustrates the alpha potential that asset managers can demonstrate by combining sustainability signals with their own proprietary financial research frameworks.
5 Preliminary back test results comparing our scoring methodology against the MSCI ACWI World Index benchmark during the period from January 1, 2010 to December 31, 2015. Exhibit 2 on page 36 compares the performance of those stocks in the MSCI ACWI index that are ranked at or above the 6th decile (High Alpha) or below the 6th decile (Low Alpha) using UBS Asset Management’s proprietary valuation database, and either at or above the 6th decile (High ESG) or below the 6th decile (Low ESG) in governance factors according to UBS Asset Management’s ESG database. The results of the back test are presented for illustrative purposes only, are developed with the benefit of hindsight and have inherent limitations as the results are based on historical analyses and numerous assumptions. The results do not represent actual trading using client assets and are not based on the results of any actual strategy managed by UBS Asset Management. The results may not reflect the impact of economic and market factors might have had on UBS Asset Management’s decision making if actual client assets were managed during the time periods portrayed. The results are not an indication, assurance, estimate or forecast of future results.” T-stat (number in parentheses) = a statistical measurement to determine the statistical significance of an event. Instrument Count=num-ber of stocks in category.
Exhibit 1: Narrowing down the selection set for portfolio construction
610
AttractiveExpensive
Valuation rankings from financial data
Suss
tain
abili
ty r
anki
ng
s fr
om
no
n-fi
nan
cial
dat
aWatch & avoid
Monitor & patience
Stay engaged
Low
deci
le
High
Primary focus
Source: UBS Asset Management
Sustainable and impact investing

4342
Exhibit 2: Good governance is a potential marker for out-performance
0 – Low Alpha 1 – High Alpha
1 – High ESG Monthly Excess Return % (T-Stat): +0.08 (0.798)
Instrument Count: 376
Monthly Excess Return % (T-Stat): +0.16 (1.248)
Instrument Count: 378
0 – Low ESG Monthly Excess Return % (T-Stat): -0.04 (-0.446)
Instrument Count: 327
Monthly Excess Return % (T-Stat): +0.04 (0.371)
Instrument Count: 316
Wealth Series: UBS ESG/GEVS Alpha
2010
1.0
1.1
0.9
1.2
2011 2012 2013 2014 2015 2016 2017
High Alpha / High ESG
High Alpha / Low ESG
Low Alpha / High ESG
Low Alpha / Low ESGRel
ativ
e W
ealt
h S
erie
s
Quadrants: ESG/Alpha
Source: UBS Asset Management. Note: The results of the back test are presented for illustrative purposes only, are developed with the benefit of hindsight and have inherent limitations as the results are based on historical analyses and numerous assumptions. The results do not represent actual trading using client assets and are not based on the results of any actual strategy managed by UBS Asset Management. The results may not reflect the impact of economic and market factors might have had on UBS Asset Management’s decision making if actual client assets were managed during the time periods portrayed. The results are not an indication, assurance, estimate or forecast of future results. T-stat (number in parentheses) = a statistical measurement to determine the statistical significance of an event. Instrument Count=number of stocks in category.
Sustainable and impact investing
Consequently, while recent academic research provides a solid case for sustainability integration, currently most opportunities lie in translating this potential into convincing investment strat-egies. Ultimately, investment out-performance is not derived from any single set of data – be it sustainability or financial. That out-performance comes from the application of all rele-vant data in a clear and consistent investment process by skilled analysts and portfolio managers with a proven track record, and from global insights into macro-economic trends and developments at companies.
Large, global asset managers are uniquely positioned to utilize their extensive financial resources and combine them with sus-tainability expertise in order to develop sustainable investment strategies with the scale and quality that larger institutional investors require. This combination represents the basis for establishing confidence among institutional investors that they can integrate sustainability while maintaining or even enhanc-ing their financial returns, and therefore that the integration of sustainability is not only consistent with, but ultimately required by, their fiduciary obligations.
Sustainable and impact investing

4544
Smart beta in 2018Will rising yields see a shift to the value factor?Ian Ashment, Head of Systematic & Index Investments Boriana Iordanova CFA, Index Analyst, Systematic & Index Investments
– A rising interest rate backdrop, led by the US, likely to benefit value stocks
– Blending alternative beta indices to capture varying equity factors can potentially reduce performance cyclicality while offering diversification benefits
– Empirical evidence suggests that value factor outper-forms market factor over the long-term
Until a decade ago, investors were able to access factor expo-sures via active/quant management. Typically this came at a higher cost. The rise of alternative beta indices has changed this, enabling investors to access factors in a cost effective manner via simple, transparent, rules-based instruments. We estimate that currently over USD 450 billion1 of assets globally are tracking alternative beta indices, with FTSE Russell’s latest annual survey of asset owners worldwide2 indicating that 71% of asset owners globally have implemented or are evaluating alternative beta.
What does 2018 hold for the main factors? Following a dec-ade of record low interest rates, monetary authorities in the US and in the UK have signaled an end to quantitative easing. Historically, rising interest rates have tended to favor value stocks. To a large extent this is because in such an environment investors typically rotate away from growth, but also because rising interest rates usually favor financial stocks – a classic value sector. Value exposure can be embedded in the index construction methodology, as stocks are selected and/or weighted by fundamental metrics such as sales, dividend, earnings, book value, etc. In addition to scalability and capacity, value indices tend to provide rebalancing benefits by selling outperformers and buying underperformers.
Another situation that investors might want to consider in the coming year is the potential return of geopolitical risks and populism. Although these risks have somewhat subsided recently, they have not disappeared. Such an environment
1 UBS Asset Management estimate based on data sourced from third party index providers and external databases. Data as of May 2017. 2 FTSE Russell, Smart beta: 2017 global survey findings from asset owners, May 2017 (survey of 200 asset owners worldwide).
Exhibit 1: Alternative beta index performance tends to be cyclical Equity factors typical performance pattern vs. market during business cycle phases
Pro-cyclical Expansion Contraction
Value
Size
Defensive
Volatility
Quality
Alternative beta indices vs. market: 1 year rolling relative monthly return
-20
-15
-10
-5
0
5
10
15
20
02 03 04 05 06 07 08 09 10 11 12 13 14 15 16
%
Value index vs. market cap index
Low volatility index vs. market cap index
Quality index vs. market cap index
Source: UBS Asset Management, Bloomberg, FTSE Russell, MSCI, Research Affiliates, RIMES. Note: Data from 31 January 2001 to 31 December 2016. TR gross index performance data in USD. Data for alternative indices contains live and back-tested data sourced from index providers. Past performance is not a reliable indicator of future results.
could cause a sharp rise in investor risk aversion and a search for ‘safe havens’. Alternative beta indices capturing defensive factors, such as low volatility and quality, could be an effective and low cost means of providing downside protection. For example, during the global financial crisis of 2007–2009 and following the Brexit referendum in the summer of 2016, while value underperformed the market, low volatility and quality outperformed the market. This would have helped to protect a blended equity portfolio (Exhibit 1).
Alternative beta indices capturing defensive factors, such as low volatility and quality, could be an effective and low cost means of providing downside protection.
Forecasting which scenario will play out in 2018 or trying to time the allocations to different factors is hard. In our view, a more pragmatic approach would be to invest in a blend of alternative beta indices capturing both factors that tend to perform well in strong markets or when interest rates are ris-ing, such as value, and factors that tend to provide good downside protection in weaker/more volatile markets, such as low volatility and quality. Combining alternative beta indices capturing different equity factors can be a highly effective strategy that can potentially reduce performance cyclicality and produce diversification benefits, as illustrated in Exhibit 2.
When alternative beta index blends combining several equity factors are constructed, they tend to benefit from a lower tracking error vs the market and a higher information ratio compared to the individual alternative beta indices. Depending on investment objectives and overall portfolio asset mix, we would typically suggest an equal allocation to pro-cyclical
Exhibit 2: Combining indices could smooth performance patterns – Alternative indices and blend 5 year annualized rolling relative return vs. MSCI World Equity factors typical performance pattern vs. market during business cycle phases
-10
-5
0
5
10
15
93 94 95 96 97 98 99 00 01 02 03 04 05 06 07 08 09 10 11 12 13 14 15 16
%
Value index vs. market cap index Low volatility index vs. market cap index
Quality index vs. market cap index 50% Value + 25% Low volatility + 25% Quality vs. market cap
Value: strong academic and market evidence that value outperforms market over the long-term; the value anomaly is likely to persist
Quality: downside protection, similar to low volatility stocks
Volatility: risk reduction for the overall portfolio, but tends
to lag in rising markets
Source: UBS Asset Management, Bloomberg, FTSE Russell, MSCI, Research Affiliates, RIMES. Note: Data from 31 May 1988 (earliest date when data is available for all examined indices) to 31 December 2016. TR gross index performance data in USD. Data for alternative indices contains live and back- tested data sourced from index providers. Past performance is not a reliable indicator of future results.
Systematic & index investing

4746
indices capturing the value factor (50%), plus defensive indices capturing the low volatility (25%) and the quality factor (25%), as there is strong empirical evidence that the value factor outperforms the market factor over the long-term and that the value anomaly is likely to persist. Depending on the asset allocation of a client’s overall portfolio, different allocations between these three factors may be optimal. For example, if a client already has a significant value tilt in their portfolio we may suggest they consider an equal allocation between the three indices or to supplement their existing value exposure with allocations to low volatility and quality indices. Investors interested in more customized rules-based solutions might want to consider a proprietary multi-factor portfolio that isolates the targeted factor exposures.
As alternative beta popularity grows, so do concerns that these strategies are becoming crowded trades. Evidence on this topic is mixed. Our view is that such risks can be mitigated effectively by constructing proprietary rules-based smart beta strategies.
Finally, a comment on sustainable investing, and its intersec-tion with alternative beta. Clients are increasingly searching for solutions to combine ESG and risk premia factors. Advance-ment in technology, coupled with a growing body of research in this area, is allowing the construction of transparent, high capacity and cost effective indices and rules-based strategies that incorporate both ESG and equity factors. One of the key features of such strategies is their high degree of customiza-tion given the multi-dimensional nature of both ESG and equity factors. The possibilities of customization in this regard are virtually endless, just as client requirements are.
Investors interested in more customized rules-based solutions might want to consider a proprietary multi- factor portfolio that isolates the targeted factor exposures.
Systematic & index investing Systematic & index investing

About the authors

5150
Erin Browne is Head of Asset Allocation in the Investment Solutions team at UBS Asset Management. Erin was most recently Head of Macro Investments at O’Connor, managing cross asset class portfolios, with a specific focus on cur-rencies and equities. She joined the firm in 2016 from Point 72 Asset Manage-ment, where she worked as a global macro portfolio manager for the firm’s Global Macroeconomic Group. Prior to that she held roles at Citigroup, Moore Capital Management and Neuberger Berman
Hayden Briscoe has overall responsibil-ity for all Asia Pacific fixed income activi-ties at UBS Asset Management. This includes fixed income investment capa-bilities in Hong Kong, Singapore, Japan, Australia, and China. He is also a mem-ber of the Global Fixed Income Manage-ment and Global Fixed Income Invest-ment Committees. Prior to joining UBS Asset Management, Hayden was a Sen-ior Vice President and Director of Asia Pacific Fixed Income at Alliance Bern-stein. In this role he was instrumental in building out their Asian fixed income platform and responsible for regional and country portfolios as well as having input in global aggregate strategies. Hayden previously worked at Schroders Investment Management, Colonial First State and Bankers Trust, where he ful-filled fund management, portfolio man-agement, and trader roles.
Bruce Amlicke is Chief Investment Officer & Head of Multi-Manager UBS Hedge Fund Solutions. His primary role is the creation of a center of excellence for the selection of third-party alpha man-agers across traditional and hedge fund capabilities. Bruce re-joined UBS in 2010, having spent five years as CIO of Blackstone Alternative Asset Manage-ment and Senior Managing Director of The Blackstone Group. Prior to that, Bruce was CIO of the then O’Connor Multi-Manager Program from 2003– 2004 – a predecessor business to HFS. He originally joined the O’Connor Multi- Manager team in 1998.
Anne Anderson is Head of Fixed Income Australia and has overall responsibility for the Australian Fixed Income business and investment activities at UBS Asset Man-agement. Anne is a member of the Global Fixed Income Investment Forum and chairs the macro forum that synthe-sizes key macro and strategic themes that frame global fixed income strategies. Anne also chairs the Global FX and Rates sub-committee. She joined UBS Asset Management in 1993 and has held sen-ior investment and managerial roles across the global and APAC regional busi-nesses, most recently establishing and building the Asian and China investment capability.
Ian Ashment is Head of Systematic & Index Investments at UBS Asset Manage-ment, responsible for managing more than CHF 180 billion in index equity and commodities assets and quantitative equity strategies. Prior to his current role, Ian was Global Head of Structured Beta & Indexing, responsible for index assets across all asset classes. He began his career at UBS Asset Management in 1985 as a statistical assistant before becoming a trainee active European equity fund manager and then a mem-ber of the Quantitative department spe-cializing in indexing and risk measure-ment. Ian is Chairman of the FTSE Russell EMEA Regional Advisory Com-mittee; member of the FTSE Policy Group and a member of S&P’s Global Index Advisory Panel.
Luke Browne is Head of Investment Specialists with UBS Investment Solu-tions and is responsible for delivering a full range of Investment Solutions for institutional, wealth management and wholesale clients globally. Luke was pre-viously the Head of Portfolio Manage-ment within Investment Solutions and Deputy Global Head of Structured Solu-tions between 2011 and 2016. Luke joined UBS Asset Management in Janu-ary 2011 from Schroder Investment Management where he had been Head of Structured Solutions since 2008, responsible for designing, marketing, executing and managing closed end structured products and institutional structured solutions.
Tommaso Albanese was appointed Head of Infrastructure of the Real Estate & Private Markets business of UBS Asset Management in December 2016. In this capacity, Tommaso leads the teams that make direct investments in infrastructure equity, infrastructure debt and real estate debt. Tommaso was previously Head of Infrastructure Debt in the for-mer Infrastructure & Private Equity area (2013–2016). He joined UBS in 2010 as Vice Chairman of EMEA Global Capital Markets in the Investment Bank where he led several strategic initiatives includ-ing the development of the infrastruc-ture finance business. Prior to that, he was Co-Head of Global Capital Markets for Europe at Morgan Stanley & Co. Tommaso is also adjunct Professor of Finance at New York University’s Stern School of Business since 2007 where he teaches infrastructure and international finance at the MBA program.
Jonathan Davies is a Senior Portfolio Manager within the Investment Solutions team. Jonathan has extensive experience in currency and multi-asset management, managing the firms’ UK balanced portfolios and standalone currency portfolios. Jonathan has worked in many areas and regions of UBS and has held roles as Chair of UK Investment Committee and ad interim Head of Asset Allocation.
AuthorsAuthors

5352
Urs Raebsamen is an equity specialist in the Systematic and Index Investments team with primary responsibility for communicating the team’s investment process, philosophy and views to clients, prospects and consultants. Between September 2007 and July 2010, Urs was on an international assignment in Korea with UBS Hana Asset Management, UBS’s Korean joint venture, where he was responsible for quantitative invest-ments as well as a range of business and operational areas in the Equities division. He was a member of the UBS Hana Asset Management Executive Commit-tee. Urs joined UBS Asset Management in 2001 as a portfolio manager with responsibility for the UBS Strategy Funds in CHF and the UBS Equity Fund – Gold. In March 2005, he joined the Swiss Equities / Systematic Alpha team, responsible for the Small Cap Switzer-land Fund as well as quantitative research. Urs is a member of the CFA Institute.
Uta Fehm is responsible for analysis and management of investments in emerging market sovereign debt portfolios. She has portfolio strategy responsibility and manages the development of emerging market products. She also serves as the Deputy Head for Emerging Market debt. Prior to joining the firm, Uta worked at Deutsche Asset Management in the Client Relations department and in Fixed Income Portfolio Management.
Suni Harford joined UBS Asset Manage ment in 2017 as Head of Invest-ments. Suni was previously at Citigroup where she worked for 24 years, most recently as Regional Head of Markets for North America for nine years, with responsi bility for sales, trading, origina-tion and research across all fixed income, currencies, commodities, equities and municipal businesses. Suni was also a member of Citi’s Pension Plan Invest-ment Committee and a Director on the Board of Citibank Canada. During her earlier career, Suni was Citi’s Global Head of Fixed Income Strategy and Analysis (2004-2008) as well as Global Head of The Yield Book Inc., a whol-ly-owned subsidiary of Citigroup. She started her Wall Street career at Merrill Lynch & Co. in Investment Banking.
Boriana Iordanova is an index analyst in the Indexing team. She is responsible for index research, including alternative beta indices. Boriana joined UBS Asset Management in 2010. Prior to this, she was an equity research analyst at Sanford C. Bernstein covering financials, and an investment banking analyst at Putnam Lovell working on M&A in the asset management sector.
Paul Guest is the Lead Real Estate Strate-gist for Real Estate Research & Strategy, a business which forms part of Real Estate & Private Markets within UBS Asset Management. In this role, Paul is primarily responsible for supporting multi-regional investment mandates with qualitative and quantitative analysis of cross-regional economies and investment markets. He also liaises between business functions within UBS’s Wealth Management and Investment Bank businesses. Paul has been with UBS Asset Management since 2015 and is a member of the Fund of Funds and Multi-Manager Investment Committee.
Christopher Greenwald joined UBS Asset Management as Head of SI Research, Sustainable and Impact Invest-ing, in February 2017. Prior to joining UBS Asset Management, Christopher led the sustainability research efforts at RobecoSAM, as Head of Sustainability Investing Research where he managed a team of sector specialists responsible for the integration of sustainability into the investment process. Previously, he headed the Sustainability Application and Operations team, overseeing Robe-coSAM’s sustainability data and calcula-tion for the Dow Jones Sustainability Indices. Prior to joining RobecoSAM, Christopher was Director of ESG Con-tent Strategy for ASSET4 / Thomson Reuters.
Stephen Friel is an Investment Special-ist with UBS Investment Solutions. He is responsible for designing innovative products and solutions for wholesale and institutional clients, spanning a range of investment needs. Stephen is also responsible for providing prospects, clients, and investment consultants with strategic thinking, market, and invest-ment views across our multi-asset capabilities. Stephen joined UBS Asset Management in 2012 from Queen’s University Belfast, having graduated with a degree in finance. Prior to gradu-ating, Stephen undertook a one year industrial placement within the Asset Allocation & Currency team at UBS Asset Management. Stephen holds the Invest-ment Management Certificate (IMC).
AuthorsAuthors
Bin Shi is a member of the Global Emerging Market and Asia Pacific Equi-ties team, located in Hong Kong. He is Country Analyst and Portfolio Manager for China with a focus on Chinese stocks listed on both the overseas and domestic Chinese stock exchanges. Prior to joining UBS Asset Manage-ment, Bin spent three years as Head of International Business, portfolio man-ager and analyst with Boshi Fund Man-agement Co., one of the largest domestic mutual fund companies in China. Prior to that, he worked in the US for eight years as a portfolio man-ager and analyst for several US mutual fund firms. Bin joined UBS Asset Man-agement in January 2006 and has man-aged the Greater China Fund since April 2006

5554
Geoffrey Wong is Head of Global Emerging Markets & Asia Pacific Equities, with overall responsibility for all Asian, Japanese and Australian equity teams, strategies and research. Geoffrey joined UBS Asset Management in 1997. Prior to that, he was a co-founder of an Asian investment management firm, where he was responsible for asset allocation and stock selection for global and regional institutional portfolios. Geoffrey has also served on the board of the Singapore Stock Exchange.
Authors
Rodrigo Trelles is Co-Head of Capital Solutions at UBS O’Connor. He joined O’Connor from Deutsche Bank where he was Head of Credit Opportunities for Structured Credit (2006–2015). Prior to Deutsche Bank Rodrigo worked at the Argentine Ministry of Finance, focusing on debt swaps and restructur-ings (2000–2004).
Baxter Wasson is Co-Head of Capital Solutions at UBS O’Connor. He joined O’Connor from Deutsche Bank where he was Head of Origination and Structuring for Structured Credit (2007–2015). Prior to Deutsche Bank he worked at Latham & Watkins as a senior associate in the Finance Depart-ment, focusing on leveraged finance and project finance (2004–2007). Previously Baxter was an associate at Winston & Strawn in the Project Finance Group (2001–2004).
In a complex world we help you find answers to your investment challenges.

5756
For marketing and information purposes by UBS. For professional clients / qualified / institutional investors only.This document does not replace portfolio and fund-specific materials. Commentary is at a macro or strategy level and is not with reference to any registered or other mutual fund.
Americas: The views expressed are a general guide to the views of UBS Asset Management as of November 2017. The information contained herein should not be considered a recommendation to purchase or sell securities or any particular strategy or fund. Commentary is at a macro level and is not with reference to any investment strategy, product or fund offered by UBS Asset Management. The information contained herein does not constitute investment research, has not been prepared in line with the requirements of any jurisdiction designed to promote the independence of investment research and is not subject to any prohibition on dealing ahead of the dissemination of investment research. The information and opinions contained in this document have been compiled or arrived at based upon information obtained from sources believed to be reliable and in good faith. All such information and opinions are subject to change without notice. Care has been taken to ensure its accuracy but no responsibility is accepted for any errors or omissions herein. A number of the comments in this document are based on current expectations and are considered “forward-looking statements.” Actual future results, however, may prove to be different from expectations. The opinions expressed are a reflection of UBS Asset Manage-ment’s best judgment at the time this document was compiled, and any obligation to update or alter forward-looking statements as a result of new information, future events or otherwise is disclaimed. Furthermore, these views are not intended to predict or guarantee the future performance of any individual security, asset class or market generally, nor are they intended to predict the future performance of any UBS Asset Management account, portfolio or fund.
EMEA: The information and opinions contained in this document have been compiled or arrived at based upon information obtained from sources believed to be reliable and in good faith, but is not guaranteed as being accurate, nor is it a complete statement or summary of the securities, markets or developments referred to in the document. UBS AG and / or other members of the UBS Group may have a position in and may make a purchase and / or sale of any of the securities or other financial instruments mentioned in this document.
Before investing in a product please read the latest prospectus carefully and thoroughly. Units of UBS funds mentioned herein may not be eligible for sale in all jurisdictions or to certain categories of investors and may not be offered, sold or delivered in the United States. The information mentioned herein is not intended to be construed as a solicitation or an offer to buy or sell any securities or related financial instruments. Past performance is not a reliable indicator of future results. The performance shown does not take account of any commissions and costs charged when subscribing to and redeeming units. Commissions and costs have a negative impact on performance. If the currency of a financial product or financial service is different from your reference currency, the return can increase or decrease as a result of currency fluctuations. This information pays no regard to the specific or future investment objectives, financial or tax situation or particular needs of any specific recipient.
The details and opinions contained in this document are provided by UBS without any guarantee or warranty and are for the recipient’s personal use and information purposes only. This document may not be reproduced, redistributed or republished for any purpose without the written permission of UBS AG.
This document contains statements that constitute “forward-looking statements”, including, but not limited to, statements relating to our future business development. While these forward-looking statements represent our judgments and future expectations concerning the development of our business, a number of risks, uncertainties and other important factors could cause actual developments and results to differ materially from our expectations.
UK: Issued in the UK by UBS Asset Management (UK) Ltd. Authorised and regulated by the Financial Conduct Authority.
APAC: This document and its contents have not been reviewed by, delivered to or registered with any regulatory or other relevant authority in APAC. This document is for informational purposes and should not be construed as an offer or invitation to the public, direct or indirect, to buy or sell securities. This document is intended for limited distribution and only to the extent permitted under applicable laws in your jurisdiction. No representations are made with respect to the eligibility of any recipients of this document to acquire interests in securities under the laws of your jurisdiction.
Using, copying, redistributing or republishing any part of this document without prior written permission from UBS Asset Management is prohibited.
Any statements made regarding investment performance objectives, risk and/or return targets shall not constitute a representation or warranty that such objectives or expectations will be achieved or risks are fully disclosed. The information and opinions contained in this document is based upon information obtained from sources believed to be reliable and in good faith but no responsibility is accepted for any misrepresentation, errors or omissions. All such information and opinions are subject to change without notice. A number of comments in this document are based on current expectations and are considered “forward-looking statements”. Actual future results may prove to be different from expectations and any unforeseen risk or event may arise in the future. The opinions expressed are a reflection of UBS Asset Management’s judgment at the time this document is compiled and any obligation to update or alter forward-looking statements as a result of new information, future events, or otherwise is disclaimed.
You are advised to exercise caution in relation to this document. The information in this document does not constitute advice and does not take into consideration your investment objectives, legal, financial or tax situation or particular needs in any other respect. Investors should be aware that past performance of investment is not necessarily indicative of future performance. Potential for profit is accompanied by possibility of loss. If you are in any doubt about any of the contents of this document, you should obtain independent professional advice.
Australia: This document is provided by UBS Asset Management (Australia) Ltd, ABN 31 003 146 290 and AFS License No. 222605.
China: The securities may not be offered or sold directly or indirectly in the People’s Republic of China (the “PRC”). Neither this document or information contained or incorporated by reference herein relating to the securities, which have not been and will not be submitted to or approved/verified by or registered with the China Securities Regulatory Commission (“CSRC”) or other relevant governmental authorities in the PRC pursuant to relevant laws and regulations, may be supplied to the public in the PRC or used in connection with any offer for the subscription or sale of the Securities in the PRC. The securities may only be offered or sold to the PRC investors that are authorized to engage in the purchase of Securities of the type being offered or sold. PRC investors are responsible for obtaining all relevant government regulatory approvals/licenses, verification and/or registrations themselves, including, but not limited to, any which may be required from the CSRC, the State Administration of Foreign Exchange and/or the China Banking Regulatory Commission, and complying with all relevant PRC regulations, including, but not limited to, all relevant foreign exchange regulations and/or foreign investment regulations.
Hong Kong: This document and its contents have not been reviewed by any regulatory authority in Hong Kong. No person may issue any invitation, advertisement or other document relating to the Interests whether in Hong Kong or elsewhere, which is directed at, or the contents of which are likely to be accessed or read by, the public in Hong Kong (except if permitted to do so under the securities laws of Hong Kong) other than with respect to the Interests which are or are intended to be disposed of only to persons outside Hong Kong or only to “professional investors” within the meaning of the Securities and Futures Ordinance (Cap. 571) and the Securities and Futures (Professional Investor) Rules made thereunder.
Japan: This document is for informational purposes only and is not intended as an offer or a solicitation to buy or sell any specific financial products, or to provide any investment advisory/management services.
Korea: The securities may not be offered, sold and delivered directly or indirectly, or offered or sold to any person for re-offering or resale, directly or indirectly, in Korea or to any resident of Korea except pursuant to the applicable laws and regulations of Korea, including the Capital Market and Financial Investment Business Act and the Foreign Exchange Transaction Law of Korea, the presidential decrees and regulations thereunder and any other applicable laws, regulations or rules of Korea. UBS Asset Management has not been registered with the Financial Services Commission of Korea for a public offering in Korea nor has it been registered with the Financial Services Commission for distribution to non-qualified investors in Korea.
Malaysia: This document is sent to you, at your request, merely for information purposes only. No invitation or offer to subscribe or purchase securities is made by UBS Asset Management as the prior approval of the Securities Commission of Malaysia or other regulatory authorities of Malaysia have not been obtained. No prospectus has or will be filed or registered with the Securities Commission of Malaysia.
Drawing on the breadth and depth of our capabilities and our global reach, we turn challenges into opportunities. Together with you, we find the solution that you need.At UBS Asset Management we take a connected approach.
Ideas and investment excellenceOur teams have distinct viewpoints and philosophies but they all share one goal – to provide you with access to the best ideas and superior investment performance.
A holistic perspectiveThe depth of our expertise and breadth of our capabilities allow us to have more insightful conversations and an active debate, all to help you make informed decisions.
Across marketsOur geographic reach means we can connect the parts of the investment world most relevant for you. That’s what makes us different – we are on the ground locally with you and truly global.
Solutions-based thinkingWe focus on finding the answers you need – and this defines the way we think. We draw on the best of our capabilities and insights to deliver a solution that is right for you.
What we offerWhatever your investment profile or time horizon, we offer a comprehensive range of active and passive investment styles and strategies designed to meet your needs across all major traditional and alternative asset classes. Our invested assets total USD 744 billion1 and we have around 3,6002 employees, including over 900 investment professionals, located in 23 countries.
Who we areWe are one of the largest managers in Alternatives: the second largest fund of hedge funds manager3 and fifth largest manager globally of direct real estate4. We are a leading fund house in Europe, the largest mutual fund manager in Switzerland5, Europe’s fourth largest money manager6 and a major international firm in APAC. UBS’s unique passive offering, encompassing index and systematic strategies, provides smart beta, alternative indices, and other custom solutions to meet our clients’ needs. We are the second largest firm in Index management7 and the fourth largest ETF provider in Europe8. We are a truly global firm with principal offices in Chicago, Frankfurt, Hartford, Hong Kong, London, New York, Singapore, Sydney, Tokyo and Zurich.
Past performance is not indicative of future results.1 As of 30 September 2017.2 Thereof around 1,300 from Corporate Centre as of 31 December 2016.3 InvestHedge Billion Dollar Club, based on data to 31 December 2016.4 FT/Towers Watson, based on data to 31 December 2016.5 Morningstar/Swiss Fund Data FundFlows, September 2017.6 Institutional Investor Euro 100, based on data to 30 June 2016 (based on discretionary assets only, UBS WM and AM combined,
excluding fund of funds assets).7 UBS Asset Management, December 2016.8 ETFGI European ETF and ETP industry insights, July 2017.
Why UBS Asset Management

58
Singapore: This document has not been registered with the Monetary Authority of Singapore pursuant to the exemption under Section 304 of the SFA. Accordingly, this document may not be circulated or distributed, nor may the Securities be offered or sold, whether directly or indirectly, to any person in Singapore other than (i) to an institutional investor pursuant to Section 304 of the SFA.
Taiwan: This document and its contents have not been reviewed by, delivered to or registered with any regulatory or other relevant authority in the Republic of China (R.O.C.). This document is for informational purposes and should
not be construed as an offer or invitation to the public, direct or indirect, to buy or sell securities. This document is intended for limited distribution and only to the extent permitted under applicable laws in the Republic of China (R.O.C.). No representations are made with respect to the eligibility of any recipients of this document to acquire interests in securities under the laws of the Republic of China (R.O.C.).
Source for all data and charts (if not indicated otherwise): UBS Asset Management.
© UBS 2017. The key symbol and UBS are among the registered and unregistered trademarks of UBS. All rights reserved. November 2017. ubs.com/am
