marquette update - coa.sba-inc.com
TRANSCRIPT

Subscribe to email alerts at MarquetteAssociates.com
Data as of June 30, 2018$175 billion aua
Client breakdown by quantity (L) & assets (R)
8%
8%
28%
24%
32%
High Net Worth
Corporate
Taft-Hartley
Public
Nonprofit &Healthcare
3%6%
28%
38%
25%
High Net Worth
Corporate
Taft-Hartley
Public
Nonprofit &Healthcare
8%
8%
29%
24%
31%
High Net Worth
Corporate
Taft-Hartley
Public
Nonprofit &Healthcare
Marquette Update 4Q 2018
CHICAGO BALTIMORE PHILADELPHIA ST. LOUIS
FIRM UPDATES
ff Compliance with the Global Investment Performance Standards (GIPS®) In August, Marquette announced the firm claims compliance with the Global Investment Performance Standards (GIPS®)1 and has been independently verified by ACA Performance Services for the period of July 31, 2013 to December 31, 2017. The GIPS standards are a rigorous set of standardized, industry-wide investment performance measurement principles and are recognized worldwide for lending credibility, integrity and uniformity to a firm’s performance reporting and historical track record.
ff Marquette hired its 100th employee!
ff Client teams attending Illinois Public Pension Fund Association’s (IPPFA) MidAmerican Pension Conference 10/2–10/5 in Lake Geneva, WI
ff Client teams attending and firm hosting annual client brunch at the International Foundation for Employee Benefit Plans (IFEBP) 64th Annual Employee Benefits Conference 10/14–10/17 in New Orleans, LA
ff Client teams attending Resource Center for Religious Institute’s (RCRI) National Conference 10/30–11/2 in Orlando, FL
NEW CLIENTS
Chicago Community Catalyst Fund
LIUNA Midwest Region Funds
RECENT HIRES
Adriana Ramos Performance Analyst
Catherine Crepack Client Analyst
John Waghorne Performance Analyst
Nick Johnsen, CFA Client Analyst
Nicole Johnson-Barnes Research Analyst
Stefan Bordonaro Client Analyst
Megan Klassa Research Analyst
3Q 2018 Market Briefing Webinar: October 18th, 1:00pm cst
Thank you for joining us on September 28th at the Union League Club in Chicago for a day of education and connection. Videos will be posted on our website soon, including six flash talks by members of our Research Team and a firm update presentation by our President & CEO Brian Wrubel. Our two keynotes by John V. Miller and Richard Thaler will also be available.
2018 Investment Symposium – Thank you!

CHICAGO BALTIMORE PHILADELPHIA ST. LOUIS
MARQUETTE ASSOCIATES
180 North LaSalle St, Ste 3500, Chicago, Illinois 60601 PHONE 312-527-5500 CHICAGO I BALTIMORE I PHILADELPHIA I ST. LOUIS WEB marquetteassociates.com
About Marquette
Marquette Associates is an independent investment consulting firm that guides institutional investment programs with a
focused client service approach and careful research. Marquette has served a single mission since 1986 — enable institutions to
become more effective investment stewards. Marquette is a completely independent and 100% employee-owned consultancy
founded with the sole purpose of advising institutions. For more information, please visit www.marquetteassociates.com.
1 GIPS® is a registered trademark of Chartered Financial Analyst (CFA) Institute, a global association of investment professionals. CFA Institute has not been involved in the preparation or review of this announcment. For a copy of a presentation that complies with the GIPS standards and/or the firm’s list of composite descriptions, please email [email protected].
SERVICES
InvestmentConsulting
Defined Contribution Consulting
Outsourced CIO
WealthAdvisement
The opinions expressed herein are those of Marquette Associates, Inc. (“Marquette”), and are subject to change without notice. This material is not financial advice or an offer to purchase or sell any product. Marquette reserves the right to modify its current investment strategies and techniques based on changing market dynamics or client needs.
Marquette’s continued commitment to diversityOur firm prides itself on its strong history of diversity and inclusion both within our firm and in our utilization of investment managers. At Marquette, we believe in setting the tone about the importance of diversity and believe we are leading the consulting industry in this area. The diversity of our employees is reflected in our approach to our role as your investment consultant—we believe individuals flourish among a variety of perspectives, backgrounds, skills and ideas.
Ultimately, that approach carries through to our investment manager selection and recommendation process, the way we do business, and our approach to new opportunities. We anticipate building on these principles well into the future.
For a full copy of the announcement, please contact your consultant.
ff Ben Mohr speaking on “Crisis Portfolio Construction” panel, David H. Smith moderating “Novel Constructs in Asset Management – Blue Sky vs. Real Life” panel at Institutional Investor Roundtable for Consultants and Institutional Investors 10/3, 10/4
ff Jeremy Zirin moderating “Value-Add and Opportunistic vs. Core and Core Plus Investments” panel at Markets Group Midwest Institutional Real Estate Investor Forum 10/17
ff Sarah E.R. Wilson speaking at Allegheny League of Municipalities Government Benefits Seminar 10/19
ff Mike Spychalski speaking on “Identifying and Accessing Global Growth Opportunities” panel at Pensions & Investments Global Equities Strategies Briefing 10/25
ff Nichole Roman-Bhatty presenting “Investment Strategies for Changing Markets” workshop at Resource Center for Religious Institute’s (RCRI) 2018 National Conference 10/31
ff Tom Latzke presenting at LIUNA Midwest Region Health & Safety Fund Conference 11/13
ff Jeremy Zirin speaking at the Institutional Investing in Infrastructure Editorial Advisory Board meeting 11/13–11/15
ff Nat Kellogg moderating “The Next Generation of Multi-Asset Class Strategies” panel at Pensions & Investrments Multi-Asset Investing Conference 11/13
ff Eric Gaylord speaking on “How Should Employee Education Work?” panel at Investment Management Institute’s DC Literacy Summit 12/5
ff Jeremy Zirin speaking on real estate consulting panel at National Association of Real Estate Investment Managers (NAREIM) Capital Raising and Investor Relations Council Meeting 12/5
UPCOMING SPEAKING ENGAGEMENTS

This presentation is furnished on a confidential basis to the recipient for informational purposes only. For disclosure information, please refer to the end of this presentation.
3Q18 Market Environment

U.S. economy overview
▪ 2Q GDP grew 4.2% thanks to higher personal consumption and net exports; 3Q expected to be about 4.1% according to the Atlanta Fed GDPNow estimate
▪ The unemployment rate remained at 3.7% in September with 134K nonfarm jobs added
▪ CPI increased 2.7% over the trailing 12 months, as energy prices have risen 10.2% during this time. Core CPI growth remains steady at 2.2%
▪ China and U.S. both increased tariffs in September, escalating the trade conflict
▪ Trump administration reached a deal to revise NAFTA, but still needs to be approved by Congress and ratified by both Mexico and Canada
2U.S. Economy

Month (%) 3-Month (%) YTD (%) 1 Year (%) 3 Year (%) 5 Year (%) 10 Year (%)
Broad Market Indices
Blm BC Aggregate -0.6 0.0 -1.6 -1.2 1.3 2.2 3.8
Intermediate Indices
Blm BC Int. Gov./Credit -0.4 0.2 -0.8 -1.0 0.9 1.5 3.2
Government Only Indices
Blm BC Long Gov. -2.9 -2.8 -5.7 -3.5 0.8 4.4 5.4
Blm BC Int. Gov. -0.5 -0.1 -0.8 -1.2 0.2 0.9 2.2
Blm BC 1-3 Year Gov. -0.1 0.2 0.3 0.0 0.4 0.6 1.2
Blm BC U.S. TIPS -1.1 -0.8 -0.8 0.4 2.0 1.4 3.3
Credit Indices
Blm BC U.S. Long Credit -0.6 1.3 -5.2 -2.2 5.2 5.7 8.4
Blm BC High Yield 0.6 2.4 2.6 3.0 8.1 5.5 9.5
CS Leveraged Loan Index 0.7 1.9 4.4 5.6 5.4 4.4 5.8
Securitized Bond Indices
Blm BC MBS -0.6 -0.1 -1.1 -0.9 1.0 2.0 3.3
Blm BC ABS 0.0 0.5 0.5 0.5 1.2 1.5 3.7
Blm BC CMBS -0.5 0.5 -0.6 -0.2 1.7 2.4 5.6
Non-US Indices
Blm BC Global Aggregate Hedged -0.4 0.0 0.0 0.8 2.4 3.1 4.1
JPM EMBI Global Diversified 1.5 2.3 -3.0 -1.9 6.0 5.4 7.5
JPM GBI-EM Global Diversified 0.9 0.2 0.2 1.1 6.6 6.0 8.0
Municipal Indices
Blm BC Municipal -0.6 -0.2 -0.4 0.3 2.2 3.5 4.8
Blm BC HY Municipal -0.4 0.8 4.4 6.4 6.3 6.4 6.5
Fixed Income: Fed hikes as EMD recovers from overselling
3
3rd hike of 2018, 8th since 2008, expect December hike and 3 in 2019
Source: Bloomberg Barclays, Credit Suisse, JPMorgan as of September 30, 2018
Fixed Income

Fixed income takeaways
Core Bonds▪ Fed no longer accommodative after 8 post-recession rate hikes▪ Duration continues to provide principal protection in market corrections▪ Expect yield curve to flatten further but at slower pace
Bank Loans & High Yield▪ Fundamentals are frothier as bank loan acquisitions/LBOs and 2nd lien reach 2007 levels▪ Spreads remain tight vs. historicals, leverage/coverage/issuance/outstanding are moderate▪ Bank loan re-pricings less of a concern as they continue to be benign
Emerging Markets Debt▪ EMD recovering from 1H selloff based on Turkish and Argentine crises of confidence▪ Average fundamentals—current accounts, growth, leverage—remain favorable▪ Other Middle Eastern, other LatAm, Chinese and African issuers continue to have strong
reserves/revenue and strong ability to pay
Municipal Bonds▪ Continue to be attractive on a tax-equivalent basis▪ Persistent net negative supply of municipals should continue to be tailwind▪ Prerefunded bonds for safety and special tax bonds for inefficiency are most attractive
4Fixed Income

U.S. equities: steady as she goes
Month (%) 3-Month (%) YTD (%) 1 Year (%) 3 Year (%) 5 Year (%) 10 Year (%)
Broad Market Indices
Dow Jones 2.0 9.6 8.8 20.8 20.5 14.6 12.2
Wilshire 5000 0.2 7.3 10.5 17.6 17.3 13.6 12.0
Russell 3000 0.2 7.1 10.6 17.6 17.1 13.5 12.0
Large-Cap Market Indices
S&P 500 0.6 7.7 10.6 17.9 17.3 13.9 12.0
Russell 1000 0.4 7.4 10.5 17.8 17.1 13.7 12.1
Russell 1000 Value 0.2 5.7 3.9 9.5 13.6 10.7 9.8
Russell 1000 Growth 0.6 9.2 17.1 26.3 20.6 16.6 14.3
Mid-Cap Market Indices
Russell MidCap -0.6 5.0 7.5 14.0 14.5 11.7 12.3
Russell MidCap Value -0.8 3.3 3.1 8.8 13.1 10.7 11.3
Russell MidCap Growth -0.4 7.6 13.4 21.1 16.6 13.0 13.5
Small-Cap Market Indices
Russell 2000 -2.4 3.6 11.5 15.2 17.1 11.1 11.1
Russell 2000 Value -2.5 1.6 7.1 9.3 16.1 9.9 9.5
Russell 2000 Growth -2.3 5.5 15.8 21.1 18.0 12.1 12.7
5
U.S. equity index returns
Source: Morningstar Direct as of September 30, 2018
U.S. Equities

U.S. equity takeaways
▪ Growth and momentum continue to lead the market
▪ Forward earnings estimates are strong, which should support equity markets
▪ NAFTA negotiations coming to a close, but tensions with China continue to escalate
▪ Strong economic data in the U.S. may dampen the effect of rising interest rates on the stock market
6U.S. Equities

Non-U.S. equities: mixed returns
September shows positive returns for DM, EM still lags
Source: Bloomberg as of September 30, 2018
Month (%) 3-Month (%) YTD (%) 1 Year (%) 3 Year (%) 5 Year (%) 10 Year (%)
MSCI ACWI ex. U.S. 0.5 0.7 -3.1 1.8 10.0 4.1 5.2
MSCI EAFE 0.9 1.4 -1.4 2.7 9.2 4.4 5.4
MSCI EAFE Local 1.4 2.4 1.4 5.1 9.4 7.9 6.7
MSCI Emerging Markets -0.5 -1.1 -7.7 -0.8 12.4 3.6 5.4
MSCI EM Local -1.2 0.0 -2.9 2.7 12.2 7.3 7.7
MSCI EAFE Small-Cap -0.7 -0.9 -2.2 3.7 12.4 8.0 9.7
MSCI EM Small-Cap -3.3 -4.2 -12.3 -4.2 7.4 2.7 7.4
MSCI Frontier -0.1 -2.0 -12.6 -7.7 5.3 2.9 -0.2
7Non-U.S. Equities

Non-U.S. equity takeaways
▪ Despite negative YTD returns, our outlook remains positive
▪ Recent volatility more normal compared to 2017
▪ This year could continue to be bumpy with issues in UK, Italy, Brazil, Russia, and Turkey
▪ Global trade conflicts serve as another source of volatility
▪ Earnings growth and economic growth remain positive
8Non-U.S. Equities

Hedge Fund September performance
9
Credit and interest rate strategies drove relative value
Month (%) 3-Month (%) YTD (%) 1 Year (%) 3 Year (%) 5 Year (%) 10 Year (%)
HFRX Global -0.7 -0.4 -1.2 0.2 2.2 1.0 0.7
HFRX Hedged Equity -1.6 -1.1 -0.9 1.8 3.2 2.4 0.8
HFRI Composite -0.2 0.6 1.5 4.1 5.4 4.1 4.6
HFRI Fund of Funds 0.0 0.4 1.2 3.3 3.3 3.2 2.6
HFRI Convertible Arbitrage 0.1 0.8 1.6 2.9 5.3 4.1 7.2
HFRI Equity Hedge -0.4 0.7 1.9 5.3 7.4 5.1 5.2
HFRI Event-Driven -0.1 0.3 2.3 4.3 6.6 4.3 5.5
HFRI Macro -0.3 0.0 -1.8 0.5 0.4 1.5 1.6
HFRI Merger Arbitrage 0.3 0.5 3.3 3.3 4.5 3.5 3.9
HFRI Relative Value 0.5 1.5 3.2 4.3 5.2 4.4 6.0
Source: Hedge Fund Research as of September 30, 2018
Hedge Funds

Hedge fund takeaways
▪ Equity hedge struggled to generate alpha in September
▪ Net exposures across all regions are sitting at YTD lows
▪ Technology was the most sold sector during the month due to an increase in short activity
▪ Industrials and consumer staples were net bought during the month
10
Source: Morgan Stanley Prime Brokerage
Hedge Funds

Real Estate performance snapshot
Another positive quarter for real estate
Sources: NCREIF, Bloomberg as of June 30, 2018
2Q18 (%) YTD (%) 1 Year (%) 3 Year (%) 5 Year (%) 10 Year (%) 10 Yr Risk(%)
NPI 1.8 3.5 7.2 8.3 9.8 6.2 5.7
Income 1.1 2.3 4.6 4.7 5.0 5.5 0.3
Appreciation 0.7 1.3 2.5 3.4 4.6 0.7 5.8
NFI-ODCE 2.1 4.3 8.4 9.4 11.0 5.3 8.5
Income 1.1 2.1 4.3 4.4 4.7 5.2 0.4
Appreciation 1.0 2.2 4.0 4.8 6.1 0.1 8.6
FTSE NAREIT All Eq. REITs 8.5 1.3 4.9 9.1 8.9 8.3 24.9
Property Type
NPI Apartment 1.5 3.1 6.5 7.5 8.8 6.2 6.2
NPI Office 1.5 3.4 6.5 7.1 8.9 5.0 6.1
NPI Industrial 3.6 6.9 14.1 13.3 13.4 7.6 6.0
NPI Retail 1.3 2.0 4.6 7.8 10.1 7.5 4.8
NPI Hotel 2.0 3.0 6.3 6.5 8.2 3.7 6.5
Geographic Sectors
NPI East 1.3 2.5 5.2 6.4 7.8 5.0 6.1
NPI Midwest 1.7 2.9 5.8 7.0 8.8 5.8 4.7
NPI South 1.9 3.8 7.2 8.1 10.2 6.9 5.1
NPI West 2.2 4.4 9.2 10.3 11.6 7.1 6.2
11Real Estate

Real estate key themes and takeaways
▪ Further moderation of returns to the mid-to-high single digits
▪ Emphasis on income growth (NOI) over appreciation
▪ Fundamentals are healthy, but keep an eye on supply and demand dynamics
▪ Impact of rising interest rates on real estate is not linear
12Real Estate
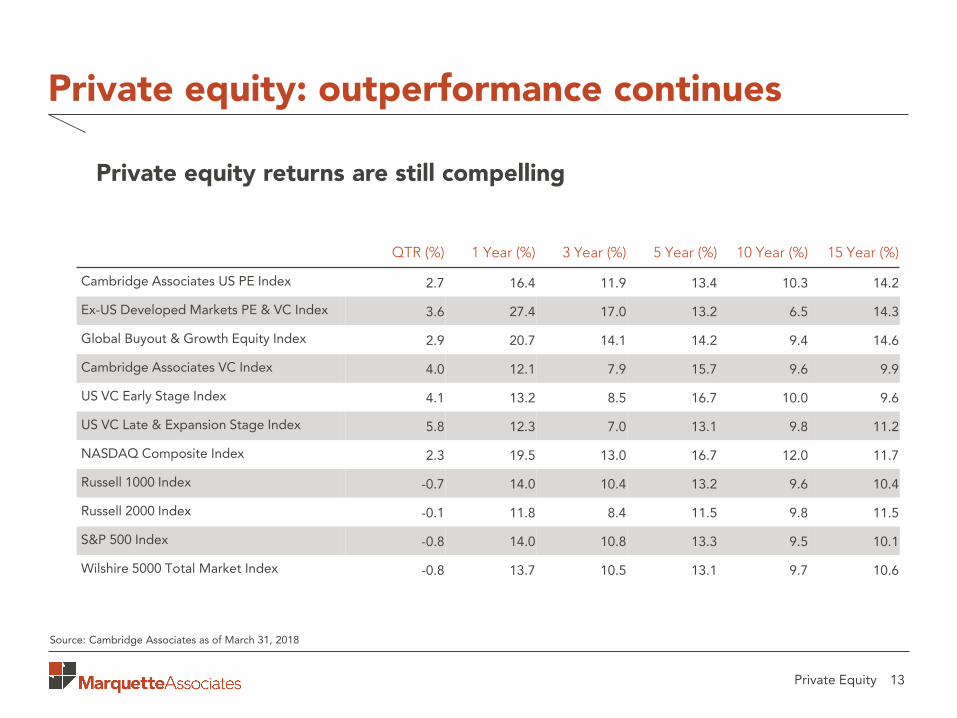
Private equity: outperformance continues
13
Private equity returns are still compelling
Source: Cambridge Associates as of March 31, 2018
QTR (%) 1 Year (%) 3 Year (%) 5 Year (%) 10 Year (%) 15 Year (%)
Cambridge Associates US PE Index 2.7 16.4 11.9 13.4 10.3 14.2
Ex-US Developed Markets PE & VC Index 3.6 27.4 17.0 13.2 6.5 14.3
Global Buyout & Growth Equity Index 2.9 20.7 14.1 14.2 9.4 14.6
Cambridge Associates VC Index 4.0 12.1 7.9 15.7 9.6 9.9
US VC Early Stage Index 4.1 13.2 8.5 16.7 10.0 9.6
US VC Late & Expansion Stage Index 5.8 12.3 7.0 13.1 9.8 11.2
NASDAQ Composite Index 2.3 19.5 13.0 16.7 12.0 11.7
Russell 1000 Index -0.7 14.0 10.4 13.2 9.6 10.4
Russell 2000 Index -0.1 11.8 8.4 11.5 9.8 11.5
S&P 500 Index -0.8 14.0 10.8 13.3 9.5 10.1
Wilshire 5000 Total Market Index -0.8 13.7 10.5 13.1 9.7 10.6
Private Equity

Private equity takeaways
▪ Industry fundraising has slowed this year due to less mega funds being closed in the 1st half of 2018
▪ Interest in high-quality managers continues to be robust as industry returns are expected to decelerate to low double-digits while likely generating a wider dispersion of performance
▪ Significant dry powder is expected to be deployed over the next few years which will increase the level of competition for assets and likely support current valuations
▪ Private equity continues to provide a relatively attractive investment opportunity for institutional investors due to an expanding opportunity set, active ownership approach to creating value, and modestly lower valuation multiples vs. public comparables
14Private Equity

The sources of information used in this report are believed to be reliable. Marquette Associates, Inc. has not
independently verified all of the information and its accuracy cannot be guaranteed. Opinions, estimates,
projections and comments on financial market trends constitute our judgment and are subject to change without
notice. References to specific securities are for illustrative purposes only and do not constitute recommendations.
Past performance does not guarantee future results.
16

Presented by
This presentation is furnished on a confidential basis to the recipient for informational purposes only. For disclosure information, please refer to the end of this presentation.
City of Atlanta Firefighters’ Pension Fund
Portfolio Review
Kweku Obed, CFA, CAIAManaging Partner
Jesus JimenezSenior Client Analyst, Assistant Vice President
Nicole Johnson-BarnesResearch Analyst
November 29, 2018

Agenda
▪ Team Overview
▪ Action Items
▪ Realized Fee Savings
▪ FY’18 Performance Overview
▪ Manager Contributions
▪ Asset Allocation
▪ 3Q’18 Performance Overview
▪ Manager Contributions
▪ Asset Allocation
▪ Key Takeaways
2

City of Atlanta’s Client Service Team (1/2)
3
Kweku Obed, CFA, CAIAManaging Partner
▪ An owner of the firm
▪ 19 years industry experience
▪ Focus on public funds
▪ B.S., University of London
▪ M.S., University of London
▪ Bernard Corry Prize in Economics
▪ Investment Committee member PSCA
Jesus JimenezSenior Client Analyst, Assistant Vice President
▪ 6 years industry experience
▪ Focus on public funds
▪ B.S., DePaul University
▪ Auxiliary Board Member, National Museum of Mexican Art
▪ Finance Advisory Committee member, Sisters of St. Francis
Nicole Johnson-BarnesResearch Analyst
▪ 13 years of industry experience
▪ Focus on manager research and due diligence
▪ B.S., University of Michigan
▪ Member, Women’s Investment Professionals

City of Atlanta’s Client Service Team (2/2)
4
Nat Kellogg, CFADirector of Manager Search, Managing Partner
▪ 16 years of industry experience
▪ B.A., Middlebury College
▪ M.B.A., Northwestern University’s Kellogg School of Management
▪ CFA Charterholder
▪ Member, CFA Society of Chicago
Greg Leonberger, FSA, EA, MAAADirector of Research, Managing Partner
▪ 19 years industry experience
▪ Leads capital markets research and directs investment strategies
▪ B.S., University of Notre Dame
▪ M.B.A. with honors, University of Chicago Booth School of Business
Samantha Grant, CFA, CAIASenior Research Analyst
▪ 10 years of industry experience
▪ Focus on manager research and due diligence
▪ B.S., Florida A&M University
▪ M.B.A., Florida A&M University
▪ CFA Charterholder
▪ CAIA Charterholder
▪ Member, CFA Society of Chicago
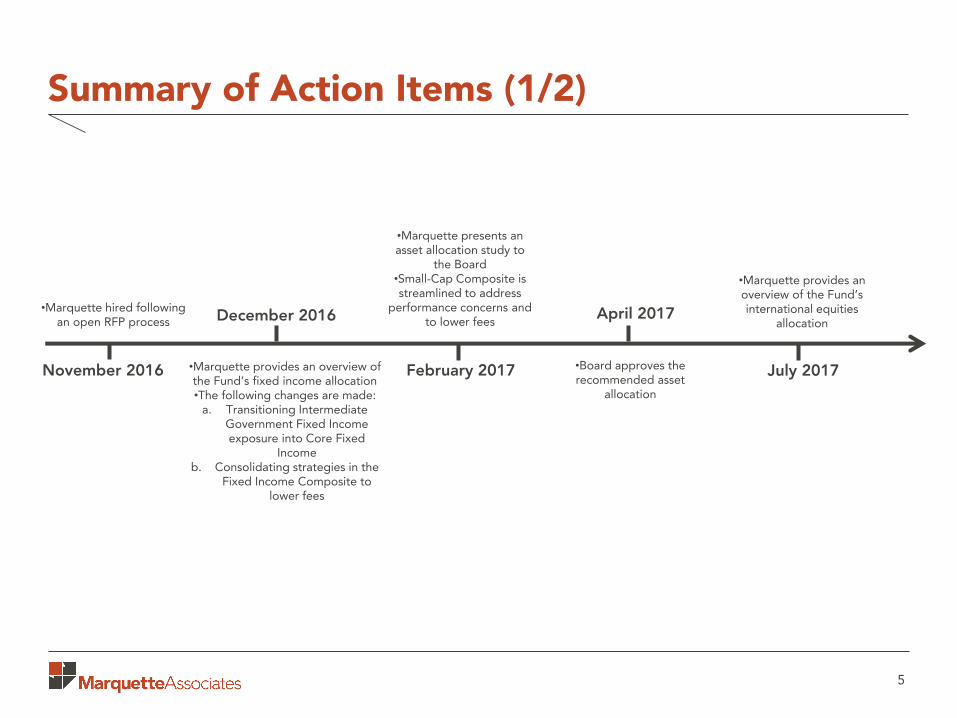
Summary of Action Items (1/2)
5
•Marquette hired following an open RFP process
November 2016
December 2016
•Marquette provides an overview of the Fund’s fixed income allocation•The following changes are made:
a. Transitioning Intermediate Government Fixed Income exposure into Core Fixed
Incomeb. Consolidating strategies in the
Fixed Income Composite to lower fees
•Marquette presents an asset allocation study to
the Board•Small-Cap Composite is streamlined to address
performance concerns and to lower fees
February 2017
April 2017
•Board approves the recommended asset
allocation
•Marquette provides an overview of the Fund’s international equities
allocation
July 2017

Summary of Action Items (2/2)
6
•Mid-Cap Value is consolidated into Mid-Cap Core to lower fees
and minimize style bias•Marquette presents three
searches for the following equity sub-asset classes:
a. International Large-Capb. International Small-Capc. International Emerging
Markets
August 2017
October 2017
•Large-Cap Value Index and Large-Cap Growth Index strategies are transitioned to Large-Cap Core
Index to lower fees •Non-US Small-Cap and Emerging
Markets equity exposures are funded
February 2018
January 2018
•Flex Cap portfolio is terminated and replaced by an All-Cap Index Fund
December 2017• Revised Investment Policy Statement is approved by
the Board
•Mid-Cap Manager of Managers Portfolio is
terminated and transferred to Mid-Cap
Core Index Fund March 2018-
Present
•Monthly performance reporting provided to
the City of Atlanta•On-going monitoring
of investment managers by Marquette
• Zenith Americanand Marquette
coordinate cash raising and policy compliance

Realized Fee Savings
7
Expense RatioEstimated Annual
Fees ($)
Total Investment Management Fees 0.22% $1,601,366
Current/Approved Asset Allocation
Expense RatioEstimated Annual
Fees ($)
Total Investment Management Fees 0.43% $2,637,353
Legacy Asset Allocation
Streamlining the portfolio and lowering annual investment management fees by approximately $1,035,987

Performance Overview

FY’18 Performance (Net of Fees)
9
• Fiscal year-to-date, the Fund outperformed its benchmark by 60 basis points, ranking in the top decile within the InvestorForce Public DB > $250MM Universe
• Fixed Income, U.S. Mid-Cap Equity, U.S. Small-Cap Equity, International Equity and Alternative composites added value to the Plan
• U.S. Large-Cap Equity composite detracted from the benchmark

Manager Contribution – FY’18 Performance
10
Top PerformersAbsolute
PerformanceBenchmark
Performance Strategy
Garcia Hamilton +1.1% -0.4% Fixed Income
Johnston International Equity +14.2% +6.8% International Equity
Intercontinental U.S. Real Estate +10.4% +7.5% Real Estate
Bottom PerformersAbsolute
PerformanceBenchmark
Performance Strategy
Colchester Global Investors +1.0% +1.9% Fixed Income
LMCG Investments +21.5% +21.9% U.S. Equity
Ativo Capital +5.3% +7.3% International Equity
* Fiscal year performance as of June 30, 2018

FY’18 Asset Allocation vs Target Allocation
11
* Fiscal year performance and allocation as of June 30, 2018
Current Allocation
Target Allocation
Fixed Income Composite $157,431,966 $175,647,908
U.S. Equity Composite $414,230,268 $358,321,732
International Equity Composite $106,178,619 $133,492,410
Cash Composite $611,692 $0
Alternative Composite $24,139,087 $35,129,582

3Q’18 Performance (Net of Fees)
12
• Year-to-date through September 30th, the Fund outperformed its benchmark by 30 basis points, ranking in the top decile within the InvestorForce Public DB > $250MM Universe
• Fixed Income, U.S. Large-Cap Equity, U.S. Mid-Cap Equity, U.S. Small-Cap Equity and Alternative composites added value to the Plan
• International Equity composite matched the benchmark
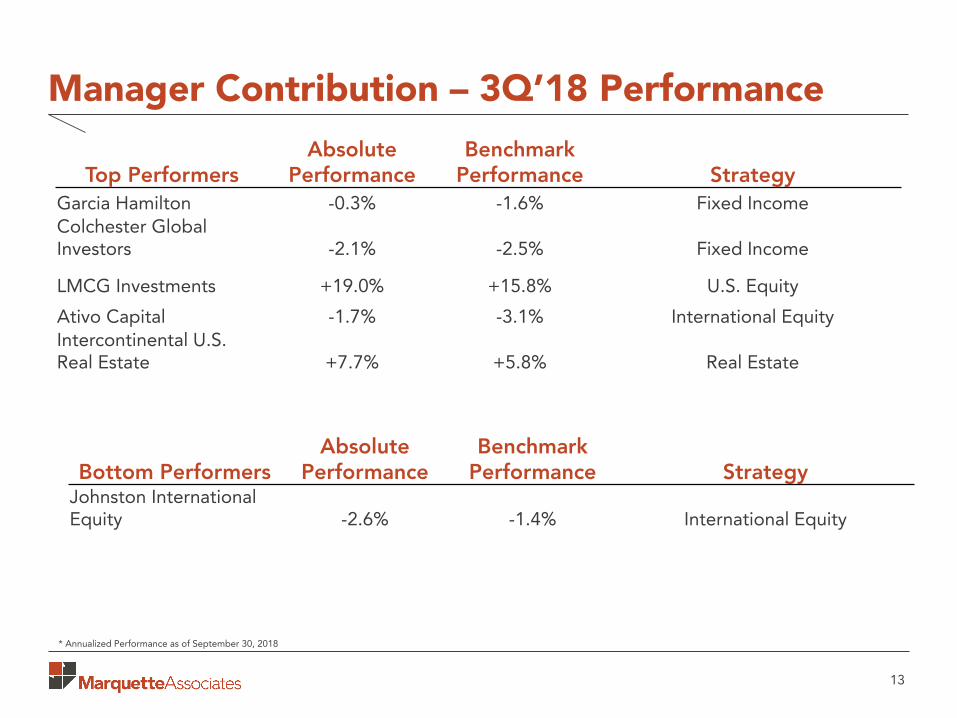
Manager Contribution – 3Q’18 Performance
13
Top PerformersAbsolute
PerformanceBenchmark
Performance Strategy
Garcia Hamilton -0.3% -1.6% Fixed Income
Colchester Global Investors -2.1% -2.5% Fixed Income
LMCG Investments +19.0% +15.8% U.S. Equity
Ativo Capital -1.7% -3.1% International Equity
Intercontinental U.S. Real Estate +7.7% +5.8% Real Estate
Bottom PerformersAbsolute
PerformanceBenchmark
Performance StrategyJohnston International Equity -2.6% -1.4% International Equity
* Annualized Performance as of September 30, 2018

3Q’18 Asset Allocation vs Target Allocation
14
* Annualized Performance as of September 30, 2018
Current Allocation
Target Allocation
Fixed Income Composite $157,039,259 $181,290,992
U.S. Equity Composite $438,419,120 $369,833,623
International Equity Composite $104,805,607 $137,781,154
Cash Composite $570,163 $0
Alternative Composite $24,329,818 $36,258,198

Key Takeaways
▪ Realized fee savings have been meaningful – Marquette will continue to review fees and renegotiate with managers where possible
▪ FY’18 performance was strong and ahead of the benchmark and peers (FY’17 performance also exceeded the target rate of return and the benchmark; FY’17 saw a 7.7% return vs the benchmark return of 6.9%)
▪ The mixture of active and passive (index) managers has been a key driver of the Plan’s strong performance
▪ Structural overweight to U.S equities has been beneficial to long-term and short-term performance
▪ With rates projected to rise one more time in 2018 and potentially 3 times in 2019, we expect some volatility from fixed income
15

Biographies

Kweku Obed, CFA, CAIA, Managing Partner
17
▪ An owner of the firm, with the company since 2014
▪ 19 years of investment experience
▪ Co-chair of DC Services Group
▪ Prior to Marquette, principal and senior consultant at Mercer
Investment Consulting
▪ B.S. with honors in economics from Queen Mary College,
University of London
▪ M.S. in development economics from SOAS, University of
London
▪ CFA Charterholder and Chartered Alternative Investment Analyst
▪ Contributed two chapters on asset allocation and defined
contribution plans to the IFEPB’s Trustee Handbook
▪ Contributor to the CAIA textbook, CAIA Level I: An Introduction
to Core Topics in Alternative Investments, Second Edition
▪ Board member, Everyone Reading Illinois
▪ Member, Economic Club of Chicago
▪ Investment committee member, Plan Sponsor Council of America
(PSCA)

Jesus Jimenez, Senior Client Analyst, Assistant Vice President
18
▪ 6 years of investment experience
▪ Member, Defined Contribution Committee
▪ Member, Alternative Investment Manager Search Committee
▪ B.S. in economics from DePaul University
▪ Auxiliary Board member, National Museum of Mexican Art
▪ Finance Advisory Committee member, Sisters of St. Francis

Nicole Johnson-Barnes, Research Analyst
19
▪ 13 years of investment experience
▪ Member, Investment Committee
▪ Member, Traditional Investment Manager Search Committee
▪ Member, Impact Investing Committee
▪ Prior to Marquette, vice president and senior consultant at
Mesirow Financial
▪ B.B.A in finance and corporate strategy from University of
Michigan
▪ Member, Women’s Investment Professionals, Chicago

Disclosures
The sources of information used in this report are believed to be reliable. Marquette Associates, Inc.
has not independently verified all of the information and its accuracy cannot be guaranteed. Opinions,
estimates, projections and comments on financial market trends constitute our judgment and are
subject to change without notice. References to specific securities are for illustrative purposes only and
do not constitute recommendations. Past performance does not guarantee future results.
About Marquette Associates
Marquette Associates is an independent investment consulting firm that guides institutional investment
programs with a focused client service approach and careful research. For over 30 years Marquette has
served this mission in close collaboration with clients – enabling institutions to be more effective
investment stewards. Marquette is a completely independent and 100% employee-owned consultancy
founded with the sole purpose of advising institutions. For more information, please visit
www.marquetteassociates.com.
20

(Preliminary Subject to Change)
September 30, 2018
City of Atlanta Firefighters
Pension Fund
Executive Summary
Pension Fund

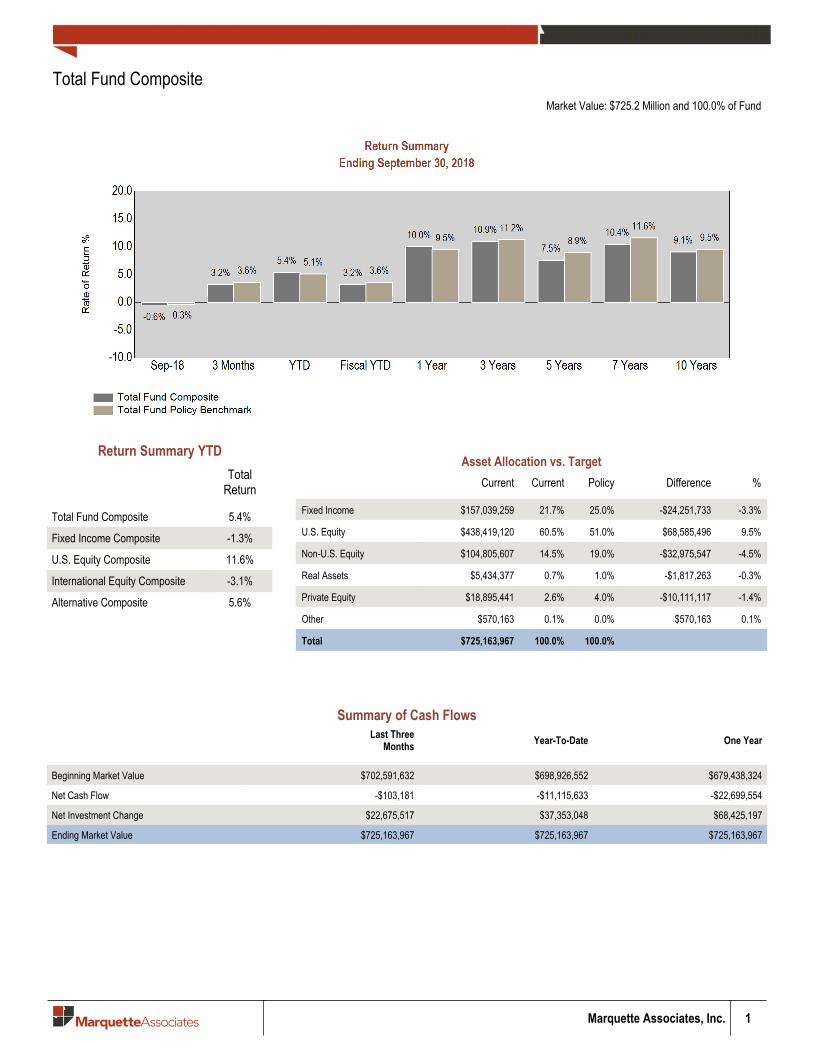
Total Fund CompositeMarket Value: $725.2 Million and 100.0% of Fund
Asset Allocation vs. TargetCurrent Current Policy Difference %
_
Fixed Income $157,039,259 21.7% 25.0% -$24,251,733 -3.3%
U.S. Equity $438,419,120 60.5% 51.0% $68,585,496 9.5%
Non-U.S. Equity $104,805,607 14.5% 19.0% -$32,975,547 -4.5%
Real Assets $5,434,377 0.7% 1.0% -$1,817,263 -0.3%
Private Equity $18,895,441 2.6% 4.0% -$10,111,117 -1.4%
Other $570,163 0.1% 0.0% $570,163 0.1%
Total $725,163,967 100.0% 100.0%XXXXX
Marquette Associates, Inc. 1
Return Summary YTD
TotalReturn
_
Total Fund Composite 5.4%
Fixed Income Composite -1.3%
U.S. Equity Composite 11.6%
International Equity Composite -3.1%
Alternative Composite 5.6%XXXXX
Summary of Cash Flows Last Three
Months Year-To-Date One Year_
Beginning Market Value $702,591,632 $698,926,552 $679,438,324
Net Cash Flow -$103,181 -$11,115,633 -$22,699,554
Net Investment Change $22,675,517 $37,353,048 $68,425,197
Ending Market Value $725,163,967 $725,163,967 $725,163,967_

2 Marquette Associates, Inc.
Total Fund CompositeMarket Value: $725.2 Million and 100.0% of Fund
Ending September 30, 2018
Asset Class Market Value($)
3 Mo NetCash Flows ($) % of Portfolio Policy % Policy Difference
($)_
Total Fund Composite 725,163,967 -103,181 100.0 100.0 0
Fixed Income Composite 157,039,259 -45,299 21.7 25.0 -24,251,733
Garcia Hamilton Core Fixed Income 51,467,408 -727 7.1
Mesirow Core Fixed Income 67,071,440 -324 9.2
Colchester Global Investors Non-U.S. Fixed Income 38,500,411 -44,248 5.3
U.S. Equity Composite 438,419,120 -31,082 60.5 51.0 68,585,496
Northern Trust Russell 3000 Index Fund All-Cap Core 51,125,712 0 7.1 7.0 364,234
Large Cap Composite 177,290,172 0 24.4 18.0 46,760,658
BlackRock 1000 Index Fund Large-Cap Core 177,290,172 0 24.4
Mid Cap Composite 122,537,909 0 16.9 14.0 21,014,953
BlackRock Mid Cap Equity Index Fund Mid-Cap Core 122,537,909 0 16.9
Small Cap Composite 87,465,327 -31,082 12.1 12.0 445,651
LMCG Investments SCG Small-Cap Growth 27,289,721 -31,082 3.8
Northern Trust Collective Russell 2000 Index Small-Cap Core 60,175,606 0 8.3
International Equity Composite 104,805,607 -2,348 14.5 19.0 -32,975,547
Ativo Capital Non-U.S. Large-CapCore 31,137,849 -2,348 4.3
Johnston International Equity Non-U.S. Large-CapCore 42,722,248 0 5.9
BlackRock MSCI EAFE Small Cap Non-U.S. Small-CapCore 14,273,344 0 2.0
BlackRock Emerging Markets Free Fund Emerging Markets 16,672,165 0 2.3
Cash Composite 570,163 -48,376 0.1 0.0 570,163
Cash Account Cash & Equivalents 465,732 -48,458 0.1
Transition Account Cash & Equivalents 104,431 82 0.0
Alternative Composite 24,329,818 23,923 3.4 5.0 -11,928,380
Intercontinental U.S. Real Estate Core Real Estate 5,434,377 -57,022 0.7
Consequent Alternative Partners II, L.P. U.S. Private Equity FoF 15,076,284 0 2.1
ICV Partners III, L.P. LBO Private Equity 2,134,196 -13,057 0.3
Pharos Capital Partners III LBO Private Equity 1,684,961 94,001 0.2 XXXXX

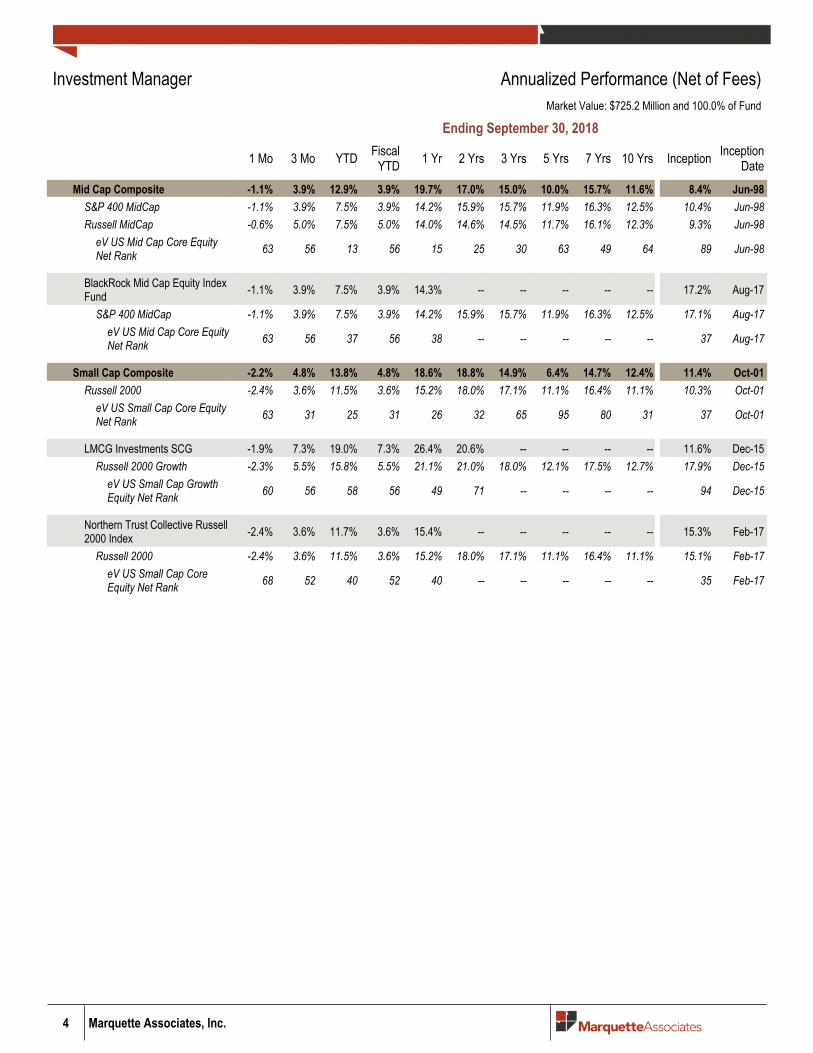
Investment Manager Annualized Performance (Net of Fees)Market Value: $725.2 Million and 100.0% of Fund
Marquette Associates, Inc. 3
Ending September 30, 2018
1 Mo 3 Mo YTD FiscalYTD 1 Yr 2 Yrs 3 Yrs 5 Yrs 7 Yrs 10 Yrs Inception Inception
Date_
Total Fund Composite -0.6% 3.2% 5.4% 3.2% 10.0% 11.1% 10.9% 7.5% 10.4% 9.1% 8.6% Jan-88Total Fund Policy Benchmark -0.3% 3.6% 5.1% 3.6% 9.5% 11.1% 11.2% 8.9% 11.6% 9.5% 9.3% Jan-88
InvestorForce Public DB > $250mmNet Rank 99 12 9 12 6 8 7 33 11 5 22 Jan-88
Fixed Income Composite -0.6% -0.3% -1.3% -0.3% -0.9% -0.3% 1.7% 2.1% 2.0% 3.8% 5.8% Jan-88Fixed Income Composite CustomBenchmark -0.6% -0.2% -1.4% -0.2% -1.2% -0.8% 1.3% 2.0% 1.9% 3.7% 6.1% Jan-88
InvestorForce Public DB Total FixInc Net Rank 96 97 74 97 70 77 67 62 85 86 81 Jan-88
Garcia Hamilton -0.5% -0.1% -0.3% -0.1% 0.6% -- -- -- -- -- 1.8% Dec-16BBgBarc US Aggregate TR -0.6% 0.0% -1.6% 0.0% -1.2% -0.6% 1.3% 2.2% 2.0% 3.8% 1.1% Dec-16
eV US Core Fixed Inc NetRank 42 89 5 89 5 -- -- -- -- -- 15 Dec-16
Mesirow -0.6% 0.0% -1.6% 0.0% -1.2% -0.6% 1.2% 2.1% 2.1% -- 2.8% May-10BBgBarc US Aggregate TR -0.6% 0.0% -1.6% 0.0% -1.2% -0.6% 1.3% 2.2% 2.0% 3.8% 2.8% May-10
eV US Core Fixed Inc NetRank 67 81 65 81 67 69 77 71 68 -- 75 May-10
Colchester Global Investors -0.6% -1.1% -2.1% -1.1% -2.3% -1.1% -- -- -- -- 3.5% Jan-16FTSE WGBI TR -1.0% -1.6% -2.5% -1.6% -1.5% -2.1% 1.7% 0.2% -0.1% 2.2% 2.3% Jan-16
eV Global Government FixedInc Net Rank 54 52 29 52 59 44 -- -- -- -- 13 Jan-16
U.S. Equity Composite -0.6% 5.8% 11.6% 5.8% 18.1% 17.4% 15.4% 10.4% 14.9% 11.9% 11.5% Jan-88Russell 3000 0.2% 7.1% 10.6% 7.1% 17.6% 18.1% 17.1% 13.5% 16.9% 12.0% 10.9% Jan-88
InvestorForce Public DB US EqNet Rank 93 83 13 83 18 51 78 96 92 33 1 Jan-88
Northern Trust Russell 3000 IndexFund 0.2% 7.1% -- 7.1% -- -- -- -- -- -- 5.0% Jan-18
Russell 3000 0.2% 7.1% 10.6% 7.1% 17.6% 18.1% 17.1% 13.5% 16.9% 12.0% 5.0% Jan-18eV US All Cap Core Equity NetRank 38 34 -- 34 -- -- -- -- -- -- 31 Jan-18
Large Cap Composite 0.4% 7.4% 10.6% 7.4% 17.4% 17.4% 15.4% 12.0% 15.0% 11.9% 10.9% Jan-88Russell 1000 0.4% 7.4% 10.5% 7.4% 17.8% 18.2% 17.1% 13.7% 16.9% 12.1% 10.9% Jan-88
eV US Large Cap Core EquityNet Rank 48 34 24 34 34 38 43 66 68 30 36 Jan-88
BlackRock 1000 Index Fund 0.4% 7.4% 10.5% 7.4% -- -- -- -- -- -- 10.5% Dec-17Russell 1000 0.4% 7.4% 10.5% 7.4% 17.8% 18.2% 17.1% 13.7% 16.9% 12.1% 10.5% Dec-17
eV US Large Cap CoreEquity Net Rank 48 34 25 34 -- -- -- -- -- -- 25 Dec-17
4 Marquette Associates, Inc.
Investment Manager Annualized Performance (Net of Fees)Market Value: $725.2 Million and 100.0% of Fund
Ending September 30, 2018
1 Mo 3 Mo YTD FiscalYTD 1 Yr 2 Yrs 3 Yrs 5 Yrs 7 Yrs 10 Yrs Inception Inception
Date_
Mid Cap Composite -1.1% 3.9% 12.9% 3.9% 19.7% 17.0% 15.0% 10.0% 15.7% 11.6% 8.4% Jun-98S&P 400 MidCap -1.1% 3.9% 7.5% 3.9% 14.2% 15.9% 15.7% 11.9% 16.3% 12.5% 10.4% Jun-98Russell MidCap -0.6% 5.0% 7.5% 5.0% 14.0% 14.6% 14.5% 11.7% 16.1% 12.3% 9.3% Jun-98
eV US Mid Cap Core EquityNet Rank 63 56 13 56 15 25 30 63 49 64 89 Jun-98
BlackRock Mid Cap Equity IndexFund -1.1% 3.9% 7.5% 3.9% 14.3% -- -- -- -- -- 17.2% Aug-17
S&P 400 MidCap -1.1% 3.9% 7.5% 3.9% 14.2% 15.9% 15.7% 11.9% 16.3% 12.5% 17.1% Aug-17eV US Mid Cap Core EquityNet Rank 63 56 37 56 38 -- -- -- -- -- 37 Aug-17
Small Cap Composite -2.2% 4.8% 13.8% 4.8% 18.6% 18.8% 14.9% 6.4% 14.7% 12.4% 11.4% Oct-01Russell 2000 -2.4% 3.6% 11.5% 3.6% 15.2% 18.0% 17.1% 11.1% 16.4% 11.1% 10.3% Oct-01
eV US Small Cap Core EquityNet Rank 63 31 25 31 26 32 65 95 80 31 37 Oct-01
LMCG Investments SCG -1.9% 7.3% 19.0% 7.3% 26.4% 20.6% -- -- -- -- 11.6% Dec-15Russell 2000 Growth -2.3% 5.5% 15.8% 5.5% 21.1% 21.0% 18.0% 12.1% 17.5% 12.7% 17.9% Dec-15
eV US Small Cap GrowthEquity Net Rank 60 56 58 56 49 71 -- -- -- -- 94 Dec-15
Northern Trust Collective Russell2000 Index -2.4% 3.6% 11.7% 3.6% 15.4% -- -- -- -- -- 15.3% Feb-17
Russell 2000 -2.4% 3.6% 11.5% 3.6% 15.2% 18.0% 17.1% 11.1% 16.4% 11.1% 15.1% Feb-17eV US Small Cap CoreEquity Net Rank 68 52 40 52 40 -- -- -- -- -- 35 Feb-17

Marquette Associates, Inc. 5
Investment Manager Annualized Performance (Net of Fees)Market Value: $725.2 Million and 100.0% of Fund
Ending September 30, 2018
1 Mo 3 Mo YTD FiscalYTD 1 Yr 2 Yrs 3 Yrs 5 Yrs 7 Yrs 10 Yrs Inception Inception
Date_
International Equity Composite -0.9% -1.4% -3.1% -1.4% 1.8% 9.6% 10.1% 5.0% 8.0% -- 6.9% Jul-10International Equity CompositeCustom Benchmark 0.5% 0.7% -3.1% 0.7% 1.8% 10.3% 10.2% 4.6% 8.0% -- 7.4% Jul-10
InvestorForce Public DB Dev Mktex-US Eq Net Rank 96 93 74 93 59 58 34 47 57 -- 80 Jul-10
Ativo Capital -0.3% 0.7% -1.7% 0.7% 0.6% 5.6% -- -- -- -- 5.2% Jan-16MSCI ACWI ex USA 0.5% 0.7% -3.1% 0.7% 1.8% 10.3% 10.0% 4.1% 7.2% 5.2% 9.6% Jan-16
eV ACWI ex-US Large CapEquity Net Rank 73 38 34 38 65 94 -- -- -- -- 93 Jan-16
Johnston International Equity -1.7% -3.2% -2.6% -3.2% 2.6% 12.7% 13.2% 7.3% 9.6% -- 8.1% Jul-10MSCI EAFE 0.9% 1.4% -1.4% 1.4% 2.7% 10.6% 9.2% 4.4% 8.3% 5.4% 7.7% Jul-10
eV EAFE Large Cap Core NetRank 99 99 72 99 52 12 3 5 25 -- 69 Jul-10
BlackRock MSCI EAFE Small Cap -0.6% -0.8% -1.8% -0.8% -- -- -- -- -- -- -1.8% Dec-17MSCI EAFE Small Cap -0.7% -0.9% -2.2% -0.9% 3.7% 12.4% 12.4% 8.0% 11.5% 9.7% -2.2% Dec-17
eV EAFE Small Cap EquityNet Rank 46 48 28 48 -- -- -- -- -- -- 28 Dec-17
BlackRock Emerging Markets FreeFund -0.5% -1.1% -7.7% -1.1% -- -- -- -- -- -- -7.7% Dec-17
MSCI Emerging Markets -0.5% -1.1% -7.7% -1.1% -0.8% 10.2% 12.4% 3.6% 5.0% 5.4% -7.7% Dec-17eV Emg Mkts Large CapEquity Net Rank 58 31 23 31 -- -- -- -- -- -- 23 Dec-17
Alternative Composite 0.7% 0.6% 5.6% 0.6% 10.8% 7.5% 6.5% 5.3% -- -- 6.3% Dec-12InvestorForce Public DB Alts NetRank 22 62 27 62 14 38 41 60 -- -- 52 Dec-12
Intercontinental U.S. Real Estate 2.5% 2.3% 7.7% 2.3% 10.4% 10.6% 10.8% -- -- -- 11.2% Aug-14NFI 0.6% 1.9% 5.8% 1.9% 7.7% 7.2% 7.8% 9.7% 10.1% 4.6% 9.4% Aug-14
XXXXX

Calendar Year2017 2016 2015 2014 2013 2012 2011 2010 2009 2008 2007
_
Total Fund Composite 16.1% 8.6% -2.5% 3.8% 22.4% 13.0% 2.4% 17.1% 21.3% -21.4% 6.9%Total Fund Policy Benchmark 15.2% 9.7% -0.2% 8.7% 21.9% 13.1% 1.0% 17.3% 18.0% -18.2% 5.6%
InvestorForce Public DB > $250mm NetRank 33 14 88 81 1 34 13 1 41 7 73
Fixed Income Composite 4.4% 2.9% 0.4% 4.4% -1.9% 4.2% 6.0% 5.9% 9.8% 1.5% 6.0%Fixed Income Composite CustomBenchmark 3.8% 2.2% 0.8% 5.0% -2.0% 4.2% 7.8% 6.5% 5.9% 5.2% 7.0%
InvestorForce Public DB Total Fix IncNet Rank 60 64 40 34 69 74 52 76 70 35 68
Garcia Hamilton 3.5% -- -- -- -- -- -- -- -- -- --BBgBarc US Aggregate TR 3.5% 2.6% 0.5% 6.0% -2.0% 4.2% 7.8% 6.5% 5.9% 5.2% 7.0%
eV US Core Fixed Inc Net Rank 71 -- -- -- -- -- -- -- -- -- --
Mesirow 3.4% 2.8% -0.1% 6.4% -2.3% 5.5% 7.2% -- -- -- --BBgBarc US Aggregate TR 3.5% 2.6% 0.5% 6.0% -2.0% 4.2% 7.8% 6.5% 5.9% 5.2% 7.0%
eV US Core Fixed Inc Net Rank 78 65 86 22 82 60 53 -- -- -- --
Colchester Global Investors 8.2% 3.8% -- -- -- -- -- -- -- -- --FTSE WGBI TR 7.5% 1.6% -3.6% -0.5% -4.0% 1.6% 6.4% 5.2% 2.6% 10.9% 11.0%
eV Global Government Fixed IncNet Rank 30 23 -- -- -- -- -- -- -- -- --
U.S. Equity Composite 18.9% 12.7% -4.9% 5.1% 34.8% 16.8% 2.7% 24.2% 32.6% -35.0% 8.5%Russell 3000 21.1% 12.7% 0.5% 12.6% 33.6% 16.4% 1.0% 16.9% 28.3% -37.3% 5.1%
InvestorForce Public DB US Eq NetRank 79 50 97 98 36 21 9 1 18 13 6
Northern Trust Russell 3000 Index Fund -- -- -- -- -- -- -- -- -- -- --Russell 3000 21.1% 12.7% 0.5% 12.6% 33.6% 16.4% 1.0% 16.9% 28.3% -37.3% 5.1%
eV US All Cap Core Equity NetRank -- -- -- -- -- -- -- -- -- -- --
Large Cap Composite 20.7% 11.1% -0.3% 7.2% 32.0% 16.1% 2.2% 17.2% 31.4% -33.3% 10.0%Russell 1000 21.7% 12.1% 0.9% 13.2% 33.1% 16.4% 1.5% 16.1% 28.4% -37.6% 5.8%
eV US Large Cap Core Equity NetRank 59 26 58 96 49 29 26 8 18 37 37
BlackRock 1000 Index Fund -- -- -- -- -- -- -- -- -- -- --Russell 1000 21.7% 12.1% 0.9% 13.2% 33.1% 16.4% 1.5% 16.1% 28.4% -37.6% 5.8%
eV US Large Cap Core EquityNet Rank -- -- -- -- -- -- -- -- -- -- --
6 Marquette Associates, Inc.
Investment Manager Calendar Performance (Net of Fees)Market Value: $725.2 Million and 100.0% of Fund

Investment Manager Calendar Performance (Net of Fees)Market Value: $725.2 Million and 100.0% of Fund
Marquette Associates, Inc. 7
Calendar Year2017 2016 2015 2014 2013 2012 2011 2010 2009 2008 2007
_
Mid Cap Composite 15.7% 15.3% -9.1% 7.1% 40.1% 17.0% 0.3% 21.0% 37.5% -39.2% 5.0%S&P 400 MidCap 16.2% 20.7% -2.2% 9.8% 33.5% 17.9% -1.7% 26.6% 37.4% -36.2% 8.0%Russell MidCap 18.5% 13.8% -2.4% 13.2% 34.8% 17.3% -1.5% 25.5% 40.5% -41.5% 5.6%
eV US Mid Cap Core Equity NetRank 74 30 94 66 15 32 25 67 19 57 57
BlackRock Mid Cap Equity IndexFund -- -- -- -- -- -- -- -- -- -- --
S&P 400 MidCap 16.2% 20.7% -2.2% 9.8% 33.5% 17.9% -1.7% 26.6% 37.4% -36.2% 8.0%eV US Mid Cap Core Equity NetRank -- -- -- -- -- -- -- -- -- -- --
Small Cap Composite 19.1% 10.9% -13.6% -3.4% 43.6% 19.8% 5.7% 50.7% 29.9% -34.2% 9.6%Russell 2000 14.6% 21.3% -4.4% 4.9% 38.8% 16.3% -4.2% 26.9% 27.2% -33.8% -1.6%
eV US Small Cap Core Equity NetRank 17 93 99 97 21 11 8 1 41 43 16
LMCG Investments SCG 19.4% -4.8% -- -- -- -- -- -- -- -- --Russell 2000 Growth 22.2% 11.3% -1.4% 5.6% 43.3% 14.6% -2.9% 29.1% 34.5% -38.5% 7.0%
eV US Small Cap Growth EquityNet Rank 74 99 -- -- -- -- -- -- -- -- --
Northern Trust Collective Russell2000 Index -- -- -- -- -- -- -- -- -- -- --
Russell 2000 14.6% 21.3% -4.4% 4.9% 38.8% 16.3% -4.2% 26.9% 27.2% -33.8% -1.6%eV US Small Cap Core EquityNet Rank -- -- -- -- -- -- -- -- -- -- --

8 Marquette Associates, Inc.
Investment Manager Calendar Performance (Net of Fees)Market Value: $725.2 Million and 100.0% of Fund
Calendar Year2017 2016 2015 2014 2013 2012 2011 2010 2009 2008 2007
_
International Equity Composite 31.4% -1.1% -1.2% -2.7% 18.5% 15.6% -8.4% -- -- -- --International Equity Composite CustomBenchmark 27.2% 4.5% -3.3% -4.4% 19.0% 17.1% -12.9% -- -- -- --
InvestorForce Public DB Dev Mkt ex-US Eq Net Rank 11 84 37 19 82 99 1 -- -- -- --
Ativo Capital 21.2% -3.6% -- -- -- -- -- -- -- -- --MSCI ACWI ex USA 27.2% 4.5% -5.7% -3.9% 15.3% 16.8% -13.7% 11.2% 41.4% -45.5% 16.7%
eV ACWI ex-US Large Cap EquityNet Rank 95 89 -- -- -- -- -- -- -- -- --
Johnston International Equity 37.5% 1.2% -0.3% 0.4% 17.3% 15.6% -8.4% -- -- -- --MSCI EAFE 25.0% 1.0% -0.8% -4.9% 22.8% 17.3% -12.1% 7.8% 31.8% -43.4% 11.2%
eV EAFE Large Cap Core NetRank 1 29 50 5 91 92 9 -- -- -- --
BlackRock MSCI EAFE Small Cap -- -- -- -- -- -- -- -- -- -- --MSCI EAFE Small Cap 33.0% 2.2% 9.6% -4.9% 29.3% 20.0% -15.9% 22.0% 46.8% -47.0% 1.4%
eV EAFE Small Cap Equity NetRank -- -- -- -- -- -- -- -- -- -- --
BlackRock Emerging Markets Free Fund -- -- -- -- -- -- -- -- -- -- --MSCI Emerging Markets 37.3% 11.2% -14.9% -2.2% -2.6% 18.2% -18.4% 18.9% 78.5% -53.3% 39.4%
eV Emg Mkts Large Cap EquityNet Rank -- -- -- -- -- -- -- -- -- -- --
Alternative Composite 7.7% 4.6% 4.4% 1.6% 4.8% -- -- -- -- -- --InvestorForce Public DB Alts Net Rank 43 74 47 86 92 -- -- -- -- -- --
Intercontinental U.S. Real Estate 7.7% 12.1% 12.7% -- -- -- -- -- -- -- --NFI 6.7% 7.8% 13.9% 11.5% 12.9% 9.8% 15.0% 15.3% -30.4% -10.7% 14.8%
XXXXX

Marquette Associates, Inc. 9
Private Equity Composite Performance Summary

10 Marquette Associates, Inc.
Total Fund Composite Fee ScheduleMarket Value: $725.2 Million and 100.0% of Fund