martin f. lueken anna m. jacob jennifer ash prepared for the campbell collaboration colloquium...
TRANSCRIPT

Martin F. Lueken
Anna M. Jacob
Jennifer Ash
Prepared for the Campbell Collaboration Colloquium
Copenhagen 2012
Thursday, May 31 2012
The Effects of Charter Competition
on Academic Outcomes: A Review of U.S. Evidence

What is a charter school in the United States?Considered a public schoolSubject to laws that govern public schoolsMore autonomous than traditional public schools (TPS) – usually not subject to other controls (i.e. collective bargaining agreements) E.g. can set own academic calendar, less restricted in
hiring decisions
INTRODUCTION

1991, Minnesota passed first charter law in United States
Political compromise in response to push for education vouchers
Today, 41 states with charter school laws
Charter schools serve over 1.5 million students
INTRODUCTION

BACKGROUND
Context: charter schools part of school choice movement
Increase school options Threat to traditional public schools (TPS) to lose
students, hence funding incentive to improve TPS options:
Improve teaching, how they use resources, etc. (constructive response)
Exert efforts to block reform, barriers to entry (non-constructive response)

BACKGROUND

Two effects of charter schools
Direct effect: how well do charter school students achieve relative to TPS students?
Indirect effect: how do other schools behave in face of charter competition?
CHARTER EFFECTS

What is the effect of charter school competition on student achievement in other traditional public schools?
RESEARCH QUESTION

Analytic ChallengesEndogeneity must be addressed in charter school studies (e.g. charter school location not random)
Outcome measures (student level vs. school level)
Variation in charter environments Charter laws vary significantly by state Some laws encourage competition, some laws
impede competition Funding levels, caps on # of schools or students, restriction
on locations
CHALLENGES TO SYSTEMATIC REVIEW

How wide the net?Definition of charter competition
Include studies with any measure of competition
GradesFocus on grades K-12
Geographic level Include studies addressing competition up to state level
INCLUSION CRITERIA

INCLUSION CRITERIA
Sample period: 2002 and laterGeographic/language: United States/English
onlyTypes of studies:
only quantitative studies that attempt to account for endogeneity problem (e.g. regressions with instrumental variables or fixed effects)
must include statistical control for pre-testMust include comparison group
Outcomes: student scholastic achievement in math and reading measured by standardized exams

Phase 1: Identify Databases
Phase 2: Title Review
Phase 3: Abstract Review
Phase 4: Methods Review
Phase 5: Coding
Phase 6: Final Inclusion Decision
Phase 7: Synthesis
SEARCH STRATEGY

1. Searched electronic databases Google Scholar, PsycINFO, ProQuest, EconLit
2. Searched grey literature1. NBER working papers, dissertations and theses
3. Hand-searched relevant journals Journal of School Choice, Education Next
4. Reviewed introduction and literature reviews of included studies
SEARCH STRATEGY

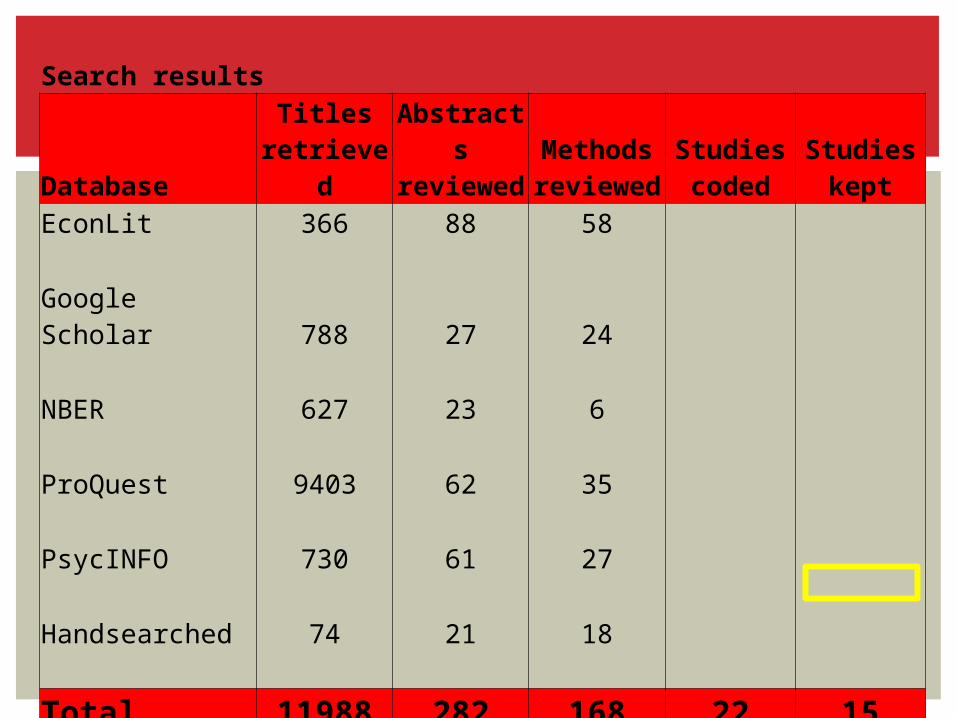
Search results
DatabaseTitles
retrievedAbstracts reviewed
Methods reviewed
Studies coded
Studies kept
EconLit 366 Google Scholar 788 NBER 627 ProQuest 9403 PsycINFO 730 Handsearched 74 Total 11988

Search results
DatabaseTitles
retrievedAbstracts reviewed
Methods reviewed
Studies coded
Studies kept
EconLit 366 88 Google Scholar 788 27 NBER 627 23 ProQuest 9403 62 PsycINFO 730 61 Handsearched 74 21 Total 11988 282

Search results
DatabaseTitles
retrievedAbstracts reviewed
Methods reviewed
Studies coded
Studies kept
EconLit 366 88 58 Google Scholar 788 27 24 NBER 627 23 6 ProQuest 9403 62 35 PsycINFO 730 61 27 Handsearched 74 21 18 Total 11988 282 168

Search results
DatabaseTitles
retrievedAbstracts reviewed
Methods reviewed
Studies coded
Studies kept
EconLit 366 88 58 Google Scholar 788 27 24 NBER 627 23 6 ProQuest 9403 62 35 PsycINFO 730 61 27 Handsearched 74 21 18 Total 11988 282 168 22 15
Search results
DatabaseTitles
retrievedAbstracts reviewed
Methods reviewed
Studies coded
Studies kept
EconLit 366 88 58 Google Scholar 788 27 24 NBER 627 23 6 ProQuest 9403 62 35 PsycINFO 730 61 27 Handsearched 74 21 18 Total 11988 282 168 22 15

Table: Locations studied in included articles
States School Districts
Arizona (1) Chicago Chula Vista, CA
Florida (1) Denver Fresno, CA
Michigan (3) Milwaukee Los Angeles, CA
North Carolina (2) New York City Napa Valley, CA
Ohio (3) Philadelphia San Diego, CA
Texas (4) San Diego West Covina, CA
"large urban school district in SW"
LOCATIONS UNDER STUDY

Number of charter schools within a district or within some specified distance (8)
Enrollment shares of charter schools by district (7)
Distance from TPS to nearest charter school (4)
Student transfer rates from TPS to charter schools (4)
Whether charter school is present in district (2)
MEASURES OF CHARTER COMPETITION

Analytic Methods Fixed effects = 9 Difference-in-differences
= 3 Instrumental variables =
3
Level of data Student = 8 School = 7
Sources Peer-reviewed = 8 Dissertations = 3 Working papers = 2 Reports = 2
CHARACTERISTICS OF 15 STUDIES

SIMPLE VOTE COUNTING
Table: Simple vote count of studies included in systematic review
Math Reading Overall*
Positive 6 5 6
Mixed / no effect 5 7 7
Negative 2 1 2*overall counts include two studies that used composite measures (positive for Holmes et al., 2003; negative for Kamienski, 2008) -- math and reading effects could not be dissected from these measures

ANTICIPATED CHALLENGES
Shocks to life-as-usual

Challenges in gathering data from studiesWhich estimates to include?
Numerous models and robustness checks run Some studies (i.e. Zimmer & Buddin, 2009) estimate
effects separately for elementary, middle, and high schools; others (i.e. Sass, 2006) produce an aggregate estimate for all grades
Outcome measures? Most studies use individual student test scores Some studies (school-level data) use schools’
proficiency rates as outcomes How to compute effect size? Two separate ones?
ANTICIPATED CHALLENGES

Currently planning how to best meta-analyze data
Potential moderator analysesEffect sizes by statesEffect sizes by district levelEffect sizes by racial background
CONCLUSIONS

Martin F. LuekenUniversity of Arkansas
Anna M. JacobUniversity of Arkansas
Jennifer AshUniversity of Arkansas
CONTACT