maryland real estate market activity, march 7, 2011, new listings, pending sales, days on market
TRANSCRIPT
8/7/2019 Maryland Real Estate Market Activity, March 7, 2011, New Listings, Pending Sales, Days on Market
http://slidepdf.com/reader/full/maryland-real-estate-market-activity-march-7-2011-new-listings-pending 1/5
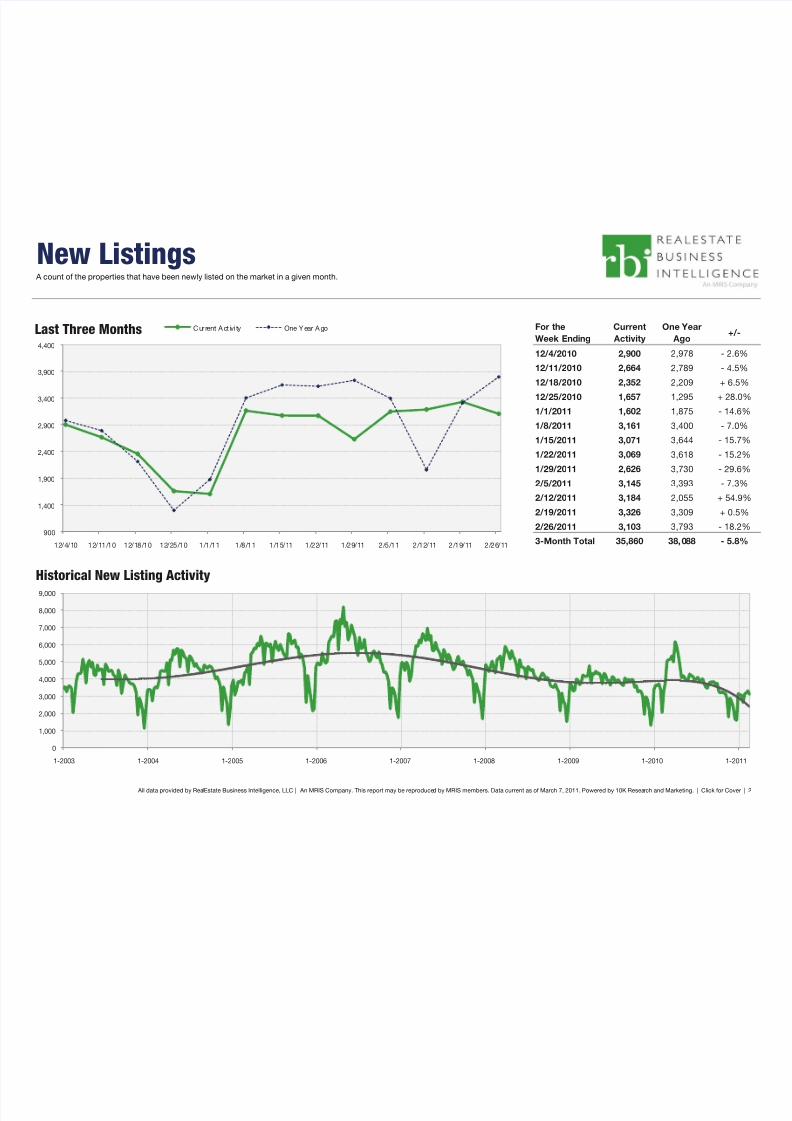
New ListingsA count of the properties that have been newly listed on the market in a given month.
For the
Week Ending
Current
Activity
One Year
Ago+/-
12/4/2010 2,900 2,978 - 2.6
12/11/2010 2,664 2,789 - 4.5
12/18/2010 2,352 2,209 + 6.5
12/25/2010 1,657 1,295 + 28.0
1/1/2011 1,602 1,875 - 14.6
1/8/2011 3,161 3,400 - 7.0
1/15/2011 3,071 3,644 - 15.7
1/22/2011 3,069 3,618 - 15.2
1/29/2011 2,626 3,730 - 29.6
2/5/2011 3,145 3,393 - 7.3
2/12/2011 3,184 2,055 + 54.9
2/19/2011 3,326 3,309 + 0.5
2/26/2011 3,103 3,793 - 18.2
3-Month Total 35,860 38,088 - 5.8
All data provided by RealEstate Business Intelligence, LLC | An MRIS Company. This report may be reproduced by MRIS members. Data current as of March 7, 2011. Powered by 10K Research and Marketing. | Click for Co
900
1,400
1,900
2,400
2,900
3,400
3,900
4,400
12/4/10 12/11/10 12/18/10 12/25/10 1/1/11 1/8/11 1/15/11 1/22/11 1/29/11 2/5/11 2/12/11 2/19/11 2/26/11
Last Three Months Cur rent Act ivi ty One Year Ago
0
1,000
2,000
3,000
4,000
5,000
6,000
7,000
8,000
9,000
1-2003 1-2004 1-2005 1-2006 1-2007 1-2008 1-2009 1-2010 1-20
Historical New Listing Activity
8/7/2019 Maryland Real Estate Market Activity, March 7, 2011, New Listings, Pending Sales, Days on Market
http://slidepdf.com/reader/full/maryland-real-estate-market-activity-march-7-2011-new-listings-pending 2/5
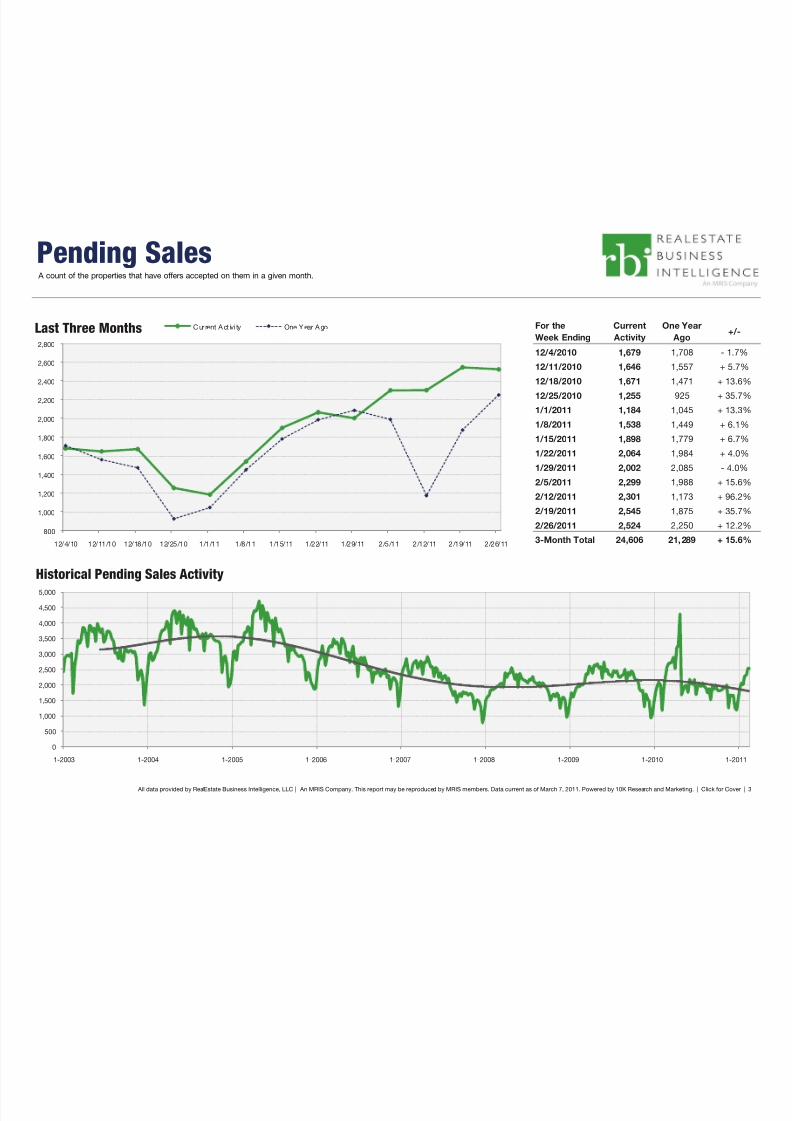
Pending SalesA count of the properties that have offers accepted on them in a given month.
For the
Week Ending
Current
Activity
One Year
Ago+/-
12/4/2010 1,679 1,708 - 1.7
12/11/2010 1,646 1,557 + 5.7
12/18/2010 1,671 1,471 + 13.6
12/25/2010 1,255 925 + 35.7
1/1/2011 1,184 1,045 + 13.3
1/8/2011 1,538 1,449 + 6.1
1/15/2011 1,898 1,779 + 6.7
1/22/2011 2,064 1,984 + 4.0
1/29/2011 2,002 2,085 - 4.0
2/5/2011 2,299 1,988 + 15.6
2/12/2011 2,301 1,173 + 96.2
2/19/2011 2,545 1,875 + 35.7
2/26/2011 2,524 2,250 + 12.2
3-Month Total 24,606 21,289 + 15.6
All data provided by RealEstate Business Intelligence, LLC | An MRIS Company. This report may be reproduced by MRIS members. Data current as of March 7, 2011. Powered by 10K Research and Marketing. | Click for Co
800
1,000
1,200
1,400
1,600
1,800
2,000
2,200
2,400
2,600
2,800
12/4/10 12/11/10 12/18/10 12/25/10 1/1/11 1/8/11 1/15/11 1/22/11 1/29/11 2/5/11 2/12/11 2/19/11 2/26/11
Last Three Months Cur rent Act ivi ty One Year Ago
0
500
1,000
1,500
2,000
2,500
3,000
3,500
4,000
4,500
5,000
1-2003 1-2004 1-2005 1-2006 1-2007 1-2008 1-2009 1-2010 1-20
Historical Pending Sales Activity
8/7/2019 Maryland Real Estate Market Activity, March 7, 2011, New Listings, Pending Sales, Days on Market
http://slidepdf.com/reader/full/maryland-real-estate-market-activity-march-7-2011-new-listings-pending 3/5
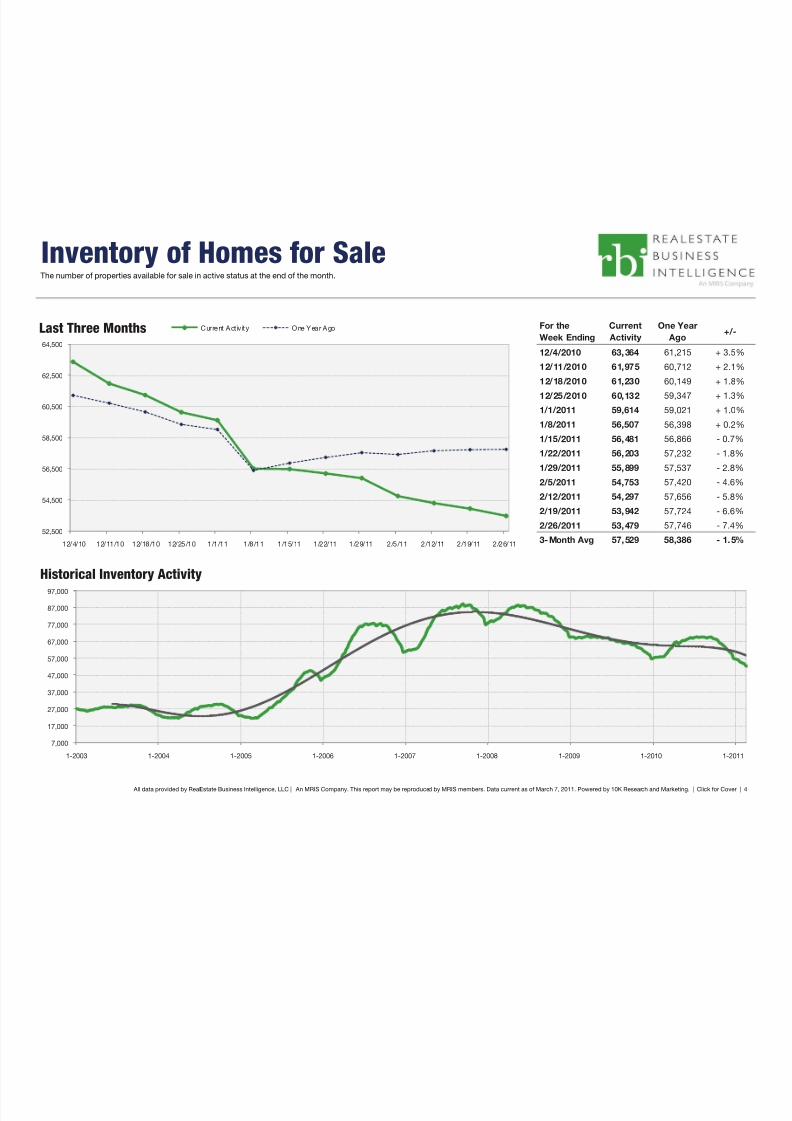
Inventory of Homes for SaleThe number of properties available for sale in active status at the end of the month.
For the
Week Ending
Current
Activity
One Year
Ago+/-
12/4/2010 63,364 61,215 + 3.5%
12/11/2010 61,975 60,712 + 2.1%
12/18/2010 61,230 60,149 + 1.8%
12/25/2010 60,132 59,347 + 1.3%
1/1/2011 59,614 59,021 + 1.0%
1/8/2011 56,507 56,398 + 0.2%
1/15/2011 56,481 56,866 - 0.7%
1/22/2011 56,203 57,232 - 1.8%
1/29/2011 55,899 57,537 - 2.8%
2/5/2011 54,753 57,420 - 4.6%
2/12/2011 54,297 57,656 - 5.8%
2/19/2011 53,942 57,724 - 6.6%
2/26/2011 53,479 57,746 - 7.4%
3-Month Avg 57,529 58,386 - 1.5%
All data provided by RealEstate Business Intelligence, LLC | An MRIS Company. This report may be reproduced by MRIS members. Data current as of March 7, 2011. Powered by 10K Research and Marketing. | Click for Cove
52,500
54,500
56,500
58,500
60,500
62,500
64,500
12/4/10 12/11/10 12/18/10 12/25/10 1/1/11 1/8/11 1/15/11 1/22/11 1/29/11 2/5/11 2/12/11 2/19/11 2/26/11
Last Three Months Current Act ivity One Year Ago
7,000
17,000
27,000
37,000
47,000
57,000
67,000
77,000
87,000
97,000
1-2003 1-2004 1-2005 1-2006 1-2007 1-2008 1-2009 1-2010 1-20
Historical Inventory Activity
8/7/2019 Maryland Real Estate Market Activity, March 7, 2011, New Listings, Pending Sales, Days on Market
http://slidepdf.com/reader/full/maryland-real-estate-market-activity-march-7-2011-new-listings-pending 4/5
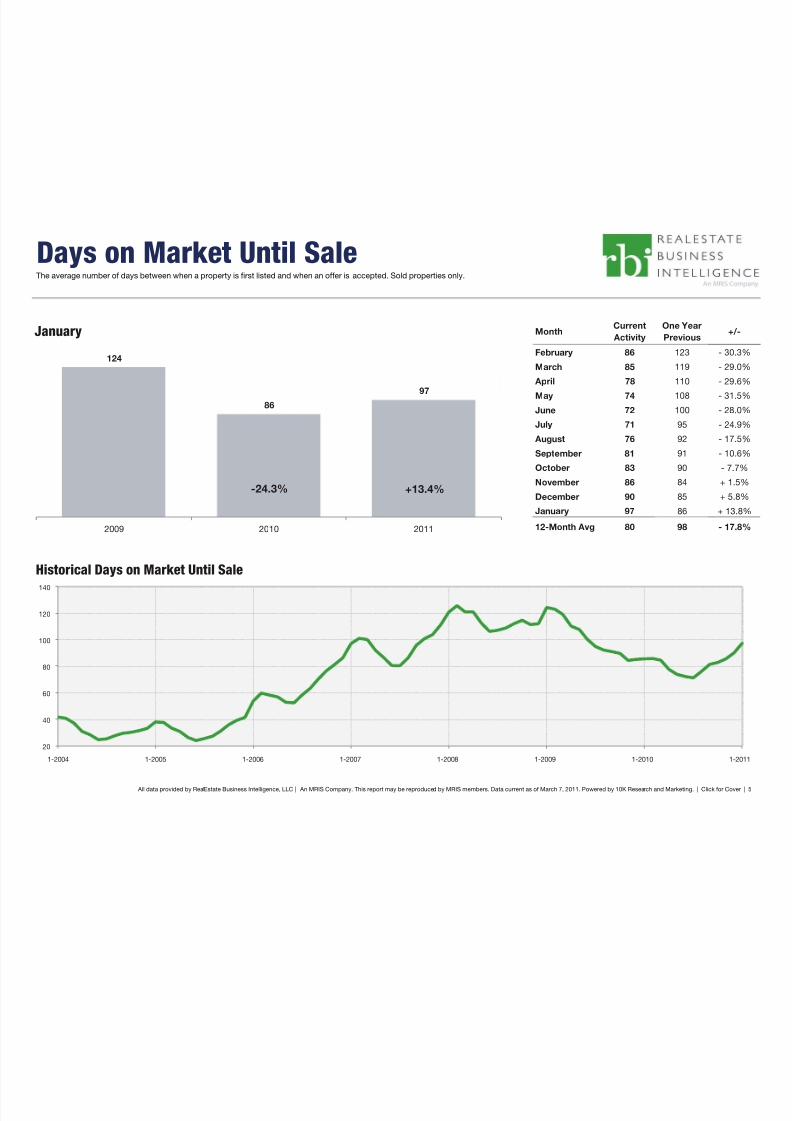
Days on Market Until SaleThe average number of days between when a property is first listed and when an offer is accepted. Sold properties only.
MonthCurrent
Activity
One Year
Previous+/-
February 86 123 - 30.3
March 85 119 - 29.0
April 78 110 - 29.6
May 74 108 - 31.5
June 72 100 - 28.0
July 71 95 - 24.9
August 76 92 - 17.5
September 81 91 - 10.6
October 83 90 - 7.7
November 86 84 + 1.5
December 90 85 + 5.8
January 97 86 + 13.8
12-Month Avg 80 98 - 17.8
All data provided by RealEstate Business Intelligence, LLC | An MRIS Company. This report may be reproduced by MRIS members. Data current as of March 7, 2011. Powered by 10K Research and Marketing. | Click for Co
January
20
40
60
80
100
120
140
1-2004 1-2005 1-2006 1-2007 1-2008 1-2009 1-2010 1-2
Historical Days on Market Until Sale
124
8697
2009 2010 2011
+13.4%-24.3%
8/7/2019 Maryland Real Estate Market Activity, March 7, 2011, New Listings, Pending Sales, Days on Market
http://slidepdf.com/reader/full/maryland-real-estate-market-activity-march-7-2011-new-listings-pending 5/5
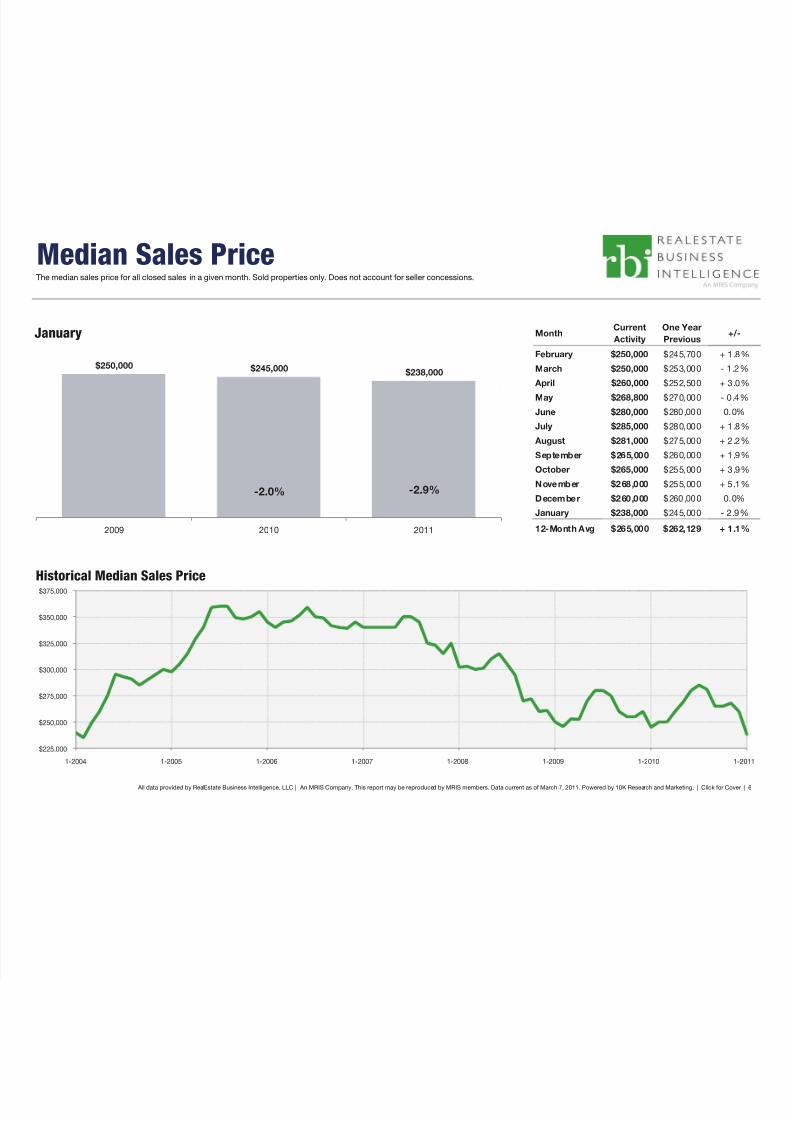
Median Sales PriceThe median sales price for all closed sales in a given month. Sold properties only. Does not account for seller concessions.
MonthCurrent
Activity
One Year
Previous+/-
February $250,000 $245,700 + 1.8
March $250,000 $253,000 - 1.2
April $260,000 $252,500 + 3.0
May $268,800 $270,000 - 0.4
June $280,000 $280,000 0.0%
July $285,000 $280,000 + 1.8
August $281,000 $275,000 + 2.2
September $265,000 $260,000 + 1.9
October $265,000 $255,000 + 3.9
November $268,000 $255,000 + 5.1
December $260,000 $260,000 0.0%
January $238,000 $245,000 - 2.9
12-Month Avg $265,000 $262,129 + 1.1
All data provided by RealEstate Business Intelligence, LLC | An MRIS Company. This report may be reproduced by MRIS members. Data current as of March 7, 2011. Powered by 10K Research and Marketing. | Click for Co
January
$225,000
$250,000
$275,000
$300,000
$325,000
$350,000
$375,000
1-2004 1-2005 1-2006 1-2007 1-2008 1-2009 1-2010 1
Historical Median Sales Price
$250,000 $245,000 $238,000
2009 2010 2011
-2.9%-2.0%