marzo – 2012 - bvl.com.pe · bursátil. así, los indicadores financieros incluyen ratios de...
TRANSCRIPT

http://www.bvl.com.pe
ESTADOS FINANCIEROS COMPARADOS
BALANCE GENERAL * ACTIVO * PASIVO * GANANCIAS Y PERDIDAS * VENTAS NETAS * COSTO DE VENTAS * GASTOS DE OPERACIÓN * UTILIDAD NETA *
RAZONES FINANCIERAS * INDICADORES BURSATILES
AL 31 DE MARZO DEL 2012
MARZO – 2012
AS OF MARCH 31th, 2012
BALANCE SHEET * ASSETS * LIABILITIES * EQUITY * PROFIT AND LOSSES * NET SALES * COST OF
SALES * OPERATING EXPENSES * NET EARNINGS * FINANCIAL RATIOS * STOCK MARKET INDICATORS
COMPARATIVE FINANCIAL STATEMENTS

BOLSA DE VALORES DE LIMA LIMA STOCK EXCHANGE
PRESENTACION / INTRODUCTION
La presente edición bilingüe muestra el resumen
de los Estados Financieros No Auditados al 31 de marzo del 2012 de las empresas inscritas
recibidos por la Bolsa de Valores de Lima;
incluyéndose además, similar información al 31 de marzo y al 31 de diciembre del 2011.
Con la finalidad que la información presentada
sea de fácil lectura e interpretación para el
usuario, además del usual ordenamiento de
acuerdo a la Clasificación Internacional Industrial
Uniforme (CIIU), las empresas han sido
agrupadas por Sector Económico (con excepción
del sector Empresas Industriales), en Bancos,
Financieras, Diversas, Servicios Públicos, Agrario,
Seguros, Compañías Mineras y Fondos de
Inversión, de suerte que pueda compararse la
performance de cada empresa con respecto al
sector al que pertenece. El sector Empresas
Industriales ha sido agrupado y totalizado de
acuerdo al CIIU.
Como ya es costumbre, se incluyen también
diversos indicadores derivados de la información
financiera y del comportamiento en el mercado
bursátil. Así, los Indicadores Financieros incluyen
ratios de Liquidez, Gestión, Solvencia y
Rentabilidad. Por su lado, los indicadores
bursátiles incluyen datos del número de acciones
en circulación, Valor Nominal, Cotización de
mercado, Valor Contable, Tasa de Lucratividad,
Relación Precio respecto del Valor Contable, al
cierre del Trimestre de cada año en estudio.
Finalmente, se incluye un ranking de las
empresas inscritas en Bolsa, ordenadas de
acuerdo a su nivel de actividad, de forma que
pueda visualizarse el grado de importancia de
cada empresa con respecto a sus resultados.
This bilingual edition is a summarized version of Lima Stock Exchange listed companies non-audited financial statements at the close of the March 31, 2012. Additionally we have included March 31, 2011 and December 31, 2011results for comparative purposes.
In order to make it of easier comprehension for the readers, apart from the Uniform International Industrial Classification Code (CIIU), the companies have been grouped according to the economic sector of activity, that is, Banking, Assorted, Public Service, Agrarian, Insurance, Mining and Investment Fund in order to enable a comparison between the company performance against the sector performance. This has been done in all sectors apart from de Industrial Company sector which has been grouped and totalized by CIIU only.
As usual, we have included a variety of indicators on each company derived from financial information as well as their behavior in the stock market. Included amongst these are financial indicators such as liquidity, activity, solvency and income-yield capacity ratios. Additionally, the stock market indicators include information of the shares outstanding, the nominal value, market price, book value and profit rate, price vs. book value, at the close of the quarter of each year.
Finally, we have included a ranking of the companies listed on the Stock Exchange in order of activity whereby, the importance of each company is graded according to the results achieved.
BOLSA DE VALORES DE LIMA LIMA STOCK EXCHANGE
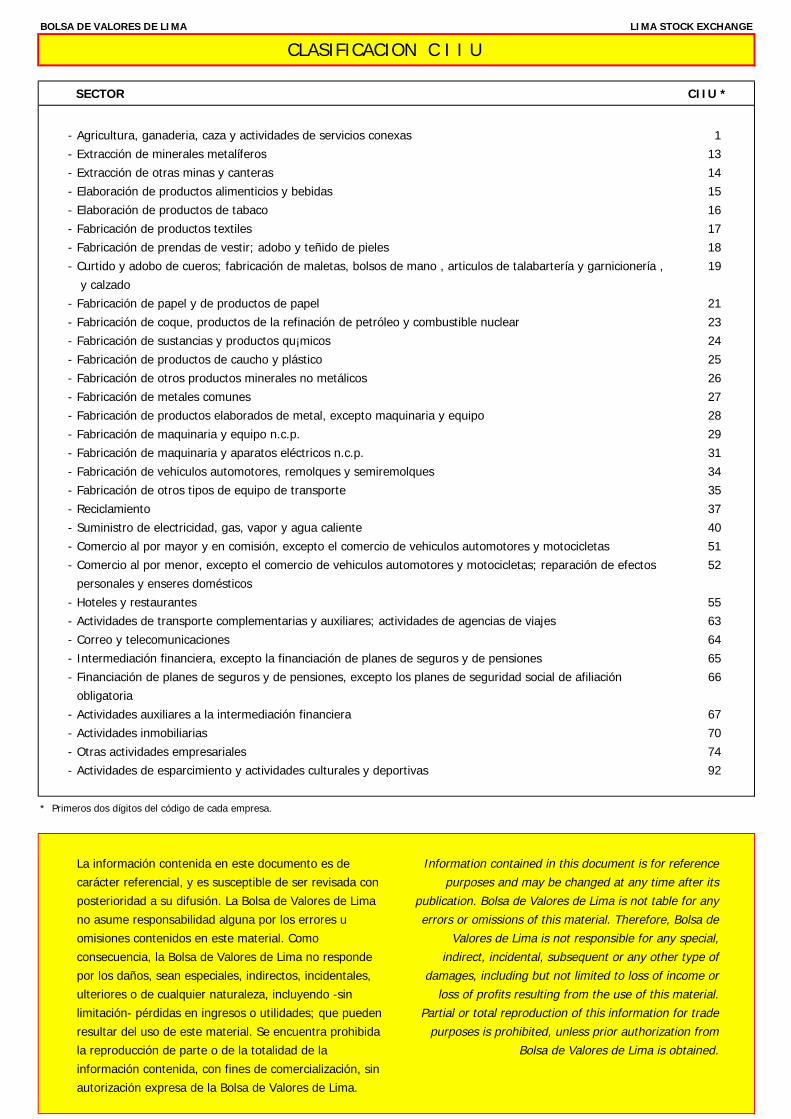
SECTOR CIIU *
- Agricultura, ganaderia, caza y actividades de servicios conexas 1- Extracción de minerales metalíferos 13- Extracción de otras minas y canteras 14- Elaboración de productos alimenticios y bebidas 15- Elaboración de productos de tabaco 16- Fabricación de productos textiles 17- Fabricación de prendas de vestir; adobo y teñido de pieles 18- Curtido y adobo de cueros; fabricación de maletas, bolsos de mano , articulos de talabartería y garnicionería , 19 y calzado- Fabricación de papel y de productos de papel 21- Fabricación de coque, productos de la refinación de petróleo y combustible nuclear 23- Fabricación de sustancias y productos qu¡micos 24- Fabricación de productos de caucho y plástico 25- Fabricación de otros productos minerales no metálicos 26- Fabricación de metales comunes 27- Fabricación de productos elaborados de metal, excepto maquinaria y equipo 28- Fabricación de maquinaria y equipo n.c.p. 29- Fabricación de maquinaria y aparatos eléctricos n.c.p. 31- Fabricación de vehiculos automotores, remolques y semiremolques 34- Fabricación de otros tipos de equipo de transporte 35- Reciclamiento 37- Suministro de electricidad, gas, vapor y agua caliente 40- Comercio al por mayor y en comisión, excepto el comercio de vehiculos automotores y motocicletas 51- Comercio al por menor, excepto el comercio de vehiculos automotores y motocicletas; reparación de efectos 52 personales y enseres domésticos- Hoteles y restaurantes 55- Actividades de transporte complementarias y auxiliares; actividades de agencias de viajes 63- Correo y telecomunicaciones 64- Intermediación financiera, excepto la financiación de planes de seguros y de pensiones 65- Financiación de planes de seguros y de pensiones, excepto los planes de seguridad social de afiliación 66 obligatoria- Actividades auxiliares a la intermediación financiera 67- Actividades inmobiliarias 70- Otras actividades empresariales 74- Actividades de esparcimiento y actividades culturales y deportivas 92
* Primeros dos dígitos del código de cada empresa.
La información contenida en este documento es de Information contained in this document is for referencecarácter referencial, y es susceptible de ser revisada con purposes and may be changed at any time after itsposterioridad a su difusión. La Bolsa de Valores de Lima publication. Bolsa de Valores de Lima is not table for anyno asume responsabilidad alguna por los errores u errors or omissions of this material. Therefore, Bolsa deomisiones contenidos en este material. Como Valores de Lima is not responsible for any special,consecuencia, la Bolsa de Valores de Lima no responde indirect, incidental, subsequent or any other type ofpor los daños, sean especiales, indirectos, incidentales, damages, including but not limited to loss of income orulteriores o de cualquier naturaleza, incluyendo -sin loss of profits resulting from the use of this material.limitación- pérdidas en ingresos o utilidades; que pueden Partial or total reproduction of this information for traderesultar del uso de este material. Se encuentra prohibida purposes is prohibited, unless prior authorization fromla reproducción de parte o de la totalidad de la Bolsa de Valores de Lima is obtained.información contenida, con fines de comercialización, sinautorización expresa de la Bolsa de Valores de Lima.
CLASIFICACION C I I U
BOLSA DE VALORES DE LIMA LIMA STOCK EXCHANGE
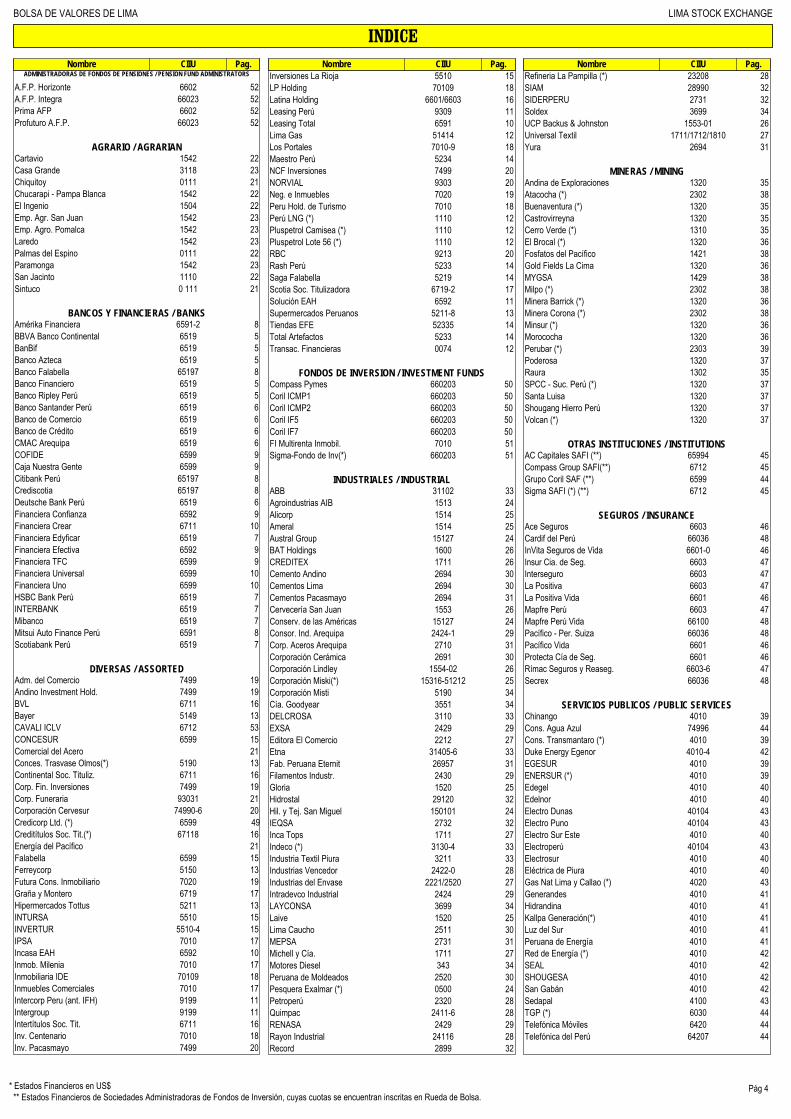
INDICENombre CIIU Pag.
Pág 4* Estados Financieros en US$** Estados Financieros de Sociedades Administradoras de Fondos de Inversión, cuyas cuotas se encuentran inscritas en Rueda de Bolsa.
ADMINISTRADORAS DE FONDOS DE PENSIONES / PENSION FUND ADMINISTRATORS
A.F.P. Horizonte 6602 52A.F.P. Integra 66023 52Prima AFP 6602 52Profuturo A.F.P. 66023 52
AGRARIO / AGRARIANCartavio 1542 22Casa Grande 3118 23Chiquitoy 0111 21Chucarapi - Pampa Blanca 1542 22El Ingenio 1504 22Emp. Agr. San Juan 1542 23Emp. Agro. Pomalca 1542 23Laredo 1542 23Palmas del Espino 0111 22Paramonga 1542 23San Jacinto 1110 22Sintuco 0 111 21
BANCOS Y FINANCIERAS / BANKSAmérika Financiera 6591-2 8BBVA Banco Continental 6519 5BanBif 6519 5Banco Azteca 6519 5Banco Falabella 65197 8Banco Financiero 6519 5Banco Ripley Perú 6519 5Banco Santander Perú 6519 6Banco de Comercio 6519 6Banco de Crédito 6519 6CMAC Arequipa 6519 6COFIDE 6599 9Caja Nuestra Gente 6599 9Citibank Perú 65197 8Crediscotia 65197 8Deutsche Bank Perú 6519 6Financiera Confianza 6592 9Financiera Crear 6711 10Financiera Edyficar 6519 7Financiera Efectiva 6592 9Financiera TFC 6599 9Financiera Universal 6599 10Financiera Uno 6599 10HSBC Bank Perú 6519 7INTERBANK 6519 7Mibanco 6519 7Mitsui Auto Finance Perú 6591 8Scotiabank Perú 6519 7
DIVERSAS / ASSORTEDAdm. del Comercio 7499 19Andino Investment Hold. 7499 19BVL 6711 16Bayer 5149 13CAVALI ICLV 6712 53CONCESUR 6599 15Comercial del Acero 21Conces. Trasvase Olmos(*) 5190 13Continental Soc. Tituliz. 6711 16Corp. Fin. Inversiones 7499 19Corp. Funeraria 93031 21Corporación Cervesur 74990-6 20Credicorp Ltd. (*) 6599 49Creditítulos Soc. Tit.(*) 67118 16Energía del Pacífico 21Falabella 6599 15Ferreycorp 5150 13Futura Cons. Inmobiliario 7020 19Graña y Montero 6719 17Hipermercados Tottus 5211 13INTURSA 5510 15INVERTUR 5510-4 15IPSA 7010 17Incasa EAH 6592 10Inmob. Milenia 7010 17Inmobiliaria IDE 70109 18Inmuebles Comerciales 7010 17Intercorp Peru (ant. IFH) 9199 11Intergroup 9199 11Intertítulos Soc. Tit. 6711 16Inv. Centenario 7010 18Inv. Pacasmayo 7499 20
Nombre CIIU Pag.Inversiones La Rioja 5510 15LP Holding 70109 18Latina Holding 6601/6603 16Leasing Perú 9309 11Leasing Total 6591 10Lima Gas 51414 12Los Portales 7010-9 18Maestro Perú 5234 14NCF Inversiones 7499 20NORVIAL 9303 20Neg. e Inmuebles 7020 19Peru Hold. de Turismo 7010 18Perú LNG (*) 1110 12Pluspetrol Camisea (*) 1110 12Pluspetrol Lote 56 (*) 1110 12RBC 9213 20Rash Perú 5233 14Saga Falabella 5219 14Scotia Soc. Titulizadora 6719-2 17Solución EAH 6592 11Supermercados Peruanos 5211-8 13Tiendas EFE 52335 14Total Artefactos 5233 14Transac. Financieras 0074 12
FONDOS DE INVERSION / INVESTMENT FUNDSCompass Pymes 660203 50Coril ICMP1 660203 50Coril ICMP2 660203 50Coril IF5 660203 50Coril IF7 660203 50FI Multirenta Inmobil. 7010 51Sigma-Fondo de Inv(*) 660203 51
INDUSTRIALES / INDUSTRIALABB 31102 33Agroindustrias AIB 1513 24Alicorp 1514 25Ameral 1514 25Austral Group 15127 24BAT Holdings 1600 26CREDITEX 1711 26Cemento Andino 2694 30Cementos Lima 2694 30Cementos Pacasmayo 2694 31Cervecería San Juan 1553 26Conserv. de las Américas 15127 24Consor. Ind. Arequipa 2424-1 29Corp. Aceros Arequipa 2710 31Corporación Cerámica 2691 30Corporación Lindley 1554-02 26Corporación Miski(*) 15316-51212 25Corporación Misti 5190 34Cía. Goodyear 3551 34DELCROSA 3110 33EXSA 2429 29Editora El Comercio 2212 27Etna 31405-6 33Fab. Peruana Eternit 26957 31Filamentos Industr. 2430 29Gloria 1520 25Hidrostal 29120 32Hil. y Tej. San Miguel 150101 24IEQSA 2732 32Inca Tops 1711 27Indeco (*) 3130-4 33Industria Textil Piura 3211 33Industrias Vencedor 2422-0 28Industrias del Envase 2221/2520 27Intradevco Industrial 2424 29LAYCONSA 3699 34Laive 1520 25Lima Caucho 2511 30MEPSA 2731 31Michell y Cía. 1711 27Motores Diesel 343 34Peruana de Moldeados 2520 30Pesquera Exalmar (*) 0500 24Petroperú 2320 28Quimpac 2411-6 28RENASA 2429 29Rayon Industrial 24116 28Record 2899 32
Nombre CIIU Pag.Refineria La Pampilla (*) 23208 28SIAM 28990 32SIDERPERU 2731 32Soldex 3699 34UCP Backus & Johnston 1553-01 26Universal Textil 1711/1712/1810 27Yura 2694 31
MINERAS / MININGAndina de Exploraciones 1320 35Atacocha (*) 2302 38Buenaventura (*) 1320 35Castrovirreyna 1320 35Cerro Verde (*) 1310 35El Brocal (*) 1320 36Fosfatos del Pacífico 1421 38Gold Fields La Cima 1320 36MYGSA 1429 38Milpo (*) 2302 38Minera Barrick (*) 1320 36Minera Corona (*) 2302 38Minsur (*) 1320 36Morococha 1320 36Perubar (*) 2303 39Poderosa 1320 37Raura 1302 35SPCC - Suc. Perú (*) 1320 37Santa Luisa 1320 37Shougang Hierro Perú 1320 37Volcan (*) 1320 37
OTRAS INSTITUCIONES / INSTITUTIONSAC Capitales SAFI (**) 65994 45Compass Group SAFI(**) 6712 45Grupo Coril SAF (**) 6599 44Sigma SAFI (*) (**) 6712 45
SEGUROS / INSURANCEAce Seguros 6603 46Cardif del Perú 66036 48InVita Seguros de Vida 6601-0 46Insur Cia. de Seg. 6603 47Interseguro 6603 47La Positiva 6603 47La Positiva Vida 6601 46Mapfre Perú 6603 47Mapfre Perú Vida 66100 48Pacífico - Per. Suiza 66036 48Pacífico Vida 6601 46Protecta Cía de Seg. 6601 46Rímac Seguros y Reaseg. 6603-6 47Secrex 66036 48
SERVICIOS PUBLICOS / PUBLIC SERVICESChinango 4010 39Cons. Agua Azul 74996 44Cons. Transmantaro (*) 4010 39Duke Energy Egenor 4010-4 42EGESUR 4010 39ENERSUR (*) 4010 39Edegel 4010 40Edelnor 4010 40Electro Dunas 40104 43Electro Puno 40104 43Electro Sur Este 4010 40Electroperú 40104 43Electrosur 4010 40Eléctrica de Piura 4010 40Gas Nat Lima y Callao (*) 4020 43Generandes 4010 41Hidrandina 4010 41Kallpa Generación(*) 4010 41Luz del Sur 4010 41Peruana de Energía 4010 41Red de Energía (*) 4010 42SEAL 4010 42SHOUGESA 4010 42San Gabán 4010 42Sedapal 4100 43TGP (*) 6030 44Telefónica Móviles 6420 44Telefónica del Perú 64207 44
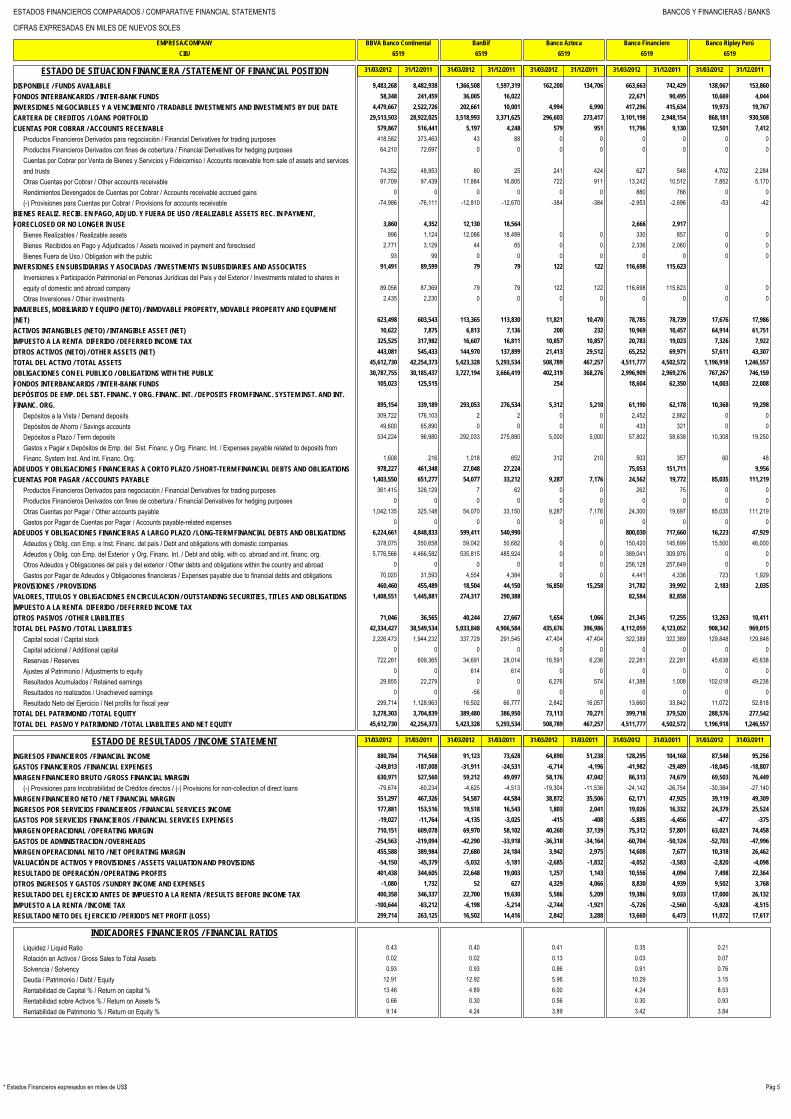
ESTADOS FINANCIEROS COMPARADOS / COMPARATIVE FINANCIAL STATEMENTS BANCOS Y FINANCIERAS / BANKS
CIFRAS EXPRESADAS EN MILES DE NUEVOS SOLES
EMPRESA/COMPANY BBVA Banco Continental BanBif Banco Azteca Banco Financiero Banco Ripley Perú
CIIU 6519 6519 6519 6519 6519
Pág 5* Estados Financieros expresados en miles de US$
ESTADO DE SITUACION FINANCIERA / STATEMENT OF FINANCIAL POSITION 31/03/2012 31/12/2011 31/03/2012 31/12/2011 31/03/2012 31/12/2011 31/03/2012 31/12/2011 31/03/2012 31/12/2011
DISPONIBLE / FUNDS AVAILABLE 9,483,268 8,482,938 1,366,508 1,597,319 162,200 134,706 663,663 742,429 138,067 153,860
FONDOS INTERBANCARIOS / INTER-BANK FUNDS 58,348 241,459 36,005 16,022 22,671 90,495 10,669 4,044
INVERSIONES NEGOCIABLES Y A VENCIMIENTO / TRADABLE INVESTMENTS AND INVESTMENTS BY DUE DATE 4,479,667 2,522,726 202,661 10,001 4,994 6,990 417,296 415,634 19,973 19,767
CARTERA DE CREDITOS / LOANS PORTFOLIO 29,513,503 28,922,025 3,518,993 3,371,625 296,603 273,417 3,101,198 2,948,154 868,181 930,508
CUENTAS POR COBRAR / ACCOUNTS RECEIVABLE 579,867 516,441 5,197 4,248 579 951 11,796 9,130 12,501 7,412
Productos Financieros Derivados para negociación / Financial Derivatives for trading purposes 418,582 373,463 43 88 0 0 0 0 0 0Productos Financieros Derivados con fines de cobertura / Financial Derivatives for hedging purposes 64,210 72,697 0 0 0 0 0 0 0 0Cuentas por Cobrar por Venta de Bienes y Servicios y Fideicomiso / Accounts receivable from sale of assets and servicesand trusts 74,352 48,953 80 25 241 424 627 548 4,702 2,284Otras Cuentas por Cobrar / Other accounts receivable 97,709 97,439 17,884 16,805 722 911 13,242 10,512 7,852 5,170Rendimientos Devengados de Cuentas por Cobrar / Accounts receivable accrued gains 0 0 0 0 0 0 880 766 0 0(-) Provisiones para Cuentas por Cobrar / Provisions for accounts receivable -74,986 -76,111 -12,810 -12,670 -384 -384 -2,953 -2,696 -53 -42
BIENES REALIZ. RECIB. EN PAGO, ADJUD. Y FUERA DE USO / REALIZABLE ASSETS REC. IN PAYMENT,
FORECLOSED OR NO LONGER IN USE 3,860 4,352 12,130 18,564 2,666 2,917
Bienes Realizables / Realizable assets 996 1,124 12,086 18,499 0 0 330 857 0 0Bienes Recibidos en Pago y Adjudicados / Assets received in payment and foreclosed 2,771 3,129 44 65 0 0 2,336 2,060 0 0Bienes Fuera de Uso / Obligation with the public 93 99 0 0 0 0 0 0 0 0
INVERSIONES EN SUBSIDIARIAS Y ASOCIADAS / INVESTMENTS IN SUBSIDIARIES AND ASSOCIATES 91,491 89,599 79 79 122 122 116,698 115,623
Inversiones x Participación Patrimonial en Personas Jurídicas del País y del Exterior / Investments related to shares inequity of domestic and abroad company 89,056 87,369 79 79 122 122 116,698 115,623 0 0Otras Inversiones / Other investments 2,435 2,230 0 0 0 0 0 0 0 0
INMUEBLES, MOBILIARIO Y EQUIPO (NETO) / INMOVABLE PROPERTY, MOVABLE PROPERTY AND EQUIPMENT
(NET) 623,498 603,543 113,365 113,830 11,821 10,470 78,785 78,739 17,676 17,986
ACTIVOS INTANGIBLES (NETO) / INTANGIBLE ASSET (NET) 10,622 7,875 6,813 7,136 200 232 10,969 10,457 64,914 61,751
IMPUESTO A LA RENTA DIFERIDO / DEFERRED INCOME TAX 325,525 317,982 16,607 16,811 10,857 10,857 20,783 19,023 7,326 7,922
OTROS ACTIVOS (NETO) / OTHER ASSETS (NET) 443,081 545,433 144,970 137,899 21,413 29,512 65,252 69,971 57,611 43,307
TOTAL DEL ACTIVO / TOTAL ASSETS 45,612,730 42,254,373 5,423,328 5,293,534 508,789 467,257 4,511,777 4,502,572 1,196,918 1,246,557
OBLIGACIONES CON EL PUBLICO / OBLIGATIONS WITH THE PUBLIC 30,787,755 30,185,437 3,727,194 3,666,419 402,319 368,276 2,996,909 2,969,276 767,267 746,159
FONDOS INTERBANCARIOS / INTER-BANK FUNDS 105,023 125,515 254 18,604 62,350 14,003 22,008
DEPÓSITOS DE EMP. DEL SIST. FINANC. Y ORG. FINANC. INT. / DEPOSITS FROM FINANC. SYSTEM INST. AND INT.
FINANC. ORG. 895,154 339,189 293,053 276,534 5,312 5,210 61,190 62,178 10,368 19,298
Depósitos a la Vista / Demand deposits 309,722 176,103 2 2 0 0 2,452 2,862 0 0Depósitos de Ahorro / Savings accounts 49,600 65,890 0 0 0 0 433 321 0 0Depósitos a Plazo / Term deposits 534,224 96,980 292,033 275,880 5,000 5,000 57,802 58,638 10,308 19,250Gastos x Pagar x Depósitos de Emp. del Sist. Financ. y Org. Financ. Int. / Expenses payable related to deposits fromFinanc. System Inst. And Int. Financ. Org. 1,608 216 1,018 652 312 210 503 357 60 48
ADEUDOS Y OBLIGACIONES FINANCIERAS A CORTO PLAZO / SHORT-TERM FINANCIAL DEBTS AND OBLIGATIONS 978,227 461,348 27,048 27,224 75,053 151,711 9,956
CUENTAS POR PAGAR / ACCOUNTS PAYABLE 1,403,550 651,277 54,077 33,212 9,287 7,176 24,562 19,772 85,035 111,219
Productos Financieros Derivados para negociación / Financial Derivatives for trading purposes 361,415 326,129 7 62 0 0 262 75 0 0Productos Financieros Derivados con fines de cobertura / Financial Derivatives for hedging purposes 0 0 0 0 0 0 0 0 0 0Otras Cuentas por Pagar / Other accounts payable 1,042,135 325,148 54,070 33,150 9,287 7,176 24,300 19,697 85,035 111,219Gastos por Pagar de Cuentas por Pagar / Accounts payable-related expenses 0 0 0 0 0 0 0 0 0 0
ADEUDOS Y OBLIGACIONES FINANCIERAS A LARGO PLAZO / LONG-TERM FINANCIAL DEBTS AND OBLIGATIONS 6,224,661 4,848,833 599,411 540,990 800,030 717,660 16,223 47,929
Adeudos y Oblig. con Emp. e Inst. Financ. del país / Debt and obligations with domestic companies 378,075 350,658 59,042 50,682 0 0 150,420 145,699 15,500 46,000Adeudos y Oblig. con Emp. del Exterior y Org. Financ. Int. / Debt and oblig. with co. abroad and int. financ. org. 5,776,566 4,466,582 535,815 485,924 0 0 389,041 309,976 0 0Otros Adeudos y Obligaciones del país y del exterior / Other debts and obligations within the country and abroad 0 0 0 0 0 0 256,128 257,649 0 0Gastos por Pagar de Adeudos y Obligaciones financieras / Expenses payable due to financial debts and obligations 70,020 31,593 4,554 4,384 0 0 4,441 4,336 723 1,929
PROVISIONES / PROVISIONS 460,460 455,489 18,504 44,150 16,850 15,258 31,782 39,992 2,183 2,035
VALORES, TITULOS Y OBLIGACIONES EN CIRCULACION / OUTSTANDING SECURITIES, TITLES AND OBLIGATIONS 1,408,551 1,445,881 274,317 290,388 82,584 82,858
IMPUESTO A LA RENTA DIFERIDO / DEFERRED INCOME TAX
OTROS PASIVOS / OTHER LIABILITIES 71,046 36,565 40,244 27,667 1,654 1,066 21,345 17,255 13,263 10,411
TOTAL DEL PASIVO / TOTAL LIABILITIES 42,334,427 38,549,534 5,033,848 4,906,584 435,676 396,986 4,112,059 4,123,052 908,342 969,015
Capital social / Capital stock 2,226,473 1,944,232 337,729 291,545 47,404 47,404 322,389 322,389 129,848 129,848Capital adicional / Additional capital 0 0 0 0 0 0 0 0 0 0Reservas / Reserves 722,261 609,365 34,691 28,014 16,591 6,236 22,281 22,281 45,638 45,638Ajustes al Patrimonio / Adjustments to equity 0 0 614 614 0 0 0 0 0 0Resultados Acumulados / Retained earnings 29,855 22,279 0 0 6,276 574 41,388 1,008 102,018 49,238Resultados no realizados / Unachieved earnings 0 0 -56 0 0 0 0 0 0 0Resultado Neto del Ejercicio / Net profits for fiscal year 299,714 1,128,963 16,502 66,777 2,842 16,057 13,660 33,842 11,072 52,818
TOTAL DEL PATRIMONIO / TOTAL EQUITY 3,278,303 3,704,839 389,480 386,950 73,113 70,271 399,718 379,520 288,576 277,542
TOTAL DEL PASIVO Y PATRIMONIO / TOTAL LIABILITIES AND NET EQUITY 45,612,730 42,254,373 5,423,328 5,293,534 508,789 467,257 4,511,777 4,502,572 1,196,918 1,246,557
ESTADO DE RESULTADOS / INCOME STATEMENT 31/03/2012 31/03/2011 31/03/2012 31/03/2011 31/03/2012 31/03/2011 31/03/2012 31/03/2011 31/03/2012 31/03/2011
INGRESOS FINANCIEROS / FINANCIAL INCOME 880,784 714,568 91,123 73,628 64,890 51,238 128,295 104,168 87,548 95,256
GASTOS FINANCIEROS / FINANCIAL EXPENSES -249,813 -187,008 -31,911 -24,531 -6,714 -4,196 -41,982 -29,489 -18,045 -18,807
MARGEN FINANCIERO BRUTO / GROSS FINANCIAL MARGIN 630,971 527,560 59,212 49,097 58,176 47,042 86,313 74,679 69,503 76,449
(-) Provisiones para Incobrabilidad de Créditos directos / (-) Provisions for non-collection of direct loans -79,674 -60,234 -4,625 -4,513 -19,304 -11,536 -24,142 -26,754 -30,384 -27,140MARGEN FINANCIERO NETO / NET FINANCIAL MARGIN 551,297 467,326 54,587 44,584 38,872 35,506 62,171 47,925 39,119 49,309
INGRESOS POR SERVICIOS FINANCIEROS / FINANCIAL SERVICES INCOME 177,881 153,516 19,518 16,543 1,803 2,041 19,026 16,332 24,379 25,524
GASTOS POR SERVICIOS FINANCIEROS / FINANCIAL SERVICES EXPENSES -19,027 -11,764 -4,135 -3,025 -415 -408 -5,885 -6,456 -477 -375
MARGEN OPERACIONAL / OPERATING MARGIN 710,151 609,078 69,970 58,102 40,260 37,139 75,312 57,801 63,021 74,458
GASTOS DE ADMINISTRACION / OVERHEADS -254,563 -219,094 -42,290 -33,918 -36,318 -34,164 -60,704 -50,124 -52,703 -47,996
MARGEN OPERACIONAL NETO / NET OPERATING MARGIN 455,588 389,984 27,680 24,184 3,942 2,975 14,608 7,677 10,318 26,462
VALUACIÓN DE ACTIVOS Y PROVISIONES / ASSETS VALUATION AND PROVISIONS -54,150 -45,379 -5,032 -5,181 -2,685 -1,832 -4,052 -3,583 -2,820 -4,098
RESULTADO DE OPERACIÓN / OPERATING PROFITS 401,438 344,605 22,648 19,003 1,257 1,143 10,556 4,094 7,498 22,364
OTROS INGRESOS Y GASTOS / SUNDRY INCOME AND EXPENSES -1,080 1,732 52 627 4,329 4,066 8,830 4,939 9,502 3,768
RESULTADO DEL EJERCICIO ANTES DE IMPUESTO A LA RENTA / RESULTS BEFORE INCOME TAX 400,358 346,337 22,700 19,630 5,586 5,209 19,386 9,033 17,000 26,132
IMPUESTO A LA RENTA / INCOME TAX -100,644 -83,212 -6,198 -5,214 -2,744 -1,921 -5,726 -2,560 -5,928 -8,515
RESULTADO NETO DEL EJERCICIO / PERIOD'S NET PROFIT (LOSS) 299,714 263,125 16,502 14,416 2,842 3,288 13,660 6,473 11,072 17,617
INDICADORES FINANCIEROS / FINANCIAL RATIOS
Liquidez / Liquid Ratio 0.43 0.40 0.41 0.35 0.21 Rotación en Activos / Gross Sales to Total Assets 0.02 0.02 0.13 0.03 0.07 Solvencia / Solvency 0.93 0.93 0.86 0.91 0.76 Deuda / Patrimonio / Debt / Equity 12.91 12.92 5.96 10.29 3.15 Rentabilidad de Capital % / Return on capital % 13.46 4.89 6.00 4.24 8.53 Rentabilidad sobre Activos % / Return on Assets % 0.66 0.30 0.56 0.30 0.93 Rentabilidad de Patrimonio % / Return on Equity % 9.14 4.24 3.89 3.42 3.84

ESTADOS FINANCIEROS COMPARADOS / COMPARATIVE FINANCIAL STATEMENTS BANCOS Y FINANCIERAS / BANKS
CIFRAS EXPRESADAS EN MILES DE NUEVOS SOLES
EMPRESA/COMPANY Banco Santander Perú Banco de Comercio Banco de Crédito CMAC Arequipa Deutsche Bank Perú
CIIU 6519 6519 6519 6519 6519
Pág 6 * Estados Financieros expresados en miles de US$
ESTADO DE SITUACION FINANCIERA / STATEMENT OF FINANCIAL POSITION 31/03/2012 31/12/2011 31/03/2012 31/12/2011 31/03/2012 31/12/2011 31/03/2012 31/12/2011 31/03/2012 31/12/2011
DISPONIBLE / FUNDS AVAILABLE 923,659 861,282 388,130 395,301 15,683,464 14,118,643 336,819 321,722 651,310 591,716
FONDOS INTERBANCARIOS / INTER-BANK FUNDS 46,945 73,485 10,002 15,605 50,676 6,002
INVERSIONES NEGOCIABLES Y A VENCIMIENTO / TRADABLE INVESTMENTS AND INVESTMENTS BY DUE DATE 97,480 130,519 10,881 6,872 11,541,950 8,267,248 19,319 16,586 21,277 2,783
CARTERA DE CREDITOS / LOANS PORTFOLIO 1,104,479 1,126,712 1,119,752 1,112,838 42,285,601 41,284,343 1,998,227 1,896,125
CUENTAS POR COBRAR / ACCOUNTS RECEIVABLE 9,180 10,443 2,445 2,601 741,410 549,125 450 345 8,193 6,597
Productos Financieros Derivados para negociación / Financial Derivatives for trading purposes 8,294 9,349 0 0 283,714 301,272 0 0 7,867 6,510Productos Financieros Derivados con fines de cobertura / Financial Derivatives for hedging purposes 0 0 0 0 56,106 31,988 0 0 0 0Cuentas por Cobrar por Venta de Bienes y Servicios y Fideicomiso / Accounts receivable from sale of assets and servicesand trusts 0 0 328 338 64,652 69,267 0 0 45 52Otras Cuentas por Cobrar / Other accounts receivable 935 1,143 5,089 5,189 356,856 164,735 530 413 281 35Rendimientos Devengados de Cuentas por Cobrar / Accounts receivable accrued gains 0 0 874 883 0 0 0 0 0 0(-) Provisiones para Cuentas por Cobrar / Provisions for accounts receivable -49 -49 -3,846 -3,809 -19,918 -18,137 -80 -68 0 0
BIENES REALIZ. RECIB. EN PAGO, ADJUD. Y FUERA DE USO / REALIZABLE ASSETS REC. IN PAYMENT,
FORECLOSED OR NO LONGER IN USE 4,206 1,472 31,752 31,567 647 598
Bienes Realizables / Realizable assets 0 0 4,031 1,274 21,721 26,263 0 0 0 0Bienes Recibidos en Pago y Adjudicados / Assets received in payment and foreclosed 0 0 175 198 10,031 5,304 647 598 0 0Bienes Fuera de Uso / Obligation with the public 0 0 0 0 0 0 0 0 0 0
INVERSIONES EN SUBSIDIARIAS Y ASOCIADAS / INVESTMENTS IN SUBSIDIARIES AND ASSOCIATES 63 63 26,615 26,943 1,273,820 1,150,190 1,075 1,075
Inversiones x Participación Patrimonial en Personas Jurídicas del País y del Exterior / Investments related to shares inequity of domestic and abroad company 0 0 21,803 20,960 1,273,820 1,150,190 0 0 0 0Otras Inversiones / Other investments 63 63 4,812 5,983 0 0 1,075 1,075 0 0
INMUEBLES, MOBILIARIO Y EQUIPO (NETO) / INMOVABLE PROPERTY, MOVABLE PROPERTY AND EQUIPMENT
(NET) 2,139 1,919 33,774 34,362 1,049,526 1,053,999 43,653 42,108 5,207 5,678
ACTIVOS INTANGIBLES (NETO) / INTANGIBLE ASSET (NET) 1,990 2,315 14,120 12,724 499,969 569,813 9,422 8,684 295 411
IMPUESTO A LA RENTA DIFERIDO / DEFERRED INCOME TAX 7,312 6,177 15,515 15,448 120,935 271,538 18,295 18,499 678 720
OTROS ACTIVOS (NETO) / OTHER ASSETS (NET) 66,043 72,795 6,819 10,389 1,446,195 819,107 10,255 4,391 201,953 383,936
TOTAL DEL ACTIVO / TOTAL ASSETS 2,259,290 2,285,710 1,622,257 1,618,950 74,684,624 68,131,178 2,438,162 2,310,133 939,589 997,843
OBLIGACIONES CON EL PUBLICO / OBLIGATIONS WITH THE PUBLIC 1,571,775 1,680,726 1,368,023 1,369,731 49,206,637 44,272,978 1,988,357 1,864,268 514,506 404,598
FONDOS INTERBANCARIOS / INTER-BANK FUNDS 10,669 94,362 367,073 359,888 44,485
DEPÓSITOS DE EMP. DEL SIST. FINANC. Y ORG. FINANC. INT. / DEPOSITS FROM FINANC. SYSTEM INST. AND INT.
FINANC. ORG. 160,675 82,522 39,810 28,738 467,028 474,768 9,633 9,272 71,348 29,658
Depósitos a la Vista / Demand deposits 0 0 419 406 214,731 276,203 0 0 0 0Depósitos de Ahorro / Savings accounts 0 0 0 0 46,649 44,539 931 708 0 0Depósitos a Plazo / Term deposits 159,347 82,352 39,391 28,332 205,648 154,026 8,401 8,401 71,341 29,656Gastos x Pagar x Depósitos de Emp. del Sist. Financ. y Org. Financ. Int. / Expenses payable related to deposits fromFinanc. System Inst. And Int. Financ. Org. 1,328 170 0 0 0 0 301 163 7 2
ADEUDOS Y OBLIGACIONES FINANCIERAS A CORTO PLAZO / SHORT-TERM FINANCIAL DEBTS AND OBLIGATIONS 10,543 7,330 6,464 17,000 2,721,743 2,410,623 30,266 45,113 233,217
CUENTAS POR PAGAR / ACCOUNTS PAYABLE 17,944 18,582 11,342 9,736 1,475,308 749,255 20,440 26,524 16,356 19,628
Productos Financieros Derivados para negociación / Financial Derivatives for trading purposes 10,835 9,659 0 0 215,656 184,604 0 0 13,759 16,328Productos Financieros Derivados con fines de cobertura / Financial Derivatives for hedging purposes 0 0 0 0 47,385 51,448 0 0 0 0Otras Cuentas por Pagar / Other accounts payable 7,109 8,923 11,342 9,736 1,212,251 513,187 20,440 26,524 2,597 3,300Gastos por Pagar de Cuentas por Pagar / Accounts payable-related expenses 0 0 0 0 16 16 0 0 0 0
ADEUDOS Y OBLIGACIONES FINANCIERAS A LARGO PLAZO / LONG-TERM FINANCIAL DEBTS AND OBLIGATIONS 227,508 228,085 24,409 24,945 5,380,497 4,894,004 37,098 45,267
Adeudos y Oblig. con Emp. e Inst. Financ. del país / Debt and obligations with domestic companies 0 0 8,485 8,807 0 0 6,370 12,184 0 0Adeudos y Oblig. con Emp. del Exterior y Org. Financ. Int. / Debt and oblig. with co. abroad and int. financ. org. 224,028 226,464 10,668 10,784 2,793,984 2,215,208 30,650 32,987 0 0Otros Adeudos y Obligaciones del país y del exterior / Other debts and obligations within the country and abroad 0 0 5,255 5,337 2,560,975 2,664,096 0 0 0 0Gastos por Pagar de Adeudos y Obligaciones financieras / Expenses payable due to financial debts and obligations 3,480 1,621 1 17 25,538 14,700 78 96 0 0
PROVISIONES / PROVISIONS 5,342 5,186 2,649 2,485 195,632 201,075 16,208 5,590 48
VALORES, TITULOS Y OBLIGACIONES EN CIRCULACION / OUTSTANDING SECURITIES, TITLES AND OBLIGATIONS 15,150 15,336 20,333 20,287 8,209,222 8,250,155
IMPUESTO A LA RENTA DIFERIDO / DEFERRED INCOME TAX
OTROS PASIVOS / OTHER LIABILITIES 10 5,243 3,858 423,607 222,779 6,762 7,199 184,335 117,532
TOTAL DEL PASIVO / TOTAL LIABILITIES 2,019,606 2,132,139 1,478,273 1,476,780 68,446,747 61,835,525 2,108,764 2,003,233 786,545 849,166
Capital social / Capital stock 231,300 150,600 119,198 119,198 3,187,897 2,557,738 189,444 189,444 129,772 129,772Capital adicional / Additional capital 0 0 9 9 0 0 182 182 0 0Reservas / Reserves 2,973 0 7,609 7,609 2,224,578 2,004,022 49,946 49,946 4,444 2,837Ajustes al Patrimonio / Adjustments to equity 0 0 0 0 0 0 0 0 0 0Resultados Acumulados / Retained earnings -8 -11,270 15,409 -1,228 0 0 67,328 0 14,461 0Resultados no realizados / Unachieved earnings 0 0 0 0 409,838 294,899 0 0 0 0Resultado Neto del Ejercicio / Net profits for fiscal year 5,419 14,241 1,759 16,582 415,564 1,438,994 22,498 67,328 4,367 16,068
TOTAL DEL PATRIMONIO / TOTAL EQUITY 239,684 153,571 143,984 142,170 6,237,877 6,295,653 329,398 306,900 153,044 148,677
TOTAL DEL PASIVO Y PATRIMONIO / TOTAL LIABILITIES AND NET EQUITY 2,259,290 2,285,710 1,622,257 1,618,950 74,684,624 68,131,178 2,438,162 2,310,133 939,589 997,843
ESTADO DE RESULTADOS / INCOME STATEMENT 31/03/2012 31/03/2011 31/03/2012 31/03/2011 31/03/2012 31/03/2011 31/03/2012 31/03/2011 31/03/2012 31/03/2011
INGRESOS FINANCIEROS / FINANCIAL INCOME 29,938 17,431 47,373 43,884 1,350,782 1,148,318 121,402 97,345 8,815 13,771
GASTOS FINANCIEROS / FINANCIAL EXPENSES -15,839 -6,787 -19,060 -15,829 -367,861 -325,697 -27,231 -22,153 -2,081 -8,394
MARGEN FINANCIERO BRUTO / GROSS FINANCIAL MARGIN 14,099 10,644 28,313 28,055 982,921 822,621 94,171 75,192 6,734 5,377
(-) Provisiones para Incobrabilidad de Créditos directos / (-) Provisions for non-collection of direct loans -2,432 -2,268 -8,362 -8,317 -194,215 -126,097 -15,834 -11,084 0 0MARGEN FINANCIERO NETO / NET FINANCIAL MARGIN 11,667 8,376 19,951 19,738 788,706 696,524 78,337 64,108 6,734 5,377
INGRESOS POR SERVICIOS FINANCIEROS / FINANCIAL SERVICES INCOME 5,571 2,916 4,615 4,578 349,859 304,821 1,512 993 4,047 38
GASTOS POR SERVICIOS FINANCIEROS / FINANCIAL SERVICES EXPENSES -2,166 -1,912 -2,065 -2,390 -26,014 -31,918 -1,065 -901 -83 -75
MARGEN OPERACIONAL / OPERATING MARGIN 15,072 9,380 22,501 21,926 1,112,551 969,427 78,784 64,200 10,698 5,340
GASTOS DE ADMINISTRACION / OVERHEADS -7,033 -6,122 -19,231 -18,423 -520,434 -461,180 -47,365 -38,946 -4,256 -4,615
MARGEN OPERACIONAL NETO / NET OPERATING MARGIN 8,039 3,258 3,270 3,503 592,117 508,247 31,419 25,254 6,442 725
VALUACIÓN DE ACTIVOS Y PROVISIONES / ASSETS VALUATION AND PROVISIONS -977 -647 -1,822 -1,909 -75,191 -56,883 -2,476 -2,619 -577 -574
RESULTADO DE OPERACIÓN / OPERATING PROFITS 7,062 2,611 1,448 1,594 516,926 451,364 28,943 22,635 5,865 151
OTROS INGRESOS Y GASTOS / SUNDRY INCOME AND EXPENSES 0 1,022 881 -485 22,999 36,163 3,338 3,658 -85 -266
RESULTADO DEL EJERCICIO ANTES DE IMPUESTO A LA RENTA / RESULTS BEFORE INCOME TAX 7,062 3,633 2,329 1,109 539,925 487,527 32,281 26,293 5,780 -115
IMPUESTO A LA RENTA / INCOME TAX -1,643 -807 -570 -288 -124,361 -115,047 -9,783 -7,953 -1,413 -55
RESULTADO NETO DEL EJERCICIO / PERIOD'S NET PROFIT (LOSS) 5,419 2,826 1,759 821 415,564 372,480 22,498 18,340 4,367 -170
INDICADORES FINANCIEROS / FINANCIAL RATIOS
Liquidez / Liquid Ratio 0.61 0.28 0.52 0.18 1.23 Rotación en Activos / Gross Sales to Total Assets 0.01 0.03 0.02 0.05 0.01 Solvencia / Solvency 0.89 0.91 0.92 0.86 0.84 Deuda / Patrimonio / Debt / Equity 8.43 10.27 10.97 6.40 5.14 Rentabilidad de Capital % / Return on capital % 2.34 1.48 13.04 11.88 3.37 Rentabilidad sobre Activos % / Return on Assets % 0.24 0.11 0.56 0.92 0.46 Rentabilidad de Patrimonio % / Return on Equity % 2.26 1.22 6.66 6.83 2.85
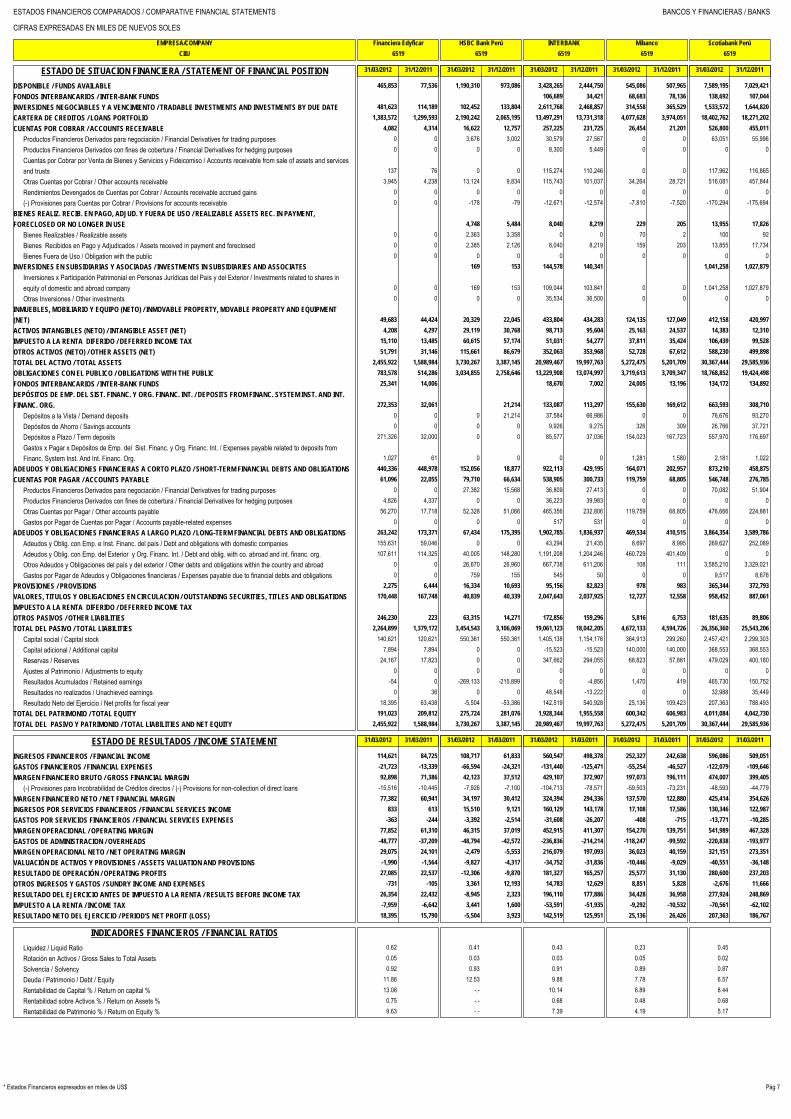
ESTADOS FINANCIEROS COMPARADOS / COMPARATIVE FINANCIAL STATEMENTS BANCOS Y FINANCIERAS / BANKS
CIFRAS EXPRESADAS EN MILES DE NUEVOS SOLES
EMPRESA/COMPANY Financiera Edyficar HSBC Bank Perú INTERBANK Mibanco Scotiabank Perú
CIIU 6519 6519 6519 6519 6519
Pág 7* Estados Financieros expresados en miles de US$
ESTADO DE SITUACION FINANCIERA / STATEMENT OF FINANCIAL POSITION 31/03/2012 31/12/2011 31/03/2012 31/12/2011 31/03/2012 31/12/2011 31/03/2012 31/12/2011 31/03/2012 31/12/2011
DISPONIBLE / FUNDS AVAILABLE 465,853 77,536 1,190,310 973,086 3,428,265 2,444,750 545,086 507,965 7,589,195 7,029,421
FONDOS INTERBANCARIOS / INTER-BANK FUNDS 106,689 34,421 68,683 78,136 138,692 107,044
INVERSIONES NEGOCIABLES Y A VENCIMIENTO / TRADABLE INVESTMENTS AND INVESTMENTS BY DUE DATE 481,623 114,189 102,452 133,804 2,611,768 2,468,857 314,558 365,529 1,533,572 1,644,820
CARTERA DE CREDITOS / LOANS PORTFOLIO 1,383,572 1,299,593 2,190,242 2,065,195 13,497,291 13,731,318 4,077,628 3,974,051 18,402,762 18,271,202
CUENTAS POR COBRAR / ACCOUNTS RECEIVABLE 4,082 4,314 16,622 12,757 257,225 231,725 26,454 21,201 526,800 455,011
Productos Financieros Derivados para negociación / Financial Derivatives for trading purposes 0 0 3,676 3,002 30,579 27,567 0 0 63,051 55,996Productos Financieros Derivados con fines de cobertura / Financial Derivatives for hedging purposes 0 0 0 0 8,300 5,449 0 0 0 0Cuentas por Cobrar por Venta de Bienes y Servicios y Fideicomiso / Accounts receivable from sale of assets and servicesand trusts 137 76 0 0 115,274 110,246 0 0 117,962 116,865Otras Cuentas por Cobrar / Other accounts receivable 3,945 4,238 13,124 9,834 115,743 101,037 34,264 28,721 516,081 457,844Rendimientos Devengados de Cuentas por Cobrar / Accounts receivable accrued gains 0 0 0 0 0 0 0 0 0 0(-) Provisiones para Cuentas por Cobrar / Provisions for accounts receivable 0 0 -178 -79 -12,671 -12,574 -7,810 -7,520 -170,294 -175,694
BIENES REALIZ. RECIB. EN PAGO, ADJUD. Y FUERA DE USO / REALIZABLE ASSETS REC. IN PAYMENT,
FORECLOSED OR NO LONGER IN USE 4,748 5,484 8,040 8,219 229 205 13,955 17,826
Bienes Realizables / Realizable assets 0 0 2,363 3,358 0 0 70 2 100 92Bienes Recibidos en Pago y Adjudicados / Assets received in payment and foreclosed 0 0 2,385 2,126 8,040 8,219 159 203 13,855 17,734Bienes Fuera de Uso / Obligation with the public 0 0 0 0 0 0 0 0 0 0
INVERSIONES EN SUBSIDIARIAS Y ASOCIADAS / INVESTMENTS IN SUBSIDIARIES AND ASSOCIATES 169 153 144,578 140,341 1,041,258 1,027,879
Inversiones x Participación Patrimonial en Personas Jurídicas del País y del Exterior / Investments related to shares inequity of domestic and abroad company 0 0 169 153 109,044 103,841 0 0 1,041,258 1,027,879Otras Inversiones / Other investments 0 0 0 0 35,534 36,500 0 0 0 0
INMUEBLES, MOBILIARIO Y EQUIPO (NETO) / INMOVABLE PROPERTY, MOVABLE PROPERTY AND EQUIPMENT
(NET) 49,683 44,424 20,329 22,045 433,804 434,283 124,135 127,049 412,158 420,997
ACTIVOS INTANGIBLES (NETO) / INTANGIBLE ASSET (NET) 4,208 4,297 29,119 30,768 98,713 95,604 25,163 24,537 14,383 12,310
IMPUESTO A LA RENTA DIFERIDO / DEFERRED INCOME TAX 15,110 13,485 60,615 57,174 51,031 54,277 37,811 35,424 106,439 99,528
OTROS ACTIVOS (NETO) / OTHER ASSETS (NET) 51,791 31,146 115,661 86,679 352,063 353,968 52,728 67,612 588,230 499,898
TOTAL DEL ACTIVO / TOTAL ASSETS 2,455,922 1,588,984 3,730,267 3,387,145 20,989,467 19,997,763 5,272,475 5,201,709 30,367,444 29,585,936
OBLIGACIONES CON EL PUBLICO / OBLIGATIONS WITH THE PUBLIC 783,578 514,286 3,034,855 2,758,646 13,229,908 13,074,997 3,719,613 3,709,347 18,768,852 19,424,498
FONDOS INTERBANCARIOS / INTER-BANK FUNDS 25,341 14,006 18,670 7,002 24,005 13,196 134,172 134,892
DEPÓSITOS DE EMP. DEL SIST. FINANC. Y ORG. FINANC. INT. / DEPOSITS FROM FINANC. SYSTEM INST. AND INT.
FINANC. ORG. 272,353 32,061 21,214 133,087 113,297 155,630 169,612 663,593 308,710
Depósitos a la Vista / Demand deposits 0 0 0 21,214 37,584 66,986 0 0 76,676 93,270Depósitos de Ahorro / Savings accounts 0 0 0 0 9,926 9,275 326 309 26,766 37,721Depósitos a Plazo / Term deposits 271,326 32,000 0 0 85,577 37,036 154,023 167,723 557,970 176,697Gastos x Pagar x Depósitos de Emp. del Sist. Financ. y Org. Financ. Int. / Expenses payable related to deposits fromFinanc. System Inst. And Int. Financ. Org. 1,027 61 0 0 0 0 1,281 1,580 2,181 1,022
ADEUDOS Y OBLIGACIONES FINANCIERAS A CORTO PLAZO / SHORT-TERM FINANCIAL DEBTS AND OBLIGATIONS 440,336 448,978 152,056 18,877 922,113 429,195 164,071 202,957 873,210 458,875
CUENTAS POR PAGAR / ACCOUNTS PAYABLE 61,096 22,055 79,710 66,634 538,905 300,733 119,759 68,805 546,748 276,785
Productos Financieros Derivados para negociación / Financial Derivatives for trading purposes 0 0 27,382 15,568 36,809 27,413 0 0 70,082 51,904Productos Financieros Derivados con fines de cobertura / Financial Derivatives for hedging purposes 4,826 4,337 0 0 36,223 39,983 0 0 0 0Otras Cuentas por Pagar / Other accounts payable 56,270 17,718 52,328 51,066 465,356 232,806 119,759 68,805 476,666 224,881Gastos por Pagar de Cuentas por Pagar / Accounts payable-related expenses 0 0 0 0 517 531 0 0 0 0
ADEUDOS Y OBLIGACIONES FINANCIERAS A LARGO PLAZO / LONG-TERM FINANCIAL DEBTS AND OBLIGATIONS 263,242 173,371 67,434 175,395 1,902,785 1,836,937 469,534 410,515 3,864,354 3,589,786
Adeudos y Oblig. con Emp. e Inst. Financ. del país / Debt and obligations with domestic companies 155,631 59,046 0 0 43,294 21,435 8,697 8,995 269,627 252,089Adeudos y Oblig. con Emp. del Exterior y Org. Financ. Int. / Debt and oblig. with co. abroad and int. financ. org. 107,611 114,325 40,005 148,280 1,191,208 1,204,246 460,729 401,409 0 0Otros Adeudos y Obligaciones del país y del exterior / Other debts and obligations within the country and abroad 0 0 26,670 26,960 667,738 611,206 108 111 3,585,210 3,329,021Gastos por Pagar de Adeudos y Obligaciones financieras / Expenses payable due to financial debts and obligations 0 0 759 155 545 50 0 0 9,517 8,676
PROVISIONES / PROVISIONS 2,275 6,444 16,334 10,693 95,156 82,823 978 983 365,344 372,793
VALORES, TITULOS Y OBLIGACIONES EN CIRCULACION / OUTSTANDING SECURITIES, TITLES AND OBLIGATIONS 170,448 167,748 40,839 40,339 2,047,643 2,037,925 12,727 12,558 958,452 887,061
IMPUESTO A LA RENTA DIFERIDO / DEFERRED INCOME TAX
OTROS PASIVOS / OTHER LIABILITIES 246,230 223 63,315 14,271 172,856 159,296 5,816 6,753 181,635 89,806
TOTAL DEL PASIVO / TOTAL LIABILITIES 2,264,899 1,379,172 3,454,543 3,106,069 19,061,123 18,042,205 4,672,133 4,594,726 26,356,360 25,543,206
Capital social / Capital stock 140,621 120,621 550,361 550,361 1,405,138 1,154,176 364,913 299,260 2,457,421 2,299,303Capital adicional / Additional capital 7,894 7,894 0 0 -15,523 -15,523 140,000 140,000 368,553 368,553Reservas / Reserves 24,167 17,823 0 0 347,662 294,055 68,823 57,881 479,029 400,180Ajustes al Patrimonio / Adjustments to equity 0 0 0 0 0 0 0 0 0 0Resultados Acumulados / Retained earnings -54 0 -269,133 -215,899 0 -4,856 1,470 419 465,730 150,752Resultados no realizados / Unachieved earnings 0 36 0 0 48,548 -13,222 0 0 32,988 35,449Resultado Neto del Ejercicio / Net profits for fiscal year 18,395 63,438 -5,504 -53,386 142,519 540,928 25,136 109,423 207,363 788,493
TOTAL DEL PATRIMONIO / TOTAL EQUITY 191,023 209,812 275,724 281,076 1,928,344 1,955,558 600,342 606,983 4,011,084 4,042,730
TOTAL DEL PASIVO Y PATRIMONIO / TOTAL LIABILITIES AND NET EQUITY 2,455,922 1,588,984 3,730,267 3,387,145 20,989,467 19,997,763 5,272,475 5,201,709 30,367,444 29,585,936
ESTADO DE RESULTADOS / INCOME STATEMENT 31/03/2012 31/03/2011 31/03/2012 31/03/2011 31/03/2012 31/03/2011 31/03/2012 31/03/2011 31/03/2012 31/03/2011
INGRESOS FINANCIEROS / FINANCIAL INCOME 114,621 84,725 108,717 61,833 560,547 498,378 252,327 242,638 596,086 509,051
GASTOS FINANCIEROS / FINANCIAL EXPENSES -21,723 -13,339 -66,594 -24,321 -131,440 -125,471 -55,254 -46,527 -122,079 -109,646
MARGEN FINANCIERO BRUTO / GROSS FINANCIAL MARGIN 92,898 71,386 42,123 37,512 429,107 372,907 197,073 196,111 474,007 399,405
(-) Provisiones para Incobrabilidad de Créditos directos / (-) Provisions for non-collection of direct loans -15,516 -10,445 -7,926 -7,100 -104,713 -78,571 -59,503 -73,231 -48,593 -44,779MARGEN FINANCIERO NETO / NET FINANCIAL MARGIN 77,382 60,941 34,197 30,412 324,394 294,336 137,570 122,880 425,414 354,626
INGRESOS POR SERVICIOS FINANCIEROS / FINANCIAL SERVICES INCOME 833 613 15,510 9,121 160,129 143,178 17,108 17,586 130,346 122,987
GASTOS POR SERVICIOS FINANCIEROS / FINANCIAL SERVICES EXPENSES -363 -244 -3,392 -2,514 -31,608 -26,207 -408 -715 -13,771 -10,285
MARGEN OPERACIONAL / OPERATING MARGIN 77,852 61,310 46,315 37,019 452,915 411,307 154,270 139,751 541,989 467,328
GASTOS DE ADMINISTRACION / OVERHEADS -48,777 -37,209 -48,794 -42,572 -236,836 -214,214 -118,247 -99,592 -220,838 -193,977
MARGEN OPERACIONAL NETO / NET OPERATING MARGIN 29,075 24,101 -2,479 -5,553 216,079 197,093 36,023 40,159 321,151 273,351
VALUACIÓN DE ACTIVOS Y PROVISIONES / ASSETS VALUATION AND PROVISIONS -1,990 -1,564 -9,827 -4,317 -34,752 -31,836 -10,446 -9,029 -40,551 -36,148
RESULTADO DE OPERACIÓN / OPERATING PROFITS 27,085 22,537 -12,306 -9,870 181,327 165,257 25,577 31,130 280,600 237,203
OTROS INGRESOS Y GASTOS / SUNDRY INCOME AND EXPENSES -731 -105 3,361 12,193 14,783 12,629 8,851 5,828 -2,676 11,666
RESULTADO DEL EJERCICIO ANTES DE IMPUESTO A LA RENTA / RESULTS BEFORE INCOME TAX 26,354 22,432 -8,945 2,323 196,110 177,886 34,428 36,958 277,924 248,869
IMPUESTO A LA RENTA / INCOME TAX -7,959 -6,642 3,441 1,600 -53,591 -51,935 -9,292 -10,532 -70,561 -62,102
RESULTADO NETO DEL EJERCICIO / PERIOD'S NET PROFIT (LOSS) 18,395 15,790 -5,504 3,923 142,519 125,951 25,136 26,426 207,363 186,767
INDICADORES FINANCIEROS / FINANCIAL RATIOS
Liquidez / Liquid Ratio 0.62 0.41 0.43 0.23 0.45 Rotación en Activos / Gross Sales to Total Assets 0.05 0.03 0.03 0.05 0.02 Solvencia / Solvency 0.92 0.93 0.91 0.89 0.87 Deuda / Patrimonio / Debt / Equity 11.86 12.53 9.88 7.78 6.57 Rentabilidad de Capital % / Return on capital % 13.08 -.- 10.14 6.89 8.44 Rentabilidad sobre Activos % / Return on Assets % 0.75 -.- 0.68 0.48 0.68 Rentabilidad de Patrimonio % / Return on Equity % 9.63 -.- 7.39 4.19 5.17
ESTADOS FINANCIEROS COMPARADOS / COMPARATIVE FINANCIAL STATEMENTS BANCOS Y FINANCIERAS / BANKS
CIFRAS EXPRESADAS EN MILES DE NUEVOS SOLES
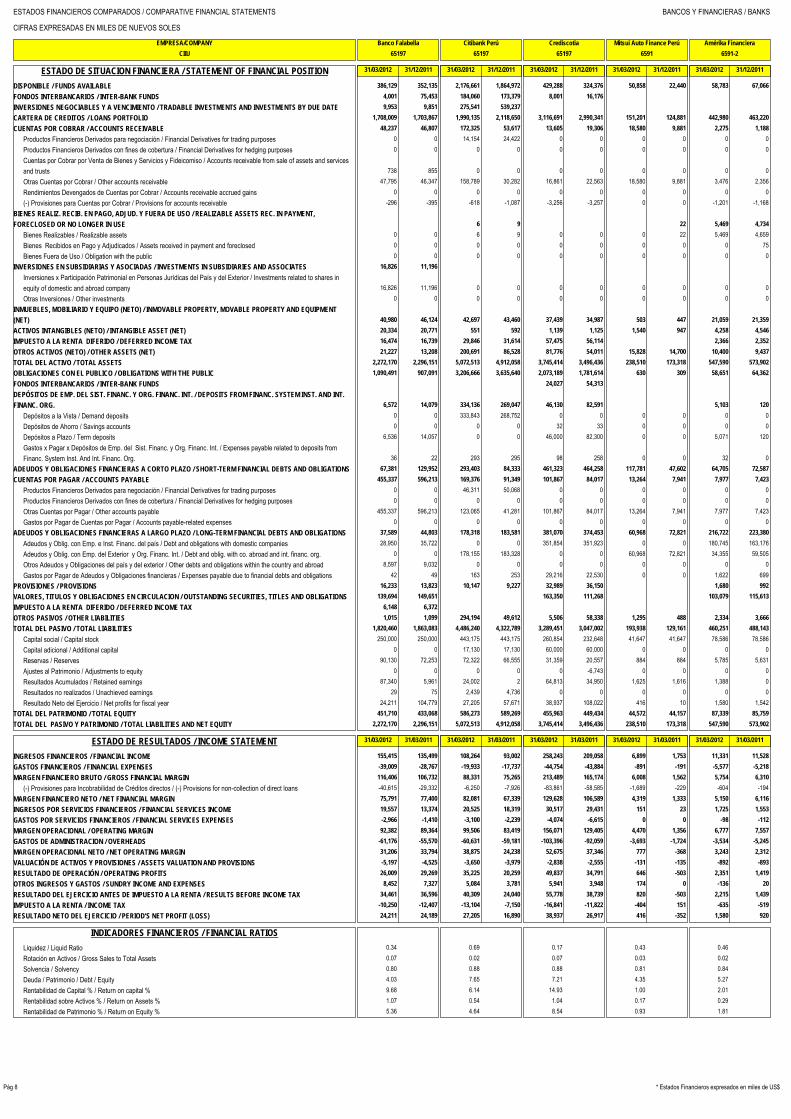
EMPRESA/COMPANY Banco Falabella Citibank Perú Crediscotia Mitsui Auto Finance Perú Amérika Financiera
CIIU 65197 65197 65197 6591 6591-2
Pág 8 * Estados Financieros expresados en miles de US$
ESTADO DE SITUACION FINANCIERA / STATEMENT OF FINANCIAL POSITION 31/03/2012 31/12/2011 31/03/2012 31/12/2011 31/03/2012 31/12/2011 31/03/2012 31/12/2011 31/03/2012 31/12/2011
DISPONIBLE / FUNDS AVAILABLE 386,129 352,135 2,176,661 1,864,972 429,288 324,376 50,858 22,440 58,783 67,066
FONDOS INTERBANCARIOS / INTER-BANK FUNDS 4,001 75,453 184,060 173,379 8,001 16,176
INVERSIONES NEGOCIABLES Y A VENCIMIENTO / TRADABLE INVESTMENTS AND INVESTMENTS BY DUE DATE 9,953 9,851 275,541 539,237
CARTERA DE CREDITOS / LOANS PORTFOLIO 1,708,009 1,703,867 1,990,135 2,118,650 3,116,691 2,990,341 151,201 124,881 442,980 463,220
CUENTAS POR COBRAR / ACCOUNTS RECEIVABLE 48,237 46,807 172,325 53,617 13,605 19,306 18,580 9,881 2,275 1,188
Productos Financieros Derivados para negociación / Financial Derivatives for trading purposes 0 0 14,154 24,422 0 0 0 0 0 0Productos Financieros Derivados con fines de cobertura / Financial Derivatives for hedging purposes 0 0 0 0 0 0 0 0 0 0Cuentas por Cobrar por Venta de Bienes y Servicios y Fideicomiso / Accounts receivable from sale of assets and servicesand trusts 738 855 0 0 0 0 0 0 0 0Otras Cuentas por Cobrar / Other accounts receivable 47,795 46,347 158,789 30,282 16,861 22,563 18,580 9,881 3,476 2,356Rendimientos Devengados de Cuentas por Cobrar / Accounts receivable accrued gains 0 0 0 0 0 0 0 0 0 0(-) Provisiones para Cuentas por Cobrar / Provisions for accounts receivable -296 -395 -618 -1,087 -3,256 -3,257 0 0 -1,201 -1,168
BIENES REALIZ. RECIB. EN PAGO, ADJUD. Y FUERA DE USO / REALIZABLE ASSETS REC. IN PAYMENT,
FORECLOSED OR NO LONGER IN USE 6 9 22 5,469 4,734
Bienes Realizables / Realizable assets 0 0 6 9 0 0 0 22 5,469 4,659Bienes Recibidos en Pago y Adjudicados / Assets received in payment and foreclosed 0 0 0 0 0 0 0 0 0 75Bienes Fuera de Uso / Obligation with the public 0 0 0 0 0 0 0 0 0 0
INVERSIONES EN SUBSIDIARIAS Y ASOCIADAS / INVESTMENTS IN SUBSIDIARIES AND ASSOCIATES 16,826 11,196
Inversiones x Participación Patrimonial en Personas Jurídicas del País y del Exterior / Investments related to shares inequity of domestic and abroad company 16,826 11,196 0 0 0 0 0 0 0 0Otras Inversiones / Other investments 0 0 0 0 0 0 0 0 0 0
INMUEBLES, MOBILIARIO Y EQUIPO (NETO) / INMOVABLE PROPERTY, MOVABLE PROPERTY AND EQUIPMENT
(NET) 40,980 46,124 42,697 43,460 37,439 34,987 503 447 21,059 21,359
ACTIVOS INTANGIBLES (NETO) / INTANGIBLE ASSET (NET) 20,334 20,771 551 592 1,139 1,125 1,540 947 4,258 4,546
IMPUESTO A LA RENTA DIFERIDO / DEFERRED INCOME TAX 16,474 16,739 29,846 31,614 57,475 56,114 2,366 2,352
OTROS ACTIVOS (NETO) / OTHER ASSETS (NET) 21,227 13,208 200,691 86,528 81,776 54,011 15,828 14,700 10,400 9,437
TOTAL DEL ACTIVO / TOTAL ASSETS 2,272,170 2,296,151 5,072,513 4,912,058 3,745,414 3,496,436 238,510 173,318 547,590 573,902
OBLIGACIONES CON EL PUBLICO / OBLIGATIONS WITH THE PUBLIC 1,090,491 907,091 3,206,666 3,635,640 2,073,189 1,781,614 630 309 58,651 64,362
FONDOS INTERBANCARIOS / INTER-BANK FUNDS 24,027 54,313
DEPÓSITOS DE EMP. DEL SIST. FINANC. Y ORG. FINANC. INT. / DEPOSITS FROM FINANC. SYSTEM INST. AND INT.
FINANC. ORG. 6,572 14,079 334,136 269,047 46,130 82,591 5,103 120
Depósitos a la Vista / Demand deposits 0 0 333,843 268,752 0 0 0 0 0 0Depósitos de Ahorro / Savings accounts 0 0 0 0 32 33 0 0 0 0Depósitos a Plazo / Term deposits 6,536 14,057 0 0 46,000 82,300 0 0 5,071 120Gastos x Pagar x Depósitos de Emp. del Sist. Financ. y Org. Financ. Int. / Expenses payable related to deposits fromFinanc. System Inst. And Int. Financ. Org. 36 22 293 295 98 258 0 0 32 0
ADEUDOS Y OBLIGACIONES FINANCIERAS A CORTO PLAZO / SHORT-TERM FINANCIAL DEBTS AND OBLIGATIONS 67,381 129,952 293,403 84,333 461,323 464,258 117,781 47,602 64,705 72,587
CUENTAS POR PAGAR / ACCOUNTS PAYABLE 455,337 596,213 169,376 91,349 101,867 84,017 13,264 7,941 7,977 7,423
Productos Financieros Derivados para negociación / Financial Derivatives for trading purposes 0 0 46,311 50,068 0 0 0 0 0 0Productos Financieros Derivados con fines de cobertura / Financial Derivatives for hedging purposes 0 0 0 0 0 0 0 0 0 0Otras Cuentas por Pagar / Other accounts payable 455,337 596,213 123,065 41,281 101,867 84,017 13,264 7,941 7,977 7,423Gastos por Pagar de Cuentas por Pagar / Accounts payable-related expenses 0 0 0 0 0 0 0 0 0 0
ADEUDOS Y OBLIGACIONES FINANCIERAS A LARGO PLAZO / LONG-TERM FINANCIAL DEBTS AND OBLIGATIONS 37,589 44,803 178,318 183,581 381,070 374,453 60,968 72,821 216,722 223,380
Adeudos y Oblig. con Emp. e Inst. Financ. del país / Debt and obligations with domestic companies 28,950 35,722 0 0 351,854 351,923 0 0 180,745 163,176Adeudos y Oblig. con Emp. del Exterior y Org. Financ. Int. / Debt and oblig. with co. abroad and int. financ. org. 0 0 178,155 183,328 0 0 60,968 72,821 34,355 59,505Otros Adeudos y Obligaciones del país y del exterior / Other debts and obligations within the country and abroad 8,597 9,032 0 0 0 0 0 0 0 0Gastos por Pagar de Adeudos y Obligaciones financieras / Expenses payable due to financial debts and obligations 42 49 163 253 29,216 22,530 0 0 1,622 699
PROVISIONES / PROVISIONS 16,233 13,823 10,147 9,227 32,989 36,150 1,680 992
VALORES, TITULOS Y OBLIGACIONES EN CIRCULACION / OUTSTANDING SECURITIES, TITLES AND OBLIGATIONS 139,694 149,651 163,350 111,268 103,079 115,613
IMPUESTO A LA RENTA DIFERIDO / DEFERRED INCOME TAX 6,148 6,372
OTROS PASIVOS / OTHER LIABILITIES 1,015 1,099 294,194 49,612 5,506 58,338 1,295 488 2,334 3,666
TOTAL DEL PASIVO / TOTAL LIABILITIES 1,820,460 1,863,083 4,486,240 4,322,789 3,289,451 3,047,002 193,938 129,161 460,251 488,143
Capital social / Capital stock 250,000 250,000 443,175 443,175 260,854 232,648 41,647 41,647 78,586 78,586Capital adicional / Additional capital 0 0 17,130 17,130 60,000 60,000 0 0 0 0Reservas / Reserves 90,130 72,253 72,322 66,555 31,359 20,557 884 884 5,785 5,631Ajustes al Patrimonio / Adjustments to equity 0 0 0 0 0 -6,743 0 0 0 0Resultados Acumulados / Retained earnings 87,340 5,961 24,002 2 64,813 34,950 1,625 1,616 1,388 0Resultados no realizados / Unachieved earnings 29 75 2,439 4,736 0 0 0 0 0 0Resultado Neto del Ejercicio / Net profits for fiscal year 24,211 104,779 27,205 57,671 38,937 108,022 416 10 1,580 1,542
TOTAL DEL PATRIMONIO / TOTAL EQUITY 451,710 433,068 586,273 589,269 455,963 449,434 44,572 44,157 87,339 85,759
TOTAL DEL PASIVO Y PATRIMONIO / TOTAL LIABILITIES AND NET EQUITY 2,272,170 2,296,151 5,072,513 4,912,058 3,745,414 3,496,436 238,510 173,318 547,590 573,902
ESTADO DE RESULTADOS / INCOME STATEMENT 31/03/2012 31/03/2011 31/03/2012 31/03/2011 31/03/2012 31/03/2011 31/03/2012 31/03/2011 31/03/2012 31/03/2011
INGRESOS FINANCIEROS / FINANCIAL INCOME 155,415 135,499 108,264 93,002 258,243 209,058 6,899 1,753 11,331 11,528
GASTOS FINANCIEROS / FINANCIAL EXPENSES -39,009 -28,767 -19,933 -17,737 -44,754 -43,884 -891 -191 -5,577 -5,218
MARGEN FINANCIERO BRUTO / GROSS FINANCIAL MARGIN 116,406 106,732 88,331 75,265 213,489 165,174 6,008 1,562 5,754 6,310
(-) Provisiones para Incobrabilidad de Créditos directos / (-) Provisions for non-collection of direct loans -40,615 -29,332 -6,250 -7,926 -83,861 -58,585 -1,689 -229 -604 -194MARGEN FINANCIERO NETO / NET FINANCIAL MARGIN 75,791 77,400 82,081 67,339 129,628 106,589 4,319 1,333 5,150 6,116
INGRESOS POR SERVICIOS FINANCIEROS / FINANCIAL SERVICES INCOME 19,557 13,374 20,525 18,319 30,517 29,431 151 23 1,725 1,553
GASTOS POR SERVICIOS FINANCIEROS / FINANCIAL SERVICES EXPENSES -2,966 -1,410 -3,100 -2,239 -4,074 -6,615 0 0 -98 -112
MARGEN OPERACIONAL / OPERATING MARGIN 92,382 89,364 99,506 83,419 156,071 129,405 4,470 1,356 6,777 7,557
GASTOS DE ADMINISTRACION / OVERHEADS -61,176 -55,570 -60,631 -59,181 -103,396 -92,059 -3,693 -1,724 -3,534 -5,245
MARGEN OPERACIONAL NETO / NET OPERATING MARGIN 31,206 33,794 38,875 24,238 52,675 37,346 777 -368 3,243 2,312
VALUACIÓN DE ACTIVOS Y PROVISIONES / ASSETS VALUATION AND PROVISIONS -5,197 -4,525 -3,650 -3,979 -2,838 -2,555 -131 -135 -892 -893
RESULTADO DE OPERACIÓN / OPERATING PROFITS 26,009 29,269 35,225 20,259 49,837 34,791 646 -503 2,351 1,419
OTROS INGRESOS Y GASTOS / SUNDRY INCOME AND EXPENSES 8,452 7,327 5,084 3,781 5,941 3,948 174 0 -136 20
RESULTADO DEL EJERCICIO ANTES DE IMPUESTO A LA RENTA / RESULTS BEFORE INCOME TAX 34,461 36,596 40,309 24,040 55,778 38,739 820 -503 2,215 1,439
IMPUESTO A LA RENTA / INCOME TAX -10,250 -12,407 -13,104 -7,150 -16,841 -11,822 -404 151 -635 -519
RESULTADO NETO DEL EJERCICIO / PERIOD'S NET PROFIT (LOSS) 24,211 24,189 27,205 16,890 38,937 26,917 416 -352 1,580 920
INDICADORES FINANCIEROS / FINANCIAL RATIOS
Liquidez / Liquid Ratio 0.34 0.69 0.17 0.43 0.46 Rotación en Activos / Gross Sales to Total Assets 0.07 0.02 0.07 0.03 0.02 Solvencia / Solvency 0.80 0.88 0.88 0.81 0.84 Deuda / Patrimonio / Debt / Equity 4.03 7.65 7.21 4.35 5.27 Rentabilidad de Capital % / Return on capital % 9.68 6.14 14.93 1.00 2.01 Rentabilidad sobre Activos % / Return on Assets % 1.07 0.54 1.04 0.17 0.29 Rentabilidad de Patrimonio % / Return on Equity % 5.36 4.64 8.54 0.93 1.81

ESTADOS FINANCIEROS COMPARADOS / COMPARATIVE FINANCIAL STATEMENTS BANCOS Y FINANCIERAS / BANKS
CIFRAS EXPRESADAS EN MILES DE NUEVOS SOLES
EMPRESA/COMPANY Financiera Confianza Financiera Efectiva COFIDE Caja Nuestra Gente Financiera TFC
CIIU 6592 6592 6599 6599 6599
Pág 9* Estados Financieros expresados en miles de US$
ESTADO DE SITUACION FINANCIERA / STATEMENT OF FINANCIAL POSITION 31/03/2012 31/12/2011 31/03/2012 31/12/2011 31/03/2012 31/12/2011 31/03/2012 31/12/2011 31/03/2012 31/12/2011
DISPONIBLE / FUNDS AVAILABLE 80,992 73,651 21,496 14,513 1,106,525 175,541 92,572 94,498 44,332 58,887
FONDOS INTERBANCARIOS / INTER-BANK FUNDS 10,000
INVERSIONES NEGOCIABLES Y A VENCIMIENTO / TRADABLE INVESTMENTS AND INVESTMENTS BY DUE DATE 529 1,134 403,616 355,387 12,044 12,433
CARTERA DE CREDITOS / LOANS PORTFOLIO 461,668 445,219 162,928 161,954 2,483,105 2,353,090 670,737 662,411 261,623 266,621
CUENTAS POR COBRAR / ACCOUNTS RECEIVABLE 339 203 4,036 7,993 28,076 73,589 6,451 6,816 23,787 17,966
Productos Financieros Derivados para negociación / Financial Derivatives for trading purposes 0 0 0 0 0 0 0 0 0 0Productos Financieros Derivados con fines de cobertura / Financial Derivatives for hedging purposes 0 0 0 0 24,114 71,798 0 0 0 0Cuentas por Cobrar por Venta de Bienes y Servicios y Fideicomiso / Accounts receivable from sale of assets and servicesand trusts 0 0 0 0 25 15 0 0 1,693 1,750Otras Cuentas por Cobrar / Other accounts receivable 339 203 4,036 7,993 12,986 10,318 8,215 8,472 24,049 18,351Rendimientos Devengados de Cuentas por Cobrar / Accounts receivable accrued gains 0 0 0 0 0 0 0 0 0 0(-) Provisiones para Cuentas por Cobrar / Provisions for accounts receivable 0 0 0 0 -9,049 -8,542 -1,764 -1,656 -1,955 -2,135
BIENES REALIZ. RECIB. EN PAGO, ADJUD. Y FUERA DE USO / REALIZABLE ASSETS REC. IN PAYMENT,
FORECLOSED OR NO LONGER IN USE 945 992 474 512 83 83 36 44 242 52
Bienes Realizables / Realizable assets 0 0 0 0 0 0 0 0 21 21Bienes Recibidos en Pago y Adjudicados / Assets received in payment and foreclosed 945 992 474 512 83 83 36 44 221 31Bienes Fuera de Uso / Obligation with the public 0 0 0 0 0 0 0 0 0 0
INVERSIONES EN SUBSIDIARIAS Y ASOCIADAS / INVESTMENTS IN SUBSIDIARIES AND ASSOCIATES 132 128 2,385,404 2,388,560 103,698 100,944
Inversiones x Participación Patrimonial en Personas Jurídicas del País y del Exterior / Investments related to shares inequity of domestic and abroad company 0 0 0 0 2,385,404 2,388,560 103,698 100,944 0 0Otras Inversiones / Other investments 132 128 0 0 0 0 0 0 0 0
INMUEBLES, MOBILIARIO Y EQUIPO (NETO) / INMOVABLE PROPERTY, MOVABLE PROPERTY AND EQUIPMENT
(NET) 16,551 17,207 1,405 1,360 11,381 10,696 24,994 24,901 3,398 3,372
ACTIVOS INTANGIBLES (NETO) / INTANGIBLE ASSET (NET) 2,437 2,152 383 340 4,199 3,769 10,305 9,672
IMPUESTO A LA RENTA DIFERIDO / DEFERRED INCOME TAX 3,551 3,377 1,115 1,245 4,437 6,392
OTROS ACTIVOS (NETO) / OTHER ASSETS (NET) 1,976 1,346 306 121 42,033 45,850 3,988 2,649 14,645 14,653
TOTAL DEL ACTIVO / TOTAL ASSETS 569,120 545,409 192,143 188,038 6,464,422 5,406,565 939,262 920,760 348,027 361,551
OBLIGACIONES CON EL PUBLICO / OBLIGATIONS WITH THE PUBLIC 126,769 104,910 29,003 27,148 27,951 70,367 611,761 606,825 115,602 110,596
FONDOS INTERBANCARIOS / INTER-BANK FUNDS 10,001 10,001 2,305
DEPÓSITOS DE EMP. DEL SIST. FINANC. Y ORG. FINANC. INT. / DEPOSITS FROM FINANC. SYSTEM INST. AND INT.
FINANC. ORG. 1,280 1,600 302,866 156,504 1,822 2,389 34,774 58,377
Depósitos a la Vista / Demand deposits 0 0 0 0 0 0 0 0 0 0Depósitos de Ahorro / Savings accounts 0 0 0 0 0 0 24 224 0 0Depósitos a Plazo / Term deposits 1,240 1,572 0 0 301,025 156,000 1,798 2,165 34,774 58,377Gastos x Pagar x Depósitos de Emp. del Sist. Financ. y Org. Financ. Int. / Expenses payable related to deposits fromFinanc. System Inst. And Int. Financ. Org. 40 28 0 0 1,841 504 0 0 0 0
ADEUDOS Y OBLIGACIONES FINANCIERAS A CORTO PLAZO / SHORT-TERM FINANCIAL DEBTS AND OBLIGATIONS 166,132 162,184 78,150 81,720 591,284 620,777 24,283 17,337 14,961 16,716
CUENTAS POR PAGAR / ACCOUNTS PAYABLE 5,738 6,381 8,947 7,472 100,679 51,710 9,593 14,356 9,901 5,714
Productos Financieros Derivados para negociación / Financial Derivatives for trading purposes 0 0 0 0 0 0 0 0 0 0Productos Financieros Derivados con fines de cobertura / Financial Derivatives for hedging purposes 0 0 0 0 33,303 45,543 0 0 0 0Otras Cuentas por Pagar / Other accounts payable 5,738 6,381 8,947 7,472 67,376 6,167 9,593 14,356 9,901 5,714Gastos por Pagar de Cuentas por Pagar / Accounts payable-related expenses 0 0 0 0 0 0 0 0 0 0
ADEUDOS Y OBLIGACIONES FINANCIERAS A LARGO PLAZO / LONG-TERM FINANCIAL DEBTS AND OBLIGATIONS 172,071 187,867 7,407 21,458 1,712,167 1,811,403 61,026 70,478 109,834 111,240
Adeudos y Oblig. con Emp. e Inst. Financ. del país / Debt and obligations with domestic companies 49,472 58,794 7,407 21,458 116,895 116,895 29,268 32,475 84,163 84,365Adeudos y Oblig. con Emp. del Exterior y Org. Financ. Int. / Debt and oblig. with co. abroad and int. financ. org. 122,560 129,023 0 0 1,230,553 1,282,475 31,750 38,000 25,295 26,404Otros Adeudos y Obligaciones del país y del exterior / Other debts and obligations within the country and abroad 39 50 0 0 349,211 393,679 0 0 252 311Gastos por Pagar de Adeudos y Obligaciones financieras / Expenses payable due to financial debts and obligations 0 0 0 0 15,508 18,354 8 3 124 160
PROVISIONES / PROVISIONS 265 2 45,690 42,602 6,084 2,348 1,054 1,371
VALORES, TITULOS Y OBLIGACIONES EN CIRCULACION / OUTSTANDING SECURITIES, TITLES AND OBLIGATIONS 6,000 3,000 1,287,691 218,461 13,647 13,419
IMPUESTO A LA RENTA DIFERIDO / DEFERRED INCOME TAX 264,390 262,605
OTROS PASIVOS / OTHER LIABILITIES 222 221 5,416 6,262 4,038 4,526 1,280 1,913 3,949 2,489
TOTAL DEL PASIVO / TOTAL LIABILITIES 482,478 463,165 134,923 147,060 4,336,756 3,238,955 725,850 715,646 306,027 319,922
Capital social / Capital stock 62,929 62,929 43,039 24,000 1,494,501 1,494,501 131,502 124,942 35,517 35,517Capital adicional / Additional capital 11,546 0 0 0 14,643 14,643 62,807 49,063 0 0Reservas / Reserves 6,191 4,795 4,901 3,558 272,297 265,085 10,806 8,441 2,821 2,821Ajustes al Patrimonio / Adjustments to equity 0 0 0 0 0 0 0 0 0 0Resultados Acumulados / Retained earnings 1,578 1,578 6,039 0 359,198 356,681 0 0 2,779 0Resultados no realizados / Unachieved earnings 0 0 0 0 -29,321 -35,423 0 0 0 0Resultado Neto del Ejercicio / Net profits for fiscal year 4,398 12,942 3,241 13,420 16,348 72,123 8,297 22,668 883 3,291
TOTAL DEL PATRIMONIO / TOTAL EQUITY 86,642 82,244 57,220 40,978 2,127,666 2,167,610 213,412 205,114 42,000 41,629
TOTAL DEL PASIVO Y PATRIMONIO / TOTAL LIABILITIES AND NET EQUITY 569,120 545,409 192,143 188,038 6,464,422 5,406,565 939,262 920,760 348,027 361,551
ESTADO DE RESULTADOS / INCOME STATEMENT 31/03/2012 31/03/2011 31/03/2012 31/03/2011 31/03/2012 31/03/2011 31/03/2012 31/03/2011 31/03/2012 31/03/2011
INGRESOS FINANCIEROS / FINANCIAL INCOME 34,814 29,565 24,653 18,552 115,948 66,822 49,144 45,810 22,656 23,961
GASTOS FINANCIEROS / FINANCIAL EXPENSES -9,320 -7,618 -3,583 -1,504 -85,063 -33,461 -10,821 -11,688 -4,996 -4,160
MARGEN FINANCIERO BRUTO / GROSS FINANCIAL MARGIN 25,494 21,947 21,070 17,048 30,885 33,361 38,323 34,122 17,660 19,801
(-) Provisiones para Incobrabilidad de Créditos directos / (-) Provisions for non-collection of direct loans -2,973 -2,290 -5,022 -3,065 9,848 -265 0 -6,799 -5,704 -9,977MARGEN FINANCIERO NETO / NET FINANCIAL MARGIN 22,521 19,657 16,048 13,983 40,733 33,096 38,323 27,323 11,956 9,824
INGRESOS POR SERVICIOS FINANCIEROS / FINANCIAL SERVICES INCOME 1,177 693 0 0 5,922 4,975 3,084 2,351 2,143 2,468
GASTOS POR SERVICIOS FINANCIEROS / FINANCIAL SERVICES EXPENSES -1,012 -102 0 0 -1,744 -100 -1,410 -1,245 -182 -83
MARGEN OPERACIONAL / OPERATING MARGIN 22,686 20,248 16,048 13,983 44,911 37,971 39,997 28,429 13,917 12,209
GASTOS DE ADMINISTRACION / OVERHEADS -15,572 -14,467 -11,993 -10,152 -14,206 -13,273 -27,520 -23,246 -11,523 -11,317
MARGEN OPERACIONAL NETO / NET OPERATING MARGIN 7,114 5,781 4,055 3,831 30,705 24,698 12,477 5,183 2,394 892
VALUACIÓN DE ACTIVOS Y PROVISIONES / ASSETS VALUATION AND PROVISIONS -929 -820 -135 -127 -5,559 -1,355 -1,927 -1,218 -486 -271
RESULTADO DE OPERACIÓN / OPERATING PROFITS 6,185 4,961 3,920 3,704 25,146 23,343 10,550 3,965 1,908 621
OTROS INGRESOS Y GASTOS / SUNDRY INCOME AND EXPENSES 115 221 758 471 -602 820 568 340 -647 594
RESULTADO DEL EJERCICIO ANTES DE IMPUESTO A LA RENTA / RESULTS BEFORE INCOME TAX 6,300 5,182 4,678 4,175 24,544 24,163 11,118 4,305 1,261 1,215
IMPUESTO A LA RENTA / INCOME TAX -1,902 -1,572 -1,437 -1,253 -8,196 -7,850 -2,821 -1,497 -378 -342
RESULTADO NETO DEL EJERCICIO / PERIOD'S NET PROFIT (LOSS) 4,398 3,610 3,241 2,922 16,348 16,313 8,297 2,808 883 873
INDICADORES FINANCIEROS / FINANCIAL RATIOS
Liquidez / Liquid Ratio 0.27 0.20 1.64 0.18 0.26 Rotación en Activos / Gross Sales to Total Assets 0.06 0.13 0.02 0.05 0.07 Solvencia / Solvency 0.85 0.70 0.67 0.77 0.88 Deuda / Patrimonio / Debt / Equity 5.57 2.36 2.04 3.40 7.29 Rentabilidad de Capital % / Return on capital % 6.99 7.53 1.09 6.31 2.49 Rentabilidad sobre Activos % / Return on Assets % 0.77 1.69 0.25 0.88 0.25 Rentabilidad de Patrimonio % / Return on Equity % 5.08 5.66 0.77 3.89 2.10

ESTADOS FINANCIEROS COMPARADOS / COMPARATIVE FINANCIAL STATEMENTS BANCOS Y FINANCIERAS Y DIVERSAS / BANKS AND ASSORTED
CIFRAS EXPRESADAS EN MILES DE NUEVOS SOLES
EMPRESA/COMPANY Financiera Universal Financiera Uno Financiera Crear Leasing Total Incasa EAH
CIIU 6599 6599 6711 6591 6592
Pág 10 * Estados Financieros expresados en miles de US$
ESTADO DE SITUACION FINANCIERA / STATEMENT OF FINANCIAL POSITION 31/03/2012 31/12/2011 31/03/2012 31/12/2011 31/03/2012 31/12/2011 31/03/2012 31/12/2011 31/03/2012 31/12/2011
DISPONIBLE / FUNDS AVAILABLE 7,905 7,409 27,787 32,736 87,620 72,568 3,082 1,718 10,722 9,201
FONDOS INTERBANCARIOS / INTER-BANK FUNDS
INVERSIONES NEGOCIABLES Y A VENCIMIENTO / TRADABLE INVESTMENTS AND INVESTMENTS BY DUE DATE
CARTERA DE CREDITOS / LOANS PORTFOLIO 71,284 63,979 83,758 81,864 478,730 465,571 117,647 107,941 31,659 29,277
CUENTAS POR COBRAR / ACCOUNTS RECEIVABLE 586 433 830 534 187 325 4,227 4,604 3,769 4,620
Productos Financieros Derivados para negociación / Financial Derivatives for trading purposes 0 0 0 0 0 0 0 0 0 0Productos Financieros Derivados con fines de cobertura / Financial Derivatives for hedging purposes 0 0 0 0 0 0 0 0 0 0Cuentas por Cobrar por Venta de Bienes y Servicios y Fideicomiso / Accounts receivable from sale of assets and servicesand trusts 0 0 3 3 0 0 0 0 0 0Otras Cuentas por Cobrar / Other accounts receivable 586 433 827 531 244 382 4,834 5,146 3,769 4,620Rendimientos Devengados de Cuentas por Cobrar / Accounts receivable accrued gains 0 0 0 0 0 0 0 0 0 0(-) Provisiones para Cuentas por Cobrar / Provisions for accounts receivable 0 0 0 0 -57 -57 -607 -542 0 0
BIENES REALIZ. RECIB. EN PAGO, ADJUD. Y FUERA DE USO / REALIZABLE ASSETS REC. IN PAYMENT,
FORECLOSED OR NO LONGER IN USE 463 250 108
Bienes Realizables / Realizable assets 0 0 0 0 0 0 0 0 0 0Bienes Recibidos en Pago y Adjudicados / Assets received in payment and foreclosed 463 250 0 0 0 0 108 0 0 0Bienes Fuera de Uso / Obligation with the public 0 0 0 0 0 0 0 0 0 0
INVERSIONES EN SUBSIDIARIAS Y ASOCIADAS / INVESTMENTS IN SUBSIDIARIES AND ASSOCIATES 6,166 6,166 2,306 2,306
Inversiones x Participación Patrimonial en Personas Jurídicas del País y del Exterior / Investments related to shares inequity of domestic and abroad company 0 0 0 0 0 0 2,306 2,306 0 0Otras Inversiones / Other investments 6,166 6,166 0 0 0 0 0 0 0 0
INMUEBLES, MOBILIARIO Y EQUIPO (NETO) / INMOVABLE PROPERTY, MOVABLE PROPERTY AND EQUIPMENT
(NET) 5,988 6,099 2,622 2,613 8,011 7,598 1,452 1,379 839 850
ACTIVOS INTANGIBLES (NETO) / INTANGIBLE ASSET (NET) 16 21 2,357 2,409 8 181 205
IMPUESTO A LA RENTA DIFERIDO / DEFERRED INCOME TAX 8,790 8,298 6,364 6,307 1,759 1,780
OTROS ACTIVOS (NETO) / OTHER ASSETS (NET) 892 602 2,620 2,706 2,644 380 17,724 15,701 252 197
TOTAL DEL ACTIVO / TOTAL ASSETS 102,090 93,257 126,338 129,169 578,959 548,222 146,546 133,649 47,422 44,350
OBLIGACIONES CON EL PUBLICO / OBLIGATIONS WITH THE PUBLIC 6,010 2,314 1,163 770 102,539 60,184 835 738 1,845 632
FONDOS INTERBANCARIOS / INTER-BANK FUNDS
DEPÓSITOS DE EMP. DEL SIST. FINANC. Y ORG. FINANC. INT. / DEPOSITS FROM FINANC. SYSTEM INST. AND INT.
FINANC. ORG.
Depósitos a la Vista / Demand deposits 0 0 0 0 0 0 0 0 0 0Depósitos de Ahorro / Savings accounts 0 0 0 0 0 0 0 0 0 0Depósitos a Plazo / Term deposits 0 0 0 0 0 0 0 0 0 0Gastos x Pagar x Depósitos de Emp. del Sist. Financ. y Org. Financ. Int. / Expenses payable related to deposits fromFinanc. System Inst. And Int. Financ. Org. 0 0 0 0 0 0 0 0 0 0
ADEUDOS Y OBLIGACIONES FINANCIERAS A CORTO PLAZO / SHORT-TERM FINANCIAL DEBTS AND OBLIGATIONS 9,693 10,220 182,977 195,569 26,276 21,041
CUENTAS POR PAGAR / ACCOUNTS PAYABLE 1,290 6,876 4,004 4,368 6,411 6,627 11,292 9,749 307 183
Productos Financieros Derivados para negociación / Financial Derivatives for trading purposes 0 0 0 0 0 0 0 0 0 0Productos Financieros Derivados con fines de cobertura / Financial Derivatives for hedging purposes 0 0 0 0 0 0 0 0 0 0Otras Cuentas por Pagar / Other accounts payable 1,290 6,876 4,004 4,368 6,411 6,627 11,292 9,749 307 183Gastos por Pagar de Cuentas por Pagar / Accounts payable-related expenses 0 0 0 0 0 0 0 0 0 0
ADEUDOS Y OBLIGACIONES FINANCIERAS A LARGO PLAZO / LONG-TERM FINANCIAL DEBTS AND OBLIGATIONS 46,248 40,488 207,230 211,639 12,463 9,944 24,914 23,277
Adeudos y Oblig. con Emp. e Inst. Financ. del país / Debt and obligations with domestic companies 0 0 0 0 43,121 51,545 11,456 8,586 0 0Adeudos y Oblig. con Emp. del Exterior y Org. Financ. Int. / Debt and oblig. with co. abroad and int. financ. org. 6,725 6,725 0 0 33,940 21,417 1,007 1,358 0 0Otros Adeudos y Obligaciones del país y del exterior / Other debts and obligations within the country and abroad 38,996 33,712 0 0 130,169 138,677 0 0 24,914 23,277Gastos por Pagar de Adeudos y Obligaciones financieras / Expenses payable due to financial debts and obligations 527 51 0 0 0 0 0 0 0 0
PROVISIONES / PROVISIONS 79 133 62 62 57 62 227 70 123
VALORES, TITULOS Y OBLIGACIONES EN CIRCULACION / OUTSTANDING SECURITIES, TITLES AND OBLIGATIONS 13,365 13,810 61,827 67,179
IMPUESTO A LA RENTA DIFERIDO / DEFERRED INCOME TAX
OTROS PASIVOS / OTHER LIABILITIES 6,191 22 1,423 2,659 98 75 9,695 6,922 3,991 2,967
TOTAL DEL PASIVO / TOTAL LIABILITIES 59,818 49,833 29,710 31,889 499,312 474,156 122,615 115,643 31,057 27,182
Capital social / Capital stock 62,559 62,559 119,898 100,459 65,195 45,427 21,906 16,506 21,054 21,054Capital adicional / Additional capital 0 0 0 19,367 449 449 0 0 0 0Reservas / Reserves 0 0 0 0 7,848 5,668 376 376 67 67Ajustes al Patrimonio / Adjustments to equity 0 0 0 0 0 0 0 0 0 0Resultados Acumulados / Retained earnings -19,135 -11,580 -22,546 -14,098 0 156 1,124 0 -3,953 -1,923Resultados no realizados / Unachieved earnings 0 0 0 0 0 0 0 0 0 0Resultado Neto del Ejercicio / Net profits for fiscal year -1,152 -7,555 -724 -8,448 6,155 22,366 525 1,124 -803 -2,030
TOTAL DEL PATRIMONIO / TOTAL EQUITY 42,272 43,424 96,628 97,280 79,647 74,066 23,931 18,006 16,365 17,168
TOTAL DEL PASIVO Y PATRIMONIO / TOTAL LIABILITIES AND NET EQUITY 102,090 93,257 126,338 129,169 578,959 548,222 146,546 133,649 47,422 44,350
ESTADO DE RESULTADOS / INCOME STATEMENT 31/03/2012 31/03/2011 31/03/2012 31/03/2011 31/03/2012 31/03/2011 31/03/2012 31/03/2011 31/03/2012 31/03/2011
INGRESOS FINANCIEROS / FINANCIAL INCOME 5,499 2,033 9,754 5,358 40,723 31,982 3,727 2,678 744 500
GASTOS FINANCIEROS / FINANCIAL EXPENSES -664 0 -500 -32 -9,607 -7,744 -1,485 -1,055 -1,350 -914
MARGEN FINANCIERO BRUTO / GROSS FINANCIAL MARGIN 4,835 2,033 9,254 5,326 31,116 24,238 2,242 1,623 -606 -414
(-) Provisiones para Incobrabilidad de Créditos directos / (-) Provisions for non-collection of direct loans -2,074 -416 -5,276 -3,340 -6,453 -4,946 -311 -447 -593 -122MARGEN FINANCIERO NETO / NET FINANCIAL MARGIN 2,761 1,617 3,978 1,986 24,663 19,292 1,931 1,176 -1,199 -536
INGRESOS POR SERVICIOS FINANCIEROS / FINANCIAL SERVICES INCOME 620 125 3,533 2,316 0 2 1,246 1,195 3 3
GASTOS POR SERVICIOS FINANCIEROS / FINANCIAL SERVICES EXPENSES -58 -2 0 0 -103 -75 -927 -795 -13 -8
MARGEN OPERACIONAL / OPERATING MARGIN 3,323 1,740 7,511 4,302 24,560 19,219 2,250 1,576 -1,209 -541
GASTOS DE ADMINISTRACION / OVERHEADS -4,891 -3,830 -8,493 -6,913 -16,078 -11,010 -1,421 -1,283 -1,975 -2,032
MARGEN OPERACIONAL NETO / NET OPERATING MARGIN -1,568 -2,090 -982 -2,611 8,482 8,209 829 293 -3,184 -2,573
VALUACIÓN DE ACTIVOS Y PROVISIONES / ASSETS VALUATION AND PROVISIONS -325 -298 -325 -336 -308 -411 -124 -52 -77 -67
RESULTADO DE OPERACIÓN / OPERATING PROFITS -1,893 -2,388 -1,307 -2,947 8,174 7,798 705 241 -3,261 -2,640
OTROS INGRESOS Y GASTOS / SUNDRY INCOME AND EXPENSES 249 13 526 973 795 1,011 56 -35 2,458 1,909
RESULTADO DEL EJERCICIO ANTES DE IMPUESTO A LA RENTA / RESULTS BEFORE INCOME TAX -1,644 -2,375 -781 -1,974 8,969 8,809 761 206 -803 -731
IMPUESTO A LA RENTA / INCOME TAX 492 743 57 266 -2,814 -2,715 -236 -17 0 0
RESULTADO NETO DEL EJERCICIO / PERIOD'S NET PROFIT (LOSS) -1,152 -1,632 -724 -1,708 6,155 6,094 525 189 -803 -731
INDICADORES FINANCIEROS / FINANCIAL RATIOS
Liquidez / Liquid Ratio 1.32 2.56 0.31 0.11 5.81 Rotación en Activos / Gross Sales to Total Assets 0.05 0.08 0.07 0.03 0.02 Solvencia / Solvency 0.59 0.24 0.86 0.84 0.65 Deuda / Patrimonio / Debt / Equity 1.42 0.31 6.27 5.12 1.90 Rentabilidad de Capital % / Return on capital % -.- -.- 9.44 2.40 -.- Rentabilidad sobre Activos % / Return on Assets % -.- -.- 1.06 0.36 -.- Rentabilidad de Patrimonio % / Return on Equity % -.- -.- 7.73 2.19 -.-
ESTADOS FINANCIEROS COMPARADOS / COMPARATIVE FINANCIAL STATEMENTS DIVERSAS / ASSORTED
CIFRAS EXPRESADAS EN MILES DE NUEVOS SOLES
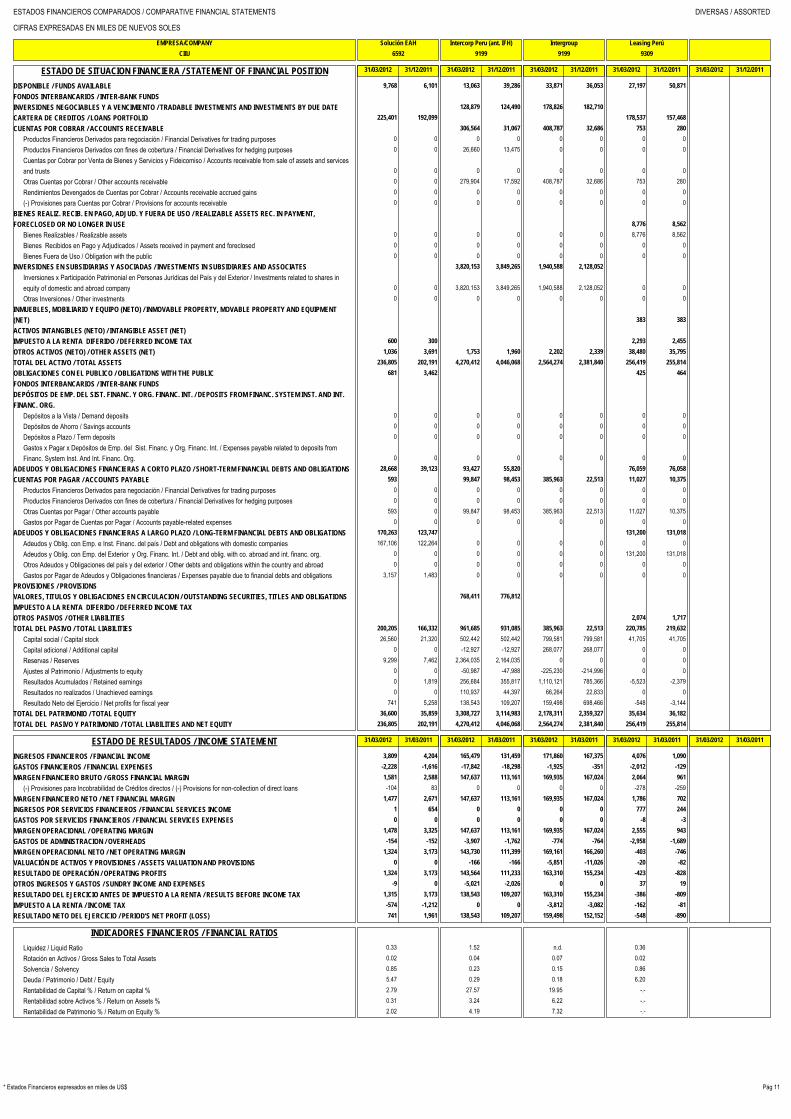
EMPRESA/COMPANY Solución EAH Intercorp Peru (ant. IFH) Intergroup Leasing Perú
CIIU 6592 9199 9199 9309
Pág 11* Estados Financieros expresados en miles de US$
ESTADO DE SITUACION FINANCIERA / STATEMENT OF FINANCIAL POSITION 31/03/2012 31/12/2011 31/03/2012 31/12/2011 31/03/2012 31/12/2011 31/03/2012 31/12/2011 31/03/2012 31/12/2011
DISPONIBLE / FUNDS AVAILABLE 9,768 6,101 13,063 39,286 33,871 36,053 27,197 50,871
FONDOS INTERBANCARIOS / INTER-BANK FUNDS
INVERSIONES NEGOCIABLES Y A VENCIMIENTO / TRADABLE INVESTMENTS AND INVESTMENTS BY DUE DATE 128,879 124,490 178,826 182,710
CARTERA DE CREDITOS / LOANS PORTFOLIO 225,401 192,099 178,537 157,468
CUENTAS POR COBRAR / ACCOUNTS RECEIVABLE 306,564 31,067 408,787 32,686 753 280
Productos Financieros Derivados para negociación / Financial Derivatives for trading purposes 0 0 0 0 0 0 0 0 Productos Financieros Derivados con fines de cobertura / Financial Derivatives for hedging purposes 0 0 26,660 13,475 0 0 0 0 Cuentas por Cobrar por Venta de Bienes y Servicios y Fideicomiso / Accounts receivable from sale of assets and servicesand trusts 0 0 0 0 0 0 0 0 Otras Cuentas por Cobrar / Other accounts receivable 0 0 279,904 17,592 408,787 32,686 753 280 Rendimientos Devengados de Cuentas por Cobrar / Accounts receivable accrued gains 0 0 0 0 0 0 0 0 (-) Provisiones para Cuentas por Cobrar / Provisions for accounts receivable 0 0 0 0 0 0 0 0
BIENES REALIZ. RECIB. EN PAGO, ADJUD. Y FUERA DE USO / REALIZABLE ASSETS REC. IN PAYMENT,
FORECLOSED OR NO LONGER IN USE 8,776 8,562
Bienes Realizables / Realizable assets 0 0 0 0 0 0 8,776 8,562 Bienes Recibidos en Pago y Adjudicados / Assets received in payment and foreclosed 0 0 0 0 0 0 0 0 Bienes Fuera de Uso / Obligation with the public 0 0 0 0 0 0 0 0
INVERSIONES EN SUBSIDIARIAS Y ASOCIADAS / INVESTMENTS IN SUBSIDIARIES AND ASSOCIATES 3,820,153 3,849,265 1,940,588 2,128,052
Inversiones x Participación Patrimonial en Personas Jurídicas del País y del Exterior / Investments related to shares inequity of domestic and abroad company 0 0 3,820,153 3,849,265 1,940,588 2,128,052 0 0 Otras Inversiones / Other investments 0 0 0 0 0 0 0 0
INMUEBLES, MOBILIARIO Y EQUIPO (NETO) / INMOVABLE PROPERTY, MOVABLE PROPERTY AND EQUIPMENT
(NET) 383 383
ACTIVOS INTANGIBLES (NETO) / INTANGIBLE ASSET (NET)
IMPUESTO A LA RENTA DIFERIDO / DEFERRED INCOME TAX 600 300 2,293 2,455
OTROS ACTIVOS (NETO) / OTHER ASSETS (NET) 1,036 3,691 1,753 1,960 2,202 2,339 38,480 35,795
TOTAL DEL ACTIVO / TOTAL ASSETS 236,805 202,191 4,270,412 4,046,068 2,564,274 2,381,840 256,419 255,814
OBLIGACIONES CON EL PUBLICO / OBLIGATIONS WITH THE PUBLIC 681 3,462 425 464
FONDOS INTERBANCARIOS / INTER-BANK FUNDS
DEPÓSITOS DE EMP. DEL SIST. FINANC. Y ORG. FINANC. INT. / DEPOSITS FROM FINANC. SYSTEM INST. AND INT.
FINANC. ORG.
Depósitos a la Vista / Demand deposits 0 0 0 0 0 0 0 0 Depósitos de Ahorro / Savings accounts 0 0 0 0 0 0 0 0 Depósitos a Plazo / Term deposits 0 0 0 0 0 0 0 0 Gastos x Pagar x Depósitos de Emp. del Sist. Financ. y Org. Financ. Int. / Expenses payable related to deposits fromFinanc. System Inst. And Int. Financ. Org. 0 0 0 0 0 0 0 0
ADEUDOS Y OBLIGACIONES FINANCIERAS A CORTO PLAZO / SHORT-TERM FINANCIAL DEBTS AND OBLIGATIONS 28,668 39,123 93,427 55,820 76,059 76,058
CUENTAS POR PAGAR / ACCOUNTS PAYABLE 593 99,847 98,453 385,963 22,513 11,027 10,375
Productos Financieros Derivados para negociación / Financial Derivatives for trading purposes 0 0 0 0 0 0 0 0 Productos Financieros Derivados con fines de cobertura / Financial Derivatives for hedging purposes 0 0 0 0 0 0 0 0 Otras Cuentas por Pagar / Other accounts payable 593 0 99,847 98,453 385,963 22,513 11,027 10,375 Gastos por Pagar de Cuentas por Pagar / Accounts payable-related expenses 0 0 0 0 0 0 0 0
ADEUDOS Y OBLIGACIONES FINANCIERAS A LARGO PLAZO / LONG-TERM FINANCIAL DEBTS AND OBLIGATIONS 170,263 123,747 131,200 131,018
Adeudos y Oblig. con Emp. e Inst. Financ. del país / Debt and obligations with domestic companies 167,106 122,264 0 0 0 0 0 0 Adeudos y Oblig. con Emp. del Exterior y Org. Financ. Int. / Debt and oblig. with co. abroad and int. financ. org. 0 0 0 0 0 0 131,200 131,018 Otros Adeudos y Obligaciones del país y del exterior / Other debts and obligations within the country and abroad 0 0 0 0 0 0 0 0 Gastos por Pagar de Adeudos y Obligaciones financieras / Expenses payable due to financial debts and obligations 3,157 1,483 0 0 0 0 0 0
PROVISIONES / PROVISIONS
VALORES, TITULOS Y OBLIGACIONES EN CIRCULACION / OUTSTANDING SECURITIES, TITLES AND OBLIGATIONS 768,411 776,812
IMPUESTO A LA RENTA DIFERIDO / DEFERRED INCOME TAX
OTROS PASIVOS / OTHER LIABILITIES 2,074 1,717
TOTAL DEL PASIVO / TOTAL LIABILITIES 200,205 166,332 961,685 931,085 385,963 22,513 220,785 219,632
Capital social / Capital stock 26,560 21,320 502,442 502,442 799,581 799,581 41,705 41,705 Capital adicional / Additional capital 0 0 -12,927 -12,927 268,077 268,077 0 0 Reservas / Reserves 9,299 7,462 2,364,035 2,164,035 0 0 0 0 Ajustes al Patrimonio / Adjustments to equity 0 0 -50,987 -47,988 -225,230 -214,996 0 0 Resultados Acumulados / Retained earnings 0 1,819 256,684 355,817 1,110,121 785,366 -5,523 -2,379 Resultados no realizados / Unachieved earnings 0 0 110,937 44,397 66,264 22,833 0 0 Resultado Neto del Ejercicio / Net profits for fiscal year 741 5,258 138,543 109,207 159,498 698,466 -548 -3,144
TOTAL DEL PATRIMONIO / TOTAL EQUITY 36,600 35,859 3,308,727 3,114,983 2,178,311 2,359,327 35,634 36,182
TOTAL DEL PASIVO Y PATRIMONIO / TOTAL LIABILITIES AND NET EQUITY 236,805 202,191 4,270,412 4,046,068 2,564,274 2,381,840 256,419 255,814
ESTADO DE RESULTADOS / INCOME STATEMENT 31/03/2012 31/03/2011 31/03/2012 31/03/2011 31/03/2012 31/03/2011 31/03/2012 31/03/2011 31/03/2012 31/03/2011
INGRESOS FINANCIEROS / FINANCIAL INCOME 3,809 4,204 165,479 131,459 171,860 167,375 4,076 1,090
GASTOS FINANCIEROS / FINANCIAL EXPENSES -2,228 -1,616 -17,842 -18,298 -1,925 -351 -2,012 -129
MARGEN FINANCIERO BRUTO / GROSS FINANCIAL MARGIN 1,581 2,588 147,637 113,161 169,935 167,024 2,064 961
(-) Provisiones para Incobrabilidad de Créditos directos / (-) Provisions for non-collection of direct loans -104 83 0 0 0 0 -278 -259 MARGEN FINANCIERO NETO / NET FINANCIAL MARGIN 1,477 2,671 147,637 113,161 169,935 167,024 1,786 702
INGRESOS POR SERVICIOS FINANCIEROS / FINANCIAL SERVICES INCOME 1 654 0 0 0 0 777 244
GASTOS POR SERVICIOS FINANCIEROS / FINANCIAL SERVICES EXPENSES 0 0 0 0 0 0 -8 -3
MARGEN OPERACIONAL / OPERATING MARGIN 1,478 3,325 147,637 113,161 169,935 167,024 2,555 943
GASTOS DE ADMINISTRACION / OVERHEADS -154 -152 -3,907 -1,762 -774 -764 -2,958 -1,689
MARGEN OPERACIONAL NETO / NET OPERATING MARGIN 1,324 3,173 143,730 111,399 169,161 166,260 -403 -746
VALUACIÓN DE ACTIVOS Y PROVISIONES / ASSETS VALUATION AND PROVISIONS 0 0 -166 -166 -5,851 -11,026 -20 -82
RESULTADO DE OPERACIÓN / OPERATING PROFITS 1,324 3,173 143,564 111,233 163,310 155,234 -423 -828
OTROS INGRESOS Y GASTOS / SUNDRY INCOME AND EXPENSES -9 0 -5,021 -2,026 0 0 37 19
RESULTADO DEL EJERCICIO ANTES DE IMPUESTO A LA RENTA / RESULTS BEFORE INCOME TAX 1,315 3,173 138,543 109,207 163,310 155,234 -386 -809
IMPUESTO A LA RENTA / INCOME TAX -574 -1,212 0 0 -3,812 -3,082 -162 -81
RESULTADO NETO DEL EJERCICIO / PERIOD'S NET PROFIT (LOSS) 741 1,961 138,543 109,207 159,498 152,152 -548 -890
INDICADORES FINANCIEROS / FINANCIAL RATIOS
Liquidez / Liquid Ratio 0.33 1.52 n.d. 0.36 Rotación en Activos / Gross Sales to Total Assets 0.02 0.04 0.07 0.02 Solvencia / Solvency 0.85 0.23 0.15 0.86 Deuda / Patrimonio / Debt / Equity 5.47 0.29 0.18 6.20 Rentabilidad de Capital % / Return on capital % 2.79 27.57 19.95 -.- Rentabilidad sobre Activos % / Return on Assets % 0.31 3.24 6.22 -.- Rentabilidad de Patrimonio % / Return on Equity % 2.02 4.19 7.32 -.-

ESTADOS FINANCIEROS COMPARADOS / COMPARATIVE FINANCIAL STATEMENTS DIVERSAS / ASSORTEDCIFRAS EXPRESADAS EN MILES DE NUEVOS SOLES
EMPRESA/COMPANY
Transac. Financieras
Perú LNG (*)
Pluspetrol Camisea (*)
Pluspetrol Lote 56 (*)
Lima GasCIIU
0074
1110
1110
1110
51414
Pág 12 * Estados Financieros expresados en miles de US$
ESTADO DE SITUACION FINANCIERA / STATEMENT OF FINANCIAL POSITION 31/03/2012 31/12/2011 31/03/2012 31/12/2011 31/03/2012 31/12/2011 31/03/2012 31/12/2011 31/03/2012 31/12/2011
Efectivo y Equivalentes al Efectivo / Cash and cash equivalent 189 633 91,296 84,719 63,078 61,499 83,452 42,277 10,504 4,058Otros Activos Financieros / Other financial assets 17,854 13,441 243,410 171,349 0 0 0 0 0 0Cuentas por Cobrar Comerciales (neto) / Trade accounts receivable (net) 0 0 95,332 121,641 20,145 13,985 33,850 31,621 10,270 11,652Otras Cuentas por Cobrar (neto) / Other accounts receivable (net) 359 345 24,143 17,153 14,453 32,882 7,942 13,782 538 703Cuentas por Cobrar a Entidades Relacionadas / Accounts receivable from related companies 0 0 0 0 2,258 2,325 7 20,322 0 0Inventarios / Stocks 0 0 25,158 21,381 12,771 10,656 10,950 18,221 2,866 2,256Activos Biológicos / Biological assets 0 0 0 0 0 0 0 0 0 0Activos por Impuestos a las Ganancias / Assets from income tax 0 0 0 0 0 0 0 0 0 0Gastos Pagados por Anticipado / Prepaid expenses 145 78 9,588 11,624 802 1,135 514 727 125 843Otros Activos / Other assets 0 0 0 0 0 0 0 0 2,927 1,952Activos no Corrientes o Grupos de Activos para su Disposición Clasificados como Mantenidos para laVenta / Non-current assets or groups of assets for disposal classified as held for sale 0 0 0 0 0 0 0 0 0 0Activos no Corrientes o Grupos de Activos para su Disposición Clasificados como Mantenidos paraDistribuir a los Propietarios / Non-current assets or groups of assets for disposal classified as held forDistribution to owner 0 0 0 0 0 0 0 0 0 0
TOTAL ACTIVOS CORRIENTES / TOTAL CURRENT ASSETS 18,547 14,497 488,927 427,867 113,507 122,482 136,715 126,950 27,230 21,464Otros Activos Financieros / Other financial assets 0 0 0 0 0 0 0 0 57 57Inversiones Contabilizadas Aplicando el Método de la Participación / Investments booked using the equitymethod 25,024 25,597 0 0 0 0 0 0 0 0Cuentas por Cobrar Comerciales / Trade accounts receivable 0 0 0 0 0 0 0 0 0 0Otras Cuentas por Cobrar / Other accounts receivable 0 0 0 0 0 0 0 0 0 0Cuentas por Cobrar a Entidades Relacionadas / Accounts receivable from related companies 0 0 0 0 0 0 0 0 0 0Activos Biológicos / Biological assets 0 0 0 0 0 0 0 0 0 0Propiedades de Inversión / Investment property 0 0 0 0 0 0 0 0 0 0Propiedades, Planta y Equipo (neto) / Property, plant and equipment (net) 0 0 3,092,034 3,126,996 404,861 399,666 243,688 228,987 117,294 117,123Activos Intangibles (neto) / Intangible assets (net) 0 0 0 0 149 160 0 0 804 809Activos por Impuestos a las Ganancias Diferidos / Assets from deferred income tax 0 0 79,824 95,019 0 0 0 0 1,550 1,540Plusvalía / Capital gain 0 0 0 0 0 0 0 0 0 0Otros Activos / Other assets 0 0 9,731 10,242 12,392 11,333 2,600 6,014 0 0
TOTAL ACTIVOS NO CORRIENTES / TOTAL NON-CURRENT ASSETS 25,024 25,597 3,181,589 3,232,257 417,402 411,159 246,288 235,001 119,705 119,529TOTAL DE ACTIVOS / TOTAL ASSETS 43,571 40,094 3,670,516 3,660,124 530,909 533,641 383,003 361,951 146,935 140,993
Otros Pasivos Financieros / Other financial liabilities 0 0 164,987 199,070 43,093 43,018 18,354 12,539 1,312 1,496Cuentas por Pagar Comerciales / Trade accounts payable 0 0 116,849 118,657 23,868 33,232 25,566 27,400 11,807 10,401Otras Cuentas por Pagar / Other accounts payable 13,384 13,409 16,262 6,776 0 0 0 0 9,877 8,034Cuentas por Pagar a Entidades Relacionadas / Accounts payable to related companies 0 0 0 0 437 20,547 317 145 0 0Provisiones / Provisions 0 0 0 0 0 0 0 0 0 0Pasivos por Impuestos a las Ganancias / Liabilities from income tax 0 0 0 0 20,437 17,789 10,044 25,638 0 0Provisión por Beneficios a los Empleados / Provisions for employee profit sharing 0 0 0 0 0 0 0 0 0 0Otros Pasivos / Other Liabilities 0 0 0 0 47,309 6,230 60,596 16,953 0 0Pasivos incluidos en Grupos de Activos para su Disposición Clasificados como Mantenidos para la Venta/ Liabilities included in groups of assets for disposal classified as held for sale 0 0 0 0 0 0 0 0 0 0
TOTAL PASIVOS CORRIENTES / TOTAL CURRENT LIABILITIES 13,384 13,409 298,098 324,503 135,144 120,816 114,877 82,675 22,996 19,931Otros Pasivos Financieros / Other financial liabilities 0 0 2,005,766 2,000,616 116,571 127,063 107,253 112,991 2,113 2,240Cuentas por Pagar Comerciales / Trade accounts payable 0 0 0 0 0 0 0 0 0 0Otras Cuentas por Pagar / Other accounts payable 0 0 0 0 0 0 0 0 0 0Cuentas por Pagar a Entidades Relacionadas / Accounts payable to related companies 0 0 1,251,335 1,251,335 0 0 0 0 0 0Pasivos por Impuestos a las Ganancias Diferidos / Liabilities from deferred income tax 1,786 800 0 0 59,414 59,544 44,459 44,449 14,164 14,164Provisiones / Provisions 0 0 0 0 230 318 0 60 0 0Provisión por Beneficios a los Empleados / Provisions for employee profit sharing 0 0 0 0 0 0 0 0 0 0Otros Pasivos / Other Liabilities 0 0 0 0 0 0 0 0 27,426 26,795Ingresos Diferidos (netos) / Deferred income (net) 0 0 0 0 3,947 4,005 2,572 2,492 0 0
TOTAL PASIVOS NO CORRIENTES / TOTAL NON-CURRENT LIABILITIES 1,786 800 3,257,101 3,251,951 180,162 190,930 154,284 159,992 43,703 43,199TOTAL PASIVOS / TOTAL LIABILITIES 15,170 14,209 3,555,199 3,576,454 315,306 311,746 269,161 242,667 66,699 63,130
Capital Emitido / Issued capital 10,000 10,000 320,100 320,100 50,183 50,183 50,517 50,517 16,286 16,286Primas de Emisión / Share premium 0 0 0 0 0 0 0 0 0 0Acciones de Inversión / Investment stock 0 0 0 0 0 0 0 0 0 0Acciones Propias en Cartera / Treasury shares 0 0 0 0 0 0 0 0 0 0Otras Reservas de Capital / Other capital reserves 0 0 0 0 10,037 10,037 10,103 10,103 3,275 3,275Resultados Acumulados / Retained earnings 8,272 7,475 -125,998 -145,449 157,133 163,329 53,333 58,763 60,189 57,816Otras Reservas de Patrimonio / Other equity reserves 10,129 8,410 -78,785 -90,981 -1,750 -1,654 -111 -99 486 486
TOTAL PATRIMONIO / TOTAL EQUITY 28,401 25,885 115,317 83,670 215,603 221,895 113,842 119,284 80,236 77,863TOTAL PASIVO Y PATRIMONIO / TOTAL LIABILITIES AND EQUITY 43,571 40,094 3,670,516 3,660,124 530,909 533,641 383,003 361,951 146,935 140,993
ESTADO DE RESULTADOS / INCOME STATEMENT 31/03/2012 31/03/2011 31/03/2012 31/03/2011 31/03/2012 31/03/2011 31/03/2012 31/03/2011 31/03/2012 31/03/2011
Ventas Netas de Bienes / Net sales of goods 0 0 367,977 210,041 94,487 108,104 139,745 90,623 76,484 64,769Prestación de Servicios / Services rendered 0 0 0 0 0 0 0 0 0 0
TOTAL DE INGRESOS DE ACTIVIDADES ORDINARIAS / TOTAL INCOME FROM REGULARACTIVITIES 0 0 367,977 210,041 94,487 108,104 139,745 90,623 76,484 64,769
Costo de Ventas / Cost of sales 0 0 -301,648 -207,890 -44,740 -46,785 -72,034 -43,272 -63,982 -51,533GANANCIA (PERDIDA) BRUTA / GROSS PROFIT (LOSS) 0 0 66,329 2,151 49,747 61,319 67,711 47,351 12,502 13,236
Gastos de Ventas y Distribución / Sales and distribution expenses 0 0 -7,290 -6,431 -847 -1,105 -1,125 -446 -6,952 -6,577Gastos de Administración / Overheads -39 -11 -6,130 -6,876 -364 -320 -252 -186 -2,142 -2,348Ganancia (Pérdida) de la baja en Activos Financieros medidos al Costo Amortizado / Profit (loss) fromdisposal of financial assets measured at amortized cost 0 0 0 0 0 0 0 0 0 0Otros Ingresos Operativos / Other operating income 2 0 0 0 1,976 1,845 2,056 1,984 56 39Otros Gastos Operativos / Other operating expenses 0 0 0 -8,088 -236 -378 -3,952 -97 -58 -68
GANANCIA (PERDIDA) OPERATIVA / OPERATING PROFIT (LOSS) -37 -11 52,909 -19,244 50,276 61,361 64,438 48,606 3,406 4,282Ingresos Financieros / Financial income 834 22 306 437 76 127 78 82 99 10Gastos Financieros / Financial expenses 0 -650 -23,796 -25,042 -1,393 -1,428 -1,256 -1,155 -55 -60Diferencias de Cambio neto / Exchange differences net 0 0 0 0 28 93 -27 26 -4 6Participación en los Resultados Netos de Asociadas y Negocios Conjuntos Contabilizados por el Métodode la Participación / Equity in net results of associates and joint ventures booked by the equity method 0 0 0 0 0 0 0 0 0 0Ganancias (Pérdidas) de la Diferencia entre el Valor Libro Anterior y el Valor Justo de ActivosFinancieros Reclasificados Medidos a Valor Razonable / Profits (losses) from the difference between theprevious book value and fair value of financial assets reclassified and measured at fair value 0 0 0 0 0 0 0 0 0 0
RESULTADO ANTES DE IMPUESTO A LAS GANANCIAS / PRE-INCOME TAX RESULT 797 -639 29,419 -43,849 48,987 60,153 63,233 47,559 3,446 4,238Gasto por Impuesto a las Ganancias / Income tax expenses 0 0 -9,968 12,979 -15,036 -18,028 -18,651 -14,491 -1,093 -1,332
GANANCIA (PERDIDA) NETA DE OPERACIONES CONTINUADAS / NET PROFIT (LOSS) FROMCONTINUING TRADES 797 -639 19,451 -30,870 33,951 42,125 44,582 33,068 2,353 2,906
Ganancia (Pérdida) Neta del Impuesto a las Ganancias Procedente de Operaciones Discontinuadas / Netprofit (loss) arising from income tax discontinued trades 0 0 0 0 0 0 0 0 0 0
GANANCIA (PERDIDA) NETA DEL EJERCICIO / PERIOD'S NET PROFIT (LOSS) 797 -639 19,451 -30,870 33,951 42,125 44,582 33,068 2,353 2,906
INDICADORES FINANCIEROS / FINANCIAL RATIOSLiquidez / Liquid Ratio 1.39 1.64 0.84 1.19 1.18 Rotación de Activos / Gross Sales to Total Assets 0.00 0.10 0.18 0.36 0.52 Solvencia / Solvency 0.35 0.97 0.59 0.70 0.45 Deuda / Patrimonio / Debt / Equity 0.53 30.83 1.46 2.36 0.83 Rentabilidad sobre Ventas Netas % / Return % n.d. 5.29 35.93 31.90 3.08 Rentabilidad sobre Activos % / Return on Assets % 1.83 0.53 6.39 11.64 1.60 Rentabilidad de Patrimonio % / Return on Equity % 2.81 16.87 15.75 39.16 2.93

ESTADOS FINANCIEROS COMPARADOS / COMPARATIVE FINANCIAL STATEMENTS DIVERSAS / ASSORTEDCIFRAS EXPRESADAS EN MILES DE NUEVOS SOLES
EMPRESA/COMPANY
Bayer
Ferreycorp
Conces. Trasvase Olmos(*)
Hipermercados Tottus
Supermercados PeruanosCIIU
5149
5150
5190
5211
5211-8
Pág 13* Estados Financieros expresados en miles de US$
ESTADO DE SITUACION FINANCIERA / STATEMENT OF FINANCIAL POSITION 31/03/2012 31/12/2011 31/03/2012 31/12/2011 31/03/2012 31/12/2011 31/03/2012 31/12/2011 31/03/2012 31/12/2011
Efectivo y Equivalentes al Efectivo / Cash and cash equivalent 19,146 3,115 40,391 42,985 2,526 2,391 41,789 56,658 64,356 160,803Otros Activos Financieros / Other financial assets 0 0 0 0 0 0 0 0 0 0Cuentas por Cobrar Comerciales (neto) / Trade accounts receivable (net) 93,119 92,023 455,841 451,121 0 0 7,213 11,758 13,195 24,773Otras Cuentas por Cobrar (neto) / Other accounts receivable (net) 91,493 94,088 22,273 44,679 5,787 5,661 6,774 7,163 15,207 13,217Cuentas por Cobrar a Entidades Relacionadas / Accounts receivable from related companies 25 0 65,815 55,456 1,382 1,382 60,677 136,672 11,492 9,602Inventarios / Stocks 52,189 52,372 946,557 879,526 0 0 164,176 146,941 324,257 309,461Activos Biológicos / Biological assets 0 0 0 0 0 0 0 0 0 0Activos por Impuestos a las Ganancias / Assets from income tax 0 0 0 0 0 0 0 0 14,155 884Gastos Pagados por Anticipado / Prepaid expenses 1,078 898 10,176 8,812 549 104 15,205 5,430 22,796 16,468Otros Activos / Other assets 0 0 0 0 0 0 0 0 0 0Activos no Corrientes o Grupos de Activos para su Disposición Clasificados como Mantenidos para laVenta / Non-current assets or groups of assets for disposal classified as held for sale 0 0 0 0 0 0 0 0 72,670 70,628Activos no Corrientes o Grupos de Activos para su Disposición Clasificados como Mantenidos paraDistribuir a los Propietarios / Non-current assets or groups of assets for disposal classified as held forDistribution to owner 0 0 0 0 0 0 0 0 0 0
TOTAL ACTIVOS CORRIENTES / TOTAL CURRENT ASSETS 257,050 242,496 1,541,053 1,482,579 10,244 9,538 295,834 364,622 538,128 605,836Otros Activos Financieros / Other financial assets 0 0 266,746 253,586 0 0 0 0 8,501 8,553Inversiones Contabilizadas Aplicando el Método de la Participación / Investments booked using the equitymethod 4 4 0 0 0 0 0 0 244 244Cuentas por Cobrar Comerciales / Trade accounts receivable 0 0 17,774 16,872 0 0 0 0 0 0Otras Cuentas por Cobrar / Other accounts receivable 0 0 5,872 5,448 5,500 5,500 0 0 1,718 1,849Cuentas por Cobrar a Entidades Relacionadas / Accounts receivable from related companies 0 0 28,785 29,683 0 0 0 0 0 0Activos Biológicos / Biological assets 0 0 0 0 0 0 0 0 0 0Propiedades de Inversión / Investment property 0 0 0 0 0 0 0 0 9,085 9,200Propiedades, Planta y Equipo (neto) / Property, plant and equipment (net) 5,061 5,445 677,521 672,334 13 13 580,120 552,996 1,188,127 1,116,465Activos Intangibles (neto) / Intangible assets (net) 4,296 4,242 0 0 259,296 254,501 3,824 3,988 44,343 43,600Activos por Impuestos a las Ganancias Diferidos / Assets from deferred income tax 8,525 8,019 0 0 4,248 4,068 12,785 12,271 0 0Plusvalía / Capital gain 0 0 0 0 0 0 0 0 0 0Otros Activos / Other assets 122 122 9,622 9,281 0 0 76,120 39,270 55,780 55,780
TOTAL ACTIVOS NO CORRIENTES / TOTAL NON-CURRENT ASSETS 18,008 17,832 1,006,320 987,204 269,057 264,082 672,849 608,525 1,307,798 1,235,691TOTAL DE ACTIVOS / TOTAL ASSETS 275,058 260,328 2,547,373 2,469,783 279,301 273,620 968,683 973,147 1,845,926 1,841,527
Otros Pasivos Financieros / Other financial liabilities 0 0 328,418 431,429 14,950 6,928 88,254 91,994 60,264 63,746Cuentas por Pagar Comerciales / Trade accounts payable 30,245 22,628 241,724 248,706 123 193 189,145 186,605 576,164 623,918Otras Cuentas por Pagar / Other accounts payable 1,658 2,350 290,964 288,586 1,052 1,064 15,911 29,047 66,470 65,099Cuentas por Pagar a Entidades Relacionadas / Accounts payable to related companies 8,730 11,460 5,524 7,957 83,934 82,436 26,581 25,643 6,029 10,671Provisiones / Provisions 9,932 10,313 72,998 59,499 0 0 4,039 4,730 0 0Pasivos por Impuestos a las Ganancias / Liabilities from income tax 0 0 8,164 18,108 0 0 12,310 12,410 0 1,362Provisión por Beneficios a los Empleados / Provisions for employee profit sharing 0 0 7,157 2,611 0 0 13,995 16,507 0 0Otros Pasivos / Other Liabilities 0 0 41,953 0 0 0 4,457 6,062 3,618 3,731Pasivos incluidos en Grupos de Activos para su Disposición Clasificados como Mantenidos para la Venta/ Liabilities included in groups of assets for disposal classified as held for sale 0 0 0 0 0 0 0 0 0 0
TOTAL PASIVOS CORRIENTES / TOTAL CURRENT LIABILITIES 50,565 46,751 996,902 1,056,896 100,059 90,621 354,692 372,998 712,545 768,527Otros Pasivos Financieros / Other financial liabilities 0 0 429,729 445,522 164,172 167,118 222,209 214,494 563,535 571,562Cuentas por Pagar Comerciales / Trade accounts payable 0 0 0 0 0 0 0 0 0 0Otras Cuentas por Pagar / Other accounts payable 0 0 0 0 0 0 0 0 0 0Cuentas por Pagar a Entidades Relacionadas / Accounts payable to related companies 0 0 0 0 0 0 0 0 2,200 2,278Pasivos por Impuestos a las Ganancias Diferidos / Liabilities from deferred income tax 3,041 2,499 7,400 12,932 0 0 0 0 24,475 22,187Provisiones / Provisions 1,159 1,593 0 0 0 0 927 926 0 0Provisión por Beneficios a los Empleados / Provisions for employee profit sharing 0 0 0 0 0 0 0 0 0 0Otros Pasivos / Other Liabilities 0 0 0 0 4,977 4,088 0 0 3,988 4,042Ingresos Diferidos (netos) / Deferred income (net) 57 0 0 0 0 0 232 220 12,969 13,995
TOTAL PASIVOS NO CORRIENTES / TOTAL NON-CURRENT LIABILITIES 4,257 4,092 437,129 458,454 169,149 171,206 223,368 215,640 607,167 614,064TOTAL PASIVOS / TOTAL LIABILITIES 54,822 50,843 1,434,031 1,515,350 269,208 261,827 578,060 588,638 1,319,712 1,382,591
Capital Emitido / Issued capital 21,835 21,835 803,235 623,635 20,000 20,000 293,386 293,386 316,685 306,678Primas de Emisión / Share premium 0 0 95,702 0 0 0 0 0 71,907 27,314Acciones de Inversión / Investment stock 3,490 3,490 0 0 0 0 0 0 0 0Acciones Propias en Cartera / Treasury shares 0 0 0 0 0 0 0 0 0 0Otras Reservas de Capital / Other capital reserves 185,784 154,707 82,179 63,692 0 0 14,620 11,350 7,062 7,062Resultados Acumulados / Retained earnings 9,127 29,453 30,048 165,222 -6,055 -5,345 79,670 77,287 126,180 115,757Otras Reservas de Patrimonio / Other equity reserves 0 0 102,178 101,884 -3,852 -2,862 2,947 2,486 4,380 2,125
TOTAL PATRIMONIO / TOTAL EQUITY 220,236 209,485 1,113,342 954,433 10,093 11,793 390,623 384,509 526,214 458,936TOTAL PASIVO Y PATRIMONIO / TOTAL LIABILITIES AND EQUITY 275,058 260,328 2,547,373 2,469,783 279,301 273,620 968,683 973,147 1,845,926 1,841,527
ESTADO DE RESULTADOS / INCOME STATEMENT 31/03/2012 31/03/2011 31/03/2012 31/03/2011 31/03/2012 31/03/2011 31/03/2012 31/03/2011 31/03/2012 31/03/2011
Ventas Netas de Bienes / Net sales of goods 85,149 74,295 665,773 546,430 0 0 524,817 421,691 720,045 646,025Prestación de Servicios / Services rendered 93 150 79,283 62,195 0 0 0 0 0 0
TOTAL DE INGRESOS DE ACTIVIDADES ORDINARIAS / TOTAL INCOME FROM REGULARACTIVITIES 85,242 74,445 745,056 608,625 0 0 524,817 421,691 720,045 646,025
Costo de Ventas / Cost of sales -48,040 -44,018 -593,660 -469,057 0 0 -414,967 -336,130 -539,866 -488,804GANANCIA (PERDIDA) BRUTA / GROSS PROFIT (LOSS) 37,202 30,427 151,396 139,568 0 0 109,850 85,561 180,179 157,221
Gastos de Ventas y Distribución / Sales and distribution expenses -22,515 -22,296 -75,853 -63,398 0 0 -79,317 -66,596 -138,287 -123,139Gastos de Administración / Overheads -988 -1,277 -32,115 -26,024 -309 -244 -21,344 -17,286 -18,726 -17,076Ganancia (Pérdida) de la baja en Activos Financieros medidos al Costo Amortizado / Profit (loss) fromdisposal of financial assets measured at amortized cost 0 0 0 0 0 0 0 0 0 0Otros Ingresos Operativos / Other operating income 815 1,575 81 279 0 0 5,021 5,960 0 0Otros Gastos Operativos / Other operating expenses -693 -291 0 0 0 0 -379 -823 -481 -624
GANANCIA (PERDIDA) OPERATIVA / OPERATING PROFIT (LOSS) 13,821 8,138 43,509 50,425 -309 -244 13,831 6,816 22,685 16,382Ingresos Financieros / Financial income 420 185 4,059 3,850 0 2 810 10 3,611 1,048Gastos Financieros / Financial expenses -814 -213 -10,897 -9,865 -3 -2 -5,847 -3,663 -16,282 -8,463Diferencias de Cambio neto / Exchange differences net -810 -87 7,469 -1,689 -679 -99 281 226 4,597 290Participación en los Resultados Netos de Asociadas y Negocios Conjuntos Contabilizados por el Métodode la Participación / Equity in net results of associates and joint ventures booked by the equity method 0 0 0 0 0 0 0 0 0 0Ganancias (Pérdidas) de la Diferencia entre el Valor Libro Anterior y el Valor Justo de ActivosFinancieros Reclasificados Medidos a Valor Razonable / Profits (losses) from the difference between theprevious book value and fair value of financial assets reclassified and measured at fair value 0 0 0 0 0 0 -129 229 0 0
RESULTADO ANTES DE IMPUESTO A LAS GANANCIAS / PRE-INCOME TAX RESULT 12,617 8,023 44,140 42,721 -991 -343 8,946 3,618 14,611 9,257Gasto por Impuesto a las Ganancias / Income tax expenses -3,490 -2,562 -14,092 -14,435 281 101 -3,293 -945 -4,188 -4,481
GANANCIA (PERDIDA) NETA DE OPERACIONES CONTINUADAS / NET PROFIT (LOSS) FROMCONTINUING TRADES 9,127 5,461 30,048 28,286 -710 -242 5,653 2,673 10,423 4,776
Ganancia (Pérdida) Neta del Impuesto a las Ganancias Procedente de Operaciones Discontinuadas / Netprofit (loss) arising from income tax discontinued trades 0 0 0 0 0 0 0 0 0 0
GANANCIA (PERDIDA) NETA DEL EJERCICIO / PERIOD'S NET PROFIT (LOSS) 9,127 5,461 30,048 28,286 -710 -242 5,653 2,673 10,423 4,776
INDICADORES FINANCIEROS / FINANCIAL RATIOSLiquidez / Liquid Ratio 5.08 1.55 0.10 0.83 0.76 Rotación de Activos / Gross Sales to Total Assets 0.31 0.29 0.00 0.54 0.39 Solvencia / Solvency 0.20 0.56 0.96 0.60 0.71 Deuda / Patrimonio / Debt / Equity 0.25 1.29 26.67 1.48 2.51 Rentabilidad sobre Ventas Netas % / Return % 10.71 4.03 n.d. 1.08 1.45 Rentabilidad sobre Activos % / Return on Assets % 3.32 1.18 -.- 0.58 0.56 Rentabilidad de Patrimonio % / Return on Equity % 4.14 2.70 -.- 1.45 1.98
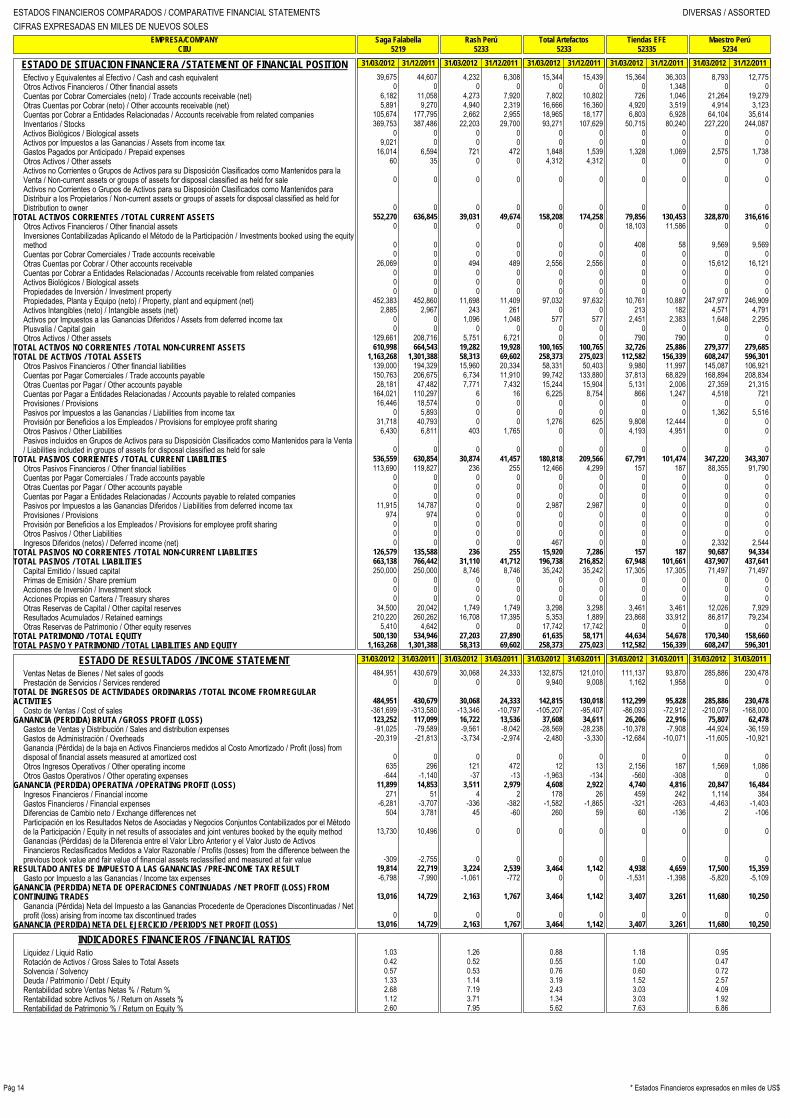
ESTADOS FINANCIEROS COMPARADOS / COMPARATIVE FINANCIAL STATEMENTS DIVERSAS / ASSORTEDCIFRAS EXPRESADAS EN MILES DE NUEVOS SOLES
EMPRESA/COMPANY
Saga Falabella
Rash Perú
Total Artefactos
Tiendas EFE
Maestro PerúCIIU
5219
5233
5233
52335
5234
Pág 14 * Estados Financieros expresados en miles de US$
ESTADO DE SITUACION FINANCIERA / STATEMENT OF FINANCIAL POSITION 31/03/2012 31/12/2011 31/03/2012 31/12/2011 31/03/2012 31/12/2011 31/03/2012 31/12/2011 31/03/2012 31/12/2011
Efectivo y Equivalentes al Efectivo / Cash and cash equivalent 39,675 44,607 4,232 6,308 15,344 15,439 15,364 36,303 8,793 12,775Otros Activos Financieros / Other financial assets 0 0 0 0 0 0 0 1,348 0 0Cuentas por Cobrar Comerciales (neto) / Trade accounts receivable (net) 6,182 11,058 4,273 7,920 7,802 10,802 726 1,046 21,264 19,279Otras Cuentas por Cobrar (neto) / Other accounts receivable (net) 5,891 9,270 4,940 2,319 16,666 16,360 4,920 3,519 4,914 3,123Cuentas por Cobrar a Entidades Relacionadas / Accounts receivable from related companies 105,674 177,795 2,662 2,955 18,965 18,177 6,803 6,928 64,104 35,614Inventarios / Stocks 369,753 387,486 22,203 29,700 93,271 107,629 50,715 80,240 227,220 244,087Activos Biológicos / Biological assets 0 0 0 0 0 0 0 0 0 0Activos por Impuestos a las Ganancias / Assets from income tax 9,021 0 0 0 0 0 0 0 0 0Gastos Pagados por Anticipado / Prepaid expenses 16,014 6,594 721 472 1,848 1,539 1,328 1,069 2,575 1,738Otros Activos / Other assets 60 35 0 0 4,312 4,312 0 0 0 0Activos no Corrientes o Grupos de Activos para su Disposición Clasificados como Mantenidos para laVenta / Non-current assets or groups of assets for disposal classified as held for sale 0 0 0 0 0 0 0 0 0 0Activos no Corrientes o Grupos de Activos para su Disposición Clasificados como Mantenidos paraDistribuir a los Propietarios / Non-current assets or groups of assets for disposal classified as held forDistribution to owner 0 0 0 0 0 0 0 0 0 0
TOTAL ACTIVOS CORRIENTES / TOTAL CURRENT ASSETS 552,270 636,845 39,031 49,674 158,208 174,258 79,856 130,453 328,870 316,616Otros Activos Financieros / Other financial assets 0 0 0 0 0 0 18,103 11,586 0 0Inversiones Contabilizadas Aplicando el Método de la Participación / Investments booked using the equitymethod 0 0 0 0 0 0 408 58 9,569 9,569Cuentas por Cobrar Comerciales / Trade accounts receivable 0 0 0 0 0 0 0 0 0 0Otras Cuentas por Cobrar / Other accounts receivable 26,069 0 494 489 2,556 2,556 0 0 15,612 16,121Cuentas por Cobrar a Entidades Relacionadas / Accounts receivable from related companies 0 0 0 0 0 0 0 0 0 0Activos Biológicos / Biological assets 0 0 0 0 0 0 0 0 0 0Propiedades de Inversión / Investment property 0 0 0 0 0 0 0 0 0 0Propiedades, Planta y Equipo (neto) / Property, plant and equipment (net) 452,383 452,860 11,698 11,409 97,032 97,632 10,761 10,887 247,977 246,909Activos Intangibles (neto) / Intangible assets (net) 2,885 2,967 243 261 0 0 213 182 4,571 4,791Activos por Impuestos a las Ganancias Diferidos / Assets from deferred income tax 0 0 1,096 1,048 577 577 2,451 2,383 1,648 2,295Plusvalía / Capital gain 0 0 0 0 0 0 0 0 0 0Otros Activos / Other assets 129,661 208,716 5,751 6,721 0 0 790 790 0 0
TOTAL ACTIVOS NO CORRIENTES / TOTAL NON-CURRENT ASSETS 610,998 664,543 19,282 19,928 100,165 100,765 32,726 25,886 279,377 279,685TOTAL DE ACTIVOS / TOTAL ASSETS 1,163,268 1,301,388 58,313 69,602 258,373 275,023 112,582 156,339 608,247 596,301
Otros Pasivos Financieros / Other financial liabilities 139,000 194,329 15,960 20,334 58,331 50,403 9,980 11,997 145,087 106,921Cuentas por Pagar Comerciales / Trade accounts payable 150,763 206,675 6,734 11,910 99,742 133,880 37,813 68,829 168,894 208,834Otras Cuentas por Pagar / Other accounts payable 28,181 47,482 7,771 7,432 15,244 15,904 5,131 2,006 27,359 21,315Cuentas por Pagar a Entidades Relacionadas / Accounts payable to related companies 164,021 110,297 6 16 6,225 8,754 866 1,247 4,518 721Provisiones / Provisions 16,446 18,574 0 0 0 0 0 0 0 0Pasivos por Impuestos a las Ganancias / Liabilities from income tax 0 5,893 0 0 0 0 0 0 1,362 5,516Provisión por Beneficios a los Empleados / Provisions for employee profit sharing 31,718 40,793 0 0 1,276 625 9,808 12,444 0 0Otros Pasivos / Other Liabilities 6,430 6,811 403 1,765 0 0 4,193 4,951 0 0Pasivos incluidos en Grupos de Activos para su Disposición Clasificados como Mantenidos para la Venta/ Liabilities included in groups of assets for disposal classified as held for sale 0 0 0 0 0 0 0 0 0 0
TOTAL PASIVOS CORRIENTES / TOTAL CURRENT LIABILITIES 536,559 630,854 30,874 41,457 180,818 209,566 67,791 101,474 347,220 343,307Otros Pasivos Financieros / Other financial liabilities 113,690 119,827 236 255 12,466 4,299 157 187 88,355 91,790Cuentas por Pagar Comerciales / Trade accounts payable 0 0 0 0 0 0 0 0 0 0Otras Cuentas por Pagar / Other accounts payable 0 0 0 0 0 0 0 0 0 0Cuentas por Pagar a Entidades Relacionadas / Accounts payable to related companies 0 0 0 0 0 0 0 0 0 0Pasivos por Impuestos a las Ganancias Diferidos / Liabilities from deferred income tax 11,915 14,787 0 0 2,987 2,987 0 0 0 0Provisiones / Provisions 974 974 0 0 0 0 0 0 0 0Provisión por Beneficios a los Empleados / Provisions for employee profit sharing 0 0 0 0 0 0 0 0 0 0Otros Pasivos / Other Liabilities 0 0 0 0 0 0 0 0 0 0Ingresos Diferidos (netos) / Deferred income (net) 0 0 0 0 467 0 0 0 2,332 2,544
TOTAL PASIVOS NO CORRIENTES / TOTAL NON-CURRENT LIABILITIES 126,579 135,588 236 255 15,920 7,286 157 187 90,687 94,334TOTAL PASIVOS / TOTAL LIABILITIES 663,138 766,442 31,110 41,712 196,738 216,852 67,948 101,661 437,907 437,641
Capital Emitido / Issued capital 250,000 250,000 8,746 8,746 35,242 35,242 17,305 17,305 71,497 71,497Primas de Emisión / Share premium 0 0 0 0 0 0 0 0 0 0Acciones de Inversión / Investment stock 0 0 0 0 0 0 0 0 0 0Acciones Propias en Cartera / Treasury shares 0 0 0 0 0 0 0 0 0 0Otras Reservas de Capital / Other capital reserves 34,500 20,042 1,749 1,749 3,298 3,298 3,461 3,461 12,026 7,929Resultados Acumulados / Retained earnings 210,220 260,262 16,708 17,395 5,353 1,889 23,868 33,912 86,817 79,234Otras Reservas de Patrimonio / Other equity reserves 5,410 4,642 0 0 17,742 17,742 0 0 0 0
TOTAL PATRIMONIO / TOTAL EQUITY 500,130 534,946 27,203 27,890 61,635 58,171 44,634 54,678 170,340 158,660TOTAL PASIVO Y PATRIMONIO / TOTAL LIABILITIES AND EQUITY 1,163,268 1,301,388 58,313 69,602 258,373 275,023 112,582 156,339 608,247 596,301
ESTADO DE RESULTADOS / INCOME STATEMENT 31/03/2012 31/03/2011 31/03/2012 31/03/2011 31/03/2012 31/03/2011 31/03/2012 31/03/2011 31/03/2012 31/03/2011
Ventas Netas de Bienes / Net sales of goods 484,951 430,679 30,068 24,333 132,875 121,010 111,137 93,870 285,886 230,478Prestación de Servicios / Services rendered 0 0 0 0 9,940 9,008 1,162 1,958 0 0
TOTAL DE INGRESOS DE ACTIVIDADES ORDINARIAS / TOTAL INCOME FROM REGULARACTIVITIES 484,951 430,679 30,068 24,333 142,815 130,018 112,299 95,828 285,886 230,478
Costo de Ventas / Cost of sales -361,699 -313,580 -13,346 -10,797 -105,207 -95,407 -86,093 -72,912 -210,079 -168,000GANANCIA (PERDIDA) BRUTA / GROSS PROFIT (LOSS) 123,252 117,099 16,722 13,536 37,608 34,611 26,206 22,916 75,807 62,478
Gastos de Ventas y Distribución / Sales and distribution expenses -91,025 -79,589 -9,561 -8,042 -28,569 -28,238 -10,378 -7,908 -44,924 -36,159Gastos de Administración / Overheads -20,319 -21,813 -3,734 -2,974 -2,480 -3,330 -12,684 -10,071 -11,605 -10,921Ganancia (Pérdida) de la baja en Activos Financieros medidos al Costo Amortizado / Profit (loss) fromdisposal of financial assets measured at amortized cost 0 0 0 0 0 0 0 0 0 0Otros Ingresos Operativos / Other operating income 635 296 121 472 12 13 2,156 187 1,569 1,086Otros Gastos Operativos / Other operating expenses -644 -1,140 -37 -13 -1,963 -134 -560 -308 0 0
GANANCIA (PERDIDA) OPERATIVA / OPERATING PROFIT (LOSS) 11,899 14,853 3,511 2,979 4,608 2,922 4,740 4,816 20,847 16,484Ingresos Financieros / Financial income 271 51 4 2 178 26 459 242 1,114 384Gastos Financieros / Financial expenses -6,281 -3,707 -336 -382 -1,582 -1,865 -321 -263 -4,463 -1,403Diferencias de Cambio neto / Exchange differences net 504 3,781 45 -60 260 59 60 -136 2 -106Participación en los Resultados Netos de Asociadas y Negocios Conjuntos Contabilizados por el Métodode la Participación / Equity in net results of associates and joint ventures booked by the equity method 13,730 10,496 0 0 0 0 0 0 0 0Ganancias (Pérdidas) de la Diferencia entre el Valor Libro Anterior y el Valor Justo de ActivosFinancieros Reclasificados Medidos a Valor Razonable / Profits (losses) from the difference between theprevious book value and fair value of financial assets reclassified and measured at fair value -309 -2,755 0 0 0 0 0 0 0 0
RESULTADO ANTES DE IMPUESTO A LAS GANANCIAS / PRE-INCOME TAX RESULT 19,814 22,719 3,224 2,539 3,464 1,142 4,938 4,659 17,500 15,359Gasto por Impuesto a las Ganancias / Income tax expenses -6,798 -7,990 -1,061 -772 0 0 -1,531 -1,398 -5,820 -5,109
GANANCIA (PERDIDA) NETA DE OPERACIONES CONTINUADAS / NET PROFIT (LOSS) FROMCONTINUING TRADES 13,016 14,729 2,163 1,767 3,464 1,142 3,407 3,261 11,680 10,250
Ganancia (Pérdida) Neta del Impuesto a las Ganancias Procedente de Operaciones Discontinuadas / Netprofit (loss) arising from income tax discontinued trades 0 0 0 0 0 0 0 0 0 0
GANANCIA (PERDIDA) NETA DEL EJERCICIO / PERIOD'S NET PROFIT (LOSS) 13,016 14,729 2,163 1,767 3,464 1,142 3,407 3,261 11,680 10,250
INDICADORES FINANCIEROS / FINANCIAL RATIOSLiquidez / Liquid Ratio 1.03 1.26 0.88 1.18 0.95 Rotación de Activos / Gross Sales to Total Assets 0.42 0.52 0.55 1.00 0.47 Solvencia / Solvency 0.57 0.53 0.76 0.60 0.72 Deuda / Patrimonio / Debt / Equity 1.33 1.14 3.19 1.52 2.57 Rentabilidad sobre Ventas Netas % / Return % 2.68 7.19 2.43 3.03 4.09 Rentabilidad sobre Activos % / Return on Assets % 1.12 3.71 1.34 3.03 1.92 Rentabilidad de Patrimonio % / Return on Equity % 2.60 7.95 5.62 7.63 6.86

ESTADOS FINANCIEROS COMPARADOS / COMPARATIVE FINANCIAL STATEMENTS DIVERSAS / ASSORTEDCIFRAS EXPRESADAS EN MILES DE NUEVOS SOLES
EMPRESA/COMPANY
INTURSA
Inversiones La Rioja
INVERTUR
CONCESUR
FalabellaCIIU
5510
5510
5510-4
6599
6599
Pág 15* Estados Financieros expresados en miles de US$
ESTADO DE SITUACION FINANCIERA / STATEMENT OF FINANCIAL POSITION 31/03/2012 31/12/2011 31/03/2012 31/12/2011 31/03/2012 31/12/2011 31/03/2012 31/12/2011 31/03/2012 31/12/2011
Efectivo y Equivalentes al Efectivo / Cash and cash equivalent 86,677 92,124 5,853 14,321 636 686 73 106 2,194 15,528Otros Activos Financieros / Other financial assets 1,990 1,052 0 0 2,333 1,733 0 0 0 0Cuentas por Cobrar Comerciales (neto) / Trade accounts receivable (net) 4,936 7,873 3,069 2,583 593 709 0 0 0 0Otras Cuentas por Cobrar (neto) / Other accounts receivable (net) 18,641 27,561 7,113 7,320 642 471 202 316 716 1,892Cuentas por Cobrar a Entidades Relacionadas / Accounts receivable from related companies 413 741 1,836 1,851 0 0 153,996 5 85,759 235Inventarios / Stocks 2,783 3,051 566 537 550 519 0 0 0 0Activos Biológicos / Biological assets 0 0 0 0 0 0 0 0 0 0Activos por Impuestos a las Ganancias / Assets from income tax 1,863 0 0 0 0 0 0 0 91 0Gastos Pagados por Anticipado / Prepaid expenses 1,187 0 4,829 3,493 357 434 1,277 2,066 379 379Otros Activos / Other assets 9,168 9,517 0 0 0 0 0 0 0 0Activos no Corrientes o Grupos de Activos para su Disposición Clasificados como Mantenidos para laVenta / Non-current assets or groups of assets for disposal classified as held for sale 0 0 0 0 0 0 0 0 0 0Activos no Corrientes o Grupos de Activos para su Disposición Clasificados como Mantenidos paraDistribuir a los Propietarios / Non-current assets or groups of assets for disposal classified as held forDistribution to owner 0 0 0 0 0 0 0 0 0 0
TOTAL ACTIVOS CORRIENTES / TOTAL CURRENT ASSETS 127,658 141,919 23,266 30,105 5,111 4,552 155,548 2,493 89,139 18,034Otros Activos Financieros / Other financial assets 0 0 0 0 962 962 624,689 624,689 0 0Inversiones Contabilizadas Aplicando el Método de la Participación / Investments booked using the equitymethod 12,763 12,763 0 0 0 0 0 0 0 0Cuentas por Cobrar Comerciales / Trade accounts receivable 0 0 0 0 0 0 0 0 0 0Otras Cuentas por Cobrar / Other accounts receivable 0 0 0 0 0 0 0 0 0 0Cuentas por Cobrar a Entidades Relacionadas / Accounts receivable from related companies 0 0 0 0 0 0 0 0 0 0Activos Biológicos / Biological assets 0 0 0 0 0 0 0 0 0 0Propiedades de Inversión / Investment property 0 0 7,632 7,671 0 0 0 0 0 0Propiedades, Planta y Equipo (neto) / Property, plant and equipment (net) 934,827 930,241 394,539 388,210 32,313 32,500 0 0 0 0Activos Intangibles (neto) / Intangible assets (net) 2,595 2,677 75 81 0 0 0 0 6 0Activos por Impuestos a las Ganancias Diferidos / Assets from deferred income tax 12,834 0 0 0 0 0 0 0 0 0Plusvalía / Capital gain 0 0 0 0 0 0 0 0 0 0Otros Activos / Other assets 28,033 22,781 0 0 974 976 0 0 1,493,904 1,500,342
TOTAL ACTIVOS NO CORRIENTES / TOTAL NON-CURRENT ASSETS 991,052 968,462 402,246 395,962 34,249 34,438 624,689 624,689 1,493,910 1,500,342TOTAL DE ACTIVOS / TOTAL ASSETS 1,118,710 1,110,381 425,512 426,067 39,360 38,990 780,237 627,182 1,583,049 1,518,376
Otros Pasivos Financieros / Other financial liabilities 0 0 38,369 40,219 0 0 0 0 0 0Cuentas por Pagar Comerciales / Trade accounts payable 8,915 12,343 2,669 4,151 687 718 11 8 155 37Otras Cuentas por Pagar / Other accounts payable 22,118 16,742 6,390 9,007 2,390 2,408 5,519 5,204 68,166 1,147Cuentas por Pagar a Entidades Relacionadas / Accounts payable to related companies 172 2,686 637 651 0 0 189,435 40,213 69 27Provisiones / Provisions 0 0 0 0 0 0 0 0 0 0Pasivos por Impuestos a las Ganancias / Liabilities from income tax 0 0 165 861 0 0 0 0 0 1,327Provisión por Beneficios a los Empleados / Provisions for employee profit sharing 0 0 0 0 0 0 0 0 0 0Otros Pasivos / Other Liabilities 9,326 9,326 120 0 859 862 0 0 0 0Pasivos incluidos en Grupos de Activos para su Disposición Clasificados como Mantenidos para la Venta/ Liabilities included in groups of assets for disposal classified as held for sale 0 0 0 0 0 0 0 0 0 0
TOTAL PASIVOS CORRIENTES / TOTAL CURRENT LIABILITIES 40,531 41,097 48,350 54,889 3,936 3,988 194,965 45,425 68,390 2,538Otros Pasivos Financieros / Other financial liabilities 199,267 200,486 58,012 56,413 1,189 1,417 53,360 53,940 0 0Cuentas por Pagar Comerciales / Trade accounts payable 0 0 0 0 0 0 0 0 0 0Otras Cuentas por Pagar / Other accounts payable 16,894 15,254 0 0 0 0 0 0 0 0Cuentas por Pagar a Entidades Relacionadas / Accounts payable to related companies 0 0 0 0 0 0 23,185 171,520 0 0Pasivos por Impuestos a las Ganancias Diferidos / Liabilities from deferred income tax 46,987 32,110 52,218 51,582 1,230 1,172 0 0 0 0Provisiones / Provisions 0 0 0 0 0 0 0 0 0 0Provisión por Beneficios a los Empleados / Provisions for employee profit sharing 0 0 0 0 0 0 0 0 0 0Otros Pasivos / Other Liabilities 0 0 0 0 0 0 0 0 0 0Ingresos Diferidos (netos) / Deferred income (net) 0 0 0 0 0 0 0 0 0 0
TOTAL PASIVOS NO CORRIENTES / TOTAL NON-CURRENT LIABILITIES 263,148 247,850 110,230 107,995 2,419 2,589 76,545 225,460 TOTAL PASIVOS / TOTAL LIABILITIES 303,679 288,947 158,580 162,884 6,355 6,577 271,510 270,885 68,390 2,538
Capital Emitido / Issued capital 806,697 806,697 76,535 76,535 22,925 22,925 253,634 253,634 191,031 191,031Primas de Emisión / Share premium 0 0 28,977 29,071 0 0 0 0 28,957 28,957Acciones de Inversión / Investment stock 0 0 0 0 0 0 25,914 25,914 0 0Acciones Propias en Cartera / Treasury shares 0 0 0 0 0 0 0 0 -203 -203Otras Reservas de Capital / Other capital reserves 8,070 8,070 9,996 9,996 1,252 1,252 18,074 18,074 38,166 38,166Resultados Acumulados / Retained earnings 264 6,667 54,789 50,946 7,757 7,165 211,105 58,675 1,251,203 1,252,382Otras Reservas de Patrimonio / Other equity reserves 0 0 96,635 96,635 1,071 1,071 0 0 5,505 5,505
TOTAL PATRIMONIO / TOTAL EQUITY 815,031 821,434 266,932 263,183 33,005 32,413 508,727 356,297 1,514,659 1,515,838TOTAL PASIVO Y PATRIMONIO / TOTAL LIABILITIES AND EQUITY 1,118,710 1,110,381 425,512 426,067 39,360 38,990 780,237 627,182 1,583,049 1,518,376
ESTADO DE RESULTADOS / INCOME STATEMENT 31/03/2012 31/03/2011 31/03/2012 31/03/2011 31/03/2012 31/03/2011 31/03/2012 31/03/2011 31/03/2012 31/03/2011
Ventas Netas de Bienes / Net sales of goods 0 0 0 0 0 0 0 0 0 0Prestación de Servicios / Services rendered 34,716 17,179 19,291 18,743 4,999 4,446 0 0 0 0
TOTAL DE INGRESOS DE ACTIVIDADES ORDINARIAS / TOTAL INCOME FROM REGULARACTIVITIES 34,716 17,179 19,291 18,743 4,999 4,446 0 0 0 0
Costo de Ventas / Cost of sales -26,775 -15,860 -6,955 -6,629 -875 -806 0 0 0 0GANANCIA (PERDIDA) BRUTA / GROSS PROFIT (LOSS) 7,941 1,319 12,336 12,114 4,124 3,640 0 0 0 0
Gastos de Ventas y Distribución / Sales and distribution expenses -3,427 -2,283 -1,300 -1,295 -154 -186 0 0 0 0Gastos de Administración / Overheads -6,772 -5,779 -5,907 -5,719 -2,464 -2,423 -1,157 -270 -177 -189Ganancia (Pérdida) de la baja en Activos Financieros medidos al Costo Amortizado / Profit (loss) fromdisposal of financial assets measured at amortized cost 0 0 -13 37 0 0 0 0 0 0Otros Ingresos Operativos / Other operating income 406 11 2 13 27 20 0 0 65,851 14,298Otros Gastos Operativos / Other operating expenses 0 0 0 0 -42 -23 0 0 0 0
GANANCIA (PERDIDA) OPERATIVA / OPERATING PROFIT (LOSS) -1,852 -6,732 5,118 5,150 1,491 1,028 -1,157 -270 65,674 14,109Ingresos Financieros / Financial income 1,376 93 31 5 32 16 153,991 102,411 789 485Gastos Financieros / Financial expenses -5,488 -437 -423 -543 -56 -73 -2,677 -1,451 -666 -756Diferencias de Cambio neto / Exchange differences net 1,480 443 690 128 0 0 2,273 29 -6 -1Participación en los Resultados Netos de Asociadas y Negocios Conjuntos Contabilizados por el Métodode la Participación / Equity in net results of associates and joint ventures booked by the equity method 0 0 0 0 0 0 0 0 0 0Ganancias (Pérdidas) de la Diferencia entre el Valor Libro Anterior y el Valor Justo de ActivosFinancieros Reclasificados Medidos a Valor Razonable / Profits (losses) from the difference between theprevious book value and fair value of financial assets reclassified and measured at fair value 0 0 0 0 0 0 0 0 0 0
RESULTADO ANTES DE IMPUESTO A LAS GANANCIAS / PRE-INCOME TAX RESULT -4,484 -6,633 5,416 4,740 1,467 971 152,430 100,719 65,791 13,837Gasto por Impuesto a las Ganancias / Income tax expenses -1,919 -880 -1,573 -1,582 -475 -330 0 0 -245 -669
GANANCIA (PERDIDA) NETA DE OPERACIONES CONTINUADAS / NET PROFIT (LOSS) FROMCONTINUING TRADES -6,403 -7,513 3,843 3,158 992 641 152,430 100,719 65,546 13,168
Ganancia (Pérdida) Neta del Impuesto a las Ganancias Procedente de Operaciones Discontinuadas / Netprofit (loss) arising from income tax discontinued trades 0 0 0 0 0 0 0 0 0 0
GANANCIA (PERDIDA) NETA DEL EJERCICIO / PERIOD'S NET PROFIT (LOSS) -6,403 -7,513 3,843 3,158 992 641 152,430 100,719 65,546 13,168
INDICADORES FINANCIEROS / FINANCIAL RATIOSLiquidez / Liquid Ratio 3.15 0.48 1.30 0.80 1.30 Rotación de Activos / Gross Sales to Total Assets 0.03 0.05 0.13 0.00 0.00 Solvencia / Solvency 0.27 0.37 0.16 0.35 0.04 Deuda / Patrimonio / Debt / Equity 0.37 0.59 0.19 0.53 0.05 Rentabilidad sobre Ventas Netas % / Return % -.- 19.92 19.84 n.d. n.d. Rentabilidad sobre Activos % / Return on Assets % -.- 0.90 2.52 19.54 4.14 Rentabilidad de Patrimonio % / Return on Equity % -.- 1.44 3.01 29.96 4.33

ESTADOS FINANCIEROS COMPARADOS / COMPARATIVE FINANCIAL STATEMENTS DIVERSAS / ASSORTEDCIFRAS EXPRESADAS EN MILES DE NUEVOS SOLES
EMPRESA/COMPANY
Latina Holding
BVL
Continental Soc. Tituliz.
Intertítulos Soc. Tit.
Creditítulos Soc. Tit.(*)CIIU
6601/6603
6711
6711
6711
67118
Pág 16 * Estados Financieros expresados en miles de US$
ESTADO DE SITUACION FINANCIERA / STATEMENT OF FINANCIAL POSITION 31/03/2012 31/12/2011 31/03/2012 31/12/2011 31/03/2012 31/12/2011 31/03/2012 31/12/2011 31/03/2012 31/12/2011
Efectivo y Equivalentes al Efectivo / Cash and cash equivalent 21 20 9,628 9,373 1,206 1,225 947 746 2,232 2,149Otros Activos Financieros / Other financial assets 0 0 22,200 21,666 0 0 498 494 0 0Cuentas por Cobrar Comerciales (neto) / Trade accounts receivable (net) 0 0 5,803 3,594 0 0 184 687 7 8Otras Cuentas por Cobrar (neto) / Other accounts receivable (net) 470 4,361 2,925 641 108 43 116 158 60 89Cuentas por Cobrar a Entidades Relacionadas / Accounts receivable from related companies 17,483 13,570 10 85 0 0 0 0 0 0Inventarios / Stocks 0 0 0 0 0 0 0 0 0 0Activos Biológicos / Biological assets 0 0 0 0 0 0 0 0 0 0Activos por Impuestos a las Ganancias / Assets from income tax 0 0 0 0 0 0 0 0 0 0Gastos Pagados por Anticipado / Prepaid expenses 0 0 213 198 1 15 118 31 100 95Otros Activos / Other assets 0 0 128 128 0 0 0 0 0 0Activos no Corrientes o Grupos de Activos para su Disposición Clasificados como Mantenidos para laVenta / Non-current assets or groups of assets for disposal classified as held for sale 0 0 0 0 194 191 4,840 4,635 0 0Activos no Corrientes o Grupos de Activos para su Disposición Clasificados como Mantenidos paraDistribuir a los Propietarios / Non-current assets or groups of assets for disposal classified as held forDistribution to owner 0 0 0 0 0 0 0 0 0 0
TOTAL ACTIVOS CORRIENTES / TOTAL CURRENT ASSETS 17,974 17,951 40,907 35,685 1,509 1,474 6,703 6,751 2,399 2,341Otros Activos Financieros / Other financial assets 10,597 10,597 13,819 14,613 0 0 0 0 0 0Inversiones Contabilizadas Aplicando el Método de la Participación / Investments booked using the equitymethod 0 0 25,264 27,813 0 0 0 0 2,890 2,727Cuentas por Cobrar Comerciales / Trade accounts receivable 0 0 0 0 0 0 0 0 0 0Otras Cuentas por Cobrar / Other accounts receivable 0 0 0 0 0 0 0 0 0 0Cuentas por Cobrar a Entidades Relacionadas / Accounts receivable from related companies 0 0 0 0 0 0 0 0 0 0Activos Biológicos / Biological assets 0 0 0 0 0 0 0 0 0 0Propiedades de Inversión / Investment property 0 0 0 0 0 0 0 0 0 0Propiedades, Planta y Equipo (neto) / Property, plant and equipment (net) 0 0 9,146 9,360 0 0 4 5 0 0Activos Intangibles (neto) / Intangible assets (net) 3,930 3,930 2,475 2,528 342 355 2 3 0 0Activos por Impuestos a las Ganancias Diferidos / Assets from deferred income tax 0 0 778 925 0 0 0 0 0 0Plusvalía / Capital gain 0 0 0 0 0 0 0 0 0 0Otros Activos / Other assets 0 0 0 0 0 0 0 0 0 0
TOTAL ACTIVOS NO CORRIENTES / TOTAL NON-CURRENT ASSETS 14,527 14,527 51,482 55,239 342 355 6 8 2,890 2,727TOTAL DE ACTIVOS / TOTAL ASSETS 32,501 32,478 92,389 90,924 1,851 1,829 6,709 6,759 5,289 5,068
Otros Pasivos Financieros / Other financial liabilities 0 0 0 0 10 36 0 0 0 0Cuentas por Pagar Comerciales / Trade accounts payable 59 39 390 316 0 0 15 0 0 0Otras Cuentas por Pagar / Other accounts payable 1,963 1,961 10,557 2,709 18 18 0 0 264 250Cuentas por Pagar a Entidades Relacionadas / Accounts payable to related companies 47 0 0 0 49 0 0 19 0 0Provisiones / Provisions 0 0 0 0 12 14 0 0 0 0Pasivos por Impuestos a las Ganancias / Liabilities from income tax 0 0 420 468 0 0 216 174 0 0Provisión por Beneficios a los Empleados / Provisions for employee profit sharing 0 0 1,847 1,672 0 0 0 103 0 0Otros Pasivos / Other Liabilities 0 0 0 0 0 0 143 167 0 0Pasivos incluidos en Grupos de Activos para su Disposición Clasificados como Mantenidos para la Venta/ Liabilities included in groups of assets for disposal classified as held for sale 0 0 0 0 0 0 0 0 0 0
TOTAL PASIVOS CORRIENTES / TOTAL CURRENT LIABILITIES 2,069 2,000 13,214 5,165 89 68 374 463 264 250Otros Pasivos Financieros / Other financial liabilities 0 0 0 0 0 0 0 0 0 0Cuentas por Pagar Comerciales / Trade accounts payable 0 0 0 0 0 0 0 0 0 0Otras Cuentas por Pagar / Other accounts payable 0 0 0 0 0 0 0 0 324 339Cuentas por Pagar a Entidades Relacionadas / Accounts payable to related companies 0 0 0 0 0 0 0 0 0 0Pasivos por Impuestos a las Ganancias Diferidos / Liabilities from deferred income tax 0 0 987 1,048 0 0 0 0 0 0Provisiones / Provisions 0 0 0 0 0 0 0 0 0 0Provisión por Beneficios a los Empleados / Provisions for employee profit sharing 0 0 0 0 0 0 0 0 0 0Otros Pasivos / Other Liabilities 0 0 0 0 0 0 1,508 0 0 0Ingresos Diferidos (netos) / Deferred income (net) 0 0 0 0 84 57 10 51 0 0
TOTAL PASIVOS NO CORRIENTES / TOTAL NON-CURRENT LIABILITIES 987 1,048 84 57 1,518 51 324 339TOTAL PASIVOS / TOTAL LIABILITIES 2,069 2,000 14,201 6,213 173 125 1,892 514 588 589
Capital Emitido / Issued capital 46,242 46,242 59,652 59,716 1,620 1,620 3,911 3,911 3,824 3,361Primas de Emisión / Share premium 0 0 0 0 0 0 0 0 0 0Acciones de Inversión / Investment stock 0 0 0 0 0 0 0 0 0 0Acciones Propias en Cartera / Treasury shares 0 0 0 0 0 0 0 0 0 0Otras Reservas de Capital / Other capital reserves 100 100 12,007 11,943 35 29 796 796 659 607Resultados Acumulados / Retained earnings -15,910 -15,864 6,365 13,127 23 55 25 1,507 187 515Otras Reservas de Patrimonio / Other equity reserves 0 0 164 -75 0 0 85 31 31 -4
TOTAL PATRIMONIO / TOTAL EQUITY 30,432 30,478 78,188 84,711 1,678 1,704 4,817 6,245 4,701 4,479TOTAL PASIVO Y PATRIMONIO / TOTAL LIABILITIES AND EQUITY 32,501 32,478 92,389 90,924 1,851 1,829 6,709 6,759 5,289 5,068
ESTADO DE RESULTADOS / INCOME STATEMENT 31/03/2012 31/03/2011 31/03/2012 31/03/2011 31/03/2012 31/03/2011 31/03/2012 31/03/2011 31/03/2012 31/03/2011
Ventas Netas de Bienes / Net sales of goods 0 0 0 0 58 48 0 0 84 81Prestación de Servicios / Services rendered 0 0 11,461 12,912 0 0 248 970 0 0
TOTAL DE INGRESOS DE ACTIVIDADES ORDINARIAS / TOTAL INCOME FROM REGULARACTIVITIES 0 0 11,461 12,912 58 48 248 970 84 81
Costo de Ventas / Cost of sales 0 0 0 0 0 0 0 0 0 0GANANCIA (PERDIDA) BRUTA / GROSS PROFIT (LOSS) 0 0 11,461 12,912 58 48 248 970 84 81
Gastos de Ventas y Distribución / Sales and distribution expenses 0 0 -249 -323 0 0 0 0 0 0Gastos de Administración / Overheads -46 -233 -4,869 -4,424 -36 -37 -88 -284 -32 -32Ganancia (Pérdida) de la baja en Activos Financieros medidos al Costo Amortizado / Profit (loss) fromdisposal of financial assets measured at amortized cost 0 0 0 0 0 0 0 0 0 0Otros Ingresos Operativos / Other operating income 0 0 1,562 1,360 0 4 0 0 22 39Otros Gastos Operativos / Other operating expenses 0 0 -398 -252 -2 0 -197 -132 -38 -109
GANANCIA (PERDIDA) OPERATIVA / OPERATING PROFIT (LOSS) -46 -233 7,507 9,273 20 15 -37 554 36 -21Ingresos Financieros / Financial income 0 0 3,156 3,323 14 7 84 35 25 11Gastos Financieros / Financial expenses 0 0 0 -1 -2 -2 -11 -136 -4 -4Diferencias de Cambio neto / Exchange differences net 0 0 -96 -31 0 0 0 0 0 0Participación en los Resultados Netos de Asociadas y Negocios Conjuntos Contabilizados por el Métodode la Participación / Equity in net results of associates and joint ventures booked by the equity method 0 0 -2,548 -2,710 0 0 0 0 128 96Ganancias (Pérdidas) de la Diferencia entre el Valor Libro Anterior y el Valor Justo de ActivosFinancieros Reclasificados Medidos a Valor Razonable / Profits (losses) from the difference between theprevious book value and fair value of financial assets reclassified and measured at fair value 0 0 0 0 0 0 0 0 0 0
RESULTADO ANTES DE IMPUESTO A LAS GANANCIAS / PRE-INCOME TAX RESULT -46 -233 8,019 9,854 32 20 36 453 185 82Gasto por Impuesto a las Ganancias / Income tax expenses 0 0 -2,511 -3,156 -9 0 -11 -136 2 1
GANANCIA (PERDIDA) NETA DE OPERACIONES CONTINUADAS / NET PROFIT (LOSS) FROMCONTINUING TRADES -46 -233 5,508 6,698 23 20 25 317 187 83
Ganancia (Pérdida) Neta del Impuesto a las Ganancias Procedente de Operaciones Discontinuadas / Netprofit (loss) arising from income tax discontinued trades 0 0 0 0 0 0 0 0 0 0
GANANCIA (PERDIDA) NETA DEL EJERCICIO / PERIOD'S NET PROFIT (LOSS) -46 -233 5,508 6,698 23 20 25 317 187 83
INDICADORES FINANCIEROS / FINANCIAL RATIOSLiquidez / Liquid Ratio 8.69 3.10 16.96 17.92 9.09 Rotación de Activos / Gross Sales to Total Assets 0.00 0.12 0.03 0.04 0.02 Solvencia / Solvency 0.06 0.15 0.09 0.28 0.11 Deuda / Patrimonio / Debt / Equity 0.07 0.18 0.10 0.39 0.13 Rentabilidad sobre Ventas Netas % / Return % n.d. 48.06 39.66 10.08 222.62 Rentabilidad sobre Activos % / Return on Assets % -.- 5.96 1.24 0.37 3.54 Rentabilidad de Patrimonio % / Return on Equity % -.- 7.04 1.37 0.52 3.98

ESTADOS FINANCIEROS COMPARADOS / COMPARATIVE FINANCIAL STATEMENTS DIVERSAS / ASSORTEDCIFRAS EXPRESADAS EN MILES DE NUEVOS SOLES
EMPRESA/COMPANY
Graña y Montero
Scotia Soc. Titulizadora
IPSA
Inmob. Milenia
Inmuebles ComercialesCIIU
6719
6719-2
7010
7010
7010
Pág 17* Estados Financieros expresados en miles de US$
ESTADO DE SITUACION FINANCIERA / STATEMENT OF FINANCIAL POSITION 31/03/2012 31/12/2011 31/03/2012 31/12/2011 31/03/2012 31/12/2011 31/03/2012 31/12/2011 31/03/2012 31/12/2011
Efectivo y Equivalentes al Efectivo / Cash and cash equivalent 54,309 68,581 1,653 1,644 67,558 4,891 9,872 8,877 6,998 315Otros Activos Financieros / Other financial assets 0 0 0 0 0 0 0 0 0 0Cuentas por Cobrar Comerciales (neto) / Trade accounts receivable (net) 0 0 77 75 5,459 6,113 607 514 635 1,542Otras Cuentas por Cobrar (neto) / Other accounts receivable (net) 38,475 36,886 33 62 1,298 3,258 210 228 827 1,251Cuentas por Cobrar a Entidades Relacionadas / Accounts receivable from related companies 93,055 86,770 0 0 131,161 73,248 0 0 1,301 42,788Inventarios / Stocks 0 0 0 0 0 0 0 0 0 0Activos Biológicos / Biological assets 0 0 0 0 0 0 0 0 0 0Activos por Impuestos a las Ganancias / Assets from income tax 0 0 0 0 0 0 0 0 0 0Gastos Pagados por Anticipado / Prepaid expenses 468 2,218 0 0 7,239 2,738 520 395 0 0Otros Activos / Other assets 5,005 5,347 0 0 4,550 0 0 0 14,004 19,810Activos no Corrientes o Grupos de Activos para su Disposición Clasificados como Mantenidos para laVenta / Non-current assets or groups of assets for disposal classified as held for sale 0 0 1,654 1,660 0 0 4,188 58,932 0 0Activos no Corrientes o Grupos de Activos para su Disposición Clasificados como Mantenidos paraDistribuir a los Propietarios / Non-current assets or groups of assets for disposal classified as held forDistribution to owner 0 0 0 0 0 0 0 0 0 0
TOTAL ACTIVOS CORRIENTES / TOTAL CURRENT ASSETS 191,312 199,802 3,417 3,441 217,265 90,248 15,397 68,946 23,765 65,706Otros Activos Financieros / Other financial assets 781,879 692,021 0 0 0 0 0 0 4,937 1,497Inversiones Contabilizadas Aplicando el Método de la Participación / Investments booked using the equitymethod 0 0 0 0 0 0 0 0 286,412 292,827Cuentas por Cobrar Comerciales / Trade accounts receivable 0 0 0 0 0 0 0 0 0 0Otras Cuentas por Cobrar / Other accounts receivable 0 0 0 0 0 2,058 0 0 0 0Cuentas por Cobrar a Entidades Relacionadas / Accounts receivable from related companies 0 60,852 0 0 0 0 0 0 93,250 82,191Activos Biológicos / Biological assets 0 0 0 0 0 0 0 0 0 0Propiedades de Inversión / Investment property 58,962 57,921 0 0 310,416 309,339 146,267 146,267 6,201 6,201Propiedades, Planta y Equipo (neto) / Property, plant and equipment (net) 1,277 1,313 0 0 1,023 1,104 695 703 964 988Activos Intangibles (neto) / Intangible assets (net) 1,056 1,244 0 0 148 155 0 0 0 0Activos por Impuestos a las Ganancias Diferidos / Assets from deferred income tax 0 0 0 0 0 0 0 0 0 0Plusvalía / Capital gain 0 0 0 0 0 0 0 0 0 0Otros Activos / Other assets 0 0 0 0 12,294 5,613 0 0 298 298
TOTAL ACTIVOS NO CORRIENTES / TOTAL NON-CURRENT ASSETS 843,174 813,351 323,881 318,269 146,962 146,970 392,062 384,002TOTAL DE ACTIVOS / TOTAL ASSETS 1,034,486 1,013,153 3,417 3,441 541,146 408,517 162,359 215,916 415,827 449,708
Otros Pasivos Financieros / Other financial liabilities 529 525 0 0 9,690 19,017 0 0 1,155 13Cuentas por Pagar Comerciales / Trade accounts payable 795 981 87 187 1,901 4,155 138 81 731 763Otras Cuentas por Pagar / Other accounts payable 8,134 11,969 0 0 5,404 6,590 9,342 331 173 378Cuentas por Pagar a Entidades Relacionadas / Accounts payable to related companies 19,912 84,819 0 0 53,177 54,189 0 0 629 41,509Provisiones / Provisions 0 0 0 0 0 0 0 0 663 692Pasivos por Impuestos a las Ganancias / Liabilities from income tax 0 0 0 0 0 0 0 0 0 0Provisión por Beneficios a los Empleados / Provisions for employee profit sharing 0 0 0 0 0 0 0 0 0 0Otros Pasivos / Other Liabilities 0 0 0 0 1,404 1,374 0 0 0 0Pasivos incluidos en Grupos de Activos para su Disposición Clasificados como Mantenidos para la Venta/ Liabilities included in groups of assets for disposal classified as held for sale 0 0 0 0 0 0 0 0 0 0
TOTAL PASIVOS CORRIENTES / TOTAL CURRENT LIABILITIES 29,370 98,294 87 187 71,576 85,325 9,480 412 3,351 43,355Otros Pasivos Financieros / Other financial liabilities 3,838 3,969 0 0 215,360 69,044 0 0 53,064 53,064Cuentas por Pagar Comerciales / Trade accounts payable 0 0 0 0 0 0 0 0 0 0Otras Cuentas por Pagar / Other accounts payable 0 0 0 0 0 0 0 0 0 0Cuentas por Pagar a Entidades Relacionadas / Accounts payable to related companies 0 0 0 0 0 0 0 0 12,572 13,066Pasivos por Impuestos a las Ganancias Diferidos / Liabilities from deferred income tax 1,585 1,530 0 0 49,056 48,368 39,141 54,462 2 2Provisiones / Provisions 0 0 0 0 0 0 0 0 0 0Provisión por Beneficios a los Empleados / Provisions for employee profit sharing 0 0 0 0 0 0 0 0 0 0Otros Pasivos / Other Liabilities 0 0 0 0 0 0 0 0 0 0Ingresos Diferidos (netos) / Deferred income (net) 0 0 0 0 1,699 1,987 0 0 0 0
TOTAL PASIVOS NO CORRIENTES / TOTAL NON-CURRENT LIABILITIES 5,423 5,499 266,115 119,399 39,141 54,462 65,638 66,132TOTAL PASIVOS / TOTAL LIABILITIES 34,793 103,793 87 187 337,691 204,724 48,621 54,874 68,989 109,487
Capital Emitido / Issued capital 558,113 390,488 2,400 2,400 60,871 60,871 23,370 26,799 344,973 340,200Primas de Emisión / Share premium 0 0 0 0 0 0 0 0 0 0Acciones de Inversión / Investment stock 0 0 0 0 0 0 0 0 0 0Acciones Propias en Cartera / Treasury shares 0 0 0 0 0 0 -149 -149 0 0Otras Reservas de Capital / Other capital reserves 84,276 82,984 480 480 12,061 12,061 4,516 2,934 1,146 -1,327Resultados Acumulados / Retained earnings 357,304 435,888 450 374 130,523 130,861 86,001 131,458 719 1,348Otras Reservas de Patrimonio / Other equity reserves 0 0 0 0 0 0 0 0 0 0
TOTAL PATRIMONIO / TOTAL EQUITY 999,693 909,360 3,330 3,254 203,455 203,793 113,738 161,042 346,838 340,221TOTAL PASIVO Y PATRIMONIO / TOTAL LIABILITIES AND EQUITY 1,034,486 1,013,153 3,417 3,441 541,146 408,517 162,359 215,916 415,827 449,708
ESTADO DE RESULTADOS / INCOME STATEMENT 31/03/2012 31/03/2011 31/03/2012 31/03/2011 31/03/2012 31/03/2011 31/03/2012 31/03/2011 31/03/2012 31/03/2011
Ventas Netas de Bienes / Net sales of goods 0 0 0 0 16,807 14,233 1,720 1,863 0 0Prestación de Servicios / Services rendered 10,179 9,229 153 192 0 0 325 251 657 599
TOTAL DE INGRESOS DE ACTIVIDADES ORDINARIAS / TOTAL INCOME FROM REGULARACTIVITIES 10,179 9,229 153 192 16,807 14,233 2,045 2,114 657 599
Costo de Ventas / Cost of sales -13,423 -11,272 0 0 -4,736 -5,674 -540 -409 -1,300 -1,056GANANCIA (PERDIDA) BRUTA / GROSS PROFIT (LOSS) -3,244 -2,043 153 192 12,071 8,559 1,505 1,705 -643 -457
Gastos de Ventas y Distribución / Sales and distribution expenses 0 0 0 0 -594 -833 0 0 0 0Gastos de Administración / Overheads -1,762 -1,178 -51 -76 0 0 -47 -416 -376 -530Ganancia (Pérdida) de la baja en Activos Financieros medidos al Costo Amortizado / Profit (loss) fromdisposal of financial assets measured at amortized cost 0 0 0 0 0 0 0 0 0 0Otros Ingresos Operativos / Other operating income 1,765 753 43 61 0 0 0 0 0 0Otros Gastos Operativos / Other operating expenses -1,072 -676 -39 -57 0 -14 0 0 -45 -24
GANANCIA (PERDIDA) OPERATIVA / OPERATING PROFIT (LOSS) -4,313 -3,144 106 120 11,477 7,712 1,458 1,289 -1,064 -1,011Ingresos Financieros / Financial income 92,374 81,283 10 23 514 12 0 55 2,040 1,167Gastos Financieros / Financial expenses -286 -415 -9 -19 -12,119 -1,282 -2 -6 -1,251 -706Diferencias de Cambio neto / Exchange differences net -1,056 -539 0 0 553 -21 -113 66 -354 322Participación en los Resultados Netos de Asociadas y Negocios Conjuntos Contabilizados por el Métodode la Participación / Equity in net results of associates and joint ventures booked by the equity method 0 0 0 0 0 0 0 0 0 0Ganancias (Pérdidas) de la Diferencia entre el Valor Libro Anterior y el Valor Justo de ActivosFinancieros Reclasificados Medidos a Valor Razonable / Profits (losses) from the difference between theprevious book value and fair value of financial assets reclassified and measured at fair value 0 0 0 0 0 0 0 0 0 0
RESULTADO ANTES DE IMPUESTO A LAS GANANCIAS / PRE-INCOME TAX RESULT 86,719 77,185 107 124 425 6,421 1,343 1,404 -629 -228Gasto por Impuesto a las Ganancias / Income tax expenses -56 0 -34 -45 -689 -1,548 -403 -407 0 0
GANANCIA (PERDIDA) NETA DE OPERACIONES CONTINUADAS / NET PROFIT (LOSS) FROMCONTINUING TRADES 86,663 77,185 73 79 -264 4,873 940 997 -629 -228
Ganancia (Pérdida) Neta del Impuesto a las Ganancias Procedente de Operaciones Discontinuadas / Netprofit (loss) arising from income tax discontinued trades 0 0 0 0 0 0 0 0 0 0
GANANCIA (PERDIDA) NETA DEL EJERCICIO / PERIOD'S NET PROFIT (LOSS) 86,663 77,185 73 79 -264 4,873 940 997 -629 -228
INDICADORES FINANCIEROS / FINANCIAL RATIOSLiquidez / Liquid Ratio 6.51 39.28 3.04 1.62 7.09 Rotación de Activos / Gross Sales to Total Assets 0.01 0.04 0.03 0.01 0.00 Solvencia / Solvency 0.03 0.03 0.62 0.30 0.17 Deuda / Patrimonio / Debt / Equity 0.03 0.03 1.66 0.43 0.20 Rentabilidad sobre Ventas Netas % / Return % 851.39 47.71 -.- 45.97 -.- Rentabilidad sobre Activos % / Return on Assets % 8.38 2.14 -.- 0.58 -.- Rentabilidad de Patrimonio % / Return on Equity % 8.67 2.19 -.- 0.83 -.-

ESTADOS FINANCIEROS COMPARADOS / COMPARATIVE FINANCIAL STATEMENTS DIVERSAS / ASSORTEDCIFRAS EXPRESADAS EN MILES DE NUEVOS SOLES
EMPRESA/COMPANY
Inv. Centenario
Peru Hold. de Turismo
Los Portales
Inmobiliaria IDE
LP HoldingCIIU
7010
7010
7010-9
70109
70109
Pág 18 * Estados Financieros expresados en miles de US$
ESTADO DE SITUACION FINANCIERA / STATEMENT OF FINANCIAL POSITION 31/03/2012 31/12/2011 31/03/2012 31/12/2011 31/03/2012 31/12/2011 31/03/2012 31/12/2011 31/03/2012 31/12/2011
Efectivo y Equivalentes al Efectivo / Cash and cash equivalent 52,621 14,310 143 143 42,161 21,472 10,488 14,020 6,644 2,009Otros Activos Financieros / Other financial assets 0 0 0 0 5,332 0 0 0 0 0Cuentas por Cobrar Comerciales (neto) / Trade accounts receivable (net) 27,610 34,875 31 26 39,128 45,479 222 178 15 0Otras Cuentas por Cobrar (neto) / Other accounts receivable (net) 23,426 15,599 1,675 1,689 27,548 21,089 12 8 157 152Cuentas por Cobrar a Entidades Relacionadas / Accounts receivable from related companies 5,621 5,647 0 0 8,325 5,588 0 0 6,273 5,608Inventarios / Stocks 87,535 89,057 0 0 287,045 274,320 0 0 0 0Activos Biológicos / Biological assets 0 0 0 0 0 0 0 0 0 0Activos por Impuestos a las Ganancias / Assets from income tax 1,319 0 0 0 0 0 0 0 0 0Gastos Pagados por Anticipado / Prepaid expenses 2,002 2,037 465 465 8,562 7,657 0 0 0 31Otros Activos / Other assets 0 0 0 0 0 0 0 0 0 0Activos no Corrientes o Grupos de Activos para su Disposición Clasificados como Mantenidos para laVenta / Non-current assets or groups of assets for disposal classified as held for sale 40,259 37,185 0 0 0 0 0 0 179 174Activos no Corrientes o Grupos de Activos para su Disposición Clasificados como Mantenidos paraDistribuir a los Propietarios / Non-current assets or groups of assets for disposal classified as held forDistribution to owner 0 0 0 0 0 0 0 0 0 0
TOTAL ACTIVOS CORRIENTES / TOTAL CURRENT ASSETS 240,393 198,710 2,314 2,323 418,101 375,605 10,722 14,206 13,268 7,974Otros Activos Financieros / Other financial assets 158,433 151,555 0 0 0 0 0 0 135,294 127,309Inversiones Contabilizadas Aplicando el Método de la Participación / Investments booked using the equitymethod 0 0 0 0 9,475 9,596 0 0 0 0Cuentas por Cobrar Comerciales / Trade accounts receivable 102,700 85,722 0 0 56,101 63,471 0 0 0 0Otras Cuentas por Cobrar / Other accounts receivable 0 0 25,011 24,719 0 0 0 0 0 0Cuentas por Cobrar a Entidades Relacionadas / Accounts receivable from related companies 0 0 11,900 12,007 0 0 0 0 4,520 4,379Activos Biológicos / Biological assets 0 0 0 0 0 0 0 0 0 0Propiedades de Inversión / Investment property 720,121 700,964 155,869 155,869 103,931 103,967 13,598 13,634 129 131Propiedades, Planta y Equipo (neto) / Property, plant and equipment (net) 13,432 13,020 0 0 98,288 96,255 0 0 51 53Activos Intangibles (neto) / Intangible assets (net) 1,136 1,159 0 0 38,944 39,258 0 0 0 0Activos por Impuestos a las Ganancias Diferidos / Assets from deferred income tax 0 0 0 0 0 0 0 0 0 0Plusvalía / Capital gain 0 0 0 0 0 0 0 0 0 0Otros Activos / Other assets 0 0 2,847 2,878 0 0 0 0 0 0
TOTAL ACTIVOS NO CORRIENTES / TOTAL NON-CURRENT ASSETS 995,822 952,420 195,627 195,473 306,739 312,547 13,598 13,634 139,994 131,872TOTAL DE ACTIVOS / TOTAL ASSETS 1,236,215 1,151,130 197,941 197,796 724,840 688,152 24,320 27,840 153,262 139,846
Otros Pasivos Financieros / Other financial liabilities 63,774 60,310 0 0 106,176 83,527 0 0 1,288 1,251Cuentas por Pagar Comerciales / Trade accounts payable 64,698 16,393 650 627 21,026 34,751 0 1 21 34Otras Cuentas por Pagar / Other accounts payable 15,852 17,022 1,694 1,702 225,006 197,146 13 256 5,867 642Cuentas por Pagar a Entidades Relacionadas / Accounts payable to related companies 5,620 5,620 0 0 14 14 240 0 0 135Provisiones / Provisions 0 0 0 0 0 0 3 0 0 0Pasivos por Impuestos a las Ganancias / Liabilities from income tax 0 5,293 0 0 0 0 0 0 0 0Provisión por Beneficios a los Empleados / Provisions for employee profit sharing 0 0 0 0 0 0 0 0 0 0Otros Pasivos / Other Liabilities 0 0 0 0 0 0 0 0 0 0Pasivos incluidos en Grupos de Activos para su Disposición Clasificados como Mantenidos para la Venta/ Liabilities included in groups of assets for disposal classified as held for sale 0 0 0 0 0 0 0 0 0 0
TOTAL PASIVOS CORRIENTES / TOTAL CURRENT LIABILITIES 149,944 104,638 2,344 2,329 352,222 315,438 256 257 7,176 2,062Otros Pasivos Financieros / Other financial liabilities 228,796 205,092 0 0 161,075 146,737 0 0 2,013 2,349Cuentas por Pagar Comerciales / Trade accounts payable 13,168 34,347 0 0 25,521 26,520 0 0 0 0Otras Cuentas por Pagar / Other accounts payable 0 0 0 0 1,435 2,977 0 0 0 0Cuentas por Pagar a Entidades Relacionadas / Accounts payable to related companies 0 0 13,548 13,523 0 0 0 0 0 0Pasivos por Impuestos a las Ganancias Diferidos / Liabilities from deferred income tax 167,239 165,623 0 0 23,596 23,596 1,717 1,730 0 0Provisiones / Provisions 0 0 0 0 0 0 0 0 0 0Provisión por Beneficios a los Empleados / Provisions for employee profit sharing 0 0 0 0 0 0 0 0 0 0Otros Pasivos / Other Liabilities 0 0 0 0 0 0 0 0 0 0Ingresos Diferidos (netos) / Deferred income (net) 0 0 0 0 0 0 0 0 0 0
TOTAL PASIVOS NO CORRIENTES / TOTAL NON-CURRENT LIABILITIES 409,203 405,062 13,548 13,523 211,627 199,830 1,717 1,730 2,013 2,349TOTAL PASIVOS / TOTAL LIABILITIES 559,147 509,700 15,892 15,852 563,849 515,268 1,973 1,987 9,189 4,411
Capital Emitido / Issued capital 200,000 200,000 181,302 181,302 119,634 119,634 16,478 16,478 79,037 79,037Primas de Emisión / Share premium 0 0 0 0 0 0 0 0 0 0Acciones de Inversión / Investment stock 0 0 0 0 0 0 5,627 5,627 0 0Acciones Propias en Cartera / Treasury shares 0 0 0 0 0 0 0 0 0 0Otras Reservas de Capital / Other capital reserves 40,009 40,009 1,004 896 12,535 8,031 0 0 5,572 4,980Resultados Acumulados / Retained earnings 425,725 392,117 -257 -254 28,822 45,219 242 3,748 38,798 38,742Otras Reservas de Patrimonio / Other equity reserves 11,334 9,304 0 0 0 0 0 0 20,666 12,676
TOTAL PATRIMONIO / TOTAL EQUITY 677,068 641,430 182,049 181,944 160,991 172,884 22,347 25,853 144,073 135,435TOTAL PASIVO Y PATRIMONIO / TOTAL LIABILITIES AND EQUITY 1,236,215 1,151,130 197,941 197,796 724,840 688,152 24,320 27,840 153,262 139,846
ESTADO DE RESULTADOS / INCOME STATEMENT 31/03/2012 31/03/2011 31/03/2012 31/03/2011 31/03/2012 31/03/2011 31/03/2012 31/03/2011 31/03/2012 31/03/2011
Ventas Netas de Bienes / Net sales of goods 18,936 34,996 41 31 44,123 58,816 0 0 6,535 6,775Prestación de Servicios / Services rendered 9,820 7,559 0 0 0 0 207 0 0 0
TOTAL DE INGRESOS DE ACTIVIDADES ORDINARIAS / TOTAL INCOME FROM REGULARACTIVITIES 28,756 42,555 41 31 44,123 58,816 207 0 6,535 6,775
Costo de Ventas / Cost of sales -6,697 -10,089 0 0 -30,544 -34,021 0 0 0 0GANANCIA (PERDIDA) BRUTA / GROSS PROFIT (LOSS) 22,059 32,466 41 31 13,579 24,795 207 0 6,535 6,775
Gastos de Ventas y Distribución / Sales and distribution expenses -1,037 -1,067 0 0 -4,446 -3,742 0 0 0 0Gastos de Administración / Overheads -7,754 -8,391 -221 -192 -13,050 -13,026 -45 0 -576 -527Ganancia (Pérdida) de la baja en Activos Financieros medidos al Costo Amortizado / Profit (loss) fromdisposal of financial assets measured at amortized cost 0 0 0 0 0 0 0 0 0 0Otros Ingresos Operativos / Other operating income 791 2,247 0 0 601 604 0 0 16 0Otros Gastos Operativos / Other operating expenses -429 -462 0 -6 0 0 0 0 0 -440
GANANCIA (PERDIDA) OPERATIVA / OPERATING PROFIT (LOSS) 13,630 24,793 -180 -167 -3,316 8,631 162 0 5,975 5,808Ingresos Financieros / Financial income 6,371 1,864 592 276 5,263 4,264 68 0 267 348Gastos Financieros / Financial expenses -4,487 -3,049 -307 0 -2,399 -3,069 -1 0 -101 -142Diferencias de Cambio neto / Exchange differences net 1,721 411 0 0 3,184 -743 0 0 -118 -9Participación en los Resultados Netos de Asociadas y Negocios Conjuntos Contabilizados por el Métodode la Participación / Equity in net results of associates and joint ventures booked by the equity method 0 0 0 0 0 0 0 0 0 0Ganancias (Pérdidas) de la Diferencia entre el Valor Libro Anterior y el Valor Justo de ActivosFinancieros Reclasificados Medidos a Valor Razonable / Profits (losses) from the difference between theprevious book value and fair value of financial assets reclassified and measured at fair value 10,588 24,227 0 0 0 0 0 0 0 0
RESULTADO ANTES DE IMPUESTO A LAS GANANCIAS / PRE-INCOME TAX RESULT 27,823 48,246 105 109 2,732 9,083 229 0 6,023 6,005Gasto por Impuesto a las Ganancias / Income tax expenses -1,590 -22,635 0 0 -1,336 -2,911 -74 0 -75 -106
GANANCIA (PERDIDA) NETA DE OPERACIONES CONTINUADAS / NET PROFIT (LOSS) FROMCONTINUING TRADES 26,233 25,611 105 109 1,396 6,172 155 0 5,948 5,899
Ganancia (Pérdida) Neta del Impuesto a las Ganancias Procedente de Operaciones Discontinuadas / Netprofit (loss) arising from income tax discontinued trades 0 0 0 0 0 0 0 0 0 0
GANANCIA (PERDIDA) NETA DEL EJERCICIO / PERIOD'S NET PROFIT (LOSS) 26,233 25,611 105 109 1,396 6,172 155 0 5,948 5,899
INDICADORES FINANCIEROS / FINANCIAL RATIOSLiquidez / Liquid Ratio 1.60 0.99 1.19 41.88 1.85 Rotación de Activos / Gross Sales to Total Assets 0.02 0.00 0.06 0.01 0.04 Solvencia / Solvency 0.45 0.08 0.78 0.08 0.06 Deuda / Patrimonio / Debt / Equity 0.83 0.09 3.50 0.09 0.06 Rentabilidad sobre Ventas Netas % / Return % 91.23 256.10 3.16 74.88 91.02 Rentabilidad sobre Activos % / Return on Assets % 2.12 0.05 0.19 0.64 3.88 Rentabilidad de Patrimonio % / Return on Equity % 3.87 0.06 0.87 0.69 4.13
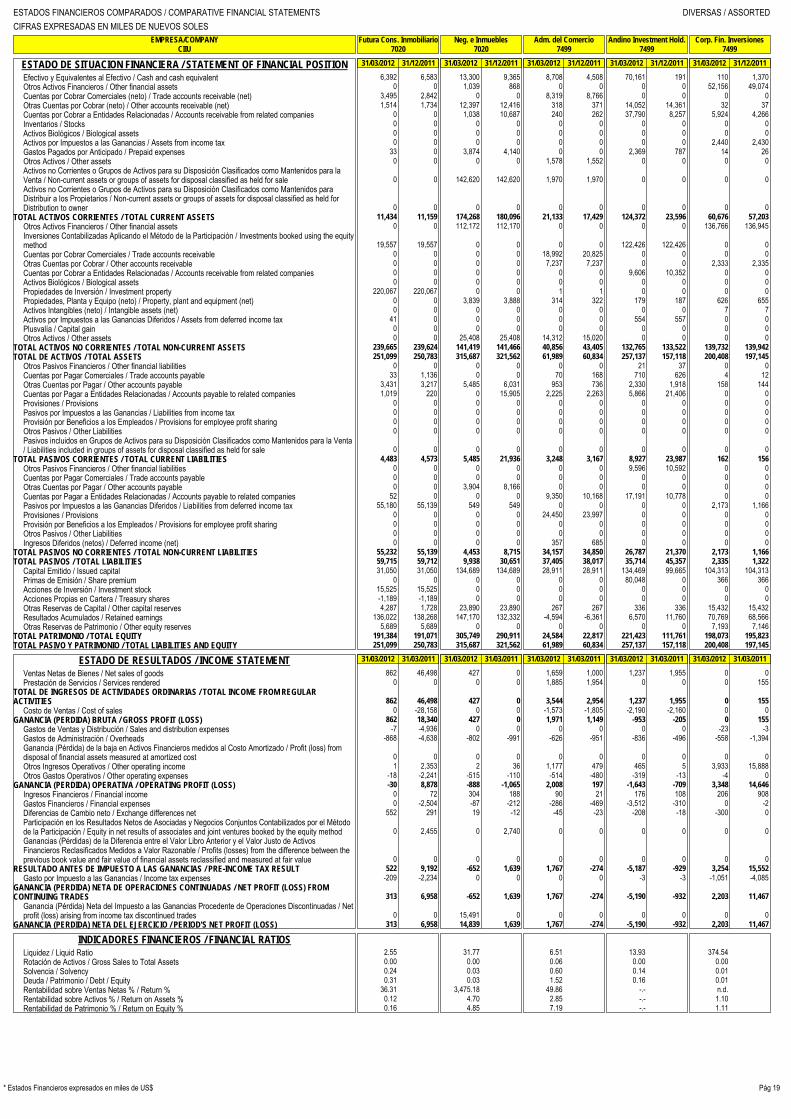
ESTADOS FINANCIEROS COMPARADOS / COMPARATIVE FINANCIAL STATEMENTS DIVERSAS / ASSORTEDCIFRAS EXPRESADAS EN MILES DE NUEVOS SOLES
EMPRESA/COMPANY
Futura Cons. Inmobiliario
Neg. e Inmuebles
Adm. del Comercio
Andino Investment Hold.
Corp. Fin. InversionesCIIU
7020
7020
7499
7499
7499
Pág 19* Estados Financieros expresados en miles de US$
ESTADO DE SITUACION FINANCIERA / STATEMENT OF FINANCIAL POSITION 31/03/2012 31/12/2011 31/03/2012 31/12/2011 31/03/2012 31/12/2011 31/03/2012 31/12/2011 31/03/2012 31/12/2011
Efectivo y Equivalentes al Efectivo / Cash and cash equivalent 6,392 6,583 13,300 9,365 8,708 4,508 70,161 191 110 1,370Otros Activos Financieros / Other financial assets 0 0 1,039 868 0 0 0 0 52,156 49,074Cuentas por Cobrar Comerciales (neto) / Trade accounts receivable (net) 3,495 2,842 0 0 8,319 8,766 0 0 0 0Otras Cuentas por Cobrar (neto) / Other accounts receivable (net) 1,514 1,734 12,397 12,416 318 371 14,052 14,361 32 37Cuentas por Cobrar a Entidades Relacionadas / Accounts receivable from related companies 0 0 1,038 10,687 240 262 37,790 8,257 5,924 4,266Inventarios / Stocks 0 0 0 0 0 0 0 0 0 0Activos Biológicos / Biological assets 0 0 0 0 0 0 0 0 0 0Activos por Impuestos a las Ganancias / Assets from income tax 0 0 0 0 0 0 0 0 2,440 2,430Gastos Pagados por Anticipado / Prepaid expenses 33 0 3,874 4,140 0 0 2,369 787 14 26Otros Activos / Other assets 0 0 0 0 1,578 1,552 0 0 0 0Activos no Corrientes o Grupos de Activos para su Disposición Clasificados como Mantenidos para laVenta / Non-current assets or groups of assets for disposal classified as held for sale 0 0 142,620 142,620 1,970 1,970 0 0 0 0Activos no Corrientes o Grupos de Activos para su Disposición Clasificados como Mantenidos paraDistribuir a los Propietarios / Non-current assets or groups of assets for disposal classified as held forDistribution to owner 0 0 0 0 0 0 0 0 0 0
TOTAL ACTIVOS CORRIENTES / TOTAL CURRENT ASSETS 11,434 11,159 174,268 180,096 21,133 17,429 124,372 23,596 60,676 57,203Otros Activos Financieros / Other financial assets 0 0 112,172 112,170 0 0 0 0 136,766 136,945Inversiones Contabilizadas Aplicando el Método de la Participación / Investments booked using the equitymethod 19,557 19,557 0 0 0 0 122,426 122,426 0 0Cuentas por Cobrar Comerciales / Trade accounts receivable 0 0 0 0 18,992 20,825 0 0 0 0Otras Cuentas por Cobrar / Other accounts receivable 0 0 0 0 7,237 7,237 0 0 2,333 2,335Cuentas por Cobrar a Entidades Relacionadas / Accounts receivable from related companies 0 0 0 0 0 0 9,606 10,352 0 0Activos Biológicos / Biological assets 0 0 0 0 0 0 0 0 0 0Propiedades de Inversión / Investment property 220,067 220,067 0 0 1 1 0 0 0 0Propiedades, Planta y Equipo (neto) / Property, plant and equipment (net) 0 0 3,839 3,888 314 322 179 187 626 655Activos Intangibles (neto) / Intangible assets (net) 0 0 0 0 0 0 0 0 7 7Activos por Impuestos a las Ganancias Diferidos / Assets from deferred income tax 41 0 0 0 0 0 554 557 0 0Plusvalía / Capital gain 0 0 0 0 0 0 0 0 0 0Otros Activos / Other assets 0 0 25,408 25,408 14,312 15,020 0 0 0 0
TOTAL ACTIVOS NO CORRIENTES / TOTAL NON-CURRENT ASSETS 239,665 239,624 141,419 141,466 40,856 43,405 132,765 133,522 139,732 139,942TOTAL DE ACTIVOS / TOTAL ASSETS 251,099 250,783 315,687 321,562 61,989 60,834 257,137 157,118 200,408 197,145
Otros Pasivos Financieros / Other financial liabilities 0 0 0 0 0 0 21 37 0 0Cuentas por Pagar Comerciales / Trade accounts payable 33 1,136 0 0 70 168 710 626 4 12Otras Cuentas por Pagar / Other accounts payable 3,431 3,217 5,485 6,031 953 736 2,330 1,918 158 144Cuentas por Pagar a Entidades Relacionadas / Accounts payable to related companies 1,019 220 0 15,905 2,225 2,263 5,866 21,406 0 0Provisiones / Provisions 0 0 0 0 0 0 0 0 0 0Pasivos por Impuestos a las Ganancias / Liabilities from income tax 0 0 0 0 0 0 0 0 0 0Provisión por Beneficios a los Empleados / Provisions for employee profit sharing 0 0 0 0 0 0 0 0 0 0Otros Pasivos / Other Liabilities 0 0 0 0 0 0 0 0 0 0Pasivos incluidos en Grupos de Activos para su Disposición Clasificados como Mantenidos para la Venta/ Liabilities included in groups of assets for disposal classified as held for sale 0 0 0 0 0 0 0 0 0 0
TOTAL PASIVOS CORRIENTES / TOTAL CURRENT LIABILITIES 4,483 4,573 5,485 21,936 3,248 3,167 8,927 23,987 162 156Otros Pasivos Financieros / Other financial liabilities 0 0 0 0 0 0 9,596 10,592 0 0Cuentas por Pagar Comerciales / Trade accounts payable 0 0 0 0 0 0 0 0 0 0Otras Cuentas por Pagar / Other accounts payable 0 0 3,904 8,166 0 0 0 0 0 0Cuentas por Pagar a Entidades Relacionadas / Accounts payable to related companies 52 0 0 0 9,350 10,168 17,191 10,778 0 0Pasivos por Impuestos a las Ganancias Diferidos / Liabilities from deferred income tax 55,180 55,139 549 549 0 0 0 0 2,173 1,166Provisiones / Provisions 0 0 0 0 24,450 23,997 0 0 0 0Provisión por Beneficios a los Empleados / Provisions for employee profit sharing 0 0 0 0 0 0 0 0 0 0Otros Pasivos / Other Liabilities 0 0 0 0 0 0 0 0 0 0Ingresos Diferidos (netos) / Deferred income (net) 0 0 0 0 357 685 0 0 0 0
TOTAL PASIVOS NO CORRIENTES / TOTAL NON-CURRENT LIABILITIES 55,232 55,139 4,453 8,715 34,157 34,850 26,787 21,370 2,173 1,166TOTAL PASIVOS / TOTAL LIABILITIES 59,715 59,712 9,938 30,651 37,405 38,017 35,714 45,357 2,335 1,322
Capital Emitido / Issued capital 31,050 31,050 134,689 134,689 28,911 28,911 134,469 99,665 104,313 104,313Primas de Emisión / Share premium 0 0 0 0 0 0 80,048 0 366 366Acciones de Inversión / Investment stock 15,525 15,525 0 0 0 0 0 0 0 0Acciones Propias en Cartera / Treasury shares -1,189 -1,189 0 0 0 0 0 0 0 0Otras Reservas de Capital / Other capital reserves 4,287 1,728 23,890 23,890 267 267 336 336 15,432 15,432Resultados Acumulados / Retained earnings 136,022 138,268 147,170 132,332 -4,594 -6,361 6,570 11,760 70,769 68,566Otras Reservas de Patrimonio / Other equity reserves 5,689 5,689 0 0 0 0 0 0 7,193 7,146
TOTAL PATRIMONIO / TOTAL EQUITY 191,384 191,071 305,749 290,911 24,584 22,817 221,423 111,761 198,073 195,823TOTAL PASIVO Y PATRIMONIO / TOTAL LIABILITIES AND EQUITY 251,099 250,783 315,687 321,562 61,989 60,834 257,137 157,118 200,408 197,145
ESTADO DE RESULTADOS / INCOME STATEMENT 31/03/2012 31/03/2011 31/03/2012 31/03/2011 31/03/2012 31/03/2011 31/03/2012 31/03/2011 31/03/2012 31/03/2011
Ventas Netas de Bienes / Net sales of goods 862 46,498 427 0 1,659 1,000 1,237 1,955 0 0Prestación de Servicios / Services rendered 0 0 0 0 1,885 1,954 0 0 0 155
TOTAL DE INGRESOS DE ACTIVIDADES ORDINARIAS / TOTAL INCOME FROM REGULARACTIVITIES 862 46,498 427 0 3,544 2,954 1,237 1,955 0 155
Costo de Ventas / Cost of sales 0 -28,158 0 0 -1,573 -1,805 -2,190 -2,160 0 0GANANCIA (PERDIDA) BRUTA / GROSS PROFIT (LOSS) 862 18,340 427 0 1,971 1,149 -953 -205 0 155
Gastos de Ventas y Distribución / Sales and distribution expenses -7 -4,936 0 0 0 0 0 0 -23 -3Gastos de Administración / Overheads -868 -4,638 -802 -991 -626 -951 -836 -496 -558 -1,394Ganancia (Pérdida) de la baja en Activos Financieros medidos al Costo Amortizado / Profit (loss) fromdisposal of financial assets measured at amortized cost 0 0 0 0 0 0 0 0 0 0Otros Ingresos Operativos / Other operating income 1 2,353 2 36 1,177 479 465 5 3,933 15,888Otros Gastos Operativos / Other operating expenses -18 -2,241 -515 -110 -514 -480 -319 -13 -4 0
GANANCIA (PERDIDA) OPERATIVA / OPERATING PROFIT (LOSS) -30 8,878 -888 -1,065 2,008 197 -1,643 -709 3,348 14,646Ingresos Financieros / Financial income 0 72 304 188 90 21 176 108 206 908Gastos Financieros / Financial expenses 0 -2,504 -87 -212 -286 -469 -3,512 -310 0 -2Diferencias de Cambio neto / Exchange differences net 552 291 19 -12 -45 -23 -208 -18 -300 0Participación en los Resultados Netos de Asociadas y Negocios Conjuntos Contabilizados por el Métodode la Participación / Equity in net results of associates and joint ventures booked by the equity method 0 2,455 0 2,740 0 0 0 0 0 0Ganancias (Pérdidas) de la Diferencia entre el Valor Libro Anterior y el Valor Justo de ActivosFinancieros Reclasificados Medidos a Valor Razonable / Profits (losses) from the difference between theprevious book value and fair value of financial assets reclassified and measured at fair value 0 0 0 0 0 0 0 0 0 0
RESULTADO ANTES DE IMPUESTO A LAS GANANCIAS / PRE-INCOME TAX RESULT 522 9,192 -652 1,639 1,767 -274 -5,187 -929 3,254 15,552Gasto por Impuesto a las Ganancias / Income tax expenses -209 -2,234 0 0 0 0 -3 -3 -1,051 -4,085
GANANCIA (PERDIDA) NETA DE OPERACIONES CONTINUADAS / NET PROFIT (LOSS) FROMCONTINUING TRADES 313 6,958 -652 1,639 1,767 -274 -5,190 -932 2,203 11,467
Ganancia (Pérdida) Neta del Impuesto a las Ganancias Procedente de Operaciones Discontinuadas / Netprofit (loss) arising from income tax discontinued trades 0 0 15,491 0 0 0 0 0 0 0
GANANCIA (PERDIDA) NETA DEL EJERCICIO / PERIOD'S NET PROFIT (LOSS) 313 6,958 14,839 1,639 1,767 -274 -5,190 -932 2,203 11,467
INDICADORES FINANCIEROS / FINANCIAL RATIOSLiquidez / Liquid Ratio 2.55 31.77 6.51 13.93 374.54 Rotación de Activos / Gross Sales to Total Assets 0.00 0.00 0.06 0.00 0.00 Solvencia / Solvency 0.24 0.03 0.60 0.14 0.01 Deuda / Patrimonio / Debt / Equity 0.31 0.03 1.52 0.16 0.01 Rentabilidad sobre Ventas Netas % / Return % 36.31 3,475.18 49.86 -.- n.d. Rentabilidad sobre Activos % / Return on Assets % 0.12 4.70 2.85 -.- 1.10 Rentabilidad de Patrimonio % / Return on Equity % 0.16 4.85 7.19 -.- 1.11

ESTADOS FINANCIEROS COMPARADOS / COMPARATIVE FINANCIAL STATEMENTS DIVERSAS / ASSORTEDCIFRAS EXPRESADAS EN MILES DE NUEVOS SOLES
EMPRESA/COMPANY
Inv. Pacasmayo
NCF Inversiones
Corporación Cervesur
RBC
NORVIALCIIU
7499
7499
74990-6
9213
9303
Pág 20 * Estados Financieros expresados en miles de US$
ESTADO DE SITUACION FINANCIERA / STATEMENT OF FINANCIAL POSITION 31/03/2012 31/12/2011 31/03/2012 31/12/2011 31/03/2012 31/12/2011 31/03/2012 31/12/2011 31/03/2012 31/12/2011
Efectivo y Equivalentes al Efectivo / Cash and cash equivalent 4,724 7,809 9,975 1,016 9,164 4,315 2,031 2,494 14,926 14,383Otros Activos Financieros / Other financial assets 0 0 75,251 105,413 10,589 7,722 0 0 0 0Cuentas por Cobrar Comerciales (neto) / Trade accounts receivable (net) 0 0 0 0 8 111 377 144 0 0Otras Cuentas por Cobrar (neto) / Other accounts receivable (net) 1,052 728 1,089 1,068 5,172 11,214 0 0 0 0Cuentas por Cobrar a Entidades Relacionadas / Accounts receivable from related companies 286 280 43,361 13,977 2,198 1,020 0 0 1,211 5Inventarios / Stocks 0 0 0 0 0 0 0 0 0 0Activos Biológicos / Biological assets 0 0 0 0 0 0 0 0 0 0Activos por Impuestos a las Ganancias / Assets from income tax 0 0 0 0 0 0 0 0 0 0Gastos Pagados por Anticipado / Prepaid expenses 15 5 1,298 1,726 56 73 0 0 101 367Otros Activos / Other assets 0 0 383 225 0 0 0 0 0 0Activos no Corrientes o Grupos de Activos para su Disposición Clasificados como Mantenidos para laVenta / Non-current assets or groups of assets for disposal classified as held for sale 0 0 0 0 0 0 0 0 0 0Activos no Corrientes o Grupos de Activos para su Disposición Clasificados como Mantenidos paraDistribuir a los Propietarios / Non-current assets or groups of assets for disposal classified as held forDistribution to owner 0 0 0 0 0 0 0 0 0 0
TOTAL ACTIVOS CORRIENTES / TOTAL CURRENT ASSETS 6,077 8,822 131,357 123,425 27,187 24,455 2,408 2,638 16,238 14,755Otros Activos Financieros / Other financial assets 27,272 19,565 146,426 146,426 510,709 460,432 0 0 0 0Inversiones Contabilizadas Aplicando el Método de la Participación / Investments booked using the equitymethod 382,280 382,280 0 0 0 0 0 0 0 0Cuentas por Cobrar Comerciales / Trade accounts receivable 0 0 0 0 0 0 0 0 0 0Otras Cuentas por Cobrar / Other accounts receivable 1,143 1,445 0 0 87 0 0 0 3,922 2,713Cuentas por Cobrar a Entidades Relacionadas / Accounts receivable from related companies 0 0 0 0 12,450 11,910 0 0 0 0Activos Biológicos / Biological assets 0 0 0 0 0 0 0 0 0 0Propiedades de Inversión / Investment property 0 0 0 0 0 0 0 0 0 0Propiedades, Planta y Equipo (neto) / Property, plant and equipment (net) 2,642 2,624 1 1 35,673 35,904 1,608 1,439 1,081 1,132Activos Intangibles (neto) / Intangible assets (net) 0 0 7,150 7,151 145 150 0 0 157,119 152,923Activos por Impuestos a las Ganancias Diferidos / Assets from deferred income tax 0 0 0 0 0 0 0 0 4,267 4,146Plusvalía / Capital gain 0 0 0 0 0 0 0 0 0 0Otros Activos / Other assets 13 14 0 0 0 0 3,738 3,738 0 0
TOTAL ACTIVOS NO CORRIENTES / TOTAL NON-CURRENT ASSETS 413,350 405,928 153,577 153,578 559,064 508,396 5,346 5,177 166,389 160,914TOTAL DE ACTIVOS / TOTAL ASSETS 419,427 414,750 284,934 277,003 586,251 532,851 7,754 7,815 182,627 175,669
Otros Pasivos Financieros / Other financial liabilities 12,286 12,286 48,335 41,585 0 1 0 0 9,606 9,059Cuentas por Pagar Comerciales / Trade accounts payable 16 0 205 223 55 68 0 0 489 512Otras Cuentas por Pagar / Other accounts payable 3,188 4,632 13 14 11,971 3,966 1,249 1,238 2,276 4,182Cuentas por Pagar a Entidades Relacionadas / Accounts payable to related companies 274 170 3,215 1,705 0 2 0 0 7,290 1,735Provisiones / Provisions 0 0 5 5 0 0 0 0 0 0Pasivos por Impuestos a las Ganancias / Liabilities from income tax 0 0 400 86 0 0 0 0 0 0Provisión por Beneficios a los Empleados / Provisions for employee profit sharing 0 0 213 144 0 0 0 0 0 0Otros Pasivos / Other Liabilities 0 0 0 0 0 0 0 0 0 0Pasivos incluidos en Grupos de Activos para su Disposición Clasificados como Mantenidos para la Venta/ Liabilities included in groups of assets for disposal classified as held for sale 0 0 0 0 0 0 0 0 0 0
TOTAL PASIVOS CORRIENTES / TOTAL CURRENT LIABILITIES 15,764 17,088 52,386 43,762 12,026 4,037 1,249 1,238 19,661 15,488Otros Pasivos Financieros / Other financial liabilities 0 0 0 0 0 0 0 0 47,336 50,808Cuentas por Pagar Comerciales / Trade accounts payable 0 0 0 0 0 0 0 0 0 0Otras Cuentas por Pagar / Other accounts payable 0 0 0 0 0 0 0 0 0 0Cuentas por Pagar a Entidades Relacionadas / Accounts payable to related companies 0 0 0 0 0 0 0 0 0 0Pasivos por Impuestos a las Ganancias Diferidos / Liabilities from deferred income tax 0 0 0 0 27,264 13,908 0 0 0 0Provisiones / Provisions 0 0 0 0 0 0 0 0 0 0Provisión por Beneficios a los Empleados / Provisions for employee profit sharing 0 0 0 0 0 0 0 0 0 0Otros Pasivos / Other Liabilities 0 0 7,953 7,778 0 0 127 127 0 0Ingresos Diferidos (netos) / Deferred income (net) 0 0 0 0 0 0 0 0 0 0
TOTAL PASIVOS NO CORRIENTES / TOTAL NON-CURRENT LIABILITIES 7,953 7,778 27,264 13,908 127 127 47,336 50,808TOTAL PASIVOS / TOTAL LIABILITIES 15,764 17,088 60,339 51,540 39,290 17,945 1,376 1,365 66,997 66,296
Capital Emitido / Issued capital 219,059 219,059 171,019 171,019 248,636 248,636 3,404 3,404 55,136 55,136Primas de Emisión / Share premium 0 0 22,698 22,698 19,549 19,549 0 0 0 0Acciones de Inversión / Investment stock 0 0 0 0 22,060 22,060 0 0 0 0Acciones Propias en Cartera / Treasury shares 0 0 -68,401 -68,401 0 0 0 0 0 0Otras Reservas de Capital / Other capital reserves 44,264 44,264 10,984 10,984 48,568 47,385 3,313 3,313 11,027 10,528Resultados Acumulados / Retained earnings 145,587 147,293 12,162 13,030 95,755 95,252 -339 -267 49,467 43,709Otras Reservas de Patrimonio / Other equity reserves -5,247 -12,954 76,133 76,133 112,393 82,024 0 0 0 0
TOTAL PATRIMONIO / TOTAL EQUITY 403,663 397,662 224,595 225,463 546,961 514,906 6,378 6,450 115,630 109,373TOTAL PASIVO Y PATRIMONIO / TOTAL LIABILITIES AND EQUITY 419,427 414,750 284,934 277,003 586,251 532,851 7,754 7,815 182,627 175,669
ESTADO DE RESULTADOS / INCOME STATEMENT 31/03/2012 31/03/2011 31/03/2012 31/03/2011 31/03/2012 31/03/2011 31/03/2012 31/03/2011 31/03/2012 31/03/2011
Ventas Netas de Bienes / Net sales of goods 0 0 61,561 36,345 0 0 0 0 20,769 19,076Prestación de Servicios / Services rendered 0 35,794 0 0 921 928 1,549 1,221 0 0
TOTAL DE INGRESOS DE ACTIVIDADES ORDINARIAS / TOTAL INCOME FROM REGULARACTIVITIES 0 35,794 61,561 36,345 921 928 1,549 1,221 20,769 19,076
Costo de Ventas / Cost of sales 0 0 -61,731 -29,955 0 0 -80 -75 -10,127 -9,178GANANCIA (PERDIDA) BRUTA / GROSS PROFIT (LOSS) 0 35,794 -170 6,390 921 928 1,469 1,146 10,642 9,898
Gastos de Ventas y Distribución / Sales and distribution expenses 0 0 -193 -101 0 0 -225 -122 0 0Gastos de Administración / Overheads -1,729 -1,559 -1,236 -1,282 -2,058 -1,847 -1,277 -693 -976 -914Ganancia (Pérdida) de la baja en Activos Financieros medidos al Costo Amortizado / Profit (loss) fromdisposal of financial assets measured at amortized cost 0 0 0 0 0 0 0 0 0 0Otros Ingresos Operativos / Other operating income 117 0 698 1,467 13,899 11,640 0 0 28 4Otros Gastos Operativos / Other operating expenses 0 0 0 0 -41 -11 0 0 0 -6
GANANCIA (PERDIDA) OPERATIVA / OPERATING PROFIT (LOSS) -1,612 34,235 -901 6,474 12,721 10,710 -33 331 9,694 8,982Ingresos Financieros / Financial income 61 0 513 17 263 226 4 8 661 134Gastos Financieros / Financial expenses -147 -153 -833 -798 -55 -743 -14 -19 -1,735 -1,916Diferencias de Cambio neto / Exchange differences net -8 -2 -56 92 -73 99 0 0 0 0Participación en los Resultados Netos de Asociadas y Negocios Conjuntos Contabilizados por el Métodode la Participación / Equity in net results of associates and joint ventures booked by the equity method 0 0 0 0 0 0 0 0 0 0Ganancias (Pérdidas) de la Diferencia entre el Valor Libro Anterior y el Valor Justo de ActivosFinancieros Reclasificados Medidos a Valor Razonable / Profits (losses) from the difference between theprevious book value and fair value of financial assets reclassified and measured at fair value 0 0 585 13,966 0 0 0 0 0 0
RESULTADO ANTES DE IMPUESTO A LAS GANANCIAS / PRE-INCOME TAX RESULT -1,706 34,080 -692 19,751 12,856 10,292 -43 320 8,620 7,200Gasto por Impuesto a las Ganancias / Income tax expenses 0 0 -176 -4,190 -342 183 -29 0 -2,363 -1,197
GANANCIA (PERDIDA) NETA DE OPERACIONES CONTINUADAS / NET PROFIT (LOSS) FROMCONTINUING TRADES -1,706 34,080 -868 15,561 12,514 10,475 -72 320 6,257 6,003
Ganancia (Pérdida) Neta del Impuesto a las Ganancias Procedente de Operaciones Discontinuadas / Netprofit (loss) arising from income tax discontinued trades 0 0 0 0 0 0 0 0 0 0
GANANCIA (PERDIDA) NETA DEL EJERCICIO / PERIOD'S NET PROFIT (LOSS) -1,706 34,080 -868 15,561 12,514 10,475 -72 320 6,257 6,003
INDICADORES FINANCIEROS / FINANCIAL RATIOSLiquidez / Liquid Ratio 0.39 2.51 2.26 1.93 0.83 Rotación de Activos / Gross Sales to Total Assets 0.00 0.22 0.00 0.20 0.11 Solvencia / Solvency 0.04 0.21 0.07 0.18 0.37 Deuda / Patrimonio / Debt / Equity 0.04 0.27 0.07 0.22 0.58 Rentabilidad sobre Ventas Netas % / Return % n.d. -.- 1,358.74 -.- 30.13 Rentabilidad sobre Activos % / Return on Assets % -.- -.- 2.13 -.- 3.43 Rentabilidad de Patrimonio % / Return on Equity % -.- -.- 2.29 -.- 5.41
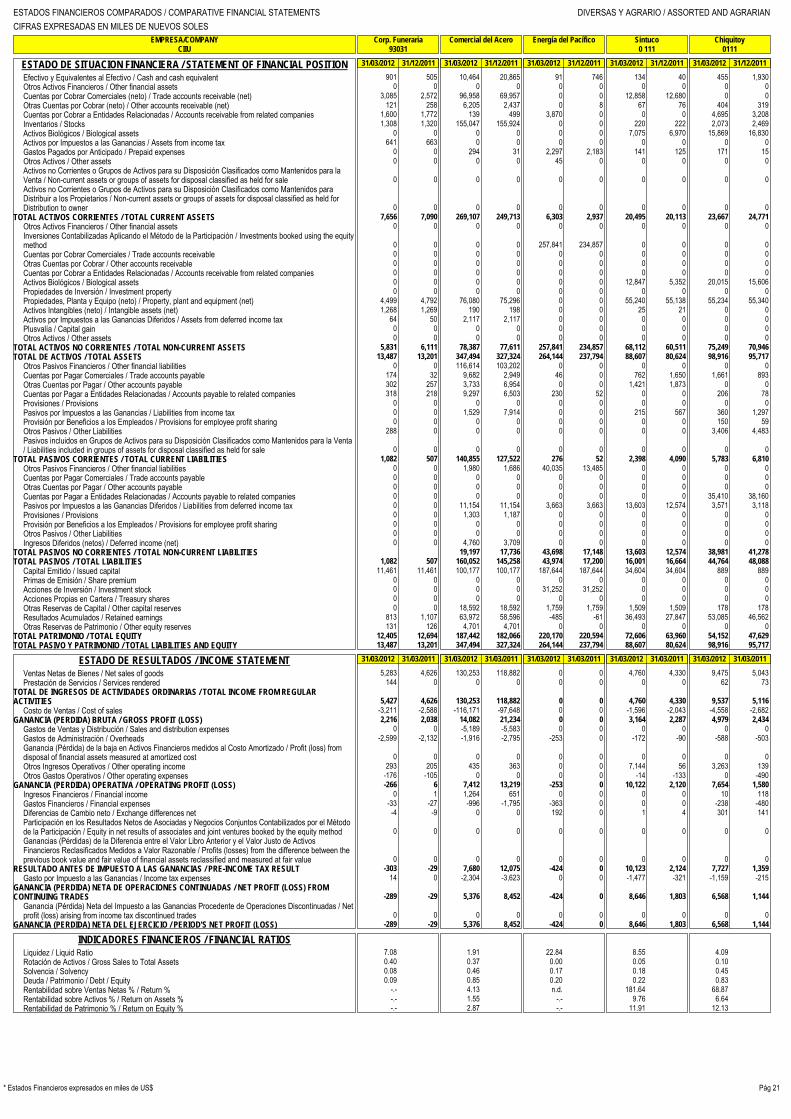
ESTADOS FINANCIEROS COMPARADOS / COMPARATIVE FINANCIAL STATEMENTS DIVERSAS Y AGRARIO / ASSORTED AND AGRARIANCIFRAS EXPRESADAS EN MILES DE NUEVOS SOLES
EMPRESA/COMPANY
Corp. Funeraria
Comercial del Acero
Energía del Pacífico
Sintuco
ChiquitoyCIIU
93031
0 111
0111
Pág 21* Estados Financieros expresados en miles de US$
ESTADO DE SITUACION FINANCIERA / STATEMENT OF FINANCIAL POSITION 31/03/2012 31/12/2011 31/03/2012 31/12/2011 31/03/2012 31/12/2011 31/03/2012 31/12/2011 31/03/2012 31/12/2011
Efectivo y Equivalentes al Efectivo / Cash and cash equivalent 901 505 10,464 20,865 91 746 134 40 455 1,930Otros Activos Financieros / Other financial assets 0 0 0 0 0 0 0 0 0 0Cuentas por Cobrar Comerciales (neto) / Trade accounts receivable (net) 3,085 2,572 96,958 69,957 0 0 12,858 12,680 0 0Otras Cuentas por Cobrar (neto) / Other accounts receivable (net) 121 258 6,205 2,437 0 8 67 76 404 319Cuentas por Cobrar a Entidades Relacionadas / Accounts receivable from related companies 1,600 1,772 139 499 3,870 0 0 0 4,695 3,208Inventarios / Stocks 1,308 1,320 155,047 155,924 0 0 220 222 2,073 2,469Activos Biológicos / Biological assets 0 0 0 0 0 0 7,075 6,970 15,869 16,830Activos por Impuestos a las Ganancias / Assets from income tax 641 663 0 0 0 0 0 0 0 0Gastos Pagados por Anticipado / Prepaid expenses 0 0 294 31 2,297 2,183 141 125 171 15Otros Activos / Other assets 0 0 0 0 45 0 0 0 0 0Activos no Corrientes o Grupos de Activos para su Disposición Clasificados como Mantenidos para laVenta / Non-current assets or groups of assets for disposal classified as held for sale 0 0 0 0 0 0 0 0 0 0Activos no Corrientes o Grupos de Activos para su Disposición Clasificados como Mantenidos paraDistribuir a los Propietarios / Non-current assets or groups of assets for disposal classified as held forDistribution to owner 0 0 0 0 0 0 0 0 0 0
TOTAL ACTIVOS CORRIENTES / TOTAL CURRENT ASSETS 7,656 7,090 269,107 249,713 6,303 2,937 20,495 20,113 23,667 24,771Otros Activos Financieros / Other financial assets 0 0 0 0 0 0 0 0 0 0Inversiones Contabilizadas Aplicando el Método de la Participación / Investments booked using the equitymethod 0 0 0 0 257,841 234,857 0 0 0 0Cuentas por Cobrar Comerciales / Trade accounts receivable 0 0 0 0 0 0 0 0 0 0Otras Cuentas por Cobrar / Other accounts receivable 0 0 0 0 0 0 0 0 0 0Cuentas por Cobrar a Entidades Relacionadas / Accounts receivable from related companies 0 0 0 0 0 0 0 0 0 0Activos Biológicos / Biological assets 0 0 0 0 0 0 12,847 5,352 20,015 15,606Propiedades de Inversión / Investment property 0 0 0 0 0 0 0 0 0 0Propiedades, Planta y Equipo (neto) / Property, plant and equipment (net) 4,499 4,792 76,080 75,296 0 0 55,240 55,138 55,234 55,340Activos Intangibles (neto) / Intangible assets (net) 1,268 1,269 190 198 0 0 25 21 0 0Activos por Impuestos a las Ganancias Diferidos / Assets from deferred income tax 64 50 2,117 2,117 0 0 0 0 0 0Plusvalía / Capital gain 0 0 0 0 0 0 0 0 0 0Otros Activos / Other assets 0 0 0 0 0 0 0 0 0 0
TOTAL ACTIVOS NO CORRIENTES / TOTAL NON-CURRENT ASSETS 5,831 6,111 78,387 77,611 257,841 234,857 68,112 60,511 75,249 70,946TOTAL DE ACTIVOS / TOTAL ASSETS 13,487 13,201 347,494 327,324 264,144 237,794 88,607 80,624 98,916 95,717
Otros Pasivos Financieros / Other financial liabilities 0 0 116,614 103,202 0 0 0 0 0 0Cuentas por Pagar Comerciales / Trade accounts payable 174 32 9,682 2,949 46 0 762 1,650 1,661 893Otras Cuentas por Pagar / Other accounts payable 302 257 3,733 6,954 0 0 1,421 1,873 0 0Cuentas por Pagar a Entidades Relacionadas / Accounts payable to related companies 318 218 9,297 6,503 230 52 0 0 206 78Provisiones / Provisions 0 0 0 0 0 0 0 0 0 0Pasivos por Impuestos a las Ganancias / Liabilities from income tax 0 0 1,529 7,914 0 0 215 567 360 1,297Provisión por Beneficios a los Empleados / Provisions for employee profit sharing 0 0 0 0 0 0 0 0 150 59Otros Pasivos / Other Liabilities 288 0 0 0 0 0 0 0 3,406 4,483Pasivos incluidos en Grupos de Activos para su Disposición Clasificados como Mantenidos para la Venta/ Liabilities included in groups of assets for disposal classified as held for sale 0 0 0 0 0 0 0 0 0 0
TOTAL PASIVOS CORRIENTES / TOTAL CURRENT LIABILITIES 1,082 507 140,855 127,522 276 52 2,398 4,090 5,783 6,810Otros Pasivos Financieros / Other financial liabilities 0 0 1,980 1,686 40,035 13,485 0 0 0 0Cuentas por Pagar Comerciales / Trade accounts payable 0 0 0 0 0 0 0 0 0 0Otras Cuentas por Pagar / Other accounts payable 0 0 0 0 0 0 0 0 0 0Cuentas por Pagar a Entidades Relacionadas / Accounts payable to related companies 0 0 0 0 0 0 0 0 35,410 38,160Pasivos por Impuestos a las Ganancias Diferidos / Liabilities from deferred income tax 0 0 11,154 11,154 3,663 3,663 13,603 12,574 3,571 3,118Provisiones / Provisions 0 0 1,303 1,187 0 0 0 0 0 0Provisión por Beneficios a los Empleados / Provisions for employee profit sharing 0 0 0 0 0 0 0 0 0 0Otros Pasivos / Other Liabilities 0 0 0 0 0 0 0 0 0 0Ingresos Diferidos (netos) / Deferred income (net) 0 0 4,760 3,709 0 0 0 0 0 0
TOTAL PASIVOS NO CORRIENTES / TOTAL NON-CURRENT LIABILITIES 19,197 17,736 43,698 17,148 13,603 12,574 38,981 41,278TOTAL PASIVOS / TOTAL LIABILITIES 1,082 507 160,052 145,258 43,974 17,200 16,001 16,664 44,764 48,088
Capital Emitido / Issued capital 11,461 11,461 100,177 100,177 187,644 187,644 34,604 34,604 889 889Primas de Emisión / Share premium 0 0 0 0 0 0 0 0 0 0Acciones de Inversión / Investment stock 0 0 0 0 31,252 31,252 0 0 0 0Acciones Propias en Cartera / Treasury shares 0 0 0 0 0 0 0 0 0 0Otras Reservas de Capital / Other capital reserves 0 0 18,592 18,592 1,759 1,759 1,509 1,509 178 178Resultados Acumulados / Retained earnings 813 1,107 63,972 58,596 -485 -61 36,493 27,847 53,085 46,562Otras Reservas de Patrimonio / Other equity reserves 131 126 4,701 4,701 0 0 0 0 0 0
TOTAL PATRIMONIO / TOTAL EQUITY 12,405 12,694 187,442 182,066 220,170 220,594 72,606 63,960 54,152 47,629TOTAL PASIVO Y PATRIMONIO / TOTAL LIABILITIES AND EQUITY 13,487 13,201 347,494 327,324 264,144 237,794 88,607 80,624 98,916 95,717
ESTADO DE RESULTADOS / INCOME STATEMENT 31/03/2012 31/03/2011 31/03/2012 31/03/2011 31/03/2012 31/03/2011 31/03/2012 31/03/2011 31/03/2012 31/03/2011
Ventas Netas de Bienes / Net sales of goods 5,283 4,626 130,253 118,882 0 0 4,760 4,330 9,475 5,043Prestación de Servicios / Services rendered 144 0 0 0 0 0 0 0 62 73
TOTAL DE INGRESOS DE ACTIVIDADES ORDINARIAS / TOTAL INCOME FROM REGULARACTIVITIES 5,427 4,626 130,253 118,882 0 0 4,760 4,330 9,537 5,116
Costo de Ventas / Cost of sales -3,211 -2,588 -116,171 -97,648 0 0 -1,596 -2,043 -4,558 -2,682GANANCIA (PERDIDA) BRUTA / GROSS PROFIT (LOSS) 2,216 2,038 14,082 21,234 0 0 3,164 2,287 4,979 2,434
Gastos de Ventas y Distribución / Sales and distribution expenses 0 0 -5,189 -5,583 0 0 0 0 0 0Gastos de Administración / Overheads -2,599 -2,132 -1,916 -2,795 -253 0 -172 -90 -588 -503Ganancia (Pérdida) de la baja en Activos Financieros medidos al Costo Amortizado / Profit (loss) fromdisposal of financial assets measured at amortized cost 0 0 0 0 0 0 0 0 0 0Otros Ingresos Operativos / Other operating income 293 205 435 363 0 0 7,144 56 3,263 139Otros Gastos Operativos / Other operating expenses -176 -105 0 0 0 0 -14 -133 0 -490
GANANCIA (PERDIDA) OPERATIVA / OPERATING PROFIT (LOSS) -266 6 7,412 13,219 -253 0 10,122 2,120 7,654 1,580Ingresos Financieros / Financial income 0 1 1,264 651 0 0 0 0 10 118Gastos Financieros / Financial expenses -33 -27 -996 -1,795 -363 0 0 0 -238 -480Diferencias de Cambio neto / Exchange differences net -4 -9 0 0 192 0 1 4 301 141Participación en los Resultados Netos de Asociadas y Negocios Conjuntos Contabilizados por el Métodode la Participación / Equity in net results of associates and joint ventures booked by the equity method 0 0 0 0 0 0 0 0 0 0Ganancias (Pérdidas) de la Diferencia entre el Valor Libro Anterior y el Valor Justo de ActivosFinancieros Reclasificados Medidos a Valor Razonable / Profits (losses) from the difference between theprevious book value and fair value of financial assets reclassified and measured at fair value 0 0 0 0 0 0 0 0 0 0
RESULTADO ANTES DE IMPUESTO A LAS GANANCIAS / PRE-INCOME TAX RESULT -303 -29 7,680 12,075 -424 0 10,123 2,124 7,727 1,359Gasto por Impuesto a las Ganancias / Income tax expenses 14 0 -2,304 -3,623 0 0 -1,477 -321 -1,159 -215
GANANCIA (PERDIDA) NETA DE OPERACIONES CONTINUADAS / NET PROFIT (LOSS) FROMCONTINUING TRADES -289 -29 5,376 8,452 -424 0 8,646 1,803 6,568 1,144
Ganancia (Pérdida) Neta del Impuesto a las Ganancias Procedente de Operaciones Discontinuadas / Netprofit (loss) arising from income tax discontinued trades 0 0 0 0 0 0 0 0 0 0
GANANCIA (PERDIDA) NETA DEL EJERCICIO / PERIOD'S NET PROFIT (LOSS) -289 -29 5,376 8,452 -424 0 8,646 1,803 6,568 1,144
INDICADORES FINANCIEROS / FINANCIAL RATIOSLiquidez / Liquid Ratio 7.08 1.91 22.84 8.55 4.09 Rotación de Activos / Gross Sales to Total Assets 0.40 0.37 0.00 0.05 0.10 Solvencia / Solvency 0.08 0.46 0.17 0.18 0.45 Deuda / Patrimonio / Debt / Equity 0.09 0.85 0.20 0.22 0.83 Rentabilidad sobre Ventas Netas % / Return % -.- 4.13 n.d. 181.64 68.87 Rentabilidad sobre Activos % / Return on Assets % -.- 1.55 -.- 9.76 6.64 Rentabilidad de Patrimonio % / Return on Equity % -.- 2.87 -.- 11.91 12.13

ESTADOS FINANCIEROS COMPARADOS / COMPARATIVE FINANCIAL STATEMENTS AGRARIO / AGRARIANCIFRAS EXPRESADAS EN MILES DE NUEVOS SOLES
EMPRESA/COMPANY
Palmas del Espino
San Jacinto
El Ingenio
Cartavio
Chucarapi - Pampa BlancaCIIU
0111
1110
1504
1542
1542
Pág 22 * Estados Financieros expresados en miles de US$
ESTADO DE SITUACION FINANCIERA / STATEMENT OF FINANCIAL POSITION 31/03/2012 31/12/2011 31/03/2012 31/12/2011 31/03/2012 31/12/2011 31/03/2012 31/12/2011 31/03/2012 31/12/2011
Efectivo y Equivalentes al Efectivo / Cash and cash equivalent 2,674 586 616 1,996 421 416 21,646 8,322 86 88Otros Activos Financieros / Other financial assets 0 0 0 0 0 0 0 0 0 0Cuentas por Cobrar Comerciales (neto) / Trade accounts receivable (net) 3,583 8,338 4,990 13,133 0 0 57,899 56,549 46 1,854Otras Cuentas por Cobrar (neto) / Other accounts receivable (net) 8,008 5,480 4,424 3,990 146 214 949 1,013 63 35Cuentas por Cobrar a Entidades Relacionadas / Accounts receivable from related companies 23,260 17,514 15,134 8,445 10,547 9,444 16,963 16,237 11,395 10,918Inventarios / Stocks 2,967 2,619 12,868 11,133 188 137 48,822 44,656 468 0Activos Biológicos / Biological assets 73,035 75,864 42,730 41,483 10,009 11,160 49,537 56,810 4,347 5,000Activos por Impuestos a las Ganancias / Assets from income tax 0 0 0 0 0 0 0 0 0 0Gastos Pagados por Anticipado / Prepaid expenses 1,530 2,250 1,175 1,195 1,064 989 2,093 1,144 3,074 3,216Otros Activos / Other assets 0 0 0 0 163 444 0 0 61 0Activos no Corrientes o Grupos de Activos para su Disposición Clasificados como Mantenidos para laVenta / Non-current assets or groups of assets for disposal classified as held for sale 91,184 91,184 0 0 0 0 0 0 0 0Activos no Corrientes o Grupos de Activos para su Disposición Clasificados como Mantenidos paraDistribuir a los Propietarios / Non-current assets or groups of assets for disposal classified as held forDistribution to owner 0 0 0 0 0 0 0 0 0 0
TOTAL ACTIVOS CORRIENTES / TOTAL CURRENT ASSETS 206,241 203,835 81,937 81,375 22,538 22,804 197,909 184,731 19,540 21,111Otros Activos Financieros / Other financial assets 5,433 4,729 0 0 0 0 5,109 5,109 0 0Inversiones Contabilizadas Aplicando el Método de la Participación / Investments booked using the equitymethod 779,720 776,227 399 399 0 0 0 0 0 0Cuentas por Cobrar Comerciales / Trade accounts receivable 0 0 0 0 0 0 8,446 9,952 0 0Otras Cuentas por Cobrar / Other accounts receivable 0 0 0 0 0 0 0 0 0 0Cuentas por Cobrar a Entidades Relacionadas / Accounts receivable from related companies 0 0 0 0 0 0 0 0 0 0Activos Biológicos / Biological assets 301,167 269,270 88,453 74,614 781 618 72,784 54,312 2,864 2,837Propiedades de Inversión / Investment property 0 0 0 0 0 0 0 0 602 601Propiedades, Planta y Equipo (neto) / Property, plant and equipment (net) 105,295 105,867 334,841 334,305 35,143 35,164 418,061 418,734 79,238 79,277Activos Intangibles (neto) / Intangible assets (net) 685 2 562 189 0 0 675 652 0 0Activos por Impuestos a las Ganancias Diferidos / Assets from deferred income tax 0 0 0 0 0 0 0 0 0 0Plusvalía / Capital gain 0 0 0 0 0 0 0 0 0 0Otros Activos / Other assets 0 0 0 0 0 0 0 0 0 575
TOTAL ACTIVOS NO CORRIENTES / TOTAL NON-CURRENT ASSETS 1,192,300 1,156,095 424,255 409,507 35,924 35,782 505,075 488,759 82,704 83,290TOTAL DE ACTIVOS / TOTAL ASSETS 1,398,541 1,359,930 506,192 490,882 58,462 58,586 702,984 673,490 102,244 104,401
Otros Pasivos Financieros / Other financial liabilities 116,927 98,616 21,598 18,519 345 130 34,002 33,651 2,179 3,530Cuentas por Pagar Comerciales / Trade accounts payable 2,487 3,662 12,262 18,845 403 335 53,772 36,426 581 545Otras Cuentas por Pagar / Other accounts payable 4,466 7,197 14,652 15,666 1,042 1,536 25,693 18,541 16,036 16,452Cuentas por Pagar a Entidades Relacionadas / Accounts payable to related companies 21,904 41,941 4,475 425 13 99 100,023 33,907 14,593 14,145Provisiones / Provisions 0 0 0 0 0 0 0 0 631 0Pasivos por Impuestos a las Ganancias / Liabilities from income tax 0 0 1,979 5,139 0 0 249 2,639 0 0Provisión por Beneficios a los Empleados / Provisions for employee profit sharing 910 1,008 0 0 274 534 0 0 0 0Otros Pasivos / Other Liabilities 0 0 0 0 405 377 0 0 598 652Pasivos incluidos en Grupos de Activos para su Disposición Clasificados como Mantenidos para la Venta/ Liabilities included in groups of assets for disposal classified as held for sale 0 0 0 0 0 0 0 0 0 0
TOTAL PASIVOS CORRIENTES / TOTAL CURRENT LIABILITIES 146,694 152,424 54,966 58,594 2,482 3,011 213,739 125,164 34,618 35,324Otros Pasivos Financieros / Other financial liabilities 30,975 35,400 81,883 86,887 0 0 20,038 22,560 0 0Cuentas por Pagar Comerciales / Trade accounts payable 0 0 0 0 0 0 0 0 0 0Otras Cuentas por Pagar / Other accounts payable 0 0 9,064 6,712 0 0 2,607 2,754 0 0Cuentas por Pagar a Entidades Relacionadas / Accounts payable to related companies 0 0 0 0 0 0 0 0 0 0Pasivos por Impuestos a las Ganancias Diferidos / Liabilities from deferred income tax 0 0 40,373 38,520 0 0 78,573 77,237 628 628Provisiones / Provisions 0 0 0 0 0 0 0 0 0 0Provisión por Beneficios a los Empleados / Provisions for employee profit sharing 0 0 0 0 1,940 2,035 0 0 0 0Otros Pasivos / Other Liabilities 0 0 0 0 5,233 5,085 0 0 0 0Ingresos Diferidos (netos) / Deferred income (net) 0 0 0 0 0 0 0 0 0 0
TOTAL PASIVOS NO CORRIENTES / TOTAL NON-CURRENT LIABILITIES 30,975 35,400 131,320 132,119 7,173 7,120 101,218 102,551 628 628TOTAL PASIVOS / TOTAL LIABILITIES 177,669 187,824 186,286 190,713 9,655 10,131 314,957 227,715 35,246 35,952
Capital Emitido / Issued capital 480,065 480,065 284,533 284,533 43,699 43,699 206,766 206,766 58,975 58,975Primas de Emisión / Share premium 0 0 0 0 0 0 0 0 0 0Acciones de Inversión / Investment stock 0 0 0 0 0 0 0 0 0 0Acciones Propias en Cartera / Treasury shares 0 0 0 0 0 0 0 0 0 0Otras Reservas de Capital / Other capital reserves 34,045 34,045 10,707 708 786 786 43,107 31,733 0 0Resultados Acumulados / Retained earnings 633,384 588,111 24,666 14,928 4,322 3,970 138,154 207,276 8,023 9,474Otras Reservas de Patrimonio / Other equity reserves 73,378 69,885 0 0 0 0 0 0 0 0
TOTAL PATRIMONIO / TOTAL EQUITY 1,220,872 1,172,106 319,906 300,169 48,807 48,455 388,027 445,775 66,998 68,449TOTAL PASIVO Y PATRIMONIO / TOTAL LIABILITIES AND EQUITY 1,398,541 1,359,930 506,192 490,882 58,462 58,586 702,984 673,490 102,244 104,401
ESTADO DE RESULTADOS / INCOME STATEMENT 31/03/2012 31/03/2011 31/03/2012 31/03/2011 31/03/2012 31/03/2011 31/03/2012 31/03/2011 31/03/2012 31/03/2011
Ventas Netas de Bienes / Net sales of goods 31,343 30,177 48,244 42,160 3,405 2,460 92,895 96,592 3,163 4Prestación de Servicios / Services rendered 0 0 186 83 0 0 2,854 2,770 12 1,128
TOTAL DE INGRESOS DE ACTIVIDADES ORDINARIAS / TOTAL INCOME FROM REGULARACTIVITIES 31,343 30,177 48,430 42,243 3,405 2,460 95,749 99,362 3,175 1,132
Costo de Ventas / Cost of sales -13,814 -11,661 -25,850 -20,974 -1,781 -1,152 -70,331 -63,907 -3,014 -232GANANCIA (PERDIDA) BRUTA / GROSS PROFIT (LOSS) 17,529 18,516 22,580 21,269 1,624 1,308 25,418 35,455 161 900
Gastos de Ventas y Distribución / Sales and distribution expenses 0 0 -27 -13 0 0 -3,359 -1,890 -42 0Gastos de Administración / Overheads -2,874 -1,899 -2,983 -3,099 -305 -399 -3,427 -3,048 -1,116 -902Ganancia (Pérdida) de la baja en Activos Financieros medidos al Costo Amortizado / Profit (loss) fromdisposal of financial assets measured at amortized cost 0 0 0 0 0 0 0 0 0 0Otros Ingresos Operativos / Other operating income 30,869 29,081 12,485 5,370 103 360 10,312 3,756 10 316Otros Gastos Operativos / Other operating expenses -950 -3,165 -592 -300 -870 -147 -227 -659 0 -146
GANANCIA (PERDIDA) OPERATIVA / OPERATING PROFIT (LOSS) 44,574 42,533 31,463 23,227 552 1,122 28,717 33,614 -987 168Ingresos Financieros / Financial income 1,060 224 19 23 4 5 163 270 128 0Gastos Financieros / Financial expenses -1,949 -2,531 -2,063 -2,067 0 -11 -1,034 -1,329 -45 -472Diferencias de Cambio neto / Exchange differences net 1,588 1,063 66 -14 -1 2 -107 -109 33 26Participación en los Resultados Netos de Asociadas y Negocios Conjuntos Contabilizados por el Métodode la Participación / Equity in net results of associates and joint ventures booked by the equity method 0 712 0 0 0 0 0 0 0 0Ganancias (Pérdidas) de la Diferencia entre el Valor Libro Anterior y el Valor Justo de ActivosFinancieros Reclasificados Medidos a Valor Razonable / Profits (losses) from the difference between theprevious book value and fair value of financial assets reclassified and measured at fair value 0 -470 0 0 0 0 0 0 0 0
RESULTADO ANTES DE IMPUESTO A LAS GANANCIAS / PRE-INCOME TAX RESULT 45,273 41,531 29,485 21,169 555 1,118 27,739 32,446 -871 -278Gasto por Impuesto a las Ganancias / Income tax expenses 0 0 -4,849 -3,225 -203 -150 -4,079 -4,857 0 0
GANANCIA (PERDIDA) NETA DE OPERACIONES CONTINUADAS / NET PROFIT (LOSS) FROMCONTINUING TRADES 45,273 41,531 24,636 17,944 352 968 23,660 27,589 -871 -278
Ganancia (Pérdida) Neta del Impuesto a las Ganancias Procedente de Operaciones Discontinuadas / Netprofit (loss) arising from income tax discontinued trades 0 0 0 0 0 0 0 0 0 0
GANANCIA (PERDIDA) NETA DEL EJERCICIO / PERIOD'S NET PROFIT (LOSS) 45,273 41,531 24,636 17,944 352 968 23,660 27,589 -871 -278
INDICADORES FINANCIEROS / FINANCIAL RATIOSLiquidez / Liquid Ratio 1.41 1.49 9.08 0.93 0.56 Rotación de Activos / Gross Sales to Total Assets 0.02 0.10 0.06 0.14 0.03 Solvencia / Solvency 0.13 0.37 0.17 0.45 0.34 Deuda / Patrimonio / Debt / Equity 0.15 0.58 0.20 0.81 0.53 Rentabilidad sobre Ventas Netas % / Return % 144.44 50.87 10.34 24.71 -.- Rentabilidad sobre Activos % / Return on Assets % 3.24 4.87 0.60 3.37 -.- Rentabilidad de Patrimonio % / Return on Equity % 3.71 7.70 0.72 6.10 -.-

ESTADOS FINANCIEROS COMPARADOS / COMPARATIVE FINANCIAL STATEMENTS AGRARIO / AGRARIANCIFRAS EXPRESADAS EN MILES DE NUEVOS SOLES
EMPRESA/COMPANY
Emp. Agr. San Juan
Emp. Agro. Pomalca
Laredo
Paramonga
Casa GrandeCIIU
1542
1542
1542
1542
3118
Pág 23* Estados Financieros expresados en miles de US$
ESTADO DE SITUACION FINANCIERA / STATEMENT OF FINANCIAL POSITION 31/03/2012 31/12/2011 31/03/2012 31/12/2011 31/03/2012 31/12/2011 31/03/2012 31/12/2011 31/03/2012 31/12/2011
Efectivo y Equivalentes al Efectivo / Cash and cash equivalent 6,088 3,822 4,659 4,049 6,213 1,244 30,526 33,095 36,674 8,674Otros Activos Financieros / Other financial assets 0 0 0 0 0 0 2,802 2,995 0 0Cuentas por Cobrar Comerciales (neto) / Trade accounts receivable (net) 218 10,395 8,305 11,069 31,454 32,412 11,626 13,622 35,034 25,050Otras Cuentas por Cobrar (neto) / Other accounts receivable (net) 6,413 3,558 1,877 1,519 8,879 8,492 10,509 10,176 9,471 7,239Cuentas por Cobrar a Entidades Relacionadas / Accounts receivable from related companies 24 24 0 0 395 397 23,578 22,973 45,572 43,792Inventarios / Stocks 2,766 4,197 14,819 18,252 14,899 14,543 24,706 16,575 73,324 71,730Activos Biológicos / Biological assets 10,749 10,749 42,806 39,527 32,270 30,685 80,051 90,177 122,738 137,590Activos por Impuestos a las Ganancias / Assets from income tax 0 0 8,397 8,590 0 0 0 0 0 0Gastos Pagados por Anticipado / Prepaid expenses 0 0 868 100 3,570 2,373 3,748 3,006 906 812Otros Activos / Other assets 106 139 0 0 0 0 0 0 0 0Activos no Corrientes o Grupos de Activos para su Disposición Clasificados como Mantenidos para laVenta / Non-current assets or groups of assets for disposal classified as held for sale 0 0 0 0 0 0 0 0 0 0Activos no Corrientes o Grupos de Activos para su Disposición Clasificados como Mantenidos paraDistribuir a los Propietarios / Non-current assets or groups of assets for disposal classified as held forDistribution to owner 0 0 0 0 0 0 0 0 0 0
TOTAL ACTIVOS CORRIENTES / TOTAL CURRENT ASSETS 26,364 32,884 81,731 83,106 97,680 90,146 187,546 192,619 323,719 294,887Otros Activos Financieros / Other financial assets 0 0 167 167 0 0 0 0 0 0Inversiones Contabilizadas Aplicando el Método de la Participación / Investments booked using the equitymethod 0 0 0 0 0 0 611 611 0 0Cuentas por Cobrar Comerciales / Trade accounts receivable 0 0 0 0 0 124 0 0 0 0Otras Cuentas por Cobrar / Other accounts receivable 586 586 0 0 1,236 1,095 0 0 66 75Cuentas por Cobrar a Entidades Relacionadas / Accounts receivable from related companies 0 0 0 0 0 0 19,586 19,586 0 0Activos Biológicos / Biological assets 11,110 6,800 3,301 4,857 23,228 21,183 40,679 55,237 264,637 218,183Propiedades de Inversión / Investment property 0 0 0 0 0 0 0 0 0 0Propiedades, Planta y Equipo (neto) / Property, plant and equipment (net) 74,288 75,296 808,810 807,708 637,338 636,986 574,112 575,404 1,214,502 1,202,117Activos Intangibles (neto) / Intangible assets (net) 62 64 0 0 62 76 0 0 1,238 1,253Activos por Impuestos a las Ganancias Diferidos / Assets from deferred income tax 0 0 0 0 0 0 0 0 0 0Plusvalía / Capital gain 0 0 0 0 0 0 0 0 0 0Otros Activos / Other assets 0 0 0 0 0 0 0 0 0 0
TOTAL ACTIVOS NO CORRIENTES / TOTAL NON-CURRENT ASSETS 86,046 82,746 812,278 812,732 661,864 659,464 634,988 650,838 1,480,443 1,421,628TOTAL DE ACTIVOS / TOTAL ASSETS 112,410 115,630 894,009 895,838 759,544 749,610 822,534 843,457 1,804,162 1,716,515
Otros Pasivos Financieros / Other financial liabilities 2,432 5,245 0 0 7,032 6,380 28,866 28,482 31,152 37,037Cuentas por Pagar Comerciales / Trade accounts payable 1,309 3,847 2,419 885 15,581 14,981 7,594 10,534 81,386 43,889Otras Cuentas por Pagar / Other accounts payable 0 0 17,869 12,536 29,167 8,110 23,611 25,418 84,786 48,145Cuentas por Pagar a Entidades Relacionadas / Accounts payable to related companies 64 1,294 0 0 286 256 3,246 1,834 65,089 7,197Provisiones / Provisions 0 0 0 0 0 0 0 0 0 0Pasivos por Impuestos a las Ganancias / Liabilities from income tax 0 0 617 617 0 3,711 0 0 3,452 8,449Provisión por Beneficios a los Empleados / Provisions for employee profit sharing 0 0 31,850 26,394 6,940 10,975 0 0 0 0Otros Pasivos / Other Liabilities 4,124 3,061 0 0 8,191 12,582 0 0 0 0Pasivos incluidos en Grupos de Activos para su Disposición Clasificados como Mantenidos para la Venta/ Liabilities included in groups of assets for disposal classified as held for sale 0 0 0 0 0 0 0 0 0 0
TOTAL PASIVOS CORRIENTES / TOTAL CURRENT LIABILITIES 7,929 13,447 52,755 40,432 67,197 56,995 63,317 66,268 265,865 144,717Otros Pasivos Financieros / Other financial liabilities 20,783 20,991 0 0 88,513 90,929 56,605 60,286 75,649 82,104Cuentas por Pagar Comerciales / Trade accounts payable 0 0 15,780 15,943 0 0 0 0 2,383 1,915Otras Cuentas por Pagar / Other accounts payable 0 0 185,967 183,809 2,204 1,626 0 0 13,336 16,185Cuentas por Pagar a Entidades Relacionadas / Accounts payable to related companies 0 0 0 0 0 0 0 0 10 10Pasivos por Impuestos a las Ganancias Diferidos / Liabilities from deferred income tax 2,677 2,676 10,387 10,387 77,514 78,247 0 0 254,012 251,318Provisiones / Provisions 0 0 24,239 26,382 0 0 0 0 0 0Provisión por Beneficios a los Empleados / Provisions for employee profit sharing 0 0 201,909 210,950 0 0 7,276 7,779 0 0Otros Pasivos / Other Liabilities 0 0 0 0 0 0 0 0 0 0Ingresos Diferidos (netos) / Deferred income (net) 0 0 0 0 0 0 111,654 113,037 3,145 3,145
TOTAL PASIVOS NO CORRIENTES / TOTAL NON-CURRENT LIABILITIES 23,460 23,667 438,282 447,471 168,231 170,802 175,535 181,102 348,535 354,677TOTAL PASIVOS / TOTAL LIABILITIES 31,389 37,114 491,037 487,903 235,428 227,797 238,852 247,370 614,400 499,394
Capital Emitido / Issued capital 60,000 60,000 335,734 335,734 191,604 191,604 332,710 332,710 847,030 847,030Primas de Emisión / Share premium 0 0 0 0 0 0 0 0 0 0Acciones de Inversión / Investment stock 0 0 2,029 2,029 0 0 0 0 0 0Acciones Propias en Cartera / Treasury shares 0 0 0 0 0 0 0 0 0 0Otras Reservas de Capital / Other capital reserves 6,346 5,614 2,856 2,856 35,961 30,409 33,521 5,456 38,138 7,052Resultados Acumulados / Retained earnings 14,675 12,902 -256,792 -251,829 254,462 258,271 220,029 260,499 304,594 363,039Otras Reservas de Patrimonio / Other equity reserves 0 0 319,145 319,145 42,089 41,529 -2,578 -2,578 0 0
TOTAL PATRIMONIO / TOTAL EQUITY 81,021 78,516 402,972 407,935 524,116 521,813 583,682 596,087 1,189,762 1,217,121TOTAL PASIVO Y PATRIMONIO / TOTAL LIABILITIES AND EQUITY 112,410 115,630 894,009 895,838 759,544 749,610 822,534 843,457 1,804,162 1,716,515
ESTADO DE RESULTADOS / INCOME STATEMENT 31/03/2012 31/03/2011 31/03/2012 31/03/2011 31/03/2012 31/03/2011 31/03/2012 31/03/2011 31/03/2012 31/03/2011
Ventas Netas de Bienes / Net sales of goods 7,682 5,632 29,042 28,308 75,956 57,453 59,936 70,880 152,353 175,264Prestación de Servicios / Services rendered 0 0 0 0 0 0 0 0 917 414
TOTAL DE INGRESOS DE ACTIVIDADES ORDINARIAS / TOTAL INCOME FROM REGULARACTIVITIES 7,682 5,632 29,042 28,308 75,956 57,453 59,936 70,880 153,270 175,678
Costo de Ventas / Cost of sales -4,000 -3,757 -22,662 -15,292 -48,755 -38,690 -62,262 -30,335 -82,056 -70,376GANANCIA (PERDIDA) BRUTA / GROSS PROFIT (LOSS) 3,682 1,875 6,380 13,016 27,201 18,763 -2,326 40,545 71,214 105,302
Gastos de Ventas y Distribución / Sales and distribution expenses -85 -70 -82 -250 -162 -234 -1,904 -863 -3,596 -5,570Gastos de Administración / Overheads -454 -707 -6,709 -9,242 -5,049 -3,950 -5,901 -4,604 -4,433 -4,486Ganancia (Pérdida) de la baja en Activos Financieros medidos al Costo Amortizado / Profit (loss) fromdisposal of financial assets measured at amortized cost 0 0 0 0 0 0 0 0 0 0Otros Ingresos Operativos / Other operating income 45 20 52 43 1,195 702 3,663 1,069 26,396 694Otros Gastos Operativos / Other operating expenses 0 -4 0 0 0 0 -1,157 -4,882 -2,354 -5,224
GANANCIA (PERDIDA) OPERATIVA / OPERATING PROFIT (LOSS) 3,188 1,114 -359 3,567 23,185 15,281 -7,625 31,265 87,227 90,716Ingresos Financieros / Financial income 55 0 39 0 76 40 59 603 711 942Gastos Financieros / Financial expenses -738 -653 -3,262 -4,196 -1,402 -1,697 -1,342 -1,694 -2,042 -2,569Diferencias de Cambio neto / Exchange differences net 0 0 -94 -61 578 -51 518 -77 940 163Participación en los Resultados Netos de Asociadas y Negocios Conjuntos Contabilizados por el Métodode la Participación / Equity in net results of associates and joint ventures booked by the equity method 0 0 0 0 0 0 0 0 0 0Ganancias (Pérdidas) de la Diferencia entre el Valor Libro Anterior y el Valor Justo de ActivosFinancieros Reclasificados Medidos a Valor Razonable / Profits (losses) from the difference between theprevious book value and fair value of financial assets reclassified and measured at fair value 0 0 -32 4,223 0 0 0 0 0 0
RESULTADO ANTES DE IMPUESTO A LAS GANANCIAS / PRE-INCOME TAX RESULT 2,505 461 -3,708 3,533 22,437 13,573 -8,390 30,097 86,836 89,252Gasto por Impuesto a las Ganancias / Income tax expenses 0 0 0 0 -2,194 -1,535 -2,304 -3,025 -12,165 -12,285
GANANCIA (PERDIDA) NETA DE OPERACIONES CONTINUADAS / NET PROFIT (LOSS) FROMCONTINUING TRADES 2,505 461 -3,708 3,533 20,243 12,038 -10,694 27,072 74,671 76,967
Ganancia (Pérdida) Neta del Impuesto a las Ganancias Procedente de Operaciones Discontinuadas / Netprofit (loss) arising from income tax discontinued trades 0 0 0 0 0 0 0 0 0 0
GANANCIA (PERDIDA) NETA DEL EJERCICIO / PERIOD'S NET PROFIT (LOSS) 2,505 461 -3,708 3,533 20,243 12,038 -10,694 27,072 74,671 76,967
INDICADORES FINANCIEROS / FINANCIAL RATIOSLiquidez / Liquid Ratio 3.33 1.55 1.45 2.96 1.22 Rotación de Activos / Gross Sales to Total Assets 0.07 0.03 0.10 0.07 0.09 Solvencia / Solvency 0.28 0.55 0.31 0.29 0.34 Deuda / Patrimonio / Debt / Equity 0.39 1.22 0.45 0.41 0.52 Rentabilidad sobre Ventas Netas % / Return % 32.61 -.- 26.65 -.- 48.72 Rentabilidad sobre Activos % / Return on Assets % 2.23 -.- 2.67 -.- 4.14 Rentabilidad de Patrimonio % / Return on Equity % 3.09 -.- 3.86 -.- 6.28

ESTADOS FINANCIEROS COMPARADOS / COMPARATIVE FINANCIAL STATEMENTS INDUSTRIALES / INDUSTRIALCIFRAS EXPRESADAS EN MILES DE NUEVOS SOLES
EMPRESA/COMPANY
Pesquera Exalmar (*)
Hil. y Tej. San Miguel
Austral Group
Conserv. de las Américas
Agroindustrias AIBCIIU
0500
150101
15127
15127
1513
Pág 24 * Estados Financieros expresados en miles de US$
ESTADO DE SITUACION FINANCIERA / STATEMENT OF FINANCIAL POSITION 31/03/2012 31/12/2011 31/03/2012 31/12/2011 31/03/2012 31/12/2011 31/03/2012 31/12/2011 31/03/2012 31/12/2011
Efectivo y Equivalentes al Efectivo / Cash and cash equivalent 8,273 3,734 6 3 75,404 8,414 1,654 835 7,311 4,833Otros Activos Financieros / Other financial assets 0 0 0 0 0 0 0 0 0 0Cuentas por Cobrar Comerciales (neto) / Trade accounts receivable (net) 27,058 14,525 0 0 81,960 71,348 0 0 11,222 27,389Otras Cuentas por Cobrar (neto) / Other accounts receivable (net) 39,295 32,531 0 0 48,324 50,720 2,695 3,275 8,545 8,760Cuentas por Cobrar a Entidades Relacionadas / Accounts receivable from related companies 4,591 4,466 0 0 25,760 23,096 3,658 4,933 2,665 944Inventarios / Stocks 23,554 48,376 0 0 119,585 184,397 3,420 3,505 30,864 27,591Activos Biológicos / Biological assets 0 0 0 0 0 0 0 0 3,406 2,630Activos por Impuestos a las Ganancias / Assets from income tax 0 0 0 0 0 0 0 0 0 0Gastos Pagados por Anticipado / Prepaid expenses 1,412 1,659 0 0 1,795 1,629 0 0 910 266Otros Activos / Other assets 0 0 0 0 0 0 352 0 0 0Activos no Corrientes o Grupos de Activos para su Disposición Clasificados como Mantenidos para laVenta / Non-current assets or groups of assets for disposal classified as held for sale 0 0 0 0 0 0 0 0 0 0Activos no Corrientes o Grupos de Activos para su Disposición Clasificados como Mantenidos paraDistribuir a los Propietarios / Non-current assets or groups of assets for disposal classified as held forDistribution to owner 0 0 0 0 0 0 0 0 0 0
TOTAL ACTIVOS CORRIENTES / TOTAL CURRENT ASSETS 104,183 105,291 6 3 352,828 339,604 11,779 12,548 64,923 72,413Otros Activos Financieros / Other financial assets 3,064 66,920 0 0 0 0 0 0 1,147 730Inversiones Contabilizadas Aplicando el Método de la Participación / Investments booked using the equitymethod 0 0 0 0 49,076 67,756 0 0 2,730 2,730Cuentas por Cobrar Comerciales / Trade accounts receivable 0 0 0 0 0 0 0 0 0 0Otras Cuentas por Cobrar / Other accounts receivable 0 0 0 0 0 0 0 0 139 246Cuentas por Cobrar a Entidades Relacionadas / Accounts receivable from related companies 0 0 1,325 1,322 0 0 0 0 0 0Activos Biológicos / Biological assets 0 0 0 0 0 0 0 0 30,514 28,856Propiedades de Inversión / Investment property 0 0 0 0 0 0 0 0 0 0Propiedades, Planta y Equipo (neto) / Property, plant and equipment (net) 163,023 161,080 0 0 456,080 456,723 62,928 63,457 102,961 102,220Activos Intangibles (neto) / Intangible assets (net) 95,517 71,952 0 0 250,505 250,271 0 0 2,261 2,360Activos por Impuestos a las Ganancias Diferidos / Assets from deferred income tax 0 0 0 0 0 0 0 0 7,711 7,711Plusvalía / Capital gain 86,297 51,708 0 0 0 0 0 0 0 0Otros Activos / Other assets 0 0 4 21 528 555 0 0 0 0
TOTAL ACTIVOS NO CORRIENTES / TOTAL NON-CURRENT ASSETS 347,901 351,660 1,329 1,343 756,189 775,305 62,928 63,457 147,463 144,853TOTAL DE ACTIVOS / TOTAL ASSETS 452,084 456,951 1,335 1,346 1,109,017 1,114,909 74,707 76,005 212,386 217,266
Otros Pasivos Financieros / Other financial liabilities 77,979 52,898 0 0 58,001 73,865 0 0 22,753 26,937Cuentas por Pagar Comerciales / Trade accounts payable 16,471 31,344 0 0 34,589 33,477 1,998 1,933 12,995 14,330Otras Cuentas por Pagar / Other accounts payable 9,841 27,728 1 8 79,266 81,309 2,438 2,790 7,317 6,603Cuentas por Pagar a Entidades Relacionadas / Accounts payable to related companies 98 6,590 0 0 6,582 7,751 13,763 13,692 95 3,975Provisiones / Provisions 0 0 0 0 0 0 0 0 0 0Pasivos por Impuestos a las Ganancias / Liabilities from income tax 11,912 8,007 0 0 0 0 0 0 0 0Provisión por Beneficios a los Empleados / Provisions for employee profit sharing 3,213 6,828 0 0 0 0 0 0 0 0Otros Pasivos / Other Liabilities 0 0 0 0 0 0 0 0 0 0Pasivos incluidos en Grupos de Activos para su Disposición Clasificados como Mantenidos para la Venta/ Liabilities included in groups of assets for disposal classified as held for sale 0 0 0 0 0 0 0 0 0 0
TOTAL PASIVOS CORRIENTES / TOTAL CURRENT LIABILITIES 119,514 133,395 1 8 178,438 196,402 18,199 18,415 43,160 51,845Otros Pasivos Financieros / Other financial liabilities 80,182 80,400 0 0 167,687 176,511 0 0 28,880 30,170Cuentas por Pagar Comerciales / Trade accounts payable 0 0 0 0 0 0 0 0 0 0Otras Cuentas por Pagar / Other accounts payable 0 0 0 0 0 0 0 0 0 0Cuentas por Pagar a Entidades Relacionadas / Accounts payable to related companies 0 0 0 0 0 0 0 0 0 0Pasivos por Impuestos a las Ganancias Diferidos / Liabilities from deferred income tax 19,934 20,508 0 0 104,159 104,402 6,237 6,926 7,332 7,279Provisiones / Provisions 910 910 0 0 0 0 0 0 0 0Provisión por Beneficios a los Empleados / Provisions for employee profit sharing 0 0 0 0 0 0 0 0 0 0Otros Pasivos / Other Liabilities 0 0 0 0 0 0 0 0 0 0Ingresos Diferidos (netos) / Deferred income (net) 0 0 0 0 0 0 0 0 0 0
TOTAL PASIVOS NO CORRIENTES / TOTAL NON-CURRENT LIABILITIES 101,026 101,818 271,846 280,913 6,237 6,926 36,212 37,449TOTAL PASIVOS / TOTAL LIABILITIES 220,540 235,213 1 8 450,284 477,315 24,436 25,341 79,372 89,294
Capital Emitido / Issued capital 90,336 90,336 213 213 389,135 389,135 37,251 37,251 102,895 98,823Primas de Emisión / Share premium 69,721 69,721 0 0 0 0 0 0 0 0Acciones de Inversión / Investment stock 0 0 1,099 1,099 2 2 0 0 0 0Acciones Propias en Cartera / Treasury shares 0 0 0 0 0 0 0 0 0 0Otras Reservas de Capital / Other capital reserves 3,609 3,609 0 0 56,264 56,264 1,237 1,237 4,684 4,603Resultados Acumulados / Retained earnings 67,878 58,072 22 26 213,332 192,193 11,783 12,176 -1,574 -2,302Otras Reservas de Patrimonio / Other equity reserves 0 0 0 0 0 0 0 0 27,009 26,848
TOTAL PATRIMONIO / TOTAL EQUITY 231,544 221,738 1,334 1,338 658,733 637,594 50,271 50,664 133,014 127,972TOTAL PASIVO Y PATRIMONIO / TOTAL LIABILITIES AND EQUITY 452,084 456,951 1,335 1,346 1,109,017 1,114,909 74,707 76,005 212,386 217,266
ESTADO DE RESULTADOS / INCOME STATEMENT 31/03/2012 31/03/2011 31/03/2012 31/03/2011 31/03/2012 31/03/2011 31/03/2012 31/03/2011 31/03/2012 31/03/2011
Ventas Netas de Bienes / Net sales of goods 71,540 32,454 0 0 236,911 112,677 0 0 18,988 30,687Prestación de Servicios / Services rendered 0 0 0 0 0 0 10,176 11,139 0 0
TOTAL DE INGRESOS DE ACTIVIDADES ORDINARIAS / TOTAL INCOME FROM REGULARACTIVITIES 71,540 32,454 0 0 236,911 112,677 10,176 11,139 18,988 30,687
Costo de Ventas / Cost of sales -50,012 -25,371 -7 -7 -150,450 -87,638 -9,500 -9,118 -13,890 -24,211GANANCIA (PERDIDA) BRUTA / GROSS PROFIT (LOSS) 21,528 7,083 -7 -7 86,461 25,039 676 2,021 5,098 6,476
Gastos de Ventas y Distribución / Sales and distribution expenses -3,734 -1,024 0 0 -16,685 -8,683 0 0 -1,958 -2,839Gastos de Administración / Overheads -1,363 -1,002 0 0 -14,072 -10,510 -1,487 -1,544 -2,186 -2,202Ganancia (Pérdida) de la baja en Activos Financieros medidos al Costo Amortizado / Profit (loss) fromdisposal of financial assets measured at amortized cost 0 0 0 0 0 0 0 0 0 0Otros Ingresos Operativos / Other operating income 2,574 478 0 0 11,943 5,202 248 3,074 30 73Otros Gastos Operativos / Other operating expenses -2,131 -354 0 0 -33,560 -5,120 -11 -2,865 0 0
GANANCIA (PERDIDA) OPERATIVA / OPERATING PROFIT (LOSS) 16,874 5,181 -7 -7 34,087 5,928 -574 686 984 1,508Ingresos Financieros / Financial income 2 76 21 9 59 37 0 0 0 0Gastos Financieros / Financial expenses -2,074 -1,214 0 0 -2,381 -2,130 -13 -317 -749 -850Diferencias de Cambio neto / Exchange differences net -99 -479 0 0 1,285 -145 3 19 627 257Participación en los Resultados Netos de Asociadas y Negocios Conjuntos Contabilizados por el Métodode la Participación / Equity in net results of associates and joint ventures booked by the equity method 0 0 0 0 0 0 0 0 0 0Ganancias (Pérdidas) de la Diferencia entre el Valor Libro Anterior y el Valor Justo de ActivosFinancieros Reclasificados Medidos a Valor Razonable / Profits (losses) from the difference between theprevious book value and fair value of financial assets reclassified and measured at fair value 0 0 0 0 0 0 0 0 0 0
RESULTADO ANTES DE IMPUESTO A LAS GANANCIAS / PRE-INCOME TAX RESULT 14,703 3,564 14 2 33,050 3,690 -584 388 862 915Gasto por Impuesto a las Ganancias / Income tax expenses -4,897 -876 0 0 -11,911 -1,271 191 -130 -53 -66
GANANCIA (PERDIDA) NETA DE OPERACIONES CONTINUADAS / NET PROFIT (LOSS) FROMCONTINUING TRADES 9,806 2,688 14 2 21,139 2,419 -393 258 809 849
Ganancia (Pérdida) Neta del Impuesto a las Ganancias Procedente de Operaciones Discontinuadas / Netprofit (loss) arising from income tax discontinued trades 0 0 0 0 0 0 0 0 0 0
GANANCIA (PERDIDA) NETA DEL EJERCICIO / PERIOD'S NET PROFIT (LOSS) 9,806 2,688 14 2 21,139 2,419 -393 258 809 849
INDICADORES FINANCIEROS / FINANCIAL RATIOSLiquidez / Liquid Ratio 0.87 6.00 1.98 0.65 1.50 Rotación de Activos / Gross Sales to Total Assets 0.16 0.00 0.21 0.14 0.09 Solvencia / Solvency 0.49 0.00 0.41 0.33 0.37 Deuda / Patrimonio / Debt / Equity 0.95 0.00 0.68 0.49 0.60 Rentabilidad sobre Ventas Netas % / Return % 13.71 n.d. 8.92 -.- 4.26 Rentabilidad sobre Activos % / Return on Assets % 2.17 1.05 1.91 -.- 0.38 Rentabilidad de Patrimonio % / Return on Equity % 4.24 1.05 3.21 -.- 0.61
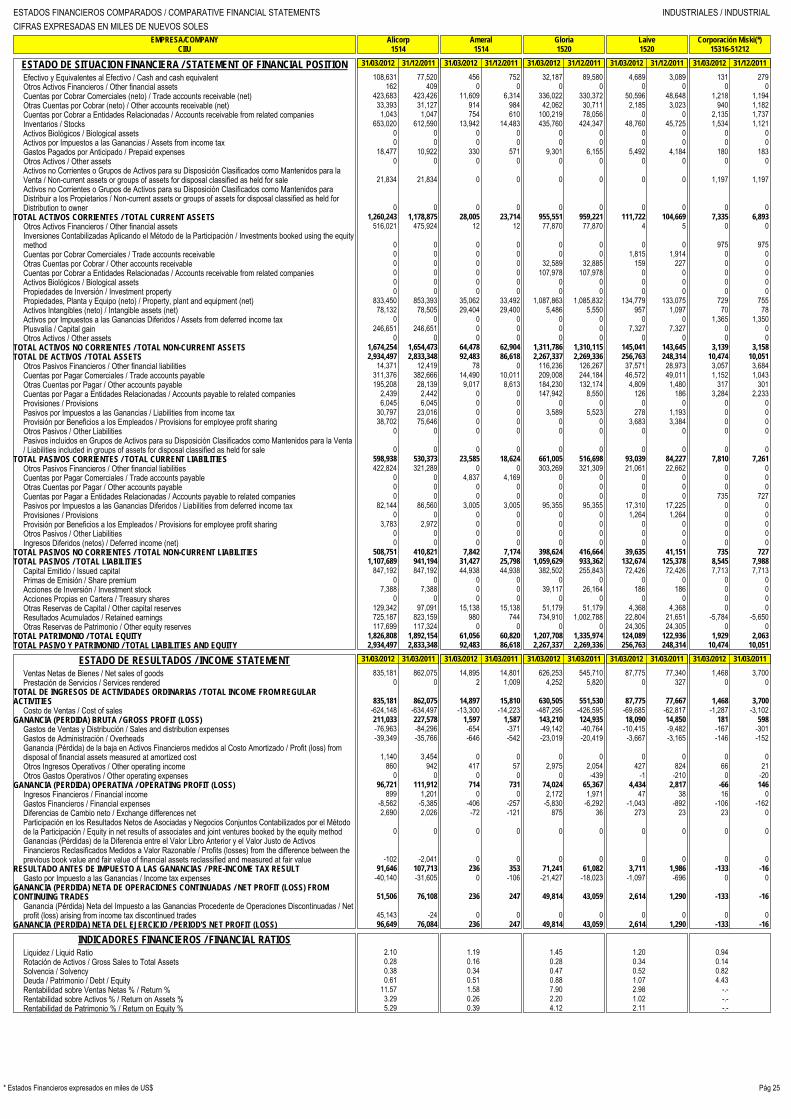
ESTADOS FINANCIEROS COMPARADOS / COMPARATIVE FINANCIAL STATEMENTS INDUSTRIALES / INDUSTRIALCIFRAS EXPRESADAS EN MILES DE NUEVOS SOLES
EMPRESA/COMPANY
Alicorp
Ameral
Gloria
Laive
Corporación Miski(*)CIIU
1514
1514
1520
1520
15316-51212
Pág 25* Estados Financieros expresados en miles de US$
ESTADO DE SITUACION FINANCIERA / STATEMENT OF FINANCIAL POSITION 31/03/2012 31/12/2011 31/03/2012 31/12/2011 31/03/2012 31/12/2011 31/03/2012 31/12/2011 31/03/2012 31/12/2011
Efectivo y Equivalentes al Efectivo / Cash and cash equivalent 108,631 77,520 456 752 32,187 89,580 4,689 3,089 131 279Otros Activos Financieros / Other financial assets 162 409 0 0 0 0 0 0 0 0Cuentas por Cobrar Comerciales (neto) / Trade accounts receivable (net) 423,683 423,426 11,609 6,314 336,022 330,372 50,596 48,648 1,218 1,194Otras Cuentas por Cobrar (neto) / Other accounts receivable (net) 33,393 31,127 914 984 42,062 30,711 2,185 3,023 940 1,182Cuentas por Cobrar a Entidades Relacionadas / Accounts receivable from related companies 1,043 1,047 754 610 100,219 78,056 0 0 2,135 1,737Inventarios / Stocks 653,020 612,590 13,942 14,483 435,760 424,347 48,760 45,725 1,534 1,121Activos Biológicos / Biological assets 0 0 0 0 0 0 0 0 0 0Activos por Impuestos a las Ganancias / Assets from income tax 0 0 0 0 0 0 0 0 0 0Gastos Pagados por Anticipado / Prepaid expenses 18,477 10,922 330 571 9,301 6,155 5,492 4,184 180 183Otros Activos / Other assets 0 0 0 0 0 0 0 0 0 0Activos no Corrientes o Grupos de Activos para su Disposición Clasificados como Mantenidos para laVenta / Non-current assets or groups of assets for disposal classified as held for sale 21,834 21,834 0 0 0 0 0 0 1,197 1,197Activos no Corrientes o Grupos de Activos para su Disposición Clasificados como Mantenidos paraDistribuir a los Propietarios / Non-current assets or groups of assets for disposal classified as held forDistribution to owner 0 0 0 0 0 0 0 0 0 0
TOTAL ACTIVOS CORRIENTES / TOTAL CURRENT ASSETS 1,260,243 1,178,875 28,005 23,714 955,551 959,221 111,722 104,669 7,335 6,893Otros Activos Financieros / Other financial assets 516,021 475,924 12 12 77,870 77,870 4 5 0 0Inversiones Contabilizadas Aplicando el Método de la Participación / Investments booked using the equitymethod 0 0 0 0 0 0 0 0 975 975Cuentas por Cobrar Comerciales / Trade accounts receivable 0 0 0 0 0 0 1,815 1,914 0 0Otras Cuentas por Cobrar / Other accounts receivable 0 0 0 0 32,589 32,885 159 227 0 0Cuentas por Cobrar a Entidades Relacionadas / Accounts receivable from related companies 0 0 0 0 107,978 107,978 0 0 0 0Activos Biológicos / Biological assets 0 0 0 0 0 0 0 0 0 0Propiedades de Inversión / Investment property 0 0 0 0 0 0 0 0 0 0Propiedades, Planta y Equipo (neto) / Property, plant and equipment (net) 833,450 853,393 35,062 33,492 1,087,863 1,085,832 134,779 133,075 729 755Activos Intangibles (neto) / Intangible assets (net) 78,132 78,505 29,404 29,400 5,486 5,550 957 1,097 70 78Activos por Impuestos a las Ganancias Diferidos / Assets from deferred income tax 0 0 0 0 0 0 0 0 1,365 1,350Plusvalía / Capital gain 246,651 246,651 0 0 0 0 7,327 7,327 0 0Otros Activos / Other assets 0 0 0 0 0 0 0 0 0 0
TOTAL ACTIVOS NO CORRIENTES / TOTAL NON-CURRENT ASSETS 1,674,254 1,654,473 64,478 62,904 1,311,786 1,310,115 145,041 143,645 3,139 3,158TOTAL DE ACTIVOS / TOTAL ASSETS 2,934,497 2,833,348 92,483 86,618 2,267,337 2,269,336 256,763 248,314 10,474 10,051
Otros Pasivos Financieros / Other financial liabilities 14,371 12,419 78 0 116,236 126,267 37,571 28,973 3,057 3,684Cuentas por Pagar Comerciales / Trade accounts payable 311,376 382,666 14,490 10,011 209,008 244,184 46,572 49,011 1,152 1,043Otras Cuentas por Pagar / Other accounts payable 195,208 28,139 9,017 8,613 184,230 132,174 4,809 1,480 317 301Cuentas por Pagar a Entidades Relacionadas / Accounts payable to related companies 2,439 2,442 0 0 147,942 8,550 126 186 3,284 2,233Provisiones / Provisions 6,045 6,045 0 0 0 0 0 0 0 0Pasivos por Impuestos a las Ganancias / Liabilities from income tax 30,797 23,016 0 0 3,589 5,523 278 1,193 0 0Provisión por Beneficios a los Empleados / Provisions for employee profit sharing 38,702 75,646 0 0 0 0 3,683 3,384 0 0Otros Pasivos / Other Liabilities 0 0 0 0 0 0 0 0 0 0Pasivos incluidos en Grupos de Activos para su Disposición Clasificados como Mantenidos para la Venta/ Liabilities included in groups of assets for disposal classified as held for sale 0 0 0 0 0 0 0 0 0 0
TOTAL PASIVOS CORRIENTES / TOTAL CURRENT LIABILITIES 598,938 530,373 23,585 18,624 661,005 516,698 93,039 84,227 7,810 7,261Otros Pasivos Financieros / Other financial liabilities 422,824 321,289 0 0 303,269 321,309 21,061 22,662 0 0Cuentas por Pagar Comerciales / Trade accounts payable 0 0 4,837 4,169 0 0 0 0 0 0Otras Cuentas por Pagar / Other accounts payable 0 0 0 0 0 0 0 0 0 0Cuentas por Pagar a Entidades Relacionadas / Accounts payable to related companies 0 0 0 0 0 0 0 0 735 727Pasivos por Impuestos a las Ganancias Diferidos / Liabilities from deferred income tax 82,144 86,560 3,005 3,005 95,355 95,355 17,310 17,225 0 0Provisiones / Provisions 0 0 0 0 0 0 1,264 1,264 0 0Provisión por Beneficios a los Empleados / Provisions for employee profit sharing 3,783 2,972 0 0 0 0 0 0 0 0Otros Pasivos / Other Liabilities 0 0 0 0 0 0 0 0 0 0Ingresos Diferidos (netos) / Deferred income (net) 0 0 0 0 0 0 0 0 0 0
TOTAL PASIVOS NO CORRIENTES / TOTAL NON-CURRENT LIABILITIES 508,751 410,821 7,842 7,174 398,624 416,664 39,635 41,151 735 727TOTAL PASIVOS / TOTAL LIABILITIES 1,107,689 941,194 31,427 25,798 1,059,629 933,362 132,674 125,378 8,545 7,988
Capital Emitido / Issued capital 847,192 847,192 44,938 44,938 382,502 255,843 72,426 72,426 7,713 7,713Primas de Emisión / Share premium 0 0 0 0 0 0 0 0 0 0Acciones de Inversión / Investment stock 7,388 7,388 0 0 39,117 26,164 186 186 0 0Acciones Propias en Cartera / Treasury shares 0 0 0 0 0 0 0 0 0 0Otras Reservas de Capital / Other capital reserves 129,342 97,091 15,138 15,138 51,179 51,179 4,368 4,368 0 0Resultados Acumulados / Retained earnings 725,187 823,159 980 744 734,910 1,002,788 22,804 21,651 -5,784 -5,650Otras Reservas de Patrimonio / Other equity reserves 117,699 117,324 0 0 0 0 24,305 24,305 0 0
TOTAL PATRIMONIO / TOTAL EQUITY 1,826,808 1,892,154 61,056 60,820 1,207,708 1,335,974 124,089 122,936 1,929 2,063TOTAL PASIVO Y PATRIMONIO / TOTAL LIABILITIES AND EQUITY 2,934,497 2,833,348 92,483 86,618 2,267,337 2,269,336 256,763 248,314 10,474 10,051
ESTADO DE RESULTADOS / INCOME STATEMENT 31/03/2012 31/03/2011 31/03/2012 31/03/2011 31/03/2012 31/03/2011 31/03/2012 31/03/2011 31/03/2012 31/03/2011
Ventas Netas de Bienes / Net sales of goods 835,181 862,075 14,895 14,801 626,253 545,710 87,775 77,340 1,468 3,700Prestación de Servicios / Services rendered 0 0 2 1,009 4,252 5,820 0 327 0 0
TOTAL DE INGRESOS DE ACTIVIDADES ORDINARIAS / TOTAL INCOME FROM REGULARACTIVITIES 835,181 862,075 14,897 15,810 630,505 551,530 87,775 77,667 1,468 3,700
Costo de Ventas / Cost of sales -624,148 -634,497 -13,300 -14,223 -487,295 -426,595 -69,685 -62,817 -1,287 -3,102GANANCIA (PERDIDA) BRUTA / GROSS PROFIT (LOSS) 211,033 227,578 1,597 1,587 143,210 124,935 18,090 14,850 181 598
Gastos de Ventas y Distribución / Sales and distribution expenses -76,963 -84,296 -654 -371 -49,142 -40,764 -10,415 -9,482 -167 -301Gastos de Administración / Overheads -39,349 -35,766 -646 -542 -23,019 -20,419 -3,667 -3,165 -146 -152Ganancia (Pérdida) de la baja en Activos Financieros medidos al Costo Amortizado / Profit (loss) fromdisposal of financial assets measured at amortized cost 1,140 3,454 0 0 0 0 0 0 0 0Otros Ingresos Operativos / Other operating income 860 942 417 57 2,975 2,054 427 824 66 21Otros Gastos Operativos / Other operating expenses 0 0 0 0 0 -439 -1 -210 0 -20
GANANCIA (PERDIDA) OPERATIVA / OPERATING PROFIT (LOSS) 96,721 111,912 714 731 74,024 65,367 4,434 2,817 -66 146Ingresos Financieros / Financial income 899 1,201 0 0 2,172 1,971 47 38 16 0Gastos Financieros / Financial expenses -8,562 -5,385 -406 -257 -5,830 -6,292 -1,043 -892 -106 -162Diferencias de Cambio neto / Exchange differences net 2,690 2,026 -72 -121 875 36 273 23 23 0Participación en los Resultados Netos de Asociadas y Negocios Conjuntos Contabilizados por el Métodode la Participación / Equity in net results of associates and joint ventures booked by the equity method 0 0 0 0 0 0 0 0 0 0Ganancias (Pérdidas) de la Diferencia entre el Valor Libro Anterior y el Valor Justo de ActivosFinancieros Reclasificados Medidos a Valor Razonable / Profits (losses) from the difference between theprevious book value and fair value of financial assets reclassified and measured at fair value -102 -2,041 0 0 0 0 0 0 0 0
RESULTADO ANTES DE IMPUESTO A LAS GANANCIAS / PRE-INCOME TAX RESULT 91,646 107,713 236 353 71,241 61,082 3,711 1,986 -133 -16Gasto por Impuesto a las Ganancias / Income tax expenses -40,140 -31,605 0 -106 -21,427 -18,023 -1,097 -696 0 0
GANANCIA (PERDIDA) NETA DE OPERACIONES CONTINUADAS / NET PROFIT (LOSS) FROMCONTINUING TRADES 51,506 76,108 236 247 49,814 43,059 2,614 1,290 -133 -16
Ganancia (Pérdida) Neta del Impuesto a las Ganancias Procedente de Operaciones Discontinuadas / Netprofit (loss) arising from income tax discontinued trades 45,143 -24 0 0 0 0 0 0 0 0
GANANCIA (PERDIDA) NETA DEL EJERCICIO / PERIOD'S NET PROFIT (LOSS) 96,649 76,084 236 247 49,814 43,059 2,614 1,290 -133 -16
INDICADORES FINANCIEROS / FINANCIAL RATIOSLiquidez / Liquid Ratio 2.10 1.19 1.45 1.20 0.94 Rotación de Activos / Gross Sales to Total Assets 0.28 0.16 0.28 0.34 0.14 Solvencia / Solvency 0.38 0.34 0.47 0.52 0.82 Deuda / Patrimonio / Debt / Equity 0.61 0.51 0.88 1.07 4.43 Rentabilidad sobre Ventas Netas % / Return % 11.57 1.58 7.90 2.98 -.- Rentabilidad sobre Activos % / Return on Assets % 3.29 0.26 2.20 1.02 -.- Rentabilidad de Patrimonio % / Return on Equity % 5.29 0.39 4.12 2.11 -.-

ESTADOS FINANCIEROS COMPARADOS / COMPARATIVE FINANCIAL STATEMENTS INDUSTRIALES / INDUSTRIALCIFRAS EXPRESADAS EN MILES DE NUEVOS SOLES
EMPRESA/COMPANY
Cervecería San Juan
UCP Backus & Johnston
Corporación Lindley
BAT Holdings
CREDITEXCIIU
1553
1553-01
1554-02
1600
1711
Pág 26 * Estados Financieros expresados en miles de US$
ESTADO DE SITUACION FINANCIERA / STATEMENT OF FINANCIAL POSITION 31/03/2012 31/12/2011 31/03/2012 31/12/2011 31/03/2012 31/12/2011 31/03/2012 31/12/2011 31/03/2012 31/12/2011
Efectivo y Equivalentes al Efectivo / Cash and cash equivalent 9,831 11,283 76,298 122,594 196,408 352,334 5,116 2,463 18,473 24,171Otros Activos Financieros / Other financial assets 0 0 0 0 148,460 0 0 0 492 962Cuentas por Cobrar Comerciales (neto) / Trade accounts receivable (net) 9,378 17,008 122,342 226,065 151,239 152,551 0 0 39,180 45,483Otras Cuentas por Cobrar (neto) / Other accounts receivable (net) 10,933 4,951 58,314 89,100 24,561 36,610 43 40 22,320 19,250Cuentas por Cobrar a Entidades Relacionadas / Accounts receivable from related companies 43,853 73,708 111,833 159,619 68,485 79,464 74,974 55,240 604 256Inventarios / Stocks 24,218 21,739 172,400 189,698 279,068 204,356 3,835 2,430 165,491 151,836Activos Biológicos / Biological assets 0 0 0 0 0 0 0 0 0 0Activos por Impuestos a las Ganancias / Assets from income tax 0 0 0 0 0 0 0 0 0 0Gastos Pagados por Anticipado / Prepaid expenses 663 598 12,597 22,759 14,268 11,790 2,892 531 6,683 1,715Otros Activos / Other assets 0 0 0 0 0 0 0 600 0 0Activos no Corrientes o Grupos de Activos para su Disposición Clasificados como Mantenidos para laVenta / Non-current assets or groups of assets for disposal classified as held for sale 0 0 18,180 26,705 0 0 30 30 0 0Activos no Corrientes o Grupos de Activos para su Disposición Clasificados como Mantenidos paraDistribuir a los Propietarios / Non-current assets or groups of assets for disposal classified as held forDistribution to owner 0 0 0 0 0 0 0 0 0 0
TOTAL ACTIVOS CORRIENTES / TOTAL CURRENT ASSETS 98,876 129,287 571,964 836,540 882,489 837,105 86,890 61,334 253,243 243,673Otros Activos Financieros / Other financial assets 31 31 5,847 6,754 0 0 0 0 0 0Inversiones Contabilizadas Aplicando el Método de la Participación / Investments booked using the equitymethod 5,129 5,129 285,988 282,571 7,301 7,301 0 0 4,562 4,562Cuentas por Cobrar Comerciales / Trade accounts receivable 0 0 0 0 0 0 0 0 0 0Otras Cuentas por Cobrar / Other accounts receivable 0 0 0 0 21,613 21,037 0 0 0 0Cuentas por Cobrar a Entidades Relacionadas / Accounts receivable from related companies 0 0 0 0 0 0 0 0 0 0Activos Biológicos / Biological assets 0 0 0 0 0 0 0 0 0 0Propiedades de Inversión / Investment property 0 0 0 0 104,761 104,859 0 0 0 0Propiedades, Planta y Equipo (neto) / Property, plant and equipment (net) 146,644 142,324 1,822,943 1,760,894 1,133,268 1,074,831 21,992 22,198 228,009 233,525Activos Intangibles (neto) / Intangible assets (net) 0 0 497,375 485,290 1,223 1,372 0 0 603 647Activos por Impuestos a las Ganancias Diferidos / Assets from deferred income tax 0 0 0 0 0 0 724 156 3,140 3,189Plusvalía / Capital gain 0 0 0 0 305,555 305,555 0 0 0 0Otros Activos / Other assets 0 0 0 0 2,177 2,416 0 0 0 0
TOTAL ACTIVOS NO CORRIENTES / TOTAL NON-CURRENT ASSETS 151,804 147,484 2,612,153 2,535,509 1,575,898 1,517,371 22,716 22,354 236,314 241,923TOTAL DE ACTIVOS / TOTAL ASSETS 250,680 276,771 3,184,117 3,372,049 2,458,387 2,354,476 109,606 83,688 489,557 485,596
Otros Pasivos Financieros / Other financial liabilities 0 0 230,000 110,623 33,218 42,076 25,452 35,254 50,531 25,434Cuentas por Pagar Comerciales / Trade accounts payable 22,020 11,138 289,525 235,550 280,904 253,450 18,188 2,690 7,483 8,336Otras Cuentas por Pagar / Other accounts payable 19,707 23,913 291,280 367,006 121,207 85,996 5,401 3,645 3,802 7,110Cuentas por Pagar a Entidades Relacionadas / Accounts payable to related companies 48,272 60,591 43,966 31,005 117,483 93,919 8,389 13,164 1,067 1,136Provisiones / Provisions 2,598 6,799 46,442 105,235 80,272 52,049 0 0 0 0Pasivos por Impuestos a las Ganancias / Liabilities from income tax 4,058 6,892 41,050 77,084 6,428 13,835 5,849 2,674 285 6,863Provisión por Beneficios a los Empleados / Provisions for employee profit sharing 531 663 9,454 10,488 0 0 41 19 5,789 9,096Otros Pasivos / Other Liabilities 0 0 16,737 14,661 3,206 16,287 0 0 0 0Pasivos incluidos en Grupos de Activos para su Disposición Clasificados como Mantenidos para la Venta/ Liabilities included in groups of assets for disposal classified as held for sale 0 0 0 0 0 0 0 0 0 0
TOTAL PASIVOS CORRIENTES / TOTAL CURRENT LIABILITIES 97,186 109,996 968,454 951,652 642,718 557,612 63,320 57,446 68,957 57,975Otros Pasivos Financieros / Other financial liabilities 0 0 0 0 1,031,294 1,048,637 6,635 6,833 5,932 8,086Cuentas por Pagar Comerciales / Trade accounts payable 0 0 0 0 2,930 2,099 0 0 0 0Otras Cuentas por Pagar / Other accounts payable 14,790 14,704 147,201 144,224 0 0 0 0 0 0Cuentas por Pagar a Entidades Relacionadas / Accounts payable to related companies 0 0 0 0 0 0 5,847 5,933 0 0Pasivos por Impuestos a las Ganancias Diferidos / Liabilities from deferred income tax 8,778 9,682 227,878 230,680 38,968 35,102 0 0 42,981 43,153Provisiones / Provisions 0 0 0 0 0 0 0 0 0 0Provisión por Beneficios a los Empleados / Provisions for employee profit sharing 881 538 37,812 33,033 0 0 0 0 0 0Otros Pasivos / Other Liabilities 0 0 0 0 0 0 0 0 0 0Ingresos Diferidos (netos) / Deferred income (net) 0 0 0 0 0 0 0 0 0 0
TOTAL PASIVOS NO CORRIENTES / TOTAL NON-CURRENT LIABILITIES 24,449 24,924 412,891 407,937 1,073,192 1,085,838 12,482 12,766 48,913 51,239TOTAL PASIVOS / TOTAL LIABILITIES 121,635 134,920 1,381,345 1,359,589 1,715,910 1,643,450 75,802 70,212 117,870 109,214
Capital Emitido / Issued capital 84,406 84,406 780,722 780,722 580,981 580,981 7,817 7,817 163,195 163,195Primas de Emisión / Share premium 0 0 8,784 6,526 0 0 0 0 49 49Acciones de Inversión / Investment stock 13,677 13,677 569,515 569,515 71,966 71,966 3,651 3,651 10,476 10,476Acciones Propias en Cartera / Treasury shares 0 0 -1,737 -1,737 0 0 -7,132 -7,132 0 0Otras Reservas de Capital / Other capital reserves 17,059 17,548 243,912 244,242 8,682 4,450 1,563 1,563 18,117 14,179Resultados Acumulados / Retained earnings 13,860 26,061 215,808 423,659 67,029 42,316 27,905 7,577 179,850 188,483Otras Reservas de Patrimonio / Other equity reserves 43 159 -14,232 -10,467 13,819 11,313 0 0 0 0
TOTAL PATRIMONIO / TOTAL EQUITY 129,045 141,851 1,802,772 2,012,460 742,477 711,026 33,804 13,476 371,687 376,382TOTAL PASIVO Y PATRIMONIO / TOTAL LIABILITIES AND EQUITY 250,680 276,771 3,184,117 3,372,049 2,458,387 2,354,476 109,606 83,688 489,557 485,596
ESTADO DE RESULTADOS / INCOME STATEMENT 31/03/2012 31/03/2011 31/03/2012 31/03/2011 31/03/2012 31/03/2011 31/03/2012 31/03/2011 31/03/2012 31/03/2011
Ventas Netas de Bienes / Net sales of goods 87,869 79,434 806,226 684,754 558,808 455,078 104,269 76,886 56,841 66,594Prestación de Servicios / Services rendered 369 574 16,531 17,556 0 0 0 0 125 108
TOTAL DE INGRESOS DE ACTIVIDADES ORDINARIAS / TOTAL INCOME FROM REGULARACTIVITIES 88,238 80,008 822,757 702,310 558,808 455,078 104,269 76,886 56,966 66,702
Costo de Ventas / Cost of sales -29,516 -31,171 -228,491 -196,390 -377,480 -323,473 -67,906 -55,067 -46,233 -46,117GANANCIA (PERDIDA) BRUTA / GROSS PROFIT (LOSS) 58,722 48,837 594,266 505,920 181,328 131,605 36,363 21,819 10,733 20,585
Gastos de Ventas y Distribución / Sales and distribution expenses -35,011 -33,151 -250,015 -231,906 -92,698 -72,367 0 0 -3,713 -4,001Gastos de Administración / Overheads -4,433 -5,582 -110,119 -88,040 -22,309 -16,495 -5,801 -1,918 -4,511 -5,541Ganancia (Pérdida) de la baja en Activos Financieros medidos al Costo Amortizado / Profit (loss) fromdisposal of financial assets measured at amortized cost 0 0 0 0 0 0 0 0 4,003 7,167Otros Ingresos Operativos / Other operating income 97 1,509 47,802 16,796 10,999 22,838 10 10 1,775 1,843Otros Gastos Operativos / Other operating expenses -510 -255 -19,785 -6,827 -21,018 -12,884 -4 -368 -176 -511
GANANCIA (PERDIDA) OPERATIVA / OPERATING PROFIT (LOSS) 18,865 11,358 262,149 195,943 56,302 52,697 30,568 19,543 8,111 19,542Ingresos Financieros / Financial income 886 466 39,716 25,332 1,591 1,878 12 3 310 360Gastos Financieros / Financial expenses -79 -219 -3,809 -4,992 -20,149 -11,546 -682 -311 -761 -377Diferencias de Cambio neto / Exchange differences net 298 -136 0 0 10,441 1,825 148 113 232 809Participación en los Resultados Netos de Asociadas y Negocios Conjuntos Contabilizados por el Métodode la Participación / Equity in net results of associates and joint ventures booked by the equity method 0 0 0 0 0 0 0 0 0 0Ganancias (Pérdidas) de la Diferencia entre el Valor Libro Anterior y el Valor Justo de ActivosFinancieros Reclasificados Medidos a Valor Razonable / Profits (losses) from the difference between theprevious book value and fair value of financial assets reclassified and measured at fair value 0 0 0 0 257 -3,566 0 0 114 -1,361
RESULTADO ANTES DE IMPUESTO A LAS GANANCIAS / PRE-INCOME TAX RESULT 19,970 11,469 298,056 216,283 48,442 41,288 30,046 19,348 8,006 18,973Gasto por Impuesto a las Ganancias / Income tax expenses -6,110 -3,441 -82,248 -59,455 -19,497 -13,763 -9,718 -5,835 -1,413 -4,959
GANANCIA (PERDIDA) NETA DE OPERACIONES CONTINUADAS / NET PROFIT (LOSS) FROMCONTINUING TRADES 13,860 8,028 215,808 156,828 28,945 27,525 20,328 13,513 6,593 14,014
Ganancia (Pérdida) Neta del Impuesto a las Ganancias Procedente de Operaciones Discontinuadas / Netprofit (loss) arising from income tax discontinued trades 0 0 0 0 0 0 0 0 0 0
GANANCIA (PERDIDA) NETA DEL EJERCICIO / PERIOD'S NET PROFIT (LOSS) 13,860 8,028 215,808 156,828 28,945 27,525 20,328 13,513 6,593 14,014
INDICADORES FINANCIEROS / FINANCIAL RATIOSLiquidez / Liquid Ratio 1.02 0.59 1.37 1.37 3.67 Rotación de Activos / Gross Sales to Total Assets 0.35 0.26 0.23 0.95 0.12 Solvencia / Solvency 0.49 0.43 0.70 0.69 0.24 Deuda / Patrimonio / Debt / Equity 0.94 0.77 2.31 2.24 0.32 Rentabilidad sobre Ventas Netas % / Return % 15.71 26.23 5.18 19.50 11.57 Rentabilidad sobre Activos % / Return on Assets % 5.53 6.78 1.18 18.55 1.35 Rentabilidad de Patrimonio % / Return on Equity % 10.74 11.97 3.90 60.13 1.77
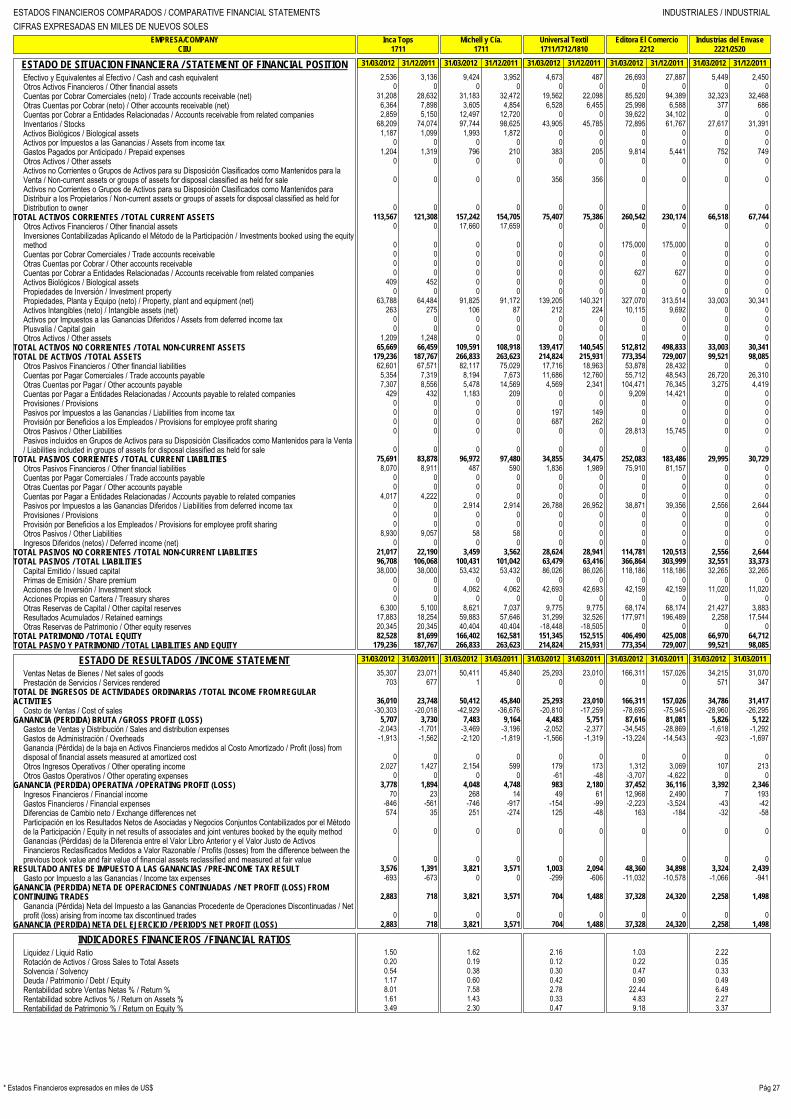
ESTADOS FINANCIEROS COMPARADOS / COMPARATIVE FINANCIAL STATEMENTS INDUSTRIALES / INDUSTRIALCIFRAS EXPRESADAS EN MILES DE NUEVOS SOLES
EMPRESA/COMPANY
Inca Tops
Michell y Cía.
Universal Textil
Editora El Comercio
Industrias del EnvaseCIIU
1711
1711
1711/1712/1810
2212
2221/2520
Pág 27* Estados Financieros expresados en miles de US$
ESTADO DE SITUACION FINANCIERA / STATEMENT OF FINANCIAL POSITION 31/03/2012 31/12/2011 31/03/2012 31/12/2011 31/03/2012 31/12/2011 31/03/2012 31/12/2011 31/03/2012 31/12/2011
Efectivo y Equivalentes al Efectivo / Cash and cash equivalent 2,536 3,136 9,424 3,952 4,673 487 26,693 27,887 5,449 2,450Otros Activos Financieros / Other financial assets 0 0 0 0 0 0 0 0 0 0Cuentas por Cobrar Comerciales (neto) / Trade accounts receivable (net) 31,208 28,632 31,183 32,472 19,562 22,098 85,520 94,389 32,323 32,468Otras Cuentas por Cobrar (neto) / Other accounts receivable (net) 6,364 7,898 3,605 4,854 6,528 6,455 25,998 6,588 377 686Cuentas por Cobrar a Entidades Relacionadas / Accounts receivable from related companies 2,859 5,150 12,497 12,720 0 0 39,622 34,102 0 0Inventarios / Stocks 68,209 74,074 97,744 98,625 43,905 45,785 72,895 61,767 27,617 31,391Activos Biológicos / Biological assets 1,187 1,099 1,993 1,872 0 0 0 0 0 0Activos por Impuestos a las Ganancias / Assets from income tax 0 0 0 0 0 0 0 0 0 0Gastos Pagados por Anticipado / Prepaid expenses 1,204 1,319 796 210 383 205 9,814 5,441 752 749Otros Activos / Other assets 0 0 0 0 0 0 0 0 0 0Activos no Corrientes o Grupos de Activos para su Disposición Clasificados como Mantenidos para laVenta / Non-current assets or groups of assets for disposal classified as held for sale 0 0 0 0 356 356 0 0 0 0Activos no Corrientes o Grupos de Activos para su Disposición Clasificados como Mantenidos paraDistribuir a los Propietarios / Non-current assets or groups of assets for disposal classified as held forDistribution to owner 0 0 0 0 0 0 0 0 0 0
TOTAL ACTIVOS CORRIENTES / TOTAL CURRENT ASSETS 113,567 121,308 157,242 154,705 75,407 75,386 260,542 230,174 66,518 67,744Otros Activos Financieros / Other financial assets 0 0 17,660 17,659 0 0 0 0 0 0Inversiones Contabilizadas Aplicando el Método de la Participación / Investments booked using the equitymethod 0 0 0 0 0 0 175,000 175,000 0 0Cuentas por Cobrar Comerciales / Trade accounts receivable 0 0 0 0 0 0 0 0 0 0Otras Cuentas por Cobrar / Other accounts receivable 0 0 0 0 0 0 0 0 0 0Cuentas por Cobrar a Entidades Relacionadas / Accounts receivable from related companies 0 0 0 0 0 0 627 627 0 0Activos Biológicos / Biological assets 409 452 0 0 0 0 0 0 0 0Propiedades de Inversión / Investment property 0 0 0 0 0 0 0 0 0 0Propiedades, Planta y Equipo (neto) / Property, plant and equipment (net) 63,788 64,484 91,825 91,172 139,205 140,321 327,070 313,514 33,003 30,341Activos Intangibles (neto) / Intangible assets (net) 263 275 106 87 212 224 10,115 9,692 0 0Activos por Impuestos a las Ganancias Diferidos / Assets from deferred income tax 0 0 0 0 0 0 0 0 0 0Plusvalía / Capital gain 0 0 0 0 0 0 0 0 0 0Otros Activos / Other assets 1,209 1,248 0 0 0 0 0 0 0 0
TOTAL ACTIVOS NO CORRIENTES / TOTAL NON-CURRENT ASSETS 65,669 66,459 109,591 108,918 139,417 140,545 512,812 498,833 33,003 30,341TOTAL DE ACTIVOS / TOTAL ASSETS 179,236 187,767 266,833 263,623 214,824 215,931 773,354 729,007 99,521 98,085
Otros Pasivos Financieros / Other financial liabilities 62,601 67,571 82,117 75,029 17,716 18,963 53,878 28,432 0 0Cuentas por Pagar Comerciales / Trade accounts payable 5,354 7,319 8,194 7,673 11,686 12,760 55,712 48,543 26,720 26,310Otras Cuentas por Pagar / Other accounts payable 7,307 8,556 5,478 14,569 4,569 2,341 104,471 76,345 3,275 4,419Cuentas por Pagar a Entidades Relacionadas / Accounts payable to related companies 429 432 1,183 209 0 0 9,209 14,421 0 0Provisiones / Provisions 0 0 0 0 0 0 0 0 0 0Pasivos por Impuestos a las Ganancias / Liabilities from income tax 0 0 0 0 197 149 0 0 0 0Provisión por Beneficios a los Empleados / Provisions for employee profit sharing 0 0 0 0 687 262 0 0 0 0Otros Pasivos / Other Liabilities 0 0 0 0 0 0 28,813 15,745 0 0Pasivos incluidos en Grupos de Activos para su Disposición Clasificados como Mantenidos para la Venta/ Liabilities included in groups of assets for disposal classified as held for sale 0 0 0 0 0 0 0 0 0 0
TOTAL PASIVOS CORRIENTES / TOTAL CURRENT LIABILITIES 75,691 83,878 96,972 97,480 34,855 34,475 252,083 183,486 29,995 30,729Otros Pasivos Financieros / Other financial liabilities 8,070 8,911 487 590 1,836 1,989 75,910 81,157 0 0Cuentas por Pagar Comerciales / Trade accounts payable 0 0 0 0 0 0 0 0 0 0Otras Cuentas por Pagar / Other accounts payable 0 0 0 0 0 0 0 0 0 0Cuentas por Pagar a Entidades Relacionadas / Accounts payable to related companies 4,017 4,222 0 0 0 0 0 0 0 0Pasivos por Impuestos a las Ganancias Diferidos / Liabilities from deferred income tax 0 0 2,914 2,914 26,788 26,952 38,871 39,356 2,556 2,644Provisiones / Provisions 0 0 0 0 0 0 0 0 0 0Provisión por Beneficios a los Empleados / Provisions for employee profit sharing 0 0 0 0 0 0 0 0 0 0Otros Pasivos / Other Liabilities 8,930 9,057 58 58 0 0 0 0 0 0Ingresos Diferidos (netos) / Deferred income (net) 0 0 0 0 0 0 0 0 0 0
TOTAL PASIVOS NO CORRIENTES / TOTAL NON-CURRENT LIABILITIES 21,017 22,190 3,459 3,562 28,624 28,941 114,781 120,513 2,556 2,644TOTAL PASIVOS / TOTAL LIABILITIES 96,708 106,068 100,431 101,042 63,479 63,416 366,864 303,999 32,551 33,373
Capital Emitido / Issued capital 38,000 38,000 53,432 53,432 86,026 86,026 118,186 118,186 32,265 32,265Primas de Emisión / Share premium 0 0 0 0 0 0 0 0 0 0Acciones de Inversión / Investment stock 0 0 4,062 4,062 42,693 42,693 42,159 42,159 11,020 11,020Acciones Propias en Cartera / Treasury shares 0 0 0 0 0 0 0 0 0 0Otras Reservas de Capital / Other capital reserves 6,300 5,100 8,621 7,037 9,775 9,775 68,174 68,174 21,427 3,883Resultados Acumulados / Retained earnings 17,883 18,254 59,883 57,646 31,299 32,526 177,971 196,489 2,258 17,544Otras Reservas de Patrimonio / Other equity reserves 20,345 20,345 40,404 40,404 -18,448 -18,505 0 0 0 0
TOTAL PATRIMONIO / TOTAL EQUITY 82,528 81,699 166,402 162,581 151,345 152,515 406,490 425,008 66,970 64,712TOTAL PASIVO Y PATRIMONIO / TOTAL LIABILITIES AND EQUITY 179,236 187,767 266,833 263,623 214,824 215,931 773,354 729,007 99,521 98,085
ESTADO DE RESULTADOS / INCOME STATEMENT 31/03/2012 31/03/2011 31/03/2012 31/03/2011 31/03/2012 31/03/2011 31/03/2012 31/03/2011 31/03/2012 31/03/2011
Ventas Netas de Bienes / Net sales of goods 35,307 23,071 50,411 45,840 25,293 23,010 166,311 157,026 34,215 31,070Prestación de Servicios / Services rendered 703 677 1 0 0 0 0 0 571 347
TOTAL DE INGRESOS DE ACTIVIDADES ORDINARIAS / TOTAL INCOME FROM REGULARACTIVITIES 36,010 23,748 50,412 45,840 25,293 23,010 166,311 157,026 34,786 31,417
Costo de Ventas / Cost of sales -30,303 -20,018 -42,929 -36,676 -20,810 -17,259 -78,695 -75,945 -28,960 -26,295GANANCIA (PERDIDA) BRUTA / GROSS PROFIT (LOSS) 5,707 3,730 7,483 9,164 4,483 5,751 87,616 81,081 5,826 5,122
Gastos de Ventas y Distribución / Sales and distribution expenses -2,043 -1,701 -3,469 -3,196 -2,052 -2,377 -34,545 -28,869 -1,618 -1,292Gastos de Administración / Overheads -1,913 -1,562 -2,120 -1,819 -1,566 -1,319 -13,224 -14,543 -923 -1,697Ganancia (Pérdida) de la baja en Activos Financieros medidos al Costo Amortizado / Profit (loss) fromdisposal of financial assets measured at amortized cost 0 0 0 0 0 0 0 0 0 0Otros Ingresos Operativos / Other operating income 2,027 1,427 2,154 599 179 173 1,312 3,069 107 213Otros Gastos Operativos / Other operating expenses 0 0 0 0 -61 -48 -3,707 -4,622 0 0
GANANCIA (PERDIDA) OPERATIVA / OPERATING PROFIT (LOSS) 3,778 1,894 4,048 4,748 983 2,180 37,452 36,116 3,392 2,346Ingresos Financieros / Financial income 70 23 268 14 49 61 12,968 2,490 7 193Gastos Financieros / Financial expenses -846 -561 -746 -917 -154 -99 -2,223 -3,524 -43 -42Diferencias de Cambio neto / Exchange differences net 574 35 251 -274 125 -48 163 -184 -32 -58Participación en los Resultados Netos de Asociadas y Negocios Conjuntos Contabilizados por el Métodode la Participación / Equity in net results of associates and joint ventures booked by the equity method 0 0 0 0 0 0 0 0 0 0Ganancias (Pérdidas) de la Diferencia entre el Valor Libro Anterior y el Valor Justo de ActivosFinancieros Reclasificados Medidos a Valor Razonable / Profits (losses) from the difference between theprevious book value and fair value of financial assets reclassified and measured at fair value 0 0 0 0 0 0 0 0 0 0
RESULTADO ANTES DE IMPUESTO A LAS GANANCIAS / PRE-INCOME TAX RESULT 3,576 1,391 3,821 3,571 1,003 2,094 48,360 34,898 3,324 2,439Gasto por Impuesto a las Ganancias / Income tax expenses -693 -673 0 0 -299 -606 -11,032 -10,578 -1,066 -941
GANANCIA (PERDIDA) NETA DE OPERACIONES CONTINUADAS / NET PROFIT (LOSS) FROMCONTINUING TRADES 2,883 718 3,821 3,571 704 1,488 37,328 24,320 2,258 1,498
Ganancia (Pérdida) Neta del Impuesto a las Ganancias Procedente de Operaciones Discontinuadas / Netprofit (loss) arising from income tax discontinued trades 0 0 0 0 0 0 0 0 0 0
GANANCIA (PERDIDA) NETA DEL EJERCICIO / PERIOD'S NET PROFIT (LOSS) 2,883 718 3,821 3,571 704 1,488 37,328 24,320 2,258 1,498
INDICADORES FINANCIEROS / FINANCIAL RATIOSLiquidez / Liquid Ratio 1.50 1.62 2.16 1.03 2.22 Rotación de Activos / Gross Sales to Total Assets 0.20 0.19 0.12 0.22 0.35 Solvencia / Solvency 0.54 0.38 0.30 0.47 0.33 Deuda / Patrimonio / Debt / Equity 1.17 0.60 0.42 0.90 0.49 Rentabilidad sobre Ventas Netas % / Return % 8.01 7.58 2.78 22.44 6.49 Rentabilidad sobre Activos % / Return on Assets % 1.61 1.43 0.33 4.83 2.27 Rentabilidad de Patrimonio % / Return on Equity % 3.49 2.30 0.47 9.18 3.37

ESTADOS FINANCIEROS COMPARADOS / COMPARATIVE FINANCIAL STATEMENTS INDUSTRIALES / INDUSTRIALCIFRAS EXPRESADAS EN MILES DE NUEVOS SOLES
EMPRESA/COMPANY
Petroperú
Refineria La Pampilla (*)
Quimpac
Rayon Industrial
Industrias VencedorCIIU
2320
23208
2411-6
24116
2422-0
Pág 28 * Estados Financieros expresados en miles de US$
ESTADO DE SITUACION FINANCIERA / STATEMENT OF FINANCIAL POSITION 31/03/2012 31/12/2011 31/03/2012 31/12/2011 31/03/2012 31/12/2011 31/03/2012 31/12/2011 31/03/2012 31/12/2011
Efectivo y Equivalentes al Efectivo / Cash and cash equivalent 54,743 157,333 10,763 7,128 34,199 54,944 1 4 2,245 4,420Otros Activos Financieros / Other financial assets 0 0 0 0 0 0 0 0 0 0Cuentas por Cobrar Comerciales (neto) / Trade accounts receivable (net) 646,496 652,832 235,503 155,984 55,354 68,014 0 0 27,295 32,829Otras Cuentas por Cobrar (neto) / Other accounts receivable (net) 462,847 513,129 101,765 103,022 12,278 4,874 120 121 3,041 708Cuentas por Cobrar a Entidades Relacionadas / Accounts receivable from related companies 0 0 0 0 775 0 0 0 3,662 60Inventarios / Stocks 2,313,108 2,286,987 597,717 497,349 61,316 51,277 0 0 24,138 26,530Activos Biológicos / Biological assets 0 0 0 0 0 0 0 0 0 0Activos por Impuestos a las Ganancias / Assets from income tax 0 0 16,580 18,565 0 0 0 0 0 0Gastos Pagados por Anticipado / Prepaid expenses 12,286 16,669 737 1,754 7,335 5,511 0 0 224 2,299Otros Activos / Other assets 0 0 0 0 0 0 0 0 0 0Activos no Corrientes o Grupos de Activos para su Disposición Clasificados como Mantenidos para laVenta / Non-current assets or groups of assets for disposal classified as held for sale 0 0 0 0 0 0 0 0 0 0Activos no Corrientes o Grupos de Activos para su Disposición Clasificados como Mantenidos paraDistribuir a los Propietarios / Non-current assets or groups of assets for disposal classified as held forDistribution to owner 0 0 0 0 0 0 0 0 0 0
TOTAL ACTIVOS CORRIENTES / TOTAL CURRENT ASSETS 3,489,480 3,626,950 963,065 783,802 171,257 184,620 121 125 60,605 66,846Otros Activos Financieros / Other financial assets 8,713 8,713 80,611 80,611 0 0 0 0 7,455 7,455Inversiones Contabilizadas Aplicando el Método de la Participación / Investments booked using the equitymethod 0 0 0 0 5,933 4,779 0 0 0 0Cuentas por Cobrar Comerciales / Trade accounts receivable 0 0 0 0 0 0 0 0 0 0Otras Cuentas por Cobrar / Other accounts receivable 185,785 175,958 1,708 2,136 0 0 674 684 0 0Cuentas por Cobrar a Entidades Relacionadas / Accounts receivable from related companies 0 0 0 0 0 0 0 0 0 0Activos Biológicos / Biological assets 0 0 0 0 0 0 0 0 0 0Propiedades de Inversión / Investment property 0 0 0 0 60,569 60,569 0 0 0 0Propiedades, Planta y Equipo (neto) / Property, plant and equipment (net) 2,465,065 2,414,643 379,364 382,620 688,642 663,929 0 0 50,769 52,604Activos Intangibles (neto) / Intangible assets (net) 0 0 0 0 6,509 6,969 0 0 71 79Activos por Impuestos a las Ganancias Diferidos / Assets from deferred income tax 0 0 0 0 0 0 0 0 0 0Plusvalía / Capital gain 0 0 0 0 24,691 24,691 0 0 0 0Otros Activos / Other assets 121,297 115,016 0 0 0 0 0 0 0 0
TOTAL ACTIVOS NO CORRIENTES / TOTAL NON-CURRENT ASSETS 2,780,860 2,714,330 461,683 465,367 786,344 760,937 674 684 58,295 60,138TOTAL DE ACTIVOS / TOTAL ASSETS 6,270,340 6,341,280 1,424,748 1,249,169 957,601 945,557 795 809 118,900 126,984
Otros Pasivos Financieros / Other financial liabilities 1,149,325 1,227,884 163,732 155,285 27,850 6,682 0 0 19,207 15,754Cuentas por Pagar Comerciales / Trade accounts payable 952,061 1,103,708 226,273 59,789 49,749 61,425 3 1 13,452 22,029Otras Cuentas por Pagar / Other accounts payable 327,008 289,224 42,511 31,217 19,351 27,787 3 4 6,111 2,782Cuentas por Pagar a Entidades Relacionadas / Accounts payable to related companies 0 0 11,262 190 0 0 0 0 4,138 907Provisiones / Provisions 130,851 134,091 0 0 0 0 0 0 371 643Pasivos por Impuestos a las Ganancias / Liabilities from income tax 0 0 0 0 5,880 12,410 0 0 0 2,472Provisión por Beneficios a los Empleados / Provisions for employee profit sharing 0 0 2,721 12,894 1,250 555 0 0 194 281Otros Pasivos / Other Liabilities 0 0 0 0 0 0 0 0 0 0Pasivos incluidos en Grupos de Activos para su Disposición Clasificados como Mantenidos para la Venta/ Liabilities included in groups of assets for disposal classified as held for sale 0 0 0 0 0 0 0 0 0 0
TOTAL PASIVOS CORRIENTES / TOTAL CURRENT LIABILITIES 2,559,245 2,754,907 446,499 259,375 104,080 108,859 6 5 43,473 44,868Otros Pasivos Financieros / Other financial liabilities 0 0 463,479 464,817 219,638 223,642 0 0 149 217Cuentas por Pagar Comerciales / Trade accounts payable 0 0 0 0 0 0 0 0 0 0Otras Cuentas por Pagar / Other accounts payable 55,946 55,946 1,181 2,912 0 0 0 0 0 0Cuentas por Pagar a Entidades Relacionadas / Accounts payable to related companies 0 0 0 0 0 0 0 0 0 0Pasivos por Impuestos a las Ganancias Diferidos / Liabilities from deferred income tax 218,548 215,127 48,371 46,902 99,490 100,499 0 0 9,742 9,742Provisiones / Provisions 647,452 651,806 0 0 0 0 0 0 0 0Provisión por Beneficios a los Empleados / Provisions for employee profit sharing 0 0 118 118 0 0 0 0 0 0Otros Pasivos / Other Liabilities 0 0 0 0 0 0 0 0 0 0Ingresos Diferidos (netos) / Deferred income (net) 0 0 0 0 0 0 0 0 0 0
TOTAL PASIVOS NO CORRIENTES / TOTAL NON-CURRENT LIABILITIES 921,946 922,879 513,149 514,749 319,128 324,141 9,891 9,959TOTAL PASIVOS / TOTAL LIABILITIES 3,481,191 3,677,786 959,648 774,124 423,208 433,000 6 5 53,364 54,827
Capital Emitido / Issued capital 1,371,866 1,371,866 298,939 231,403 160,155 160,155 119 119 13,371 13,371Primas de Emisión / Share premium 0 0 0 0 0 0 0 0 4,162 4,162Acciones de Inversión / Investment stock 0 0 0 0 26,673 26,673 2,087 2,087 4,058 4,058Acciones Propias en Cartera / Treasury shares 0 0 0 0 0 0 0 0 0 0Otras Reservas de Capital / Other capital reserves 29,950 29,950 38,396 29,404 79,613 79,613 110 110 2,997 2,997Resultados Acumulados / Retained earnings 1,387,333 1,261,678 127,765 214,238 267,952 246,116 -1,527 -1,512 40,948 47,569Otras Reservas de Patrimonio / Other equity reserves 0 0 0 0 0 0 0 0 0 0
TOTAL PATRIMONIO / TOTAL EQUITY 2,789,149 2,663,494 465,100 475,045 534,393 512,557 789 804 65,536 72,157TOTAL PASIVO Y PATRIMONIO / TOTAL LIABILITIES AND EQUITY 6,270,340 6,341,280 1,424,748 1,249,169 957,601 945,557 795 809 118,900 126,984
ESTADO DE RESULTADOS / INCOME STATEMENT 31/03/2012 31/03/2011 31/03/2012 31/03/2011 31/03/2012 31/03/2011 31/03/2012 31/03/2011 31/03/2012 31/03/2011
Ventas Netas de Bienes / Net sales of goods 3,130,010 2,907,293 1,156,995 949,425 118,122 118,113 0 0 27,757 29,264Prestación de Servicios / Services rendered 50,961 50,915 3,201 4,314 0 0 0 0 0 0
TOTAL DE INGRESOS DE ACTIVIDADES ORDINARIAS / TOTAL INCOME FROM REGULARACTIVITIES 3,180,971 2,958,208 1,160,196 953,739 118,122 118,113 0 0 27,757 29,264
Costo de Ventas / Cost of sales -2,845,207 -2,429,790 -1,119,353 -869,801 -70,440 -68,319 0 0 -22,705 -21,704GANANCIA (PERDIDA) BRUTA / GROSS PROFIT (LOSS) 335,764 528,418 40,843 83,938 47,682 49,794 0 0 5,052 7,560
Gastos de Ventas y Distribución / Sales and distribution expenses -72,089 -73,208 -19,630 -18,619 -6,554 -9,147 0 0 -7,117 -4,689Gastos de Administración / Overheads -72,396 -69,200 -4,929 -6,279 -10,611 -9,958 -28 -73 -4,849 -2,757Ganancia (Pérdida) de la baja en Activos Financieros medidos al Costo Amortizado / Profit (loss) fromdisposal of financial assets measured at amortized cost 0 0 0 0 0 0 0 0 0 0Otros Ingresos Operativos / Other operating income 8,398 18,159 4,262 0 557 517 0 0 1,517 418Otros Gastos Operativos / Other operating expenses -71,700 -68,183 -37 -227 -91 -165 0 0 -1,035 -53
GANANCIA (PERDIDA) OPERATIVA / OPERATING PROFIT (LOSS) 127,977 335,986 20,509 58,813 30,983 31,041 -28 -73 -6,432 479Ingresos Financieros / Financial income 1,212 1,560 103 26 279 350 13 20 68 61Gastos Financieros / Financial expenses -3,189 -2,798 -5,795 -5,390 -2,967 -2,218 0 0 -273 -149Diferencias de Cambio neto / Exchange differences net 16,893 4,027 1,023 -394 3,812 333 0 0 88 -40Participación en los Resultados Netos de Asociadas y Negocios Conjuntos Contabilizados por el Métodode la Participación / Equity in net results of associates and joint ventures booked by the equity method 0 0 0 0 0 0 0 0 0 0Ganancias (Pérdidas) de la Diferencia entre el Valor Libro Anterior y el Valor Justo de ActivosFinancieros Reclasificados Medidos a Valor Razonable / Profits (losses) from the difference between theprevious book value and fair value of financial assets reclassified and measured at fair value 0 0 0 0 -66 -104 0 0 0 0
RESULTADO ANTES DE IMPUESTO A LAS GANANCIAS / PRE-INCOME TAX RESULT 142,893 338,775 15,840 53,055 32,041 29,402 -15 -53 -6,549 351Gasto por Impuesto a las Ganancias / Income tax expenses 0 0 -3,764 -15,234 -10,205 -9,592 0 0 0 -305
GANANCIA (PERDIDA) NETA DE OPERACIONES CONTINUADAS / NET PROFIT (LOSS) FROMCONTINUING TRADES 142,893 338,775 12,076 37,821 21,836 19,810 -15 -53 -6,549 46
Ganancia (Pérdida) Neta del Impuesto a las Ganancias Procedente de Operaciones Discontinuadas / Netprofit (loss) arising from income tax discontinued trades -47,323 -102,206 0 0 0 0 0 0 0 0
GANANCIA (PERDIDA) NETA DEL EJERCICIO / PERIOD'S NET PROFIT (LOSS) 95,570 236,569 12,076 37,821 21,836 19,810 -15 -53 -6,549 46
INDICADORES FINANCIEROS / FINANCIAL RATIOSLiquidez / Liquid Ratio 1.36 2.16 1.65 20.17 1.39 Rotación de Activos / Gross Sales to Total Assets 0.51 0.81 0.12 0.00 0.23 Solvencia / Solvency 0.56 0.67 0.44 0.01 0.45 Deuda / Patrimonio / Debt / Equity 1.25 2.06 0.79 0.01 0.81 Rentabilidad sobre Ventas Netas % / Return % 3.00 1.04 18.49 n.d. -.- Rentabilidad sobre Activos % / Return on Assets % 1.52 0.85 2.28 -.- -.- Rentabilidad de Patrimonio % / Return on Equity % 3.43 2.60 4.09 -.- -.-
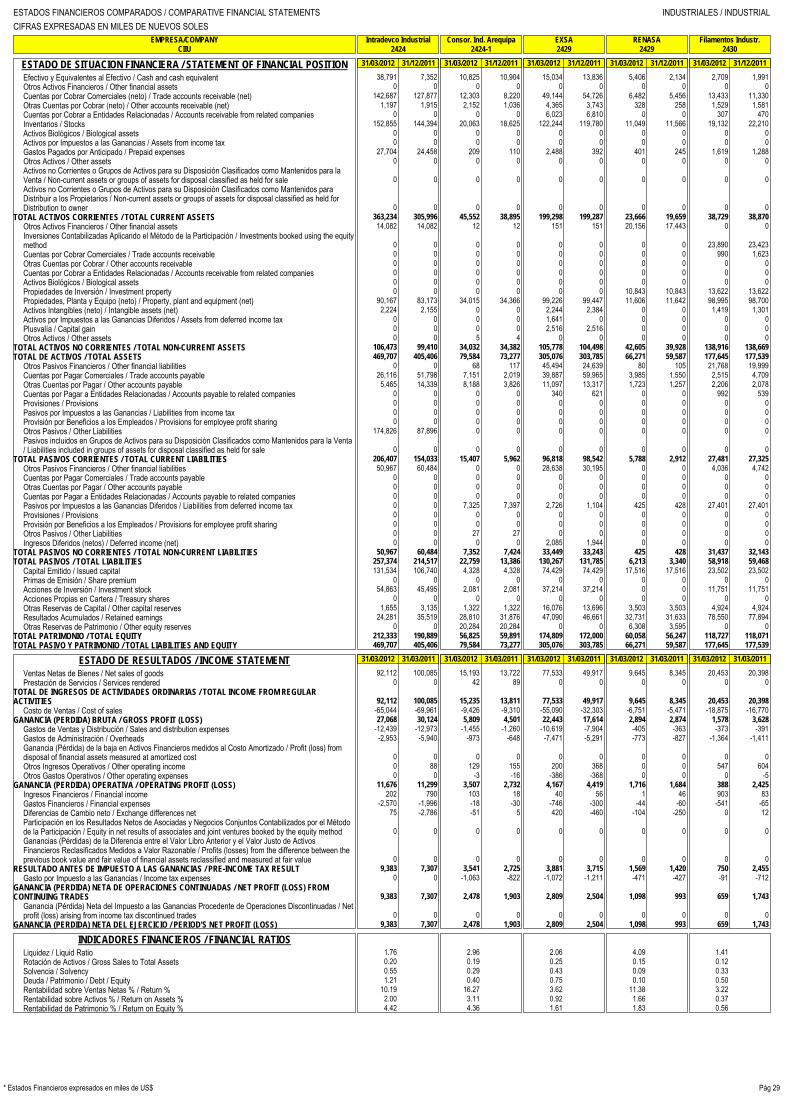
ESTADOS FINANCIEROS COMPARADOS / COMPARATIVE FINANCIAL STATEMENTS INDUSTRIALES / INDUSTRIALCIFRAS EXPRESADAS EN MILES DE NUEVOS SOLES
EMPRESA/COMPANY
Intradevco Industrial
Consor. Ind. Arequipa
EXSA
RENASA
Filamentos Industr.CIIU
2424
2424-1
2429
2429
2430
Pág 29* Estados Financieros expresados en miles de US$
ESTADO DE SITUACION FINANCIERA / STATEMENT OF FINANCIAL POSITION 31/03/2012 31/12/2011 31/03/2012 31/12/2011 31/03/2012 31/12/2011 31/03/2012 31/12/2011 31/03/2012 31/12/2011
Efectivo y Equivalentes al Efectivo / Cash and cash equivalent 38,791 7,352 10,825 10,904 15,034 13,836 5,406 2,134 2,709 1,991Otros Activos Financieros / Other financial assets 0 0 0 0 0 0 0 0 0 0Cuentas por Cobrar Comerciales (neto) / Trade accounts receivable (net) 142,687 127,877 12,303 8,220 49,144 54,726 6,482 5,456 13,433 11,330Otras Cuentas por Cobrar (neto) / Other accounts receivable (net) 1,197 1,915 2,152 1,036 4,365 3,743 328 258 1,529 1,581Cuentas por Cobrar a Entidades Relacionadas / Accounts receivable from related companies 0 0 0 0 6,023 6,810 0 0 307 470Inventarios / Stocks 152,855 144,394 20,063 18,625 122,244 119,780 11,049 11,566 19,132 22,210Activos Biológicos / Biological assets 0 0 0 0 0 0 0 0 0 0Activos por Impuestos a las Ganancias / Assets from income tax 0 0 0 0 0 0 0 0 0 0Gastos Pagados por Anticipado / Prepaid expenses 27,704 24,458 209 110 2,488 392 401 245 1,619 1,288Otros Activos / Other assets 0 0 0 0 0 0 0 0 0 0Activos no Corrientes o Grupos de Activos para su Disposición Clasificados como Mantenidos para laVenta / Non-current assets or groups of assets for disposal classified as held for sale 0 0 0 0 0 0 0 0 0 0Activos no Corrientes o Grupos de Activos para su Disposición Clasificados como Mantenidos paraDistribuir a los Propietarios / Non-current assets or groups of assets for disposal classified as held forDistribution to owner 0 0 0 0 0 0 0 0 0 0
TOTAL ACTIVOS CORRIENTES / TOTAL CURRENT ASSETS 363,234 305,996 45,552 38,895 199,298 199,287 23,666 19,659 38,729 38,870Otros Activos Financieros / Other financial assets 14,082 14,082 12 12 151 151 20,156 17,443 0 0Inversiones Contabilizadas Aplicando el Método de la Participación / Investments booked using the equitymethod 0 0 0 0 0 0 0 0 23,890 23,423Cuentas por Cobrar Comerciales / Trade accounts receivable 0 0 0 0 0 0 0 0 990 1,623Otras Cuentas por Cobrar / Other accounts receivable 0 0 0 0 0 0 0 0 0 0Cuentas por Cobrar a Entidades Relacionadas / Accounts receivable from related companies 0 0 0 0 0 0 0 0 0 0Activos Biológicos / Biological assets 0 0 0 0 0 0 0 0 0 0Propiedades de Inversión / Investment property 0 0 0 0 0 0 10,843 10,843 13,622 13,622Propiedades, Planta y Equipo (neto) / Property, plant and equipment (net) 90,167 83,173 34,015 34,366 99,226 99,447 11,606 11,642 98,995 98,700Activos Intangibles (neto) / Intangible assets (net) 2,224 2,155 0 0 2,244 2,384 0 0 1,419 1,301Activos por Impuestos a las Ganancias Diferidos / Assets from deferred income tax 0 0 0 0 1,641 0 0 0 0 0Plusvalía / Capital gain 0 0 0 0 2,516 2,516 0 0 0 0Otros Activos / Other assets 0 0 5 4 0 0 0 0 0 0
TOTAL ACTIVOS NO CORRIENTES / TOTAL NON-CURRENT ASSETS 106,473 99,410 34,032 34,382 105,778 104,498 42,605 39,928 138,916 138,669TOTAL DE ACTIVOS / TOTAL ASSETS 469,707 405,406 79,584 73,277 305,076 303,785 66,271 59,587 177,645 177,539
Otros Pasivos Financieros / Other financial liabilities 0 0 68 117 45,494 24,639 80 105 21,768 19,999Cuentas por Pagar Comerciales / Trade accounts payable 26,116 51,798 7,151 2,019 39,887 59,965 3,985 1,550 2,515 4,709Otras Cuentas por Pagar / Other accounts payable 5,465 14,339 8,188 3,826 11,097 13,317 1,723 1,257 2,206 2,078Cuentas por Pagar a Entidades Relacionadas / Accounts payable to related companies 0 0 0 0 340 621 0 0 992 539Provisiones / Provisions 0 0 0 0 0 0 0 0 0 0Pasivos por Impuestos a las Ganancias / Liabilities from income tax 0 0 0 0 0 0 0 0 0 0Provisión por Beneficios a los Empleados / Provisions for employee profit sharing 0 0 0 0 0 0 0 0 0 0Otros Pasivos / Other Liabilities 174,826 87,896 0 0 0 0 0 0 0 0Pasivos incluidos en Grupos de Activos para su Disposición Clasificados como Mantenidos para la Venta/ Liabilities included in groups of assets for disposal classified as held for sale 0 0 0 0 0 0 0 0 0 0
TOTAL PASIVOS CORRIENTES / TOTAL CURRENT LIABILITIES 206,407 154,033 15,407 5,962 96,818 98,542 5,788 2,912 27,481 27,325Otros Pasivos Financieros / Other financial liabilities 50,967 60,484 0 0 28,638 30,195 0 0 4,036 4,742Cuentas por Pagar Comerciales / Trade accounts payable 0 0 0 0 0 0 0 0 0 0Otras Cuentas por Pagar / Other accounts payable 0 0 0 0 0 0 0 0 0 0Cuentas por Pagar a Entidades Relacionadas / Accounts payable to related companies 0 0 0 0 0 0 0 0 0 0Pasivos por Impuestos a las Ganancias Diferidos / Liabilities from deferred income tax 0 0 7,325 7,397 2,726 1,104 425 428 27,401 27,401Provisiones / Provisions 0 0 0 0 0 0 0 0 0 0Provisión por Beneficios a los Empleados / Provisions for employee profit sharing 0 0 0 0 0 0 0 0 0 0Otros Pasivos / Other Liabilities 0 0 27 27 0 0 0 0 0 0Ingresos Diferidos (netos) / Deferred income (net) 0 0 0 0 2,085 1,944 0 0 0 0
TOTAL PASIVOS NO CORRIENTES / TOTAL NON-CURRENT LIABILITIES 50,967 60,484 7,352 7,424 33,449 33,243 425 428 31,437 32,143TOTAL PASIVOS / TOTAL LIABILITIES 257,374 214,517 22,759 13,386 130,267 131,785 6,213 3,340 58,918 59,468
Capital Emitido / Issued capital 131,534 106,740 4,328 4,328 74,429 74,429 17,516 17,516 23,502 23,502Primas de Emisión / Share premium 0 0 0 0 0 0 0 0 0 0Acciones de Inversión / Investment stock 54,863 45,495 2,081 2,081 37,214 37,214 0 0 11,751 11,751Acciones Propias en Cartera / Treasury shares 0 0 0 0 0 0 0 0 0 0Otras Reservas de Capital / Other capital reserves 1,655 3,135 1,322 1,322 16,076 13,696 3,503 3,503 4,924 4,924Resultados Acumulados / Retained earnings 24,281 35,519 28,810 31,876 47,090 46,661 32,731 31,633 78,550 77,894Otras Reservas de Patrimonio / Other equity reserves 0 0 20,284 20,284 0 0 6,308 3,595 0 0
TOTAL PATRIMONIO / TOTAL EQUITY 212,333 190,889 56,825 59,891 174,809 172,000 60,058 56,247 118,727 118,071TOTAL PASIVO Y PATRIMONIO / TOTAL LIABILITIES AND EQUITY 469,707 405,406 79,584 73,277 305,076 303,785 66,271 59,587 177,645 177,539
ESTADO DE RESULTADOS / INCOME STATEMENT 31/03/2012 31/03/2011 31/03/2012 31/03/2011 31/03/2012 31/03/2011 31/03/2012 31/03/2011 31/03/2012 31/03/2011
Ventas Netas de Bienes / Net sales of goods 92,112 100,085 15,193 13,722 77,533 49,917 9,645 8,345 20,453 20,398Prestación de Servicios / Services rendered 0 0 42 89 0 0 0 0 0 0
TOTAL DE INGRESOS DE ACTIVIDADES ORDINARIAS / TOTAL INCOME FROM REGULARACTIVITIES 92,112 100,085 15,235 13,811 77,533 49,917 9,645 8,345 20,453 20,398
Costo de Ventas / Cost of sales -65,044 -69,961 -9,426 -9,310 -55,090 -32,303 -6,751 -5,471 -18,875 -16,770GANANCIA (PERDIDA) BRUTA / GROSS PROFIT (LOSS) 27,068 30,124 5,809 4,501 22,443 17,614 2,894 2,874 1,578 3,628
Gastos de Ventas y Distribución / Sales and distribution expenses -12,439 -12,973 -1,455 -1,260 -10,619 -7,904 -405 -363 -373 -391Gastos de Administración / Overheads -2,953 -5,940 -973 -648 -7,471 -5,291 -773 -827 -1,364 -1,411Ganancia (Pérdida) de la baja en Activos Financieros medidos al Costo Amortizado / Profit (loss) fromdisposal of financial assets measured at amortized cost 0 0 0 0 0 0 0 0 0 0Otros Ingresos Operativos / Other operating income 0 88 129 155 200 368 0 0 547 604Otros Gastos Operativos / Other operating expenses 0 0 -3 -16 -386 -368 0 0 0 -5
GANANCIA (PERDIDA) OPERATIVA / OPERATING PROFIT (LOSS) 11,676 11,299 3,507 2,732 4,167 4,419 1,716 1,684 388 2,425Ingresos Financieros / Financial income 202 790 103 18 40 56 1 46 903 83Gastos Financieros / Financial expenses -2,570 -1,996 -18 -30 -746 -300 -44 -60 -541 -65Diferencias de Cambio neto / Exchange differences net 75 -2,786 -51 5 420 -460 -104 -250 0 12Participación en los Resultados Netos de Asociadas y Negocios Conjuntos Contabilizados por el Métodode la Participación / Equity in net results of associates and joint ventures booked by the equity method 0 0 0 0 0 0 0 0 0 0Ganancias (Pérdidas) de la Diferencia entre el Valor Libro Anterior y el Valor Justo de ActivosFinancieros Reclasificados Medidos a Valor Razonable / Profits (losses) from the difference between theprevious book value and fair value of financial assets reclassified and measured at fair value 0 0 0 0 0 0 0 0 0 0
RESULTADO ANTES DE IMPUESTO A LAS GANANCIAS / PRE-INCOME TAX RESULT 9,383 7,307 3,541 2,725 3,881 3,715 1,569 1,420 750 2,455Gasto por Impuesto a las Ganancias / Income tax expenses 0 0 -1,063 -822 -1,072 -1,211 -471 -427 -91 -712
GANANCIA (PERDIDA) NETA DE OPERACIONES CONTINUADAS / NET PROFIT (LOSS) FROMCONTINUING TRADES 9,383 7,307 2,478 1,903 2,809 2,504 1,098 993 659 1,743
Ganancia (Pérdida) Neta del Impuesto a las Ganancias Procedente de Operaciones Discontinuadas / Netprofit (loss) arising from income tax discontinued trades 0 0 0 0 0 0 0 0 0 0
GANANCIA (PERDIDA) NETA DEL EJERCICIO / PERIOD'S NET PROFIT (LOSS) 9,383 7,307 2,478 1,903 2,809 2,504 1,098 993 659 1,743
INDICADORES FINANCIEROS / FINANCIAL RATIOSLiquidez / Liquid Ratio 1.76 2.96 2.06 4.09 1.41 Rotación de Activos / Gross Sales to Total Assets 0.20 0.19 0.25 0.15 0.12 Solvencia / Solvency 0.55 0.29 0.43 0.09 0.33 Deuda / Patrimonio / Debt / Equity 1.21 0.40 0.75 0.10 0.50 Rentabilidad sobre Ventas Netas % / Return % 10.19 16.27 3.62 11.38 3.22 Rentabilidad sobre Activos % / Return on Assets % 2.00 3.11 0.92 1.66 0.37 Rentabilidad de Patrimonio % / Return on Equity % 4.42 4.36 1.61 1.83 0.56

ESTADOS FINANCIEROS COMPARADOS / COMPARATIVE FINANCIAL STATEMENTS INDUSTRIALES / INDUSTRIALCIFRAS EXPRESADAS EN MILES DE NUEVOS SOLES
EMPRESA/COMPANY
Lima Caucho
Peruana de Moldeados
Corporación Cerámica
Cemento Andino
Cementos LimaCIIU
2511
2520
2691
2694
2694
Pág 30 * Estados Financieros expresados en miles de US$
ESTADO DE SITUACION FINANCIERA / STATEMENT OF FINANCIAL POSITION 31/03/2012 31/12/2011 31/03/2012 31/12/2011 31/03/2012 31/12/2011 31/03/2012 31/12/2011 31/03/2012 31/12/2011
Efectivo y Equivalentes al Efectivo / Cash and cash equivalent 566 2,441 9,584 7,408 4,947 768 86,271 33,155 142,463 30,317Otros Activos Financieros / Other financial assets 0 0 2,933 15,186 0 0 133 170 0 0Cuentas por Cobrar Comerciales (neto) / Trade accounts receivable (net) 38,642 36,446 23,854 22,413 40,607 35,562 21,499 17,188 54,550 50,474Otras Cuentas por Cobrar (neto) / Other accounts receivable (net) 3,803 4,374 3,015 3,501 2,256 2,828 1,964 7,938 47,547 36,318Cuentas por Cobrar a Entidades Relacionadas / Accounts receivable from related companies 0 0 4,733 3,213 1,780 873 6,134 7,170 18,514 19,294Inventarios / Stocks 63,905 67,549 32,971 34,578 47,864 54,714 117,779 127,621 219,971 225,493Activos Biológicos / Biological assets 0 0 0 0 0 0 0 0 0 0Activos por Impuestos a las Ganancias / Assets from income tax 0 0 2,106 1,445 0 0 0 0 0 0Gastos Pagados por Anticipado / Prepaid expenses 585 592 102 209 4,157 3,436 7,123 4,100 9,752 10,371Otros Activos / Other assets 0 0 0 0 0 0 0 0 24,912 23,775Activos no Corrientes o Grupos de Activos para su Disposición Clasificados como Mantenidos para laVenta / Non-current assets or groups of assets for disposal classified as held for sale 82 82 0 0 0 0 0 0 0 0Activos no Corrientes o Grupos de Activos para su Disposición Clasificados como Mantenidos paraDistribuir a los Propietarios / Non-current assets or groups of assets for disposal classified as held forDistribution to owner 0 0 0 0 0 0 0 0 0 0
TOTAL ACTIVOS CORRIENTES / TOTAL CURRENT ASSETS 107,583 111,484 79,298 87,953 101,611 98,181 240,903 197,342 517,709 396,042Otros Activos Financieros / Other financial assets 0 0 4,281 4,281 108 108 280,814 280,814 123 123Inversiones Contabilizadas Aplicando el Método de la Participación / Investments booked using the equitymethod 0 0 0 0 0 0 0 0 1,229,782 1,222,389Cuentas por Cobrar Comerciales / Trade accounts receivable 0 0 0 0 0 0 0 0 0 0Otras Cuentas por Cobrar / Other accounts receivable 0 0 0 0 0 0 0 0 8,775 11,700Cuentas por Cobrar a Entidades Relacionadas / Accounts receivable from related companies 0 0 0 0 0 0 0 0 0 0Activos Biológicos / Biological assets 0 0 0 0 0 0 0 0 0 0Propiedades de Inversión / Investment property 0 0 0 0 0 0 0 0 0 0Propiedades, Planta y Equipo (neto) / Property, plant and equipment (net) 212,788 212,413 102,054 103,494 232,404 234,145 1,336,239 1,295,360 2,065,235 2,030,638Activos Intangibles (neto) / Intangible assets (net) 0 0 142 61 496 423 39,400 39,393 44,436 44,140Activos por Impuestos a las Ganancias Diferidos / Assets from deferred income tax 157 157 0 0 0 0 0 0 0 0Plusvalía / Capital gain 0 0 7,338 7,338 0 0 0 0 9,745 9,745Otros Activos / Other assets 0 0 0 0 0 0 0 0 109,473 104,476
TOTAL ACTIVOS NO CORRIENTES / TOTAL NON-CURRENT ASSETS 212,945 212,570 113,815 115,174 233,008 234,676 1,656,453 1,615,567 3,467,569 3,423,211TOTAL DE ACTIVOS / TOTAL ASSETS 320,528 324,054 193,113 203,127 334,619 332,857 1,897,356 1,812,909 3,985,278 3,819,253
Otros Pasivos Financieros / Other financial liabilities 62,171 61,879 32,967 26,492 28,324 29,031 139,926 106,948 566,983 430,122Cuentas por Pagar Comerciales / Trade accounts payable 17,015 20,035 22,185 28,272 10,588 13,107 14,946 16,031 62,054 90,164Otras Cuentas por Pagar / Other accounts payable 11,687 11,115 4,473 6,770 13,380 10,927 16,209 13,173 46,852 36,416Cuentas por Pagar a Entidades Relacionadas / Accounts payable to related companies 0 0 12,188 17,278 3,212 2,643 4,679 5,116 103,654 54,423Provisiones / Provisions 544 618 0 0 0 0 0 0 9,849 20,353Pasivos por Impuestos a las Ganancias / Liabilities from income tax 0 0 0 0 0 0 0 0 13,953 17,168Provisión por Beneficios a los Empleados / Provisions for employee profit sharing 713 280 7,099 5,778 0 0 770 286 0 0Otros Pasivos / Other Liabilities 0 0 0 0 0 0 1,232 12,266 68,079 69,819Pasivos incluidos en Grupos de Activos para su Disposición Clasificados como Mantenidos para la Venta/ Liabilities included in groups of assets for disposal classified as held for sale 0 0 0 0 0 0 0 0 0 0
TOTAL PASIVOS CORRIENTES / TOTAL CURRENT LIABILITIES 92,130 93,927 78,912 84,590 55,504 55,708 177,762 153,820 871,424 718,465Otros Pasivos Financieros / Other financial liabilities 13,106 15,111 7,504 8,602 3,621 4,856 456,035 416,501 781,279 811,812Cuentas por Pagar Comerciales / Trade accounts payable 0 0 0 0 0 0 0 0 0 0Otras Cuentas por Pagar / Other accounts payable 0 0 823 832 0 0 0 0 0 0Cuentas por Pagar a Entidades Relacionadas / Accounts payable to related companies 0 0 0 0 0 0 0 0 0 0Pasivos por Impuestos a las Ganancias Diferidos / Liabilities from deferred income tax 53,042 53,042 8,018 8,018 0 0 184,700 183,789 306,914 304,856Provisiones / Provisions 0 0 0 0 0 0 0 0 10,590 10,590Provisión por Beneficios a los Empleados / Provisions for employee profit sharing 0 0 0 0 0 0 0 0 0 0Otros Pasivos / Other Liabilities 0 0 0 0 0 0 0 0 7,923 8,778Ingresos Diferidos (netos) / Deferred income (net) 0 0 0 0 58,311 58,728 0 0 0 0
TOTAL PASIVOS NO CORRIENTES / TOTAL NON-CURRENT LIABILITIES 66,148 68,153 16,345 17,452 61,932 63,584 640,735 600,290 1,106,706 1,136,036TOTAL PASIVOS / TOTAL LIABILITIES 158,278 162,080 95,257 102,042 117,436 119,292 818,497 754,110 1,978,130 1,854,501
Capital Emitido / Issued capital 15,962 15,962 33,631 33,631 55,867 55,867 313,320 313,320 1,185,703 1,185,703Primas de Emisión / Share premium 0 0 0 0 0 0 0 0 0 0Acciones de Inversión / Investment stock 5,720 5,720 0 0 12,851 12,851 0 0 0 0Acciones Propias en Cartera / Treasury shares 0 0 0 0 0 0 0 0 0 0Otras Reservas de Capital / Other capital reserves 3,512 1,909 6,726 6,726 3,429 3,429 62,664 62,664 0 0Resultados Acumulados / Retained earnings 11,610 12,937 57,499 60,728 145,036 141,418 702,875 682,815 670,647 634,493Otras Reservas de Patrimonio / Other equity reserves 125,446 125,446 0 0 0 0 0 0 150,798 144,556
TOTAL PATRIMONIO / TOTAL EQUITY 162,250 161,974 97,856 101,085 217,183 213,565 1,078,859 1,058,799 2,007,148 1,964,752TOTAL PASIVO Y PATRIMONIO / TOTAL LIABILITIES AND EQUITY 320,528 324,054 193,113 203,127 334,619 332,857 1,897,356 1,812,909 3,985,278 3,819,253
ESTADO DE RESULTADOS / INCOME STATEMENT 31/03/2012 31/03/2011 31/03/2012 31/03/2011 31/03/2012 31/03/2011 31/03/2012 31/03/2011 31/03/2012 31/03/2011
Ventas Netas de Bienes / Net sales of goods 35,653 35,272 56,353 48,691 43,443 37,584 115,407 102,388 285,955 266,715Prestación de Servicios / Services rendered 0 0 0 0 0 0 0 0 0 0
TOTAL DE INGRESOS DE ACTIVIDADES ORDINARIAS / TOTAL INCOME FROM REGULARACTIVITIES 35,653 35,272 56,353 48,691 43,443 37,584 115,407 102,388 285,955 266,715
Costo de Ventas / Cost of sales -29,948 -27,636 -37,691 -33,117 -31,456 -27,211 -79,523 -66,096 -150,080 -132,320GANANCIA (PERDIDA) BRUTA / GROSS PROFIT (LOSS) 5,705 7,636 18,662 15,574 11,987 10,373 35,884 36,292 135,875 134,395
Gastos de Ventas y Distribución / Sales and distribution expenses -2,747 -3,023 -5,718 -5,523 -4,456 -4,217 -769 -680 -19,285 -18,032Gastos de Administración / Overheads -2,330 -2,096 -1,951 -1,796 -3,162 -3,320 -6,981 -6,531 -33,111 -34,190Ganancia (Pérdida) de la baja en Activos Financieros medidos al Costo Amortizado / Profit (loss) fromdisposal of financial assets measured at amortized cost 0 0 0 0 0 0 0 0 0 0Otros Ingresos Operativos / Other operating income 219 180 43 108 1,034 711 1,012 904 6,964 23,762Otros Gastos Operativos / Other operating expenses -46 -118 -117 -262 0 0 0 0 -4,652 -5,986
GANANCIA (PERDIDA) OPERATIVA / OPERATING PROFIT (LOSS) 801 2,579 10,919 8,101 5,403 3,547 29,146 29,985 85,791 99,949Ingresos Financieros / Financial income 255 104 40 15 520 894 1,186 158 465 7,785Gastos Financieros / Financial expenses -1,279 -707 -442 -472 -535 -1,202 -3,787 -2,297 -11,596 -13,068Diferencias de Cambio neto / Exchange differences net 558 -54 226 0 0 0 1,589 126 7,821 2,464Participación en los Resultados Netos de Asociadas y Negocios Conjuntos Contabilizados por el Métodode la Participación / Equity in net results of associates and joint ventures booked by the equity method 0 0 0 0 -596 -249 0 0 0 0Ganancias (Pérdidas) de la Diferencia entre el Valor Libro Anterior y el Valor Justo de ActivosFinancieros Reclasificados Medidos a Valor Razonable / Profits (losses) from the difference between theprevious book value and fair value of financial assets reclassified and measured at fair value 0 0 0 0 0 0 0 0 0 0
RESULTADO ANTES DE IMPUESTO A LAS GANANCIAS / PRE-INCOME TAX RESULT 335 1,922 10,743 7,644 4,792 2,990 28,134 27,972 82,481 97,130Gasto por Impuesto a las Ganancias / Income tax expenses 0 0 -2,654 -2,162 -1,193 -674 -8,074 -8,365 -26,040 -26,279
GANANCIA (PERDIDA) NETA DE OPERACIONES CONTINUADAS / NET PROFIT (LOSS) FROMCONTINUING TRADES 335 1,922 8,089 5,482 3,599 2,316 20,060 19,607 56,441 70,851
Ganancia (Pérdida) Neta del Impuesto a las Ganancias Procedente de Operaciones Discontinuadas / Netprofit (loss) arising from income tax discontinued trades 0 0 0 0 0 0 0 0 0 0
GANANCIA (PERDIDA) NETA DEL EJERCICIO / PERIOD'S NET PROFIT (LOSS) 335 1,922 8,089 5,482 3,599 2,316 20,060 19,607 56,441 70,851
INDICADORES FINANCIEROS / FINANCIAL RATIOSLiquidez / Liquid Ratio 1.17 1.00 1.83 1.36 0.59 Rotación de Activos / Gross Sales to Total Assets 0.11 0.29 0.13 0.06 0.07 Solvencia / Solvency 0.49 0.49 0.35 0.43 0.50 Deuda / Patrimonio / Debt / Equity 0.98 0.97 0.54 0.76 0.99 Rentabilidad sobre Ventas Netas % / Return % 0.94 14.35 8.28 17.38 19.74 Rentabilidad sobre Activos % / Return on Assets % 0.10 4.19 1.08 1.06 1.42 Rentabilidad de Patrimonio % / Return on Equity % 0.21 8.27 1.66 1.86 2.81

ESTADOS FINANCIEROS COMPARADOS / COMPARATIVE FINANCIAL STATEMENTS INDUSTRIALES / INDUSTRIALCIFRAS EXPRESADAS EN MILES DE NUEVOS SOLES
EMPRESA/COMPANY
Cementos Pacasmayo
Yura
Fab. Peruana Eternit
Corp. Aceros Arequipa
MEPSACIIU
2694
2694
26957
2710
2731
Pág 31* Estados Financieros expresados en miles de US$
ESTADO DE SITUACION FINANCIERA / STATEMENT OF FINANCIAL POSITION 31/03/2012 31/12/2011 31/03/2012 31/12/2011 31/03/2012 31/12/2011 31/03/2012 31/12/2011 31/03/2012 31/12/2011
Efectivo y Equivalentes al Efectivo / Cash and cash equivalent 493,364 330,316 15,428 23,646 26 2,419 141,192 160,456 2,055 2,089Otros Activos Financieros / Other financial assets 403,950 0 0 0 0 0 0 0 0 0Cuentas por Cobrar Comerciales (neto) / Trade accounts receivable (net) 7,156 8,245 25,806 29,230 10,245 5,723 94,005 91,484 23,606 21,002Otras Cuentas por Cobrar (neto) / Other accounts receivable (net) 35,538 33,118 3,256 1,984 88 1,722 46,418 67,531 6,248 5,014Cuentas por Cobrar a Entidades Relacionadas / Accounts receivable from related companies 80,618 44,286 207,065 55,913 6,677 1,968 39,647 35,165 3 961Inventarios / Stocks 178,450 167,571 165,408 151,885 33,117 36,395 1,008,340 1,132,144 66,797 60,829Activos Biológicos / Biological assets 0 0 0 0 0 0 0 0 0 0Activos por Impuestos a las Ganancias / Assets from income tax 0 0 0 0 3,647 7,388 0 0 0 0Gastos Pagados por Anticipado / Prepaid expenses 14,223 9,697 9,553 4,844 421 298 6,126 7,242 579 24Otros Activos / Other assets 0 0 0 0 0 0 0 0 0 0Activos no Corrientes o Grupos de Activos para su Disposición Clasificados como Mantenidos para laVenta / Non-current assets or groups of assets for disposal classified as held for sale 0 0 0 0 0 0 0 0 0 0Activos no Corrientes o Grupos de Activos para su Disposición Clasificados como Mantenidos paraDistribuir a los Propietarios / Non-current assets or groups of assets for disposal classified as held forDistribution to owner 0 0 0 0 0 0 0 0 0 0
TOTAL ACTIVOS CORRIENTES / TOTAL CURRENT ASSETS 1,213,299 593,233 426,516 267,502 54,221 55,913 1,335,728 1,494,022 99,288 89,919Otros Activos Financieros / Other financial assets 29,611 22,074 209,895 209,895 155 155 94,270 94,270 0 0Inversiones Contabilizadas Aplicando el Método de la Participación / Investments booked using the equitymethod 205,174 196,328 0 0 0 0 0 0 0 0Cuentas por Cobrar Comerciales / Trade accounts receivable 0 0 0 0 0 0 0 0 0 0Otras Cuentas por Cobrar / Other accounts receivable 1,151 1,167 0 0 0 0 31,623 31,754 0 0Cuentas por Cobrar a Entidades Relacionadas / Accounts receivable from related companies 8,008 10,080 10,984 159,209 0 0 0 0 0 0Activos Biológicos / Biological assets 0 0 0 0 0 0 0 0 0 0Propiedades de Inversión / Investment property 0 0 0 0 0 0 930,935 885,829 0 0Propiedades, Planta y Equipo (neto) / Property, plant and equipment (net) 871,880 867,966 965,454 960,725 153,458 153,124 0 0 135,980 130,471Activos Intangibles (neto) / Intangible assets (net) 5,447 5,447 658 668 184 178 21,432 17,413 824 704Activos por Impuestos a las Ganancias Diferidos / Assets from deferred income tax 0 0 0 0 0 0 0 0 0 0Plusvalía / Capital gain 0 0 0 0 0 0 0 0 0 0Otros Activos / Other assets 0 393 0 0 0 0 28,518 27,355 0 0
TOTAL ACTIVOS NO CORRIENTES / TOTAL NON-CURRENT ASSETS 1,121,271 1,103,455 1,186,991 1,330,497 153,797 153,457 1,106,778 1,056,621 136,804 131,175TOTAL DE ACTIVOS / TOTAL ASSETS 2,334,570 1,696,688 1,613,507 1,597,999 208,018 209,370 2,442,506 2,550,643 236,092 221,094
Otros Pasivos Financieros / Other financial liabilities 162,670 125,381 139,788 136,587 10,299 10,032 508,621 595,187 35,844 34,038Cuentas por Pagar Comerciales / Trade accounts payable 30,360 42,023 54,067 55,817 19,960 21,279 174,509 188,935 39,679 33,085Otras Cuentas por Pagar / Other accounts payable 29,092 32,036 106,893 89,120 10,092 10,053 59,664 70,495 3,235 3,416Cuentas por Pagar a Entidades Relacionadas / Accounts payable to related companies 15,693 18,482 175,528 20,551 9,572 3,168 33,681 22,175 1,187 1,125Provisiones / Provisions 2,461 23,626 0 0 0 0 0 0 124 110Pasivos por Impuestos a las Ganancias / Liabilities from income tax 0 11,077 4,712 1,916 0 0 4,314 3,827 0 0Provisión por Beneficios a los Empleados / Provisions for employee profit sharing 0 0 0 0 0 0 0 0 3,509 2,642Otros Pasivos / Other Liabilities 0 0 0 0 17,387 13,308 0 0 0 0Pasivos incluidos en Grupos de Activos para su Disposición Clasificados como Mantenidos para la Venta/ Liabilities included in groups of assets for disposal classified as held for sale 0 0 0 0 0 0 0 0 0 0
TOTAL PASIVOS CORRIENTES / TOTAL CURRENT LIABILITIES 240,276 252,625 480,988 303,991 67,310 57,840 780,789 880,619 83,578 74,416Otros Pasivos Financieros / Other financial liabilities 356,787 424,213 355,332 397,269 5,957 5,957 302,882 322,160 32,339 28,024Cuentas por Pagar Comerciales / Trade accounts payable 0 0 0 0 0 0 782 999 0 0Otras Cuentas por Pagar / Other accounts payable 0 0 0 0 0 0 0 0 0 0Cuentas por Pagar a Entidades Relacionadas / Accounts payable to related companies 0 0 0 0 0 0 0 0 0 0Pasivos por Impuestos a las Ganancias Diferidos / Liabilities from deferred income tax 83,182 81,415 48,518 48,518 0 0 86,727 85,488 25,883 25,730Provisiones / Provisions 12,409 10,909 10,411 10,411 0 0 0 0 0 0Provisión por Beneficios a los Empleados / Provisions for employee profit sharing 0 0 0 0 0 0 0 0 0 0Otros Pasivos / Other Liabilities 0 0 0 0 2,007 2,007 0 0 0 0Ingresos Diferidos (netos) / Deferred income (net) 0 0 0 0 0 0 0 0 0 0
TOTAL PASIVOS NO CORRIENTES / TOTAL NON-CURRENT LIABILITIES 452,378 516,537 414,261 456,198 7,964 7,964 390,391 408,647 58,222 53,754TOTAL PASIVOS / TOTAL LIABILITIES 692,654 769,162 895,249 760,189 75,274 65,804 1,171,180 1,289,266 141,800 128,170
Capital Emitido / Issued capital 531,461 419,977 261,705 231,821 20,230 20,230 897,024 640,705 37,116 37,116Primas de Emisión / Share premium 559,585 0 0 0 0 0 0 0 0 0Acciones de Inversión / Investment stock 50,503 49,575 278 246 5,178 5,178 191,367 136,685 18,438 18,438Acciones Propias en Cartera / Treasury shares 0 0 0 0 0 0 0 0 0 0Otras Reservas de Capital / Other capital reserves 94,951 90,451 46,364 46,364 4,593 4,593 0 0 9,033 9,033Resultados Acumulados / Retained earnings 390,879 358,266 409,911 559,379 102,743 113,565 63,836 383,275 29,705 28,337Otras Reservas de Patrimonio / Other equity reserves 14,537 9,257 0 0 0 0 119,099 100,712 0 0
TOTAL PATRIMONIO / TOTAL EQUITY 1,641,916 927,526 718,258 837,810 132,744 143,566 1,271,326 1,261,377 94,292 92,924TOTAL PASIVO Y PATRIMONIO / TOTAL LIABILITIES AND EQUITY 2,334,570 1,696,688 1,613,507 1,597,999 208,018 209,370 2,442,506 2,550,643 236,092 221,094
ESTADO DE RESULTADOS / INCOME STATEMENT 31/03/2012 31/03/2011 31/03/2012 31/03/2011 31/03/2012 31/03/2011 31/03/2012 31/03/2011 31/03/2012 31/03/2011
Ventas Netas de Bienes / Net sales of goods 185,062 155,480 146,202 114,785 53,026 37,770 544,609 555,160 52,098 43,990Prestación de Servicios / Services rendered 0 0 37,609 26,114 0 0 0 0 656 733
TOTAL DE INGRESOS DE ACTIVIDADES ORDINARIAS / TOTAL INCOME FROM REGULARACTIVITIES 185,062 155,480 183,811 140,899 53,026 37,770 544,609 555,160 52,754 44,723
Costo de Ventas / Cost of sales -96,564 -76,470 -98,666 -79,238 -37,173 -27,207 -451,973 -410,417 -46,935 -37,592GANANCIA (PERDIDA) BRUTA / GROSS PROFIT (LOSS) 88,498 79,010 85,145 61,661 15,853 10,563 92,636 144,743 5,819 7,131
Gastos de Ventas y Distribución / Sales and distribution expenses -2,488 -2,020 -5,941 -3,165 -3,831 -2,405 -28,538 -24,770 -2,344 -1,993Gastos de Administración / Overheads -33,371 -27,347 -15,372 -12,354 -2,958 -1,876 -20,519 -23,445 -2,595 -2,714Ganancia (Pérdida) de la baja en Activos Financieros medidos al Costo Amortizado / Profit (loss) fromdisposal of financial assets measured at amortized cost 0 0 0 0 0 0 0 0 0 0Otros Ingresos Operativos / Other operating income 2,472 3,273 1,226 517 157 894 1,195 935 996 743Otros Gastos Operativos / Other operating expenses 0 0 0 -73 -14 -634 0 0 0 0
GANANCIA (PERDIDA) OPERATIVA / OPERATING PROFIT (LOSS) 55,111 52,916 65,058 46,586 9,207 6,542 44,774 97,463 1,876 3,167Ingresos Financieros / Financial income 6,388 1,444 9,670 22,102 249 29 2,109 672 7 14Gastos Financieros / Financial expenses -8,653 -4,235 -9,262 -4,323 -562 -424 -10,124 -8,938 -598 -474Diferencias de Cambio neto / Exchange differences net -603 226 1,574 -156 0 -3 7,618 2,685 236 -221Participación en los Resultados Netos de Asociadas y Negocios Conjuntos Contabilizados por el Métodode la Participación / Equity in net results of associates and joint ventures booked by the equity method 0 0 0 0 0 0 0 0 0 0Ganancias (Pérdidas) de la Diferencia entre el Valor Libro Anterior y el Valor Justo de ActivosFinancieros Reclasificados Medidos a Valor Razonable / Profits (losses) from the difference between theprevious book value and fair value of financial assets reclassified and measured at fair value 0 0 0 0 0 0 0 0 0 0
RESULTADO ANTES DE IMPUESTO A LAS GANANCIAS / PRE-INCOME TAX RESULT 52,243 50,351 67,040 64,209 8,894 6,144 44,377 91,882 1,521 2,486Gasto por Impuesto a las Ganancias / Income tax expenses -15,130 -15,225 -20,217 -13,046 -2,716 -1,885 -12,429 -28,610 -153 -525
GANANCIA (PERDIDA) NETA DE OPERACIONES CONTINUADAS / NET PROFIT (LOSS) FROMCONTINUING TRADES 37,113 35,126 46,823 51,163 6,178 4,259 31,948 63,272 1,368 1,961
Ganancia (Pérdida) Neta del Impuesto a las Ganancias Procedente de Operaciones Discontinuadas / Netprofit (loss) arising from income tax discontinued trades 0 0 0 0 0 0 0 0 0 0
GANANCIA (PERDIDA) NETA DEL EJERCICIO / PERIOD'S NET PROFIT (LOSS) 37,113 35,126 46,823 51,163 6,178 4,259 31,948 63,272 1,368 1,961
INDICADORES FINANCIEROS / FINANCIAL RATIOSLiquidez / Liquid Ratio 5.05 0.89 0.81 1.71 1.19 Rotación de Activos / Gross Sales to Total Assets 0.08 0.11 0.25 0.22 0.22 Solvencia / Solvency 0.30 0.55 0.36 0.48 0.60 Deuda / Patrimonio / Debt / Equity 0.42 1.25 0.57 0.92 1.50 Rentabilidad sobre Ventas Netas % / Return % 20.05 25.47 11.65 5.87 2.59 Rentabilidad sobre Activos % / Return on Assets % 1.59 2.90 2.97 1.31 0.58 Rentabilidad de Patrimonio % / Return on Equity % 2.26 6.52 4.65 2.51 1.45

ESTADOS FINANCIEROS COMPARADOS / COMPARATIVE FINANCIAL STATEMENTS INDUSTRIALES / INDUSTRIALCIFRAS EXPRESADAS EN MILES DE NUEVOS SOLES
EMPRESA/COMPANY
SIDERPERU
IEQSA
Record
SIAM
HidrostalCIIU
2731
2732
2899
28990
29120
Pág 32 * Estados Financieros expresados en miles de US$
ESTADO DE SITUACION FINANCIERA / STATEMENT OF FINANCIAL POSITION 31/03/2012 31/12/2011 31/03/2012 31/12/2011 31/03/2012 31/12/2011 31/03/2012 31/12/2011 31/03/2012 31/12/2011
Efectivo y Equivalentes al Efectivo / Cash and cash equivalent 71,283 23,861 13,465 6,081 383 217 2,920 2,342 3,817 1,309Otros Activos Financieros / Other financial assets 0 0 0 0 0 0 0 0 0 0Cuentas por Cobrar Comerciales (neto) / Trade accounts receivable (net) 216,619 172,634 46,908 43,984 11,535 12,213 2,784 3,855 26,036 25,250Otras Cuentas por Cobrar (neto) / Other accounts receivable (net) 138,929 145,071 9,808 15,604 1,911 2,646 41 25 14,349 7,886Cuentas por Cobrar a Entidades Relacionadas / Accounts receivable from related companies 0 406 0 0 0 0 17 7 0 0Inventarios / Stocks 705,783 700,001 44,367 49,043 14,502 13,565 6,420 5,395 42,138 38,819Activos Biológicos / Biological assets 0 0 0 0 0 0 0 0 0 0Activos por Impuestos a las Ganancias / Assets from income tax 0 0 0 0 0 0 0 0 0 0Gastos Pagados por Anticipado / Prepaid expenses 1,077 2,583 342 260 2,164 482 50 26 801 981Otros Activos / Other assets 0 0 0 540 0 0 0 0 0 0Activos no Corrientes o Grupos de Activos para su Disposición Clasificados como Mantenidos para laVenta / Non-current assets or groups of assets for disposal classified as held for sale 0 0 0 0 0 0 0 0 0 0Activos no Corrientes o Grupos de Activos para su Disposición Clasificados como Mantenidos paraDistribuir a los Propietarios / Non-current assets or groups of assets for disposal classified as held forDistribution to owner 0 0 0 0 0 0 0 0 0 0
TOTAL ACTIVOS CORRIENTES / TOTAL CURRENT ASSETS 1,133,691 1,044,556 114,890 115,512 30,495 29,123 12,232 11,650 87,141 74,245Otros Activos Financieros / Other financial assets 0 0 0 0 0 0 0 0 0 0Inversiones Contabilizadas Aplicando el Método de la Participación / Investments booked using the equitymethod 0 0 0 0 0 0 0 0 0 0Cuentas por Cobrar Comerciales / Trade accounts receivable 0 0 0 0 0 0 0 0 691 1,043Otras Cuentas por Cobrar / Other accounts receivable 0 0 0 0 0 0 0 0 0 0Cuentas por Cobrar a Entidades Relacionadas / Accounts receivable from related companies 0 0 0 0 0 0 0 0 0 0Activos Biológicos / Biological assets 0 0 0 0 0 0 0 0 0 0Propiedades de Inversión / Investment property 0 0 4,081 4,081 0 0 0 0 0 0Propiedades, Planta y Equipo (neto) / Property, plant and equipment (net) 956,171 952,899 57,059 57,344 92,709 93,177 15,509 15,514 89,665 90,077Activos Intangibles (neto) / Intangible assets (net) 3,580 3,673 0 0 0 0 54 55 397 271Activos por Impuestos a las Ganancias Diferidos / Assets from deferred income tax 0 0 0 0 117 117 182 182 0 0Plusvalía / Capital gain 0 0 0 0 0 0 0 0 0 0Otros Activos / Other assets 136,745 136,745 8 8 0 0 0 0 0 0
TOTAL ACTIVOS NO CORRIENTES / TOTAL NON-CURRENT ASSETS 1,096,496 1,093,317 61,148 61,433 92,826 93,294 15,745 15,751 90,753 91,391TOTAL DE ACTIVOS / TOTAL ASSETS 2,230,187 2,137,873 176,038 176,945 123,321 122,417 27,977 27,401 177,894 165,636
Otros Pasivos Financieros / Other financial liabilities 605,067 463,987 15,655 10,012 7,231 6,864 144 121 30,046 23,498Cuentas por Pagar Comerciales / Trade accounts payable 52,639 35,415 30,024 38,781 4,421 4,119 1,643 1,537 10,054 5,418Otras Cuentas por Pagar / Other accounts payable 4,853 6,394 4,398 4,318 4,044 4,891 4,489 4,141 10,371 14,146Cuentas por Pagar a Entidades Relacionadas / Accounts payable to related companies 25,984 74,144 0 0 0 0 0 25 0 0Provisiones / Provisions 9,561 4,408 0 0 0 0 0 0 0 0Pasivos por Impuestos a las Ganancias / Liabilities from income tax 1,030 136 0 0 0 0 0 0 1,018 842Provisión por Beneficios a los Empleados / Provisions for employee profit sharing 16,083 11,224 0 0 0 0 0 0 729 315Otros Pasivos / Other Liabilities 0 0 278 0 0 0 0 0 0 0Pasivos incluidos en Grupos de Activos para su Disposición Clasificados como Mantenidos para la Venta/ Liabilities included in groups of assets for disposal classified as held for sale 0 0 0 0 0 0 0 0 0 0
TOTAL PASIVOS CORRIENTES / TOTAL CURRENT LIABILITIES 715,217 595,708 50,355 53,111 15,696 15,874 6,276 5,824 52,218 44,219Otros Pasivos Financieros / Other financial liabilities 391,756 416,220 192 210 111 118 290 299 12,107 10,173Cuentas por Pagar Comerciales / Trade accounts payable 0 0 0 0 0 0 0 0 0 0Otras Cuentas por Pagar / Other accounts payable 0 0 0 0 0 0 0 0 0 0Cuentas por Pagar a Entidades Relacionadas / Accounts payable to related companies 0 0 0 0 0 0 0 0 0 0Pasivos por Impuestos a las Ganancias Diferidos / Liabilities from deferred income tax 65,844 65,730 6,682 7,027 94 94 3,940 3,940 15,192 15,192Provisiones / Provisions 0 0 0 0 0 0 0 0 0 0Provisión por Beneficios a los Empleados / Provisions for employee profit sharing 0 0 0 0 0 0 0 0 0 0Otros Pasivos / Other Liabilities 4,378 5,249 0 0 0 0 0 0 0 0Ingresos Diferidos (netos) / Deferred income (net) 0 0 0 0 0 0 0 0 0 0
TOTAL PASIVOS NO CORRIENTES / TOTAL NON-CURRENT LIABILITIES 461,978 487,199 6,874 7,237 205 212 4,230 4,239 27,299 25,365TOTAL PASIVOS / TOTAL LIABILITIES 1,177,195 1,082,907 57,229 60,348 15,901 16,086 10,506 10,063 79,517 69,584
Capital Emitido / Issued capital 917,717 917,717 50,147 50,147 25,630 25,630 3,135 3,135 53,971 48,052Primas de Emisión / Share premium 83,000 83,000 0 0 0 0 0 0 0 0Acciones de Inversión / Investment stock 0 0 14,730 14,730 9,602 9,602 1,567 1,567 21,603 19,234Acciones Propias en Cartera / Treasury shares 0 0 0 0 0 0 0 0 0 0Otras Reservas de Capital / Other capital reserves 995 995 5,512 4,912 390 390 694 650 4,635 3,869Resultados Acumulados / Retained earnings 53,186 56,929 48,420 46,808 71,798 70,709 2,935 2,846 9,213 15,942Otras Reservas de Patrimonio / Other equity reserves -1,906 -3,675 0 0 0 0 9,140 9,140 8,955 8,955
TOTAL PATRIMONIO / TOTAL EQUITY 1,052,992 1,054,966 118,809 116,597 107,420 106,331 17,471 17,338 98,377 96,052TOTAL PASIVO Y PATRIMONIO / TOTAL LIABILITIES AND EQUITY 2,230,187 2,137,873 176,038 176,945 123,321 122,417 27,977 27,401 177,894 165,636
ESTADO DE RESULTADOS / INCOME STATEMENT 31/03/2012 31/03/2011 31/03/2012 31/03/2011 31/03/2012 31/03/2011 31/03/2012 31/03/2011 31/03/2012 31/03/2011
Ventas Netas de Bienes / Net sales of goods 423,234 408,272 77,841 85,044 13,110 12,843 4,566 2,603 37,239 28,721Prestación de Servicios / Services rendered 0 0 0 0 277 35 0 0 0 0
TOTAL DE INGRESOS DE ACTIVIDADES ORDINARIAS / TOTAL INCOME FROM REGULARACTIVITIES 423,234 408,272 77,841 85,044 13,387 12,878 4,566 2,603 37,239 28,721
Costo de Ventas / Cost of sales -399,638 -353,617 -70,067 -76,037 -7,579 -6,853 -3,346 -1,809 -27,270 -20,897GANANCIA (PERDIDA) BRUTA / GROSS PROFIT (LOSS) 23,596 54,655 7,774 9,007 5,808 6,025 1,220 794 9,969 7,824
Gastos de Ventas y Distribución / Sales and distribution expenses -9,174 -11,955 -2,504 -1,852 -3,228 -2,836 -504 -302 -5,550 -4,220Gastos de Administración / Overheads -8,487 -9,957 -2,599 -2,833 -1,501 -1,591 -411 -349 -1,230 -1,217Ganancia (Pérdida) de la baja en Activos Financieros medidos al Costo Amortizado / Profit (loss) fromdisposal of financial assets measured at amortized cost 0 0 0 0 0 0 0 0 0 0Otros Ingresos Operativos / Other operating income 474 9,245 201 229 38 0 54 65 283 167Otros Gastos Operativos / Other operating expenses -10,315 -2,780 0 0 -9 0 -129 -54 -20 -41
GANANCIA (PERDIDA) OPERATIVA / OPERATING PROFIT (LOSS) -3,906 39,208 2,872 4,551 1,108 1,598 230 154 3,452 2,513Ingresos Financieros / Financial income 24,685 17,076 23 11 47 49 0 2 47 149Gastos Financieros / Financial expenses -22,608 -18,629 -338 -311 -84 -111 -14 -16 -450 -418Diferencias de Cambio neto / Exchange differences net 0 0 -690 -603 29 -12 -27 -21 128 31Participación en los Resultados Netos de Asociadas y Negocios Conjuntos Contabilizados por el Métodode la Participación / Equity in net results of associates and joint ventures booked by the equity method 0 0 0 0 0 0 0 0 0 0Ganancias (Pérdidas) de la Diferencia entre el Valor Libro Anterior y el Valor Justo de ActivosFinancieros Reclasificados Medidos a Valor Razonable / Profits (losses) from the difference between theprevious book value and fair value of financial assets reclassified and measured at fair value 0 0 0 0 0 0 0 0 0 0
RESULTADO ANTES DE IMPUESTO A LAS GANANCIAS / PRE-INCOME TAX RESULT -1,829 37,655 1,867 3,648 1,100 1,524 189 119 3,177 2,275Gasto por Impuesto a las Ganancias / Income tax expenses -1,904 -15,974 345 -60 0 0 -56 -36 -852 -751
GANANCIA (PERDIDA) NETA DE OPERACIONES CONTINUADAS / NET PROFIT (LOSS) FROMCONTINUING TRADES -3,733 21,681 2,212 3,588 1,100 1,524 133 83 2,325 1,524
Ganancia (Pérdida) Neta del Impuesto a las Ganancias Procedente de Operaciones Discontinuadas / Netprofit (loss) arising from income tax discontinued trades 0 0 0 0 0 0 0 0 0 0
GANANCIA (PERDIDA) NETA DEL EJERCICIO / PERIOD'S NET PROFIT (LOSS) -3,733 21,681 2,212 3,588 1,100 1,524 133 83 2,325 1,524
INDICADORES FINANCIEROS / FINANCIAL RATIOSLiquidez / Liquid Ratio 1.59 2.28 1.94 1.95 1.67 Rotación de Activos / Gross Sales to Total Assets 0.19 0.44 0.11 0.16 0.21 Solvencia / Solvency 0.53 0.33 0.13 0.38 0.45 Deuda / Patrimonio / Debt / Equity 1.12 0.48 0.15 0.60 0.81 Rentabilidad sobre Ventas Netas % / Return % -.- 2.84 8.22 2.91 6.24 Rentabilidad sobre Activos % / Return on Assets % -.- 1.26 0.89 0.48 1.31 Rentabilidad de Patrimonio % / Return on Equity % -.- 1.86 1.02 0.76 2.36

ESTADOS FINANCIEROS COMPARADOS / COMPARATIVE FINANCIAL STATEMENTS INDUSTRIALES / INDUSTRIALCIFRAS EXPRESADAS EN MILES DE NUEVOS SOLES
EMPRESA/COMPANY
DELCROSA
ABB
Indeco (*)
Etna
Industria Textil PiuraCIIU
3110
31102
3130-4
31405-6
3211
Pág 33* Estados Financieros expresados en miles de US$
ESTADO DE SITUACION FINANCIERA / STATEMENT OF FINANCIAL POSITION 31/03/2012 31/12/2011 31/03/2012 31/12/2011 31/03/2012 31/12/2011 31/03/2012 31/12/2011 31/03/2012 31/12/2011
Efectivo y Equivalentes al Efectivo / Cash and cash equivalent 2,730 2,428 10,290 30,998 9,036 3,141 15,194 15,619 6,077 3,484Otros Activos Financieros / Other financial assets 0 0 0 0 0 0 0 82 0 0Cuentas por Cobrar Comerciales (neto) / Trade accounts receivable (net) 19,270 23,744 53,703 68,912 37,211 30,404 16,271 15,824 16,465 16,239Otras Cuentas por Cobrar (neto) / Other accounts receivable (net) 1,928 397 750 803 2,358 2,965 1,023 1,266 16,875 6,021Cuentas por Cobrar a Entidades Relacionadas / Accounts receivable from related companies 0 0 3,798 5,678 902 6,102 326 4,598 0 0Inventarios / Stocks 35,396 31,212 94,421 81,161 34,925 28,390 40,231 37,512 119,465 124,610Activos Biológicos / Biological assets 0 0 0 0 0 0 0 0 0 0Activos por Impuestos a las Ganancias / Assets from income tax 0 0 0 0 0 0 0 0 0 0Gastos Pagados por Anticipado / Prepaid expenses 38 0 1,337 323 0 0 1,519 611 4,961 969Otros Activos / Other assets 0 0 42,386 25,403 771 222 0 0 0 0Activos no Corrientes o Grupos de Activos para su Disposición Clasificados como Mantenidos para laVenta / Non-current assets or groups of assets for disposal classified as held for sale 32 32 0 0 0 0 0 0 0 0Activos no Corrientes o Grupos de Activos para su Disposición Clasificados como Mantenidos paraDistribuir a los Propietarios / Non-current assets or groups of assets for disposal classified as held forDistribution to owner 0 0 0 0 0 0 0 0 0 0
TOTAL ACTIVOS CORRIENTES / TOTAL CURRENT ASSETS 59,394 57,813 206,685 213,278 85,203 71,224 74,564 75,512 163,843 151,323Otros Activos Financieros / Other financial assets 0 0 0 0 0 0 6,123 4,427 0 0Inversiones Contabilizadas Aplicando el Método de la Participación / Investments booked using the equitymethod 0 0 0 0 2,110 2,110 0 0 0 0Cuentas por Cobrar Comerciales / Trade accounts receivable 0 0 0 0 0 0 0 0 0 0Otras Cuentas por Cobrar / Other accounts receivable 0 0 0 0 0 0 0 0 0 0Cuentas por Cobrar a Entidades Relacionadas / Accounts receivable from related companies 0 0 0 0 0 0 0 0 0 0Activos Biológicos / Biological assets 0 0 0 0 0 0 0 0 0 0Propiedades de Inversión / Investment property 0 0 0 0 0 0 0 0 443 443Propiedades, Planta y Equipo (neto) / Property, plant and equipment (net) 48,412 47,723 55,171 55,723 40,395 40,723 76,084 76,108 186,562 184,443Activos Intangibles (neto) / Intangible assets (net) 48 52 652 372 85 131 145 146 0 0Activos por Impuestos a las Ganancias Diferidos / Assets from deferred income tax 0 0 0 0 0 0 0 0 0 0Plusvalía / Capital gain 0 0 0 0 0 0 0 0 0 0Otros Activos / Other assets 0 0 0 0 0 0 0 0 0 0
TOTAL ACTIVOS NO CORRIENTES / TOTAL NON-CURRENT ASSETS 48,460 47,775 55,823 56,095 42,590 42,964 82,352 80,681 187,005 184,886TOTAL DE ACTIVOS / TOTAL ASSETS 107,854 105,588 262,508 269,373 127,793 114,188 156,916 156,193 350,848 336,209
Otros Pasivos Financieros / Other financial liabilities 24,626 30,653 3,670 6,412 134 225 819 3,179 109,367 107,425Cuentas por Pagar Comerciales / Trade accounts payable 11,822 19,896 70,799 55,871 23,600 11,774 730 978 9,109 3,478Otras Cuentas por Pagar / Other accounts payable 29,367 13,778 48,395 67,344 13,907 3,724 17,062 8,267 2,094 2,595Cuentas por Pagar a Entidades Relacionadas / Accounts payable to related companies 0 0 45,894 49,452 560 2,316 2,192 2,471 0 0Provisiones / Provisions 0 0 0 0 0 0 0 0 0 0Pasivos por Impuestos a las Ganancias / Liabilities from income tax 0 0 0 0 989 0 0 0 0 0Provisión por Beneficios a los Empleados / Provisions for employee profit sharing 0 0 1,459 529 1,784 3,369 334 0 232 106Otros Pasivos / Other Liabilities 0 0 0 0 0 0 0 0 0 0Pasivos incluidos en Grupos de Activos para su Disposición Clasificados como Mantenidos para la Venta/ Liabilities included in groups of assets for disposal classified as held for sale 0 0 0 0 0 0 0 0 0 0
TOTAL PASIVOS CORRIENTES / TOTAL CURRENT LIABILITIES 65,815 64,327 170,217 179,608 40,974 21,408 21,137 14,895 120,802 113,604Otros Pasivos Financieros / Other financial liabilities 3,769 3,162 0 0 10 0 593 1,051 10,294 1,889Cuentas por Pagar Comerciales / Trade accounts payable 0 0 0 0 0 0 0 0 0 0Otras Cuentas por Pagar / Other accounts payable 0 0 0 0 0 0 0 0 0 0Cuentas por Pagar a Entidades Relacionadas / Accounts payable to related companies 0 0 0 0 0 0 0 0 0 0Pasivos por Impuestos a las Ganancias Diferidos / Liabilities from deferred income tax 0 0 4,072 4,461 1,691 2,027 2,183 2,183 34,843 34,843Provisiones / Provisions 0 0 0 0 0 0 0 0 0 0Provisión por Beneficios a los Empleados / Provisions for employee profit sharing 0 0 0 0 0 0 0 0 0 0Otros Pasivos / Other Liabilities 0 0 0 0 0 0 0 0 0 0Ingresos Diferidos (netos) / Deferred income (net) 0 0 0 0 0 0 3,570 2,901 0 0
TOTAL PASIVOS NO CORRIENTES / TOTAL NON-CURRENT LIABILITIES 3,769 3,162 4,072 4,461 1,701 2,027 6,346 6,135 45,137 36,732TOTAL PASIVOS / TOTAL LIABILITIES 69,584 67,489 174,289 184,069 42,675 23,435 27,483 21,030 165,939 150,336
Capital Emitido / Issued capital 13,867 13,867 28,587 28,587 53,998 53,998 10,405 10,405 56,844 56,844Primas de Emisión / Share premium 0 0 0 0 0 0 0 0 0 0Acciones de Inversión / Investment stock 1,858 1,858 6,883 6,883 1,952 1,952 5,203 5,203 12,750 12,750Acciones Propias en Cartera / Treasury shares 481 481 -6,053 -6,053 0 0 0 0 0 0Otras Reservas de Capital / Other capital reserves 577 577 6,559 6,559 11,475 9,676 2,086 2,081 4,970 4,970Resultados Acumulados / Retained earnings 21,487 21,316 52,243 49,328 17,559 25,381 111,739 117,474 110,345 111,309Otras Reservas de Patrimonio / Other equity reserves 0 0 0 0 134 -254 0 0 0 0
TOTAL PATRIMONIO / TOTAL EQUITY 38,270 38,099 88,219 85,304 85,118 90,753 129,433 135,163 184,909 185,873TOTAL PASIVO Y PATRIMONIO / TOTAL LIABILITIES AND EQUITY 107,854 105,588 262,508 269,373 127,793 114,188 156,916 156,193 350,848 336,209
ESTADO DE RESULTADOS / INCOME STATEMENT 31/03/2012 31/03/2011 31/03/2012 31/03/2011 31/03/2012 31/03/2011 31/03/2012 31/03/2011 31/03/2012 31/03/2011
Ventas Netas de Bienes / Net sales of goods 8,746 8,967 100,730 89,694 79,279 87,331 21,758 21,732 18,762 36,002Prestación de Servicios / Services rendered 4,293 101 0 0 0 0 0 0 0 0
TOTAL DE INGRESOS DE ACTIVIDADES ORDINARIAS / TOTAL INCOME FROM REGULARACTIVITIES 13,039 9,068 100,730 89,694 79,279 87,331 21,758 21,732 18,762 36,002
Costo de Ventas / Cost of sales -9,555 -6,415 -82,486 -75,234 -67,323 -75,613 -13,063 -11,650 -19,247 -26,437GANANCIA (PERDIDA) BRUTA / GROSS PROFIT (LOSS) 3,484 2,653 18,244 14,460 11,956 11,718 8,695 10,082 -485 9,565
Gastos de Ventas y Distribución / Sales and distribution expenses -1,756 -1,272 -8,942 -6,646 -1,845 -1,608 -2,118 -2,056 -753 -1,169Gastos de Administración / Overheads -1,208 -1,071 -4,205 -3,893 -2,803 -2,878 -2,443 -1,474 -1,139 -1,344Ganancia (Pérdida) de la baja en Activos Financieros medidos al Costo Amortizado / Profit (loss) fromdisposal of financial assets measured at amortized cost 0 0 0 0 0 0 0 0 0 0Otros Ingresos Operativos / Other operating income 13 14 0 0 245 220 112 232 148 595Otros Gastos Operativos / Other operating expenses -127 -71 0 0 -28 -127 -21 -95 0 0
GANANCIA (PERDIDA) OPERATIVA / OPERATING PROFIT (LOSS) 406 253 5,097 3,921 7,525 7,325 4,225 6,689 -2,229 7,647Ingresos Financieros / Financial income 0 0 26 19 15 11 576 764 0 0Gastos Financieros / Financial expenses -575 -405 -42 -6 -74 -178 -542 -699 -1,382 -804Diferencias de Cambio neto / Exchange differences net 340 242 58 -190 -256 35 0 0 2,647 -1,159Participación en los Resultados Netos de Asociadas y Negocios Conjuntos Contabilizados por el Métodode la Participación / Equity in net results of associates and joint ventures booked by the equity method 0 0 0 0 0 17 0 0 0 0Ganancias (Pérdidas) de la Diferencia entre el Valor Libro Anterior y el Valor Justo de ActivosFinancieros Reclasificados Medidos a Valor Razonable / Profits (losses) from the difference between theprevious book value and fair value of financial assets reclassified and measured at fair value 0 0 0 0 0 187 0 0 0 0
RESULTADO ANTES DE IMPUESTO A LAS GANANCIAS / PRE-INCOME TAX RESULT 171 90 5,139 3,744 7,210 7,397 4,259 6,754 -964 5,684Gasto por Impuesto a las Ganancias / Income tax expenses 0 0 -2,224 -547 -1,988 -2,205 -1,563 -1,838 0 0
GANANCIA (PERDIDA) NETA DE OPERACIONES CONTINUADAS / NET PROFIT (LOSS) FROMCONTINUING TRADES 171 90 2,915 3,197 5,222 5,192 2,696 4,916 -964 5,684
Ganancia (Pérdida) Neta del Impuesto a las Ganancias Procedente de Operaciones Discontinuadas / Netprofit (loss) arising from income tax discontinued trades 0 0 0 0 0 0 0 0 0 0
GANANCIA (PERDIDA) NETA DEL EJERCICIO / PERIOD'S NET PROFIT (LOSS) 171 90 2,915 3,197 5,222 5,192 2,696 4,916 -964 5,684
INDICADORES FINANCIEROS / FINANCIAL RATIOSLiquidez / Liquid Ratio 0.90 1.21 2.08 3.53 1.36 Rotación de Activos / Gross Sales to Total Assets 0.12 0.38 0.62 0.14 0.05 Solvencia / Solvency 0.65 0.66 0.33 0.18 0.47 Deuda / Patrimonio / Debt / Equity 1.82 1.98 0.50 0.21 0.90 Rentabilidad sobre Ventas Netas % / Return % 1.31 2.89 6.59 12.39 -.- Rentabilidad sobre Activos % / Return on Assets % 0.16 1.11 4.09 1.72 -.- Rentabilidad de Patrimonio % / Return on Equity % 0.45 3.30 6.14 2.08 -.-

ESTADOS FINANCIEROS COMPARADOS / COMPARATIVE FINANCIAL STATEMENTS INDUSTRIALES / INDUSTRIALCIFRAS EXPRESADAS EN MILES DE NUEVOS SOLES
EMPRESA/COMPANY
Motores Diesel
Cía. Goodyear
LAYCONSA
Soldex
Corporación MistiCIIU
343
3551
3699
3699
5190
Pág 34 * Estados Financieros expresados en miles de US$
ESTADO DE SITUACION FINANCIERA / STATEMENT OF FINANCIAL POSITION 31/03/2012 31/12/2011 31/03/2012 31/12/2011 31/03/2012 31/12/2011 31/03/2012 31/12/2011 31/03/2012 31/12/2011
Efectivo y Equivalentes al Efectivo / Cash and cash equivalent 5,008 16,208 48,904 43,864 6,434 3,712 10,835 13,451 4,478 3,203Otros Activos Financieros / Other financial assets 0 0 0 0 0 0 0 0 0 0Cuentas por Cobrar Comerciales (neto) / Trade accounts receivable (net) 70,143 77,770 9,723 7,503 22,054 22,045 31,803 27,946 76,883 76,479Otras Cuentas por Cobrar (neto) / Other accounts receivable (net) 23,427 11,030 1,594 1,532 3,056 4,226 1,182 2,915 768 634Cuentas por Cobrar a Entidades Relacionadas / Accounts receivable from related companies 94 57 195,880 199,877 2,089 1,891 6,994 918 13,882 5,527Inventarios / Stocks 78,161 99,936 54,090 39,721 34,598 40,033 54,805 60,088 213,390 190,419Activos Biológicos / Biological assets 0 0 0 0 0 0 0 0 0 0Activos por Impuestos a las Ganancias / Assets from income tax 0 0 0 0 0 0 0 0 0 0Gastos Pagados por Anticipado / Prepaid expenses 2,520 2,679 4,149 9,488 0 0 534 284 3,163 1,936Otros Activos / Other assets 0 0 0 0 71 71 0 0 0 602Activos no Corrientes o Grupos de Activos para su Disposición Clasificados como Mantenidos para laVenta / Non-current assets or groups of assets for disposal classified as held for sale 0 0 0 0 0 0 0 0 0 0Activos no Corrientes o Grupos de Activos para su Disposición Clasificados como Mantenidos paraDistribuir a los Propietarios / Non-current assets or groups of assets for disposal classified as held forDistribution to owner 0 0 0 0 0 0 0 0 0 0
TOTAL ACTIVOS CORRIENTES / TOTAL CURRENT ASSETS 179,353 207,680 314,340 301,985 68,302 71,978 106,153 105,602 312,564 278,800Otros Activos Financieros / Other financial assets 0 0 0 0 0 0 0 0 618 618Inversiones Contabilizadas Aplicando el Método de la Participación / Investments booked using the equitymethod 0 0 0 0 9,518 9,518 320,468 320,468 0 0Cuentas por Cobrar Comerciales / Trade accounts receivable 24,537 28,139 0 0 0 0 0 0 0 0Otras Cuentas por Cobrar / Other accounts receivable 0 0 400 363 0 0 0 0 0 0Cuentas por Cobrar a Entidades Relacionadas / Accounts receivable from related companies 0 0 0 0 0 0 0 0 0 0Activos Biológicos / Biological assets 0 0 0 0 0 0 0 0 0 0Propiedades de Inversión / Investment property 0 0 0 0 0 0 0 0 0 0Propiedades, Planta y Equipo (neto) / Property, plant and equipment (net) 107,572 107,395 156,810 157,643 38,173 37,976 28,256 28,187 38,056 28,707Activos Intangibles (neto) / Intangible assets (net) 815 912 12,598 12,948 15 16 1,997 2,096 631 666Activos por Impuestos a las Ganancias Diferidos / Assets from deferred income tax 0 0 0 0 0 0 0 0 1,622 2,041Plusvalía / Capital gain 0 0 0 0 0 0 0 0 0 0Otros Activos / Other assets 0 0 0 0 997 946 0 0 0 0
TOTAL ACTIVOS NO CORRIENTES / TOTAL NON-CURRENT ASSETS 132,924 136,446 169,808 170,954 48,703 48,456 350,721 350,751 40,927 32,032TOTAL DE ACTIVOS / TOTAL ASSETS 312,277 344,126 484,148 472,939 117,005 120,434 456,874 456,353 353,491 310,832
Otros Pasivos Financieros / Other financial liabilities 44,521 83,831 0 0 31,556 38,143 19,343 19,458 164,821 141,024Cuentas por Pagar Comerciales / Trade accounts payable 13,915 25,563 51,018 55,670 9,234 13,670 12,486 25,673 16,977 11,281Otras Cuentas por Pagar / Other accounts payable 17,425 14,425 4,268 4,925 8,079 2,859 11,679 8,444 29,930 24,439Cuentas por Pagar a Entidades Relacionadas / Accounts payable to related companies 12 0 20,899 10,225 3,130 3,130 1,266 1,266 0 0Provisiones / Provisions 0 0 0 0 0 0 0 0 0 0Pasivos por Impuestos a las Ganancias / Liabilities from income tax 0 0 0 1,920 0 0 0 0 0 0Provisión por Beneficios a los Empleados / Provisions for employee profit sharing 0 0 6,507 7,199 0 0 0 0 0 0Otros Pasivos / Other Liabilities 15,111 0 0 0 1,232 948 0 63 0 0Pasivos incluidos en Grupos de Activos para su Disposición Clasificados como Mantenidos para la Venta/ Liabilities included in groups of assets for disposal classified as held for sale 0 0 0 0 0 0 0 0 0 0
TOTAL PASIVOS CORRIENTES / TOTAL CURRENT LIABILITIES 90,984 123,819 82,692 79,939 53,231 58,750 44,774 54,904 211,728 176,744Otros Pasivos Financieros / Other financial liabilities 0 0 0 0 2,655 1,926 80,316 81,031 5,236 708Cuentas por Pagar Comerciales / Trade accounts payable 0 0 0 0 0 0 0 0 0 0Otras Cuentas por Pagar / Other accounts payable 18,182 22,268 0 0 0 0 0 0 0 0Cuentas por Pagar a Entidades Relacionadas / Accounts payable to related companies 0 0 0 0 0 0 0 0 0 0Pasivos por Impuestos a las Ganancias Diferidos / Liabilities from deferred income tax 0 0 30,081 30,081 0 0 912 900 0 0Provisiones / Provisions 0 0 0 0 0 0 0 0 0 0Provisión por Beneficios a los Empleados / Provisions for employee profit sharing 0 0 0 0 0 0 0 0 0 0Otros Pasivos / Other Liabilities 0 0 0 0 0 0 0 0 0 0Ingresos Diferidos (netos) / Deferred income (net) 21,401 21,419 0 0 0 0 0 0 0 0
TOTAL PASIVOS NO CORRIENTES / TOTAL NON-CURRENT LIABILITIES 39,583 43,687 30,081 30,081 2,655 1,926 81,228 81,931 5,236 708TOTAL PASIVOS / TOTAL LIABILITIES 130,567 167,506 112,773 110,020 55,886 60,676 126,002 136,835 216,964 177,452
Capital Emitido / Issued capital 25,277 25,277 79,361 79,361 7,470 7,470 148,309 148,309 62,564 62,564Primas de Emisión / Share premium 0 0 0 0 0 0 0 0 0 0Acciones de Inversión / Investment stock 4,123 4,123 22,322 22,322 3,275 3,275 74,153 74,153 0 0Acciones Propias en Cartera / Treasury shares 0 0 0 0 0 0 0 0 0 0Otras Reservas de Capital / Other capital reserves 5,056 5,056 15,872 15,872 2,759 2,759 14,059 11,279 12,513 12,513Resultados Acumulados / Retained earnings 147,254 142,164 253,820 245,364 22,953 21,592 94,351 85,777 61,450 58,303Otras Reservas de Patrimonio / Other equity reserves 0 0 0 0 24,662 24,662 0 0 0 0
TOTAL PATRIMONIO / TOTAL EQUITY 181,710 176,620 371,375 362,919 61,119 59,758 330,872 319,518 136,527 133,380TOTAL PASIVO Y PATRIMONIO / TOTAL LIABILITIES AND EQUITY 312,277 344,126 484,148 472,939 117,005 120,434 456,874 456,353 353,491 310,832
ESTADO DE RESULTADOS / INCOME STATEMENT 31/03/2012 31/03/2011 31/03/2012 31/03/2011 31/03/2012 31/03/2011 31/03/2012 31/03/2011 31/03/2012 31/03/2011
Ventas Netas de Bienes / Net sales of goods 57,293 65,288 116,486 102,977 18,115 16,851 49,450 0 136,410 119,640Prestación de Servicios / Services rendered 0 0 0 0 0 0 0 0 0 0
TOTAL DE INGRESOS DE ACTIVIDADES ORDINARIAS / TOTAL INCOME FROM REGULARACTIVITIES 57,293 65,288 116,486 102,977 18,115 16,851 49,450 0 136,410 119,640
Costo de Ventas / Cost of sales -43,516 -55,189 -93,755 -81,242 -12,745 -10,655 -31,849 0 -126,019 -100,599GANANCIA (PERDIDA) BRUTA / GROSS PROFIT (LOSS) 13,777 10,099 22,731 21,735 5,370 6,196 17,601 0 10,391 19,041
Gastos de Ventas y Distribución / Sales and distribution expenses -3,644 -3,491 -3,346 -4,973 -2,267 -2,164 -5,226 0 -3,922 -4,360Gastos de Administración / Overheads -3,574 -3,071 -5,742 -3,146 -947 -1,028 -4,007 -9 -4,019 -4,708Ganancia (Pérdida) de la baja en Activos Financieros medidos al Costo Amortizado / Profit (loss) fromdisposal of financial assets measured at amortized cost 0 0 0 0 0 0 0 0 0 0Otros Ingresos Operativos / Other operating income 1,330 167 612 105 12 85 1,645 0 2,313 1,223Otros Gastos Operativos / Other operating expenses 0 0 -1,517 -1,722 0 0 -1,996 0 -434 -1,279
GANANCIA (PERDIDA) OPERATIVA / OPERATING PROFIT (LOSS) 7,889 3,704 12,738 11,999 2,168 3,089 8,017 -9 4,329 9,917Ingresos Financieros / Financial income 1,229 946 1,535 1,233 600 236 6,335 0 779 534Gastos Financieros / Financial expenses -795 -417 -283 -330 -563 -393 -2,015 0 -1,690 -954Diferencias de Cambio neto / Exchange differences net 0 0 -614 -77 0 0 1,119 0 1,310 -631Participación en los Resultados Netos de Asociadas y Negocios Conjuntos Contabilizados por el Métodode la Participación / Equity in net results of associates and joint ventures booked by the equity method 0 0 0 0 0 0 0 0 0 0Ganancias (Pérdidas) de la Diferencia entre el Valor Libro Anterior y el Valor Justo de ActivosFinancieros Reclasificados Medidos a Valor Razonable / Profits (losses) from the difference between theprevious book value and fair value of financial assets reclassified and measured at fair value 0 0 0 0 0 0 0 0 0 0
RESULTADO ANTES DE IMPUESTO A LAS GANANCIAS / PRE-INCOME TAX RESULT 8,323 4,233 13,376 12,825 2,205 2,932 13,456 -9 4,728 8,866Gasto por Impuesto a las Ganancias / Income tax expenses -3,250 -1,288 -4,920 -3,984 -844 -1,100 -2,102 0 -1,581 -2,893
GANANCIA (PERDIDA) NETA DE OPERACIONES CONTINUADAS / NET PROFIT (LOSS) FROMCONTINUING TRADES 5,073 2,945 8,456 8,841 1,361 1,832 11,354 -9 3,147 5,973
Ganancia (Pérdida) Neta del Impuesto a las Ganancias Procedente de Operaciones Discontinuadas / Netprofit (loss) arising from income tax discontinued trades 0 0 0 0 0 0 0 0 0 0
GANANCIA (PERDIDA) NETA DEL EJERCICIO / PERIOD'S NET PROFIT (LOSS) 5,073 2,945 8,456 8,841 1,361 1,832 11,354 -9 3,147 5,973
INDICADORES FINANCIEROS / FINANCIAL RATIOSLiquidez / Liquid Ratio 1.97 3.80 1.28 2.37 1.48 Rotación de Activos / Gross Sales to Total Assets 0.18 0.24 0.15 0.11 0.39 Solvencia / Solvency 0.42 0.23 0.48 0.28 0.61 Deuda / Patrimonio / Debt / Equity 0.72 0.30 0.91 0.38 1.59 Rentabilidad sobre Ventas Netas % / Return % 8.85 7.26 7.51 22.96 2.31 Rentabilidad sobre Activos % / Return on Assets % 1.62 1.75 1.16 2.49 0.89 Rentabilidad de Patrimonio % / Return on Equity % 2.79 2.28 2.23 3.43 2.31
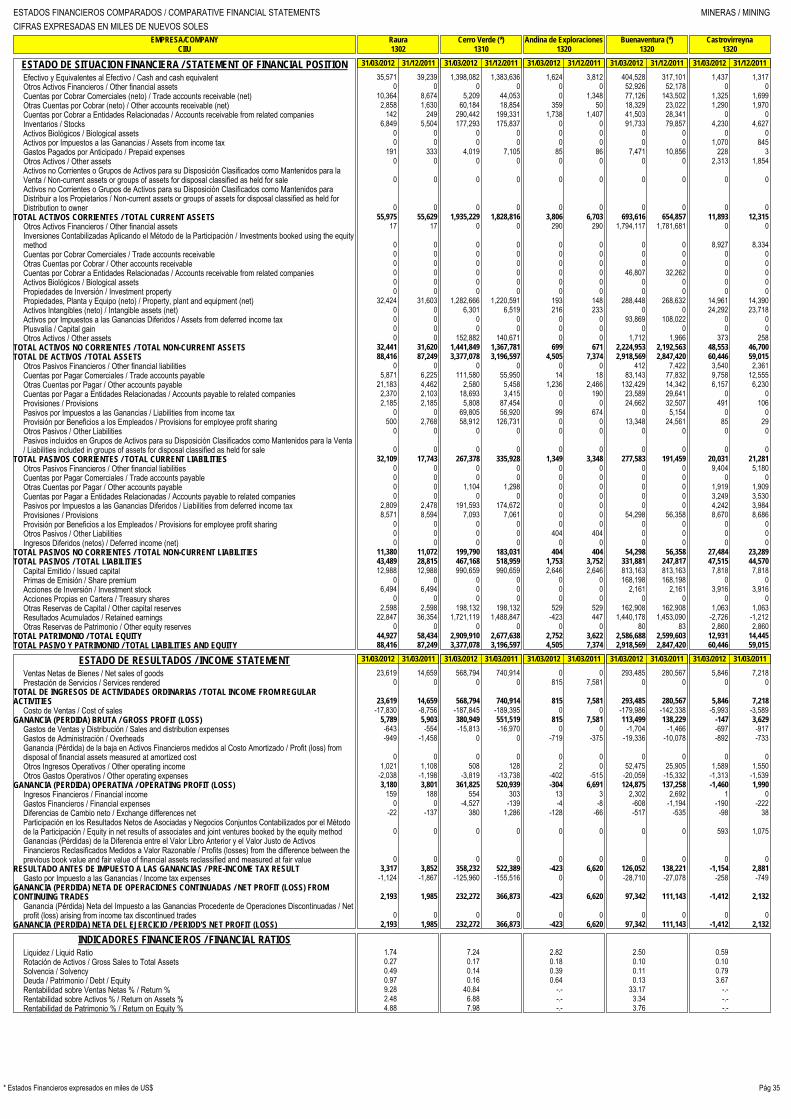
ESTADOS FINANCIEROS COMPARADOS / COMPARATIVE FINANCIAL STATEMENTS MINERAS / MININGCIFRAS EXPRESADAS EN MILES DE NUEVOS SOLES
EMPRESA/COMPANY
Raura
Cerro Verde (*)
Andina de Exploraciones
Buenaventura (*)
CastrovirreynaCIIU
1302
1310
1320
1320
1320
Pág 35* Estados Financieros expresados en miles de US$
ESTADO DE SITUACION FINANCIERA / STATEMENT OF FINANCIAL POSITION 31/03/2012 31/12/2011 31/03/2012 31/12/2011 31/03/2012 31/12/2011 31/03/2012 31/12/2011 31/03/2012 31/12/2011
Efectivo y Equivalentes al Efectivo / Cash and cash equivalent 35,571 39,239 1,398,082 1,383,636 1,624 3,812 404,528 317,101 1,437 1,317Otros Activos Financieros / Other financial assets 0 0 0 0 0 0 52,926 52,178 0 0Cuentas por Cobrar Comerciales (neto) / Trade accounts receivable (net) 10,364 8,674 5,209 44,053 0 1,348 77,126 143,502 1,325 1,699Otras Cuentas por Cobrar (neto) / Other accounts receivable (net) 2,858 1,630 60,184 18,854 359 50 18,329 23,022 1,290 1,970Cuentas por Cobrar a Entidades Relacionadas / Accounts receivable from related companies 142 249 290,442 199,331 1,738 1,407 41,503 28,341 0 0Inventarios / Stocks 6,849 5,504 177,293 175,837 0 0 91,733 79,857 4,230 4,627Activos Biológicos / Biological assets 0 0 0 0 0 0 0 0 0 0Activos por Impuestos a las Ganancias / Assets from income tax 0 0 0 0 0 0 0 0 1,070 845Gastos Pagados por Anticipado / Prepaid expenses 191 333 4,019 7,105 85 86 7,471 10,856 228 3Otros Activos / Other assets 0 0 0 0 0 0 0 0 2,313 1,854Activos no Corrientes o Grupos de Activos para su Disposición Clasificados como Mantenidos para laVenta / Non-current assets or groups of assets for disposal classified as held for sale 0 0 0 0 0 0 0 0 0 0Activos no Corrientes o Grupos de Activos para su Disposición Clasificados como Mantenidos paraDistribuir a los Propietarios / Non-current assets or groups of assets for disposal classified as held forDistribution to owner 0 0 0 0 0 0 0 0 0 0
TOTAL ACTIVOS CORRIENTES / TOTAL CURRENT ASSETS 55,975 55,629 1,935,229 1,828,816 3,806 6,703 693,616 654,857 11,893 12,315Otros Activos Financieros / Other financial assets 17 17 0 0 290 290 1,794,117 1,781,681 0 0Inversiones Contabilizadas Aplicando el Método de la Participación / Investments booked using the equitymethod 0 0 0 0 0 0 0 0 8,927 8,334Cuentas por Cobrar Comerciales / Trade accounts receivable 0 0 0 0 0 0 0 0 0 0Otras Cuentas por Cobrar / Other accounts receivable 0 0 0 0 0 0 0 0 0 0Cuentas por Cobrar a Entidades Relacionadas / Accounts receivable from related companies 0 0 0 0 0 0 46,807 32,262 0 0Activos Biológicos / Biological assets 0 0 0 0 0 0 0 0 0 0Propiedades de Inversión / Investment property 0 0 0 0 0 0 0 0 0 0Propiedades, Planta y Equipo (neto) / Property, plant and equipment (net) 32,424 31,603 1,282,666 1,220,591 193 148 288,448 268,632 14,961 14,390Activos Intangibles (neto) / Intangible assets (net) 0 0 6,301 6,519 216 233 0 0 24,292 23,718Activos por Impuestos a las Ganancias Diferidos / Assets from deferred income tax 0 0 0 0 0 0 93,869 108,022 0 0Plusvalía / Capital gain 0 0 0 0 0 0 0 0 0 0Otros Activos / Other assets 0 0 152,882 140,671 0 0 1,712 1,966 373 258
TOTAL ACTIVOS NO CORRIENTES / TOTAL NON-CURRENT ASSETS 32,441 31,620 1,441,849 1,367,781 699 671 2,224,953 2,192,563 48,553 46,700TOTAL DE ACTIVOS / TOTAL ASSETS 88,416 87,249 3,377,078 3,196,597 4,505 7,374 2,918,569 2,847,420 60,446 59,015
Otros Pasivos Financieros / Other financial liabilities 0 0 0 0 0 0 412 7,422 3,540 2,361Cuentas por Pagar Comerciales / Trade accounts payable 5,871 6,225 111,580 55,950 14 18 83,143 77,832 9,758 12,555Otras Cuentas por Pagar / Other accounts payable 21,183 4,462 2,580 5,458 1,236 2,466 132,429 14,342 6,157 6,230Cuentas por Pagar a Entidades Relacionadas / Accounts payable to related companies 2,370 2,103 18,693 3,415 0 190 23,589 29,641 0 0Provisiones / Provisions 2,185 2,185 5,808 87,454 0 0 24,662 32,507 491 106Pasivos por Impuestos a las Ganancias / Liabilities from income tax 0 0 69,805 56,920 99 674 0 5,154 0 0Provisión por Beneficios a los Empleados / Provisions for employee profit sharing 500 2,768 58,912 126,731 0 0 13,348 24,561 85 29Otros Pasivos / Other Liabilities 0 0 0 0 0 0 0 0 0 0Pasivos incluidos en Grupos de Activos para su Disposición Clasificados como Mantenidos para la Venta/ Liabilities included in groups of assets for disposal classified as held for sale 0 0 0 0 0 0 0 0 0 0
TOTAL PASIVOS CORRIENTES / TOTAL CURRENT LIABILITIES 32,109 17,743 267,378 335,928 1,349 3,348 277,583 191,459 20,031 21,281Otros Pasivos Financieros / Other financial liabilities 0 0 0 0 0 0 0 0 9,404 5,180Cuentas por Pagar Comerciales / Trade accounts payable 0 0 0 0 0 0 0 0 0 0Otras Cuentas por Pagar / Other accounts payable 0 0 1,104 1,298 0 0 0 0 1,919 1,909Cuentas por Pagar a Entidades Relacionadas / Accounts payable to related companies 0 0 0 0 0 0 0 0 3,249 3,530Pasivos por Impuestos a las Ganancias Diferidos / Liabilities from deferred income tax 2,809 2,478 191,593 174,672 0 0 0 0 4,242 3,984Provisiones / Provisions 8,571 8,594 7,093 7,061 0 0 54,298 56,358 8,670 8,686Provisión por Beneficios a los Empleados / Provisions for employee profit sharing 0 0 0 0 0 0 0 0 0 0Otros Pasivos / Other Liabilities 0 0 0 0 404 404 0 0 0 0Ingresos Diferidos (netos) / Deferred income (net) 0 0 0 0 0 0 0 0 0 0
TOTAL PASIVOS NO CORRIENTES / TOTAL NON-CURRENT LIABILITIES 11,380 11,072 199,790 183,031 404 404 54,298 56,358 27,484 23,289TOTAL PASIVOS / TOTAL LIABILITIES 43,489 28,815 467,168 518,959 1,753 3,752 331,881 247,817 47,515 44,570
Capital Emitido / Issued capital 12,988 12,988 990,659 990,659 2,646 2,646 813,163 813,163 7,818 7,818Primas de Emisión / Share premium 0 0 0 0 0 0 168,198 168,198 0 0Acciones de Inversión / Investment stock 6,494 6,494 0 0 0 0 2,161 2,161 3,916 3,916Acciones Propias en Cartera / Treasury shares 0 0 0 0 0 0 0 0 0 0Otras Reservas de Capital / Other capital reserves 2,598 2,598 198,132 198,132 529 529 162,908 162,908 1,063 1,063Resultados Acumulados / Retained earnings 22,847 36,354 1,721,119 1,488,847 -423 447 1,440,178 1,453,090 -2,726 -1,212Otras Reservas de Patrimonio / Other equity reserves 0 0 0 0 0 0 80 83 2,860 2,860
TOTAL PATRIMONIO / TOTAL EQUITY 44,927 58,434 2,909,910 2,677,638 2,752 3,622 2,586,688 2,599,603 12,931 14,445TOTAL PASIVO Y PATRIMONIO / TOTAL LIABILITIES AND EQUITY 88,416 87,249 3,377,078 3,196,597 4,505 7,374 2,918,569 2,847,420 60,446 59,015
ESTADO DE RESULTADOS / INCOME STATEMENT 31/03/2012 31/03/2011 31/03/2012 31/03/2011 31/03/2012 31/03/2011 31/03/2012 31/03/2011 31/03/2012 31/03/2011
Ventas Netas de Bienes / Net sales of goods 23,619 14,659 568,794 740,914 0 0 293,485 280,567 5,846 7,218Prestación de Servicios / Services rendered 0 0 0 0 815 7,581 0 0 0 0
TOTAL DE INGRESOS DE ACTIVIDADES ORDINARIAS / TOTAL INCOME FROM REGULARACTIVITIES 23,619 14,659 568,794 740,914 815 7,581 293,485 280,567 5,846 7,218
Costo de Ventas / Cost of sales -17,830 -8,756 -187,845 -189,395 0 0 -179,986 -142,338 -5,993 -3,589GANANCIA (PERDIDA) BRUTA / GROSS PROFIT (LOSS) 5,789 5,903 380,949 551,519 815 7,581 113,499 138,229 -147 3,629
Gastos de Ventas y Distribución / Sales and distribution expenses -643 -554 -15,813 -16,970 0 0 -1,704 -1,466 -697 -917Gastos de Administración / Overheads -949 -1,458 0 0 -719 -375 -19,336 -10,078 -892 -733Ganancia (Pérdida) de la baja en Activos Financieros medidos al Costo Amortizado / Profit (loss) fromdisposal of financial assets measured at amortized cost 0 0 0 0 0 0 0 0 0 0Otros Ingresos Operativos / Other operating income 1,021 1,108 508 128 2 0 52,475 25,905 1,589 1,550Otros Gastos Operativos / Other operating expenses -2,038 -1,198 -3,819 -13,738 -402 -515 -20,059 -15,332 -1,313 -1,539
GANANCIA (PERDIDA) OPERATIVA / OPERATING PROFIT (LOSS) 3,180 3,801 361,825 520,939 -304 6,691 124,875 137,258 -1,460 1,990Ingresos Financieros / Financial income 159 188 554 303 13 3 2,302 2,692 1 0Gastos Financieros / Financial expenses 0 0 -4,527 -139 -4 -8 -608 -1,194 -190 -222Diferencias de Cambio neto / Exchange differences net -22 -137 380 1,286 -128 -66 -517 -535 -98 38Participación en los Resultados Netos de Asociadas y Negocios Conjuntos Contabilizados por el Métodode la Participación / Equity in net results of associates and joint ventures booked by the equity method 0 0 0 0 0 0 0 0 593 1,075Ganancias (Pérdidas) de la Diferencia entre el Valor Libro Anterior y el Valor Justo de ActivosFinancieros Reclasificados Medidos a Valor Razonable / Profits (losses) from the difference between theprevious book value and fair value of financial assets reclassified and measured at fair value 0 0 0 0 0 0 0 0 0 0
RESULTADO ANTES DE IMPUESTO A LAS GANANCIAS / PRE-INCOME TAX RESULT 3,317 3,852 358,232 522,389 -423 6,620 126,052 138,221 -1,154 2,881Gasto por Impuesto a las Ganancias / Income tax expenses -1,124 -1,867 -125,960 -155,516 0 0 -28,710 -27,078 -258 -749
GANANCIA (PERDIDA) NETA DE OPERACIONES CONTINUADAS / NET PROFIT (LOSS) FROMCONTINUING TRADES 2,193 1,985 232,272 366,873 -423 6,620 97,342 111,143 -1,412 2,132
Ganancia (Pérdida) Neta del Impuesto a las Ganancias Procedente de Operaciones Discontinuadas / Netprofit (loss) arising from income tax discontinued trades 0 0 0 0 0 0 0 0 0 0
GANANCIA (PERDIDA) NETA DEL EJERCICIO / PERIOD'S NET PROFIT (LOSS) 2,193 1,985 232,272 366,873 -423 6,620 97,342 111,143 -1,412 2,132
INDICADORES FINANCIEROS / FINANCIAL RATIOSLiquidez / Liquid Ratio 1.74 7.24 2.82 2.50 0.59 Rotación de Activos / Gross Sales to Total Assets 0.27 0.17 0.18 0.10 0.10 Solvencia / Solvency 0.49 0.14 0.39 0.11 0.79 Deuda / Patrimonio / Debt / Equity 0.97 0.16 0.64 0.13 3.67 Rentabilidad sobre Ventas Netas % / Return % 9.28 40.84 -.- 33.17 -.- Rentabilidad sobre Activos % / Return on Assets % 2.48 6.88 -.- 3.34 -.- Rentabilidad de Patrimonio % / Return on Equity % 4.88 7.98 -.- 3.76 -.-

ESTADOS FINANCIEROS COMPARADOS / COMPARATIVE FINANCIAL STATEMENTS MINERAS / MININGCIFRAS EXPRESADAS EN MILES DE NUEVOS SOLES
EMPRESA/COMPANY
El Brocal (*)
Gold Fields La Cima
Minera Barrick (*)
Minsur (*)
MorocochaCIIU
1320
1320
1320
1320
1320
Pág 36 * Estados Financieros expresados en miles de US$
ESTADO DE SITUACION FINANCIERA / STATEMENT OF FINANCIAL POSITION 31/03/2012 31/12/2011 31/03/2012 31/12/2011 31/03/2012 31/12/2011 31/03/2012 31/12/2011 31/03/2012 31/12/2011
Efectivo y Equivalentes al Efectivo / Cash and cash equivalent 38,909 81,097 387,473 286,629 771,734 520,279 528,933 504,693 1,061 395Otros Activos Financieros / Other financial assets 1,812 1,400 0 0 0 0 6,319 6,849 0 0Cuentas por Cobrar Comerciales (neto) / Trade accounts receivable (net) 44,308 22,073 231,566 265,113 154,479 334,228 44,377 30,204 1,842 2,104Otras Cuentas por Cobrar (neto) / Other accounts receivable (net) 12,431 12,872 43,428 32,877 10,758 11,536 14,514 10,612 2,885 2,374Cuentas por Cobrar a Entidades Relacionadas / Accounts receivable from related companies 0 0 242 161 608,505 609,124 7,180 1,285 0 0Inventarios / Stocks 97,039 89,399 64,285 71,306 165,249 160,628 104,543 101,412 3,158 3,326Activos Biológicos / Biological assets 0 0 0 0 0 0 0 0 0 0Activos por Impuestos a las Ganancias / Assets from income tax 3,047 787 255,547 201,868 0 0 0 0 0 0Gastos Pagados por Anticipado / Prepaid expenses 1,480 2,116 16,089 16,294 1,669 2,511 776 1,150 2,222 1,005Otros Activos / Other assets 0 0 0 0 0 0 0 0 1,730 1,174Activos no Corrientes o Grupos de Activos para su Disposición Clasificados como Mantenidos para laVenta / Non-current assets or groups of assets for disposal classified as held for sale 0 0 0 0 0 0 0 0 0 0Activos no Corrientes o Grupos de Activos para su Disposición Clasificados como Mantenidos paraDistribuir a los Propietarios / Non-current assets or groups of assets for disposal classified as held forDistribution to owner 0 0 0 0 0 0 0 0 0 0
TOTAL ACTIVOS CORRIENTES / TOTAL CURRENT ASSETS 199,026 209,744 998,630 874,248 1,712,394 1,638,306 706,642 656,205 12,898 10,378Otros Activos Financieros / Other financial assets 0 0 0 0 0 0 0 0 0 0Inversiones Contabilizadas Aplicando el Método de la Participación / Investments booked using the equitymethod 0 0 18,269 16,512 0 0 1,114,274 1,114,274 0 0Cuentas por Cobrar Comerciales / Trade accounts receivable 0 0 0 0 0 0 0 0 0 0Otras Cuentas por Cobrar / Other accounts receivable 0 0 0 0 372 375 27,621 27,324 7,383 4,978Cuentas por Cobrar a Entidades Relacionadas / Accounts receivable from related companies 0 0 0 0 0 0 0 0 23,074 22,881Activos Biológicos / Biological assets 0 0 0 0 0 0 0 0 0 0Propiedades de Inversión / Investment property 0 0 0 0 0 0 0 0 195 195Propiedades, Planta y Equipo (neto) / Property, plant and equipment (net) 188,643 174,100 1,796,039 1,786,785 554,628 543,356 270,600 254,258 151,925 152,978Activos Intangibles (neto) / Intangible assets (net) 62,639 68,791 602,881 608,064 357 357 0 0 58,542 59,007Activos por Impuestos a las Ganancias Diferidos / Assets from deferred income tax 12,293 13,508 0 0 33,345 29,665 0 0 0 0Plusvalía / Capital gain 0 0 0 0 0 0 0 0 0 0Otros Activos / Other assets 2,500 1,988 0 0 40,670 43,384 5,429 5,465 0 0
TOTAL ACTIVOS NO CORRIENTES / TOTAL NON-CURRENT ASSETS 266,075 258,387 2,417,189 2,411,361 629,372 617,137 1,417,924 1,401,321 241,119 240,039TOTAL DE ACTIVOS / TOTAL ASSETS 465,101 468,131 3,415,819 3,285,609 2,341,766 2,255,443 2,124,566 2,057,526 254,017 250,417
Otros Pasivos Financieros / Other financial liabilities 1,679 0 107,092 108,180 62,542 63,001 0 0 17,694 19,890Cuentas por Pagar Comerciales / Trade accounts payable 26,836 31,027 74,342 74,861 20,664 29,846 13,969 10,475 15,531 16,777Otras Cuentas por Pagar / Other accounts payable 39,051 15,148 114,633 140,576 28,204 61,864 160,591 2,720 5,253 4,204Cuentas por Pagar a Entidades Relacionadas / Accounts payable to related companies 171 375 390 220 5,304 5,121 421 5,270 5,384 5,375Provisiones / Provisions 5,468 5,468 0 0 0 0 0 0 0 0Pasivos por Impuestos a las Ganancias / Liabilities from income tax 0 0 352,574 301,492 -25,536 37,566 13,346 13,256 0 0Provisión por Beneficios a los Empleados / Provisions for employee profit sharing 0 0 1,566 634 44,892 31,759 14,479 52,420 0 0Otros Pasivos / Other Liabilities 4 4 0 0 0 0 0 0 11,295 9,878Pasivos incluidos en Grupos de Activos para su Disposición Clasificados como Mantenidos para la Venta/ Liabilities included in groups of assets for disposal classified as held for sale 0 0 0 0 0 0 0 0 0 0
TOTAL PASIVOS CORRIENTES / TOTAL CURRENT LIABILITIES 73,209 52,022 650,597 625,963 136,070 229,157 202,806 84,141 55,157 56,124Otros Pasivos Financieros / Other financial liabilities 0 0 266,955 296,826 139,737 131,872 13,627 6,774 8,409 4,634Cuentas por Pagar Comerciales / Trade accounts payable 0 0 0 0 0 0 0 0 0 0Otras Cuentas por Pagar / Other accounts payable 0 0 0 0 0 0 0 0 0 0Cuentas por Pagar a Entidades Relacionadas / Accounts payable to related companies 0 0 0 0 0 0 0 0 1,847 1,867Pasivos por Impuestos a las Ganancias Diferidos / Liabilities from deferred income tax 6,850 6,652 113,239 103,599 0 0 14,136 15,555 4,059 4,490Provisiones / Provisions 18,181 17,825 93,110 92,922 351,233 350,601 38,000 39,116 30,616 30,597Provisión por Beneficios a los Empleados / Provisions for employee profit sharing 0 0 0 0 498 284 0 0 1,339 1,385Otros Pasivos / Other Liabilities 0 0 0 0 0 0 0 0 0 0Ingresos Diferidos (netos) / Deferred income (net) 0 0 0 0 0 0 11 13 0 0
TOTAL PASIVOS NO CORRIENTES / TOTAL NON-CURRENT LIABILITIES 25,031 24,477 473,304 493,347 491,468 482,757 65,774 61,458 46,270 42,973TOTAL PASIVOS / TOTAL LIABILITIES 98,240 76,499 1,123,901 1,119,310 627,538 711,914 268,580 145,599 101,427 99,097
Capital Emitido / Issued capital 30,281 30,281 1,259,915 1,259,915 478,148 478,148 601,269 601,269 81,680 81,680Primas de Emisión / Share premium 0 0 0 0 0 0 0 0 0 0Acciones de Inversión / Investment stock 1,810 1,810 176,213 176,213 0 0 300,634 300,634 36,196 36,196Acciones Propias en Cartera / Treasury shares 0 0 0 0 0 0 0 0 0 0Otras Reservas de Capital / Other capital reserves 6,418 6,418 131,726 131,726 95,724 95,724 120,685 120,685 0 0Resultados Acumulados / Retained earnings 329,445 352,279 724,064 598,445 1,144,554 973,855 793,413 849,354 34,714 33,444Otras Reservas de Patrimonio / Other equity reserves -1,093 844 0 0 -4,198 -4,198 39,985 39,985 0 0
TOTAL PATRIMONIO / TOTAL EQUITY 366,861 391,632 2,291,918 2,166,299 1,714,228 1,543,529 1,855,986 1,911,927 152,590 151,320TOTAL PASIVO Y PATRIMONIO / TOTAL LIABILITIES AND EQUITY 465,101 468,131 3,415,819 3,285,609 2,341,766 2,255,443 2,124,566 2,057,526 254,017 250,417
ESTADO DE RESULTADOS / INCOME STATEMENT 31/03/2012 31/03/2011 31/03/2012 31/03/2011 31/03/2012 31/03/2011 31/03/2012 31/03/2011 31/03/2012 31/03/2011
Ventas Netas de Bienes / Net sales of goods 55,596 76,203 354,545 447,818 361,225 300,881 195,826 238,884 27,020 26,908Prestación de Servicios / Services rendered 0 0 0 0 0 0 0 0 0 0
TOTAL DE INGRESOS DE ACTIVIDADES ORDINARIAS / TOTAL INCOME FROM REGULARACTIVITIES 55,596 76,203 354,545 447,818 361,225 300,881 195,826 238,884 27,020 26,908
Costo de Ventas / Cost of sales -32,475 -34,446 -130,665 -144,390 -88,059 -68,993 -44,616 -39,017 -21,924 -22,321GANANCIA (PERDIDA) BRUTA / GROSS PROFIT (LOSS) 23,121 41,757 223,880 303,428 273,166 231,888 151,210 199,867 5,096 4,587
Gastos de Ventas y Distribución / Sales and distribution expenses -948 -1,479 -12,229 -14,639 0 0 -2,760 -2,832 -1,108 -923Gastos de Administración / Overheads -7,692 -6,493 -4,213 -20,153 -12,740 -12,564 -11,074 -8,543 -3,704 -2,051Ganancia (Pérdida) de la baja en Activos Financieros medidos al Costo Amortizado / Profit (loss) fromdisposal of financial assets measured at amortized cost 0 0 0 0 0 0 0 0 0 0Otros Ingresos Operativos / Other operating income 5,663 4,097 9,871 1,996 3,508 135 1,155 613 846 48Otros Gastos Operativos / Other operating expenses -5,161 -4,178 -31,292 -8,013 -18,510 -14,320 -14,141 -7,249 -73 0
GANANCIA (PERDIDA) OPERATIVA / OPERATING PROFIT (LOSS) 14,983 33,704 186,017 262,619 245,424 205,139 124,390 181,856 1,057 1,661Ingresos Financieros / Financial income 229 434 1,746 838 3,268 14,305 7,892 5,180 364 379Gastos Financieros / Financial expenses -356 -332 -3,753 -3,118 -1,061 -769 -190 -6,397 -613 -569Diferencias de Cambio neto / Exchange differences net 249 -98 2,332 -712 -258 -189 3,127 1,830 31 1Participación en los Resultados Netos de Asociadas y Negocios Conjuntos Contabilizados por el Métodode la Participación / Equity in net results of associates and joint ventures booked by the equity method 0 0 0 0 0 0 0 0 0 0Ganancias (Pérdidas) de la Diferencia entre el Valor Libro Anterior y el Valor Justo de ActivosFinancieros Reclasificados Medidos a Valor Razonable / Profits (losses) from the difference between theprevious book value and fair value of financial assets reclassified and measured at fair value 0 0 0 0 0 0 -530 1,611 0 0
RESULTADO ANTES DE IMPUESTO A LAS GANANCIAS / PRE-INCOME TAX RESULT 15,105 33,708 186,342 259,627 247,373 218,486 134,689 184,080 839 1,472Gasto por Impuesto a las Ganancias / Income tax expenses -6,008 -10,283 -60,723 -66,755 -76,674 -74,472 -40,630 -54,368 431 -138
GANANCIA (PERDIDA) NETA DE OPERACIONES CONTINUADAS / NET PROFIT (LOSS) FROMCONTINUING TRADES 9,097 23,425 125,619 192,872 170,699 144,014 94,059 129,712 1,270 1,334
Ganancia (Pérdida) Neta del Impuesto a las Ganancias Procedente de Operaciones Discontinuadas / Netprofit (loss) arising from income tax discontinued trades 0 0 0 0 0 0 0 0 0 0
GANANCIA (PERDIDA) NETA DEL EJERCICIO / PERIOD'S NET PROFIT (LOSS) 9,097 23,425 125,619 192,872 170,699 144,014 94,059 129,712 1,270 1,334
INDICADORES FINANCIEROS / FINANCIAL RATIOSLiquidez / Liquid Ratio 2.72 1.53 12.58 3.48 0.23 Rotación de Activos / Gross Sales to Total Assets 0.12 0.10 0.15 0.09 0.11 Solvencia / Solvency 0.21 0.33 0.27 0.13 0.40 Deuda / Patrimonio / Debt / Equity 0.27 0.49 0.37 0.14 0.66 Rentabilidad sobre Ventas Netas % / Return % 16.36 35.43 47.26 48.03 4.70 Rentabilidad sobre Activos % / Return on Assets % 1.96 3.68 7.29 4.43 0.50 Rentabilidad de Patrimonio % / Return on Equity % 2.48 5.48 9.96 5.07 0.83

ESTADOS FINANCIEROS COMPARADOS / COMPARATIVE FINANCIAL STATEMENTS MINERAS / MININGCIFRAS EXPRESADAS EN MILES DE NUEVOS SOLES
EMPRESA/COMPANY
Poderosa
SPCC - Suc. Perú (*)
Santa Luisa
Shougang Hierro Perú
Volcan (*)CIIU
1320
1320
1320
1320
1320
Pág 37* Estados Financieros expresados en miles de US$
ESTADO DE SITUACION FINANCIERA / STATEMENT OF FINANCIAL POSITION 31/03/2012 31/12/2011 31/03/2012 31/12/2011 31/03/2012 31/12/2011 31/03/2012 31/12/2011 31/03/2012 31/12/2011
Efectivo y Equivalentes al Efectivo / Cash and cash equivalent 84,329 73,139 146,897 64,412 173,329 175,212 1,740,123 2,071,780 580,908 58,649Otros Activos Financieros / Other financial assets 0 0 0 5,081 0 0 0 0 0 0Cuentas por Cobrar Comerciales (neto) / Trade accounts receivable (net) 12,440 11,682 310,690 306,670 13,079 23,299 195,554 140,329 70,275 68,470Otras Cuentas por Cobrar (neto) / Other accounts receivable (net) 7,769 7,803 43,058 59,056 1,822 356 9,483 16,037 77,117 63,337Cuentas por Cobrar a Entidades Relacionadas / Accounts receivable from related companies 0 0 0 0 19,575 1,460 2,902 6,611 439,488 451,856Inventarios / Stocks 18,737 20,164 240,591 281,521 25,945 16,940 208,779 215,400 46,957 28,892Activos Biológicos / Biological assets 0 0 0 0 0 0 0 0 0 0Activos por Impuestos a las Ganancias / Assets from income tax 0 0 0 0 0 0 0 0 0 0Gastos Pagados por Anticipado / Prepaid expenses 3,876 5,271 26,536 28,256 235 274 1,935 2,893 0 0Otros Activos / Other assets 0 0 0 0 0 0 0 0 10,857 9,920Activos no Corrientes o Grupos de Activos para su Disposición Clasificados como Mantenidos para laVenta / Non-current assets or groups of assets for disposal classified as held for sale 0 0 0 0 0 0 0 0 0 0Activos no Corrientes o Grupos de Activos para su Disposición Clasificados como Mantenidos paraDistribuir a los Propietarios / Non-current assets or groups of assets for disposal classified as held forDistribution to owner 0 0 0 0 0 0 0 0 0 0
TOTAL ACTIVOS CORRIENTES / TOTAL CURRENT ASSETS 127,151 118,059 767,772 744,996 233,985 217,541 2,158,776 2,453,050 1,225,602 681,124Otros Activos Financieros / Other financial assets 0 0 0 0 0 0 1,372 1,372 0 0Inversiones Contabilizadas Aplicando el Método de la Participación / Investments booked using the equitymethod 0 0 0 0 0 0 0 0 732,751 686,069Cuentas por Cobrar Comerciales / Trade accounts receivable 0 0 0 0 0 0 0 0 0 0Otras Cuentas por Cobrar / Other accounts receivable 0 0 34,760 34,760 0 0 0 0 6,759 6,515Cuentas por Cobrar a Entidades Relacionadas / Accounts receivable from related companies 0 0 113,761 6,322 0 0 0 0 0 0Activos Biológicos / Biological assets 0 0 0 0 0 0 0 0 0 0Propiedades de Inversión / Investment property 0 0 0 0 0 0 0 0 0 0Propiedades, Planta y Equipo (neto) / Property, plant and equipment (net) 206,682 201,322 1,959,986 1,983,983 95,183 93,231 1,076,283 1,066,386 177,929 173,493Activos Intangibles (neto) / Intangible assets (net) 176,529 173,552 45,033 45,471 3,658 3,658 391,601 402,821 213,194 207,277Activos por Impuestos a las Ganancias Diferidos / Assets from deferred income tax 0 0 0 0 12,197 11,839 20,792 25,274 0 0Plusvalía / Capital gain 0 0 0 0 0 0 0 0 0 0Otros Activos / Other assets 12,001 12,011 24,948 24,950 7,529 5,106 0 0 6,482 8,533
TOTAL ACTIVOS NO CORRIENTES / TOTAL NON-CURRENT ASSETS 395,212 386,885 2,178,488 2,095,486 118,567 113,834 1,490,048 1,495,853 1,137,115 1,081,887TOTAL DE ACTIVOS / TOTAL ASSETS 522,363 504,944 2,946,260 2,840,482 352,552 331,375 3,648,824 3,948,903 2,362,717 1,763,011
Otros Pasivos Financieros / Other financial liabilities 15,563 18,721 10,000 10,000 0 0 0 0 27,160 42,926Cuentas por Pagar Comerciales / Trade accounts payable 26,286 27,432 120,234 159,004 10,416 15,383 60,350 61,997 86,960 79,826Otras Cuentas por Pagar / Other accounts payable 27,391 25,412 69,318 33,386 23,161 2,782 162,811 231,377 120,604 63,527Cuentas por Pagar a Entidades Relacionadas / Accounts payable to related companies 0 0 0 0 87,940 0 96,399 437,876 205,541 202,599Provisiones / Provisions 2,700 2,730 0 0 1,701 1,701 0 0 0 0Pasivos por Impuestos a las Ganancias / Liabilities from income tax 1,963 912 40,526 45,603 16,851 8,936 43,582 179,508 0 0Provisión por Beneficios a los Empleados / Provisions for employee profit sharing 2,786 12,679 60,533 130,595 1,179 743 183 791 0 0Otros Pasivos / Other Liabilities 0 0 0 0 2,322 7,917 0 0 54,287 40,807Pasivos incluidos en Grupos de Activos para su Disposición Clasificados como Mantenidos para la Venta/ Liabilities included in groups of assets for disposal classified as held for sale 0 0 0 0 0 0 0 0 0 0
TOTAL PASIVOS CORRIENTES / TOTAL CURRENT LIABILITIES 76,689 87,886 300,611 378,588 143,570 37,462 363,325 911,549 494,552 429,685Otros Pasivos Financieros / Other financial liabilities 37,369 39,806 10,000 10,000 0 0 1,334 1,349 615,969 11,218Cuentas por Pagar Comerciales / Trade accounts payable 0 0 0 0 0 0 0 0 0 0Otras Cuentas por Pagar / Other accounts payable 9,738 10,189 0 0 0 0 0 0 4,859 4,816Cuentas por Pagar a Entidades Relacionadas / Accounts payable to related companies 0 0 0 0 0 0 4,654 4,704 0 0Pasivos por Impuestos a las Ganancias Diferidos / Liabilities from deferred income tax 22,508 23,831 1,704 5,275 4,482 4,482 228,305 232,011 21,796 24,878Provisiones / Provisions 21,452 21,685 52,766 51,954 41,400 40,786 121,282 105,579 16,232 16,466Provisión por Beneficios a los Empleados / Provisions for employee profit sharing 0 0 0 0 0 0 32,761 32,071 0 0Otros Pasivos / Other Liabilities 0 0 0 0 0 0 0 0 3,905 0Ingresos Diferidos (netos) / Deferred income (net) 0 0 0 0 0 0 0 0 0 0
TOTAL PASIVOS NO CORRIENTES / TOTAL NON-CURRENT LIABILITIES 91,067 95,511 64,470 67,229 45,882 45,268 388,336 375,714 662,761 57,378TOTAL PASIVOS / TOTAL LIABILITIES 167,756 183,397 365,081 445,817 189,452 82,730 751,661 1,287,263 1,157,313 487,063
Capital Emitido / Issued capital 150,000 150,000 321,797 321,797 6,801 6,801 156,184 156,184 1,282,774 1,142,894Primas de Emisión / Share premium 0 0 61,972 61,972 0 0 0 0 0 0Acciones de Inversión / Investment stock 0 0 51,847 51,847 2,886 2,886 0 0 0 0Acciones Propias en Cartera / Treasury shares 0 0 0 0 0 0 0 0 -218,004 -217,917Otras Reservas de Capital / Other capital reserves 23,629 23,629 245,000 245,000 1,360 1,360 31,237 31,237 99,883 86,363Resultados Acumulados / Retained earnings 180,978 147,918 1,900,563 1,710,493 152,053 237,598 2,709,742 2,474,219 69,515 275,871Otras Reservas de Patrimonio / Other equity reserves 0 0 0 3,556 0 0 0 0 -28,764 -11,263
TOTAL PATRIMONIO / TOTAL EQUITY 354,607 321,547 2,581,179 2,394,665 163,100 248,645 2,897,163 2,661,640 1,205,404 1,275,948TOTAL PASIVO Y PATRIMONIO / TOTAL LIABILITIES AND EQUITY 522,363 504,944 2,946,260 2,840,482 352,552 331,375 3,648,824 3,948,903 2,362,717 1,763,011
ESTADO DE RESULTADOS / INCOME STATEMENT 31/03/2012 31/03/2011 31/03/2012 31/03/2011 31/03/2012 31/03/2011 31/03/2012 31/03/2011 31/03/2012 31/03/2011
Ventas Netas de Bienes / Net sales of goods 145,041 109,946 826,501 839,307 53,802 65,456 667,130 676,000 154,495 158,667Prestación de Servicios / Services rendered 0 0 0 0 0 0 0 0 0 0
TOTAL DE INGRESOS DE ACTIVIDADES ORDINARIAS / TOTAL INCOME FROM REGULARACTIVITIES 145,041 109,946 826,501 839,307 53,802 65,456 667,130 676,000 154,495 158,667
Costo de Ventas / Cost of sales -82,403 -66,535 -365,329 -434,628 -33,649 -29,340 -223,900 -211,714 -90,784 -76,443GANANCIA (PERDIDA) BRUTA / GROSS PROFIT (LOSS) 62,638 43,411 461,172 404,679 20,153 36,116 443,230 464,286 63,711 82,224
Gastos de Ventas y Distribución / Sales and distribution expenses -3,696 -2,372 -9,202 -9,168 -3,554 -3,395 -21,555 -14,224 -4,320 -3,849Gastos de Administración / Overheads -14,077 -9,066 -12,404 -11,582 -2,275 -2,163 -7,198 -7,885 -10,198 -11,385Ganancia (Pérdida) de la baja en Activos Financieros medidos al Costo Amortizado / Profit (loss) fromdisposal of financial assets measured at amortized cost 0 0 0 0 32 138 0 0 0 0Otros Ingresos Operativos / Other operating income 710 691 2,457 2,292 25,448 265 4,679 4,925 8,759 9,468Otros Gastos Operativos / Other operating expenses 0 -418 -34,171 -23,871 -8,933 -297 -43,519 -12,441 -5,785 -7,403
GANANCIA (PERDIDA) OPERATIVA / OPERATING PROFIT (LOSS) 45,575 32,246 407,852 362,350 30,871 30,664 375,637 434,661 52,167 69,055Ingresos Financieros / Financial income 277 118 3,512 1,306 951 480 4,715 3,138 3,284 2,320Gastos Financieros / Financial expenses -708 -356 -174 -20,980 -928 -245 -1,160 -2,458 -6,812 -3,115Diferencias de Cambio neto / Exchange differences net 391 -76 758 -1,221 -1,017 -266 -19,857 -702 -18,145 -1,357Participación en los Resultados Netos de Asociadas y Negocios Conjuntos Contabilizados por el Métodode la Participación / Equity in net results of associates and joint ventures booked by the equity method 0 0 0 0 0 0 0 0 0 0Ganancias (Pérdidas) de la Diferencia entre el Valor Libro Anterior y el Valor Justo de ActivosFinancieros Reclasificados Medidos a Valor Razonable / Profits (losses) from the difference between theprevious book value and fair value of financial assets reclassified and measured at fair value 0 0 0 0 0 0 0 0 1,834 -9,308
RESULTADO ANTES DE IMPUESTO A LAS GANANCIAS / PRE-INCOME TAX RESULT 45,535 31,932 411,948 341,455 29,877 30,633 359,335 434,639 32,328 57,595Gasto por Impuesto a las Ganancias / Income tax expenses -12,475 -9,690 -117,919 -102,582 -3,869 -7,696 -123,812 -127,989 -16,504 -17,160
GANANCIA (PERDIDA) NETA DE OPERACIONES CONTINUADAS / NET PROFIT (LOSS) FROMCONTINUING TRADES 33,060 22,242 294,029 238,873 26,008 22,937 235,523 306,650 15,824 40,435
Ganancia (Pérdida) Neta del Impuesto a las Ganancias Procedente de Operaciones Discontinuadas / Netprofit (loss) arising from income tax discontinued trades 0 0 0 0 0 0 0 0 0 0
GANANCIA (PERDIDA) NETA DEL EJERCICIO / PERIOD'S NET PROFIT (LOSS) 33,060 22,242 294,029 238,873 26,008 22,937 235,523 306,650 15,824 40,435
INDICADORES FINANCIEROS / FINANCIAL RATIOSLiquidez / Liquid Ratio 1.66 2.55 1.63 5.94 2.48 Rotación de Activos / Gross Sales to Total Assets 0.28 0.28 0.15 0.18 0.07 Solvencia / Solvency 0.32 0.12 0.54 0.21 0.49 Deuda / Patrimonio / Debt / Equity 0.47 0.14 1.16 0.26 0.96 Rentabilidad sobre Ventas Netas % / Return % 22.79 35.58 48.34 35.30 10.24 Rentabilidad sobre Activos % / Return on Assets % 6.33 9.98 7.38 6.45 0.67 Rentabilidad de Patrimonio % / Return on Equity % 9.32 11.39 15.95 8.13 1.31

ESTADOS FINANCIEROS COMPARADOS / COMPARATIVE FINANCIAL STATEMENTS MINERAS / MININGCIFRAS EXPRESADAS EN MILES DE NUEVOS SOLES
EMPRESA/COMPANY
Fosfatos del Pacífico
MYGSA
Atacocha (*)
Milpo (*)
Minera Corona (*)CIIU
1421
1429
2302
2302
2302
Pág 38 * Estados Financieros expresados en miles de US$
ESTADO DE SITUACION FINANCIERA / STATEMENT OF FINANCIAL POSITION 31/03/2012 31/12/2011 31/03/2012 31/12/2011 31/03/2012 31/12/2011 31/03/2012 31/12/2011 31/03/2012 31/12/2011
Efectivo y Equivalentes al Efectivo / Cash and cash equivalent 991 373 31 18 23,868 30,415 104,945 151,205 55,467 14,935Otros Activos Financieros / Other financial assets 0 0 0 0 0 0 0 0 0 0Cuentas por Cobrar Comerciales (neto) / Trade accounts receivable (net) 0 0 3,786 3,820 13,459 10,535 81,558 56,943 16,852 14,780Otras Cuentas por Cobrar (neto) / Other accounts receivable (net) 326 215 4,386 4,253 12,385 10,989 3,918 2,485 155 164Cuentas por Cobrar a Entidades Relacionadas / Accounts receivable from related companies 0 0 0 0 27 85 57,464 52,296 114 699Inventarios / Stocks 1,614 1,398 5,283 5,609 13,343 13,056 39,034 35,502 10,678 10,013Activos Biológicos / Biological assets 0 0 0 0 0 0 0 0 0 0Activos por Impuestos a las Ganancias / Assets from income tax 0 0 0 0 0 0 0 0 0 0Gastos Pagados por Anticipado / Prepaid expenses 290 630 1,515 1,586 1,595 268 4,769 336 155 128Otros Activos / Other assets 0 0 0 0 0 0 0 0 3,215 5,221Activos no Corrientes o Grupos de Activos para su Disposición Clasificados como Mantenidos para laVenta / Non-current assets or groups of assets for disposal classified as held for sale 0 0 0 0 0 0 0 0 0 31,583Activos no Corrientes o Grupos de Activos para su Disposición Clasificados como Mantenidos paraDistribuir a los Propietarios / Non-current assets or groups of assets for disposal classified as held forDistribution to owner 0 0 0 0 0 0 0 0 0 0
TOTAL ACTIVOS CORRIENTES / TOTAL CURRENT ASSETS 3,221 2,616 15,001 15,286 64,677 65,348 291,688 298,767 86,636 77,523Otros Activos Financieros / Other financial assets 0 0 408 408 0 0 0 0 0 0Inversiones Contabilizadas Aplicando el Método de la Participación / Investments booked using the equitymethod 0 0 0 0 10,905 11,061 102,567 119,733 0 0Cuentas por Cobrar Comerciales / Trade accounts receivable 0 0 0 0 0 0 0 0 0 0Otras Cuentas por Cobrar / Other accounts receivable 15,805 14,612 0 0 0 0 856 1,236 0 0Cuentas por Cobrar a Entidades Relacionadas / Accounts receivable from related companies 0 0 0 0 0 0 0 0 0 0Activos Biológicos / Biological assets 0 0 0 0 0 0 0 0 0 0Propiedades de Inversión / Investment property 0 0 0 0 0 0 0 0 0 0Propiedades, Planta y Equipo (neto) / Property, plant and equipment (net) 63,946 58,481 2,576 2,670 116,151 117,142 262,856 247,330 44,960 46,118Activos Intangibles (neto) / Intangible assets (net) 15,565 15,565 0 0 0 0 95,703 84,960 67 70Activos por Impuestos a las Ganancias Diferidos / Assets from deferred income tax 5,696 4,967 0 0 6,130 5,987 10,132 9,020 0 0Plusvalía / Capital gain 0 0 0 0 0 0 0 0 0 0Otros Activos / Other assets 0 0 0 0 0 0 0 0 0 0
TOTAL ACTIVOS NO CORRIENTES / TOTAL NON-CURRENT ASSETS 101,012 93,625 2,984 3,078 133,186 134,190 472,114 462,279 45,027 46,188TOTAL DE ACTIVOS / TOTAL ASSETS 104,233 96,241 17,985 18,364 197,863 199,538 763,802 761,046 131,663 123,711
Otros Pasivos Financieros / Other financial liabilities 0 0 428 428 15,130 14,564 55,452 51,090 11,000 11,000Cuentas por Pagar Comerciales / Trade accounts payable 1,734 3,018 3,587 3,652 16,410 16,890 47,512 48,553 5,610 4,703Otras Cuentas por Pagar / Other accounts payable 1,173 783 6,740 6,756 5,508 4,063 27,376 14,386 18,453 4,972Cuentas por Pagar a Entidades Relacionadas / Accounts payable to related companies 10,762 0 0 0 4,827 4,378 3,438 3,120 0 0Provisiones / Provisions 0 0 0 0 5,965 9,594 20,903 38,354 2,809 2,845Pasivos por Impuestos a las Ganancias / Liabilities from income tax 0 0 0 0 0 0 5,977 2,862 665 5,204Provisión por Beneficios a los Empleados / Provisions for employee profit sharing 0 0 0 0 2,806 1,207 7,222 7,544 4,981 8,117Otros Pasivos / Other Liabilities 0 0 0 0 0 0 0 0 0 0Pasivos incluidos en Grupos de Activos para su Disposición Clasificados como Mantenidos para la Venta/ Liabilities included in groups of assets for disposal classified as held for sale 0 0 0 0 0 0 0 0 0 200
TOTAL PASIVOS CORRIENTES / TOTAL CURRENT LIABILITIES 13,669 3,801 10,755 10,836 50,646 50,696 167,880 165,909 43,518 37,041Otros Pasivos Financieros / Other financial liabilities 0 0 2,018 2,052 18,186 20,145 68,264 82,036 0 0Cuentas por Pagar Comerciales / Trade accounts payable 0 0 0 0 0 0 0 0 0 0Otras Cuentas por Pagar / Other accounts payable 0 0 998 1,003 0 0 0 0 0 0Cuentas por Pagar a Entidades Relacionadas / Accounts payable to related companies 0 0 0 0 0 0 0 0 0 0Pasivos por Impuestos a las Ganancias Diferidos / Liabilities from deferred income tax 0 0 0 0 0 0 0 0 4,403 9,601Provisiones / Provisions 0 0 0 0 23,225 23,556 29,931 29,760 7,753 7,665Provisión por Beneficios a los Empleados / Provisions for employee profit sharing 0 0 0 0 0 0 0 0 0 0Otros Pasivos / Other Liabilities 0 0 0 0 0 0 0 0 0 0Ingresos Diferidos (netos) / Deferred income (net) 0 0 0 46 0 0 0 0 0 0
TOTAL PASIVOS NO CORRIENTES / TOTAL NON-CURRENT LIABILITIES 3,016 3,101 41,411 43,701 98,195 111,796 12,156 17,266TOTAL PASIVOS / TOTAL LIABILITIES 13,669 3,801 13,771 13,937 92,057 94,397 266,075 277,705 55,674 54,307
Capital Emitido / Issued capital 104,712 104,712 3,387 3,387 307,647 307,647 347,233 347,233 10,210 10,210Primas de Emisión / Share premium 0 0 0 0 0 0 0 0 0 0Acciones de Inversión / Investment stock 0 0 657 657 0 0 5,686 5,686 1,309 1,309Acciones Propias en Cartera / Treasury shares 0 0 0 0 0 0 0 0 0 0Otras Reservas de Capital / Other capital reserves 0 0 67 67 62,063 62,063 64,595 63,285 2,042 2,042Resultados Acumulados / Retained earnings -14,148 -12,272 103 316 -265,059 -265,724 80,213 67,137 21,982 20,648Otras Reservas de Patrimonio / Other equity reserves 0 0 0 0 1,155 1,155 0 0 40,446 35,195
TOTAL PATRIMONIO / TOTAL EQUITY 90,564 92,440 4,214 4,427 105,806 105,141 497,727 483,341 75,989 69,404TOTAL PASIVO Y PATRIMONIO / TOTAL LIABILITIES AND EQUITY 104,233 96,241 17,985 18,364 197,863 199,538 763,802 761,046 131,663 123,711
ESTADO DE RESULTADOS / INCOME STATEMENT 31/03/2012 31/03/2011 31/03/2012 31/03/2011 31/03/2012 31/03/2011 31/03/2012 31/03/2011 31/03/2012 31/03/2011
Ventas Netas de Bienes / Net sales of goods 0 0 418 615 31,414 35,008 127,027 119,934 40,054 38,574Prestación de Servicios / Services rendered 0 0 0 0 0 0 0 0 0 0
TOTAL DE INGRESOS DE ACTIVIDADES ORDINARIAS / TOTAL INCOME FROM REGULARACTIVITIES 0 0 418 615 31,414 35,008 127,027 119,934 40,054 38,574
Costo de Ventas / Cost of sales 0 0 -362 -537 -26,476 -21,528 -61,603 -43,460 -17,091 -13,507GANANCIA (PERDIDA) BRUTA / GROSS PROFIT (LOSS) 0 0 56 78 4,938 13,480 65,424 76,474 22,963 25,067
Gastos de Ventas y Distribución / Sales and distribution expenses -3 0 -16 -33 -1,469 -1,030 -4,947 -2,671 -980 -947Gastos de Administración / Overheads -2,536 -1,935 -133 -141 -1,169 -1,221 -8,046 -3,563 -2,743 -2,058Ganancia (Pérdida) de la baja en Activos Financieros medidos al Costo Amortizado / Profit (loss) fromdisposal of financial assets measured at amortized cost 0 0 0 0 0 0 0 0 0 23Otros Ingresos Operativos / Other operating income 6 0 13 42 543 1,581 54 321 15,627 150Otros Gastos Operativos / Other operating expenses 0 0 0 -5 -811 -624 -11,978 -5,063 -193 -112
GANANCIA (PERDIDA) OPERATIVA / OPERATING PROFIT (LOSS) -2,533 -1,935 -80 -59 2,032 12,186 40,507 65,498 34,674 22,123Ingresos Financieros / Financial income 0 86 67 8 93 98 506 448 159 269Gastos Financieros / Financial expenses -84 0 -200 -71 -544 -732 -1,115 -877 -1,800 -324Diferencias de Cambio neto / Exchange differences net 11 0 0 0 0 0 0 0 -230 198Participación en los Resultados Netos de Asociadas y Negocios Conjuntos Contabilizados por el Métodode la Participación / Equity in net results of associates and joint ventures booked by the equity method 0 0 0 0 -156 0 -17,147 131 0 0Ganancias (Pérdidas) de la Diferencia entre el Valor Libro Anterior y el Valor Justo de ActivosFinancieros Reclasificados Medidos a Valor Razonable / Profits (losses) from the difference between theprevious book value and fair value of financial assets reclassified and measured at fair value 0 0 0 0 0 0 0 0 0 0
RESULTADO ANTES DE IMPUESTO A LAS GANANCIAS / PRE-INCOME TAX RESULT -2,606 -1,849 -213 -122 1,425 11,552 22,751 65,200 32,803 22,266Gasto por Impuesto a las Ganancias / Income tax expenses 730 520 0 0 -760 -4,447 -14,564 -13,001 -9,659 -6,849
GANANCIA (PERDIDA) NETA DE OPERACIONES CONTINUADAS / NET PROFIT (LOSS) FROMCONTINUING TRADES -1,876 -1,329 -213 -122 665 7,105 8,187 52,199 23,144 15,417
Ganancia (Pérdida) Neta del Impuesto a las Ganancias Procedente de Operaciones Discontinuadas / Netprofit (loss) arising from income tax discontinued trades 0 0 0 0 0 0 0 0 427 757
GANANCIA (PERDIDA) NETA DEL EJERCICIO / PERIOD'S NET PROFIT (LOSS) -1,876 -1,329 -213 -122 665 7,105 8,187 52,199 23,571 16,174
INDICADORES FINANCIEROS / FINANCIAL RATIOSLiquidez / Liquid Ratio 0.24 1.39 1.28 1.74 1.99 Rotación de Activos / Gross Sales to Total Assets 0.00 0.02 0.16 0.17 0.30 Solvencia / Solvency 0.13 0.77 0.47 0.35 0.42 Deuda / Patrimonio / Debt / Equity 0.15 3.27 0.87 0.53 0.73 Rentabilidad sobre Ventas Netas % / Return % n.d. -.- 2.12 6.45 58.85 Rentabilidad sobre Activos % / Return on Assets % -.- -.- 0.34 1.07 17.90 Rentabilidad de Patrimonio % / Return on Equity % -.- -.- 0.63 1.64 31.02
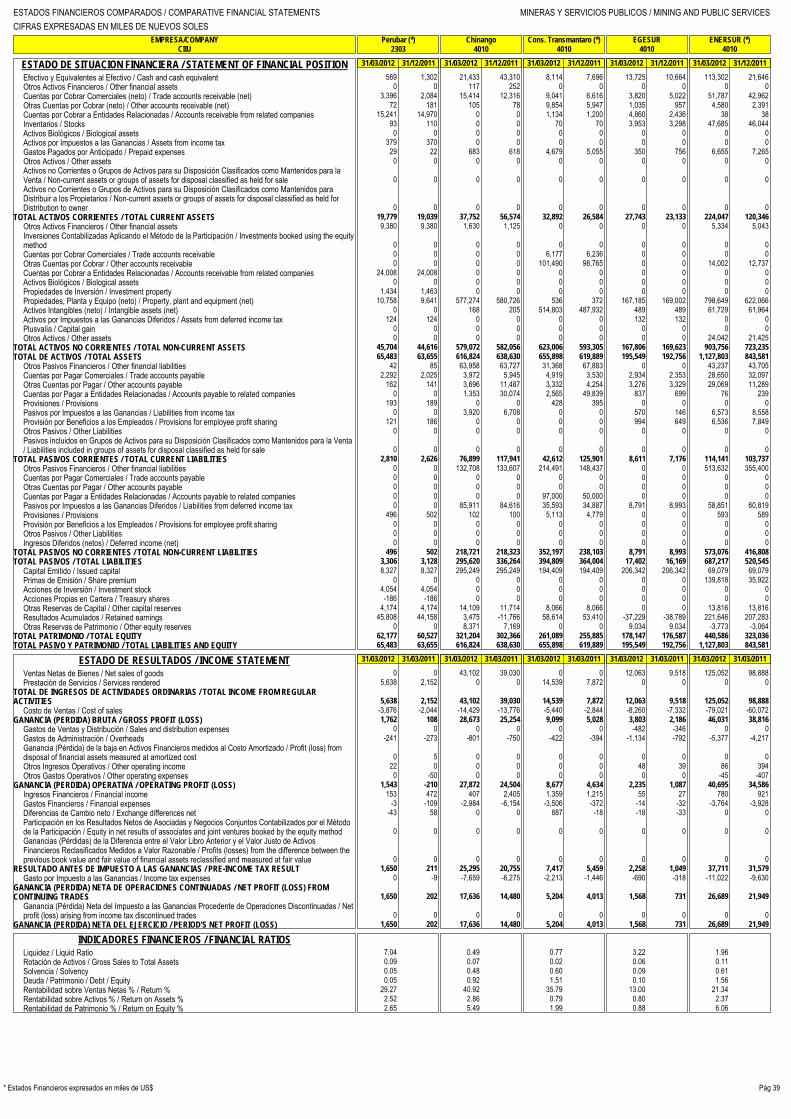
ESTADOS FINANCIEROS COMPARADOS / COMPARATIVE FINANCIAL STATEMENTS MINERAS Y SERVICIOS PUBLICOS / MINING AND PUBLIC SERVICESCIFRAS EXPRESADAS EN MILES DE NUEVOS SOLES
EMPRESA/COMPANY
Perubar (*)
Chinango
Cons. Transmantaro (*)
EGESUR
ENERSUR (*)CIIU
2303
4010
4010
4010
4010
Pág 39* Estados Financieros expresados en miles de US$
ESTADO DE SITUACION FINANCIERA / STATEMENT OF FINANCIAL POSITION 31/03/2012 31/12/2011 31/03/2012 31/12/2011 31/03/2012 31/12/2011 31/03/2012 31/12/2011 31/03/2012 31/12/2011
Efectivo y Equivalentes al Efectivo / Cash and cash equivalent 569 1,302 21,433 43,310 8,114 7,696 13,725 10,664 113,302 21,646Otros Activos Financieros / Other financial assets 0 0 117 252 0 0 0 0 0 0Cuentas por Cobrar Comerciales (neto) / Trade accounts receivable (net) 3,396 2,084 15,414 12,316 9,041 6,616 3,820 5,022 51,787 42,962Otras Cuentas por Cobrar (neto) / Other accounts receivable (net) 72 181 105 78 9,854 5,947 1,035 957 4,580 2,391Cuentas por Cobrar a Entidades Relacionadas / Accounts receivable from related companies 15,241 14,970 0 0 1,134 1,200 4,860 2,436 38 38Inventarios / Stocks 93 110 0 0 70 70 3,953 3,298 47,685 46,044Activos Biológicos / Biological assets 0 0 0 0 0 0 0 0 0 0Activos por Impuestos a las Ganancias / Assets from income tax 379 370 0 0 0 0 0 0 0 0Gastos Pagados por Anticipado / Prepaid expenses 29 22 683 618 4,679 5,055 350 756 6,655 7,265Otros Activos / Other assets 0 0 0 0 0 0 0 0 0 0Activos no Corrientes o Grupos de Activos para su Disposición Clasificados como Mantenidos para laVenta / Non-current assets or groups of assets for disposal classified as held for sale 0 0 0 0 0 0 0 0 0 0Activos no Corrientes o Grupos de Activos para su Disposición Clasificados como Mantenidos paraDistribuir a los Propietarios / Non-current assets or groups of assets for disposal classified as held forDistribution to owner 0 0 0 0 0 0 0 0 0 0
TOTAL ACTIVOS CORRIENTES / TOTAL CURRENT ASSETS 19,779 19,039 37,752 56,574 32,892 26,584 27,743 23,133 224,047 120,346Otros Activos Financieros / Other financial assets 9,380 9,380 1,630 1,125 0 0 0 0 5,334 5,043Inversiones Contabilizadas Aplicando el Método de la Participación / Investments booked using the equitymethod 0 0 0 0 0 0 0 0 0 0Cuentas por Cobrar Comerciales / Trade accounts receivable 0 0 0 0 6,177 6,236 0 0 0 0Otras Cuentas por Cobrar / Other accounts receivable 0 0 0 0 101,490 98,765 0 0 14,002 12,737Cuentas por Cobrar a Entidades Relacionadas / Accounts receivable from related companies 24,008 24,008 0 0 0 0 0 0 0 0Activos Biológicos / Biological assets 0 0 0 0 0 0 0 0 0 0Propiedades de Inversión / Investment property 1,434 1,463 0 0 0 0 0 0 0 0Propiedades, Planta y Equipo (neto) / Property, plant and equipment (net) 10,758 9,641 577,274 580,726 536 372 167,185 169,002 798,649 622,066Activos Intangibles (neto) / Intangible assets (net) 0 0 168 205 514,803 487,932 489 489 61,729 61,964Activos por Impuestos a las Ganancias Diferidos / Assets from deferred income tax 124 124 0 0 0 0 132 132 0 0Plusvalía / Capital gain 0 0 0 0 0 0 0 0 0 0Otros Activos / Other assets 0 0 0 0 0 0 0 0 24,042 21,425
TOTAL ACTIVOS NO CORRIENTES / TOTAL NON-CURRENT ASSETS 45,704 44,616 579,072 582,056 623,006 593,305 167,806 169,623 903,756 723,235TOTAL DE ACTIVOS / TOTAL ASSETS 65,483 63,655 616,824 638,630 655,898 619,889 195,549 192,756 1,127,803 843,581
Otros Pasivos Financieros / Other financial liabilities 42 85 63,958 63,727 31,368 67,883 0 0 43,237 43,705Cuentas por Pagar Comerciales / Trade accounts payable 2,292 2,025 3,972 5,945 4,919 3,530 2,934 2,353 28,650 32,097Otras Cuentas por Pagar / Other accounts payable 162 141 3,696 11,487 3,332 4,254 3,276 3,329 29,069 11,289Cuentas por Pagar a Entidades Relacionadas / Accounts payable to related companies 0 0 1,353 30,074 2,565 49,839 837 699 76 239Provisiones / Provisions 193 189 0 0 428 395 0 0 0 0Pasivos por Impuestos a las Ganancias / Liabilities from income tax 0 0 3,920 6,708 0 0 570 146 6,573 8,558Provisión por Beneficios a los Empleados / Provisions for employee profit sharing 121 186 0 0 0 0 994 649 6,536 7,849Otros Pasivos / Other Liabilities 0 0 0 0 0 0 0 0 0 0Pasivos incluidos en Grupos de Activos para su Disposición Clasificados como Mantenidos para la Venta/ Liabilities included in groups of assets for disposal classified as held for sale 0 0 0 0 0 0 0 0 0 0
TOTAL PASIVOS CORRIENTES / TOTAL CURRENT LIABILITIES 2,810 2,626 76,899 117,941 42,612 125,901 8,611 7,176 114,141 103,737Otros Pasivos Financieros / Other financial liabilities 0 0 132,708 133,607 214,491 148,437 0 0 513,632 355,400Cuentas por Pagar Comerciales / Trade accounts payable 0 0 0 0 0 0 0 0 0 0Otras Cuentas por Pagar / Other accounts payable 0 0 0 0 0 0 0 0 0 0Cuentas por Pagar a Entidades Relacionadas / Accounts payable to related companies 0 0 0 0 97,000 50,000 0 0 0 0Pasivos por Impuestos a las Ganancias Diferidos / Liabilities from deferred income tax 0 0 85,911 84,616 35,593 34,887 8,791 8,993 58,851 60,819Provisiones / Provisions 496 502 102 100 5,113 4,779 0 0 593 589Provisión por Beneficios a los Empleados / Provisions for employee profit sharing 0 0 0 0 0 0 0 0 0 0Otros Pasivos / Other Liabilities 0 0 0 0 0 0 0 0 0 0Ingresos Diferidos (netos) / Deferred income (net) 0 0 0 0 0 0 0 0 0 0
TOTAL PASIVOS NO CORRIENTES / TOTAL NON-CURRENT LIABILITIES 496 502 218,721 218,323 352,197 238,103 8,791 8,993 573,076 416,808TOTAL PASIVOS / TOTAL LIABILITIES 3,306 3,128 295,620 336,264 394,809 364,004 17,402 16,169 687,217 520,545
Capital Emitido / Issued capital 8,327 8,327 295,249 295,249 194,409 194,409 206,342 206,342 69,079 69,079Primas de Emisión / Share premium 0 0 0 0 0 0 0 0 139,818 35,922Acciones de Inversión / Investment stock 4,054 4,054 0 0 0 0 0 0 0 0Acciones Propias en Cartera / Treasury shares -186 -186 0 0 0 0 0 0 0 0Otras Reservas de Capital / Other capital reserves 4,174 4,174 14,109 11,714 8,066 8,066 0 0 13,816 13,816Resultados Acumulados / Retained earnings 45,808 44,158 3,475 -11,766 58,614 53,410 -37,229 -38,789 221,646 207,283Otras Reservas de Patrimonio / Other equity reserves 0 0 8,371 7,169 0 0 9,034 9,034 -3,773 -3,064
TOTAL PATRIMONIO / TOTAL EQUITY 62,177 60,527 321,204 302,366 261,089 255,885 178,147 176,587 440,586 323,036TOTAL PASIVO Y PATRIMONIO / TOTAL LIABILITIES AND EQUITY 65,483 63,655 616,824 638,630 655,898 619,889 195,549 192,756 1,127,803 843,581
ESTADO DE RESULTADOS / INCOME STATEMENT 31/03/2012 31/03/2011 31/03/2012 31/03/2011 31/03/2012 31/03/2011 31/03/2012 31/03/2011 31/03/2012 31/03/2011
Ventas Netas de Bienes / Net sales of goods 0 0 43,102 39,030 0 0 12,063 9,518 125,052 98,888Prestación de Servicios / Services rendered 5,638 2,152 0 0 14,539 7,872 0 0 0 0
TOTAL DE INGRESOS DE ACTIVIDADES ORDINARIAS / TOTAL INCOME FROM REGULARACTIVITIES 5,638 2,152 43,102 39,030 14,539 7,872 12,063 9,518 125,052 98,888
Costo de Ventas / Cost of sales -3,876 -2,044 -14,429 -13,776 -5,440 -2,844 -8,260 -7,332 -79,021 -60,072GANANCIA (PERDIDA) BRUTA / GROSS PROFIT (LOSS) 1,762 108 28,673 25,254 9,099 5,028 3,803 2,186 46,031 38,816
Gastos de Ventas y Distribución / Sales and distribution expenses 0 0 0 0 0 0 -482 -346 0 0Gastos de Administración / Overheads -241 -273 -801 -750 -422 -394 -1,134 -792 -5,377 -4,217Ganancia (Pérdida) de la baja en Activos Financieros medidos al Costo Amortizado / Profit (loss) fromdisposal of financial assets measured at amortized cost 0 5 0 0 0 0 0 0 0 0Otros Ingresos Operativos / Other operating income 22 0 0 0 0 0 48 39 86 394Otros Gastos Operativos / Other operating expenses 0 -50 0 0 0 0 0 0 -45 -407
GANANCIA (PERDIDA) OPERATIVA / OPERATING PROFIT (LOSS) 1,543 -210 27,872 24,504 8,677 4,634 2,235 1,087 40,695 34,586Ingresos Financieros / Financial income 153 472 407 2,405 1,359 1,215 55 27 780 921Gastos Financieros / Financial expenses -3 -109 -2,984 -6,154 -3,506 -372 -14 -32 -3,764 -3,928Diferencias de Cambio neto / Exchange differences net -43 58 0 0 887 -18 -18 -33 0 0Participación en los Resultados Netos de Asociadas y Negocios Conjuntos Contabilizados por el Métodode la Participación / Equity in net results of associates and joint ventures booked by the equity method 0 0 0 0 0 0 0 0 0 0Ganancias (Pérdidas) de la Diferencia entre el Valor Libro Anterior y el Valor Justo de ActivosFinancieros Reclasificados Medidos a Valor Razonable / Profits (losses) from the difference between theprevious book value and fair value of financial assets reclassified and measured at fair value 0 0 0 0 0 0 0 0 0 0
RESULTADO ANTES DE IMPUESTO A LAS GANANCIAS / PRE-INCOME TAX RESULT 1,650 211 25,295 20,755 7,417 5,459 2,258 1,049 37,711 31,579Gasto por Impuesto a las Ganancias / Income tax expenses 0 -9 -7,659 -6,275 -2,213 -1,446 -690 -318 -11,022 -9,630
GANANCIA (PERDIDA) NETA DE OPERACIONES CONTINUADAS / NET PROFIT (LOSS) FROMCONTINUING TRADES 1,650 202 17,636 14,480 5,204 4,013 1,568 731 26,689 21,949
Ganancia (Pérdida) Neta del Impuesto a las Ganancias Procedente de Operaciones Discontinuadas / Netprofit (loss) arising from income tax discontinued trades 0 0 0 0 0 0 0 0 0 0
GANANCIA (PERDIDA) NETA DEL EJERCICIO / PERIOD'S NET PROFIT (LOSS) 1,650 202 17,636 14,480 5,204 4,013 1,568 731 26,689 21,949
INDICADORES FINANCIEROS / FINANCIAL RATIOSLiquidez / Liquid Ratio 7.04 0.49 0.77 3.22 1.96 Rotación de Activos / Gross Sales to Total Assets 0.09 0.07 0.02 0.06 0.11 Solvencia / Solvency 0.05 0.48 0.60 0.09 0.61 Deuda / Patrimonio / Debt / Equity 0.05 0.92 1.51 0.10 1.56 Rentabilidad sobre Ventas Netas % / Return % 29.27 40.92 35.79 13.00 21.34 Rentabilidad sobre Activos % / Return on Assets % 2.52 2.86 0.79 0.80 2.37 Rentabilidad de Patrimonio % / Return on Equity % 2.65 5.49 1.99 0.88 6.06

ESTADOS FINANCIEROS COMPARADOS / COMPARATIVE FINANCIAL STATEMENTS SERVICIOS PUBLICOS / PUBLIC SERVICESCIFRAS EXPRESADAS EN MILES DE NUEVOS SOLES
EMPRESA/COMPANY
Edegel
Edelnor
Electro Sur Este
Electrosur
Eléctrica de PiuraCIIU
4010
4010
4010
4010
4010
Pág 40 * Estados Financieros expresados en miles de US$
ESTADO DE SITUACION FINANCIERA / STATEMENT OF FINANCIAL POSITION 31/03/2012 31/12/2011 31/03/2012 31/12/2011 31/03/2012 31/12/2011 31/03/2012 31/12/2011 31/03/2012 31/12/2011
Efectivo y Equivalentes al Efectivo / Cash and cash equivalent 174,298 125,892 129,690 47,915 42,250 39,914 8,901 10,207 126,913 128,279Otros Activos Financieros / Other financial assets 0 0 0 0 0 0 0 0 0 0Cuentas por Cobrar Comerciales (neto) / Trade accounts receivable (net) 130,496 123,961 298,637 286,442 24,415 29,626 15,422 14,539 22,404 38,434Otras Cuentas por Cobrar (neto) / Other accounts receivable (net) 6,202 8,954 21,354 15,681 2,317 4,512 449 971 711 1,798Cuentas por Cobrar a Entidades Relacionadas / Accounts receivable from related companies 691 30,495 285 42 0 310 6 12 0 5,168Inventarios / Stocks 68,965 65,622 26,073 22,612 10,232 10,425 7,540 6,701 2,459 2,352Activos Biológicos / Biological assets 0 0 0 0 0 0 0 0 0 0Activos por Impuestos a las Ganancias / Assets from income tax 0 0 0 0 0 0 0 0 0 0Gastos Pagados por Anticipado / Prepaid expenses 7,884 9,071 5,142 5,429 343 0 295 521 1,578 3,046Otros Activos / Other assets 0 0 0 0 0 0 0 0 0 0Activos no Corrientes o Grupos de Activos para su Disposición Clasificados como Mantenidos para laVenta / Non-current assets or groups of assets for disposal classified as held for sale 0 0 0 0 0 0 0 0 0 0Activos no Corrientes o Grupos de Activos para su Disposición Clasificados como Mantenidos paraDistribuir a los Propietarios / Non-current assets or groups of assets for disposal classified as held forDistribution to owner 0 0 0 0 0 0 0 0 0 0
TOTAL ACTIVOS CORRIENTES / TOTAL CURRENT ASSETS 388,536 363,995 481,181 378,121 79,557 84,787 32,613 32,951 154,065 179,077Otros Activos Financieros / Other financial assets 360,511 360,511 14,305 14,491 0 0 0 0 0 0Inversiones Contabilizadas Aplicando el Método de la Participación / Investments booked using the equitymethod 0 0 0 0 0 0 0 0 0 0Cuentas por Cobrar Comerciales / Trade accounts receivable 0 0 1,801 1,931 0 0 1,303 1,350 0 0Otras Cuentas por Cobrar / Other accounts receivable 0 0 0 0 0 0 0 0 0 0Cuentas por Cobrar a Entidades Relacionadas / Accounts receivable from related companies 0 0 0 0 0 0 0 0 0 0Activos Biológicos / Biological assets 0 0 0 0 0 0 0 0 0 0Propiedades de Inversión / Investment property 0 0 0 0 0 0 0 0 0 0Propiedades, Planta y Equipo (neto) / Property, plant and equipment (net) 3,275,341 3,311,869 2,243,806 2,222,955 530,783 529,478 150,543 147,163 266,746 265,464Activos Intangibles (neto) / Intangible assets (net) 2,012 2,170 14,248 14,763 1,270 1,241 892 935 134 135Activos por Impuestos a las Ganancias Diferidos / Assets from deferred income tax 6,813 7,902 0 0 417 417 0 0 0 0Plusvalía / Capital gain 0 0 0 0 0 0 0 0 0 0Otros Activos / Other assets 0 0 0 0 611 780 0 0 0 0
TOTAL ACTIVOS NO CORRIENTES / TOTAL NON-CURRENT ASSETS 3,644,677 3,682,452 2,274,160 2,254,140 533,081 531,916 152,738 149,448 266,880 265,599TOTAL DE ACTIVOS / TOTAL ASSETS 4,033,213 4,046,447 2,755,341 2,632,261 612,638 616,703 185,351 182,399 420,945 444,676
Otros Pasivos Financieros / Other financial liabilities 123,755 107,461 208,369 150,400 5,319 7,155 1,439 1,391 40,000 40,000Cuentas por Pagar Comerciales / Trade accounts payable 68,072 91,481 165,800 138,453 28,046 27,644 9,166 7,040 11,761 21,254Otras Cuentas por Pagar / Other accounts payable 38,801 41,488 295,409 153,252 30,820 35,296 2,804 2,268 8,419 5,539Cuentas por Pagar a Entidades Relacionadas / Accounts payable to related companies 13,300 73 49,692 59,085 0 3,917 35 4,845 0 1,080Provisiones / Provisions 73,071 71,952 24,199 30,689 0 0 899 794 0 0Pasivos por Impuestos a las Ganancias / Liabilities from income tax 19,084 57,250 8,913 5,030 0 0 954 792 4,054 10,694Provisión por Beneficios a los Empleados / Provisions for employee profit sharing 0 0 0 0 430 0 285 746 0 0Otros Pasivos / Other Liabilities 0 0 0 0 0 0 0 0 0 0Pasivos incluidos en Grupos de Activos para su Disposición Clasificados como Mantenidos para la Venta/ Liabilities included in groups of assets for disposal classified as held for sale 0 0 0 0 0 0 0 0 0 0
TOTAL PASIVOS CORRIENTES / TOTAL CURRENT LIABILITIES 336,083 369,705 752,382 536,909 64,615 74,012 15,582 17,876 64,234 78,567Otros Pasivos Financieros / Other financial liabilities 696,843 744,873 707,158 791,917 14,852 14,683 14,163 12,511 136,172 162,374Cuentas por Pagar Comerciales / Trade accounts payable 0 0 0 0 0 0 0 0 0 0Otras Cuentas por Pagar / Other accounts payable 0 0 3,684 3,578 0 0 1,234 1,257 0 0Cuentas por Pagar a Entidades Relacionadas / Accounts payable to related companies 0 0 0 0 0 0 0 0 0 0Pasivos por Impuestos a las Ganancias Diferidos / Liabilities from deferred income tax 672,801 675,269 290,324 295,354 5,510 5,510 0 0 11,620 11,939Provisiones / Provisions 8,679 8,557 0 0 0 0 0 0 0 0Provisión por Beneficios a los Empleados / Provisions for employee profit sharing 0 0 0 0 0 0 0 0 0 0Otros Pasivos / Other Liabilities 0 0 0 0 0 0 0 0 0 0Ingresos Diferidos (netos) / Deferred income (net) 0 0 3,335 3,282 0 0 0 0 0 0
TOTAL PASIVOS NO CORRIENTES / TOTAL NON-CURRENT LIABILITIES 1,378,323 1,428,699 1,004,501 1,094,131 20,362 20,193 15,397 13,768 147,792 174,313TOTAL PASIVOS / TOTAL LIABILITIES 1,714,406 1,798,404 1,756,883 1,631,040 84,977 94,205 30,979 31,644 212,026 252,880
Capital Emitido / Issued capital 2,018,429 2,018,429 638,564 638,564 486,922 486,907 137,442 137,442 81,553 81,553Primas de Emisión / Share premium 0 0 0 0 0 0 0 0 2,671 2,671Acciones de Inversión / Investment stock 0 0 0 0 0 0 0 0 0 0Acciones Propias en Cartera / Treasury shares 0 0 0 0 0 0 0 0 0 0Otras Reservas de Capital / Other capital reserves 159,949 139,902 133,188 133,188 4,202 4,202 3,776 3,776 16,311 16,311Resultados Acumulados / Retained earnings 82,119 34,324 216,692 219,325 -4,242 -9,390 12,400 8,783 108,384 91,261Otras Reservas de Patrimonio / Other equity reserves 58,310 55,388 10,014 10,144 40,779 40,779 754 754 0 0
TOTAL PATRIMONIO / TOTAL EQUITY 2,318,807 2,248,043 998,458 1,001,221 527,661 522,498 154,372 150,755 208,919 191,796TOTAL PASIVO Y PATRIMONIO / TOTAL LIABILITIES AND EQUITY 4,033,213 4,046,447 2,755,341 2,632,261 612,638 616,703 185,351 182,399 420,945 444,676
ESTADO DE RESULTADOS / INCOME STATEMENT 31/03/2012 31/03/2011 31/03/2012 31/03/2011 31/03/2012 31/03/2011 31/03/2012 31/03/2011 31/03/2012 31/03/2011
Ventas Netas de Bienes / Net sales of goods 0 0 0 0 0 0 0 0 61,641 76,457Prestación de Servicios / Services rendered 344,334 305,911 521,111 463,401 50,889 44,293 29,354 26,152 26 27
TOTAL DE INGRESOS DE ACTIVIDADES ORDINARIAS / TOTAL INCOME FROM REGULARACTIVITIES 344,334 305,911 521,111 463,401 50,889 44,293 29,354 26,152 61,667 76,484
Costo de Ventas / Cost of sales -206,718 -191,714 -391,462 -340,028 -35,677 -30,769 -21,816 -19,754 -35,317 -43,400GANANCIA (PERDIDA) BRUTA / GROSS PROFIT (LOSS) 137,616 114,197 129,649 123,373 15,212 13,524 7,538 6,398 26,350 33,084
Gastos de Ventas y Distribución / Sales and distribution expenses 0 0 -18,880 -16,680 -4,800 -4,398 -1,664 -1,497 -271 -231Gastos de Administración / Overheads -11,544 -11,586 -18,101 -17,540 -2,205 -2,284 -1,084 -1,231 -2,032 -1,568Ganancia (Pérdida) de la baja en Activos Financieros medidos al Costo Amortizado / Profit (loss) fromdisposal of financial assets measured at amortized cost 0 0 0 0 0 0 0 0 0 0Otros Ingresos Operativos / Other operating income 2,658 1,864 5,134 2,274 365 403 304 236 90 466Otros Gastos Operativos / Other operating expenses 0 0 -6,094 -418 -1,537 -2,303 0 0 0 -94
GANANCIA (PERDIDA) OPERATIVA / OPERATING PROFIT (LOSS) 128,730 104,475 91,708 91,009 7,035 4,942 5,094 3,906 24,137 31,657Ingresos Financieros / Financial income 1,797 2,521 11,327 2,945 329 45 151 168 510 540Gastos Financieros / Financial expenses -12,118 -14,759 -16,445 -22,690 0 -3 -4 -36 -630 -759Diferencias de Cambio neto / Exchange differences net 0 0 209 -25 0 0 3 0 523 27Participación en los Resultados Netos de Asociadas y Negocios Conjuntos Contabilizados por el Métodode la Participación / Equity in net results of associates and joint ventures booked by the equity method 0 0 0 0 0 0 0 0 0 0Ganancias (Pérdidas) de la Diferencia entre el Valor Libro Anterior y el Valor Justo de ActivosFinancieros Reclasificados Medidos a Valor Razonable / Profits (losses) from the difference between theprevious book value and fair value of financial assets reclassified and measured at fair value 0 0 0 0 0 0 0 0 0 0
RESULTADO ANTES DE IMPUESTO A LAS GANANCIAS / PRE-INCOME TAX RESULT 118,409 92,237 86,799 71,239 7,364 4,984 5,244 4,038 24,540 31,465Gasto por Impuesto a las Ganancias / Income tax expenses -36,290 -27,138 -19,736 -20,684 -2,209 -1,669 -1,627 -1,273 -7,417 -9,118
GANANCIA (PERDIDA) NETA DE OPERACIONES CONTINUADAS / NET PROFIT (LOSS) FROMCONTINUING TRADES 82,119 65,099 67,063 50,555 5,155 3,315 3,617 2,765 17,123 22,347
Ganancia (Pérdida) Neta del Impuesto a las Ganancias Procedente de Operaciones Discontinuadas / Netprofit (loss) arising from income tax discontinued trades 0 0 0 0 0 0 0 0 0 0
GANANCIA (PERDIDA) NETA DEL EJERCICIO / PERIOD'S NET PROFIT (LOSS) 82,119 65,099 67,063 50,555 5,155 3,315 3,617 2,765 17,123 22,347
INDICADORES FINANCIEROS / FINANCIAL RATIOSLiquidez / Liquid Ratio 1.16 0.64 1.23 2.09 2.40 Rotación de Activos / Gross Sales to Total Assets 0.09 0.19 0.08 0.16 0.15 Solvencia / Solvency 0.43 0.64 0.14 0.17 0.50 Deuda / Patrimonio / Debt / Equity 0.74 1.76 0.16 0.20 1.01 Rentabilidad sobre Ventas Netas % / Return % 23.85 12.87 10.13 12.32 27.77 Rentabilidad sobre Activos % / Return on Assets % 2.04 2.43 0.84 1.95 4.07 Rentabilidad de Patrimonio % / Return on Equity % 3.54 6.72 0.98 2.34 8.20
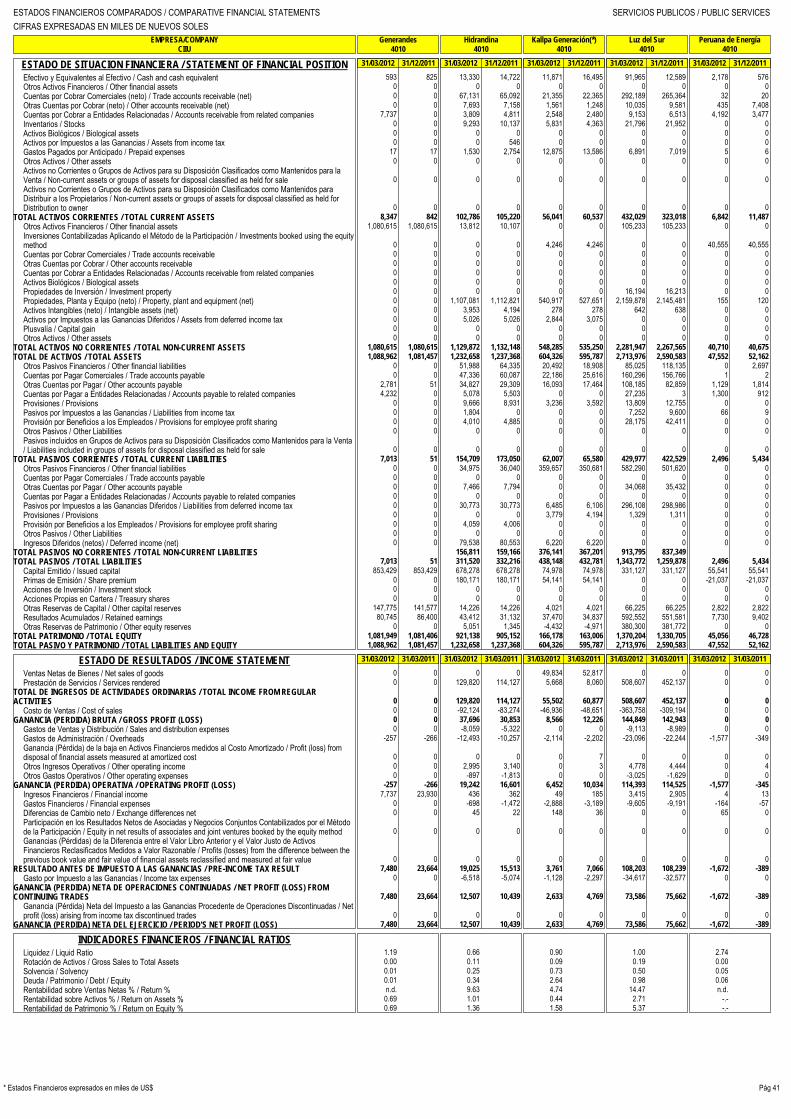
ESTADOS FINANCIEROS COMPARADOS / COMPARATIVE FINANCIAL STATEMENTS SERVICIOS PUBLICOS / PUBLIC SERVICESCIFRAS EXPRESADAS EN MILES DE NUEVOS SOLES
EMPRESA/COMPANY
Generandes
Hidrandina
Kallpa Generación(*)
Luz del Sur
Peruana de EnergíaCIIU
4010
4010
4010
4010
4010
Pág 41* Estados Financieros expresados en miles de US$
ESTADO DE SITUACION FINANCIERA / STATEMENT OF FINANCIAL POSITION 31/03/2012 31/12/2011 31/03/2012 31/12/2011 31/03/2012 31/12/2011 31/03/2012 31/12/2011 31/03/2012 31/12/2011
Efectivo y Equivalentes al Efectivo / Cash and cash equivalent 593 825 13,330 14,722 11,871 16,495 91,965 12,589 2,178 576Otros Activos Financieros / Other financial assets 0 0 0 0 0 0 0 0 0 0Cuentas por Cobrar Comerciales (neto) / Trade accounts receivable (net) 0 0 67,131 65,092 21,355 22,365 292,189 265,364 32 20Otras Cuentas por Cobrar (neto) / Other accounts receivable (net) 0 0 7,693 7,158 1,561 1,248 10,035 9,581 435 7,408Cuentas por Cobrar a Entidades Relacionadas / Accounts receivable from related companies 7,737 0 3,809 4,811 2,548 2,480 9,153 6,513 4,192 3,477Inventarios / Stocks 0 0 9,293 10,137 5,831 4,363 21,796 21,952 0 0Activos Biológicos / Biological assets 0 0 0 0 0 0 0 0 0 0Activos por Impuestos a las Ganancias / Assets from income tax 0 0 0 546 0 0 0 0 0 0Gastos Pagados por Anticipado / Prepaid expenses 17 17 1,530 2,754 12,875 13,586 6,891 7,019 5 6Otros Activos / Other assets 0 0 0 0 0 0 0 0 0 0Activos no Corrientes o Grupos de Activos para su Disposición Clasificados como Mantenidos para laVenta / Non-current assets or groups of assets for disposal classified as held for sale 0 0 0 0 0 0 0 0 0 0Activos no Corrientes o Grupos de Activos para su Disposición Clasificados como Mantenidos paraDistribuir a los Propietarios / Non-current assets or groups of assets for disposal classified as held forDistribution to owner 0 0 0 0 0 0 0 0 0 0
TOTAL ACTIVOS CORRIENTES / TOTAL CURRENT ASSETS 8,347 842 102,786 105,220 56,041 60,537 432,029 323,018 6,842 11,487Otros Activos Financieros / Other financial assets 1,080,615 1,080,615 13,812 10,107 0 0 105,233 105,233 0 0Inversiones Contabilizadas Aplicando el Método de la Participación / Investments booked using the equitymethod 0 0 0 0 4,246 4,246 0 0 40,555 40,555Cuentas por Cobrar Comerciales / Trade accounts receivable 0 0 0 0 0 0 0 0 0 0Otras Cuentas por Cobrar / Other accounts receivable 0 0 0 0 0 0 0 0 0 0Cuentas por Cobrar a Entidades Relacionadas / Accounts receivable from related companies 0 0 0 0 0 0 0 0 0 0Activos Biológicos / Biological assets 0 0 0 0 0 0 0 0 0 0Propiedades de Inversión / Investment property 0 0 0 0 0 0 16,194 16,213 0 0Propiedades, Planta y Equipo (neto) / Property, plant and equipment (net) 0 0 1,107,081 1,112,821 540,917 527,651 2,159,878 2,145,481 155 120Activos Intangibles (neto) / Intangible assets (net) 0 0 3,953 4,194 278 278 642 638 0 0Activos por Impuestos a las Ganancias Diferidos / Assets from deferred income tax 0 0 5,026 5,026 2,844 3,075 0 0 0 0Plusvalía / Capital gain 0 0 0 0 0 0 0 0 0 0Otros Activos / Other assets 0 0 0 0 0 0 0 0 0 0
TOTAL ACTIVOS NO CORRIENTES / TOTAL NON-CURRENT ASSETS 1,080,615 1,080,615 1,129,872 1,132,148 548,285 535,250 2,281,947 2,267,565 40,710 40,675TOTAL DE ACTIVOS / TOTAL ASSETS 1,088,962 1,081,457 1,232,658 1,237,368 604,326 595,787 2,713,976 2,590,583 47,552 52,162
Otros Pasivos Financieros / Other financial liabilities 0 0 51,988 64,335 20,492 18,908 85,025 118,135 0 2,697Cuentas por Pagar Comerciales / Trade accounts payable 0 0 47,336 60,087 22,186 25,616 160,296 156,766 1 2Otras Cuentas por Pagar / Other accounts payable 2,781 51 34,827 29,309 16,093 17,464 108,185 82,859 1,129 1,814Cuentas por Pagar a Entidades Relacionadas / Accounts payable to related companies 4,232 0 5,078 5,503 0 0 27,235 3 1,300 912Provisiones / Provisions 0 0 9,666 8,931 3,236 3,592 13,809 12,755 0 0Pasivos por Impuestos a las Ganancias / Liabilities from income tax 0 0 1,804 0 0 0 7,252 9,600 66 9Provisión por Beneficios a los Empleados / Provisions for employee profit sharing 0 0 4,010 4,885 0 0 28,175 42,411 0 0Otros Pasivos / Other Liabilities 0 0 0 0 0 0 0 0 0 0Pasivos incluidos en Grupos de Activos para su Disposición Clasificados como Mantenidos para la Venta/ Liabilities included in groups of assets for disposal classified as held for sale 0 0 0 0 0 0 0 0 0 0
TOTAL PASIVOS CORRIENTES / TOTAL CURRENT LIABILITIES 7,013 51 154,709 173,050 62,007 65,580 429,977 422,529 2,496 5,434Otros Pasivos Financieros / Other financial liabilities 0 0 34,975 36,040 359,657 350,681 582,290 501,620 0 0Cuentas por Pagar Comerciales / Trade accounts payable 0 0 0 0 0 0 0 0 0 0Otras Cuentas por Pagar / Other accounts payable 0 0 7,466 7,794 0 0 34,068 35,432 0 0Cuentas por Pagar a Entidades Relacionadas / Accounts payable to related companies 0 0 0 0 0 0 0 0 0 0Pasivos por Impuestos a las Ganancias Diferidos / Liabilities from deferred income tax 0 0 30,773 30,773 6,485 6,106 296,108 298,986 0 0Provisiones / Provisions 0 0 0 0 3,779 4,194 1,329 1,311 0 0Provisión por Beneficios a los Empleados / Provisions for employee profit sharing 0 0 4,059 4,006 0 0 0 0 0 0Otros Pasivos / Other Liabilities 0 0 0 0 0 0 0 0 0 0Ingresos Diferidos (netos) / Deferred income (net) 0 0 79,538 80,553 6,220 6,220 0 0 0 0
TOTAL PASIVOS NO CORRIENTES / TOTAL NON-CURRENT LIABILITIES 156,811 159,166 376,141 367,201 913,795 837,349 TOTAL PASIVOS / TOTAL LIABILITIES 7,013 51 311,520 332,216 438,148 432,781 1,343,772 1,259,878 2,496 5,434
Capital Emitido / Issued capital 853,429 853,429 678,278 678,278 74,978 74,978 331,127 331,127 55,541 55,541Primas de Emisión / Share premium 0 0 180,171 180,171 54,141 54,141 0 0 -21,037 -21,037Acciones de Inversión / Investment stock 0 0 0 0 0 0 0 0 0 0Acciones Propias en Cartera / Treasury shares 0 0 0 0 0 0 0 0 0 0Otras Reservas de Capital / Other capital reserves 147,775 141,577 14,226 14,226 4,021 4,021 66,225 66,225 2,822 2,822Resultados Acumulados / Retained earnings 80,745 86,400 43,412 31,132 37,470 34,837 592,552 551,581 7,730 9,402Otras Reservas de Patrimonio / Other equity reserves 0 0 5,051 1,345 -4,432 -4,971 380,300 381,772 0 0
TOTAL PATRIMONIO / TOTAL EQUITY 1,081,949 1,081,406 921,138 905,152 166,178 163,006 1,370,204 1,330,705 45,056 46,728TOTAL PASIVO Y PATRIMONIO / TOTAL LIABILITIES AND EQUITY 1,088,962 1,081,457 1,232,658 1,237,368 604,326 595,787 2,713,976 2,590,583 47,552 52,162
ESTADO DE RESULTADOS / INCOME STATEMENT 31/03/2012 31/03/2011 31/03/2012 31/03/2011 31/03/2012 31/03/2011 31/03/2012 31/03/2011 31/03/2012 31/03/2011
Ventas Netas de Bienes / Net sales of goods 0 0 0 0 49,834 52,817 0 0 0 0Prestación de Servicios / Services rendered 0 0 129,820 114,127 5,668 8,060 508,607 452,137 0 0
TOTAL DE INGRESOS DE ACTIVIDADES ORDINARIAS / TOTAL INCOME FROM REGULARACTIVITIES 0 0 129,820 114,127 55,502 60,877 508,607 452,137 0 0
Costo de Ventas / Cost of sales 0 0 -92,124 -83,274 -46,936 -48,651 -363,758 -309,194 0 0GANANCIA (PERDIDA) BRUTA / GROSS PROFIT (LOSS) 0 0 37,696 30,853 8,566 12,226 144,849 142,943 0 0
Gastos de Ventas y Distribución / Sales and distribution expenses 0 0 -8,059 -5,322 0 0 -9,113 -8,989 0 0Gastos de Administración / Overheads -257 -266 -12,493 -10,257 -2,114 -2,202 -23,096 -22,244 -1,577 -349Ganancia (Pérdida) de la baja en Activos Financieros medidos al Costo Amortizado / Profit (loss) fromdisposal of financial assets measured at amortized cost 0 0 0 0 0 7 0 0 0 0Otros Ingresos Operativos / Other operating income 0 0 2,995 3,140 0 3 4,778 4,444 0 4Otros Gastos Operativos / Other operating expenses 0 0 -897 -1,813 0 0 -3,025 -1,629 0 0
GANANCIA (PERDIDA) OPERATIVA / OPERATING PROFIT (LOSS) -257 -266 19,242 16,601 6,452 10,034 114,393 114,525 -1,577 -345Ingresos Financieros / Financial income 7,737 23,930 436 362 49 185 3,415 2,905 4 13Gastos Financieros / Financial expenses 0 0 -698 -1,472 -2,888 -3,189 -9,605 -9,191 -164 -57Diferencias de Cambio neto / Exchange differences net 0 0 45 22 148 36 0 0 65 0Participación en los Resultados Netos de Asociadas y Negocios Conjuntos Contabilizados por el Métodode la Participación / Equity in net results of associates and joint ventures booked by the equity method 0 0 0 0 0 0 0 0 0 0Ganancias (Pérdidas) de la Diferencia entre el Valor Libro Anterior y el Valor Justo de ActivosFinancieros Reclasificados Medidos a Valor Razonable / Profits (losses) from the difference between theprevious book value and fair value of financial assets reclassified and measured at fair value 0 0 0 0 0 0 0 0 0 0
RESULTADO ANTES DE IMPUESTO A LAS GANANCIAS / PRE-INCOME TAX RESULT 7,480 23,664 19,025 15,513 3,761 7,066 108,203 108,239 -1,672 -389Gasto por Impuesto a las Ganancias / Income tax expenses 0 0 -6,518 -5,074 -1,128 -2,297 -34,617 -32,577 0 0
GANANCIA (PERDIDA) NETA DE OPERACIONES CONTINUADAS / NET PROFIT (LOSS) FROMCONTINUING TRADES 7,480 23,664 12,507 10,439 2,633 4,769 73,586 75,662 -1,672 -389
Ganancia (Pérdida) Neta del Impuesto a las Ganancias Procedente de Operaciones Discontinuadas / Netprofit (loss) arising from income tax discontinued trades 0 0 0 0 0 0 0 0 0 0
GANANCIA (PERDIDA) NETA DEL EJERCICIO / PERIOD'S NET PROFIT (LOSS) 7,480 23,664 12,507 10,439 2,633 4,769 73,586 75,662 -1,672 -389
INDICADORES FINANCIEROS / FINANCIAL RATIOSLiquidez / Liquid Ratio 1.19 0.66 0.90 1.00 2.74 Rotación de Activos / Gross Sales to Total Assets 0.00 0.11 0.09 0.19 0.00 Solvencia / Solvency 0.01 0.25 0.73 0.50 0.05 Deuda / Patrimonio / Debt / Equity 0.01 0.34 2.64 0.98 0.06 Rentabilidad sobre Ventas Netas % / Return % n.d. 9.63 4.74 14.47 n.d. Rentabilidad sobre Activos % / Return on Assets % 0.69 1.01 0.44 2.71 -.- Rentabilidad de Patrimonio % / Return on Equity % 0.69 1.36 1.58 5.37 -.-

ESTADOS FINANCIEROS COMPARADOS / COMPARATIVE FINANCIAL STATEMENTS SERVICIOS PUBLICOS / PUBLIC SERVICESCIFRAS EXPRESADAS EN MILES DE NUEVOS SOLES
EMPRESA/COMPANY
Red de Energía (*)
SEAL
SHOUGESA
San Gabán
Duke Energy EgenorCIIU
4010
4010
4010
4010
4010-4
Pág 42 * Estados Financieros expresados en miles de US$
ESTADO DE SITUACION FINANCIERA / STATEMENT OF FINANCIAL POSITION 31/03/2012 31/12/2011 31/03/2012 31/12/2011 31/03/2012 31/12/2011 31/03/2012 31/12/2011 31/03/2012 31/12/2011
Efectivo y Equivalentes al Efectivo / Cash and cash equivalent 8,941 11,842 45,946 42,778 61,486 64,675 15,416 17,018 176,825 121,896Otros Activos Financieros / Other financial assets 0 0 0 0 0 0 0 0 0 0Cuentas por Cobrar Comerciales (neto) / Trade accounts receivable (net) 9,104 9,185 43,189 37,196 9,470 2,850 6,440 4,225 57,830 58,135Otras Cuentas por Cobrar (neto) / Other accounts receivable (net) 1,762 1,345 2,995 1,531 2,823 2,870 24,286 17,527 1,939 1,842Cuentas por Cobrar a Entidades Relacionadas / Accounts receivable from related companies 2,938 44,037 0 0 234 451 4,688 8,394 7,638 8,580Inventarios / Stocks 5,435 5,591 20,976 22,368 1,539 1,222 11,951 12,475 10,300 11,106Activos Biológicos / Biological assets 0 0 0 0 0 0 0 0 0 0Activos por Impuestos a las Ganancias / Assets from income tax 0 0 0 0 0 0 0 0 0 791Gastos Pagados por Anticipado / Prepaid expenses 1,058 1,407 2,312 2,546 102 290 1,204 2,561 3,924 757Otros Activos / Other assets 0 0 0 0 0 0 0 0 0 0Activos no Corrientes o Grupos de Activos para su Disposición Clasificados como Mantenidos para laVenta / Non-current assets or groups of assets for disposal classified as held for sale 0 0 0 0 0 0 0 0 0 0Activos no Corrientes o Grupos de Activos para su Disposición Clasificados como Mantenidos paraDistribuir a los Propietarios / Non-current assets or groups of assets for disposal classified as held forDistribution to owner 0 0 0 0 0 0 0 0 0 0
TOTAL ACTIVOS CORRIENTES / TOTAL CURRENT ASSETS 29,238 73,407 115,418 106,419 75,654 72,358 63,985 62,200 258,456 203,107Otros Activos Financieros / Other financial assets 0 0 72 72 0 0 0 0 0 0Inversiones Contabilizadas Aplicando el Método de la Participación / Investments booked using the equitymethod 0 0 0 0 0 0 0 0 0 0Cuentas por Cobrar Comerciales / Trade accounts receivable 0 0 0 0 0 0 0 0 0 0Otras Cuentas por Cobrar / Other accounts receivable 0 0 0 0 0 0 630 630 1,545 1,545Cuentas por Cobrar a Entidades Relacionadas / Accounts receivable from related companies 97,000 50,000 0 0 0 0 0 0 0 0Activos Biológicos / Biological assets 0 0 0 0 0 0 0 0 0 0Propiedades de Inversión / Investment property 0 0 0 0 0 0 0 0 32,959 32,959Propiedades, Planta y Equipo (neto) / Property, plant and equipment (net) 13,591 13,263 264,105 262,069 50,213 51,304 399,086 401,400 1,200,292 1,212,264Activos Intangibles (neto) / Intangible assets (net) 397,563 390,765 92 92 21 21 5,452 5,458 993 1,175Activos por Impuestos a las Ganancias Diferidos / Assets from deferred income tax 0 0 19,550 19,550 0 0 0 0 0 5,500Plusvalía / Capital gain 0 0 0 0 0 0 0 0 0 0Otros Activos / Other assets 0 0 0 0 0 0 0 0 56 56
TOTAL ACTIVOS NO CORRIENTES / TOTAL NON-CURRENT ASSETS 508,154 454,028 283,819 281,783 50,234 51,325 405,168 407,488 1,235,845 1,253,499TOTAL DE ACTIVOS / TOTAL ASSETS 537,392 527,435 399,237 388,202 125,888 123,683 469,153 469,688 1,494,301 1,456,606
Otros Pasivos Financieros / Other financial liabilities 78,703 68,347 41,685 41,372 0 0 35,493 35,515 39,725 40,307Cuentas por Pagar Comerciales / Trade accounts payable 7,386 8,532 24,384 31,839 1,981 1,709 4,420 8,325 20,007 15,131Otras Cuentas por Pagar / Other accounts payable 5,110 4,407 40,580 10,411 1,976 3,588 29,015 2,896 13,068 10,151Cuentas por Pagar a Entidades Relacionadas / Accounts payable to related companies 1,844 2,003 0 0 1,827 2,142 2,383 2,763 112 435Provisiones / Provisions 6,611 7,125 0 0 0 0 187 187 0 0Pasivos por Impuestos a las Ganancias / Liabilities from income tax 0 0 0 0 0 0 0 0 6,663 0Provisión por Beneficios a los Empleados / Provisions for employee profit sharing 0 0 0 0 0 0 1,254 1,254 8,883 10,850Otros Pasivos / Other Liabilities 0 0 0 0 0 0 0 0 0 0Pasivos incluidos en Grupos de Activos para su Disposición Clasificados como Mantenidos para la Venta/ Liabilities included in groups of assets for disposal classified as held for sale 0 0 0 0 0 0 0 0 0 0
TOTAL PASIVOS CORRIENTES / TOTAL CURRENT LIABILITIES 99,654 90,414 106,649 83,622 5,784 7,439 72,752 50,940 88,458 76,874Otros Pasivos Financieros / Other financial liabilities 145,725 152,007 1,465 1,621 0 0 61,690 70,504 356,451 369,935Cuentas por Pagar Comerciales / Trade accounts payable 0 0 0 0 0 0 0 0 0 0Otras Cuentas por Pagar / Other accounts payable 0 0 0 0 0 0 0 0 0 0Cuentas por Pagar a Entidades Relacionadas / Accounts payable to related companies 0 0 0 0 0 0 0 0 0 0Pasivos por Impuestos a las Ganancias Diferidos / Liabilities from deferred income tax 34,605 34,298 0 0 10,520 10,520 4,716 4,716 183,410 178,255Provisiones / Provisions 28,161 26,118 0 0 2,875 2,710 0 0 395 401Provisión por Beneficios a los Empleados / Provisions for employee profit sharing 0 0 0 0 421 421 0 0 0 0Otros Pasivos / Other Liabilities 0 0 0 0 0 0 0 0 2,355 2,355Ingresos Diferidos (netos) / Deferred income (net) 0 0 0 0 0 0 0 0 0 0
TOTAL PASIVOS NO CORRIENTES / TOTAL NON-CURRENT LIABILITIES 208,491 212,423 1,465 1,621 13,816 13,651 66,406 75,220 542,611 550,946TOTAL PASIVOS / TOTAL LIABILITIES 308,145 302,837 108,114 85,243 19,600 21,090 139,158 126,160 631,069 627,820
Capital Emitido / Issued capital 121,254 121,254 204,842 204,842 62,645 62,645 307,297 307,297 538,519 538,519Primas de Emisión / Share premium 0 0 0 0 0 0 0 0 0 0Acciones de Inversión / Investment stock 0 0 0 0 0 0 0 0 0 0Acciones Propias en Cartera / Treasury shares 0 0 36,993 36,993 0 0 0 0 0 0Otras Reservas de Capital / Other capital reserves 4,737 4,737 12,756 10,297 162 162 14,493 12,077 52,980 52,980Resultados Acumulados / Retained earnings 103,256 98,607 36,532 50,827 43,481 39,786 8,205 24,154 271,733 237,287Otras Reservas de Patrimonio / Other equity reserves 0 0 0 0 0 0 0 0 0 0
TOTAL PATRIMONIO / TOTAL EQUITY 229,247 224,598 291,123 302,959 106,288 102,593 329,995 343,528 863,232 828,786TOTAL PASIVO Y PATRIMONIO / TOTAL LIABILITIES AND EQUITY 537,392 527,435 399,237 388,202 125,888 123,683 469,153 469,688 1,494,301 1,456,606
ESTADO DE RESULTADOS / INCOME STATEMENT 31/03/2012 31/03/2011 31/03/2012 31/03/2011 31/03/2012 31/03/2011 31/03/2012 31/03/2011 31/03/2012 31/03/2011
Ventas Netas de Bienes / Net sales of goods 0 0 0 0 20,949 19,801 31,340 22,322 0 0Prestación de Servicios / Services rendered 26,128 23,411 77,065 66,511 0 0 0 0 123,409 94,603
TOTAL DE INGRESOS DE ACTIVIDADES ORDINARIAS / TOTAL INCOME FROM REGULARACTIVITIES 26,128 23,411 77,065 66,511 20,949 19,801 31,340 22,322 123,409 94,603
Costo de Ventas / Cost of sales -14,977 -12,492 -52,550 -49,290 -11,680 -11,327 -16,648 -11,831 -58,883 -50,493GANANCIA (PERDIDA) BRUTA / GROSS PROFIT (LOSS) 11,151 10,919 24,515 17,221 9,269 8,474 14,692 10,491 64,526 44,110
Gastos de Ventas y Distribución / Sales and distribution expenses 0 0 -7,766 -3,539 -3,784 -4,365 -407 -315 -3,038 -1,902Gastos de Administración / Overheads -3,114 -2,512 -3,311 -2,830 -594 -684 -1,333 -1,137 -9,511 -8,753Ganancia (Pérdida) de la baja en Activos Financieros medidos al Costo Amortizado / Profit (loss) fromdisposal of financial assets measured at amortized cost 0 0 0 0 0 0 0 0 0 0Otros Ingresos Operativos / Other operating income 0 0 830 0 0 1 109 586 5,697 4,780Otros Gastos Operativos / Other operating expenses 0 0 0 -555 -5 -2 0 0 0 0
GANANCIA (PERDIDA) OPERATIVA / OPERATING PROFIT (LOSS) 8,037 8,407 14,268 10,297 4,886 3,424 13,061 9,625 57,674 38,235Ingresos Financieros / Financial income 1,684 785 695 571 439 211 10 25 8,227 13,078Gastos Financieros / Financial expenses -3,104 -2,392 -269 -216 -15 -46 -848 -1,198 -13,344 -15,085Diferencias de Cambio neto / Exchange differences net -148 -167 0 0 -31 0 -24 3,707 0 0Participación en los Resultados Netos de Asociadas y Negocios Conjuntos Contabilizados por el Métodode la Participación / Equity in net results of associates and joint ventures booked by the equity method 0 0 0 0 0 0 0 0 0 0Ganancias (Pérdidas) de la Diferencia entre el Valor Libro Anterior y el Valor Justo de ActivosFinancieros Reclasificados Medidos a Valor Razonable / Profits (losses) from the difference between theprevious book value and fair value of financial assets reclassified and measured at fair value 0 0 0 0 0 0 0 0 0 0
RESULTADO ANTES DE IMPUESTO A LAS GANANCIAS / PRE-INCOME TAX RESULT 6,469 6,633 14,694 10,652 5,279 3,589 12,199 12,159 52,557 36,228Gasto por Impuesto a las Ganancias / Income tax expenses -1,820 -2,055 -4,408 -3,196 -1,584 -981 -3,660 -3,493 -18,111 -11,458
GANANCIA (PERDIDA) NETA DE OPERACIONES CONTINUADAS / NET PROFIT (LOSS) FROMCONTINUING TRADES 4,649 4,578 10,286 7,456 3,695 2,608 8,539 8,666 34,446 24,770
Ganancia (Pérdida) Neta del Impuesto a las Ganancias Procedente de Operaciones Discontinuadas / Netprofit (loss) arising from income tax discontinued trades 0 0 0 0 0 0 0 0 0 0
GANANCIA (PERDIDA) NETA DEL EJERCICIO / PERIOD'S NET PROFIT (LOSS) 4,649 4,578 10,286 7,456 3,695 2,608 8,539 8,666 34,446 24,770
INDICADORES FINANCIEROS / FINANCIAL RATIOSLiquidez / Liquid Ratio 0.29 1.08 13.08 0.88 2.92 Rotación de Activos / Gross Sales to Total Assets 0.05 0.19 0.17 0.07 0.08 Solvencia / Solvency 0.57 0.27 0.16 0.30 0.42 Deuda / Patrimonio / Debt / Equity 1.34 0.37 0.18 0.42 0.73 Rentabilidad sobre Ventas Netas % / Return % 17.79 13.35 17.64 27.25 27.91 Rentabilidad sobre Activos % / Return on Assets % 0.87 2.58 2.94 1.82 2.31 Rentabilidad de Patrimonio % / Return on Equity % 2.03 3.53 3.48 2.59 3.99
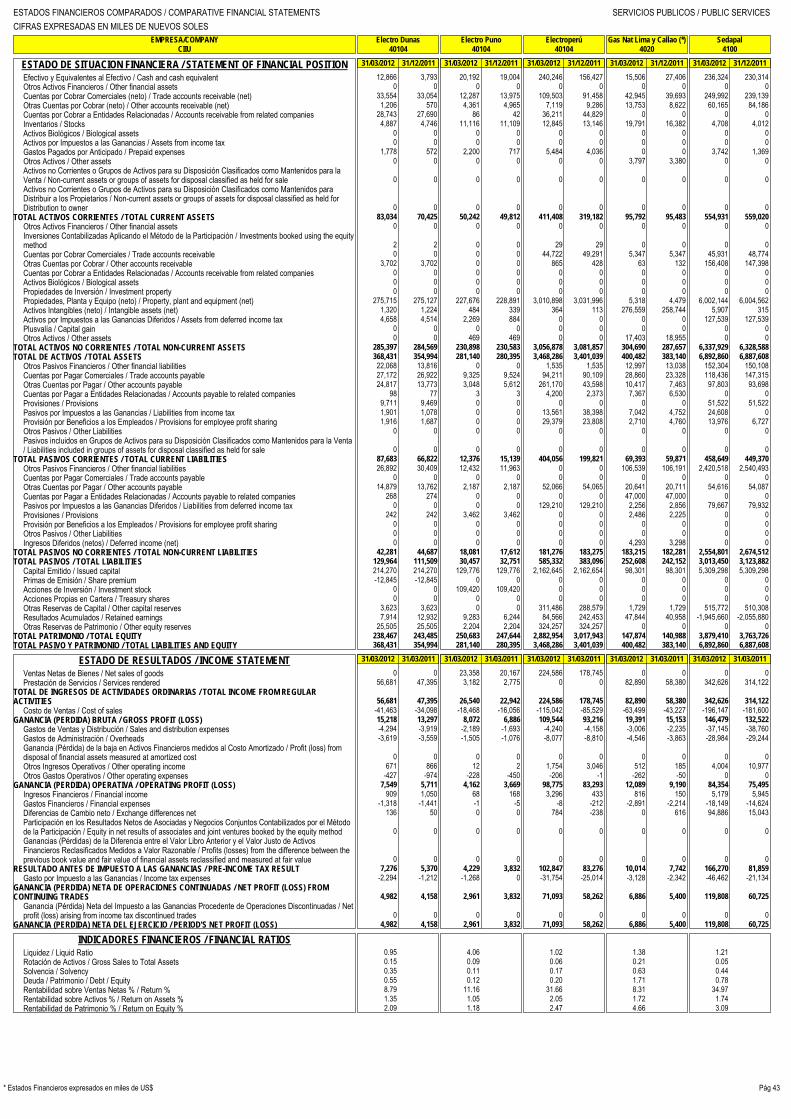
ESTADOS FINANCIEROS COMPARADOS / COMPARATIVE FINANCIAL STATEMENTS SERVICIOS PUBLICOS / PUBLIC SERVICESCIFRAS EXPRESADAS EN MILES DE NUEVOS SOLES
EMPRESA/COMPANY
Electro Dunas
Electro Puno
Electroperú
Gas Nat Lima y Callao (*)
SedapalCIIU
40104
40104
40104
4020
4100
Pág 43* Estados Financieros expresados en miles de US$
ESTADO DE SITUACION FINANCIERA / STATEMENT OF FINANCIAL POSITION 31/03/2012 31/12/2011 31/03/2012 31/12/2011 31/03/2012 31/12/2011 31/03/2012 31/12/2011 31/03/2012 31/12/2011
Efectivo y Equivalentes al Efectivo / Cash and cash equivalent 12,866 3,793 20,192 19,004 240,246 156,427 15,506 27,406 236,324 230,314Otros Activos Financieros / Other financial assets 0 0 0 0 0 0 0 0 0 0Cuentas por Cobrar Comerciales (neto) / Trade accounts receivable (net) 33,554 33,054 12,287 13,975 109,503 91,458 42,945 39,693 249,992 239,139Otras Cuentas por Cobrar (neto) / Other accounts receivable (net) 1,206 570 4,361 4,965 7,119 9,286 13,753 8,622 60,165 84,186Cuentas por Cobrar a Entidades Relacionadas / Accounts receivable from related companies 28,743 27,690 86 42 36,211 44,829 0 0 0 0Inventarios / Stocks 4,887 4,746 11,116 11,109 12,845 13,146 19,791 16,382 4,708 4,012Activos Biológicos / Biological assets 0 0 0 0 0 0 0 0 0 0Activos por Impuestos a las Ganancias / Assets from income tax 0 0 0 0 0 0 0 0 0 0Gastos Pagados por Anticipado / Prepaid expenses 1,778 572 2,200 717 5,484 4,036 0 0 3,742 1,369Otros Activos / Other assets 0 0 0 0 0 0 3,797 3,380 0 0Activos no Corrientes o Grupos de Activos para su Disposición Clasificados como Mantenidos para laVenta / Non-current assets or groups of assets for disposal classified as held for sale 0 0 0 0 0 0 0 0 0 0Activos no Corrientes o Grupos de Activos para su Disposición Clasificados como Mantenidos paraDistribuir a los Propietarios / Non-current assets or groups of assets for disposal classified as held forDistribution to owner 0 0 0 0 0 0 0 0 0 0
TOTAL ACTIVOS CORRIENTES / TOTAL CURRENT ASSETS 83,034 70,425 50,242 49,812 411,408 319,182 95,792 95,483 554,931 559,020Otros Activos Financieros / Other financial assets 0 0 0 0 0 0 0 0 0 0Inversiones Contabilizadas Aplicando el Método de la Participación / Investments booked using the equitymethod 2 2 0 0 29 29 0 0 0 0Cuentas por Cobrar Comerciales / Trade accounts receivable 0 0 0 0 44,722 49,291 5,347 5,347 45,931 48,774Otras Cuentas por Cobrar / Other accounts receivable 3,702 3,702 0 0 865 428 63 132 156,408 147,398Cuentas por Cobrar a Entidades Relacionadas / Accounts receivable from related companies 0 0 0 0 0 0 0 0 0 0Activos Biológicos / Biological assets 0 0 0 0 0 0 0 0 0 0Propiedades de Inversión / Investment property 0 0 0 0 0 0 0 0 0 0Propiedades, Planta y Equipo (neto) / Property, plant and equipment (net) 275,715 275,127 227,676 228,891 3,010,898 3,031,996 5,318 4,479 6,002,144 6,004,562Activos Intangibles (neto) / Intangible assets (net) 1,320 1,224 484 339 364 113 276,559 258,744 5,907 315Activos por Impuestos a las Ganancias Diferidos / Assets from deferred income tax 4,658 4,514 2,269 884 0 0 0 0 127,539 127,539Plusvalía / Capital gain 0 0 0 0 0 0 0 0 0 0Otros Activos / Other assets 0 0 469 469 0 0 17,403 18,955 0 0
TOTAL ACTIVOS NO CORRIENTES / TOTAL NON-CURRENT ASSETS 285,397 284,569 230,898 230,583 3,056,878 3,081,857 304,690 287,657 6,337,929 6,328,588TOTAL DE ACTIVOS / TOTAL ASSETS 368,431 354,994 281,140 280,395 3,468,286 3,401,039 400,482 383,140 6,892,860 6,887,608
Otros Pasivos Financieros / Other financial liabilities 22,068 13,816 0 0 1,535 1,535 12,997 13,038 152,304 150,108Cuentas por Pagar Comerciales / Trade accounts payable 27,172 26,922 9,325 9,524 94,211 90,109 28,860 23,328 118,436 147,315Otras Cuentas por Pagar / Other accounts payable 24,817 13,773 3,048 5,612 261,170 43,598 10,417 7,463 97,803 93,698Cuentas por Pagar a Entidades Relacionadas / Accounts payable to related companies 98 77 3 3 4,200 2,373 7,367 6,530 0 0Provisiones / Provisions 9,711 9,469 0 0 0 0 0 0 51,522 51,522Pasivos por Impuestos a las Ganancias / Liabilities from income tax 1,901 1,078 0 0 13,561 38,398 7,042 4,752 24,608 0Provisión por Beneficios a los Empleados / Provisions for employee profit sharing 1,916 1,687 0 0 29,379 23,808 2,710 4,760 13,976 6,727Otros Pasivos / Other Liabilities 0 0 0 0 0 0 0 0 0 0Pasivos incluidos en Grupos de Activos para su Disposición Clasificados como Mantenidos para la Venta/ Liabilities included in groups of assets for disposal classified as held for sale 0 0 0 0 0 0 0 0 0 0
TOTAL PASIVOS CORRIENTES / TOTAL CURRENT LIABILITIES 87,683 66,822 12,376 15,139 404,056 199,821 69,393 59,871 458,649 449,370Otros Pasivos Financieros / Other financial liabilities 26,892 30,409 12,432 11,963 0 0 106,539 106,191 2,420,518 2,540,493Cuentas por Pagar Comerciales / Trade accounts payable 0 0 0 0 0 0 0 0 0 0Otras Cuentas por Pagar / Other accounts payable 14,879 13,762 2,187 2,187 52,066 54,065 20,641 20,711 54,616 54,087Cuentas por Pagar a Entidades Relacionadas / Accounts payable to related companies 268 274 0 0 0 0 47,000 47,000 0 0Pasivos por Impuestos a las Ganancias Diferidos / Liabilities from deferred income tax 0 0 0 0 129,210 129,210 2,256 2,856 79,667 79,932Provisiones / Provisions 242 242 3,462 3,462 0 0 2,486 2,225 0 0Provisión por Beneficios a los Empleados / Provisions for employee profit sharing 0 0 0 0 0 0 0 0 0 0Otros Pasivos / Other Liabilities 0 0 0 0 0 0 0 0 0 0Ingresos Diferidos (netos) / Deferred income (net) 0 0 0 0 0 0 4,293 3,298 0 0
TOTAL PASIVOS NO CORRIENTES / TOTAL NON-CURRENT LIABILITIES 42,281 44,687 18,081 17,612 181,276 183,275 183,215 182,281 2,554,801 2,674,512TOTAL PASIVOS / TOTAL LIABILITIES 129,964 111,509 30,457 32,751 585,332 383,096 252,608 242,152 3,013,450 3,123,882
Capital Emitido / Issued capital 214,270 214,270 129,776 129,776 2,162,645 2,162,654 98,301 98,301 5,309,298 5,309,298Primas de Emisión / Share premium -12,845 -12,845 0 0 0 0 0 0 0 0Acciones de Inversión / Investment stock 0 0 109,420 109,420 0 0 0 0 0 0Acciones Propias en Cartera / Treasury shares 0 0 0 0 0 0 0 0 0 0Otras Reservas de Capital / Other capital reserves 3,623 3,623 0 0 311,486 288,579 1,729 1,729 515,772 510,308Resultados Acumulados / Retained earnings 7,914 12,932 9,283 6,244 84,566 242,453 47,844 40,958 -1,945,660 -2,055,880Otras Reservas de Patrimonio / Other equity reserves 25,505 25,505 2,204 2,204 324,257 324,257 0 0 0 0
TOTAL PATRIMONIO / TOTAL EQUITY 238,467 243,485 250,683 247,644 2,882,954 3,017,943 147,874 140,988 3,879,410 3,763,726TOTAL PASIVO Y PATRIMONIO / TOTAL LIABILITIES AND EQUITY 368,431 354,994 281,140 280,395 3,468,286 3,401,039 400,482 383,140 6,892,860 6,887,608
ESTADO DE RESULTADOS / INCOME STATEMENT 31/03/2012 31/03/2011 31/03/2012 31/03/2011 31/03/2012 31/03/2011 31/03/2012 31/03/2011 31/03/2012 31/03/2011
Ventas Netas de Bienes / Net sales of goods 0 0 23,358 20,167 224,586 178,745 0 0 0 0Prestación de Servicios / Services rendered 56,681 47,395 3,182 2,775 0 0 82,890 58,380 342,626 314,122
TOTAL DE INGRESOS DE ACTIVIDADES ORDINARIAS / TOTAL INCOME FROM REGULARACTIVITIES 56,681 47,395 26,540 22,942 224,586 178,745 82,890 58,380 342,626 314,122
Costo de Ventas / Cost of sales -41,463 -34,098 -18,468 -16,056 -115,042 -85,529 -63,499 -43,227 -196,147 -181,600GANANCIA (PERDIDA) BRUTA / GROSS PROFIT (LOSS) 15,218 13,297 8,072 6,886 109,544 93,216 19,391 15,153 146,479 132,522
Gastos de Ventas y Distribución / Sales and distribution expenses -4,294 -3,919 -2,189 -1,693 -4,240 -4,158 -3,006 -2,235 -37,145 -38,760Gastos de Administración / Overheads -3,619 -3,559 -1,505 -1,076 -8,077 -8,810 -4,546 -3,863 -28,984 -29,244Ganancia (Pérdida) de la baja en Activos Financieros medidos al Costo Amortizado / Profit (loss) fromdisposal of financial assets measured at amortized cost 0 0 0 0 0 0 0 0 0 0Otros Ingresos Operativos / Other operating income 671 866 12 2 1,754 3,046 512 185 4,004 10,977Otros Gastos Operativos / Other operating expenses -427 -974 -228 -450 -206 -1 -262 -50 0 0
GANANCIA (PERDIDA) OPERATIVA / OPERATING PROFIT (LOSS) 7,549 5,711 4,162 3,669 98,775 83,293 12,089 9,190 84,354 75,495Ingresos Financieros / Financial income 909 1,050 68 168 3,296 433 816 150 5,179 5,945Gastos Financieros / Financial expenses -1,318 -1,441 -1 -5 -8 -212 -2,891 -2,214 -18,149 -14,624Diferencias de Cambio neto / Exchange differences net 136 50 0 0 784 -238 0 616 94,886 15,043Participación en los Resultados Netos de Asociadas y Negocios Conjuntos Contabilizados por el Métodode la Participación / Equity in net results of associates and joint ventures booked by the equity method 0 0 0 0 0 0 0 0 0 0Ganancias (Pérdidas) de la Diferencia entre el Valor Libro Anterior y el Valor Justo de ActivosFinancieros Reclasificados Medidos a Valor Razonable / Profits (losses) from the difference between theprevious book value and fair value of financial assets reclassified and measured at fair value 0 0 0 0 0 0 0 0 0 0
RESULTADO ANTES DE IMPUESTO A LAS GANANCIAS / PRE-INCOME TAX RESULT 7,276 5,370 4,229 3,832 102,847 83,276 10,014 7,742 166,270 81,859Gasto por Impuesto a las Ganancias / Income tax expenses -2,294 -1,212 -1,268 0 -31,754 -25,014 -3,128 -2,342 -46,462 -21,134
GANANCIA (PERDIDA) NETA DE OPERACIONES CONTINUADAS / NET PROFIT (LOSS) FROMCONTINUING TRADES 4,982 4,158 2,961 3,832 71,093 58,262 6,886 5,400 119,808 60,725
Ganancia (Pérdida) Neta del Impuesto a las Ganancias Procedente de Operaciones Discontinuadas / Netprofit (loss) arising from income tax discontinued trades 0 0 0 0 0 0 0 0 0 0
GANANCIA (PERDIDA) NETA DEL EJERCICIO / PERIOD'S NET PROFIT (LOSS) 4,982 4,158 2,961 3,832 71,093 58,262 6,886 5,400 119,808 60,725
INDICADORES FINANCIEROS / FINANCIAL RATIOSLiquidez / Liquid Ratio 0.95 4.06 1.02 1.38 1.21 Rotación de Activos / Gross Sales to Total Assets 0.15 0.09 0.06 0.21 0.05 Solvencia / Solvency 0.35 0.11 0.17 0.63 0.44 Deuda / Patrimonio / Debt / Equity 0.55 0.12 0.20 1.71 0.78 Rentabilidad sobre Ventas Netas % / Return % 8.79 11.16 31.66 8.31 34.97 Rentabilidad sobre Activos % / Return on Assets % 1.35 1.05 2.05 1.72 1.74 Rentabilidad de Patrimonio % / Return on Equity % 2.09 1.18 2.47 4.66 3.09

ESTADOS FINANCIEROS COMPARADOS / COMPARATIVE FINANCIAL STATEMENTS SERVICIOS PUBLICOS Y OTRAS INSTITUCIONES / PUBLIC SERVICES AND INSTITUTIONSCIFRAS EXPRESADAS EN MILES DE NUEVOS SOLES
EMPRESA/COMPANY
TGP (*)
Telefónica Móviles
Telefónica del Perú
Cons. Agua Azul
Grupo Coril SAF (**)CIIU
6030
6420
64207
74996
6599
Pág 44 * Estados Financieros expresados en miles de US$
ESTADO DE SITUACION FINANCIERA / STATEMENT OF FINANCIAL POSITION 31/03/2012 31/12/2011 31/03/2012 31/12/2011 31/03/2012 31/12/2011 31/03/2012 31/12/2011 31/03/2012 31/12/2011
Efectivo y Equivalentes al Efectivo / Cash and cash equivalent 293,599 278,565 270,325 293,217 134,370 285,059 9,570 13,822 525 441Otros Activos Financieros / Other financial assets 0 0 0 0 0 0 0 0 886 973Cuentas por Cobrar Comerciales (neto) / Trade accounts receivable (net) 37,365 33,122 574,525 531,072 1,077,541 1,092,013 3,094 2,930 33 47Otras Cuentas por Cobrar (neto) / Other accounts receivable (net) 9,739 16,925 68,949 55,980 89,205 65,375 234 209 18 10Cuentas por Cobrar a Entidades Relacionadas / Accounts receivable from related companies 0 0 2,123 800 2,083 3,180 0 0 0 0Inventarios / Stocks 13,685 13,624 257,303 234,919 45,392 57,147 705 639 0 0Activos Biológicos / Biological assets 0 0 0 0 0 0 0 0 0 0Activos por Impuestos a las Ganancias / Assets from income tax 0 0 30,125 22,488 80,297 57,029 0 0 2 2Gastos Pagados por Anticipado / Prepaid expenses 5,372 2,426 71,785 38,611 50,229 63,224 156 188 3 0Otros Activos / Other assets 0 0 0 0 0 0 0 0 0 0Activos no Corrientes o Grupos de Activos para su Disposición Clasificados como Mantenidos para laVenta / Non-current assets or groups of assets for disposal classified as held for sale 0 0 0 0 0 0 0 0 0 0Activos no Corrientes o Grupos de Activos para su Disposición Clasificados como Mantenidos paraDistribuir a los Propietarios / Non-current assets or groups of assets for disposal classified as held forDistribution to owner 0 0 0 0 0 0 0 0 0 0
TOTAL ACTIVOS CORRIENTES / TOTAL CURRENT ASSETS 359,760 344,662 1,275,135 1,177,087 1,479,117 1,623,027 13,759 17,788 1,467 1,473Otros Activos Financieros / Other financial assets 0 0 0 0 1,393 1,393 0 0 0 0Inversiones Contabilizadas Aplicando el Método de la Participación / Investments booked using the equitymethod 0 0 0 0 1,295,925 1,295,925 0 0 0 0Cuentas por Cobrar Comerciales / Trade accounts receivable 0 0 0 0 0 0 0 0 0 0Otras Cuentas por Cobrar / Other accounts receivable 0 0 238,711 275,904 29,811 30,094 0 0 0 0Cuentas por Cobrar a Entidades Relacionadas / Accounts receivable from related companies 0 0 140,000 140,000 0 0 0 0 0 0Activos Biológicos / Biological assets 0 0 0 0 0 0 0 0 0 0Propiedades de Inversión / Investment property 0 0 0 0 0 0 0 0 0 0Propiedades, Planta y Equipo (neto) / Property, plant and equipment (net) 1,381,505 1,349,563 1,939,807 1,962,481 3,070,150 3,130,938 1,016 1,060 6 6Activos Intangibles (neto) / Intangible assets (net) 0 0 155,521 160,318 1,368,563 1,381,740 106,581 108,458 0 0Activos por Impuestos a las Ganancias Diferidos / Assets from deferred income tax 2,005 1,029 167,552 147,067 0 0 12,000 12,000 7 11Plusvalía / Capital gain 0 0 0 0 1,224,379 1,224,379 0 0 0 0Otros Activos / Other assets 165,990 170,148 0 0 99,607 103,795 0 0 0 0
TOTAL ACTIVOS NO CORRIENTES / TOTAL NON-CURRENT ASSETS 1,549,500 1,520,740 2,641,591 2,685,770 7,089,828 7,168,264 119,597 121,518 13 17TOTAL DE ACTIVOS / TOTAL ASSETS 1,909,260 1,865,402 3,916,726 3,862,857 8,568,945 8,791,291 133,356 139,306 1,480 1,490
Otros Pasivos Financieros / Other financial liabilities 79,240 75,905 370,521 268,210 635,829 565,728 76 77 0 0Cuentas por Pagar Comerciales / Trade accounts payable 52,887 38,631 1,100,547 1,217,947 1,113,609 1,202,766 207 271 11 10Otras Cuentas por Pagar / Other accounts payable 22,788 16,979 278,695 318,214 139,253 161,591 1,064 1,000 8 13Cuentas por Pagar a Entidades Relacionadas / Accounts payable to related companies 0 0 0 0 2,123 45 272 202 0 0Provisiones / Provisions 0 0 24,858 26,746 547,560 681,551 0 0 0 0Pasivos por Impuestos a las Ganancias / Liabilities from income tax 5,249 1,843 0 0 0 0 1,014 910 0 0Provisión por Beneficios a los Empleados / Provisions for employee profit sharing 0 0 0 0 0 0 401 545 43 27Otros Pasivos / Other Liabilities 0 0 0 0 0 0 6,572 6,715 0 0Pasivos incluidos en Grupos de Activos para su Disposición Clasificados como Mantenidos para la Venta/ Liabilities included in groups of assets for disposal classified as held for sale 0 0 0 0 0 0 0 0 0 0
TOTAL PASIVOS CORRIENTES / TOTAL CURRENT LIABILITIES 160,164 133,358 1,774,621 1,831,117 2,438,374 2,611,681 9,606 9,720 62 50Otros Pasivos Financieros / Other financial liabilities 948,509 962,098 651,553 726,359 2,030,976 2,079,127 0 19 0 0Cuentas por Pagar Comerciales / Trade accounts payable 0 0 0 0 0 0 0 0 0 0Otras Cuentas por Pagar / Other accounts payable 158,872 162,762 0 0 42,001 41,907 0 0 0 0Cuentas por Pagar a Entidades Relacionadas / Accounts payable to related companies 143,225 141,848 0 0 140,000 140,000 0 0 0 0Pasivos por Impuestos a las Ganancias Diferidos / Liabilities from deferred income tax 0 0 0 0 81,751 97,640 0 0 0 0Provisiones / Provisions 0 0 126,970 121,254 0 0 0 0 0 0Provisión por Beneficios a los Empleados / Provisions for employee profit sharing 0 0 0 0 0 0 0 0 0 0Otros Pasivos / Other Liabilities 0 0 0 0 0 0 36,983 38,788 0 0Ingresos Diferidos (netos) / Deferred income (net) 4,227 4,137 69,165 69,668 71,546 76,145 0 0 0 0
TOTAL PASIVOS NO CORRIENTES / TOTAL NON-CURRENT LIABILITIES 1,254,833 1,270,845 847,688 917,281 2,366,274 2,434,819 36,983 38,807 TOTAL PASIVOS / TOTAL LIABILITIES 1,414,997 1,404,203 2,622,309 2,748,398 4,804,648 5,046,500 46,589 48,527 62 50
Capital Emitido / Issued capital 208,300 208,300 172,867 172,867 2,878,643 2,878,643 74,350 74,350 1,395 1,315Primas de Emisión / Share premium 0 0 451,759 451,759 83,403 83,403 0 0 0 0Acciones de Inversión / Investment stock 0 0 0 0 0 0 0 0 0 0Acciones Propias en Cartera / Treasury shares 0 0 0 0 0 0 0 0 0 0Otras Reservas de Capital / Other capital reserves 25,152 16,756 38,162 35,680 373,268 331,091 9,577 8,347 43 43Resultados Acumulados / Retained earnings 259,417 234,765 635,146 456,898 441,252 462,052 2,840 8,082 -20 82Otras Reservas de Patrimonio / Other equity reserves 1,394 1,378 -3,517 -2,745 -12,269 -10,398 0 0 0 0
TOTAL PATRIMONIO / TOTAL EQUITY 494,263 461,199 1,294,417 1,114,459 3,764,297 3,744,791 86,767 90,779 1,418 1,440TOTAL PASIVO Y PATRIMONIO / TOTAL LIABILITIES AND EQUITY 1,909,260 1,865,402 3,916,726 3,862,857 8,568,945 8,791,291 133,356 139,306 1,480 1,490
ESTADO DE RESULTADOS / INCOME STATEMENT 31/03/2012 31/03/2011 31/03/2012 31/03/2011 31/03/2012 31/03/2011 31/03/2012 31/03/2011 31/03/2012 31/03/2011
Ventas Netas de Bienes / Net sales of goods 113,138 99,617 0 0 0 0 9,405 9,328 0 0Prestación de Servicios / Services rendered 0 0 1,167,475 997,693 940,077 935,499 0 0 119 89
TOTAL DE INGRESOS DE ACTIVIDADES ORDINARIAS / TOTAL INCOME FROM REGULARACTIVITIES 113,138 99,617 1,167,475 997,693 940,077 935,499 9,405 9,328 119 89
Costo de Ventas / Cost of sales -47,188 -40,984 0 0 0 0 -4,053 -3,844 0 0GANANCIA (PERDIDA) BRUTA / GROSS PROFIT (LOSS) 65,950 58,633 1,167,475 997,693 940,077 935,499 5,352 5,484 119 89
Gastos de Ventas y Distribución / Sales and distribution expenses 0 0 -31,331 -28,027 -19,596 -16,360 0 0 0 0Gastos de Administración / Overheads -2,541 -3,248 -861,107 -703,964 -823,235 -784,321 -558 -781 -143 -177Ganancia (Pérdida) de la baja en Activos Financieros medidos al Costo Amortizado / Profit (loss) fromdisposal of financial assets measured at amortized cost 0 0 0 0 0 0 0 0 0 0Otros Ingresos Operativos / Other operating income 359 387 7,124 2,798 14,997 7,177 0 8 496 4,528Otros Gastos Operativos / Other operating expenses -269 -461 -2,343 -962 -5,703 -5,217 0 0 -487 -4,490
GANANCIA (PERDIDA) OPERATIVA / OPERATING PROFIT (LOSS) 63,499 55,311 279,818 267,538 106,540 136,778 4,794 4,711 -15 -50Ingresos Financieros / Financial income 187 287 4,411 2,151 3,551 8,532 22 3 12 10Gastos Financieros / Financial expenses -18,193 -17,382 -17,086 -12,253 -52,402 -55,445 -1,056 -1,202 -5 -5Diferencias de Cambio neto / Exchange differences net 0 0 2,084 -1,005 -1,258 -2,468 366 13 -11 -8Participación en los Resultados Netos de Asociadas y Negocios Conjuntos Contabilizados por el Métodode la Participación / Equity in net results of associates and joint ventures booked by the equity method 0 0 0 0 0 0 0 0 0 0Ganancias (Pérdidas) de la Diferencia entre el Valor Libro Anterior y el Valor Justo de ActivosFinancieros Reclasificados Medidos a Valor Razonable / Profits (losses) from the difference between theprevious book value and fair value of financial assets reclassified and measured at fair value 0 0 0 0 0 0 0 0 0 0
RESULTADO ANTES DE IMPUESTO A LAS GANANCIAS / PRE-INCOME TAX RESULT 45,493 38,216 269,227 256,431 56,431 87,397 4,126 3,525 -19 -53Gasto por Impuesto a las Ganancias / Income tax expenses -12,445 -10,611 -87,609 -79,773 -32,995 -47,086 -1,286 -1,394 -3 -3
GANANCIA (PERDIDA) NETA DE OPERACIONES CONTINUADAS / NET PROFIT (LOSS) FROMCONTINUING TRADES 33,048 27,605 181,618 176,658 23,436 40,311 2,840 2,131 -22 -56
Ganancia (Pérdida) Neta del Impuesto a las Ganancias Procedente de Operaciones Discontinuadas / Netprofit (loss) arising from income tax discontinued trades 0 0 0 0 0 0 0 0 0 0
GANANCIA (PERDIDA) NETA DEL EJERCICIO / PERIOD'S NET PROFIT (LOSS) 33,048 27,605 181,618 176,658 23,436 40,311 2,840 2,131 -22 -56
INDICADORES FINANCIEROS / FINANCIAL RATIOSLiquidez / Liquid Ratio 2.25 0.72 0.61 1.43 23.66 Rotación de Activos / Gross Sales to Total Assets 0.06 0.30 0.11 0.07 0.08 Solvencia / Solvency 0.74 0.67 0.56 0.35 0.04 Deuda / Patrimonio / Debt / Equity 2.86 2.03 1.28 0.54 0.04 Rentabilidad sobre Ventas Netas % / Return % 29.21 15.56 2.49 30.20 -.- Rentabilidad sobre Activos % / Return on Assets % 1.73 4.64 0.27 2.13 -.- Rentabilidad de Patrimonio % / Return on Equity % 6.69 14.03 0.62 3.27 -.-

ESTADOS FINANCIEROS COMPARADOS / COMPARATIVE FINANCIAL STATEMENTS OTRAS INSTITUCIONES / INSTITUTIONSCIFRAS EXPRESADAS EN MILES DE NUEVOS SOLES
EMPRESA/COMPANY
AC Capitales SAFI (**)
Compass Group SAFI(**)
Sigma SAFI (*) (**)
CIIU
65994
6712
6712
Pág 45* Estados Financieros expresados en miles de US$** Estados Financieros de Sociedades Administradoras de Fondos de Inversión, cuyas cuotas se encuentran inscritas en Rueda de Bolsa.
ESTADO DE SITUACION FINANCIERA / STATEMENT OF FINANCIAL POSITION 31/03/2012 31/12/2011 31/03/2012 31/12/2011 31/03/2012 31/12/2011 31/03/2012 31/12/2011 31/03/2012 31/12/2011
Efectivo y Equivalentes al Efectivo / Cash and cash equivalent 1,210 1,533 152 729 3,031 2,008 Otros Activos Financieros / Other financial assets 0 0 0 0 0 0 Cuentas por Cobrar Comerciales (neto) / Trade accounts receivable (net) 7,677 7,711 285 0 351 2,801 Otras Cuentas por Cobrar (neto) / Other accounts receivable (net) 46 47 35 83 930 261 Cuentas por Cobrar a Entidades Relacionadas / Accounts receivable from related companies 151 181 2,250 2,196 0 0 Inventarios / Stocks 0 0 0 0 0 0 Activos Biológicos / Biological assets 0 0 0 0 0 0 Activos por Impuestos a las Ganancias / Assets from income tax 0 0 175 0 0 0 Gastos Pagados por Anticipado / Prepaid expenses 26 29 1,775 1,767 42 22 Otros Activos / Other assets 0 0 0 0 60 0 Activos no Corrientes o Grupos de Activos para su Disposición Clasificados como Mantenidos para laVenta / Non-current assets or groups of assets for disposal classified as held for sale 0 0 0 0 0 0 Activos no Corrientes o Grupos de Activos para su Disposición Clasificados como Mantenidos paraDistribuir a los Propietarios / Non-current assets or groups of assets for disposal classified as held forDistribution to owner 0 0 0 0 0 0
TOTAL ACTIVOS CORRIENTES / TOTAL CURRENT ASSETS 9,110 9,501 4,672 4,775 4,414 5,092 Otros Activos Financieros / Other financial assets 0 0 0 0 0 0 Inversiones Contabilizadas Aplicando el Método de la Participación / Investments booked using the equitymethod 1,634 1,307 0 0 0 0 Cuentas por Cobrar Comerciales / Trade accounts receivable 0 0 0 0 0 0 Otras Cuentas por Cobrar / Other accounts receivable 0 0 0 0 0 0 Cuentas por Cobrar a Entidades Relacionadas / Accounts receivable from related companies 0 0 0 0 0 0 Activos Biológicos / Biological assets 0 0 0 0 0 0 Propiedades de Inversión / Investment property 243 244 0 0 0 0 Propiedades, Planta y Equipo (neto) / Property, plant and equipment (net) 6,556 6,641 6,884 6,974 183 193 Activos Intangibles (neto) / Intangible assets (net) 15 10 0 0 19 22 Activos por Impuestos a las Ganancias Diferidos / Assets from deferred income tax 0 0 0 0 0 0 Plusvalía / Capital gain 0 0 0 0 0 0 Otros Activos / Other assets 0 0 0 0 0 0
TOTAL ACTIVOS NO CORRIENTES / TOTAL NON-CURRENT ASSETS 8,448 8,202 6,884 6,974 202 215 TOTAL DE ACTIVOS / TOTAL ASSETS 17,558 17,703 11,556 11,749 4,616 5,307
Otros Pasivos Financieros / Other financial liabilities 754 769 486 510 30 31 Cuentas por Pagar Comerciales / Trade accounts payable 86 199 108 125 10 9 Otras Cuentas por Pagar / Other accounts payable 2,269 2,680 738 1,235 154 1,058 Cuentas por Pagar a Entidades Relacionadas / Accounts payable to related companies 11 17 220 190 0 0 Provisiones / Provisions 0 0 0 0 9 0 Pasivos por Impuestos a las Ganancias / Liabilities from income tax 0 0 356 183 0 0 Provisión por Beneficios a los Empleados / Provisions for employee profit sharing 0 0 0 0 27 0 Otros Pasivos / Other Liabilities 0 0 0 0 0 0 Pasivos incluidos en Grupos de Activos para su Disposición Clasificados como Mantenidos para la Venta/ Liabilities included in groups of assets for disposal classified as held for sale 0 0 0 0 0 0
TOTAL PASIVOS CORRIENTES / TOTAL CURRENT LIABILITIES 3,120 3,665 1,908 2,243 230 1,098 Otros Pasivos Financieros / Other financial liabilities 1,667 1,772 3,177 3,316 20 28 Cuentas por Pagar Comerciales / Trade accounts payable 0 0 0 0 0 0 Otras Cuentas por Pagar / Other accounts payable 0 0 0 0 0 0 Cuentas por Pagar a Entidades Relacionadas / Accounts payable to related companies 0 0 0 0 0 0 Pasivos por Impuestos a las Ganancias Diferidos / Liabilities from deferred income tax 664 664 0 0 0 0 Provisiones / Provisions 0 0 0 0 0 0 Provisión por Beneficios a los Empleados / Provisions for employee profit sharing 0 0 0 0 0 0 Otros Pasivos / Other Liabilities 0 0 0 0 0 0 Ingresos Diferidos (netos) / Deferred income (net) 0 0 0 0 0 0
TOTAL PASIVOS NO CORRIENTES / TOTAL NON-CURRENT LIABILITIES 2,331 2,436 3,177 3,316 20 28 TOTAL PASIVOS / TOTAL LIABILITIES 5,451 6,101 5,085 5,559 250 1,126
Capital Emitido / Issued capital 2,537 2,537 4,855 4,855 701 701 Primas de Emisión / Share premium 0 0 0 0 0 0 Acciones de Inversión / Investment stock 0 0 0 0 0 0 Acciones Propias en Cartera / Treasury shares 0 0 0 0 0 0 Otras Reservas de Capital / Other capital reserves 507 507 465 465 140 140 Resultados Acumulados / Retained earnings 9,063 8,558 1,151 870 3,725 3,540 Otras Reservas de Patrimonio / Other equity reserves 0 0 0 0 -200 -200
TOTAL PATRIMONIO / TOTAL EQUITY 12,107 11,602 6,471 6,190 4,366 4,181 TOTAL PASIVO Y PATRIMONIO / TOTAL LIABILITIES AND EQUITY 17,558 17,703 11,556 11,749 4,616 5,307
ESTADO DE RESULTADOS / INCOME STATEMENT 31/03/2012 31/03/2011 31/03/2012 31/03/2011 31/03/2012 31/03/2011 31/03/2012 31/03/2011 31/03/2012 31/03/2011
Ventas Netas de Bienes / Net sales of goods 1,034 1,001 0 0 0 0 Prestación de Servicios / Services rendered 164 171 2,513 2,970 887 818
TOTAL DE INGRESOS DE ACTIVIDADES ORDINARIAS / TOTAL INCOME FROM REGULARACTIVITIES 1,198 1,172 2,513 2,970 887 818
Costo de Ventas / Cost of sales 0 0 0 0 0 0 GANANCIA (PERDIDA) BRUTA / GROSS PROFIT (LOSS) 1,198 1,172 2,513 2,970 887 818
Gastos de Ventas y Distribución / Sales and distribution expenses 0 0 0 0 0 0 Gastos de Administración / Overheads -945 -914 -2,423 -2,254 -653 -625 Ganancia (Pérdida) de la baja en Activos Financieros medidos al Costo Amortizado / Profit (loss) fromdisposal of financial assets measured at amortized cost 0 0 0 0 0 0 Otros Ingresos Operativos / Other operating income 10 9 246 89 0 0 Otros Gastos Operativos / Other operating expenses -11 -7 0 0 0 0
GANANCIA (PERDIDA) OPERATIVA / OPERATING PROFIT (LOSS) 252 260 336 805 234 193 Ingresos Financieros / Financial income 92 302 0 0 9 8 Gastos Financieros / Financial expenses -151 -339 -50 -81 -3 -2 Diferencias de Cambio neto / Exchange differences net 0 0 -5 -14 -4 -13 Participación en los Resultados Netos de Asociadas y Negocios Conjuntos Contabilizados por el Métodode la Participación / Equity in net results of associates and joint ventures booked by the equity method 327 208 0 0 0 0 Ganancias (Pérdidas) de la Diferencia entre el Valor Libro Anterior y el Valor Justo de ActivosFinancieros Reclasificados Medidos a Valor Razonable / Profits (losses) from the difference between theprevious book value and fair value of financial assets reclassified and measured at fair value 0 0 0 0 0 0
RESULTADO ANTES DE IMPUESTO A LAS GANANCIAS / PRE-INCOME TAX RESULT 520 431 281 710 236 186 Gasto por Impuesto a las Ganancias / Income tax expenses -15 -25 0 -223 -51 -35
GANANCIA (PERDIDA) NETA DE OPERACIONES CONTINUADAS / NET PROFIT (LOSS) FROMCONTINUING TRADES 505 406 281 487 185 151
Ganancia (Pérdida) Neta del Impuesto a las Ganancias Procedente de Operaciones Discontinuadas / Netprofit (loss) arising from income tax discontinued trades 0 0 0 0 0 0
GANANCIA (PERDIDA) NETA DEL EJERCICIO / PERIOD'S NET PROFIT (LOSS) 505 406 281 487 185 151
INDICADORES FINANCIEROS / FINANCIAL RATIOSLiquidez / Liquid Ratio 2.92 2.45 19.19 Rotación de Activos / Gross Sales to Total Assets 0.07 0.22 0.19 Solvencia / Solvency 0.31 0.44 0.05 Deuda / Patrimonio / Debt / Equity 0.45 0.79 0.06 Rentabilidad sobre Ventas Netas % / Return % 42.15 11.18 20.86 Rentabilidad sobre Activos % / Return on Assets % 2.88 2.43 4.01 Rentabilidad de Patrimonio % / Return on Equity % 4.17 4.34 4.24

ESTADOS FINANCIEROS COMPARADOS / COMPARATIVE FINANCIAL STATEMENTS SEGUROS / INSURANCECIFRAS EXPRESADAS EN MILES DE NUEVOS SOLES
EMPRESA/COMPANY
La Positiva Vida
Pacífico Vida
Protecta Cía de Seg.
InVita Seguros de Vida
Ace SegurosCIIU
6601
6601
6601
6601-0
6603
Pág 46 * Estados Financieros expresados en miles de US$
ESTADO DE SITUACION FINANCIERA / STATEMENT OF FINANCIAL POSITION 31/03/2012 31/12/2011 31/03/2012 31/12/2011 31/03/2012 31/12/2011 31/03/2012 31/12/2011 31/03/2012 31/12/2011
EFECTIVO Y EQUIVALENTE DE EFECTIVO / CASH AND DEPOSITS 42,968 160,321 157,628 145,718 32,208 24,539 71,740 41,342 12,753 7,244INVERSIONES FINANCIERAS (NETO) / FINANCIAL INVESTMENTS (NET)
A valor Razonable con Cambios en Resultados / At reasonable value with changes in results 17,593 15,156 158,387 136,754 523 417 45,476 89,514 0 0Disponibles para la Venta / Available for sale 316,990 243,996 53,591 46,134 0 0 0 0 10,116 15,445A Vencimiento / To maturity 0 0 0 0 0 0 0 0 0 0Menos: Provisiones de Inversiones Financieras y Deterioro de Valor / Less: Provisions for financial investmentsand loss of value 0 0 0 0 0 0 0 0 0 0Cuentas por Cobrar por Operaciones de Seguros (neto) / Accounts receivable from insurance transact.(net) 25,082 28,431 24,023 19,500 290 332 0 0 10,776 11,937Menos: Cargas Aplicadas Sobre Pólizas / Less: Charges applied to policies 0 0 0 0 0 0 0 0 -1,217 -1,321Cuentas por Cobrar por Operaciones Sujetas a Riesgo Crediticio (neto) / Accounts receivable from transactionssubject to credit risk 0 0 0 0 0 0 47,121 50,017 0 0Cuentas por Cobrar a Reaseguradores y Coaseguradores (neto) / Accounts receivable from reinsurers andcoinsurers (net) 126 283 0 0 2,536 1,924 7 -136 7,993 7,758Cuentas por Cobrar Diversas (neto) / Sundry accounts receivable (net) 35,999 8,807 5,311 5,296 515 502 4,802 21,464 184 122Cuentas por Cobrar por Productos Financieros Derivados para Negociación / Accounts receivable from financialderivatives for trading purposes 0 0 0 0 0 0 2,560 822 0 0Cuentas por Cobrar Productos Financieros Derivados con Fines de Cobertura / Accounts receivable fromfinancial derivatives for hedging purposes 0 0 0 0 0 0 0 0 0 0Cuentas por Cobrar por Macro-coberturas / Accounts receivable from macro-hedging 0 0 0 0 0 0 0 0 0 0Gastos Contrados por Adelantado / Prepaid expenses 1,334 690 38,681 38,020 265 226 731 831 453 181
TOTAL ACTIVO CORRIENTE / TOTAL CURRENT ASSETS 440,092 457,684 437,621 391,422 36,337 27,940 172,437 203,854 41,058 41,366INVERSIONES FINANCIERAS (NETO) / FINANCIAL INVESTMENTS (NET)
Disponibles para la Venta / Available for sale 9,964 4,648 328,779 378,664 2,152 2,126 122,522 75,497 46,012 45,023A Vencimiento / To maturity 1,025,790 891,792 2,542,659 2,505,746 107,873 103,113 2,491,554 2,477,680 0 0Inversiones en Subsidiarias y Asociadas / Investments in subsidiaries and associates 27,018 40,843 0 0 0 0 16,361 17,164 0 0Menos: Provisiones de Inversiones Financieras y Deterioro de Valor / Less: Provisions for financial investmentsand loss of value -136 -136 0 0 -1,075 -1,087 -4,329 -3,212 0 0Cuentas por Cobrar Diversas Largo Plazo(neto) / Sundry long-term accounts receivable (net) 0 0 0 0 0 0 0 0 0 0Inversiones en Inmuebles (neto) / Investments in immovable property (net) 80,608 80,670 31,456 31,580 14,509 14,201 69,738 52,118 0 0Inmuebles, Muebles y Equipo (neto) / Property, furniture and equipment (net) 15,008 15,064 7,874 7,770 640 610 16,388 16,458 5,598 5,608Activos Intangibles (Neto) / Intangible assets (net) 938 985 5,765 6,572 1,672 1,652 0 0 3,075 3,083Activo por Impuesto a la Renta Diferido / Deferred income tax assets 0 0 0 0 0 0 0 0 222 222Otros Activos / Other assets 1,222 1,288 0 0 1,248 741 4,552 4,535 4,358 4,221
TOTAL ACTIVO / TOTAL ASSETS 1,600,504 1,492,838 3,354,154 3,321,754 163,356 149,296 2,889,223 2,844,094 100,323 99,523Tributos, Participaciones y Ctas. por Pagar Diversas / Taxes, profit sharing and other accounts payable 18,951 27,279 67,215 85,230 2,190 5,244 43,979 18,530 6,445 7,974Cuentas por Pagar por Productos Financieros Derivados para Negociación / Accounts payable due to financialderivatives for trading purposes 0 0 0 0 0 0 0 0 0 0Cuentas por Pagar por Productos Financieros Derivados con Fines de Cobertura / Accounts payable due tofinancial derivatives for hedging purposes 0 0 0 0 0 0 0 0 0 0Cuentas por Pagar por Macro-Coberturas / Accounts payable due to macro-hedging 0 0 0 0 0 0 0 0 0 0Obligaciones Financieras / Financial liabilities 46,667 45,789 0 0 0 0 0 130 0 0Cuentas por Pagar a Intermediarios y Auxiliares / Accounts payable to brokers and assistants 2,264 1,900 3,106 2,811 209 121 1,589 1,444 3,892 4,220Cuentas por Pagar a Asegurados / Accounts payable to insured 116 143 4,465 3,994 6 12 386 426 45 556Cuentas por Pagar a Reaseguradores y Coaseguradores (neto) / Accounts payable to reinsurers and coinsurers(net) 2,959 2,404 4,301 5,056 324 239 2,688 2,323 7,094 5,323Reservas Técnicas por Siniestros / Technical reserves for claims 173,505 159,717 291,275 272,134 2,936 2,758 212,090 204,588 10,080 9,157
TOTAL PASIVO CORRIENTE / TOTAL CURRENT LIABILITIES 244,462 237,232 370,362 369,225 5,665 8,374 260,732 227,441 27,556 27,230Obligaciones Financieras / Financial liabilities 0 0 0 0 0 0 8,196 8,287 0 0Reservas Técnicas por Siniestros / Technical reserves for claims 0 0 0 0 0 0 0 0 5,334 5,392Reservas Técnicas por Primas / Technical reserves for premiums 1,152,730 1,099,131 2,547,903 2,443,993 115,389 100,350 2,352,952 2,311,094 24,025 23,430Otras Provisiones (Neto) / Other provisions (net) 3,563 2,712 0 0 196 75 1,159 595 0 0Ganancias Diferidas / Deferred profits 395 667 0 0 0 0 883 878 1,104 962Pasivo por Impuesto a la Renta Diferido / Deferred income tax liabilities 0 0 3,161 1,358 0 0 0 0 0 0
TOTAL PASIVO / TOTAL LIABILITIES 1,401,150 1,339,742 2,921,426 2,814,576 121,250 108,799 2,623,922 2,548,295 58,019 57,014Capital Social / Capital stock 141,830 141,830 74,000 74,000 43,219 43,219 225,714 193,584 20,672 20,672Capital Adicional / Additional capital 0 0 0 0 0 0 0 0 0 0Resultados no Realizados / Unachieved earnings 26,311 -13,867 35,927 38,908 -18 -80 0 0 615 244Excedente de Revaluación / Revaluation surplus 0 0 0 0 0 0 0 0 0 0Reservas / Reserves 10,554 0 304,270 273,290 0 0 38,263 31,123 6,625 6,625Acciones en Tesorería / Treasury shares 0 0 0 0 0 0 0 0 0 0Resultados Acumulados / Retained earnings 14,130 25,133 0 3,966 -2,642 -8,106 656 -308 14,968 12,736Resultado del Ejercicio / Period's results 6,529 0 18,531 117,014 1,547 5,464 668 71,400 -576 2,232
TOTAL PATRIMONIO / TOTAL EQUITY 199,354 153,096 432,728 507,178 42,106 40,497 265,301 295,799 42,304 42,509TOTAL PASIVO Y PATRIMONIO / TOTAL LIABILITIES AND EQUITY 1,600,504 1,492,838 3,354,154 3,321,754 163,356 149,296 2,889,223 2,844,094 100,323 99,523
ESTADO DE RESULTADOS / INCOME STATEMENT 31/03/2012 31/03/2011 31/03/2012 31/03/2011 31/03/2012 31/03/2011 31/03/2012 31/03/2011 31/03/2012 31/03/2011
Primas de Seguros (Neto) / Insurance premiums (net) 98,389 95,884 257,816 232,064 28,718 28,588 108,796 148,533 23,148 17,964Reaseguro Aceptado (Neto) / Accepted reinsurance (net) 13,012 12,222 0 0 0 0 0 0 3,529 2,717Ajuste de Reservas Técnicas de Primas de Seg. y Reaseg. Aceptado / Adjustments to technical reserves foraccepted insurance and re-insurance premiums -60,357 -61,469 -117,192 -103,913 -15,941 -16,927 -59,834 -105,186 -1,658 -1,383
TOTAL PRIMAS NETAS DEL EJERCICIO / TOTAL NET PREMIUMS FOR FISCAL YEAR 51,044 46,637 140,624 128,151 12,777 11,661 48,962 43,347 25,019 19,298Primas Cedidas Netas / Ceded premiums (net) -4,322 -4,119 -7,217 -5,894 -166 -110 -2,138 -1,534 -11,615 -5,957Ajuste de Reservas Técnicas de Primas Cedidas / Adjustment to technical reserves for ceded premiums 2,316 3,207 0 0 8 1 17 -93 1,021 -384
TOTAL PRIMAS CEDIDAS NETAS DEL EJERCICIO / TOTAL CEDED PREMIUMS -2,006 -912 -7,217 -5,894 -158 -109 -2,121 -1,627 -10,594 -6,341PRIMAS GANADAS NETAS / NET PREMIUMS EARNED 49,038 45,725 133,407 122,257 12,619 11,552 46,841 41,720 14,425 12,957
Siniestros de primas de seguros (netos) / Insurance premium claims (net) -56,429 -42,979 -120,804 -78,344 -3,090 -2,630 -78,807 -64,479 -4,377 -2,140Siniestros de reaseguros aceptados (netos) / Accepted reinsurance claims (net) 0 -686 0 0 0 0 0 0 -548 0Siniestros de primas cedidas (netos) / Ceded premiums claims 1,253 780 5,366 2,778 153 36 910 594 2,015 619Recuperos y Salvamentos / Recovery and salvage 585 0 0 0 0 0 0 0 9 0
SINIESTROS INCURRIDOS (NETOS) / CLAIMS INCURRED (NET) -54,591 -42,885 -115,438 -75,566 -2,937 -2,594 -77,897 -63,885 -2,901 -1,521Ajuste de Reservas para Riesgos Catastróficos / Adjustment to reserves for catastrophe risk 0 0 0 0 0 0 0 0 0 0
RESULTADO TECNICO BRUTO / GROSS TECHNICAL PROFTIS -5,553 2,840 17,969 46,691 9,682 8,958 -31,056 -22,165 11,524 11,436Comisiones sobre Primas de Seguros (netas) / Commissions on insurance premiums (net) -11,200 -11,048 -8,576 -7,629 -7,641 -7,398 -2,954 -2,867 -2,700 -1,603Comisiones sobre Reaseguro Aceptado (netas) / Commissions on accepted reinsurance (net) -1,914 -1,889 0 0 0 0 0 0 0 0Comisiones de Primas Cedidas (netas) / Commissions of ceded premiums (net) 0 0 0 0 0 0 0 0 0 0
COMISIONES (NETAS) / FEES (NET) -13,114 -12,937 -8,576 -7,629 -7,641 -7,398 -2,954 -2,867 -2,700 -1,603Ingresos Técnicos Diversos / Sundry technical income 1,217 1,095 2,088 1,850 379 356 120 78 632 527Gastos Técnicos Diversos / Sundry technical expenses -1,473 -1,226 -41,243 -32,872 -200 -213 -5,370 -3,607 -7,449 -6,626Ingresos (Egresos) Diversos, neto / Sundry income (expenses), net 0 0 0 0 0 0 0 0 0 0
RESULTADO TÉCNICO / TECHNICAL PROFITS -18,923 -10,228 -29,762 8,040 2,220 1,703 -39,260 -28,561 2,007 3,734Ingresos de Inversiones y Otros Ingresos Financieros / Investment income and other financial income 52,398 53,114 77,743 47,155 3,383 2,923 54,265 45,411 893 1,208Gastos de Inversiones y Otros Gastos Financieros. / Investment expenses and other financial expenses -15,278 -18,959 -1,807 -4,044 -883 -1,709 -3,664 -4,909 -369 -637
RESULTADO DE INVERSIONES / INVESTMENTS PROFITS 37,120 34,155 75,936 43,111 2,500 1,214 50,601 40,502 524 571Gastos de Administración (Neto de Ingresos por Servicios y Otros) / Administrative expenses (net of serviceincome and others) -11,668 -9,412 -27,643 -25,373 -3,173 -2,600 -10,673 -8,861 -3,107 -2,812
RESULTADO DE OPERACIÓN ANTES DE IMPUESTO A LA RENTA / RESULT BEFORE INCOME TAX 6,529 14,515 18,531 25,778 1,547 317 668 3,080 -576 1,493Impuesto a la Renta / Income Tax 0 0 0 0 0 0 0 0 0 -474Efecto acumulativo de cambios en las políticas contables / Cumulative effect from accounting policy changes 0 0 0 -3,672 0 0 0 0 0 0
UTILIDAD (PÉRDIDA) NETA DEL EJERCICIO / PERIOD'S NET PROFIT (LOSS) 6,529 14,515 18,531 22,106 1,547 317 668 3,080 -576 1,019
INDICADORES FINANCIEROS / FINANCIAL RATIOSLiquidez / Liquid Ratio 1.80 1.18 6.41 0.66 1.49 Rotación en Activos / Gross Sales to Total Assets 0.10 0.10 0.20 0.06 0.30 Solvencia / Solvency 0.88 0.87 0.74 0.91 0.58 Deuda / Patrimonio / Debt / Equity 7.03 6.75 2.88 9.89 1.37 Rentabilidad de Capital % / Return on capital % 4.60 25.04 3.58 0.30 -.- Rentabilidad sobre Activos % / Return on Assets % 0.41 0.55 0.95 0.02 -.- Rentabilidad de Patrimonio % / Return on Equity % 3.28 4.28 3.67 0.25 -.-
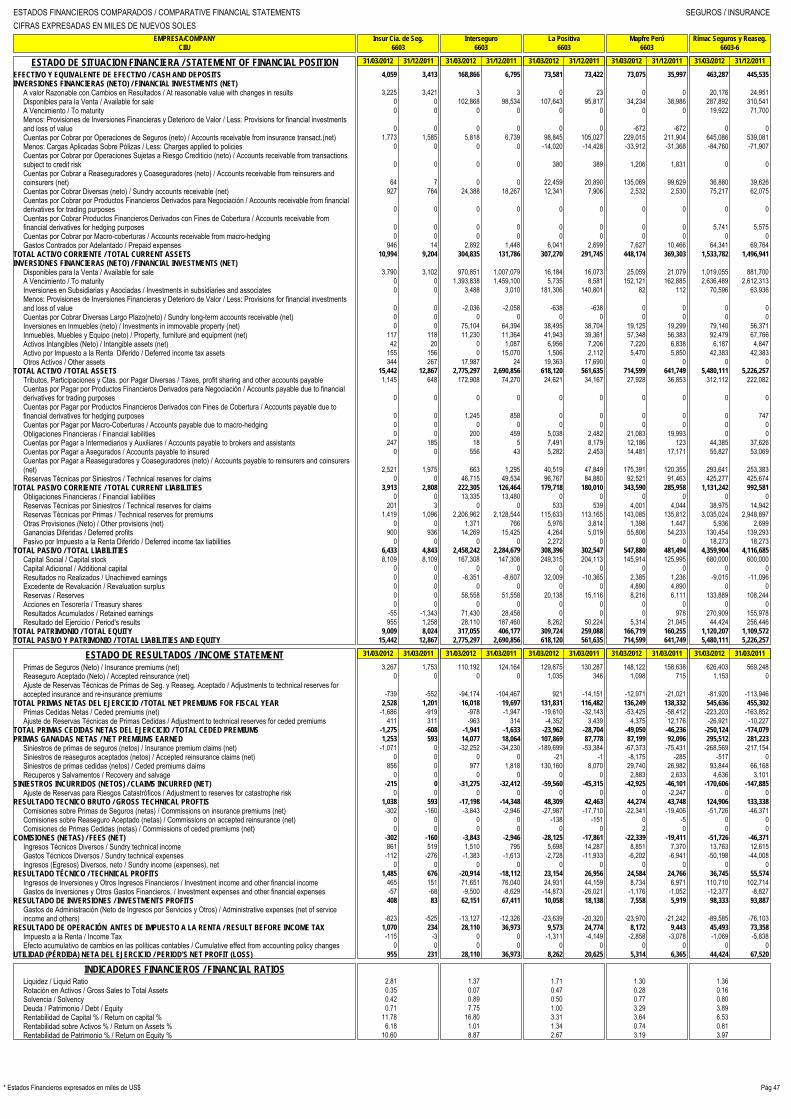
ESTADOS FINANCIEROS COMPARADOS / COMPARATIVE FINANCIAL STATEMENTS SEGUROS / INSURANCECIFRAS EXPRESADAS EN MILES DE NUEVOS SOLES
EMPRESA/COMPANY
Insur Cia. de Seg.
Interseguro
La Positiva
Mapfre Perú
Rímac Seguros y Reaseg.CIIU
6603
6603
6603
6603
6603-6
Pág 47* Estados Financieros expresados en miles de US$
ESTADO DE SITUACION FINANCIERA / STATEMENT OF FINANCIAL POSITION 31/03/2012 31/12/2011 31/03/2012 31/12/2011 31/03/2012 31/12/2011 31/03/2012 31/12/2011 31/03/2012 31/12/2011
EFECTIVO Y EQUIVALENTE DE EFECTIVO / CASH AND DEPOSITS 4,059 3,413 168,866 6,795 73,581 73,422 73,075 35,997 463,287 445,535INVERSIONES FINANCIERAS (NETO) / FINANCIAL INVESTMENTS (NET)
A valor Razonable con Cambios en Resultados / At reasonable value with changes in results 3,225 3,421 3 3 0 23 0 0 20,176 24,951Disponibles para la Venta / Available for sale 0 0 102,868 98,534 107,643 95,817 34,234 38,986 287,892 310,541A Vencimiento / To maturity 0 0 0 0 0 0 0 0 19,922 71,700Menos: Provisiones de Inversiones Financieras y Deterioro de Valor / Less: Provisions for financial investmentsand loss of value 0 0 0 0 0 0 -672 -672 0 0Cuentas por Cobrar por Operaciones de Seguros (neto) / Accounts receivable from insurance transact.(net) 1,773 1,585 5,818 6,739 98,845 105,027 229,015 211,904 645,086 539,081Menos: Cargas Aplicadas Sobre Pólizas / Less: Charges applied to policies 0 0 0 0 -14,020 -14,428 -33,912 -31,368 -84,760 -71,907Cuentas por Cobrar por Operaciones Sujetas a Riesgo Crediticio (neto) / Accounts receivable from transactionssubject to credit risk 0 0 0 0 380 389 1,206 1,831 0 0Cuentas por Cobrar a Reaseguradores y Coaseguradores (neto) / Accounts receivable from reinsurers andcoinsurers (net) 64 7 0 0 22,459 20,890 135,069 99,629 36,880 39,626Cuentas por Cobrar Diversas (neto) / Sundry accounts receivable (net) 927 764 24,388 18,267 12,341 7,906 2,532 2,530 75,217 62,075Cuentas por Cobrar por Productos Financieros Derivados para Negociación / Accounts receivable from financialderivatives for trading purposes 0 0 0 0 0 0 0 0 0 0Cuentas por Cobrar Productos Financieros Derivados con Fines de Cobertura / Accounts receivable fromfinancial derivatives for hedging purposes 0 0 0 0 0 0 0 0 5,741 5,575Cuentas por Cobrar por Macro-coberturas / Accounts receivable from macro-hedging 0 0 0 0 0 0 0 0 0 0Gastos Contrados por Adelantado / Prepaid expenses 946 14 2,892 1,448 6,041 2,699 7,627 10,466 64,341 69,764
TOTAL ACTIVO CORRIENTE / TOTAL CURRENT ASSETS 10,994 9,204 304,835 131,786 307,270 291,745 448,174 369,303 1,533,782 1,496,941INVERSIONES FINANCIERAS (NETO) / FINANCIAL INVESTMENTS (NET)
Disponibles para la Venta / Available for sale 3,790 3,102 970,851 1,007,079 16,184 16,073 25,059 21,079 1,019,055 881,700A Vencimiento / To maturity 0 0 1,393,838 1,459,100 5,735 8,581 152,121 162,885 2,636,489 2,612,313Inversiones en Subsidiarias y Asociadas / Investments in subsidiaries and associates 0 0 3,488 3,010 181,306 140,801 82 112 70,596 63,936Menos: Provisiones de Inversiones Financieras y Deterioro de Valor / Less: Provisions for financial investmentsand loss of value 0 0 -2,036 -2,058 -638 -638 0 0 0 0Cuentas por Cobrar Diversas Largo Plazo(neto) / Sundry long-term accounts receivable (net) 0 0 0 0 0 0 0 0 0 0Inversiones en Inmuebles (neto) / Investments in immovable property (net) 0 0 75,104 64,394 38,495 38,704 19,125 19,299 79,140 56,371Inmuebles, Muebles y Equipo (neto) / Property, furniture and equipment (net) 117 118 11,230 11,364 41,943 39,361 57,348 56,383 92,479 67,766Activos Intangibles (Neto) / Intangible assets (net) 42 20 0 1,087 6,956 7,206 7,220 6,838 6,187 4,847Activo por Impuesto a la Renta Diferido / Deferred income tax assets 155 156 0 15,070 1,506 2,112 5,470 5,850 42,383 42,383Otros Activos / Other assets 344 267 17,987 24 19,363 17,690 0 0 0 0
TOTAL ACTIVO / TOTAL ASSETS 15,442 12,867 2,775,297 2,690,856 618,120 561,635 714,599 641,749 5,480,111 5,226,257Tributos, Participaciones y Ctas. por Pagar Diversas / Taxes, profit sharing and other accounts payable 1,145 648 172,908 74,270 24,621 34,167 27,928 36,853 312,112 222,082Cuentas por Pagar por Productos Financieros Derivados para Negociación / Accounts payable due to financialderivatives for trading purposes 0 0 0 0 0 0 0 0 0 0Cuentas por Pagar por Productos Financieros Derivados con Fines de Cobertura / Accounts payable due tofinancial derivatives for hedging purposes 0 0 1,245 858 0 0 0 0 0 747Cuentas por Pagar por Macro-Coberturas / Accounts payable due to macro-hedging 0 0 0 0 0 0 0 0 0 0Obligaciones Financieras / Financial liabilities 0 0 200 459 5,038 2,482 21,083 19,993 0 0Cuentas por Pagar a Intermediarios y Auxiliares / Accounts payable to brokers and assistants 247 185 18 5 7,491 8,179 12,186 123 44,385 37,626Cuentas por Pagar a Asegurados / Accounts payable to insured 0 0 556 43 5,282 2,453 14,481 17,171 55,827 53,069Cuentas por Pagar a Reaseguradores y Coaseguradores (neto) / Accounts payable to reinsurers and coinsurers(net) 2,521 1,975 663 1,295 40,519 47,849 175,391 120,355 293,641 253,383Reservas Técnicas por Siniestros / Technical reserves for claims 0 0 46,715 49,534 96,767 84,880 92,521 91,463 425,277 425,674
TOTAL PASIVO CORRIENTE / TOTAL CURRENT LIABILITIES 3,913 2,808 222,305 126,464 179,718 180,010 343,590 285,958 1,131,242 992,581Obligaciones Financieras / Financial liabilities 0 0 13,335 13,480 0 0 0 0 0 0Reservas Técnicas por Siniestros / Technical reserves for claims 201 3 0 0 533 539 4,001 4,044 38,975 14,942Reservas Técnicas por Primas / Technical reserves for premiums 1,419 1,096 2,206,962 2,128,544 115,633 113,165 143,085 135,812 3,035,024 2,948,897Otras Provisiones (Neto) / Other provisions (net) 0 0 1,371 766 5,976 3,814 1,398 1,447 5,936 2,699Ganancias Diferidas / Deferred profits 900 936 14,269 15,425 4,264 5,019 55,806 54,233 130,454 139,293Pasivo por Impuesto a la Renta Diferido / Deferred income tax liabilities 0 0 0 0 2,272 0 0 0 18,273 18,273
TOTAL PASIVO / TOTAL LIABILITIES 6,433 4,843 2,458,242 2,284,679 308,396 302,547 547,880 481,494 4,359,904 4,116,685Capital Social / Capital stock 8,109 8,109 167,308 147,308 249,315 204,113 145,914 125,995 680,000 600,000Capital Adicional / Additional capital 0 0 0 0 0 0 0 0 0 0Resultados no Realizados / Unachieved earnings 0 0 -8,351 -8,607 32,009 -10,365 2,385 1,236 -9,015 -11,096Excedente de Revaluación / Revaluation surplus 0 0 0 0 0 0 4,890 4,890 0 0Reservas / Reserves 0 0 58,558 51,558 20,138 15,116 8,216 6,111 133,889 108,244Acciones en Tesorería / Treasury shares 0 0 0 0 0 0 0 0 0 0Resultados Acumulados / Retained earnings -55 -1,343 71,430 28,458 0 0 0 978 270,909 155,978Resultado del Ejercicio / Period's results 955 1,258 28,110 187,460 8,262 50,224 5,314 21,045 44,424 256,446
TOTAL PATRIMONIO / TOTAL EQUITY 9,009 8,024 317,055 406,177 309,724 259,088 166,719 160,255 1,120,207 1,109,572TOTAL PASIVO Y PATRIMONIO / TOTAL LIABILITIES AND EQUITY 15,442 12,867 2,775,297 2,690,856 618,120 561,635 714,599 641,749 5,480,111 5,226,257
ESTADO DE RESULTADOS / INCOME STATEMENT 31/03/2012 31/03/2011 31/03/2012 31/03/2011 31/03/2012 31/03/2011 31/03/2012 31/03/2011 31/03/2012 31/03/2011
Primas de Seguros (Neto) / Insurance premiums (net) 3,267 1,753 110,192 124,164 129,875 130,287 148,122 158,638 626,403 569,248Reaseguro Aceptado (Neto) / Accepted reinsurance (net) 0 0 0 0 1,035 346 1,098 715 1,153 0Ajuste de Reservas Técnicas de Primas de Seg. y Reaseg. Aceptado / Adjustments to technical reserves foraccepted insurance and re-insurance premiums -739 -552 -94,174 -104,467 921 -14,151 -12,971 -21,021 -81,920 -113,946
TOTAL PRIMAS NETAS DEL EJERCICIO / TOTAL NET PREMIUMS FOR FISCAL YEAR 2,528 1,201 16,018 19,697 131,831 116,482 136,249 138,332 545,636 455,302Primas Cedidas Netas / Ceded premiums (net) -1,686 -919 -978 -1,947 -19,610 -32,143 -53,425 -58,412 -223,203 -163,852Ajuste de Reservas Técnicas de Primas Cedidas / Adjustment to technical reserves for ceded premiums 411 311 -963 314 -4,352 3,439 4,375 12,176 -26,921 -10,227
TOTAL PRIMAS CEDIDAS NETAS DEL EJERCICIO / TOTAL CEDED PREMIUMS -1,275 -608 -1,941 -1,633 -23,962 -28,704 -49,050 -46,236 -250,124 -174,079PRIMAS GANADAS NETAS / NET PREMIUMS EARNED 1,253 593 14,077 18,064 107,869 87,778 87,199 92,096 295,512 281,223
Siniestros de primas de seguros (netos) / Insurance premium claims (net) -1,071 0 -32,252 -34,230 -189,699 -53,384 -67,373 -75,431 -268,569 -217,154Siniestros de reaseguros aceptados (netos) / Accepted reinsurance claims (net) 0 0 0 0 -21 -1 -8,175 -285 -517 0Siniestros de primas cedidas (netos) / Ceded premiums claims 856 0 977 1,818 130,160 8,070 29,740 26,982 93,844 66,168Recuperos y Salvamentos / Recovery and salvage 0 0 0 0 0 0 2,883 2,633 4,636 3,101
SINIESTROS INCURRIDOS (NETOS) / CLAIMS INCURRED (NET) -215 0 -31,275 -32,412 -59,560 -45,315 -42,925 -46,101 -170,606 -147,885Ajuste de Reservas para Riesgos Catastróficos / Adjustment to reserves for catastrophe risk 0 0 0 0 0 0 0 -2,247 0 0
RESULTADO TECNICO BRUTO / GROSS TECHNICAL PROFTIS 1,038 593 -17,198 -14,348 48,309 42,463 44,274 43,748 124,906 133,338Comisiones sobre Primas de Seguros (netas) / Commissions on insurance premiums (net) -302 -160 -3,843 -2,946 -27,987 -17,710 -22,341 -19,406 -51,726 -46,371Comisiones sobre Reaseguro Aceptado (netas) / Commissions on accepted reinsurance (net) 0 0 0 0 -138 -151 0 -5 0 0Comisiones de Primas Cedidas (netas) / Commissions of ceded premiums (net) 0 0 0 0 0 0 2 0 0 0
COMISIONES (NETAS) / FEES (NET) -302 -160 -3,843 -2,946 -28,125 -17,861 -22,339 -19,411 -51,726 -46,371Ingresos Técnicos Diversos / Sundry technical income 861 519 1,510 795 5,698 14,287 8,851 7,370 13,763 12,615Gastos Técnicos Diversos / Sundry technical expenses -112 -276 -1,383 -1,613 -2,728 -11,933 -6,202 -6,941 -50,198 -44,008Ingresos (Egresos) Diversos, neto / Sundry income (expenses), net 0 0 0 0 0 0 0 0 0 0
RESULTADO TÉCNICO / TECHNICAL PROFITS 1,485 676 -20,914 -18,112 23,154 26,956 24,584 24,766 36,745 55,574Ingresos de Inversiones y Otros Ingresos Financieros / Investment income and other financial income 465 151 71,651 76,040 24,931 44,159 8,734 6,971 110,710 102,714Gastos de Inversiones y Otros Gastos Financieros. / Investment expenses and other financial expenses -57 -68 -9,500 -8,629 -14,873 -26,021 -1,176 -1,052 -12,377 -8,827
RESULTADO DE INVERSIONES / INVESTMENTS PROFITS 408 83 62,151 67,411 10,058 18,138 7,558 5,919 98,333 93,887Gastos de Administración (Neto de Ingresos por Servicios y Otros) / Administrative expenses (net of serviceincome and others) -823 -525 -13,127 -12,326 -23,639 -20,320 -23,970 -21,242 -89,585 -76,103
RESULTADO DE OPERACIÓN ANTES DE IMPUESTO A LA RENTA / RESULT BEFORE INCOME TAX 1,070 234 28,110 36,973 9,573 24,774 8,172 9,443 45,493 73,358Impuesto a la Renta / Income Tax -115 -3 0 0 -1,311 -4,149 -2,858 -3,078 -1,069 -5,838Efecto acumulativo de cambios en las políticas contables / Cumulative effect from accounting policy changes 0 0 0 0 0 0 0 0 0 0
UTILIDAD (PÉRDIDA) NETA DEL EJERCICIO / PERIOD'S NET PROFIT (LOSS) 955 231 28,110 36,973 8,262 20,625 5,314 6,365 44,424 67,520
INDICADORES FINANCIEROS / FINANCIAL RATIOSLiquidez / Liquid Ratio 2.81 1.37 1.71 1.30 1.36 Rotación en Activos / Gross Sales to Total Assets 0.35 0.07 0.47 0.28 0.16 Solvencia / Solvency 0.42 0.89 0.50 0.77 0.80 Deuda / Patrimonio / Debt / Equity 0.71 7.75 1.00 3.29 3.89 Rentabilidad de Capital % / Return on capital % 11.78 16.80 3.31 3.64 6.53 Rentabilidad sobre Activos % / Return on Assets % 6.18 1.01 1.34 0.74 0.81 Rentabilidad de Patrimonio % / Return on Equity % 10.60 8.87 2.67 3.19 3.97
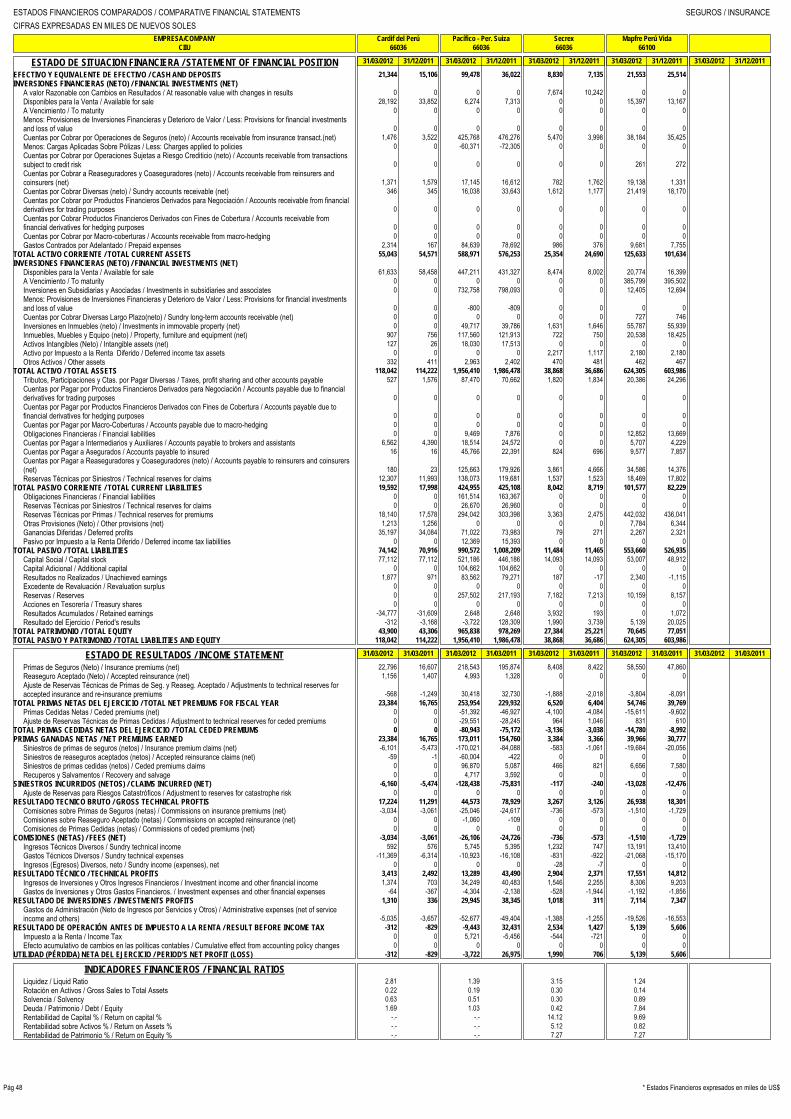
ESTADOS FINANCIEROS COMPARADOS / COMPARATIVE FINANCIAL STATEMENTS SEGUROS / INSURANCECIFRAS EXPRESADAS EN MILES DE NUEVOS SOLES
EMPRESA/COMPANY
Cardif del Perú
Pacífico - Per. Suiza
Secrex
Mapfre Perú Vida
CIIU
66036
66036
66036
66100
Pág 48 * Estados Financieros expresados en miles de US$
ESTADO DE SITUACION FINANCIERA / STATEMENT OF FINANCIAL POSITION 31/03/2012 31/12/2011 31/03/2012 31/12/2011 31/03/2012 31/12/2011 31/03/2012 31/12/2011 31/03/2012 31/12/2011
EFECTIVO Y EQUIVALENTE DE EFECTIVO / CASH AND DEPOSITS 21,344 15,106 99,478 36,022 8,830 7,135 21,553 25,514 INVERSIONES FINANCIERAS (NETO) / FINANCIAL INVESTMENTS (NET)
A valor Razonable con Cambios en Resultados / At reasonable value with changes in results 0 0 0 0 7,674 10,242 0 0 Disponibles para la Venta / Available for sale 28,192 33,852 6,274 7,313 0 0 15,397 13,167 A Vencimiento / To maturity 0 0 0 0 0 0 0 0 Menos: Provisiones de Inversiones Financieras y Deterioro de Valor / Less: Provisions for financial investmentsand loss of value 0 0 0 0 0 0 0 0 Cuentas por Cobrar por Operaciones de Seguros (neto) / Accounts receivable from insurance transact.(net) 1,476 3,522 425,768 476,276 5,470 3,998 38,184 35,425 Menos: Cargas Aplicadas Sobre Pólizas / Less: Charges applied to policies 0 0 -60,371 -72,305 0 0 0 0 Cuentas por Cobrar por Operaciones Sujetas a Riesgo Crediticio (neto) / Accounts receivable from transactionssubject to credit risk 0 0 0 0 0 0 261 272 Cuentas por Cobrar a Reaseguradores y Coaseguradores (neto) / Accounts receivable from reinsurers andcoinsurers (net) 1,371 1,579 17,145 16,612 782 1,762 19,138 1,331 Cuentas por Cobrar Diversas (neto) / Sundry accounts receivable (net) 346 345 16,038 33,643 1,612 1,177 21,419 18,170 Cuentas por Cobrar por Productos Financieros Derivados para Negociación / Accounts receivable from financialderivatives for trading purposes 0 0 0 0 0 0 0 0 Cuentas por Cobrar Productos Financieros Derivados con Fines de Cobertura / Accounts receivable fromfinancial derivatives for hedging purposes 0 0 0 0 0 0 0 0 Cuentas por Cobrar por Macro-coberturas / Accounts receivable from macro-hedging 0 0 0 0 0 0 0 0 Gastos Contrados por Adelantado / Prepaid expenses 2,314 167 84,639 78,692 986 376 9,681 7,755
TOTAL ACTIVO CORRIENTE / TOTAL CURRENT ASSETS 55,043 54,571 588,971 576,253 25,354 24,690 125,633 101,634 INVERSIONES FINANCIERAS (NETO) / FINANCIAL INVESTMENTS (NET)
Disponibles para la Venta / Available for sale 61,633 58,458 447,211 431,327 8,474 8,002 20,774 16,399 A Vencimiento / To maturity 0 0 0 0 0 0 385,799 395,502 Inversiones en Subsidiarias y Asociadas / Investments in subsidiaries and associates 0 0 732,758 798,093 0 0 12,405 12,694 Menos: Provisiones de Inversiones Financieras y Deterioro de Valor / Less: Provisions for financial investmentsand loss of value 0 0 -800 -809 0 0 0 0 Cuentas por Cobrar Diversas Largo Plazo(neto) / Sundry long-term accounts receivable (net) 0 0 0 0 0 0 727 746 Inversiones en Inmuebles (neto) / Investments in immovable property (net) 0 0 49,717 39,786 1,631 1,646 55,787 55,939 Inmuebles, Muebles y Equipo (neto) / Property, furniture and equipment (net) 907 756 117,560 121,913 722 750 20,538 18,425 Activos Intangibles (Neto) / Intangible assets (net) 127 26 18,030 17,513 0 0 0 0 Activo por Impuesto a la Renta Diferido / Deferred income tax assets 0 0 0 0 2,217 1,117 2,180 2,180 Otros Activos / Other assets 332 411 2,963 2,402 470 481 462 467
TOTAL ACTIVO / TOTAL ASSETS 118,042 114,222 1,956,410 1,986,478 38,868 36,686 624,305 603,986 Tributos, Participaciones y Ctas. por Pagar Diversas / Taxes, profit sharing and other accounts payable 527 1,576 87,470 70,662 1,820 1,834 20,386 24,296 Cuentas por Pagar por Productos Financieros Derivados para Negociación / Accounts payable due to financialderivatives for trading purposes 0 0 0 0 0 0 0 0 Cuentas por Pagar por Productos Financieros Derivados con Fines de Cobertura / Accounts payable due tofinancial derivatives for hedging purposes 0 0 0 0 0 0 0 0 Cuentas por Pagar por Macro-Coberturas / Accounts payable due to macro-hedging 0 0 0 0 0 0 0 0 Obligaciones Financieras / Financial liabilities 0 0 9,469 7,876 0 0 12,852 13,669 Cuentas por Pagar a Intermediarios y Auxiliares / Accounts payable to brokers and assistants 6,562 4,390 18,514 24,572 0 0 5,707 4,229 Cuentas por Pagar a Asegurados / Accounts payable to insured 16 16 45,766 22,391 824 696 9,577 7,857 Cuentas por Pagar a Reaseguradores y Coaseguradores (neto) / Accounts payable to reinsurers and coinsurers(net) 180 23 125,663 179,926 3,861 4,666 34,586 14,376 Reservas Técnicas por Siniestros / Technical reserves for claims 12,307 11,993 138,073 119,681 1,537 1,523 18,469 17,802
TOTAL PASIVO CORRIENTE / TOTAL CURRENT LIABILITIES 19,592 17,998 424,955 425,108 8,042 8,719 101,577 82,229 Obligaciones Financieras / Financial liabilities 0 0 161,514 163,367 0 0 0 0 Reservas Técnicas por Siniestros / Technical reserves for claims 0 0 26,670 26,960 0 0 0 0 Reservas Técnicas por Primas / Technical reserves for premiums 18,140 17,578 294,042 303,398 3,363 2,475 442,032 436,041 Otras Provisiones (Neto) / Other provisions (net) 1,213 1,256 0 0 0 0 7,784 6,344 Ganancias Diferidas / Deferred profits 35,197 34,084 71,022 73,983 79 271 2,267 2,321 Pasivo por Impuesto a la Renta Diferido / Deferred income tax liabilities 0 0 12,369 15,393 0 0 0 0
TOTAL PASIVO / TOTAL LIABILITIES 74,142 70,916 990,572 1,008,209 11,484 11,465 553,660 526,935 Capital Social / Capital stock 77,112 77,112 521,186 446,186 14,093 14,093 53,007 48,912 Capital Adicional / Additional capital 0 0 104,662 104,662 0 0 0 0 Resultados no Realizados / Unachieved earnings 1,877 971 83,562 79,271 187 -17 2,340 -1,115 Excedente de Revaluación / Revaluation surplus 0 0 0 0 0 0 0 0 Reservas / Reserves 0 0 257,502 217,193 7,182 7,213 10,159 8,157 Acciones en Tesorería / Treasury shares 0 0 0 0 0 0 0 0 Resultados Acumulados / Retained earnings -34,777 -31,609 2,648 2,648 3,932 193 0 1,072 Resultado del Ejercicio / Period's results -312 -3,168 -3,722 128,309 1,990 3,739 5,139 20,025
TOTAL PATRIMONIO / TOTAL EQUITY 43,900 43,306 965,838 978,269 27,384 25,221 70,645 77,051 TOTAL PASIVO Y PATRIMONIO / TOTAL LIABILITIES AND EQUITY 118,042 114,222 1,956,410 1,986,478 38,868 36,686 624,305 603,986
ESTADO DE RESULTADOS / INCOME STATEMENT 31/03/2012 31/03/2011 31/03/2012 31/03/2011 31/03/2012 31/03/2011 31/03/2012 31/03/2011 31/03/2012 31/03/2011
Primas de Seguros (Neto) / Insurance premiums (net) 22,796 16,607 218,543 195,874 8,408 8,422 58,550 47,860 Reaseguro Aceptado (Neto) / Accepted reinsurance (net) 1,156 1,407 4,993 1,328 0 0 0 0 Ajuste de Reservas Técnicas de Primas de Seg. y Reaseg. Aceptado / Adjustments to technical reserves foraccepted insurance and re-insurance premiums -568 -1,249 30,418 32,730 -1,888 -2,018 -3,804 -8,091
TOTAL PRIMAS NETAS DEL EJERCICIO / TOTAL NET PREMIUMS FOR FISCAL YEAR 23,384 16,765 253,954 229,932 6,520 6,404 54,746 39,769 Primas Cedidas Netas / Ceded premiums (net) 0 0 -51,392 -46,927 -4,100 -4,084 -15,611 -9,602 Ajuste de Reservas Técnicas de Primas Cedidas / Adjustment to technical reserves for ceded premiums 0 0 -29,551 -28,245 964 1,046 831 610
TOTAL PRIMAS CEDIDAS NETAS DEL EJERCICIO / TOTAL CEDED PREMIUMS 0 0 -80,943 -75,172 -3,136 -3,038 -14,780 -8,992 PRIMAS GANADAS NETAS / NET PREMIUMS EARNED 23,384 16,765 173,011 154,760 3,384 3,366 39,966 30,777
Siniestros de primas de seguros (netos) / Insurance premium claims (net) -6,101 -5,473 -170,021 -84,088 -583 -1,061 -19,684 -20,056 Siniestros de reaseguros aceptados (netos) / Accepted reinsurance claims (net) -59 -1 -60,004 -422 0 0 0 0 Siniestros de primas cedidas (netos) / Ceded premiums claims 0 0 96,870 5,087 466 821 6,656 7,580 Recuperos y Salvamentos / Recovery and salvage 0 0 4,717 3,592 0 0 0 0
SINIESTROS INCURRIDOS (NETOS) / CLAIMS INCURRED (NET) -6,160 -5,474 -128,438 -75,831 -117 -240 -13,028 -12,476 Ajuste de Reservas para Riesgos Catastróficos / Adjustment to reserves for catastrophe risk 0 0 0 0 0 0 0 0
RESULTADO TECNICO BRUTO / GROSS TECHNICAL PROFTIS 17,224 11,291 44,573 78,929 3,267 3,126 26,938 18,301 Comisiones sobre Primas de Seguros (netas) / Commissions on insurance premiums (net) -3,034 -3,061 -25,046 -24,617 -736 -573 -1,510 -1,729 Comisiones sobre Reaseguro Aceptado (netas) / Commissions on accepted reinsurance (net) 0 0 -1,060 -109 0 0 0 0 Comisiones de Primas Cedidas (netas) / Commissions of ceded premiums (net) 0 0 0 0 0 0 0 0
COMISIONES (NETAS) / FEES (NET) -3,034 -3,061 -26,106 -24,726 -736 -573 -1,510 -1,729 Ingresos Técnicos Diversos / Sundry technical income 592 576 5,745 5,395 1,232 747 13,191 13,410 Gastos Técnicos Diversos / Sundry technical expenses -11,369 -6,314 -10,923 -16,108 -831 -922 -21,068 -15,170 Ingresos (Egresos) Diversos, neto / Sundry income (expenses), net 0 0 0 0 -28 -7 0 0
RESULTADO TÉCNICO / TECHNICAL PROFITS 3,413 2,492 13,289 43,490 2,904 2,371 17,551 14,812 Ingresos de Inversiones y Otros Ingresos Financieros / Investment income and other financial income 1,374 703 34,249 40,483 1,546 2,255 8,306 9,203 Gastos de Inversiones y Otros Gastos Financieros. / Investment expenses and other financial expenses -64 -367 -4,304 -2,138 -528 -1,944 -1,192 -1,856
RESULTADO DE INVERSIONES / INVESTMENTS PROFITS 1,310 336 29,945 38,345 1,018 311 7,114 7,347 Gastos de Administración (Neto de Ingresos por Servicios y Otros) / Administrative expenses (net of serviceincome and others) -5,035 -3,657 -52,677 -49,404 -1,388 -1,255 -19,526 -16,553
RESULTADO DE OPERACIÓN ANTES DE IMPUESTO A LA RENTA / RESULT BEFORE INCOME TAX -312 -829 -9,443 32,431 2,534 1,427 5,139 5,606 Impuesto a la Renta / Income Tax 0 0 5,721 -5,456 -544 -721 0 0 Efecto acumulativo de cambios en las políticas contables / Cumulative effect from accounting policy changes 0 0 0 0 0 0 0 0
UTILIDAD (PÉRDIDA) NETA DEL EJERCICIO / PERIOD'S NET PROFIT (LOSS) -312 -829 -3,722 26,975 1,990 706 5,139 5,606
INDICADORES FINANCIEROS / FINANCIAL RATIOSLiquidez / Liquid Ratio 2.81 1.39 3.15 1.24 Rotación en Activos / Gross Sales to Total Assets 0.22 0.19 0.30 0.14 Solvencia / Solvency 0.63 0.51 0.30 0.89 Deuda / Patrimonio / Debt / Equity 1.69 1.03 0.42 7.84 Rentabilidad de Capital % / Return on capital % -.- -.- 14.12 9.69 Rentabilidad sobre Activos % / Return on Assets % -.- -.- 5.12 0.82 Rentabilidad de Patrimonio % / Return on Equity % -.- -.- 7.27 7.27

ESTADOS FINANCIEROS COMPARADOS / COMPARATIVE FINANCIAL STATEMENTS DIVERSAS / ASSORTEDCIFRAS EXPRESADAS EN MILES DE NUEVOS SOLES
EMPRESA/COMPANY Credicorp Ltd. (*)
CIIU 6599
Pág 49* Estados Financieros expresados en miles de US$
ESTADO DE SITUACION FINANCIERA / STATEMENT OF FINANCIAL POSITION 31/03/2012 31/12/2011 31/03/2012 31/12/2011 31/03/2012 31/12/2011 31/03/2012 31/12/2011 31/03/2012 31/12/2011
Disponible / Funds Available 6,296,977 5,480,911 Fondos interbancarios / Inter-Bank Funds 10,630 21,951 Inversiones en Valores (neto) / Investments in securities (net) 160,579 75,611 Cartera de créditos (neto) / Loans portfolio (net) 8,057,823 7,716,730 Cuentas por Cobrar por Operaciones de Seguros / Accounts receivable from insurance transactions 167,308 174,367 Cuentas por Cobrar a Reaseguradores y Coaseguradores / Accounts receivable from reinsurers and coinsurers 167,448 151,080 Cuentas por cobrar (neto) / Accounts receivable (net) 206,640 129,645 Otras Cuentas por Cobrar / Other accounts receivable 127,507 172,584 Activos por Impuestos a las Ganancias / Assets from income tax 0 0 Otros activos / Other assets 724,055 575,948
TOTAL ACTIVO CORRIENTE / TOTAL CURRENT ASSETS 15,918,967 14,498,827 Cartera de créditos (neto) / Loans portfolio (net) 9,472,642 9,205,503 Cuentas por cobrar (neto) / Accounts receivable (net) 0 0 Otras Cuentas por Cobrar / Other accounts receivable 0 0 Bienes realizables, recib. en pago, adjudic. y fuera de uso (neto) / Realizable, received as payment, foreclosed andobsolete assets (net) 12,524 10,842 Inversiones permanentes en valores (neto) / Permanent investments in securities (net) 7,629,634 5,915,601 Propiedades de Inversión / Investment property 0 0 Propiedad, planta y equipo (neto) / Property, plant and equipment (net) 481,906 472,433 Activos intangibles (neto) / Intangible assets 257,528 266,448 Activos por Impuestos a las Ganancias Diferidos / Assets from deferred income tax 134,661 61,695 Otros activos / Other assets 57,506 114,470 Plusvalía / Capital gain 195,655 186,974
TOTAL ACTIVO NO CORRIENTE / TOTAL NON-CURRENT ASSETS 18,242,056 16,233,966 TOTAL ACTIVO / TOTAL ASSETS 34,161,023 30,732,793
Obligaciones con el público / Obligations with the public 19,942,426 17,562,025 Fondos interbancarios / Inter-Bank Funds 147,370 138,671 Depósitos de Emp. del Sist. Financ. y Org. Financ. Internac. / Deposits from financial system companies and internat.financial org. 1,239,278 1,141,822 Adeudados y Obligaciones Financieras / Financial debt and obligations 801,068 912,391 Cuentas por Pagar a Intermediarios y Auxiliares / Accounts payable to brokers and assistants 0 0 Cuentas por Pagar a Asegurados / Accounts payable to insured 0 0 Cuentas por Pagar a Reaseguradores y Coaseguradores / Accounts payable to reinsurers and coinsurers 54,118 75,366 Cuentas por Pagar / Accounts payable 758,810 223,743 Otras Cuentas por Pagar / Other accounts payable 152,708 145,261 Valores, Títulos y Obligaciones en Circulación / Outstanding securities, instruments and obligations 292,284 327,330 Provisiones / Provisions 40,250 38,478 Reservas Técnicas por Siniestros / Technical reserves for claims 1,241,936 1,157,491 Pasivos por Impuestos a las Ganancias / Liabilities form income tax 0 0 Otros pasivos / Other Liabilities 299,514 489,963
TOTAL PASIVO CORRIENTE / TOTAL CURRENT LIABILITIES 24,969,762 22,212,541 Adeudos y Obligaciones Financieras / Financial debts and obligations 1,565,575 1,008,958 Reservas Técnicas por Primas / Technical reserves for premiums 206,098 220,807 Reservas Técnicas por Siniestros / Technical reserves for claims 0 0 Cuentas por Pagar / Accounts payable 0 0 Cuentas por Pagar Diversas / Sundry accounts payable 0 0 Valores, Títulos y Obligaciones en Circulación / Outstanding securities, instruments and obligations 3,618,047 3,638,192 Pasivos por Impuestos a las Ganancias Diferidos / Liabilities from deferred income tax 174,961 127,960 Otras Provisiones / Other Provisions 0 0 Otros pasivos / Other Liabilities 57,503 61,695 Ingreso Diferido / Deferred income 0 0
TOTAL PASIVO NO CORRIENTE / TOTAL NON-CURRENT LIABILITIES 5,622,184 5,057,612 TOTAL PASIVO / TOTAL LIABILITIES 30,591,946 27,270,153
Capital Emitido / Issued capital 471,912 471,912 Prima de Emisión / Share premium 107,018 111,145 Acciones propias en cartera / Treasury shares -74,673 -74,877 Reservas / Reserves 2,319,051 1,812,977 Resultados Acumulados / Retained earnings 216,566 734,474 Resultados No Realizados / Unachieved earnings 453,880 340,168 Patrimonio Atribuible a los Propietarios de la Controladora / Equity attributable to controlling interest 3,493,754 3,395,799 Participaciones No Controladoras / Non-controlling interest 75,323 66,841
TOTAL PATRIMONIO / TOTAL EQUITY 3,569,077 3,462,640 TOTAL PASIVO Y PATRIMONIO / TOTAL LIABILITIES AND EQUITY 34,161,023 30,732,793
ESTADO DE RESULTADOS / INCOME STATEMENT 31/03/2012 31/03/2011 31/03/2012 31/03/2011 31/03/2012 31/03/2011 31/03/2012 31/03/2011 31/03/2012 31/03/2011
INGRESOS DE ACTIVIDADES ORDINARIAS / INCOME FROM REGULAR ACTIVITIES 683,192 564,022 COSTOS POR SERVICIOS Y VENTA DE BIENES / COSTS OF SERVICES AND PROPERTY SALES -278,919 -203,804 MARGEN BRUTO / GROSS MARGIN 404,273 360,218
Ganancias (Pérd.) de la dif. entre Valor Libro Ant. y Valor Justo de Activos Financ. a Valor Razonable / Profits (losses) fromdiff. between previous book value and fair value of financ. assets reclassified and measured at fair value 0 0 Provisión para Incobrabilidad de Créditos / Provisions for bad loans -69,639 -41,517
MARGEN FINANCIERO BRUTO DESPUÉS DE PROVISIONES / GROSS FINANCIAL MARGIN AFTER PROVISIONS 334,634 318,701 Comisiones / Fees 162,848 142,489 Ingresos (Egresos) Diversos / Sundry income (expenses) -28,346 -25,250 Particip. en los Result. Netos de Asoc. y Negocios Conjuntos Contabilizados por el Método de Participación / Equity in netresults of associates and joint ventures booked by equity method 1,364 -158
MARGEN OPERACIONAL ANTES DE GASTOS ADMINISTRATIVOS Y DE INGRESOS POR ACTIVIDADES ORDINARIAS /OPERATING MARGIN BEFORE OVERHEADS AND INCOME FROM REGULAR ACTIVITIES 470,500 435,782
Gastos de Administración / Overheads -287,000 -240,582 Gastos de Ventas / Sales expenses -11,442 -7,048
RESULTADO DE OPERACIÓN / OPERATING PROFITS 172,058 188,152 Ingresos financieros / Financial income 67,645 50,003 Gastos financieros / Financial expenses 0 0 Otros ingresos y gastos / Sundry income and expenses 13,184 1,023
RESULTADO ANTES DE IMPUESTO A LAS GANANCIAS / PRE-INCOME TAX RESULT 252,887 239,178 Gasto por Impuesto a las Ganancias / Income tax expenses -60,073 -60,676 Ganancia (Pérdida) Neta de Operaciones Continuadas / Net profit (loss) form continuing trades 192,814 178,502 Ganancia (Pérdida) Neta del Imp. a las Ganancias Procedente de Op. Discontinuadas / Net profit (loss) from income taxdiscontinued trades 0 0
GANANCIA (PERDIDA) NETA DEL EJERCICIO / PERIOD'S NET PROFIT (LOSS) 192,814 178,502 Ganancia (Pérdida) Neta atribuible a: / Net profit (loss) attributable to: 0 0 Propietarios de la Controladora / Controlling interest 189,113 175,024 Participaciones no Controladoras / Non-controlling interest 3,701 3,478
INDICADORES FINANCIEROS / FINANCIAL RATIOSLiquidez / Liquid Ratio 0.29 Rotación en Activos / Gross Sales to Total Assets 0.02 Solvencia / Solvency 0.90 Deuda / Patrimonio / Debt / Equity 8.57 Rentabilidad de Capital % / Return on capital % 40.86 Rentabilidad sobre Activos % / Return on Assets % 0.56 Rentabilidad de Patrimonio % / Return on Equity % 5.40

ESTADOS FINANCIEROS COMPARADOS / COMPARATIVE FINANCIAL STATEMENTS FONDOS DE INVERSION / INVESTMENT FUNDSCIFRAS EXPRESADAS EN MILES DE NUEVOS SOLES
EMPRESA/COMPANY
Compass Pymes
Coril ICMP1
Coril ICMP2
Coril IF5
Coril IF7CIIU
660203
660203
660203
660203
660203
Pág 50* Estados Financieros expresados en miles de US$
BALANCE GENERAL / BALANCE SHEET 31/03/2012 31/12/2011 31/03/2012 31/12/2011 31/03/2012 31/12/2011 31/03/2012 31/12/2011 31/03/2012 31/12/2011
Efectivo y Equivalentes de efectivo / Cash and cash equivalent 20,700 2,447 602 73 814 9 76 42 267 43Inversiones Financieras / Financial investments 0 0 27,271 27,600 23,346 23,961 16,931 16,877 14,968 15,120Activos Financieros al Valor Razonable con cambios en Ganancias y Pérdidas / Financial assets at reasonablevalue with profit and loss changes 0 0 27,271 27,600 23,346 23,961 16,931 16,877 14,968 15,120Activos Financieros Disponibles para la Venta / Financial assets available for sale 0 0 0 0 0 0 0 0 0 0Activos Financieros mantenidos hasta el Vencimiento / Financial assets kept to maturity 0 0 0 0 0 0 0 0 0 0Activos por Instrumentos Financieros Derivados / Assets for Financial Instruments Derivates 0 0 0 0 0 0 0 0 0 0Cuentas por Cobrar Comerciales (neto) / Trade accounts receivable (net) 0 0 8 18 11 12 0 5 0 2Cuentas por Cobrar a Partes Relacionadas / Accounts receivable from related companies 0 0 0 0 0 0 0 0 0 0Otras Cuentas por Cobrar (neto) / Other accounts receivable (net) 0 0 0 0 0 0 0 0 0 0Existencias (neto) / Stock (net) 0 0 0 0 0 0 0 0 0 0Activos no Corrientes mantenidos para la Venta / Non-current assets available for sale 0 0 0 0 0 0 0 0 0 0Gastos Diferidos / Deferred expenses 0 0 0 0 0 0 0 0 0 0Otros Activos / Other assets 0 0 0 0 0 0 0 0 0 0
TOTAL ACTIVO CORRIENTE / TOTAL CURRENT ASSETS 20,700 2,447 27,881 27,691 24,171 23,982 17,007 16,924 15,235 15,165Inversiones Financieras / Financial investments 312,666 326,388 0 0 0 0 0 0 0 0Activos Financieros Disponibles para la Venta / Financial assets available for sale 312,666 326,388 0 0 0 0 0 0 0 0Activos Financieros mantenidos hasta el Vencimiento / Financial assets kept to maturity 0 0 0 0 0 0 0 0 0 0Activos por Instrumentos Financieros Derivados / Assets for Financial Instruments Derivates 0 0 0 0 0 0 0 0 0 0Inversiones al Método de Participación / Share method investments 0 0 0 0 0 0 0 0 0 0Otras Inversiones Financieras / Other financial investments 0 0 0 0 0 0 0 0 0 0Cuentas por Cobrar Comerciales / Trade accounts receivable 0 0 0 0 0 0 0 0 0 0Cuentas por Cobrar a Partes Relacionadas / Accounts receivable from related companies 0 0 0 0 0 0 0 0 0 0Otras Cuentas por Cobrar / Other accounts receivable 0 0 0 0 0 0 0 0 0 0Existencias (neto) / Stock (net) 0 0 0 0 0 0 0 0 0 0Inversiones Inmobiliarias / Real estate investments 0 0 0 0 0 0 0 0 0 0Inmuebles, Maquinaria y Equipo (neto) / Inmovable Property, Machinery and Equipment (net) 0 0 0 0 0 0 0 0 0 0Activos Intangibles (neto) / Intangible assets (net) 0 0 0 0 0 0 0 0 0 0Activo por Impuesto a la Renta y Participaciones Diferidos / Income tax and deferred profit sharing-Assets 0 0 0 0 0 0 0 0 0 0Otros Activos / Other assets 0 0 0 0 0 0 0 0 0 0
TOTAL ACTIVO NO CORRIENTE / TOTAL NON-CURRENT ASSETS 312,666 326,388 0 0 0 0 0 0 0 0TOTAL ACTIVO / TOTAL ASSETS 333,366 328,835 27,881 27,691 24,171 23,982 17,007 16,924 15,235 15,165
Sobregiros Bancarios / Bank overdrafts 0 0 0 0 0 0 0 0 0 0Obligaciones Financieras / Financial liabilities 0 0 0 0 0 0 0 0 0 0Cuentas por Pagar Comerciales / Trade accounts payable 0 0 0 0 0 0 0 0 0 0Cuentas por Pagar a Partes Relacionadas / Accounts payable to related companies 0 404 0 0 0 0 0 0 0 0Impuesto a la Renta y Participaciones Corrientes / Current income tax and profit sharing 0 0 0 0 0 0 0 0 0 0Otras Cuentas por Pagar / Other accounts payable 75 63 16 20 8 19 22 14 18 17Provisiones / Provisions 0 0 0 0 0 0 0 0 0 0
TOTAL PASIVO CORRIENTE / TOTAL CURRENT LIABILITIES 75 467 16 20 8 19 22 14 18 17Obligaciones Financieras / Financial liabilities 0 0 0 0 0 0 0 0 0 0 Obligaciones Financieras / 0 0 0 0 0 0 0 0 0 0Cuentas por Pagar Comerciales / Trade accounts payable 0 0 0 0 0 0 0 0 0 0Cuentas por Pagar a Partes Relacionadas / Accounts payable to related companies 0 0 0 0 0 0 0 0 0 0Pasivo por Impuesto a la Renta y Participaciones Diferidos / Deferred income tax and profit sharing - Liabilities 0 0 0 0 0 0 0 0 0 0Otras Cuentas por Pagar / Other accounts payable 0 0 0 0 0 0 0 0 0 0Provisiones / Provisions 0 0 0 0 0 0 0 0 0 0Ingresos Diferidos (netos) / Deferred income (net) 0 0 0 0 0 0 0 0 0 0
TOTAL PASIVO NO CORRIENTE / TOTAL NON-CURRENT LIABILITIES 0 0 0 0 0 0 0 0 0 0TOTAL PASIVO / TOTAL LIABILITIES 75 467 16 20 8 19 22 14 18 17
Capital / Capital 254,654 254,654 16,454 16,629 14,322 14,475 9,408 9,509 9,356 9,456Capital Adicional / Additional Capital 122 122 0 0 0 0 158 160 0 0Resultados no Realizados / Unachieved Earnings -7 42 -102 -78 -73 -69 -29 -136 -9 -72Reservas / Reserves 0 0 0 0 0 0 0 0 0 0Resultados Acumulados / Retained Earnings 78,522 73,550 11,513 11,120 9,914 9,557 7,448 7,377 5,870 5,764Diferencias de Conversión / Exchange Differences 0 0 0 0 0 0 0 0 0 0
TOTAL PATRIMONIO NETO / TOTAL NET EQUITY 333,291 328,368 27,865 27,671 24,163 23,963 16,985 16,910 15,217 15,148TOTAL PASIVO Y PATRIMONIO NETO / TOTAL LIABILITY AND NET EQUITY 333,366 328,835 27,881 27,691 24,171 23,982 17,007 16,924 15,235 15,165
ESTADO DE GANANCIAS Y PERDIDAS / INCOME STATEMENT 31/03/2012 31/03/2011 31/03/2012 31/03/2011 31/03/2012 31/03/2011 31/03/2012 31/03/2011 31/03/2012 31/03/2011
Ventas Netas (ingresos operacionales) / Net sales (operational income) 6,017 4,926 7,150 4,151 12,309 6,257 4,652 3,187 4,071 5,699Otros Ingresos Operacionales / Other operational income 0 0 0 0 0 0 0 0 0 0
TOTAL DE INGRESOS BRUTOS / TOTAL GROSS INCOME 6,017 4,926 7,150 4,151 12,309 6,257 4,652 3,187 4,071 5,699Costo de Ventas (Operacionales) / Cost of sales 0 0 -7,163 -4,171 -12,311 -6,257 -4,764 -3,204 -4,136 -5,728Otros Costos Operacionales / Operational costs 0 0 0 0 0 0 0 0 0 0
TOTAL COSTOS OPERACIONALES / TOTAL OPERATIONAL COSTS 0 0 -7,163 -4,171 -12,311 -6,257 -4,764 -3,204 -4,136 -5,728UTILIDAD BRUTA / GROSS PROFIT 6,017 4,926 -13 -20 -2 0 -112 -17 -65 -29
Gastos de Ventas / Sale expenses 0 0 0 0 0 0 0 0 0 0Gastos de Administración / Overheads -1,295 -1,226 -35 -16 -32 -14 -36 -35 -25 -28Ganancia (Pérdida) por Venta de Activos / Provisions for loss of assets devaluation 0 0 0 0 0 0 0 0 0 0Otros Ingresos / Other income 0 0 0 0 0 0 0 0 0 0Otros Gastos / Other expenses 0 0 -14 -4 -12 -8 -10 -7 -10 -7
UTILIDAD OPERATIVA / OPERATING PROFIT 4,722 3,700 -62 -40 -46 -22 -158 -59 -100 -64Ingresos Financieros / Financial income 250 301 577 543 508 461 310 328 269 281Gastos Financieros / Financial Expenses 0 0 -4 -9 -4 -8 -2 -5 -2 -4Participación en los Resultados de Partes Relacionadas por el Método de Participación / Share in relatedcompanies, under the equity sharing system 0 0 0 0 0 0 0 0 0 0Ganancia (Pérdida) por Instrumentos Financieros Derivados / Earning or loss for financial instruments derivates 0 0 0 0 0 0 0 0 0 0Resultado antes de Participaciones y del Impuesto a la Renta / Results before profit sharing and income tax 4,972 4,001 511 494 458 431 150 264 167 213Impuesto a la Renta / Income Tax 0 0 0 0 0 0 0 0 0 0
UTILIDAD (PERDIDA) NETA DE ACTIVIDADES CONTINUAS / NET PROFIT (LOSS) FROM ORDINARYACTIVITIES 4,972 4,001 511 494 458 431 150 264 167 213
Ingreso (Gasto) Neto de Operaciones en Discontinuación / Net Income (Expenses) from Discontinued Operations 0 0 0 0 0 0 0 0 0 0UTILIDAD (PERDIDA) NETA DEL EJERCICIO / PERIOD'S NET PROFIT (LOSS) 4,972 4,001 511 494 458 431 150 264 167 213
INDICADORES FINANCIEROS / FINANCIAL RATIOSLiquidez / Liquid Ratio 276.00 1,742.56 3,021.38 773.05 846.39 Rotación en Activos / Gross Sales to Total Assets 0.02 0.26 0.51 0.27 0.27 Solvencia / Solvency 0.00 0.00 0.00 0.00 0.00 Deuda / Patrimonio / Debt / Equity 0.00 0.00 0.00 0.00 0.00 Rentabilidad sobre Ventas Netas % / Return % 82.63 7.15 3.72 3.22 4.10 Rentabilidad sobre Activos % / Return on Assets % 1.49 1.83 1.89 0.88 1.10 Rentabilidad de Patrimonio % / Return on Equity % 1.49 1.83 1.90 0.88 1.10

ESTADOS FINANCIEROS COMPARADOS / COMPARATIVE FINANCIAL STATEMENTS FONDOS DE INVERSION / INVESTMENT FUNDSCIFRAS EXPRESADAS EN MILES DE NUEVOS SOLES
EMPRESA/COMPANY
Sigma-Fondo de Inv(*)
FI Multirenta Inmobil.
CIIU
660203
7010
Pág 51 * Estados Financieros expresados en miles de US$
BALANCE GENERAL / BALANCE SHEET 31/03/2012 31/12/2011 31/03/2012 31/12/2011 31/03/2012 31/12/2011 31/03/2012 31/12/2011 31/03/2012 31/12/2011
Efectivo y Equivalentes de efectivo / Cash and cash equivalent 11,218 13,424 14,441 12,482 Inversiones Financieras / Financial investments 0 0 0 0 Activos Financieros al Valor Razonable con cambios en Ganancias y Pérdidas / Financial assets at reasonablevalue with profit and loss changes 0 0 0 0 Activos Financieros Disponibles para la Venta / Financial assets available for sale 0 0 0 0 Activos Financieros mantenidos hasta el Vencimiento / Financial assets kept to maturity 0 0 0 0 Activos por Instrumentos Financieros Derivados / Assets for Financial Instruments Derivates 0 0 0 0 Cuentas por Cobrar Comerciales (neto) / Trade accounts receivable (net) 7,046 6,614 1,911 2,664 Cuentas por Cobrar a Partes Relacionadas / Accounts receivable from related companies 0 0 0 0 Otras Cuentas por Cobrar (neto) / Other accounts receivable (net) 707 1,251 135 8,408 Existencias (neto) / Stock (net) 0 0 0 0 Activos no Corrientes mantenidos para la Venta / Non-current assets available for sale 0 0 0 0 Gastos Diferidos / Deferred expenses 206 143 1,039 538 Otros Activos / Other assets 11,939 11,849 0 0
TOTAL ACTIVO CORRIENTE / TOTAL CURRENT ASSETS 31,116 33,281 17,526 24,092 Inversiones Financieras / Financial investments 0 0 85,881 60,077 Activos Financieros Disponibles para la Venta / Financial assets available for sale 0 0 0 0 Activos Financieros mantenidos hasta el Vencimiento / Financial assets kept to maturity 0 0 0 0 Activos por Instrumentos Financieros Derivados / Assets for Financial Instruments Derivates 0 0 0 0 Inversiones al Método de Participación / Share method investments 0 0 26,605 25,766 Otras Inversiones Financieras / Other financial investments 0 0 59,276 34,311 Cuentas por Cobrar Comerciales / Trade accounts receivable 0 0 0 0 Cuentas por Cobrar a Partes Relacionadas / Accounts receivable from related companies 0 0 0 0 Otras Cuentas por Cobrar / Other accounts receivable 0 0 1,792 1,847 Existencias (neto) / Stock (net) 0 0 0 0 Inversiones Inmobiliarias / Real estate investments 0 0 211,681 211,133 Inmuebles, Maquinaria y Equipo (neto) / Inmovable Property, Machinery and Equipment (net) 98,065 95,099 0 0 Activos Intangibles (neto) / Intangible assets (net) 0 0 0 0 Activo por Impuesto a la Renta y Participaciones Diferidos / Income tax and deferred profit sharing-Assets 0 0 0 0 Otros Activos / Other assets 2,535 2,534 0 0
TOTAL ACTIVO NO CORRIENTE / TOTAL NON-CURRENT ASSETS 100,600 97,633 299,354 273,057 TOTAL ACTIVO / TOTAL ASSETS 131,716 130,914 316,880 297,149
Sobregiros Bancarios / Bank overdrafts 0 0 0 0 Obligaciones Financieras / Financial liabilities 0 0 1,063 1,097 Cuentas por Pagar Comerciales / Trade accounts payable 1,098 3,038 2,600 2,414 Cuentas por Pagar a Partes Relacionadas / Accounts payable to related companies 0 0 0 0 Impuesto a la Renta y Participaciones Corrientes / Current income tax and profit sharing 0 0 0 0 Otras Cuentas por Pagar / Other accounts payable 1,395 1,459 2,277 2,679 Provisiones / Provisions 0 0 0 0
TOTAL PASIVO CORRIENTE / TOTAL CURRENT LIABILITIES 2,493 4,497 5,940 6,190 Obligaciones Financieras / Financial liabilities 0 0 0 0 Obligaciones Financieras / 0 0 4,735 5,051 Cuentas por Pagar Comerciales / Trade accounts payable 0 0 0 0 Cuentas por Pagar a Partes Relacionadas / Accounts payable to related companies 0 0 0 0 Pasivo por Impuesto a la Renta y Participaciones Diferidos / Deferred income tax and profit sharing - Liabilities 0 0 0 0 Otras Cuentas por Pagar / Other accounts payable 0 0 0 0 Provisiones / Provisions 0 0 0 0 Ingresos Diferidos (netos) / Deferred income (net) 1,223 813 0 0
TOTAL PASIVO NO CORRIENTE / TOTAL NON-CURRENT LIABILITIES 1,223 813 4,735 5,051 TOTAL PASIVO / TOTAL LIABILITIES 3,716 5,310 10,675 11,241
Capital / Capital 73,653 73,653 181,441 183,413 Capital Adicional / Additional Capital 12,423 12,423 0 0 Resultados no Realizados / Unachieved Earnings 0 0 0 0 Reservas / Reserves 0 0 0 0 Resultados Acumulados / Retained Earnings 41,924 39,528 124,764 102,495 Diferencias de Conversión / Exchange Differences 0 0 0 0
TOTAL PATRIMONIO NETO / TOTAL NET EQUITY 128,000 125,604 306,205 285,908 TOTAL PASIVO Y PATRIMONIO NETO / TOTAL LIABILITY AND NET EQUITY 131,716 130,914 316,880 297,149
ESTADO DE GANANCIAS Y PERDIDAS / INCOME STATEMENT 31/03/2012 31/03/2011 31/03/2012 31/03/2011 31/03/2012 31/03/2011 31/03/2012 31/03/2011 31/03/2012 31/03/2011
Ventas Netas (ingresos operacionales) / Net sales (operational income) 9,505 8,655 5,415 5,029 Otros Ingresos Operacionales / Other operational income 3,174 3,615 15,713 1,288
TOTAL DE INGRESOS BRUTOS / TOTAL GROSS INCOME 12,679 12,270 21,128 6,317 Costo de Ventas (Operacionales) / Cost of sales -5,919 -4,701 0 0 Otros Costos Operacionales / Operational costs 0 0 -712 -619
TOTAL COSTOS OPERACIONALES / TOTAL OPERATIONAL COSTS -5,919 -4,701 -712 -619 UTILIDAD BRUTA / GROSS PROFIT 6,760 7,569 20,416 5,698
Gastos de Ventas / Sale expenses 0 0 0 0 Gastos de Administración / Overheads -4,489 -5,057 -577 -524 Ganancia (Pérdida) por Venta de Activos / Provisions for loss of assets devaluation 0 0 0 0 Otros Ingresos / Other income 18 0 647 506 Otros Gastos / Other expenses 0 0 -513 -117
UTILIDAD OPERATIVA / OPERATING PROFIT 2,289 2,512 19,973 5,563 Ingresos Financieros / Financial income 108 35 3,698 10,555 Gastos Financieros / Financial Expenses -1 0 -2,240 -10,732 Participación en los Resultados de Partes Relacionadas por el Método de Participación / Share in relatedcompanies, under the equity sharing system 0 0 838 -695 Ganancia (Pérdida) por Instrumentos Financieros Derivados / Earning or loss for financial instruments derivates 0 0 0 0 Resultado antes de Participaciones y del Impuesto a la Renta / Results before profit sharing and income tax 2,396 2,547 22,269 4,691 Impuesto a la Renta / Income Tax 0 0 0 0
UTILIDAD (PERDIDA) NETA DE ACTIVIDADES CONTINUAS / NET PROFIT (LOSS) FROM ORDINARYACTIVITIES 2,396 2,547 22,269 4,691
Ingreso (Gasto) Neto de Operaciones en Discontinuación / Net Income (Expenses) from Discontinued Operations 0 0 0 0 UTILIDAD (PERDIDA) NETA DEL EJERCICIO / PERIOD'S NET PROFIT (LOSS) 2,396 2,547 22,269 4,691
INDICADORES FINANCIEROS / FINANCIAL RATIOSLiquidez / Liquid Ratio 12.48 2.95 Rotación en Activos / Gross Sales to Total Assets 0.10 0.07 Solvencia / Solvency 0.03 0.03 Deuda / Patrimonio / Debt / Equity 0.03 0.03 Rentabilidad sobre Ventas Netas % / Return % 18.90 105.40 Rentabilidad sobre Activos % / Return on Assets % 1.82 7.03 Rentabilidad de Patrimonio % / Return on Equity % 1.87 7.27

ESTADOS FINANCIEROS COMPARADOS / COMPARATIVE FINANCIAL STATEMENTS ADMINISTRADORAS DE FONDOS DE PENSIONES / PENSION FUND ADMINISTRATORSCIFRAS EXPRESADAS EN MILES DE NUEVOS SOLES
EMPRESA/COMPANY
A.F.P. Horizonte
Prima AFP
A.F.P. Integra
Profuturo A.F.P.
CIIU
6602
6602
66023
66023
Pág 52* Estados Financieros expresados en miles de US$
ESTADO DE SITUACION FINANCIERA / STATEMENT OF FINANCIAL POSITION 31/03/2012 31/12/2011 31/03/2012 31/12/2011 31/03/2012 31/12/2011 31/03/2012 31/12/2011 31/03/2012 31/12/2011
Efectivo y Equivalentes de efectivo / Cash and cash equivalent 25,321 9,665 94,980 42,266 24,902 24,785 83,516 74,157 Inversiones Financieras / Financial investments 53,432 49,132 0 0 43,667 32,440 3,004 0 Inversiones Financieras al Valor Razonable con cambios en Ganancias y Pérdidas / Financialinvestments at reasonable value with profit and loss changes 0 0 0 0 0 0 3,004 0 Inversiones Financieras Disponibles para la Venta / Financial investments available for sale 53,432 49,132 0 0 43,667 32,440 0 0 Inversiones Financieras mantenidas hasta el Vencimiento / Financial investments kept to maturity 0 0 0 0 0 0 0 0 Cuentas por Cobrar Comerciales (neto) / Trade accounts receivable (net) 2,896 2,236 798 517 609 290 403 149 Otras Cuentas por Cobrar a vinculadas (neto) / Other accounts receivable from relatedcompanies (net) 0 0 176 59 0 0 44 139 Otras Cuentas por Cobrar (neto) / Other accounts receivable (net) 722 0 689 581 1,053 43 1,815 2,724 Gastos Contratados por Anticipado / Prepaid expenses 40,573 848 3,109 209 1,360 894 5,977 20,534 Otros Activos / Other assets 0 5,770 282 276 791 433 296 281
TOTAL ACTIVO CORRIENTE / TOTAL CURRENT ASSETS 122,944 67,651 100,034 43,908 72,382 58,885 95,055 97,984 Encaje legal / Legal reserve 0 0 289,578 261,057 272,057 250,528 134,969 123,579 Inversiones Financieras / Financial investments 0 0 0 0 461 470 0 0 Inversiones Financieras al Valor Razonable con cambios en Ganancias y Pérdidas / Financialinvestments at reasonable value with profit and loss changes 0 0 0 0 0 0 0 0 Inversiones Financieras Disponibles para la Venta / Financial investments available for sale 0 0 0 0 0 0 0 0 Inversiones Financieras mantenidas hasta el Vencimiento / Financial investments kept to maturity 0 0 0 0 0 0 0 0 Inversiones al Método de Participación / Share method investments 0 0 0 0 0 0 0 0 Otras Inversiones Financieras / Other financial investments 0 0 0 0 461 470 0 0 Otras Cuentas por Cobrar a vinculadas (neto) / Other accounts receivable from relatedcompanies (net) 0 0 0 0 0 0 0 0 Otras Cuentas por Cobrar / Other accounts receivable 0 0 0 0 0 0 329 349 Inmuebles, Maquinaria y Equipo (neto) / Inmovable Property, Machinery and Equipment (net) 8,518 7,725 42,273 42,937 30,817 31,677 35,378 35,938 Activos Intangibles (neto) / Intangible assets (net) 7,079 7,550 358,872 364,126 211 287 12,049 12,465 Activo por Impuesto a la Renta Diferido / Deferred income tax assets 6,773 3,760 0 0 5,327 8,310 524 4,813 Otros Activos / Other assets 211,340 194,322 0 0 0 0 4 4
TOTAL ACTIVO NO CORRIENTE / TOTAL NON-CURRENT ASSETS 233,710 213,357 690,723 668,120 308,873 291,272 183,253 177,148 TOTAL ACTIVO / TOTAL ASSETS 356,654 281,008 790,757 712,028 381,255 350,157 278,308 275,132
Sobregiros Bancarios / Bank overdrafts 0 0 0 0 0 0 0 0 Parte corriente de deudas a largo plazo / Current portion of long-term debt 0 0 35,780 125 0 0 1,688 1,671 Cuentas por Pagar Comerciales / Trade accounts payable 365 1,248 8,569 6,288 1,672 1,461 4,289 1,881 Otras Cuentas por Pagar a vinculadas / Other accounts payable to related companies 13,587 15,166 501 716 0 0 332 541 Dividendos por pagar / Dividends to pay 45,331 0 84,089 0 0 0 20,000 0 Impuesto a la Renta y Participaciones Corrientes / Current income tax and profit sharing 40,316 6,153 19,312 18,947 3,016 10,711 8,264 30,503 Otras Cuentas por Pagar / Other accounts payable 38,366 32,175 34,980 33,603 42,063 46,836 42,932 44,745 Beneficios sociales a los trabajadores / Worker's fringe benefits 1,654 788 1,633 667 1,642 652 1,317 556 Provisión por negligencia / Provisions for negligence 242 34 10 7 0 0 633 0 Provisiones / Provisions 167 0 0 0 0 0 0 0
TOTAL PASIVO CORRIENTE / TOTAL CURRENT LIABILITIES 140,028 55,564 184,874 60,353 48,393 59,660 79,455 79,897 Deudas a largo plazo / Long-term debts 0 0 65,075 76,188 0 0 3,459 3,933 Otras Cuentas por Pagar a vinculadas / Other accounts payable to related companies 0 0 0 0 0 0 0 0 Pasivo por Impuesto a la Renta Diferido / Deferred income tax liabilities 0 0 65,767 60,064 20,414 14,771 0 0 Otras Cuentas por Pagar / Other accounts payable 0 6,605 0 0 0 0 0 0 Otras Provisiones / Others Provisions 0 0 0 0 0 0 0 0
TOTAL PASIVO NO CORRIENTE / TOTAL NON-CURRENT LIABILITIES 0 6,605 130,842 136,252 20,414 14,771 3,459 3,933 TOTAL PASIVO / TOTAL LIABILITIES 140,028 62,169 315,716 196,605 68,807 74,431 82,914 83,830
Capital / Capital 22,656 22,656 322,732 322,732 38,700 38,700 19,291 19,291 Capital Adicional / Additional capital 0 0 0 0 0 0 0 0 Excedente de revaluación / Revaluation surplus 0 0 0 0 0 0 0 0 Resultados no Realizados / Unachieved earnings 120,522 100,989 103,855 84,932 154,080 138,510 71,904 63,825 Reservas Legales / Legal reserves 4,531 4,531 23,670 14,327 7,748 7,748 3,858 3,858 Otras Reservas / Other reserves 0 0 0 0 76 76 0 0 Otros / Others 0 0 0 0 0 0 0 0 Resultados Acumulados / Retained earnings 45,331 90,663 0 7,949 90,693 4,188 84,328 56,502 Resultado Neto del ejercicio / Net profit for fiscal year 23,586 0 24,784 85,483 21,151 86,504 16,013 47,826
TOTAL PATRIMONIO NETO / TOTAL NET EQUITY 216,626 218,839 475,041 515,423 312,448 275,726 195,394 191,302 TOTAL PASIVO Y PATRIMONIO NETO / TOTAL LIABILITY AND NET EQUITY 356,654 281,008 790,757 712,028 381,255 350,157 278,308 275,132
ESTADO DE RESULTADOS / INCOME STATEMENT 31/03/2012 31/03/2011 31/03/2012 31/03/2011 31/03/2012 31/03/2011 31/03/2012 31/03/2011 31/03/2012 31/03/2011
Ingreso por Comisiones / Fee income 66,418 56,695 81,073 69,462 71,724 62,942 47,073 41,627 TOTAL DE INGRESOS BRUTOS / TOTAL GROSS INCOME 66,418 56,695 81,073 69,462 71,724 62,942 47,073 41,627
Gastos de Ventas / Sale expenses -10,877 -10,617 -17,255 -14,967 -28,859 -11,291 -9,516 -10,554 Gastos de Administración / Overheads -22,638 -21,692 -25,574 -27,685 -12,190 -21,875 -15,642 -13,588
UTILIDAD OPERATIVA / OPERATING PROFIT 32,903 24,386 38,244 26,810 30,675 29,776 21,915 17,485 Utilidad (pérdida) del encaje legal / Profit (loss) from legal reserve 0 0 0 0 0 0 0 0 Utilidad (pérdida) del fondo compensatorio / Profit (loss) from the compensation fund 0 0 0 0 0 0 0 0 Utilidad (pérdida) del fondo de longevidad / Profit (loss) from the longevity fund 0 0 0 0 0 0 0 0 Utilidad (pérdida) en venta de activos / Profit (loss) from asset sales 0 0 1 1 0 -236 0 -6 Ingresos Financieros / Financial income 1,188 1,071 1,655 1,647 723 979 932 418 Gastos Financieros / Financial expenses -7 -3 -1,360 -2,366 -638 -690 -237 -278 Otros Ingresos (egresos) / Other income (expenses) 95 453 937 645 296 2,009 512 725
RESULTADO ANTES DEL IMPUESTO A LA RENTA / RESULT BEFORE INCOME TAX 34,179 25,907 39,477 26,737 31,056 31,838 23,122 18,344 Impuesto a la Renta / Income Tax -10,593 -8,390 -14,693 -7,877 -9,905 -9,628 -7,109 -5,640
UTILIDAD (PERDIDA) NETA DEL EJERCICIO / PERIOD'S NET PROFIT (LOSS) 23,586 17,517 24,784 18,860 21,151 22,210 16,013 12,704
INDICADORES FINANCIEROS / FINANCIAL RATIOSLiquidez / Liquid Ratio 0.88 0.54 1.50 1.20 Rotación en Activos / Gross Sales to Total Assets 0.19 0.10 0.19 0.17 Solvencia / Solvency 0.39 0.40 0.18 0.30 Deuda / Patrimonio / Debt / Equity 0.65 0.66 0.22 0.42 Rentabilidad de Capital % / Return on capital % 104.10 7.68 54.65 83.01 Rentabilidad sobre Activos % / Return on Assets % 6.61 3.13 5.55 5.75 Rentabilidad de Patrimonio % / Return on Equity % 10.89 5.22 6.77 8.20
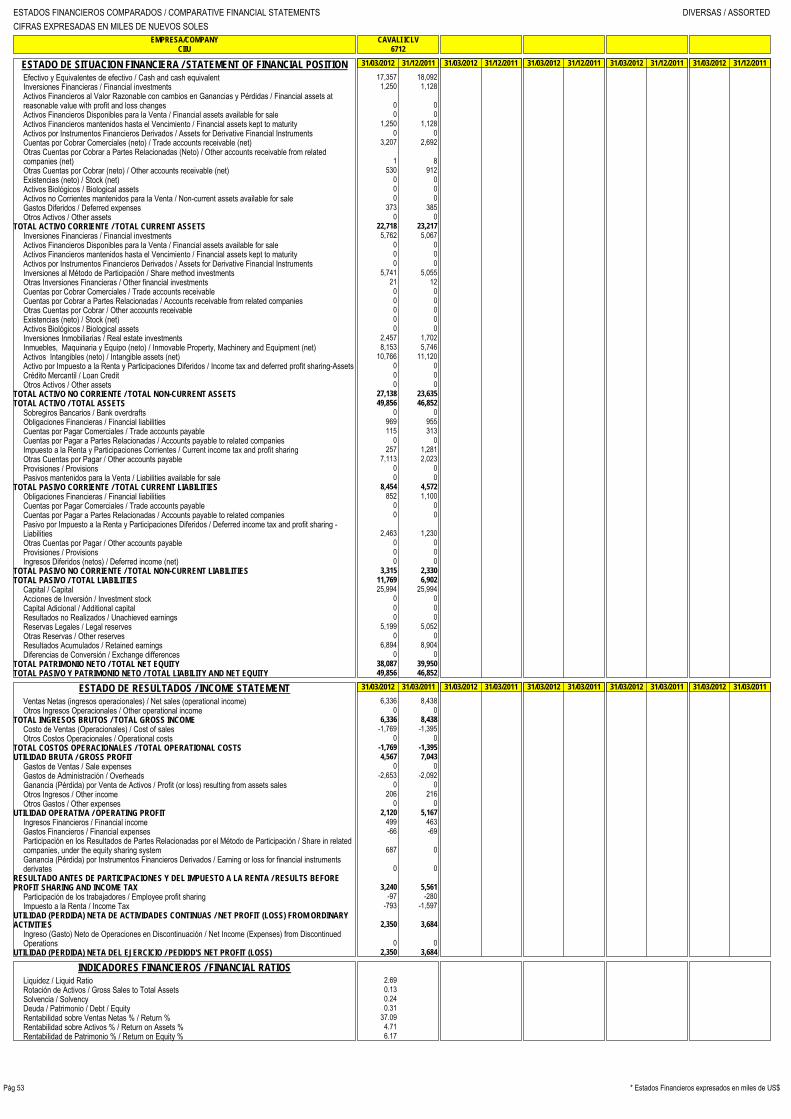
ESTADOS FINANCIEROS COMPARADOS / COMPARATIVE FINANCIAL STATEMENTS DIVERSAS / ASSORTEDCIFRAS EXPRESADAS EN MILES DE NUEVOS SOLES
EMPRESA/COMPANY
CAVALI ICLV
CIIU
6712
Pág 53 * Estados Financieros expresados en miles de US$
ESTADO DE SITUACION FINANCIERA / STATEMENT OF FINANCIAL POSITION 31/03/2012 31/12/2011 31/03/2012 31/12/2011 31/03/2012 31/12/2011 31/03/2012 31/12/2011 31/03/2012 31/12/2011
Efectivo y Equivalentes de efectivo / Cash and cash equivalent 17,357 18,092 Inversiones Financieras / Financial investments 1,250 1,128 Activos Financieros al Valor Razonable con cambios en Ganancias y Pérdidas / Financial assets atreasonable value with profit and loss changes 0 0 Activos Financieros Disponibles para la Venta / Financial assets available for sale 0 0 Activos Financieros mantenidos hasta el Vencimiento / Financial assets kept to maturity 1,250 1,128 Activos por Instrumentos Financieros Derivados / Assets for Derivative Financial Instruments 0 0 Cuentas por Cobrar Comerciales (neto) / Trade accounts receivable (net) 3,207 2,692 Otras Cuentas por Cobrar a Partes Relacionadas (Neto) / Other accounts receivable from relatedcompanies (net) 1 8 Otras Cuentas por Cobrar (neto) / Other accounts receivable (net) 530 912 Existencias (neto) / Stock (net) 0 0 Activos Biológicos / Biological assets 0 0 Activos no Corrientes mantenidos para la Venta / Non-current assets available for sale 0 0 Gastos Diferidos / Deferred expenses 373 385 Otros Activos / Other assets 0 0
TOTAL ACTIVO CORRIENTE / TOTAL CURRENT ASSETS 22,718 23,217 Inversiones Financieras / Financial investments 5,762 5,067 Activos Financieros Disponibles para la Venta / Financial assets available for sale 0 0 Activos Financieros mantenidos hasta el Vencimiento / Financial assets kept to maturity 0 0 Activos por Instrumentos Financieros Derivados / Assets for Derivative Financial Instruments 0 0 Inversiones al Método de Participación / Share method investments 5,741 5,055 Otras Inversiones Financieras / Other financial investments 21 12 Cuentas por Cobrar Comerciales / Trade accounts receivable 0 0 Cuentas por Cobrar a Partes Relacionadas / Accounts receivable from related companies 0 0 Otras Cuentas por Cobrar / Other accounts receivable 0 0 Existencias (neto) / Stock (net) 0 0 Activos Biológicos / Biological assets 0 0 Inversiones Inmobiliarias / Real estate investments 2,457 1,702 Inmuebles, Maquinaria y Equipo (neto) / Inmovable Property, Machinery and Equipment (net) 8,153 5,746 Activos Intangibles (neto) / Intangible assets (net) 10,766 11,120 Activo por Impuesto a la Renta y Participaciones Diferidos / Income tax and deferred profit sharing-Assets 0 0 Crédito Mercantil / Loan Credit 0 0 Otros Activos / Other assets 0 0
TOTAL ACTIVO NO CORRIENTE / TOTAL NON-CURRENT ASSETS 27,138 23,635 TOTAL ACTIVO / TOTAL ASSETS 49,856 46,852
Sobregiros Bancarios / Bank overdrafts 0 0 Obligaciones Financieras / Financial liabilities 969 955 Cuentas por Pagar Comerciales / Trade accounts payable 115 313 Cuentas por Pagar a Partes Relacionadas / Accounts payable to related companies 0 0 Impuesto a la Renta y Participaciones Corrientes / Current income tax and profit sharing 257 1,281 Otras Cuentas por Pagar / Other accounts payable 7,113 2,023 Provisiones / Provisions 0 0 Pasivos mantenidos para la Venta / Liabilities available for sale 0 0
TOTAL PASIVO CORRIENTE / TOTAL CURRENT LIABILITIES 8,454 4,572 Obligaciones Financieras / Financial liabilities 852 1,100 Cuentas por Pagar Comerciales / Trade accounts payable 0 0 Cuentas por Pagar a Partes Relacionadas / Accounts payable to related companies 0 0 Pasivo por Impuesto a la Renta y Participaciones Diferidos / Deferred income tax and profit sharing -Liabilities 2,463 1,230 Otras Cuentas por Pagar / Other accounts payable 0 0 Provisiones / Provisions 0 0 Ingresos Diferidos (netos) / Deferred income (net) 0 0
TOTAL PASIVO NO CORRIENTE / TOTAL NON-CURRENT LIABILITIES 3,315 2,330 TOTAL PASIVO / TOTAL LIABILITIES 11,769 6,902
Capital / Capital 25,994 25,994 Acciones de Inversión / Investment stock 0 0 Capital Adicional / Additional capital 0 0 Resultados no Realizados / Unachieved earnings 0 0 Reservas Legales / Legal reserves 5,199 5,052 Otras Reservas / Other reserves 0 0 Resultados Acumulados / Retained earnings 6,894 8,904 Diferencias de Conversión / Exchange differences 0 0
TOTAL PATRIMONIO NETO / TOTAL NET EQUITY 38,087 39,950 TOTAL PASIVO Y PATRIMONIO NETO / TOTAL LIABILITY AND NET EQUITY 49,856 46,852
ESTADO DE RESULTADOS / INCOME STATEMENT 31/03/2012 31/03/2011 31/03/2012 31/03/2011 31/03/2012 31/03/2011 31/03/2012 31/03/2011 31/03/2012 31/03/2011
Ventas Netas (ingresos operacionales) / Net sales (operational income) 6,336 8,438 Otros Ingresos Operacionales / Other operational income 0 0
TOTAL INGRESOS BRUTOS / TOTAL GROSS INCOME 6,336 8,438 Costo de Ventas (Operacionales) / Cost of sales -1,769 -1,395 Otros Costos Operacionales / Operational costs 0 0
TOTAL COSTOS OPERACIONALES / TOTAL OPERATIONAL COSTS -1,769 -1,395 UTILIDAD BRUTA / GROSS PROFIT 4,567 7,043
Gastos de Ventas / Sale expenses 0 0 Gastos de Administración / Overheads -2,653 -2,092 Ganancia (Pérdida) por Venta de Activos / Profit (or loss) resulting from assets sales 0 0 Otros Ingresos / Other income 206 216 Otros Gastos / Other expenses 0 0
UTILIDAD OPERATIVA / OPERATING PROFIT 2,120 5,167 Ingresos Financieros / Financial income 499 463 Gastos Financieros / Financial expenses -66 -69 Participación en los Resultados de Partes Relacionadas por el Método de Participación / Share in relatedcompanies, under the equity sharing system 687 0 Ganancia (Pérdida) por Instrumentos Financieros Derivados / Earning or loss for financial instrumentsderivates 0 0
RESULTADO ANTES DE PARTICIPACIONES Y DEL IMPUESTO A LA RENTA / RESULTS BEFOREPROFIT SHARING AND INCOME TAX 3,240 5,561
Participación de los trabajadores / Employee profit sharing -97 -280 Impuesto a la Renta / Income Tax -793 -1,597
UTILIDAD (PERDIDA) NETA DE ACTIVIDADES CONTINUAS / NET PROFIT (LOSS) FROM ORDINARYACTIVITIES 2,350 3,684
Ingreso (Gasto) Neto de Operaciones en Discontinuación / Net Income (Expenses) from DiscontinuedOperations 0 0
UTILIDAD (PERDIDA) NETA DEL EJERCICIO / PEDIOD'S NET PROFIT (LOSS) 2,350 3,684
INDICADORES FINANCIEROS / FINANCIAL RATIOSLiquidez / Liquid Ratio 2.69 Rotación de Activos / Gross Sales to Total Assets 0.13 Solvencia / Solvency 0.24 Deuda / Patrimonio / Debt / Equity 0.31 Rentabilidad sobre Ventas Netas % / Return % 37.09 Rentabilidad sobre Activos % / Return on Assets % 4.71 Rentabilidad de Patrimonio % / Return on Equity % 6.17

BOLSA DE VALORES DE LIMA LIMA STOCK EXCHANGE
INDICADORES BURSATILES / STOCK MARKET INDICATORS Al 30 de Marzo de 2012 Al 31 de Marzo de 2011
Empresa/Company Valor Acciones en Valor Cotiz. Indice de Valor Precio Acciones en Valor Cotiz. Indice de Valor Precio
Circulación Nominal S/. S/. Lucratividad Contable /VC Circulación Nominal S/. S/. Lucratividad Contable /VC
ADMINISTRADORAS DE FONDOS DE PENSIONES / PENSION FUND ADMINISTRATORS
A.F.P. Horizonte HORIZC1 64,616,488 0.35 -.- 100.00 3.35 M -.- 64,616,488 0.35 -.- 100.00 2.89 M -.-
Prima AFP PRIMAC1 322,732 1,000.00 -.- 100.00 1,471.94 M -.- 350,732 1,000.00 -.- 100.00 1,391.19 M -.-
A.F.P. Integra INTEGRC1 387,000 100.00 -.- 100.00 807.36 M -.- 387,000 100.00 -.- 100.00 869.24 M -.-
Profuturo A.F.P. PROFUTC1 18,126,462 1.00 -.- 100.00 10.78 M -.- 18,126,462 1.00 -.- 100.00 8.84 M -.-
AGRARIO / AGRARIAN
Sintuco SINTUC1 3,459,908 10.00 -.- 100.00 20.99 M -.- 3,459,908 10.00 10.63 100.19 12.72 M 0.84
Chiquitoy CHIQUIC1 177,742 5.00 -.- 100.00 304.67 M -.- 177,742 5.00 8.00 100.00 137.28 M 0.06
San Jacinto SNJACIC1 24,265,283 10.00 11.50 143.75 11.24 M 1.02 28,985,449 10.00 8.00 114.29 7.81 M 1.02 102
SNJACIC2 4,187,503 10.00 11.40 158.33 11.24 M 1.01 4,187,503 10.00 -.- 111.30 7.81 M -.-
El Ingenio INGENIC1 2,968,130 10.00 -.- 100.00 16.44 M -.- 3,372,028 10.00 -.- 100.00 12.73 M -.-
Cartavio CARTAVC1 20,675,896 10.00 30.00 130.43 18.77 M 1.60 20,675,896 10.00 32.20 115.00 17.85 M 1.80
Chucarapi - Pampa Blanca CHUCARC1 2,342,501 24.00 -.- 100.00 28.60 M -.- 2,342,501 24.00 -.- 100.00 15.22 M -.-
Emp. Agr. San Juan ASJUANC1 60,000,000 1.00 0.70 100.00 1.35 M 0.52 60,000,000 1.00 -.- 100.00 1.22 M -.-
Emp. Agro. Pomalca POMALCC1 315,110,369 1.00 0.54 112.50 1.27 M 0.43 315,110,369 1.00 0.57 83.82 1.09 M 0.52
Laredo LAREDOC1 11,563,369 16.56 36.00 150.00 45.33 M 0.79 11,563,369 16.56 39.00 139.29 26.92 M 1.45
Paramonga PARAMOC1 33,270,968 10.00 7.36 112.02 17.54 M 0.42 33,270,968 10.00 8.05 104.55 11.04 M 0.73
Casa Grande CASAGRC1 84,234,550 10.00 17.50 115.51 14.12 M 1.24 84,234,550 10.00 16.30 98.19 12.80 M 1.27
BANCOS Y FINANCIERAS / BANKS
BBVA Banco Continental CONTINC1 1,944,231,963 1.00 6.80 123.41 1.69 M 4.02 1,843,427,288 1.00 7.00 90.91 1.52 M 4.61
BanBif BIFC1 9,718,174 30.00 -.- 100.00 40.08 M -.- 9,249,896 27.45 -.- 100.00 36.13 M -.-
Banco Azteca BAZC1 47,403,915 1.00 -.- 100.00 1.54 M -.- 47,403,915 1.00 -.- 100.00 1.21 M -.-
Banco Financiero FINANCC1 239,441,614 1.00 -.- 100.00 1.24 M -.- 216,501,607 1.00 -.- 137.80 1.12 M -.-
FINANPC1 82,947,458 1.00 -.- 101.92 1.24 M -.- 82,947,458 1.00 0.67 134.00 1.12 M 0.60
Banco Ripley Perú BRIPLEC1 129,847,719 1.00 -.- 100.00 2.22 M -.- 107,767,118 1.00 -.- 100.00 2.25 M -.-
Banco Santander Perú SANC1 231,300,000 1.00 -.- 100.00 1.04 M -.- 150,600,000 1.00 -.- 100.00 0.94 M -.-
Banco de Comercio BANCOMC1 119,197,729 1.00 -.- 100.00 1.21 M -.- 105,730,557 1.00 -.- 100.00 1.19 M -.-
Banco de Crédito CREDITC1 2,557,737,988 1.00 7.50 122.95 2.44 M 3.07 2,557,737,988 1.00 8.30 103.11 2.08 M 3.99
Deutsche Bank Perú DBKPEC1 129,771,744 1.00 -.- 100.00 1.18 M -.- 120,455,202 1.00 -.- 100.00 1.10 M -.-
Financiera Edyficar EDYFIBC1 1,444 100.00 -.- 100.00 158.37 M -.- 1,046 100.00 -.- 100.00 185.56 M -.-
EDYFICC1 223,742 100.00 -.- 100.00 158.37 M -.- 162,066 100.00 -.- 100.00 185.56 M -.-
EDYFIAC1 981,025 100.00 -.- 100.00 158.37 M -.- 710,599 100.00 -.- 100.00 185.56 M -.-
HSBC Bank Perú HSBCC1 550,361,500 1.00 -.- 100.00 0.50 M -.- 479,961,500 1.00 -.- 100.00 0.56 M -.-
INTERBANK INTERBC1 1,172,562,509 1.00 5.10 120.00 1.64 M 3.11 948,669,177 1.00 6.01 96.16 1.62 M 3.71
Mibanco MIBANC1 325,509,813 1.00 -.- 101.50 2.01 M -.- 244,763,869 1.00 -.- 101.25 1.57 M -.-
Scotiabank Perú SCOTIAC1 227,128,755 10.00 41.99 115.04 17.66 M 2.38 154,108,966 10.00 70.00 89.74 21.99 M 3.18
Banco Falabella BANFALC1 250,000,000 1.00 -.- 100.00 1.81 M -.- 200,000,000 1.00 -.- 100.00 2.04 M -.-
Citibank Perú CITIBKC1 443,174,687 1.00 -.- 100.00 1.32 M -.- 443,174,687 1.00 -.- 100.00 1.62 M -.-
Crediscotia CSCOTIC1 32,336,724 9.05 -.- 100.00 15.96 M -.- 21,845,050 9.05 -.- 100.00 16.86 M -.-
Mitsui Auto Finance Perú MITSUFC1 41,647 1,000.00 -.- 100.00 1,070.23 M -.- 14,127 1,000.00 -.- 100.00 1,152.05 M -.-
Amérika Financiera AMERFIC1 78,585,983 1.00 -.- 100.00 1.11 M -.- 76,324,315 1.00 -.- 100.00 1.11 M -.-
Financiera Confianza CONFIC1 57,732,588 1.09 -.- 100.00 1.50 M -.- -.- -.- -.- -.- 1.26 M -.-
Financiera Efectiva EFECTIC1 37,000,000 1.00 -.- 100.00 1.55 M -.- 19,064,014 1.00 -.- 100.00 1.81 M -.-
Caja Nuestra Gente CGENTEC1 3,123,562 42.10 -.- 100.00 68.32 M -.- 2,002,843 40.00 -.- 100.00 92.50 M -.-
Financiera TFC FINTFCC1 35,517,188 1.00 -.- 100.00 1.18 M -.- 31,714,009 1.00 -.- 100.00 1.24 M -.-
Financiera Universal UNIVERC1 62,559,223 1.00 -.- 100.00 0.68 M -.- 62,559,223 1.00 -.- 100.00 0.79 M -.-
Financiera Uno FINUNOC1 119,898,274 1.00 -.- 100.00 0.81 M -.- 88,262,936 1.00 -.- 100.00 0.82 M -.-
Financiera Crear FCREARC1 4,542,758 10.00 -.- 100.00 17.53 M -.- 3,681,155 10.00 -.- 100.00 17.97 M -.-
DIVERSAS / ASSORTED
Leasing Total LTOTALC1 219,055 100.00 -.- 100.00 109.25 M -.- 144,589 100.00 -.- 100.00 108.66 M -.-
Incasa EAH INCASAC1 21,054,200 1.00 -.- 100.00 0.78 M -.- 21,054,200 1.00 -.- 100.00 0.88 M -.-
Solución EAH SOLUCIC1 2,267 10,000.00 -.- 100.00 16,144.68 M -.- 2,132 10,000.00 -.- 100.00 15,272.98 M -.-
CREDICORP LTD. (*)(**) BAP 94,382,317 5.00 131.15 120.05 37.82 M 3.47 94,382,317 5.00 105.70 89.20 30.25 M 3.49
Intercorp Peru (ant. IFH)(***) IFH 134,117,023 1.00 -.- 100.00 -.- -.- 134,117,023 1.00 -.- 100.00 6.37 M -.-
Intergroup(****) IFS -.- -.- 33.00 127.91 -.- -.- -.- -.- 28.90 80.06 -.- -.-
Leasing Perú LPERUC1 41,705,348 1.00 -.- 100.00 0.85 M -.- 41,705,348 1.00 -.- 100.00 0.92 M -.-
Transac. Financieras TRANFIC1 22,722,139 1.00 -.- 100.00 1.25 M -.- 22,722,139 1.00 -.- 100.00 1.54 M -.-
Lima Gas LIMGASC1 866,973 18.78 -.- 100.00 92.55 M -.- 866,973 18.78 -.- 100.00 52.66 M -.-
Bayer BAYERI1 897,140 1.00 -.- 100.00 33.83 M -.- 897,140 1.00 11.00 122.22 27.49 M 0.40
Ferreycorp FERREYC1 698,402,606 1.00 3.09 136.14 1.59 M 1.94 482,691,963 1.10 3.80 89.41 1.58 M 2.41
Supermercados Peruanos SUPERC1 316,685,551 1.00 -.- 100.00 1.66 M -.- 306,678,288 1.00 -.- 100.00 1.35 M -.-
Saga Falabella SAGAC1 250,000,000 1.00 6.10 143.53 2.00 M 3.05 99,275,445 1.00 14.00 100.00 5.00 M 2.80
Total Artefactos TOTALC1 35,242,321 1.00 1.00 14.86 1.75 M 0.57 -.- -.- -.- -.- -.- -.-
Maestro Perú MAESTRC1 71,496,706 1.00 -.- 100.00 2.38 M -.- 71,496,706 1.00 -.- 100.00 1.84 M -.-
INTURSA INTURSC1 80,669,715 10.00 4.50 100.00 10.10 M 0.45 77,169,715 10.00 -.- 102.04 9.83 M -.-
Inversiones La Rioja LARIOJC1 76,535,000 1.00 -.- 100.00 3.49 M -.- 76,535,000 1.00 -.- 100.00 2.67 M -.-
INVERTUR INVERTC1 21,722,635 1.00 -.- 100.00 1.52 M -.- 21,722,635 1.00 -.- 100.00 1.41 M -.-
(*) Información financiera en US$ (**) VN, VC y Cotización en US$ (***) VN en US$ (****) Sin VN y Cotización en US$
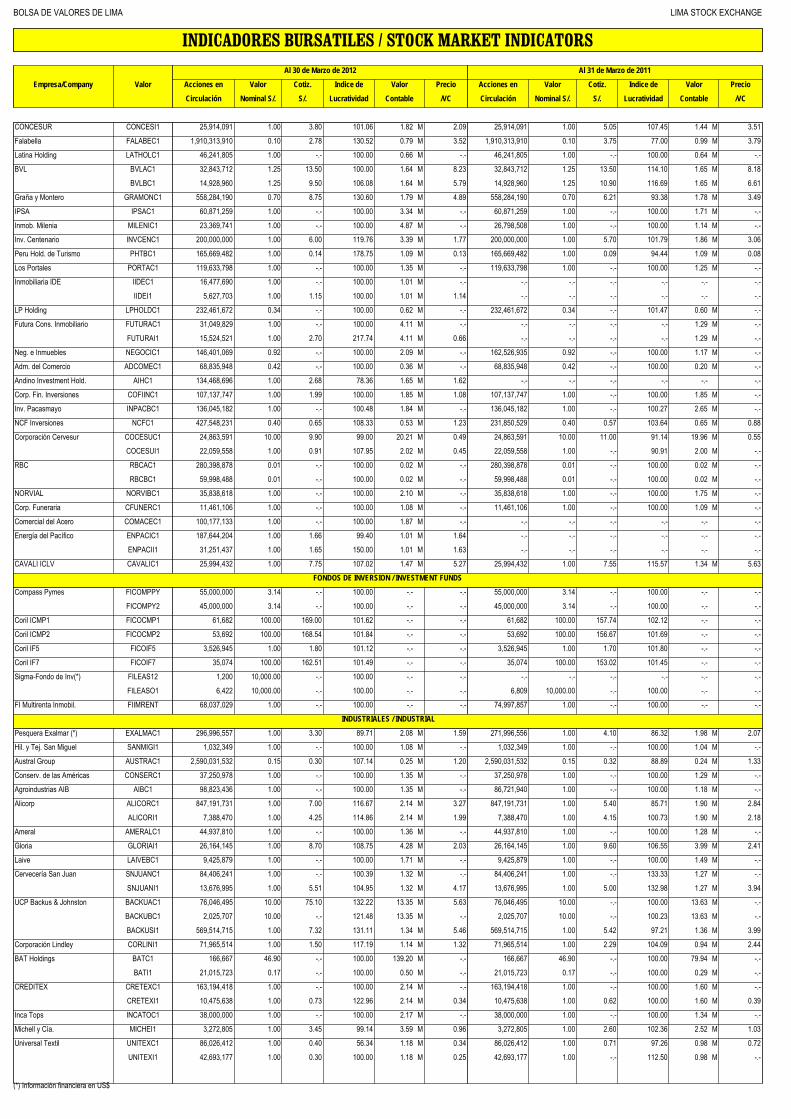
BOLSA DE VALORES DE LIMA LIMA STOCK EXCHANGE
INDICADORES BURSATILES / STOCK MARKET INDICATORS Al 30 de Marzo de 2012 Al 31 de Marzo de 2011
Empresa/Company Valor Acciones en Valor Cotiz. Indice de Valor Precio Acciones en Valor Cotiz. Indice de Valor Precio
Circulación Nominal S/. S/. Lucratividad Contable /VC Circulación Nominal S/. S/. Lucratividad Contable /VC
CONCESUR CONCESI1 25,914,091 1.00 3.80 101.06 1.82 M 2.09 25,914,091 1.00 5.05 107.45 1.44 M 3.51
Falabella FALABEC1 1,910,313,910 0.10 2.78 130.52 0.79 M 3.52 1,910,313,910 0.10 3.75 77.00 0.99 M 3.79
Latina Holding LATHOLC1 46,241,805 1.00 -.- 100.00 0.66 M -.- 46,241,805 1.00 -.- 100.00 0.64 M -.-
BVL BVLAC1 32,843,712 1.25 13.50 100.00 1.64 M 8.23 32,843,712 1.25 13.50 114.10 1.65 M 8.18
BVLBC1 14,928,960 1.25 9.50 106.08 1.64 M 5.79 14,928,960 1.25 10.90 116.69 1.65 M 6.61
Graña y Montero GRAMONC1 558,284,190 0.70 8.75 130.60 1.79 M 4.89 558,284,190 0.70 6.21 93.38 1.78 M 3.49
IPSA IPSAC1 60,871,259 1.00 -.- 100.00 3.34 M -.- 60,871,259 1.00 -.- 100.00 1.71 M -.-
Inmob. Milenia MILENIC1 23,369,741 1.00 -.- 100.00 4.87 M -.- 26,798,508 1.00 -.- 100.00 1.14 M -.-
Inv. Centenario INVCENC1 200,000,000 1.00 6.00 119.76 3.39 M 1.77 200,000,000 1.00 5.70 101.79 1.86 M 3.06
Peru Hold. de Turismo PHTBC1 165,669,482 1.00 0.14 178.75 1.09 M 0.13 165,669,482 1.00 0.09 94.44 1.09 M 0.08
Los Portales PORTAC1 119,633,798 1.00 -.- 100.00 1.35 M -.- 119,633,798 1.00 -.- 100.00 1.25 M -.-
Inmobiliaria IDE IIDEC1 16,477,690 1.00 -.- 100.00 1.01 M -.- -.- -.- -.- -.- -.- -.-
IIDEI1 5,627,703 1.00 1.15 100.00 1.01 M 1.14 -.- -.- -.- -.- -.- -.-
LP Holding LPHOLDC1 232,461,672 0.34 -.- 100.00 0.62 M -.- 232,461,672 0.34 -.- 101.47 0.60 M -.-
Futura Cons. Inmobiliario FUTURAC1 31,049,829 1.00 -.- 100.00 4.11 M -.- -.- -.- -.- -.- 1.29 M -.-
FUTURAI1 15,524,521 1.00 2.70 217.74 4.11 M 0.66 -.- -.- -.- -.- 1.29 M -.-
Neg. e Inmuebles NEGOCIC1 146,401,069 0.92 -.- 100.00 2.09 M -.- 162,526,935 0.92 -.- 100.00 1.17 M -.-
Adm. del Comercio ADCOMEC1 68,835,948 0.42 -.- 100.00 0.36 M -.- 68,835,948 0.42 -.- 100.00 0.20 M -.-
Andino Investment Hold. AIHC1 134,468,696 1.00 2.68 78.36 1.65 M 1.62 -.- -.- -.- -.- -.- -.-
Corp. Fin. Inversiones COFIINC1 107,137,747 1.00 1.99 100.00 1.85 M 1.08 107,137,747 1.00 -.- 100.00 1.85 M -.-
Inv. Pacasmayo INPACBC1 136,045,182 1.00 -.- 100.48 1.84 M -.- 136,045,182 1.00 -.- 100.27 2.65 M -.-
NCF Inversiones NCFC1 427,548,231 0.40 0.65 108.33 0.53 M 1.23 231,850,529 0.40 0.57 103.64 0.65 M 0.88
Corporación Cervesur COCESUC1 24,863,591 10.00 9.90 99.00 20.21 M 0.49 24,863,591 10.00 11.00 91.14 19.96 M 0.55
COCESUI1 22,059,558 1.00 0.91 107.95 2.02 M 0.45 22,059,558 1.00 -.- 90.91 2.00 M -.-
RBC RBCAC1 280,398,878 0.01 -.- 100.00 0.02 M -.- 280,398,878 0.01 -.- 100.00 0.02 M -.-
RBCBC1 59,998,488 0.01 -.- 100.00 0.02 M -.- 59,998,488 0.01 -.- 100.00 0.02 M -.-
NORVIAL NORVIBC1 35,838,618 1.00 -.- 100.00 2.10 M -.- 35,838,618 1.00 -.- 100.00 1.75 M -.-
Corp. Funeraria CFUNERC1 11,461,106 1.00 -.- 100.00 1.08 M -.- 11,461,106 1.00 -.- 100.00 1.09 M -.-
Comercial del Acero COMACEC1 100,177,133 1.00 -.- 100.00 1.87 M -.- -.- -.- -.- -.- -.- -.-
Energía del Pacífico ENPACIC1 187,644,204 1.00 1.66 99.40 1.01 M 1.64 -.- -.- -.- -.- -.- -.-
ENPACII1 31,251,437 1.00 1.65 150.00 1.01 M 1.63 -.- -.- -.- -.- -.- -.-
CAVALI ICLV CAVALIC1 25,994,432 1.00 7.75 107.02 1.47 M 5.27 25,994,432 1.00 7.55 115.57 1.34 M 5.63
FONDOS DE INVERSION / INVESTMENT FUNDS
Compass Pymes FICOMPPY 55,000,000 3.14 -.- 100.00 -.- -.- 55,000,000 3.14 -.- 100.00 -.- -.-
FICOMPY2 45,000,000 3.14 -.- 100.00 -.- -.- 45,000,000 3.14 -.- 100.00 -.- -.-
Coril ICMP1 FICOCMP1 61,682 100.00 169.00 101.62 -.- -.- 61,682 100.00 157.74 102.12 -.- -.-
Coril ICMP2 FICOCMP2 53,692 100.00 168.54 101.84 -.- -.- 53,692 100.00 156.67 101.69 -.- -.-
Coril IF5 FICOIF5 3,526,945 1.00 1.80 101.12 -.- -.- 3,526,945 1.00 1.70 101.80 -.- -.-
Coril IF7 FICOIF7 35,074 100.00 162.51 101.49 -.- -.- 35,074 100.00 153.02 101.45 -.- -.-
Sigma-Fondo de Inv(*) FILEAS12 1,200 10,000.00 -.- 100.00 -.- -.- -.- -.- -.- -.- -.- -.-
FILEASO1 6,422 10,000.00 -.- 100.00 -.- -.- 6,809 10,000.00 -.- 100.00 -.- -.-
FI Multirenta Inmobil. FIIMRENT 68,037,029 1.00 -.- 100.00 -.- -.- 74,997,857 1.00 -.- 100.00 -.- -.-
INDUSTRIALES / INDUSTRIAL
Pesquera Exalmar (*) EXALMAC1 296,996,557 1.00 3.30 89.71 2.08 M 1.59 271,996,556 1.00 4.10 86.32 1.98 M 2.07
Hil. y Tej. San Miguel SANMIGI1 1,032,349 1.00 -.- 100.00 1.08 M -.- 1,032,349 1.00 -.- 100.00 1.04 M -.-
Austral Group AUSTRAC1 2,590,031,532 0.15 0.30 107.14 0.25 M 1.20 2,590,031,532 0.15 0.32 88.89 0.24 M 1.33
Conserv. de las Américas CONSERC1 37,250,978 1.00 -.- 100.00 1.35 M -.- 37,250,978 1.00 -.- 100.00 1.29 M -.-
Agroindustrias AIB AIBC1 98,823,436 1.00 -.- 100.00 1.35 M -.- 86,721,940 1.00 -.- 100.00 1.18 M -.-
Alicorp ALICORC1 847,191,731 1.00 7.00 116.67 2.14 M 3.27 847,191,731 1.00 5.40 85.71 1.90 M 2.84
ALICORI1 7,388,470 1.00 4.25 114.86 2.14 M 1.99 7,388,470 1.00 4.15 100.73 1.90 M 2.18
Ameral AMERALC1 44,937,810 1.00 -.- 100.00 1.36 M -.- 44,937,810 1.00 -.- 100.00 1.28 M -.-
Gloria GLORIAI1 26,164,145 1.00 8.70 108.75 4.28 M 2.03 26,164,145 1.00 9.60 106.55 3.99 M 2.41
Laive LAIVEBC1 9,425,879 1.00 -.- 100.00 1.71 M -.- 9,425,879 1.00 -.- 100.00 1.49 M -.-
Cervecería San Juan SNJUANC1 84,406,241 1.00 -.- 100.39 1.32 M -.- 84,406,241 1.00 -.- 133.33 1.27 M -.-
SNJUANI1 13,676,995 1.00 5.51 104.95 1.32 M 4.17 13,676,995 1.00 5.00 132.98 1.27 M 3.94
UCP Backus & Johnston BACKUAC1 76,046,495 10.00 75.10 132.22 13.35 M 5.63 76,046,495 10.00 -.- 100.00 13.63 M -.-
BACKUBC1 2,025,707 10.00 -.- 121.48 13.35 M -.- 2,025,707 10.00 -.- 100.23 13.63 M -.-
BACKUSI1 569,514,715 1.00 7.32 131.11 1.34 M 5.46 569,514,715 1.00 5.42 97.21 1.36 M 3.99
Corporación Lindley CORLINI1 71,965,514 1.00 1.50 117.19 1.14 M 1.32 71,965,514 1.00 2.29 104.09 0.94 M 2.44
BAT Holdings BATC1 166,667 46.90 -.- 100.00 139.20 M -.- 166,667 46.90 -.- 100.00 79.94 M -.-
BATI1 21,015,723 0.17 -.- 100.00 0.50 M -.- 21,015,723 0.17 -.- 100.00 0.29 M -.-
CREDITEX CRETEXC1 163,194,418 1.00 -.- 100.00 2.14 M -.- 163,194,418 1.00 -.- 100.00 1.60 M -.-
CRETEXI1 10,475,638 1.00 0.73 122.96 2.14 M 0.34 10,475,638 1.00 0.62 100.00 1.60 M 0.39
Inca Tops INCATOC1 38,000,000 1.00 -.- 100.00 2.17 M -.- 38,000,000 1.00 -.- 100.00 1.34 M -.-
Michell y Cía. MICHEI1 3,272,805 1.00 3.45 99.14 3.59 M 0.96 3,272,805 1.00 2.60 102.36 2.52 M 1.03
Universal Textil UNITEXC1 86,026,412 1.00 0.40 56.34 1.18 M 0.34 86,026,412 1.00 0.71 97.26 0.98 M 0.72
UNITEXI1 42,693,177 1.00 0.30 100.00 1.18 M 0.25 42,693,177 1.00 -.- 112.50 0.98 M -.-
(*) Información financiera en US$
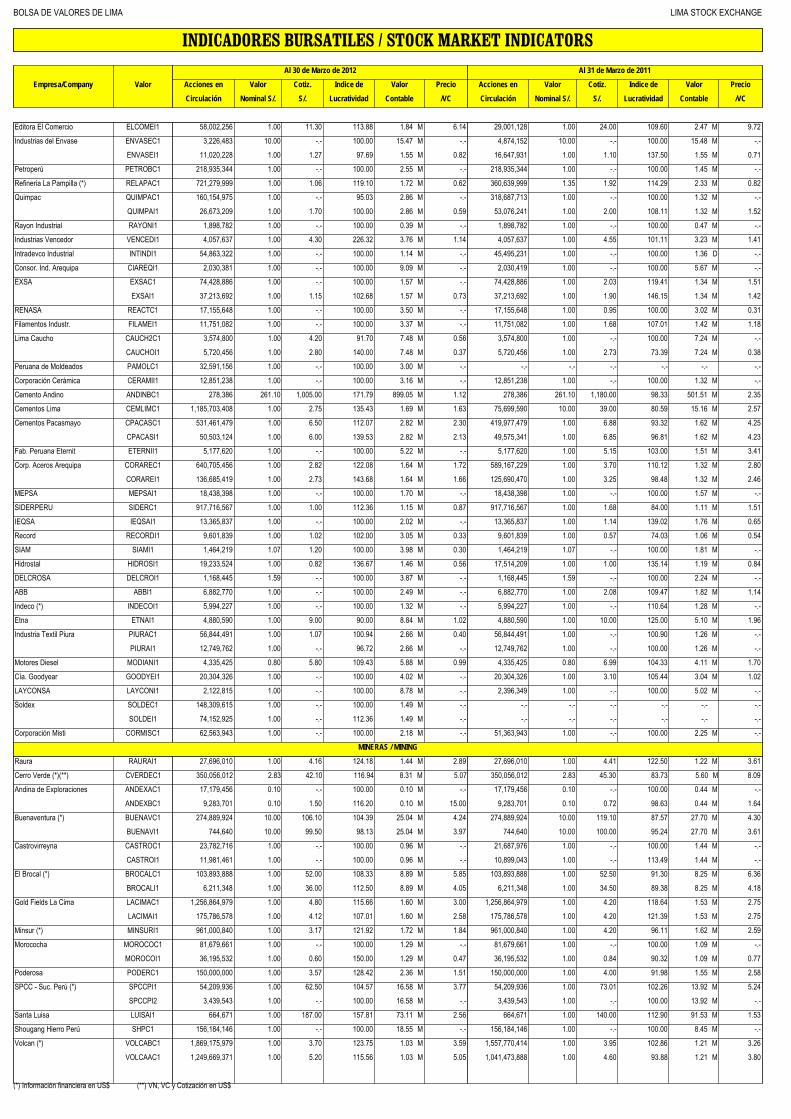
BOLSA DE VALORES DE LIMA LIMA STOCK EXCHANGE
INDICADORES BURSATILES / STOCK MARKET INDICATORS Al 30 de Marzo de 2012 Al 31 de Marzo de 2011
Empresa/Company Valor Acciones en Valor Cotiz. Indice de Valor Precio Acciones en Valor Cotiz. Indice de Valor Precio
Circulación Nominal S/. S/. Lucratividad Contable /VC Circulación Nominal S/. S/. Lucratividad Contable /VC
Editora El Comercio ELCOMEI1 58,002,256 1.00 11.30 113.88 1.84 M 6.14 29,001,128 1.00 24.00 109.60 2.47 M 9.72
Industrias del Envase ENVASEC1 3,226,483 10.00 -.- 100.00 15.47 M -.- 4,874,152 10.00 -.- 100.00 15.48 M -.-
ENVASEI1 11,020,228 1.00 1.27 97.69 1.55 M 0.82 16,647,931 1.00 1.10 137.50 1.55 M 0.71
Petroperú PETROBC1 218,935,344 1.00 -.- 100.00 2.55 M -.- 218,935,344 1.00 -.- 100.00 1.45 M -.-
Refineria La Pampilla (*) RELAPAC1 721,279,999 1.00 1.06 119.10 1.72 M 0.62 360,639,999 1.35 1.92 114.29 2.33 M 0.82
Quimpac QUIMPAC1 160,154,975 1.00 -.- 95.03 2.86 M -.- 318,687,713 1.00 -.- 100.00 1.32 M -.-
QUIMPAI1 26,673,209 1.00 1.70 100.00 2.86 M 0.59 53,076,241 1.00 2.00 108.11 1.32 M 1.52
Rayon Industrial RAYONI1 1,898,782 1.00 -.- 100.00 0.39 M -.- 1,898,782 1.00 -.- 100.00 0.47 M -.-
Industrias Vencedor VENCEDI1 4,057,637 1.00 4.30 226.32 3.76 M 1.14 4,057,637 1.00 4.55 101.11 3.23 M 1.41
Intradevco Industrial INTINDI1 54,863,322 1.00 -.- 100.00 1.14 M -.- 45,495,231 1.00 -.- 100.00 1.36 D -.-
Consor. Ind. Arequipa CIAREQI1 2,030,381 1.00 -.- 100.00 9.09 M -.- 2,030,419 1.00 -.- 100.00 5.67 M -.-
EXSA EXSAC1 74,428,886 1.00 -.- 100.00 1.57 M -.- 74,428,886 1.00 2.03 119.41 1.34 M 1.51
EXSAI1 37,213,692 1.00 1.15 102.68 1.57 M 0.73 37,213,692 1.00 1.90 146.15 1.34 M 1.42
RENASA REACTC1 17,155,648 1.00 -.- 100.00 3.50 M -.- 17,155,648 1.00 0.95 100.00 3.02 M 0.31
Filamentos Industr. FILAMEI1 11,751,082 1.00 -.- 100.00 3.37 M -.- 11,751,082 1.00 1.68 107.01 1.42 M 1.18
Lima Caucho CAUCH2C1 3,574,800 1.00 4.20 91.70 7.48 M 0.56 3,574,800 1.00 -.- 100.00 7.24 M -.-
CAUCHOI1 5,720,456 1.00 2.80 140.00 7.48 M 0.37 5,720,456 1.00 2.73 73.39 7.24 M 0.38
Peruana de Moldeados PAMOLC1 32,591,156 1.00 -.- 100.00 3.00 M -.- -.- -.- -.- -.- -.- -.-
Corporación Cerámica CERAMII1 12,851,238 1.00 -.- 100.00 3.16 M -.- 12,851,238 1.00 -.- 100.00 1.32 M -.-
Cemento Andino ANDINBC1 278,386 261.10 1,005.00 171.79 899.05 M 1.12 278,386 261.10 1,180.00 98.33 501.51 M 2.35
Cementos Lima CEMLIMC1 1,185,703,408 1.00 2.75 135.43 1.69 M 1.63 75,699,590 10.00 39.00 80.59 15.16 M 2.57
Cementos Pacasmayo CPACASC1 531,461,479 1.00 6.50 112.07 2.82 M 2.30 419,977,479 1.00 6.88 93.32 1.62 M 4.25
CPACASI1 50,503,124 1.00 6.00 139.53 2.82 M 2.13 49,575,341 1.00 6.85 96.81 1.62 M 4.23
Fab. Peruana Eternit ETERNII1 5,177,620 1.00 -.- 100.00 5.22 M -.- 5,177,620 1.00 5.15 103.00 1.51 M 3.41
Corp. Aceros Arequipa CORAREC1 640,705,456 1.00 2.82 122.08 1.64 M 1.72 589,167,229 1.00 3.70 110.12 1.32 M 2.80
CORAREI1 136,685,419 1.00 2.73 143.68 1.64 M 1.66 125,690,470 1.00 3.25 98.48 1.32 M 2.46
MEPSA MEPSAI1 18,438,398 1.00 -.- 100.00 1.70 M -.- 18,438,398 1.00 -.- 100.00 1.57 M -.-
SIDERPERU SIDERC1 917,716,567 1.00 1.00 112.36 1.15 M 0.87 917,716,567 1.00 1.68 84.00 1.11 M 1.51
IEQSA IEQSAI1 13,365,837 1.00 -.- 100.00 2.02 M -.- 13,365,837 1.00 1.14 139.02 1.76 M 0.65
Record RECORDI1 9,601,839 1.00 1.02 102.00 3.05 M 0.33 9,601,839 1.00 0.57 74.03 1.06 M 0.54
SIAM SIAMI1 1,464,219 1.07 1.20 100.00 3.98 M 0.30 1,464,219 1.07 -.- 100.00 1.81 M -.-
Hidrostal HIDROSI1 19,233,524 1.00 0.82 136.67 1.46 M 0.56 17,514,209 1.00 1.00 135.14 1.19 M 0.84
DELCROSA DELCROI1 1,168,445 1.59 -.- 100.00 3.87 M -.- 1,168,445 1.59 -.- 100.00 2.24 M -.-
ABB ABBI1 6,882,770 1.00 -.- 100.00 2.49 M -.- 6,882,770 1.00 2.08 109.47 1.82 M 1.14
Indeco (*) INDECOI1 5,994,227 1.00 -.- 100.00 1.32 M -.- 5,994,227 1.00 -.- 110.64 1.28 M -.-
Etna ETNAI1 4,880,590 1.00 9.00 90.00 8.84 M 1.02 4,880,590 1.00 10.00 125.00 5.10 M 1.96
Industria Textil Piura PIURAC1 56,844,491 1.00 1.07 100.94 2.66 M 0.40 56,844,491 1.00 -.- 100.90 1.26 M -.-
PIURAI1 12,749,762 1.00 -.- 96.72 2.66 M -.- 12,749,762 1.00 -.- 100.00 1.26 M -.-
Motores Diesel MODIANI1 4,335,425 0.80 5.80 109.43 5.88 M 0.99 4,335,425 0.80 6.99 104.33 4.11 M 1.70
Cía. Goodyear GOODYEI1 20,304,326 1.00 -.- 100.00 4.02 M -.- 20,304,326 1.00 3.10 105.44 3.04 M 1.02
LAYCONSA LAYCONI1 2,122,815 1.00 -.- 100.00 8.78 M -.- 2,396,349 1.00 -.- 100.00 5.02 M -.-
Soldex SOLDEC1 148,309,615 1.00 -.- 100.00 1.49 M -.- -.- -.- -.- -.- -.- -.-
SOLDEI1 74,152,925 1.00 -.- 112.36 1.49 M -.- -.- -.- -.- -.- -.- -.-
Corporación Misti CORMISC1 62,563,943 1.00 -.- 100.00 2.18 M -.- 51,363,943 1.00 -.- 100.00 2.25 M -.-
MINERAS / MINING
Raura RAURAI1 27,696,010 1.00 4.16 124.18 1.44 M 2.89 27,696,010 1.00 4.41 122.50 1.22 M 3.61
Cerro Verde (*)(**) CVERDEC1 350,056,012 2.83 42.10 116.94 8.31 M 5.07 350,056,012 2.83 45.30 83.73 5.60 M 8.09
Andina de Exploraciones ANDEXAC1 17,179,456 0.10 -.- 100.00 0.10 M -.- 17,179,456 0.10 -.- 100.00 0.44 M -.-
ANDEXBC1 9,283,701 0.10 1.50 116.20 0.10 M 15.00 9,283,701 0.10 0.72 98.63 0.44 M 1.64
Buenaventura (*) BUENAVC1 274,889,924 10.00 106.10 104.39 25.04 M 4.24 274,889,924 10.00 119.10 87.57 27.70 M 4.30
BUENAVI1 744,640 10.00 99.50 98.13 25.04 M 3.97 744,640 10.00 100.00 95.24 27.70 M 3.61
Castrovirreyna CASTROC1 23,782,716 1.00 -.- 100.00 0.96 M -.- 21,687,976 1.00 -.- 100.00 1.44 M -.-
CASTROI1 11,981,461 1.00 -.- 100.00 0.96 M -.- 10,899,043 1.00 -.- 113.49 1.44 M -.-
El Brocal (*) BROCALC1 103,893,888 1.00 52.00 108.33 8.89 M 5.85 103,893,888 1.00 52.50 91.30 8.25 M 6.36
BROCALI1 6,211,348 1.00 36.00 112.50 8.89 M 4.05 6,211,348 1.00 34.50 89.38 8.25 M 4.18
Gold Fields La Cima LACIMAC1 1,256,864,979 1.00 4.80 115.66 1.60 M 3.00 1,256,864,979 1.00 4.20 118.64 1.53 M 2.75
LACIMAI1 175,786,578 1.00 4.12 107.01 1.60 M 2.58 175,786,578 1.00 4.20 121.39 1.53 M 2.75
Minsur (*) MINSURI1 961,000,840 1.00 3.17 121.92 1.72 M 1.84 961,000,840 1.00 4.20 96.11 1.62 M 2.59
Morococha MOROCOC1 81,679,661 1.00 -.- 100.00 1.29 M -.- 81,679,661 1.00 -.- 100.00 1.09 M -.-
MOROCOI1 36,195,532 1.00 0.60 150.00 1.29 M 0.47 36,195,532 1.00 0.84 90.32 1.09 M 0.77
Poderosa PODERC1 150,000,000 1.00 3.57 128.42 2.36 M 1.51 150,000,000 1.00 4.00 91.98 1.55 M 2.58
SPCC - Suc. Perú (*) SPCCPI1 54,209,936 1.00 62.50 104.57 16.58 M 3.77 54,209,936 1.00 73.01 102.26 13.92 M 5.24
SPCCPI2 3,439,543 1.00 -.- 100.00 16.58 M -.- 3,439,543 1.00 -.- 100.00 13.92 M -.-
Santa Luisa LUISAI1 664,671 1.00 187.00 157.81 73.11 M 2.56 664,671 1.00 140.00 112.90 91.53 M 1.53
Shougang Hierro Perú SHPC1 156,184,146 1.00 -.- 100.00 18.55 M -.- 156,184,146 1.00 -.- 100.00 8.45 M -.-
Volcan (*) VOLCABC1 1,869,175,979 1.00 3.70 123.75 1.03 M 3.59 1,557,770,414 1.00 3.95 102.86 1.21 M 3.26
VOLCAAC1 1,249,669,371 1.00 5.20 115.56 1.03 M 5.05 1,041,473,888 1.00 4.60 93.88 1.21 M 3.80
(*) Información financiera en US$ (**) VN, VC y Cotización en US$

BOLSA DE VALORES DE LIMA LIMA STOCK EXCHANGE
INDICADORES BURSATILES / STOCK MARKET INDICATORS Al 30 de Marzo de 2012 Al 31 de Marzo de 2011
Empresa/Company Valor Acciones en Valor Cotiz. Indice de Valor Precio Acciones en Valor Cotiz. Indice de Valor Precio
Circulación Nominal S/. S/. Lucratividad Contable /VC Circulación Nominal S/. S/. Lucratividad Contable /VC
Fosfatos del Pacífico FOSPACC1 104,712,580 1.00 -.- 100.00 0.86 M -.- 28,356,432 1.00 -.- 100.00 2.25 M -.-
MYGSA MARMOLI1 566,134 1.00 -.- 100.00 1.21 M -.- 566,134 1.00 -.- 100.00 1.64 M -.-
Atacocha (*) ATACOAC1 534,557,407 1.00 0.93 110.71 0.29 M 3.21 534,557,407 1.00 1.55 80.31 0.44 M 3.52
ATACOBC1 427,550,310 1.00 0.81 100.00 0.29 M 2.79 427,550,310 1.00 1.30 85.53 0.44 M 2.95
Milpo (*) MILPOC1 1,098,962,569 1.00 5.32 118.22 1.19 M 4.47 1,098,962,569 1.00 6.85 91.81 1.54 M 4.45
MILPOI1 17,968,942 1.00 4.70 106.82 1.19 M 3.95 16,398,459 1.00 5.05 163.90 1.54 M 3.28
Minera Corona (*) MINCORC1 31,890,365 1.00 33.00 110.00 5.64 M 5.85 31,890,365 1.00 28.00 99.41 2.88 M 9.72
MINCORI1 4,088,863 1.00 32.00 141.21 5.64 M 5.67 4,088,863 1.00 28.50 101.73 2.88 M 9.90
Perubar (*) PERUBAI1 17,454,224 1.00 3.50 100.00 3.11 M 1.13 17,454,224 1.00 3.30 95.65 3.16 M 1.04
SEGUROS / INSURANCE
La Positiva Vida POSITVC1 141,829,693 1.00 -.- 100.00 1.41 M -.- 131,829,693 1.00 -.- 100.00 1.46 M -.-
Pacífico Vida PAVIDAC1 7,400,000 10.00 -.- 100.00 58.48 M -.- 7,400,000 10.00 -.- 100.00 56.31 M -.-
Protecta Cía de Seg. PROTECC1 43,218,563 1.00 -.- 100.00 0.97 M -.- 33,138,563 1.00 -.- 100.00 0.76 M -.-
InVita Seguros de Vida INVITAC1 193,583,690 1.00 -.- 100.00 1.37 M -.- 172,020,520 1.00 -.- 100.00 1.32 M -.-
Ace Seguros ACESEGC1 6,800,000 3.04 -.- 100.00 6.22 M -.- 6,800,000 3.04 -.- 100.00 6.00 M -.-
Insur Cia. de Seg. INSURC1 8,109,276 1.00 -.- 100.00 1.11 M -.- 8,109,276 1.00 -.- 100.00 0.86 M -.-
Interseguro INTSEGC1 147,307,666 1.00 -.- 100.00 2.15 M -.- 147,307,666 1.00 -.- 100.00 2.02 M -.-
La Positiva POSITIC1 204,113,063 1.00 1.65 117.86 1.52 M 1.09 189,741,713 1.00 2.10 74.20 1.62 M 1.30
Mapfre Perú MAPFREC1 125,994,821 1.00 -.- 100.00 1.32 M -.- 125,994,821 1.00 -.- 100.00 1.25 M -.-
Rímac Seguros y Reaseg. RIMINTC1 600,000,000 1.00 3.20 106.67 1.87 M 1.71 500,000,000 1.00 4.20 100.00 2.03 M 2.07
Cardif del Perú CARDIFC1 77,112,438 1.00 -.- 100.00 0.57 M -.- -.- -.- -.- -.- -.- -.-
Pacífico - Per. Suiza PSUIZAC1 44,618,554 10.00 26.23 100.00 21.65 M 1.21 38,899,911 10.00 26.00 94.43 18.79 M 1.38
Secrex SECREXC1 14,093,417 1.00 -.- 100.00 1.94 M -.- 9,557,513 1.00 -.- 100.00 3.22 M -.-
Mapfre Perú Vida MAPVIDC1 48,911,868 1.00 -.- 100.00 1.44 M -.- 48,911,868 1.00 -.- 100.00 1.35 M -.-
SERVICIOS PUBLICOS / PUBLIC SERVICES
EGESUR EGESUBC1 20,634,181 1.00 -.- 100.00 0.86 M -.- -.- -.- -.- -.- -.- -.-
ENERSUR (*) ENERSUC1 199,970,023 1.00 19.60 123.56 5.24 M 3.74 199,970,023 1.00 20.00 88.89 3.61 M 5.54
Edegel EDEGELC1 2,293,668,594 0.88 2.08 118.86 1.01 M 2.06 2,293,668,594 0.88 1.80 90.00 1.05 M 1.71
Edelnor EDELNOC1 638,563,900 1.00 4.25 110.39 1.56 M 2.72 638,563,900 1.00 3.70 96.86 1.49 M 2.48
Electro Sur Este ESUREBC1 9,498,677 1.00 -.- 100.00 1.56 M -.- 9,498,677 1.00 -.- 100.00 1.55 M -.-
Electrosur ELESUDC1 12,979,735 1.00 -.- 100.00 1.19 M -.- 12,979,735 1.00 -.- 100.00 1.15 M -.-
Eléctrica de Piura ELPIUBC1 29,593,037 1.00 5.60 112.00 2.82 M 1.99 29,593,037 1.00 6.70 113.56 1.79 M 3.74
Generandes GENPEBC1 332,850,556 1.00 -.- 100.00 1.27 M -.- 332,850,556 1.00 -.- 100.00 1.34 M -.-
Hidrandina HIDRA2C1 32,677,173 1.00 0.58 120.83 1.36 M 0.43 32,677,173 1.00 0.54 101.89 1.34 M 0.40
Luz del Sur LUSURC1 486,951,371 0.68 7.60 116.21 2.81 M 2.70 486,951,371 0.68 6.80 96.45 2.46 M 2.76
Peruana de Energía PERENBC1 13,914,253 1.00 -.- 92.39 0.81 M -.- 13,914,253 1.00 2.85 100.00 0.83 M 3.43
PERENAC1 41,626,600 1.00 -.- 100.00 0.81 M -.- 41,626,600 1.00 -.- 100.00 0.83 M -.-
SEAL SEALDC1 25,728,705 1.00 -.- 100.00 1.42 M -.- 46,850,419 1.00 -.- 100.00 1.21 M -.-
SHOUGESA SHOUGEC1 62,644,714 1.00 -.- 100.00 1.70 M -.- 62,644,714 1.00 -.- 100.00 1.43 M -.-
San Gabán SANGABC1 30,729,661 1.00 -.- 100.00 1.07 M -.- 30,729,661 1.00 -.- 100.00 1.08 M -.-
Electro Dunas EDUNASC1 214,269,928 1.00 -.- 100.00 1.11 M -.- 214,269,928 1.00 -.- 100.00 1.16 M -.-
Electro Puno EPUNOBC1 10,009,916 0.973 -.- 100.00 1.07 M -.- 10,009,916 0.973 -.- 100.00 1.08 M -.-
Electroperú ELECPBC1 216,266,421 1.00 -.- 100.00 1.33 M -.- 216,266,421 1.00 -.- 100.00 1.17 M -.-
Gas Nat Lima y Callao (*)(**) CALIDDC1 98,301,277 1.00 -.- 100.00 1.50 M -.- 98,301,277 1.00 -.- 100.00 1.23 M -.-
Sedapal SEDAPBC1 530,930 1,000.00 -.- 100.00 730.68 M -.- 530,930 1,000.00 -.- 100.00 713.02 M -.-
Telefónica Móviles TELMOVC1 743,236 0.01 -.- 100.00 0.07 M -.- 14,993,162,995 0.01 -.- 100.00 0.07 M -.-
TELMOVC2 17,286,018,798 0.01 -.- 100.00 0.07 M -.- -.- -.- -.- -.- -.- -.-
Telefónica del Perú TELEFCC1 220,475 0.86 -.- 105.73 1.12 M -.- 236,633 0.86 -.- 100.00 1.13 M -.-
TELEFBC1 3,347,038,474 0.86 2.18 89.71 1.12 M 1.95 3,347,022,316 0.86 3.30 103.13 1.13 M 2.92
(*) Información financiera en US$ (**) VN, VC y Cotización en US$
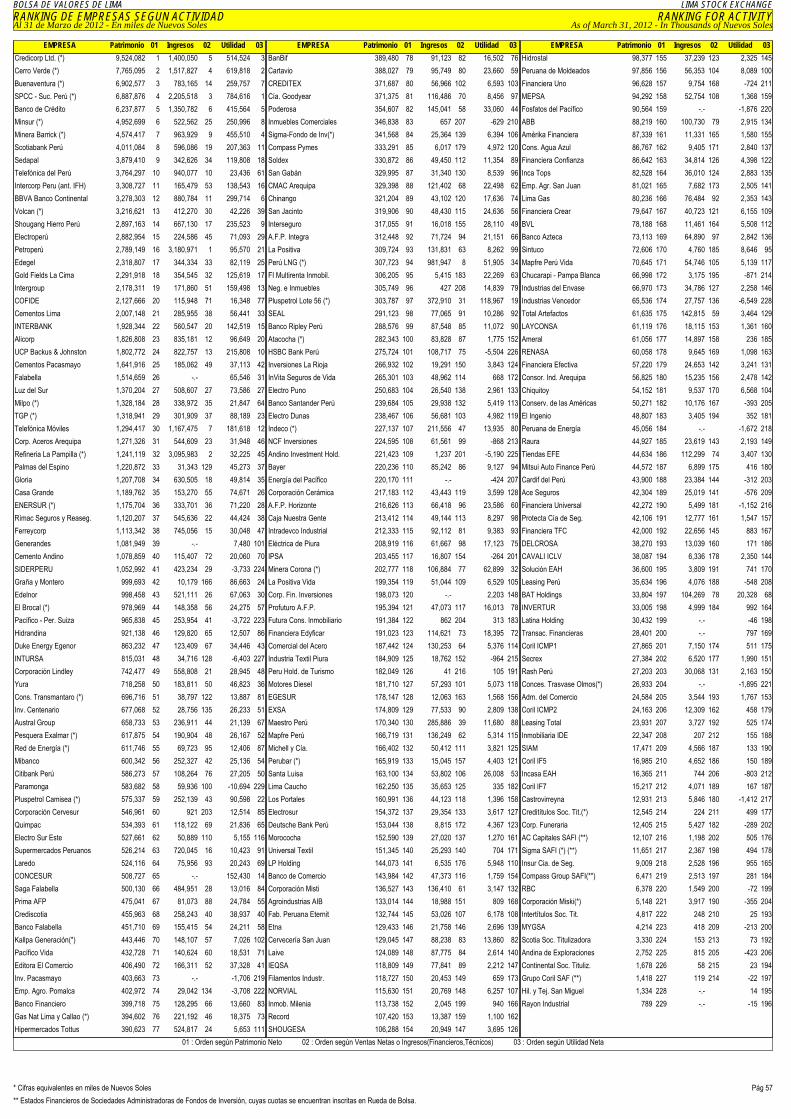
BOLSA DE VALORES DE LIMA LIMA STOCK EXCHANGERANKING DE EMPRESAS SEGUN ACTIVIDAD RANKING FOR ACTIVITYAl 31 de Marzo de 2012 - En miles de Nuevos Soles As of March 31, 2012 - In Thousands of Nuevos Soles
EMPRESA Patrimonio 01 Ingresos 02 Utilidad 03
Pág 57* Cifras equivalentes en miles de Nuevos Soles** Estados Financieros de Sociedades Administradoras de Fondos de Inversión, cuyas cuotas se encuentran inscritas en Rueda de Bolsa.
Credicorp Ltd. (*) 9,524,082 1 1,400,050 5 514,524 3 Cerro Verde (*) 7,765,095 2 1,517,827 4 619,818 2 Buenaventura (*) 6,902,577 3 783,165 14 259,757 7 SPCC - Suc. Perú (*) 6,887,876 4 2,205,518 3 784,616 1 Banco de Crédito 6,237,877 5 1,350,782 6 415,564 5 Minsur (*) 4,952,699 6 522,562 25 250,996 8 Minera Barrick (*) 4,574,417 7 963,929 9 455,510 4 Scotiabank Perú 4,011,084 8 596,086 19 207,363 11 Sedapal 3,879,410 9 342,626 34 119,808 18 Telefónica del Perú 3,764,297 10 940,077 10 23,436 61 Intercorp Peru (ant. IFH) 3,308,727 11 165,479 53 138,543 16 BBVA Banco Continental 3,278,303 12 880,784 11 299,714 6 Volcan (*) 3,216,621 13 412,270 30 42,226 39 Shougang Hierro Perú 2,897,163 14 667,130 17 235,523 9 Electroperú 2,882,954 15 224,586 45 71,093 29 Petroperú 2,789,149 16 3,180,971 1 95,570 21 Edegel 2,318,807 17 344,334 33 82,119 25 Gold Fields La Cima 2,291,918 18 354,545 32 125,619 17 Intergroup 2,178,311 19 171,860 51 159,498 13 COFIDE 2,127,666 20 115,948 71 16,348 77 Cementos Lima 2,007,148 21 285,955 38 56,441 33 INTERBANK 1,928,344 22 560,547 20 142,519 15 Alicorp 1,826,808 23 835,181 12 96,649 20 UCP Backus & Johnston 1,802,772 24 822,757 13 215,808 10 Cementos Pacasmayo 1,641,916 25 185,062 49 37,113 42 Falabella 1,514,659 26 -.- 65,546 31 Luz del Sur 1,370,204 27 508,607 27 73,586 27 Milpo (*) 1,328,184 28 338,972 35 21,847 64 TGP (*) 1,318,941 29 301,909 37 88,189 23 Telefónica Móviles 1,294,417 30 1,167,475 7 181,618 12 Corp. Aceros Arequipa 1,271,326 31 544,609 23 31,948 46 Refineria La Pampilla (*) 1,241,119 32 3,095,983 2 32,225 45 Palmas del Espino 1,220,872 33 31,343 129 45,273 37 Gloria 1,207,708 34 630,505 18 49,814 35 Casa Grande 1,189,762 35 153,270 55 74,671 26 ENERSUR (*) 1,175,704 36 333,701 36 71,220 28 Rímac Seguros y Reaseg. 1,120,207 37 545,636 22 44,424 38 Ferreycorp 1,113,342 38 745,056 15 30,048 47 Generandes 1,081,949 39 -.- 7,480 101 Cemento Andino 1,078,859 40 115,407 72 20,060 70 SIDERPERU 1,052,992 41 423,234 29 -3,733 224 Graña y Montero 999,693 42 10,179 166 86,663 24 Edelnor 998,458 43 521,111 26 67,063 30 El Brocal (*) 978,969 44 148,358 56 24,275 57 Pacífico - Per. Suiza 965,838 45 253,954 41 -3,722 223 Hidrandina 921,138 46 129,820 65 12,507 86 Duke Energy Egenor 863,232 47 123,409 67 34,446 43 INTURSA 815,031 48 34,716 128 -6,403 227 Corporación Lindley 742,477 49 558,808 21 28,945 48 Yura 718,258 50 183,811 50 46,823 36 Cons. Transmantaro (*) 696,716 51 38,797 122 13,887 81 Inv. Centenario 677,068 52 28,756 135 26,233 51 Austral Group 658,733 53 236,911 44 21,139 67 Pesquera Exalmar (*) 617,875 54 190,904 48 26,167 52 Red de Energía (*) 611,746 55 69,723 95 12,406 87 Mibanco 600,342 56 252,327 42 25,136 54 Citibank Perú 586,273 57 108,264 76 27,205 50 Paramonga 583,682 58 59,936 100 -10,694 229 Pluspetrol Camisea (*) 575,337 59 252,139 43 90,598 22 Corporación Cervesur 546,961 60 921 203 12,514 85 Quimpac 534,393 61 118,122 69 21,836 65 Electro Sur Este 527,661 62 50,889 110 5,155 116 Supermercados Peruanos 526,214 63 720,045 16 10,423 91 Laredo 524,116 64 75,956 93 20,243 69 CONCESUR 508,727 65 -.- 152,430 14 Saga Falabella 500,130 66 484,951 28 13,016 84 Prima AFP 475,041 67 81,073 88 24,784 55 Crediscotia 455,963 68 258,243 40 38,937 40 Banco Falabella 451,710 69 155,415 54 24,211 58 Kallpa Generación(*) 443,446 70 148,107 57 7,026 102 Pacífico Vida 432,728 71 140,624 60 18,531 71 Editora El Comercio 406,490 72 166,311 52 37,328 41 Inv. Pacasmayo 403,663 73 -.- -1,706 219 Emp. Agro. Pomalca 402,972 74 29,042 134 -3,708 222 Banco Financiero 399,718 75 128,295 66 13,660 83 Gas Nat Lima y Callao (*) 394,602 76 221,192 46 18,375 73 Hipermercados Tottus 390,623 77 524,817 24 5,653 111
EMPRESA Patrimonio 01 Ingresos 02 Utilidad 03
BanBif 389,480 78 91,123 82 16,502 76 Cartavio 388,027 79 95,749 80 23,660 59 CREDITEX 371,687 80 56,966 102 6,593 103 Cía. Goodyear 371,375 81 116,486 70 8,456 97 Poderosa 354,607 82 145,041 58 33,060 44 Inmuebles Comerciales 346,838 83 657 207 -629 210 Sigma-Fondo de Inv(*) 341,568 84 25,364 139 6,394 106 Compass Pymes 333,291 85 6,017 179 4,972 120 Soldex 330,872 86 49,450 112 11,354 89 San Gabán 329,995 87 31,340 130 8,539 96 CMAC Arequipa 329,398 88 121,402 68 22,498 62 Chinango 321,204 89 43,102 120 17,636 74 San Jacinto 319,906 90 48,430 115 24,636 56 Interseguro 317,055 91 16,018 155 28,110 49 A.F.P. Integra 312,448 92 71,724 94 21,151 66 La Positiva 309,724 93 131,831 63 8,262 99 Perú LNG (*) 307,723 94 981,947 8 51,905 34 FI Multirenta Inmobil. 306,205 95 5,415 183 22,269 63 Neg. e Inmuebles 305,749 96 427 208 14,839 79 Pluspetrol Lote 56 (*) 303,787 97 372,910 31 118,967 19 SEAL 291,123 98 77,065 91 10,286 92 Banco Ripley Perú 288,576 99 87,548 85 11,072 90 Atacocha (*) 282,343 100 83,828 87 1,775 152 HSBC Bank Perú 275,724 101 108,717 75 -5,504 226 Inversiones La Rioja 266,932 102 19,291 150 3,843 124 InVita Seguros de Vida 265,301 103 48,962 114 668 172 Electro Puno 250,683 104 26,540 138 2,961 133 Banco Santander Perú 239,684 105 29,938 132 5,419 113 Electro Dunas 238,467 106 56,681 103 4,982 119 Indeco (*) 227,137 107 211,556 47 13,935 80 NCF Inversiones 224,595 108 61,561 99 -868 213 Andino Investment Hold. 221,423 109 1,237 201 -5,190 225 Bayer 220,236 110 85,242 86 9,127 94 Energía del Pacífico 220,170 111 -.- -424 207 Corporación Cerámica 217,183 112 43,443 119 3,599 128 A.F.P. Horizonte 216,626 113 66,418 96 23,586 60 Caja Nuestra Gente 213,412 114 49,144 113 8,297 98 Intradevco Industrial 212,333 115 92,112 81 9,383 93 Eléctrica de Piura 208,919 116 61,667 98 17,123 75 IPSA 203,455 117 16,807 154 -264 201 Minera Corona (*) 202,777 118 106,884 77 62,899 32 La Positiva Vida 199,354 119 51,044 109 6,529 105 Corp. Fin. Inversiones 198,073 120 -.- 2,203 148 Profuturo A.F.P. 195,394 121 47,073 117 16,013 78 Futura Cons. Inmobiliario 191,384 122 862 204 313 183 Financiera Edyficar 191,023 123 114,621 73 18,395 72 Comercial del Acero 187,442 124 130,253 64 5,376 114 Industria Textil Piura 184,909 125 18,762 152 -964 215 Peru Hold. de Turismo 182,049 126 41 216 105 191 Motores Diesel 181,710 127 57,293 101 5,073 118 EGESUR 178,147 128 12,063 163 1,568 156 EXSA 174,809 129 77,533 90 2,809 138 Maestro Perú 170,340 130 285,886 39 11,680 88 Mapfre Perú 166,719 131 136,249 62 5,314 115 Michell y Cía. 166,402 132 50,412 111 3,821 125 Perubar (*) 165,919 133 15,045 157 4,403 121 Santa Luisa 163,100 134 53,802 106 26,008 53 Lima Caucho 162,250 135 35,653 125 335 182 Los Portales 160,991 136 44,123 118 1,396 158 Electrosur 154,372 137 29,354 133 3,617 127 Deutsche Bank Perú 153,044 138 8,815 172 4,367 123 Morococha 152,590 139 27,020 137 1,270 161 Universal Textil 151,345 140 25,293 140 704 171 LP Holding 144,073 141 6,535 176 5,948 110 Banco de Comercio 143,984 142 47,373 116 1,759 154 Corporación Misti 136,527 143 136,410 61 3,147 132 Agroindustrias AIB 133,014 144 18,988 151 809 168 Fab. Peruana Eternit 132,744 145 53,026 107 6,178 108 Etna 129,433 146 21,758 146 2,696 139 Cervecería San Juan 129,045 147 88,238 83 13,860 82 Laive 124,089 148 87,775 84 2,614 140 IEQSA 118,809 149 77,841 89 2,212 147 Filamentos Industr. 118,727 150 20,453 149 659 173 NORVIAL 115,630 151 20,769 148 6,257 107 Inmob. Milenia 113,738 152 2,045 199 940 166 Record 107,420 153 13,387 159 1,100 162 SHOUGESA 106,288 154 20,949 147 3,695 126
EMPRESA Patrimonio 01 Ingresos 02 Utilidad 03
Hidrostal 98,377 155 37,239 123 2,325 145 Peruana de Moldeados 97,856 156 56,353 104 8,089 100 Financiera Uno 96,628 157 9,754 168 -724 211 MEPSA 94,292 158 52,754 108 1,368 159 Fosfatos del Pacífico 90,564 159 -.- -1,876 220 ABB 88,219 160 100,730 79 2,915 134 Amérika Financiera 87,339 161 11,331 165 1,580 155 Cons. Agua Azul 86,767 162 9,405 171 2,840 137 Financiera Confianza 86,642 163 34,814 126 4,398 122 Inca Tops 82,528 164 36,010 124 2,883 135 Emp. Agr. San Juan 81,021 165 7,682 173 2,505 141 Lima Gas 80,236 166 76,484 92 2,353 143 Financiera Crear 79,647 167 40,723 121 6,155 109 BVL 78,188 168 11,461 164 5,508 112 Banco Azteca 73,113 169 64,890 97 2,842 136 Sintuco 72,606 170 4,760 185 8,646 95 Mapfre Perú Vida 70,645 171 54,746 105 5,139 117 Chucarapi - Pampa Blanca 66,998 172 3,175 195 -871 214 Industrias del Envase 66,970 173 34,786 127 2,258 146 Industrias Vencedor 65,536 174 27,757 136 -6,549 228 Total Artefactos 61,635 175 142,815 59 3,464 129 LAYCONSA 61,119 176 18,115 153 1,361 160 Ameral 61,056 177 14,897 158 236 185 RENASA 60,058 178 9,645 169 1,098 163 Financiera Efectiva 57,220 179 24,653 142 3,241 131 Consor. Ind. Arequipa 56,825 180 15,235 156 2,478 142 Chiquitoy 54,152 181 9,537 170 6,568 104 Conserv. de las Américas 50,271 182 10,176 167 -393 205 El Ingenio 48,807 183 3,405 194 352 181 Peruana de Energía 45,056 184 -.- -1,672 218 Raura 44,927 185 23,619 143 2,193 149 Tiendas EFE 44,634 186 112,299 74 3,407 130 Mitsui Auto Finance Perú 44,572 187 6,899 175 416 180 Cardif del Perú 43,900 188 23,384 144 -312 203 Ace Seguros 42,304 189 25,019 141 -576 209 Financiera Universal 42,272 190 5,499 181 -1,152 216 Protecta Cía de Seg. 42,106 191 12,777 161 1,547 157 Financiera TFC 42,000 192 22,656 145 883 167 DELCROSA 38,270 193 13,039 160 171 186 CAVALI ICLV 38,087 194 6,336 178 2,350 144 Solución EAH 36,600 195 3,809 191 741 170 Leasing Perú 35,634 196 4,076 188 -548 208 BAT Holdings 33,804 197 104,269 78 20,328 68 INVERTUR 33,005 198 4,999 184 992 164 Latina Holding 30,432 199 -.- -46 198 Transac. Financieras 28,401 200 -.- 797 169 Coril ICMP1 27,865 201 7,150 174 511 175 Secrex 27,384 202 6,520 177 1,990 151 Rash Perú 27,203 203 30,068 131 2,163 150 Conces. Trasvase Olmos(*) 26,933 204 -.- -1,895 221 Adm. del Comercio 24,584 205 3,544 193 1,767 153 Coril ICMP2 24,163 206 12,309 162 458 179 Leasing Total 23,931 207 3,727 192 525 174 Inmobiliaria IDE 22,347 208 207 212 155 188 SIAM 17,471 209 4,566 187 133 190 Coril IF5 16,985 210 4,652 186 150 189 Incasa EAH 16,365 211 744 206 -803 212 Coril IF7 15,217 212 4,071 189 167 187 Castrovirreyna 12,931 213 5,846 180 -1,412 217 Creditítulos Soc. Tit.(*) 12,545 214 224 211 499 177 Corp. Funeraria 12,405 215 5,427 182 -289 202 AC Capitales SAFI (**) 12,107 216 1,198 202 505 176 Sigma SAFI (*) (**) 11,651 217 2,367 198 494 178 Insur Cia. de Seg. 9,009 218 2,528 196 955 165 Compass Group SAFI(**) 6,471 219 2,513 197 281 184 RBC 6,378 220 1,549 200 -72 199 Corporación Miski(*) 5,148 221 3,917 190 -355 204 Intertítulos Soc. Tit. 4,817 222 248 210 25 193 MYGSA 4,214 223 418 209 -213 200 Scotia Soc. Titulizadora 3,330 224 153 213 73 192 Andina de Exploraciones 2,752 225 815 205 -423 206 Continental Soc. Tituliz. 1,678 226 58 215 23 194 Grupo Coril SAF (**) 1,418 227 119 214 -22 197 Hil. y Tej. San Miguel 1,334 228 -.- 14 195 Rayon Industrial 789 229 -.- -15 196
01 : Orden según Patrimonio Neto 02 : Orden según Ventas Netas o Ingresos(Financieros,Técnicos) 03 : Orden según Utilidad Neta

(1) LIQUIDEZ : (1) LIQUIDITY :
(2) GESTION : (2) MANAGEMENT :Financial Income Financial Incometo Total Assets Ratio Total Assets
(3) SOLVENCIA : (3) SOLVENCY :Pasivo Total Total LiabilitiesActivo Total Total Assets
Endeudamiento Pasivo Total Equity Total LiabilitiesPatrimonial Patrimonio Indebtedness Equity(4) RENTABILIDAD : (4) RETURN :Rentabilidad del Utilidad Neta x 100 Return on Capital Net Profit x 100Capital (%) Capital (%) Capital
Rentabilidad x 100 Return on x 100sobre Activos (%) Assets (%)
Rentabilidad x 100 Return on Equity(%) x 100Patrimonial (%)
(1) LIQUIDEZ : (1) LIQUIDITY :Activo Corriente Current AssetsPasivo Corriente Current Liabilities
(2) GESTION : (2) MANAGEMENT :Rotación de Activo Ing. técnicos + Ing. Naturaleza ech.Income to
Total Assets ratio(3) SOLVENCIA : (3) SOLVENCY :
Pasivo Total Total LiabilitiesActivo Total Total Assets
Endeudamiento Pasivo Total Equity Total LiabilitiesPatrimonial Patrimonio Indebtedness Equity(4) RENTABILIDAD : (4) RETURN :Rentabilidad del Utilidad Neta x 100 Net Profit x 100Capital (%) Capital Capital
Total AssetsTechnical Income + Income for Nature
= =Solvency
BOLSA DE VALORES DE LIMA LIMA STOCK EXCHANGE
INDICADORES FINANCIEROS / FINANCIAL INDICATORSBANCOS - FINANCIERAS / BANKS - FINANCIAL COMPANIES
COMPAÑIAS DE SEGUROS / INSURANCE COMPANIES
Net ProfitEquity
Utilidad Neta
Utilidad Neta
Activo Total
=
=
=
=
Funds Available+Inter. Funds+Tradable Invest.Obligations+Inter Bank Funds+Deposits+Debts=
=
Solvencia Solvency
Patrimonio
Net ProfitTotal Assets
= =
= =Return on Capital (%)
Solvencia
=
= =
=
=
=
=
=
=
Activo Total
Liquidez Liquidity
=Rotación de ActivoIngresos Financieros
Activo Total
Disponible + F. Interb.+Inv. NegociablesObligac.+ F.Interb.+ Depósitos+Adeudos=
Liquidez Liquidity
=
Rentabilidad Utilidad Neta x 100 Return on Net Profit x 100sobre Activos (%) Activo Total Assets (%) Total Assets
Rentabilidad Utilidad Neta x 100 Net Profit x 100Patrimonial (%) Patrimonio Equity
(1) LIQUIDEZ : (1) LIQUIDITY :Activo Corriente Current AssetsPasivo Corriente Current Liabilities
(2) GESTION : (2) MANAGEMENT :Ingresos x Actividades Ordinarias Gross Sales to Income from Regular Activities Activo Total Total Assets ratio Total Assets
(3) SOLVENCIA : (3) SOLVENCY :Pasivo Total Total LiabilitiesActivo Total Total Assets
Endeudamiento Pasivo Total Equity Total LiabilitiesPatrimonial Patrimonio Indebtedness Equity
(4) RENTABILIDAD : (4) RETURN :Rentabilidad Utilidad Neta x 100 Net Sales Return Net Profit x 100Ventas Netas (%) Ingresos x Actividades Ordinarias (%) Income from Regular Activities
Rentabilidad Utilidad Neta x 100 Return on Net Profit x 100sobre Activos (%) Activo Total Assets (%) Total Assets
Rentabilidad Utilidad Neta x 100 Return on Equity(%) Net Profit x 100Patrimonial (%) Patrimonio Equity
* Nota: En el caso de las Administradoras Privadas de Fondos de Pensiones se considera el ratio de "Rentabilidad del Capital" (Utilidad Neta / Capital * 100)
(1) INDICE DE LUCRO (1) EARNINGS INDEX
donde : where :P = Precio de la acción Pi = Share pricePo = Precio de la acción al cierre del año anterior Po = Share price at closing previous yearD i = %Dividendos por acción. D i = %Dividens for share
(2) VALOR CONTABLE (2) BOOK VALUE[ Equity ] x [ Par Value "A"][ Patrimonio ] x [ Valor Nominal de "A"]
=
=
=
=Return on Equity(%)
=
=
=
=
Solvencia Solvency
= =
= =
Rotación de Activo
Liquidez Liquidity
=
=
=
INDUSTRIALES, MINERAS Y OTROS / INDUSTRIAL, MINING AND OTHER *
INDICADORES BURSATILES / STOCK MARKET INDICATORS
= =I.L. E.I.
=
=
=
(3) RELACION PRECIO VALOR CONTABLE : (3) PRICE BOOK VALUEShare Price "A"Book Value "A"
[ Equity ] x [ Par Value "A"]Stock in circulation
=
=
=
=
[ Patrimonio ] x [ Valor Nominal de "A"]Capital en circulación
Precio de la Acción "A"Valor Contable de "A"
R.P.V.C. (A) P.B.V. (A)
V.C. (A) B.V. (A)
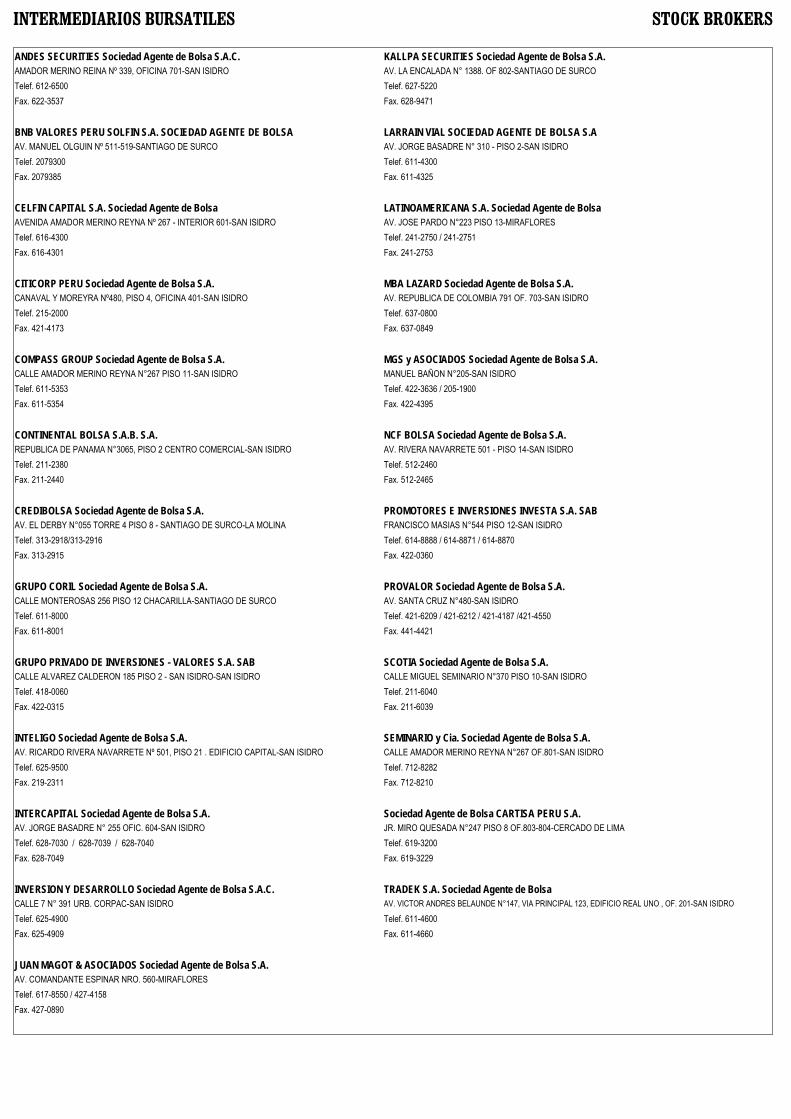
INTERMEDIARIOS BURSATILES STOCK BROKERS
ANDES SECURITIES Sociedad Agente de Bolsa S.A.C.AMADOR MERINO REINA Nº 339, OFICINA 701-SAN ISIDROTelef. 612-6500Fax. 622-3537
BNB VALORES PERU SOLFIN S.A. SOCIEDAD AGENTE DE BOLSAAV. MANUEL OLGUIN Nº 511-519-SANTIAGO DE SURCOTelef. 2079300Fax. 2079385
CELFIN CAPITAL S.A. Sociedad Agente de BolsaAVENIDA AMADOR MERINO REYNA Nº 267 - INTERIOR 601-SAN ISIDROTelef. 616-4300Fax. 616-4301
CITICORP PERU Sociedad Agente de Bolsa S.A.CANAVAL Y MOREYRA Nº480, PISO 4, OFICINA 401-SAN ISIDROTelef. 215-2000Fax. 421-4173
COMPASS GROUP Sociedad Agente de Bolsa S.A.CALLE AMADOR MERINO REYNA N°267 PISO 11-SAN ISIDROTelef. 611-5353Fax. 611-5354
CONTINENTAL BOLSA S.A.B. S.A.REPUBLICA DE PANAMA N°3065, PISO 2 CENTRO COMERCIAL-SAN ISIDROTelef. 211-2380Fax. 211-2440
CREDIBOLSA Sociedad Agente de Bolsa S.A.AV. EL DERBY N°055 TORRE 4 PISO 8 - SANTIAGO DE SURCO-LA MOLINATelef. 313-2918/313-2916Fax. 313-2915
GRUPO CORIL Sociedad Agente de Bolsa S.A.CALLE MONTEROSAS 256 PISO 12 CHACARILLA-SANTIAGO DE SURCOTelef. 611-8000Fax. 611-8001
GRUPO PRIVADO DE INVERSIONES - VALORES S.A. SABCALLE ALVAREZ CALDERON 185 PISO 2 - SAN ISIDRO-SAN ISIDROTelef. 418-0060Fax. 422-0315
INTELIGO Sociedad Agente de Bolsa S.A.AV. RICARDO RIVERA NAVARRETE Nº 501, PISO 21 . EDIFICIO CAPITAL-SAN ISIDROTelef. 625-9500Fax. 219-2311
INTERCAPITAL Sociedad Agente de Bolsa S.A.AV. JORGE BASADRE N° 255 OFIC. 604-SAN ISIDROTelef. 628-7030 / 628-7039 / 628-7040Fax. 628-7049
INVERSION Y DESARROLLO Sociedad Agente de Bolsa S.A.C.CALLE 7 N° 391 URB. CORPAC-SAN ISIDROTelef. 625-4900Fax. 625-4909
JUAN MAGOT & ASOCIADOS Sociedad Agente de Bolsa S.A.AV. COMANDANTE ESPINAR NRO. 560-MIRAFLORESTelef. 617-8550 / 427-4158Fax. 427-0890
KALLPA SECURITIES Sociedad Agente de Bolsa S.A.AV. LA ENCALADA N° 1388. OF 802-SANTIAGO DE SURCOTelef. 627-5220Fax. 628-9471
LARRAIN VIAL SOCIEDAD AGENTE DE BOLSA S.AAV. JORGE BASADRE N° 310 - PISO 2-SAN ISIDROTelef. 611-4300Fax. 611-4325
LATINOAMERICANA S.A. Sociedad Agente de BolsaAV. JOSE PARDO N°223 PISO 13-MIRAFLORESTelef. 241-2750 / 241-2751Fax. 241-2753
MBA LAZARD Sociedad Agente de Bolsa S.A.AV. REPUBLICA DE COLOMBIA 791 OF. 703-SAN ISIDROTelef. 637-0800Fax. 637-0849
MGS y ASOCIADOS Sociedad Agente de Bolsa S.A.MANUEL BAÑON N°205-SAN ISIDROTelef. 422-3636 / 205-1900Fax. 422-4395
NCF BOLSA Sociedad Agente de Bolsa S.A.AV. RIVERA NAVARRETE 501 - PISO 14-SAN ISIDROTelef. 512-2460Fax. 512-2465
PROMOTORES E INVERSIONES INVESTA S.A. SABFRANCISCO MASIAS N°544 PISO 12-SAN ISIDROTelef. 614-8888 / 614-8871 / 614-8870Fax. 422-0360
PROVALOR Sociedad Agente de Bolsa S.A.AV. SANTA CRUZ N°480-SAN ISIDROTelef. 421-6209 / 421-6212 / 421-4187 /421-4550Fax. 441-4421
SCOTIA Sociedad Agente de Bolsa S.A.CALLE MIGUEL SEMINARIO N°370 PISO 10-SAN ISIDROTelef. 211-6040Fax. 211-6039
SEMINARIO y Cia. Sociedad Agente de Bolsa S.A.CALLE AMADOR MERINO REYNA N°267 OF.801-SAN ISIDROTelef. 712-8282Fax. 712-8210
Sociedad Agente de Bolsa CARTISA PERU S.A.JR. MIRO QUESADA N°247 PISO 8 OF.803-804-CERCADO DE LIMATelef. 619-3200Fax. 619-3229
TRADEK S.A. Sociedad Agente de BolsaAV. VICTOR ANDRES BELAUNDE N°147, VIA PRINCIPAL 123, EDIFICIO REAL UNO , OF. 201-SAN ISIDRO
Telef. 611-4600Fax. 611-4660