mass emission rates and chemical characterization of pm2.5
TRANSCRIPT

MASS EMISSION RATES AND CHEMICAL CHARACTERIZATION OF PM2.5 EMISSIONS FROM TWO
MOTORCYCLES
Deniz Karman and Colin WelburnDepartment of Civil and Environmental Engineering, Carleton University
1125 Colonel By Drive, K1S 5B6 Ottawa, Ontario, Canada
Lisa A. Graham Environmental Technology Centre, Environment Canada
3439 River Road, K1A 0H3 Ottawa, Ontario, Canada
11TH CRC ON-ROAD VEHICLE EMISSIONS WORKSHOP San Diego, CaliforniaMarch 26-28, 2001
Overview
• Considerations for PM2.5 sampling from vehicle exhaust
• Motorcycle emission measurement program• Results & Discussion
– PM2.5 Mass emission rates– Chemical characterization
• Comparison with diesel bus emissions• Conclusions

Sample Collection Goals
• Dilute and cool the hot exhaust gases simulating the actual dilution process that occurs at the tailpipe or exhaust stack of a vehicle on the road
• Capture sufficient sample on a filter without causing changes in the physical and chemical composition of the particulate matter

Requirements of Dilution System
• Easily cleaned between tests.• Useful for light duty gasoline and diesel vehicles
and heavy duty diesel vehicles.• Residence time appropriate for collecting primary
particle emission samples• Adequate conditioning of dilution air • Provide complete mixing of dilution air and hot
exhaust before samples are collected
Requirements of Dilution System
• Simulate as much as possible real world dilution process
• Present dilute samples to the collection media at a temperature and relative humidity consistent with ambient conditions.
• Must be able to collect multiple, simultaneous samples using different sample collection methods and different sample media.

ERMD Dilution System
• Located in cold temperature test cell to simulate all seasons (25 to -20 °C)
• Exhaust transfer line from vehicle to tunnel is heated and relatively straight to reduce PM loss.
• Constructed of flanged pipe segments for easy cleaning.
• All samples collected under iso-axial, isokinetic conditions.

DISTANCE / SPEED
LOAD (force)
Critical Flow Venturi
Dilution Air
Dilution Air Filter
Particulate Sampling
Particulate Pump
Unregulated Emissions Sample
Regulated Emissions Sample
Dilute Exhaust
Filter Box
Heated NOxHeated Fid (NDIR)
Carbon Monoxide
(NDIR)
Carbon DioxideNitrogen OxidesTotal Hydrocarbon
Analyzer Bench
Concentrations
Temperature, Abs. Pressure
grams/mileCO CO2NOx HC
Vehicle Exhaust
LIGHT DUTY VEHICLE TESTING

Critical Flow Venturi - Constant Volume Sampler
Critical Flow Venturi
Dilution Air
Dilution Air Filter
Particulate Pump
Unregulated Emissions Sample
Regulated Emissions Sample
Dilute Exhaust
Filter Box
Heated NOxHeated Fid (NDIR)
Carbon Monoxide
(NDIR)
Carbon DioxideNitrogen OxidesTotal Hydrocarbon
Analyzer Bench

• Multiple PM2.5 samples collected in parallel from 2 isokinetic sampling probes in dilution tunnel


Motorcycle testing
• 2 motorcycles: – Suzuki 750 – Honda 600
• 2 gasoline fuels: – Summer Grade Commercial (SGC) – Low-sulfur (2 ppmw)
• 3 driving cycles– LA4, US06, NYCC

Collecting Sufficient Mass
• More repeats of a test, same filter is exposed longer– 2 X LA4 ; first one cold start, followed by
second one – 3 X US06– 3 X NYCC

PM2.5 Sample Analysis
• Gravimetric mg/mile
• Chemical– Organic / Elemental Carbon – Ion Analysis – Ammonia – Sulphur Dioxide

PM2.5 Emission Rates
0.00
10.00
20.00
30.00
40.00
50.00
60.00
CS LA4 HS LA4 Comp US06 NYCC
Em
issi
on
Rat
e (m
g/m
ile)
Suzuki SGC
Suzuki Lo-S
Honda SGC
Honda Lo-S

Results of Motorcycle Testing - Gravimetric Analysis
• High degree of uncertainty in PM emission rates (5-94% RSD).
• Uncertainty linked to low mass of PM collected on filters.
• Cold Start emission rates not significantly different from Hot Start emission rates
• US-06 and NYCC produce significantly higher emission rates compared to FTP

OC/EC Analysis
Quartz
Quartz Quartz
Teflon
Traditional Method Supplemental Method
T1
Q3
Q 1
Q2

Organic Carbon in PM2.5 - corrected for filter adsorption
R2 = 0.733
R2 = 0.2141
0.00
2.00
4.00
6.00
8.00
10.00
12.00
14.00
16.00
18.00
0.00 2.00 4.00 6.00 8.00 10.00 12.00 14.00 16.00 18.00PM2.5 Rate (mg/mile)
OC
ra
te (
mg/
mile
)
OC-Q3 correctedOC-Q2 corrected
Linear (OC-Q3 corrected)
Linear (1:1)
Linear (OC-Q2 corrected)
1:1
Organic/Elemental Carbon Analysis
• Need to correct for sampling “artefacts”• Correction method critical for accurate
results• Number of invalidated tests directly
linked to mass of sample collected.• EC emission rates below detectable
limits
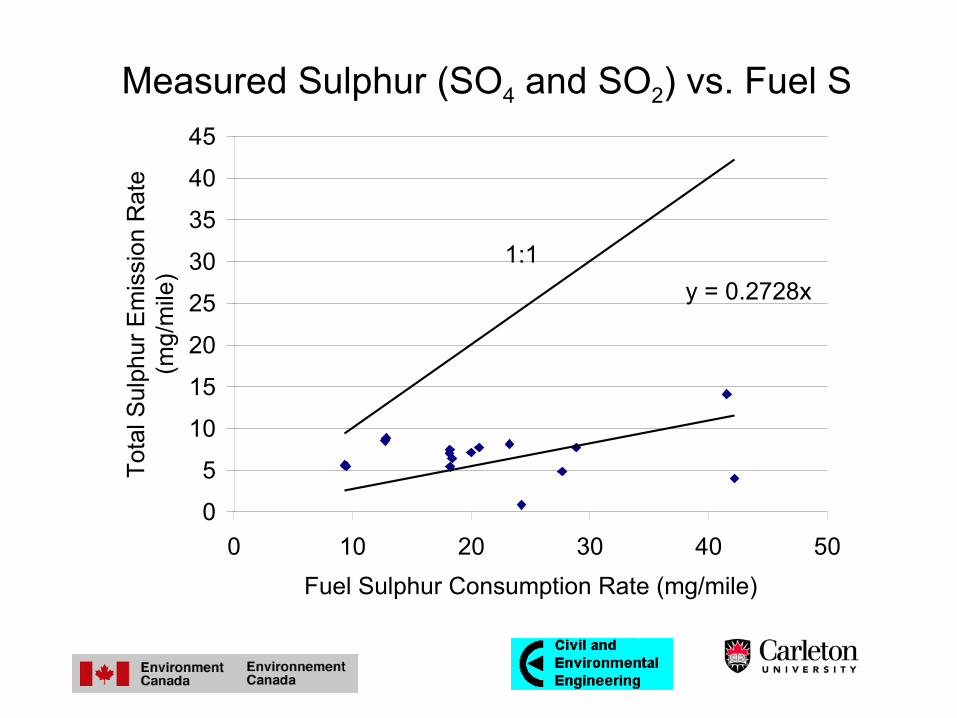
Measured Sulphur (SO4 and SO2) vs. Fuel S
y = 0.2728x
0
5
10
15
20
25
30
35
40
45
0 10 20 30 40 50
Fuel Sulphur Consumption Rate (mg/mile)
Tot
al S
ulph
ur E
mis
sion
Rat
e (m
g/m
ile)
1:1

Sulphur Balance - Motorcycles
• Fuel sulphur consumed >> sulphur collected as SO2 and PM-bound SO4.
• Causes:
– SO2 by-pass?
– Gaseous sulphur species not identified?.

PM2.5 Emission Rates - Diesel Bus on CBD
0.00
0.50
1.00
1.50
2.00
2.50
3.00
3.50
WarmBaseline
ColdBaseline
WarmCatalyst
ColdCatalyst
Em
iss
ion
Ra
te (
g/m
ile)
EC
OCPM2.5

• Conclusions– PM2.5 mass emission rates from motorcycles are
1/1000 of emissions from bus - approaching limit of gravimetric method of measurement
– the effect of aggressive driving cycles is noticeable – Motorcycle PM2.5 virtually all organic carbon
• Current work:– Particle size distribution with SMPS and ELPI,
potential for observing effect of driving conditions on emission rate and size distribution
Acknowledgement
• Contributions from the following programs are gratefully acknowledged:
• PERD (Government of Canada Panel on Energy Research and Development)
• TSRI - Health Canada (Toxic Substances Research Initiative)
• NSERC -PGS (Natural Sciences and Engineering Research Council of Canada, Post Graduate Scholarships)