massachusetts comprehensive annual financial report
TRANSCRIPT

CITY OF BEVERLY MASSACHUSETTS
COMPREHENSIVE ANNUAL FINANCIAL REPORT
City Hall
For the Year Ended June 30, 2019
Michael P. Cahill, Mayor
Bryant Ayles, Director of Municipal Finance
The Beverly Commons

CITY OF BEVERLY, MASSACHUSETTS
COMPREHENSIVE ANNUAL FINANCIAL REPORT
For the Year Ended June 30, 2019
Prepared by:
Bryant Ayles, Director of Municipal Finance
CITY OF BEVERLY, MASSACHUSETTS
COMPREHENSIVE ANNUAL FINANCIAL REPORT
JUNE 30, 2019
TABLE OF CONTENTS
Introductory Section ..................................................................................................................................................... 1
Letter of Transmittal ..................................................................................................................................................... 3
GFOA Certificate of Acheivement ............................................................................................................................... 7
Organizational Chart .................................................................................................................................................... 8
Principal Executive Officers ......................................................................................................................................... 9
Financial Section ......................................................................................................................................................... 11
Independent Auditor’s Report .................................................................................................................................... 13
Management’s Discussion and Analysis ................................................................................................................... 15
Basic Financial Statements ....................................................................................................................................... 27
Statement of net position ....................................................................................................................................... 29
Statement of activities ............................................................................................................................................ 30
Governmental funds – balance sheet .................................................................................................................... 32
Reconciliation of the governmental funds balance sheet total fund balances to the statement of net position .... 33
Governmental funds – statement of revenues, expenditures and changes in fund balances ............................... 34
Reconciliation of the statement of revenues, expenditures, and changes in fund balances of governmental
funds to the statement of activities ........................................................................................................................ 35
Proprietary funds – statement of net position ........................................................................................................ 36
Proprietary funds – statement of revenues, expenses and changes in fund net position ..................................... 38
Proprietary funds – statement of cash flows .......................................................................................................... 40
Fiduciary funds – statement of fiduciary net position ............................................................................................. 42
Fiduciary funds – statement of changes in fiduciary net position .......................................................................... 43
Notes to basic financial statements ....................................................................................................................... 44
Required Supplementary Information ........................................................................................................................ 87
General Fund Budgetary Comparison Schedule ................................................................................................... 89
General fund schedule of revenues, expenditures and changes in fund balance – budget and actual ............ 90
Pension Plan Schedules – Retirement System ..................................................................................................... 92
Schedule of changes in the net pension liability and related ratios ................................................................... 93
Schedule of contributions ................................................................................................................................... 94
Schedule of investment return ........................................................................................................................... 95
Pension Plan Schedules - City............................................................................................................................... 96
Schedule of the City’s proportionate share of the net pension liability .............................................................. 97
Schedule of the City’s contributions ................................................................................................................... 98
Schedule of the special funding amounts of the net pension liability ................................................................. 99
Other Postemployment Benefit Plan Schedules .................................................................................................. 100
Schedule of changes in the City’s net other postemployment benefit liability and related ratios .................... 101
Schedule of the City’s contributions ................................................................................................................. 102
Schedule of investment returns ........................................................................................................................ 103
Notes to required supplementary information ...................................................................................................... 104
Combining and Individual Fund Statements ............................................................................................................ 108
Nonmajor governmental funds ............................................................................................................................. 109
Nonmajor governmental funds – combining balance sheet ............................................................................. 112
Nonmajor governmental funds – combining statement of revenues, expenditures, and changes in fund
balances ...................................................................................................................................................... 116
Agency fund ......................................................................................................................................................... 120
Agency fund – statement of changes in assets and liabilities .......................................................................... 121
Statistical Section ..................................................................................................................................................... 123
Net position by component – last ten years ............................................................................................................ 124
Changes in net position – last ten years ................................................................................................................. 125
Fund balances, governmental funds – last ten years .............................................................................................. 127
Changes in fund balances, governmental funds – last ten years ............................................................................ 128
Assessed value and actual value of taxable property by classification and tax rates – last ten years ................... 129
Principal taxpayers – current year and nine years ago ........................................................................................... 130
Property tax levies and collections – last ten years ................................................................................................. 131
Ratios of outstanding debt by type – last ten years ................................................................................................. 132
Ratios of outstanding debt and general bonded debt – last ten years .................................................................... 133
Direct and overlapping governmental activities debt – as of June 30, 2019 ........................................................... 134
Computation of legal debt margin – last ten years .................................................................................................. 135
Demographic and economic statistics – last ten years ........................................................................................... 136
Principal employers (excluding City) – current year and nine years ago ................................................................ 137
Full-time equivalent City employees by function – last ten years ............................................................................ 138
Operating indicators by function/program – last ten years ...................................................................................... 139
Capital asset statistics by function/program – last ten years .................................................................................. 140
Free cash and stabilization fund balances – last ten years ..................................................................................... 141

Introductory Section
The Beverly Commons
Endicott College Fountain

City of Beverly, Massachusetts 1 Comprehensive Annual Financial Report
Introductory Section

City of Beverly, Massachusetts 2 Comprehensive Annual Financial Report
This page intentionally left blank.
City of Beverly, Massachusetts 3 Comprehensive Annual Financial Report
CITY OF BEVERLY DEPARTMENT OF FINANCE
191 Cabot Street Beverly, Massachusetts 01915
Letter of Transmittal December 24, 2019 To the Honorable Mayor Cahill, Members of the City Council and Citizens of the City of Beverly, Massachusetts: At the close of each year, the City of Beverly is required by state law to issue a complete set of financial statements in conformity with generally accepted accounting principles (GAAP) that comply with the financial reporting requirements issued by the Governmental Accounting Standards Board (GASB). To meet this requirement, we hereby issue this Comprehensive Annual Financial Report (CAFR) of the City of Beverly, Massachusetts for the year ending June 30, 2019 for your review. This report consists of management’s representations concerning the City’s finances. Management is responsible for the financial operations of the City as well as the preparation and fair representation of the financial statements contained herein. Included in that responsibility is the proper design, implementation and maintenance of an internal control system designed to ensure fair presentation of the financial statements that are free from material misstatements, whether due to fraud or error. As the structure of internal controls should not outweigh the benefits, Beverly’s structure has been designed to provide reasonable not absolute assurance with regards to conformity with GAAP. The City of Beverly’s financial statements have been audited by Powers & Sullivan, LLC, a firm of licensed certified public accountants. Powers & Sullivan, LLC conducted the audit in accordance with auditing standards generally accepted in the United States of America and the standards applicable to financial audits contained in Government Auditing Standards, issued by the Comptroller General of the United States. These standards require that Powers & Sullivan, LLC perform the audit to obtain reasonable assurance that the financial statements are free from material misstatements. To obtain that assurance the auditors performed numerous procedures based on their assessment of the risk of misstatement, consideration of internal controls and evaluation the appropriateness of accounting policies. GAAP requires that management provide a discussion and analysis section to accompany its annual financial statements. That section is contained within this report immediately following the auditor’s opinion letter. This transmittal letter is designed to complement the required Management Discussion and Analysis. Profile of the City The City of Beverly is located in northeastern Massachusetts in Essex County, approximately 18 miles from Boston. It is bordered on the west by the Town of Danvers, on the north and east by the Town of Wenham, and on the east by the Town of Manchester-by-the-Sea and the Atlantic Ocean. To the south lies Beverly Harbor and the City of Salem. The American Community Survey (Census) estimates that Beverly had a population of 42,312 in 2018 and occupies a land area of 15.14 square miles.
OPERATING OFFICES: Board of Assessors Office of Collections Office of Treasury Office of Accounting
(978) 921-6000 Telephone (978) 921-8301 Facsimile
City of Beverly, Massachusetts 4 Comprehensive Annual Financial Report
Beverly, which had been a part of Salem since 1626, became a Town in 1668 after Reverend John Hale and the First Parish Church were officially recognized. The City is believed to be named after Beverly, England. During the 17th and 18th centuries, the farming and fishing industries prevailed. At the conclusion of the American Revolution, some residents who had succeeded in privateering started a small cotton manufactory in North Beverly. In the same year, 1788, the first Beverly-Salem Bridge was constructed. The 19th century saw the development of home shoemaking and commercial shoe factories. By 1894, Beverly had grown sufficiently and was incorporated as a City. Early in the last century, the United Shoe Machinery Company came to Beverly and, until its closing in 1987, the “Shoe” was the largest employer in the City. The City’s government is comprised of a Mayor and City Council. Local legislative decisions are made by the City Council consisting of nine members elected for two-year terms. The Mayor serves as the chief executive of the City and is also elected for two-year terms. Municipal Services The City provides general governmental services for the territory within its boundaries. These services include police and fire protection, schooling, trash collection and disposal, certain water services through the Salem-Beverly Water Supply Board, certain sewage disposal services through the South Essex Sewerage District, and parks and recreational facilities. The City owns and operates a regional airport. The City also owns the Beverly Golf and Tennis Club, the operation of which is under contract with Golf Facilities Management, Inc. Beverly also enjoys a wide range of cultural and historical resources. Its importance in early American history is seen through various historical landmarks related to early colonial settlements and its role in the American revolutionary era. Beverly houses three performance theaters within its boundaries and enjoys a downtown that has an official designation as an arts district by the Massachusetts Cultural Council. Economic Condition According to the Massachusetts Executive Office of Labor and Workforce Development, in June 2019, the City had a total labor force of 24,413, of whom 23,720 were employed and 693 or 2.8% were unemployed as compared with 3.1% for the Commonwealth of Massachusetts. Since 2004 the City has always held an unemployment rate below the state and national averages. The workforce in Beverly is diverse consisting of education and health service providers, professional and business services, manufacturing and numerous other industries. The major employers within the City are the Northeast Hospital Corporation, Endicott College, and a number of mid-sized advanced manufacturing facilities and life science companies. Recently the City has focused efforts on the revitalization of its downtown area and has invested significant funds to support infrastructure improvements in the downtown and throughout the City. This investment, in addition to other factors including but not limited to transportation access, a deep pool of skilled workers, and a variety of local and regional amenities, has resulted in significant growth of residential, commercial and industrial development. Many parcels in the downtown area are being redeveloped as mixed use properties that include multi-unit rental housing and retail, all within walking distance of the Beverly Depot Commuter Rail Station thus establishing the area as a vibrant example of transit-oriented development that strengthens the commercial base of the downtown core. This economic growth has and continues to draw mid-size companies, many with international profiles, to Beverly. These businesses have created job opportunities and increased the tax base in addition to raising Beverly's visibility as a hub for advanced manufacturing and the life sciences. In June 2019, a Standard and Poor’s rating letter identified Beverly's economic outlook as stable with a very strong underlying economy and a consistent operating performance.
City of Beverly, Massachusetts 5 Comprehensive Annual Financial Report
City Finances The City Charter requires that each year the Mayor submit to the City Council a proposed operating budget for the ensuing fiscal year. The budget consists of a complete financial plan for all general fund and enterprise fund activity for the coming fiscal year. The general fund operating budget for fiscal year 2019 excluding prior year carryforwards and all enterprise funds was approved at $133.4 million. Real estate, personal property, meals and excise tax accounts for 84.6% of the anticipated revenue budget. Additionally, as required by the City Charter, the Mayor annually submits a capital expenditure plan which is required to cover a five year period but in practice extends to ten (10) years. The plan is required to outline anticipated capital needs for the City and funding options for those needs. Annually the City undertakes a financial forecast process. A committee is established with representatives from the Finance Department, School Department, City Council and the general public. The committee reviews trends, establishes reasonable revenue and expenditure forecasts which span five years and produces a report on their findings. This process serves as valuable tool for the City in providing policy makers, citizens and municipal and school officials with an understanding of the immediate and future financial position. In 2014, the City established a stabilization fund policy which requires an annual deposit of at least 10% of the previous fiscal year’s unrestricted cash balance at year-end. The policy also outlines the allowable uses and the appropriate process for utilizing any balance from the fund. Since the establishment of this policy, the stabilization fund balance has grown to $13.6 million by the close of fiscal year 2019 and is expected to exceed $14.5 million by the close of fiscal year 2020. The goal is to grow and maintain the stabilization fund balance to a range of 10 to 15% of annual general fund operations to ensure the City’s fiscal stability in the future. The City also established a set of comprehensive financial policies and guidelines to provide a framework to help guide the finance department and policy makers in the management of the City's finances. These policies and guidelines outline appropriate strategies and targets relating to reserves, budgeting, cash management and debt among other areas. Awards and Acknowledgements The Government Finance Officers Association (GFOA) has awarded a Certificate of Achievement for Excellence in Financial Reporting to the City for its Comprehensive Annual Financial Report (CAFR) for the year ended June 30, 2018. This was the third consecutive year that the City has received this prestigious award. In order to be awarded a Certificate of Achievement, the City had to publish an easily readable and efficiently organized CAFR that satisfied both generally accepted accounting principles and applicable legal requirements. A Certificate of Achievement is valid for a period of one year only. We believe that our current CAFR continues to meet the Certificate of Achievement Program’s requirements and we are submitting it to the GFOA to determine its eligibility for another certificate. The preparation of this report would not have been possible without the efficient and dedicated services of the City’s financial team. We would like to express our sincere appreciation to all members of the finance team who assisted and contributed in the preparation of this report. Credit should be given to the dedicated City employees, our elected officials and appointed board and committee members for their unfailing support for maintaining the highest standards of professionalism in the management of the City of Beverly.
City of Beverly, Massachusetts 6 Comprehensive Annual Financial Report
Overall the City of Beverly is financially healthy and management has continued to strengthen its fiscal policies, enhanced its reserves, made responsible financial decisions and is optimistic of the City’s financial future. We hope you find this Comprehensive Annual Financial Report helpful. Sincerely,
Bryant Ayles, Carol Augulewicz, Finance Director City Accountant
City of Beverly, Massachusetts 7 Comprehensive Annual Financial Report
GFOA Certificate of Acheivement

City of Beverly, Massachusetts 8 Comprehensive Annual Financial Report
Organizational Chart Informational City of Beverly Organizational Chart
*This document is for informational purposes only. The City Charter and, to the extent not consistent with the City Charter, the City ordinances control the organization of City government.
City of Beverly, Massachusetts 9 Comprehensive Annual Financial Report
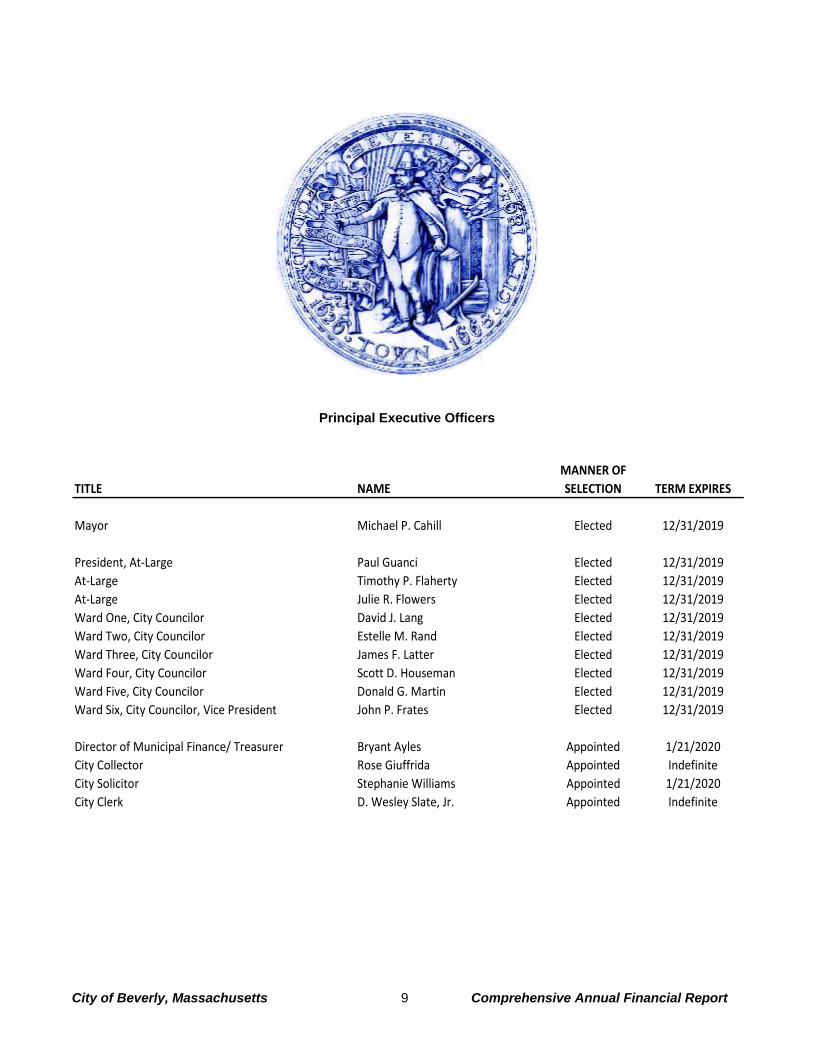
Principal Executive Officers
Principal Executive Officers
MANNER OF
TITLE NAME SELECTION TERM EXPIRES
Mayor Michael P. Cahill Elected 12/31/2019
President, At‐Large Paul Guanci Elected 12/31/2019
At‐Large Timothy P. Flaherty Elected 12/31/2019
At‐Large Julie R. Flowers Elected 12/31/2019
Ward One, City Councilor David J. Lang Elected 12/31/2019
Ward Two, City Councilor Estelle M. Rand Elected 12/31/2019
Ward Three, City Councilor James F. Latter Elected 12/31/2019
Ward Four, City Councilor Scott D. Houseman Elected 12/31/2019
Ward Five, City Councilor Donald G. Martin Elected 12/31/2019
Ward Six, City Councilor, Vice President John P. Frates Elected 12/31/2019
Director of Municipal Finance/ Treasurer Bryant Ayles Appointed 1/21/2020
City Collector Rose Giuffrida Appointed Indefinite
City Solicitor Stephanie Williams Appointed 1/21/2020
City Clerk D. Wesley Slate, Jr. Appointed Indefinite

City of Beverly, Massachusetts 10 Comprehensive Annual Financial Report
This page intentionally left blank.

Financial Section
Moraine Farm
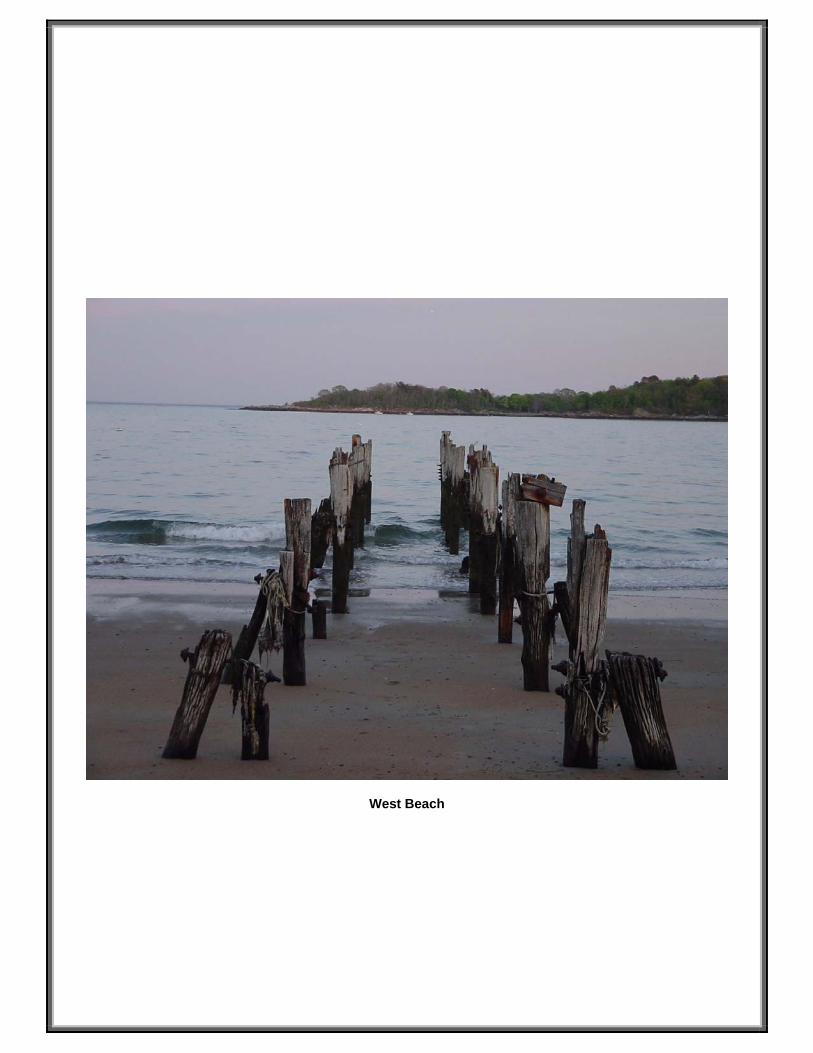
West Beach

City of Beverly, Massachusetts 11 Comprehensive Annual Financial Report
Financial Section
City of Beverly, Massachusetts 12 Comprehensive Annual Financial Report
This page intentionally left blank.
13
Independent Auditor’s Report To the Honorable City Council City of Beverly, Massachusetts Report on the Financial Statements We have audited the accompanying financial statements of the governmental activities, the business-type activities, each major fund, and the aggregate remaining fund information of the City of Beverly, Massachusetts, as of and for the year ended June 30, 2019 (except for the Beverly Contributory Retirement System which is as of and for the year ended December 31, 2018), which collectively comprise the City’s basic financial statements as listed in the table of contents, and the related notes to the financial statements. Management’s Responsibility for the Financial Statements Management is responsible for the preparation and fair presentation of these financial statements in accordance with accounting principles generally accepted in the United States of America; this includes the design, implementation, and maintenance of internal control relevant to the preparation and fair presentation of financial statements that are free from material misstatement, whether due to fraud or error. Auditor’s Responsibility Our responsibility is to express opinions on these financial statements based on our audit. We conducted our audit in accordance with auditing standards generally accepted in the United States of America and the standards applicable to financial audits contained in Government Auditing Standards, issued by the Comptroller General of the United States. Those standards require that we plan and perform the audit to obtain reasonable assurance about whether the financial statements are free of material misstatement. An audit involves performing procedures to obtain audit evidence about the amounts and disclosures in the financial statements. The procedures selected depend on the auditor’s judgment, including the assessment of the risks of material misstatement of the financial statements, whether due to fraud or error. In making those risk assessments, the auditor considers internal control relevant to the entity’s preparation and fair presentation of the financial statements in order to design audit procedures that are appropriate in the circumstances, but not for the purpose of expressing an opinion on the effectiveness of the entity’s internal control. Accordingly, we express no such opinion. An audit also includes evaluating the appropriateness of accounting policies used and the reasonableness of significant accounting estimates made by management, as well as evaluating the overall presentation of the financial statements. We believe that the audit evidence we have obtained is sufficient and appropriate to provide a basis for our audit opinions. Opinions In our opinion, the financial statements referred to above present fairly, in all material respects, the respective financial position of the governmental activities, the business-type activities, each major fund, and the aggregate remaining fund information of the City of Beverly, Massachusetts, as of June 30, 2019 (except for the Beverly Contributory Retirement System which is as of December 31, 2018), and the respective changes in financial position and cash flows, where applicable, thereof for the year then ended in conformity with accounting principles generally accepted in the United States of America.
14
Other Matters Required Supplementary Information Accounting principles generally accepted in the United States of America require that the management’s discussion and analysis and required supplementary information, as listed in the table of contents, be presented to supplement the basic financial statements. Such information, although not a part of the basic financial statements, is required by the Governmental Accounting Standards Board who considers it to be an essential part of financial reporting for placing the basic financial statements in an appropriate operational, economic, or historical context. We have applied certain limited procedures to the required supplementary information in accordance with auditing standards generally accepted in the United States of America, which consisted of inquiries of management about the methods of preparing the information and comparing the information for consistency with management’s responses to our inquiries, the basic financial statements, and other knowledge we obtained during our audit of the basic financial statements. We do not express an opinion or provide any assurance on the information because the limited procedures do not provide us with sufficient evidence to express an opinion or provide any assurance. Other Information Our audit was conducted for the purpose of forming opinions on the financial statements that collectively comprise the City of Beverly, Massachusetts’ basic financial statements. The introductory section, combining and individual fund statements, and statistical section are presented for purposes of additional analysis and are not a required part of the basic financial statements. The combining and individual fund statements, as listed in the table of contents, are the responsibility of management and were derived from and relate directly to the underlying accounting and other records used to prepare the basic financial statements. Such information has been subjected to the auditing procedures applied in the audit of the basic financial statements and certain additional procedures, including comparing and reconciling such information directly to the underlying accounting and other records used to prepare the basic financial statements or to the basic financial statements themselves, and other additional procedures in accordance with auditing standards generally accepted in the United States of America. In our opinion, the combining and individual fund statements are fairly stated, in all material respects, in relation to the basic financial statements as a whole. The introductory and statistical sections have not been subjected to the auditing procedures applied in the audit of the basic financial statements, and accordingly, we do not express an opinion or provide any assurance on them. Other Reporting Required by Government Auditing Standards In accordance with Government Auditing Standards, we have also issued our report dated December 24, 2019, on our consideration of the City of Beverly, Massachusetts’ internal control over financial reporting and our tests of its compliance with certain provisions of laws, regulations, contracts and grant agreements and other matters. The purpose of that report is to describe the scope of our testing of internal control over financial reporting and compliance and the results of that testing, and not to provide an opinion on the internal control over financial reporting or on compliance. That report is an integral part of an audit performed in accordance with Government Auditing Standards in considering the City of Beverly, Massachusetts’ internal control over financial reporting and compliance.
December 24, 2019

City of Beverly, Massachusetts 15 Comprehensive Annual Financial Report
Management’s Discussion and Analysis

City of Beverly, Massachusetts 16 Comprehensive Annual Financial Report
This page intentionally left blank.
City of Beverly, Massachusetts 17 Comprehensive Annual Financial Report
Management’s Discussion and Analysis As management of the City of Beverly, we offer readers of these financial statements this narrative overview and analysis of the financial activities for the year ended June 30, 2019. The City complies with financial reporting requirements issued by the Governmental Accounting Standards Board (GASB). The GASB is the authoritative standard setting body that provides guidance on how to prepare financial statements in conformity with generally accepted accounting principles (GAAP). Users of these financial statements (such as investors and rating agencies) rely on the GASB to establish consistent reporting standards for all governments in the United States. This consistent application is the only way users (including citizens, the media, legislators and others) can assess the financial condition of one government compared to others. Financial Highlights
The City’s credit rating was maintained at AA+ by Standard & Poor’s credit rating agency. The City approved a $731,000 transfer to the general stabilization fund in 2019 and the fund balance
totaled $12.6 million at year-end. The debt service stabilization fund totaled $1.0 million at year-end. The City raised $825,000 in community preservation taxes and received $149,000 of grant funds from the
Commonwealth of Massachusetts for its community preservation program. The fund balance totaled $2.9 million at year-end.
The liabilities and deferred inflows of resources of the City of Beverly exceeded its assets and deferred outflows of resources at the close of the most recent year by $128.5 million (net position).
At the end of the current year, the City’s general fund reported an ending fund balance of $27.2 million, an increase of $2.4 million in comparison with the prior year. Total fund balance represents 20% of total general fund expenditures.
The net other postemployment benefit (OPEB) liability increased by $35.4 million during the current year and the year-end balance totaled $339.8 million.
The net pension liability (NPL) liability increased by $8.9 million during the current year and the year-end balance totaled $91.3 million.
Overview of the Financial Statements This discussion and analysis is intended to serve as an introduction to the City of Beverly’s basic financial statements. These basic financial statements comprise of three components: 1) government-wide financial statements, 2) fund financial statements, and 3) notes to the financial statements. The basic financial statements focus on both the City as a whole (government-wide) and the fund financial statements. The government-wide financial statements provide both long-term and short-term information about the City as a whole. The fund financial statements focus on the individual parts of the City government, reporting the City’s operations in more detail than the government-wide statements. Both presentations (government-wide and fund) allow the user to address relevant questions, broaden the basis of comparison and enhance the City’s accountability. An additional part of the basic financial statements are the notes to the financial statements. This report also contains other supplementary information in addition to the basic financial statements themselves.
City of Beverly, Massachusetts 18 Comprehensive Annual Financial Report
Government-wide financial statements. The government-wide financial statements are designed to provide readers with a broad overview of finances, in a manner similar to private-sector business. The statement of net position presents information on all assets and liabilities, and deferred inflows/outflows of resources, with the difference between them reported as net position. Over time, increases or decreases in net position may serve as a useful indicator of whether the financial position is improving or deteriorating. The statement of activities presents information showing how the government’s net position changed during the most recent year. All changes in net position are reported as soon as the underlying event giving rise to the change occurs, regardless of the timing of related cash flows. Thus, revenues and expenses are reported in this statement for some items that will only result in cash flows in future periods (e.g., uncollected taxes and earned but unused vacation leave). Both of the government-wide financial statements distinguish functions that are principally supported by taxes and intergovernmental revenues (governmental activities) from other functions that are intended to recover all or a significant portion of their costs through user fees and charges (business-type activities). The governmental activities include general government, public safety, education, public works, community development, community preservation, human services, culture and recreation and interest. The business-type activities include the activities of the water, sewer, airport, golf and tennis, sanitation, harbor management, recreation and senior citizens funds. The government-wide financial statements include not only the City of Beverly itself (known as the primary government), but also a legally separate public employee retirement system for which the City of Beverly is financially accountable. Financial information for this component unit is reported separately within the fiduciary fund statements. Fund financial statements. A fund is a grouping of related accounts that is used to maintain control over resources that have been segregated for specific activities or objectives. Fund accounting is used to ensure and demonstrate compliance with finance-related legal requirements. All of the funds can be divided into three categories: governmental funds, proprietary funds, and fiduciary funds. Governmental funds. The focus of the City of Beverly’s governmental funds is to provide information on near-term inflows, outflows, and balances of spendable resources. Such information is useful in assessing the City of Beverly’s financing requirements. In particular, unassigned fund balance may serve as a useful measure of a government’s net resources available for spending at the end of the year. Because the focus of governmental funds is narrower than that of the government-wide financial statements, it is useful to compare the information presented for governmental funds with similar information presented for governmental activities in the government-wide financial statements. By doing so, readers may better understand the long-term impact of the government’s near-term financing decisions. Both the governmental fund balance sheet and the governmental fund statement of revenues, expenditures, and changes in fund balances provide a reconciliation to facilitate this comparison between governmental funds and governmental activities. The City of Beverly adopts an annual appropriated budget for its general fund. A budgetary comparison statement has been provided for the general fund to demonstrate compliance with this budget. Proprietary funds. The City maintains two types of propriety funds. Enterprise funds are used to report the same functions presented as business-type activities in the government-wide financial statements. The City uses enterprise funds to account for its water, sewer, airport, golf and tennis, sanitation, harbor management, recreation and senior citizens activities.
City of Beverly, Massachusetts 19 Comprehensive Annual Financial Report
The internal service fund is used to account for the financing of services provided by one department to other departments or governmental units. This fund is used to account for risk financing activities related to employees’ health insurance. Fiduciary funds. Fiduciary funds are used to account for resources held for the benefit of parties outside the government. Fiduciary funds are not reflected in the government-wide financial statement because the resources of those funds are not available to support the City’s own programs. The accounting used for fiduciary funds is much like that used for propriety funds. Notes to the basic financial statements. The notes provide additional information that is essential to a full understanding of the data provided in the government-wide and fund financial statements.
Government-wide Financial Analysis As noted earlier, net position may serve over time as a useful indicator of a government’s financial position. The City of Beverly’s liabilities and deferred inflows of resources exceeded assets and deferred outflows of resources by $128.5 million at the close of 2019, which was a decrease of $8.6 million from the prior year. Net position of $219.8 million reflects its net investment in capital assets (e.g., land, land improvements, buildings and building improvements, machinery and equipment, vehicles and infrastructure); less any related debt used to acquire those assets that are still outstanding. The City uses these capital assets to provide services to citizens; consequently, these assets are not available for future spending. Although the investment in its capital assets is reported net of its related debt, it should be noted that the resources needed to repay this debt must be provided from other sources, since the capital assets themselves cannot be used to liquidate these liabilities. An additional portion of the governmental net position, $13.5 million, represents resources that are subject to external restrictions on how they may be used. The balance of unrestricted net position has a year-end deficit of $361.8 million. The primary reason for this deficit balance is the recognition of the net other postemployment benefit liability and net pension liabilities totaling $339.8 million and $91.3 million, respectively. The governmental and business-type activities of the City are presented on the following pages.
City of Beverly, Massachusetts 20 Comprehensive Annual Financial Report
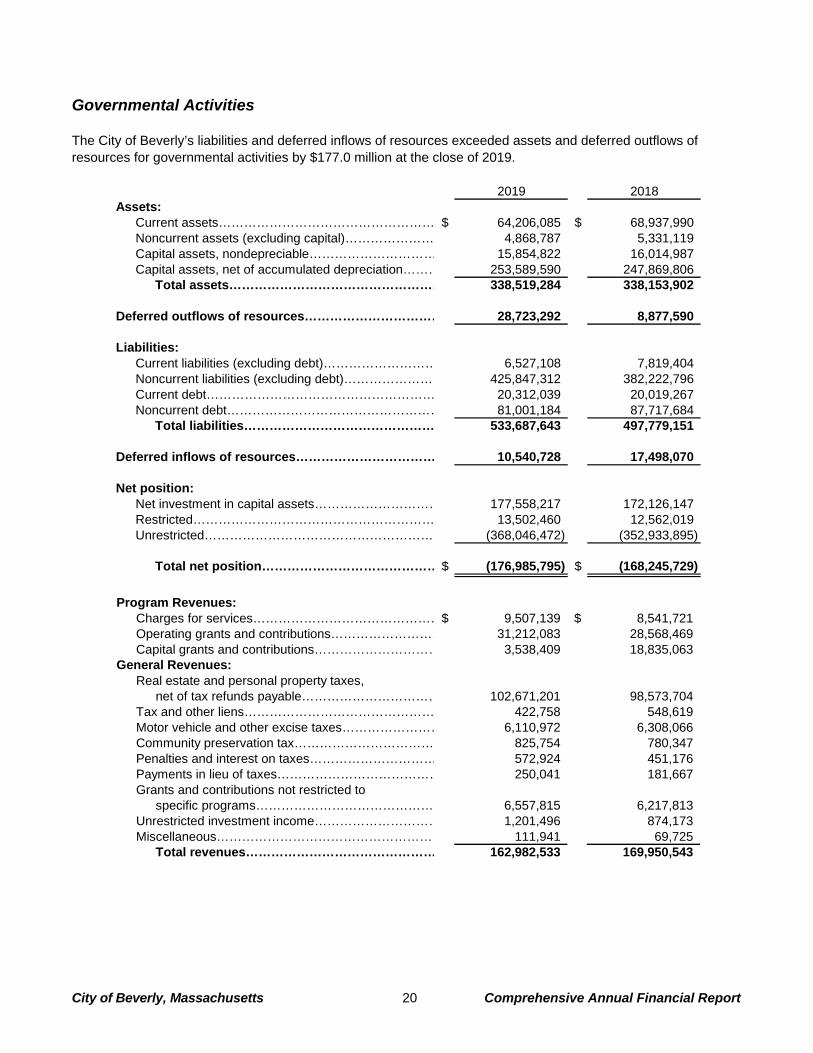
Governmental Activities The City of Beverly’s liabilities and deferred inflows of resources exceeded assets and deferred outflows of resources for governmental activities by $177.0 million at the close of 2019.
2019 2018Assets:
Current assets…………………………………………… $ 64,206,085 $ 68,937,990 Noncurrent assets (excluding capital)………………… 4,868,787 5,331,119 Capital assets, nondepreciable………………………… 15,854,822 16,014,987 Capital assets, net of accumulated depreciation……… 253,589,590 247,869,806
Total assets…………………………………………… 338,519,284 338,153,902
Deferred outflows of resources…………………………… 28,723,292 8,877,590
Liabilities: Current liabilities (excluding debt)……………………… 6,527,108 7,819,404 Noncurrent liabilities (excluding debt)………………… 425,847,312 382,222,796 Current debt……………………………………………… 20,312,039 20,019,267 Noncurrent debt…………………………………………… 81,001,184 87,717,684
Total liabilities……………………………………… 533,687,643 497,779,151
Deferred inflows of resources…………………………… 10,540,728 17,498,070
Net position: Net investment in capital assets………………………… 177,558,217 172,126,147 Restricted………………………………………………… 13,502,460 12,562,019 Unrestricted……………………………………………… (368,046,472) (352,933,895)
Total net position…………………………………… $ (176,985,795) $ (168,245,729)
Program Revenues:
Charges for services………………………………………$ 9,507,139 $ 8,541,721 Operating grants and contributions……………………… 31,212,083 28,568,469 Capital grants and contributions………………………… 3,538,409 18,835,063
General Revenues: Real estate and personal property taxes,
net of tax refunds payable…………………………… 102,671,201 98,573,704 Tax and other liens……………………………………… 422,758 548,619 Motor vehicle and other excise taxes…………………… 6,110,972 6,308,066 Community preservation tax…………………………… 825,754 780,347 Penalties and interest on taxes………………………… 572,924 451,176 Payments in lieu of taxes………………………………… 250,041 181,667 Grants and contributions not restricted to
specific programs…………………………………… 6,557,815 6,217,813 Unrestricted investment income………………………… 1,201,496 874,173 Miscellaneous……………………………………………… 111,941 69,725
Total revenues……………………………………… 162,982,533 169,950,543
City of Beverly, Massachusetts 21 Comprehensive Annual Financial Report
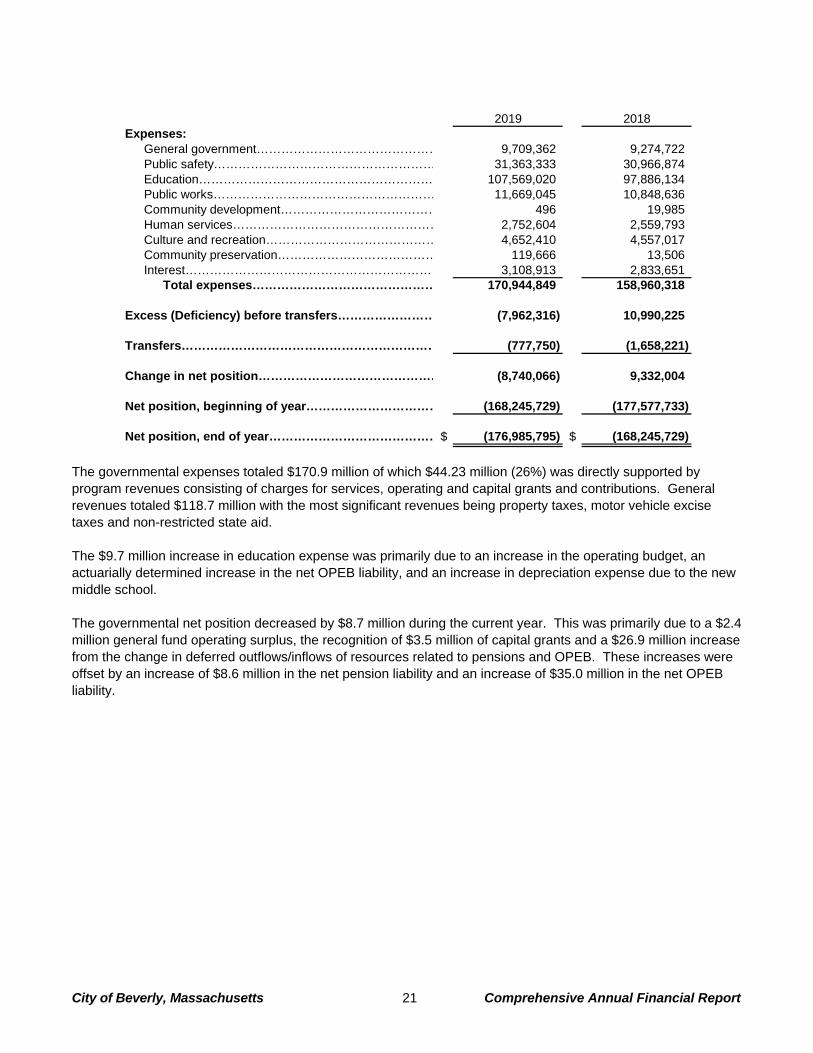
2019 2018Expenses:
General government……………………………………… 9,709,362 9,274,722 Public safety……………………………………………… 31,363,333 30,966,874 Education………………………………………………… 107,569,020 97,886,134 Public works……………………………………………… 11,669,045 10,848,636 Community development………………………………… 496 19,985 Human services…………………………………………… 2,752,604 2,559,793 Culture and recreation…………………………………… 4,652,410 4,557,017 Community preservation………………………………… 119,666 13,506 Interest……………………………………………………… 3,108,913 2,833,651
Total expenses……………………………………… 170,944,849 158,960,318
Excess (Deficiency) before transfers…………………… (7,962,316) 10,990,225
Transfers……………………………………………………… (777,750) (1,658,221)
Change in net position……………………………………… (8,740,066) 9,332,004
Net position, beginning of year…………………………… (168,245,729) (177,577,733)
Net position, end of year……………………………………$ (176,985,795) $ (168,245,729)
The governmental expenses totaled $170.9 million of which $44.23 million (26%) was directly supported by program revenues consisting of charges for services, operating and capital grants and contributions. General revenues totaled $118.7 million with the most significant revenues being property taxes, motor vehicle excise taxes and non-restricted state aid. The $9.7 million increase in education expense was primarily due to an increase in the operating budget, an actuarially determined increase in the net OPEB liability, and an increase in depreciation expense due to the new middle school. The governmental net position decreased by $8.7 million during the current year. This was primarily due to a $2.4 million general fund operating surplus, the recognition of $3.5 million of capital grants and a $26.9 million increase from the change in deferred outflows/inflows of resources related to pensions and OPEB. These increases were offset by an increase of $8.6 million in the net pension liability and an increase of $35.0 million in the net OPEB liability.
City of Beverly, Massachusetts 22 Comprehensive Annual Financial Report
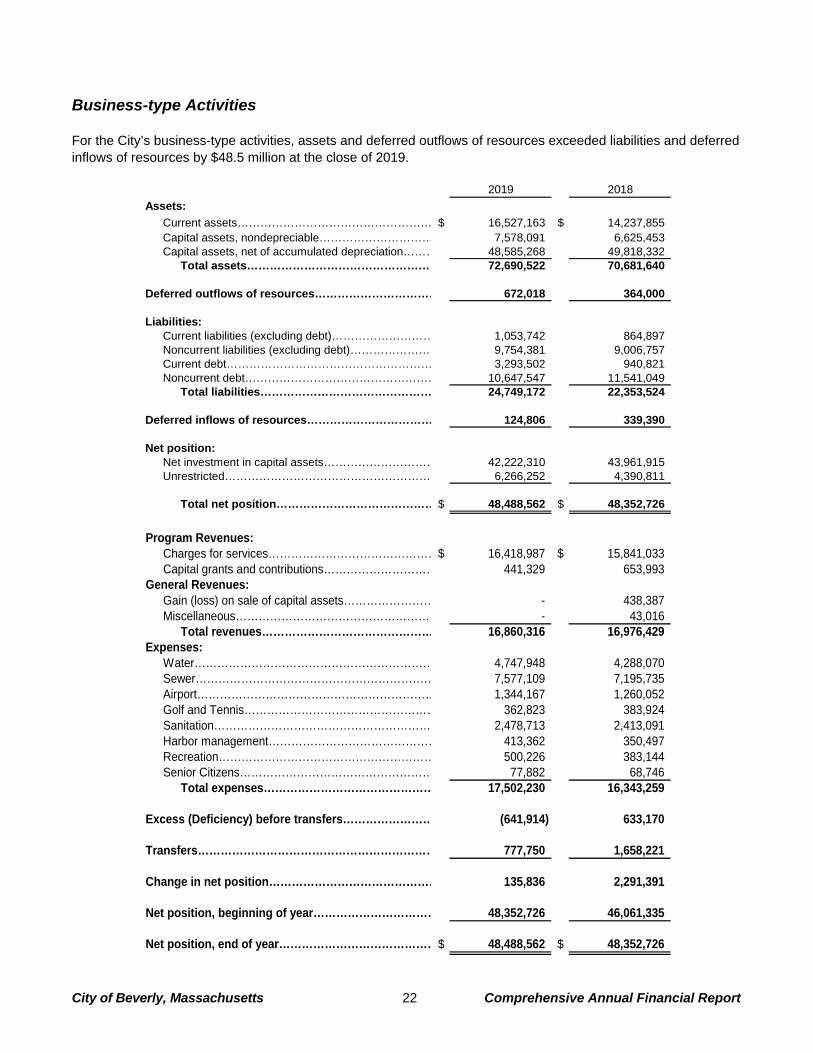
Business-type Activities For the City’s business-type activities, assets and deferred outflows of resources exceeded liabilities and deferred inflows of resources by $48.5 million at the close of 2019.
2019 2018
Assets:
Current assets…………………………………………… $ 16,527,163 $ 14,237,855 Capital assets, nondepreciable………………………… 7,578,091 6,625,453 Capital assets, net of accumulated depreciation……… 48,585,268 49,818,332
Total assets…………………………………………… 72,690,522 70,681,640
Deferred outflows of resources…………………………… 672,018 364,000
Liabilities: Current liabilities (excluding debt)……………………… 1,053,742 864,897 Noncurrent liabilities (excluding debt)………………… 9,754,381 9,006,757 Current debt……………………………………………… 3,293,502 940,821 Noncurrent debt…………………………………………… 10,647,547 11,541,049
Total liabilities……………………………………… 24,749,172 22,353,524
Deferred inflows of resources…………………………… 124,806 339,390
Net position: Net investment in capital assets………………………… 42,222,310 43,961,915 Unrestricted……………………………………………… 6,266,252 4,390,811
Total net position…………………………………… $ 48,488,562 $ 48,352,726
Program Revenues:
Charges for services………………………………………$ 16,418,987 $ 15,841,033 Capital grants and contributions………………………… 441,329 653,993
General Revenues: Gain (loss) on sale of capital assets…………………… - 438,387 Miscellaneous……………………………………………… - 43,016
Total revenues……………………………………… 16,860,316 16,976,429 Expenses:
Water……………………………………………………… 4,747,948 4,288,070 Sewer……………………………………………………… 7,577,109 7,195,735 Airport……………………………………………………… 1,344,167 1,260,052 Golf and Tennis…………………………………………… 362,823 383,924 Sanitation………………………………………………… 2,478,713 2,413,091 Harbor management……………………………………… 413,362 350,497 Recreation………………………………………………… 500,226 383,144 Senior Citizens…………………………………………… 77,882 68,746
Total expenses……………………………………… 17,502,230 16,343,259
Excess (Deficiency) before transfers…………………… (641,914) 633,170
Transfers……………………………………………………… 777,750 1,658,221
Change in net position……………………………………… 135,836 2,291,391
Net position, beginning of year…………………………… 48,352,726 46,061,335
Net position, end of year……………………………………$ 48,488,562 $ 48,352,726
City of Beverly, Massachusetts 23 Comprehensive Annual Financial Report
Business-type net position of $42.2 million (87%) represents the net investment in capital assets while $6.3 million (13%) is unrestricted. The City’s business-type activities net position increased by $136,000 in the current year. The water operations experienced an increase of $462,000 in net position. This increase was primarily due to a $251,000 operating surplus, a $68,000 decrease in the workers’ compensation liability, and a $159,000 increase from the change in deferred outflows/inflows of resources related to pensions and OPEB. These increases were offset by a $138,000 increase in the net pension liability and a $155,000 increase in the net OPEB liability. The sewer operations experienced an increase of $665,000 in net position. This increase is mainly attributable to a $1.0 million operating surplus and a $237,000 increase from the change in deferred outflows/inflows of resources related to pensions and OPEB. These increases were offset by a $152,000 increase in the net pension liability, a $220,000 increase in the net OPEB liability and a $116,000 decrease in the investment in joint venture. The airport operations experienced a decrease of $509,000 in net position. The decrease is mainly attributable to current rates not being set to raise revenue to support non-cash depreciation expense of $717,000. This decrease was offset by capital grants totaling $299,000. The golf and tennis operations experienced an increase of $146,000. The increase is mainly attributable to a $89,000 transfer from the Community Preservation Fund for capital purposes. Sanitation operations experienced an increase of $39,000, which was primarily due to a $1.0 million operating loss, offset by a subsidy of $1.1 million from the general fund. The harbor management operations experienced a decrease of $81,000, which is primarily due to the recognition of capital grants totaling $142,000, offset by rates not being set to raise revenue to support $237,000 of non-cash depreciation expense. The recreation operations experienced a decrease of $565,000, which is primarily due to a $450,000 transfer to the Community Preservation fund. The senior citizens operations experienced a decrease of $21,000, which is primarily due to fees not being set to raise revenue to support $5,000 of non-cash depreciation expense. The internal service fund experienced a decrease of $152,000, which is primarily due to claims experience.
Financial Analysis of the Government’s Funds As noted earlier, the City uses fund accounting to ensure and demonstrate compliance with finance-related legal requirements. Governmental funds. The focus of the City’s governmental funds is to provide information on near-term inflows, outflows, and balances of spendable resources. Such information is useful in assessing financing requirements. In particular, unassigned fund balance may serve as a useful measure of a government’s net resources available for spending at the end of the year. As of the end of the current year, governmental funds reported combined ending fund balances of $37.0 million, of which $27.2 million is for the general fund, $2.9 million is for the community preservation fund, a $10.9 million deficit is for the middle school construction fund, and $17.8 million is for the nonmajor governmental funds. Cumulatively there was a decrease of $3.3 million in fund balances from the prior year. The general fund is the chief operating fund. At the end of the current year, unassigned fund balance of the general fund was $24.5 million, while total fund balance was $27.2 million. As a measure of the general fund’s
City of Beverly, Massachusetts 24 Comprehensive Annual Financial Report
liquidity, it may be useful to compare both unassigned fund balance and the total fund balance to total fund expenditures. Unassigned fund balance represents 18% of the total general fund expenditures, while total fund balance represents 20% of that same amount. $1.0 million of fund balance is committed for debt service stabilization and $1.7 million of fund balance is assigned for encumbrances that have been carried forward to the next year. In 2019, the City’s general fund increased by $2.4 million. This increase is primarily due to $1.7 million of better than anticipated revenue collections and $2.0 millon of unexpended appropriations that was offset by the use of free cash to fund appropriations. The community preservation fund was established through the City’s acceptance of the Community Preservation Act, which allows the City to impose up to a 1% surcharge on property taxes and to receive matching State grant funds for specified uses related to the acquisition, creation, preservation and support of open space, historical resources, land for recreational use and community housing. As of June 30, 2019, the fund balance totaled $2.9 million. $825,000 of community preservation taxes were collected during the year and $149,000 of state matching funds were also received. The middle school construction fund is used to account for construction activities related to the new middle school. The City recognized $2.8 million of school construction assistance and $10.6 million of expenditures in 2019 resulting in an ending fund balance deficit of $10.9 million. This deficit will be funded with bond proceeds and additional school construction assistance.
General Fund Budgetary Highlights The City adopts an annual budget for the general fund. The original 2019 budget authorized $131.2 million in appropriations and other amounts to be raised, which includes $1.4 million of amounts carried forward from the prior year. During 2019, the Council approved supplemental appropriations totaling $3.5 million, which included a $731,000 transfer to the stabilization fund and $2.5 million of transfers to capital project funds
Capital Asset and Debt Administration Capital Assets. In conjunction with the annual operating budget, the City annually prepares a capital budget for the upcoming year and a five-year Capital Improvement Plan (CIP) that is used as a guide for future capital expenditures. The City’s investment in capital assets for its governmental and business-type activities as of June 30, 2019, amounts to $325.6 million (net of accumulated depreciation). This investment in capital assets includes land, construction in progress, land improvements, buildings and building improvements, machinery and equipment, vehicles and infrastructure. The total additions to the governmental activities investment in capital assets for the current year were $17.3 million and total retirements were $21.2 million. Major capital asset events during the current year include middle school construction, the installation of LED street lights, Beverly High School athletic field improvements, parking improvements, and street paving. The $2.7 million in additions to the business-type activities are attributable to water, sewer infrastructure improvements, building improvements, and purchases of vehicles, machinery and equipment, and land.
City of Beverly, Massachusetts 25 Comprehensive Annual Financial Report
Debt Administration. Outstanding long-term governmental debt of the City, as of June 30, 2019, totaled $87.3 million. The Commonwealth has approved school construction assistance to the City. The assistance program, which is administered by the MSBA, provides resources for future debt service of general obligation school bonds outstanding. During 2019, $868,000 of such assistance was received and $2.6 million will be received in future years. Of this amount, $231,000 represents reimbursement of long-term interest costs, and $2.4 million represents reimbursement of approved construction costs. Accordingly, a $2.4 million intergovernmental receivable and corresponding deferred inflow of resources have been reported in the governmental fund financial statements. The deferred inflow of resources has been recognized as revenue in the conversion to the government-wide financial statements. The MSBA has an additional method for funding the school building assistance program in which the assistance is paid to support construction costs and reduce the total debt service of the City. The City has been approved for the Briscoe Middle School construction project. Through the end of 2019, the City has received $45.2 million of capital grant reimbursements from the MSBA which is equal to 42.42% of approved construction costs incurred to date for the new middle school. The City anticipates receiving an additional $981,000 of grant proceeds in 2020. At year-end, the water, sewer, and golf and tennis enterprise funds have $2.8 million, $7.5 million and $1.2 million, respectively, of outstanding long-term debt, which is fully supported by rates and does not rely on a general fund subsidy. The City had outstanding short-term debt of $12.5 million for middle school construction and $860,000 for parking kiosks and traffic equipment. The water enterprise fund had outstanding short-term debt of $2.4 million for the Brimball Avenue standpipe and the Pershing Avenue water pump station. Please refer to notes 4, 7 and 8 to the financial statements for further discussion of the major capital and debt activity.
Requests for Information This financial report is designed to provide a general overview of the City of Beverly’s finances for all those with an interest in the government’s finances. Questions concerning any of the information provided in this report or requests for additional financial information should be addressed to the City Accountant, City Hall, 191 Cabot Street, Beverly, Massachusetts, 01915.

City of Beverly, Massachusetts 26 Comprehensive Annual Financial Report
This page intentionally left blank.

City of Beverly, Massachusetts 27 Comprehensive Annual Financial Report
Basic Financial Statements
Basic Financial Statements

City of Beverly, Massachusetts 28 Comprehensive Annual Financial Report
This page intentionally left blank.
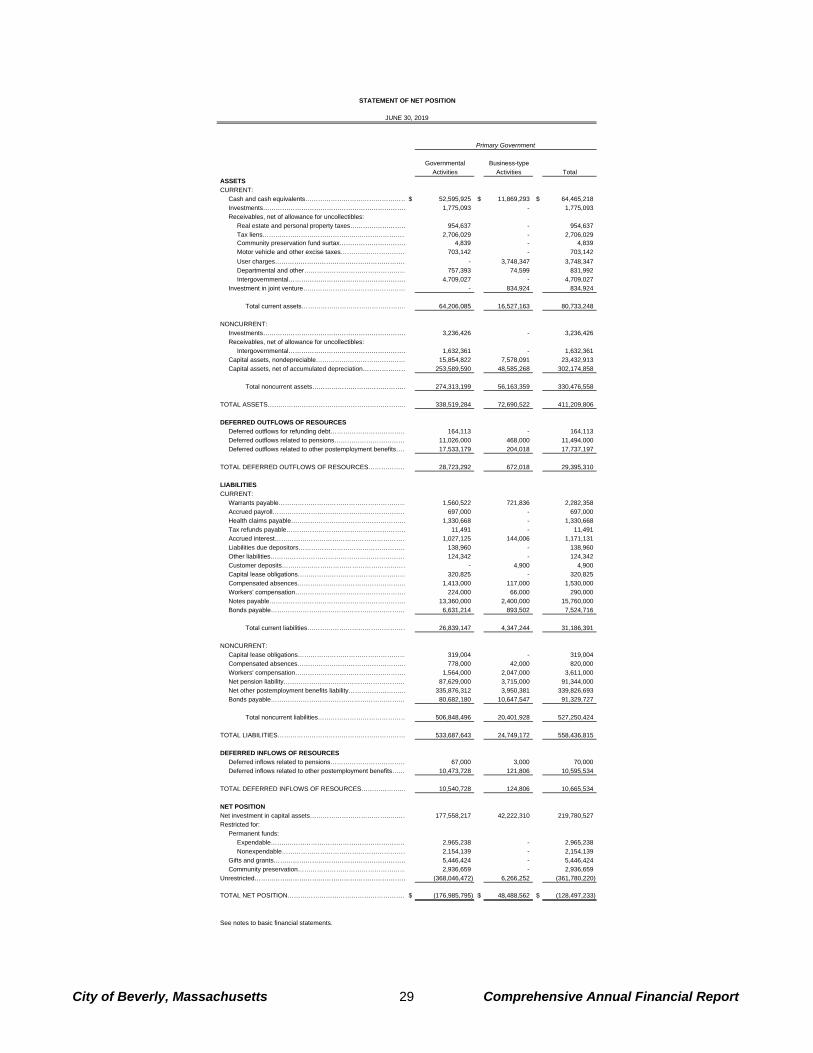
Governmental Business-type
Activities Activities Total
ASSETS
CURRENT:
Cash and cash equivalents………………………………………… $ 52,595,925 $ 11,869,293 $ 64,465,218
Investments…………………………………………………………… 1,775,093 - 1,775,093
Receivables, net of allowance for uncollectibles:
Real estate and personal property taxes……………………… 954,637 - 954,637
Tax liens……………………………………...…………………… 2,706,029 - 2,706,029 Community preservation fund surtax…………………………… 4,839 - 4,839
Motor vehicle and other excise taxes………………………… 703,142 - 703,142
User charges……………………………………………………… - 3,748,347 3,748,347
Departmental and other………………………………………… 757,393 74,599 831,992
Intergovernmental………………………………………………… 4,709,027 - 4,709,027
Investment in joint venture………………………………………… - 834,924 834,924
Total current assets…………………………………………… 64,206,085 16,527,163 80,733,248
NONCURRENT:
Investments…………………………………………………………… 3,236,426 - 3,236,426
Receivables, net of allowance for uncollectibles:
Intergovernmental………………………………………………… 1,632,361 - 1,632,361
Capital assets, nondepreciable…………………………………… 15,854,822 7,578,091 23,432,913
Capital assets, net of accumulated depreciation………………… 253,589,590 48,585,268 302,174,858
Total noncurrent assets……………………………………… 274,313,199 56,163,359 330,476,558
TOTAL ASSETS………………………………………………………… 338,519,284 72,690,522 411,209,806
DEFERRED OUTFLOWS OF RESOURCES
Deferred outflows for refunding debt……………………………… 164,113 - 164,113
Deferred outflows related to pensions…………………………… 11,026,000 468,000 11,494,000
Deferred outflows related to other postemployment benefits…… 17,533,179 204,018 17,737,197
TOTAL DEFERRED OUTFLOWS OF RESOURCES……………… 28,723,292 672,018 29,395,310
LIABILITIES
CURRENT:
Warrants payable…………………………………………………… 1,560,522 721,836 2,282,358
Accrued payroll……………………………………………………… 697,000 - 697,000
Health claims payable……………………………………………… 1,330,668 - 1,330,668
Tax refunds payable………………………………………………… 11,491 - 11,491
Accrued interest……………………………………………………… 1,027,125 144,006 1,171,131
Liabilities due depositors…………………………………………… 138,960 - 138,960
Other liabilities……………………………………………………… 124,342 - 124,342
Customer deposits…………………………………………………… - 4,900 4,900
Capital lease obligations…………………………………………… 320,825 - 320,825
Compensated absences…………………………………………… 1,413,000 117,000 1,530,000
Workers' compensation……………………………………………… 224,000 66,000 290,000
Notes payable………………………………………………………… 13,360,000 2,400,000 15,760,000
Bonds payable……………………………………………………… 6,631,214 893,502 7,524,716
Total current liabilities………………………………………… 26,839,147 4,347,244 31,186,391
NONCURRENT:
Capital lease obligations…………………………………………… 319,004 - 319,004
Compensated absences…………………………………………… 778,000 42,000 820,000
Workers' compensation……………………………………………… 1,564,000 2,047,000 3,611,000
Net pension liability………………………………………………… 87,629,000 3,715,000 91,344,000
Net other postemployment benefits liability……………………… 335,876,312 3,950,381 339,826,693
Bonds payable……………………………………………………… 80,682,180 10,647,547 91,329,727
Total noncurrent liabilities…………………………………… 506,848,496 20,401,928 527,250,424
TOTAL LIABILITIES…………………………………………………… 533,687,643 24,749,172 558,436,815
DEFERRED INFLOWS OF RESOURCES
Deferred inflows related to pensions……………………………… 67,000 3,000 70,000
Deferred inflows related to other postemployment benefits…… 10,473,728 121,806 10,595,534
TOTAL DEFERRED INFLOWS OF RESOURCES………………… 10,540,728 124,806 10,665,534
NET POSITION
Net investment in capital assets………………………………..……… 177,558,217 42,222,310 219,780,527
Restricted for:
Permanent funds:
Expendable……….……………………………………………… 2,965,238 - 2,965,238
Nonexpendable…………………………………………………… 2,154,139 - 2,154,139
Gifts and grants……………………………………………………… 5,446,424 - 5,446,424
Community preservation…………………………………………… 2,936,659 - 2,936,659
Unrestricted……………………………………………………………… (368,046,472) 6,266,252 (361,780,220)
TOTAL NET POSITION…………………………………………………$ (176,985,795) $ 48,488,562 $ (128,497,233)
See notes to basic financial statements.
Primary Government
STATEMENT OF NET POSITION
JUNE 30, 2019
City of Beverly, Massachusetts 29 Comprehensive Annual Financial Report
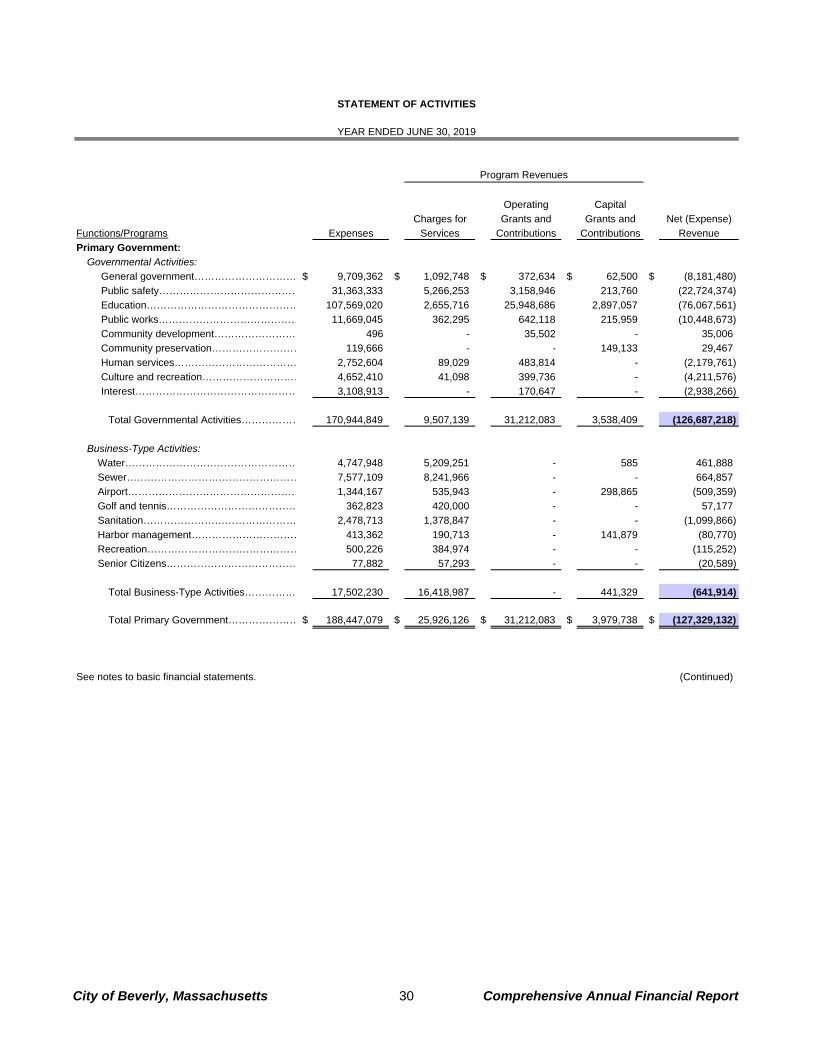
Operating Capital
Charges for Grants and Grants and Net (Expense)
Functions/Programs Expenses Services Contributions Contributions Revenue
Primary Government:
Governmental Activities:
General government………………………… $ 9,709,362 $ 1,092,748 $ 372,634 $ 62,500 $ (8,181,480)
Public safety…………………………………… 31,363,333 5,266,253 3,158,946 213,760 (22,724,374)
Education……………………………………… 107,569,020 2,655,716 25,948,686 2,897,057 (76,067,561)
Public works…………………………………… 11,669,045 362,295 642,118 215,959 (10,448,673)
Community development…………………… 496 - 35,502 - 35,006
Community preservation……………………… 119,666 - - 149,133 29,467
Human services……………………………… 2,752,604 89,029 483,814 - (2,179,761)
Culture and recreation………………………… 4,652,410 41,098 399,736 - (4,211,576)
Interest………………………………………… 3,108,913 - 170,647 - (2,938,266)
Total Governmental Activities……………… 170,944,849 9,507,139 31,212,083 3,538,409 (126,687,218)
Business-Type Activities:
Water…………………………………………… 4,747,948 5,209,251 - 585 461,888
Sewer…………………………………………… 7,577,109 8,241,966 - - 664,857
Airport…………………………………………… 1,344,167 535,943 - 298,865 (509,359)
Golf and tennis………………………………… 362,823 420,000 - - 57,177
Sanitation……………………………………… 2,478,713 1,378,847 - - (1,099,866)
Harbor management…………………………… 413,362 190,713 - 141,879 (80,770)
Recreation……………………………………… 500,226 384,974 - - (115,252)
Senior Citizens………………………………… 77,882 57,293 - - (20,589)
Total Business-Type Activities…………… 17,502,230 16,418,987 - 441,329 (641,914)
Total Primary Government………………… $ 188,447,079 $ 25,926,126 $ 31,212,083 $ 3,979,738 $ (127,329,132)
See notes to basic financial statements. (Continued)
STATEMENT OF ACTIVITIES
YEAR ENDED JUNE 30, 2019
Program Revenues
City of Beverly, Massachusetts 30 Comprehensive Annual Financial Report
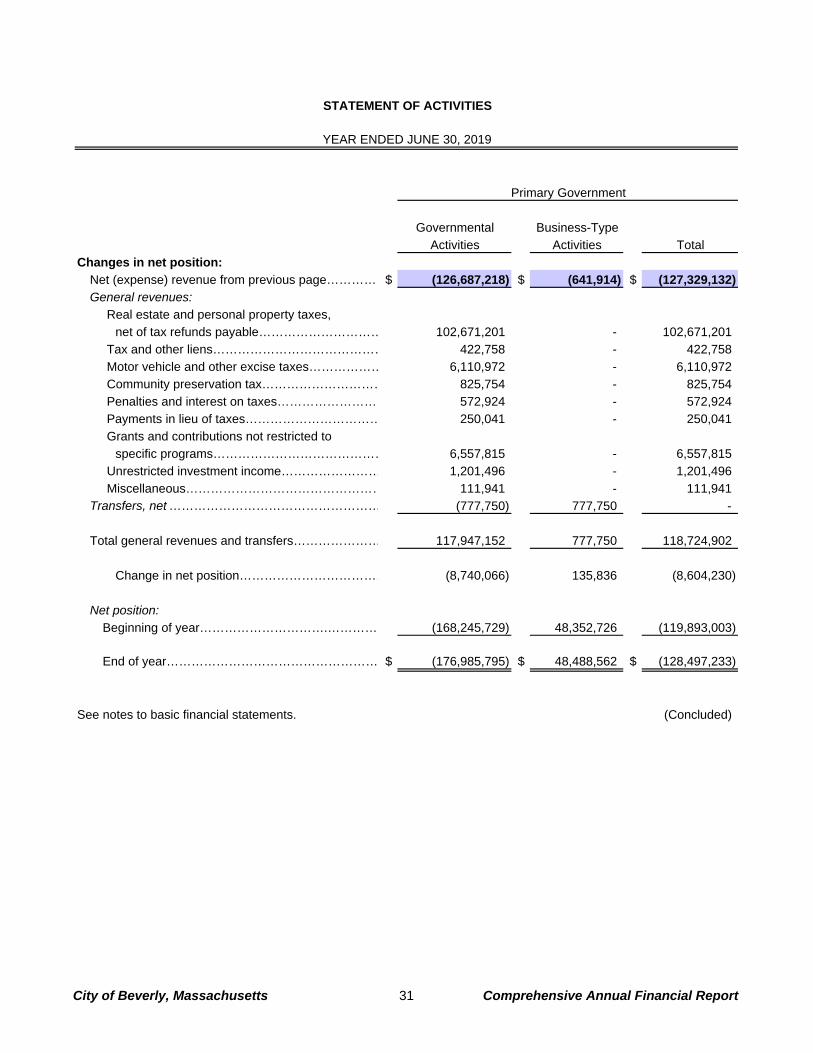
Governmental Business-Type
Activities Activities Total
Changes in net position:
Net (expense) revenue from previous page……………$ (126,687,218) $ (641,914) $ (127,329,132)
General revenues:
Real estate and personal property taxes,
net of tax refunds payable………………………… 102,671,201 - 102,671,201
Tax and other liens…………………………………… 422,758 - 422,758
Motor vehicle and other excise taxes……………… 6,110,972 - 6,110,972
Community preservation tax………………………… 825,754 - 825,754
Penalties and interest on taxes……………………… 572,924 - 572,924
Payments in lieu of taxes…………………………… 250,041 - 250,041
Grants and contributions not restricted to
specific programs…………………………………… 6,557,815 - 6,557,815
Unrestricted investment income…………………… 1,201,496 - 1,201,496
Miscellaneous………………………………………… 111,941 - 111,941 Transfers, net …………………………………………… (777,750) 777,750 -
Total general revenues and transfers………………… 117,947,152 777,750 118,724,902
Change in net position……………………………… (8,740,066) 135,836 (8,604,230)
Net position:
Beginning of year………………………….………… (168,245,729) 48,352,726 (119,893,003)
End of year…………………………………………… $ (176,985,795) $ 48,488,562 $ (128,497,233)
See notes to basic financial statements. (Concluded)
Primary Government
STATEMENT OF ACTIVITIES
YEAR ENDED JUNE 30, 2019
City of Beverly, Massachusetts 31 Comprehensive Annual Financial Report
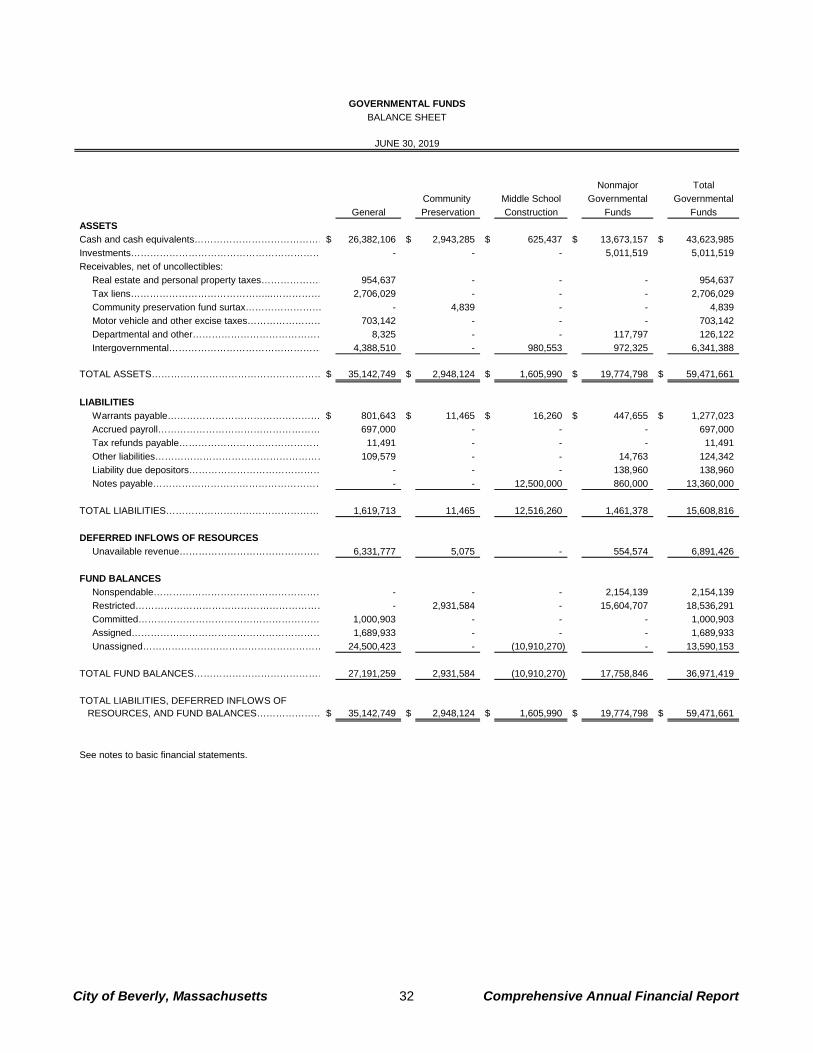
Nonmajor Total
Community Middle School Governmental Governmental
General Preservation Construction Funds Funds
ASSETS
Cash and cash equivalents……………………………………$ 26,382,106 $ 2,943,285 $ 625,437 $ 13,673,157 $ 43,623,985
Investments…………………………………………………… - - - 5,011,519 5,011,519
Receivables, net of uncollectibles:
Real estate and personal property taxes………………… 954,637 - - - 954,637
Tax liens……………………………………...…………… 2,706,029 - - - 2,706,029
Community preservation fund surtax…………………… - 4,839 - - 4,839
Motor vehicle and other excise taxes…………………… 703,142 - - - 703,142
Departmental and other…………………………………… 8,325 - - 117,797 126,122
Intergovernmental………………………………………… 4,388,510 - 980,553 972,325 6,341,388
TOTAL ASSETS……………………………………………… $ 35,142,749 $ 2,948,124 $ 1,605,990 $ 19,774,798 $ 59,471,661
LIABILITIES
Warrants payable………………………………………… $ 801,643 $ 11,465 $ 16,260 $ 447,655 $ 1,277,023
Accrued payroll…………………………………………… 697,000 - - - 697,000
Tax refunds payable……………………………………… 11,491 - - - 11,491
Other liabilities……………………………………………… 109,579 - - 14,763 124,342
Liability due depositors…………………………………… - - - 138,960 138,960
Notes payable……………………………………………… - - 12,500,000 860,000 13,360,000
TOTAL LIABILITIES…………………………………………… 1,619,713 11,465 12,516,260 1,461,378 15,608,816
DEFERRED INFLOWS OF RESOURCES
Unavailable revenue……………………………………… 6,331,777 5,075 - 554,574 6,891,426
FUND BALANCES
Nonspendable……………………………………………… - - - 2,154,139 2,154,139
Restricted…………………………………………………… - 2,931,584 - 15,604,707 18,536,291
Committed………………………………………………… 1,000,903 - - - 1,000,903
Assigned…………………………………………………… 1,689,933 - - - 1,689,933
Unassigned………………………………………………… 24,500,423 - (10,910,270) - 13,590,153
TOTAL FUND BALANCES…………………………………… 27,191,259 2,931,584 (10,910,270) 17,758,846 36,971,419
TOTAL LIABILITIES, DEFERRED INFLOWS OF RESOURCES, AND FUND BALANCES………………… $ 35,142,749 $ 2,948,124 $ 1,605,990 $ 19,774,798 $ 59,471,661
See notes to basic financial statements.
GOVERNMENTAL FUNDS
BALANCE SHEET
JUNE 30, 2019
City of Beverly, Massachusetts 32 Comprehensive Annual Financial Report
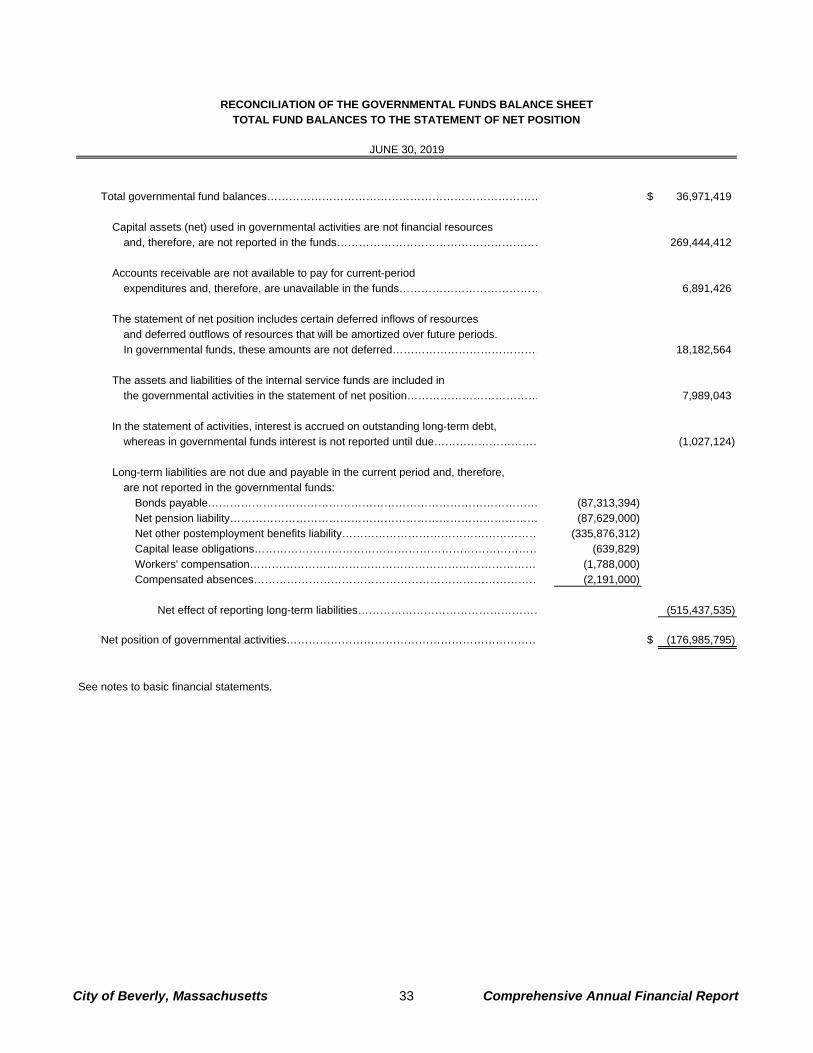
Total governmental fund balances………………………………………………………………… $ 36,971,419
Capital assets (net) used in governmental activities are not financial resources and, therefore, are not reported in the funds………………………………………………… 269,444,412
Accounts receivable are not available to pay for current-period
expenditures and, therefore, are unavailable in the funds………………………………… 6,891,426
The statement of net position includes certain deferred inflows of resourcesand deferred outflows of resources that will be amortized over future periods.In governmental funds, these amounts are not deferred…………………………………… 18,182,564
The assets and liabilities of the internal service funds are included in the governmental activities in the statement of net position……………………………… 7,989,043
In the statement of activities, interest is accrued on outstanding long-term debt,
whereas in governmental funds interest is not reported until due………………………… (1,027,124)
Long-term liabilities are not due and payable in the current period and, therefore, are not reported in the governmental funds:
Bonds payable……………………………………………………………………………… (87,313,394) Net pension liability………………………………………………………………………… (87,629,000) Net other postemployment benefits liability……………………………………………… (335,876,312) Capital lease obligations…………………………………………………………………… (639,829) Workers' compensation…………………………………………………………………… (1,788,000) Compensated absences…………………………………………………………………… (2,191,000)
Net effect of reporting long-term liabilities…………………………………………… (515,437,535)
Net position of governmental activities…………………………………………………………… $ (176,985,795)
See notes to basic financial statements.
RECONCILIATION OF THE GOVERNMENTAL FUNDS BALANCE SHEETTOTAL FUND BALANCES TO THE STATEMENT OF NET POSITION
JUNE 30, 2019
City of Beverly, Massachusetts 33 Comprehensive Annual Financial Report
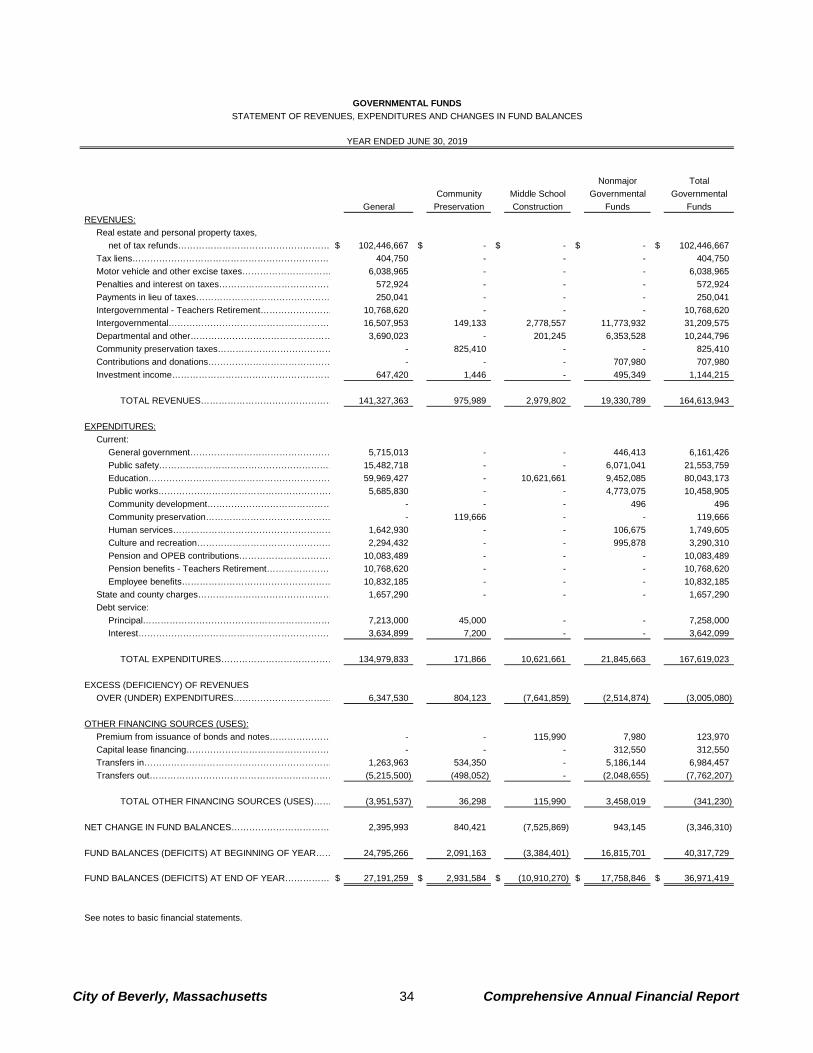
Nonmajor Total
Community Middle School Governmental Governmental
General Preservation Construction Funds Funds
REVENUES:
Real estate and personal property taxes,
net of tax refunds…………………………………………… $ 102,446,667 $ - $ - $ - $ 102,446,667
Tax liens…………………………………………………………… 404,750 - - - 404,750
Motor vehicle and other excise taxes………………………… 6,038,965 - - - 6,038,965
Penalties and interest on taxes………………………………… 572,924 - - - 572,924
Payments in lieu of taxes……………………………………… 250,041 - - - 250,041
Intergovernmental - Teachers Retirement…………………… 10,768,620 - - - 10,768,620
Intergovernmental……………………………………………… 16,507,953 149,133 2,778,557 11,773,932 31,209,575
Departmental and other………………………………………… 3,690,023 - 201,245 6,353,528 10,244,796
Community preservation taxes………………………………… - 825,410 - - 825,410
Contributions and donations…………………………………… - - - 707,980 707,980
Investment income……………………………………………… 647,420 1,446 - 495,349 1,144,215
TOTAL REVENUES……………………………………… 141,327,363 975,989 2,979,802 19,330,789 164,613,943
EXPENDITURES:
Current:
General government………………………………………… 5,715,013 - - 446,413 6,161,426
Public safety…………………………………………………… 15,482,718 - - 6,071,041 21,553,759
Education……………………………………………………… 59,969,427 - 10,621,661 9,452,085 80,043,173
Public works…………………………………………………… 5,685,830 - - 4,773,075 10,458,905
Community development…………………………………… - - - 496 496
Community preservation…………………………………… - 119,666 - - 119,666
Human services……………………………………………… 1,642,930 - - 106,675 1,749,605
Culture and recreation……………………………………… 2,294,432 - - 995,878 3,290,310
Pension and OPEB contributions…………………………… 10,083,489 - - - 10,083,489
Pension benefits - Teachers Retirement………………… 10,768,620 - - - 10,768,620
Employee benefits…………………………………………… 10,832,185 - - - 10,832,185
State and county charges……………………………………… 1,657,290 - - - 1,657,290
Debt service:
Principal……………………………………………………… 7,213,000 45,000 - - 7,258,000
Interest………………………………………………………… 3,634,899 7,200 - - 3,642,099
TOTAL EXPENDITURES………………………………… 134,979,833 171,866 10,621,661 21,845,663 167,619,023
EXCESS (DEFICIENCY) OF REVENUES
OVER (UNDER) EXPENDITURES…………………………… 6,347,530 804,123 (7,641,859) (2,514,874) (3,005,080)
OTHER FINANCING SOURCES (USES):
Premium from issuance of bonds and notes………………… - - 115,990 7,980 123,970
Capital lease financing………………………………………… - - - 312,550 312,550
Transfers in……………………………………………………… 1,263,963 534,350 - 5,186,144 6,984,457
Transfers out……………………………………………………… (5,215,500) (498,052) - (2,048,655) (7,762,207)
TOTAL OTHER FINANCING SOURCES (USES)…… (3,951,537) 36,298 115,990 3,458,019 (341,230)
NET CHANGE IN FUND BALANCES…………………………… 2,395,993 840,421 (7,525,869) 943,145 (3,346,310)
FUND BALANCES (DEFICITS) AT BEGINNING OF YEAR…… 24,795,266 2,091,163 (3,384,401) 16,815,701 40,317,729
FUND BALANCES (DEFICITS) AT END OF YEAR…………… $ 27,191,259 $ 2,931,584 $ (10,910,270) $ 17,758,846 $ 36,971,419
See notes to basic financial statements.
GOVERNMENTAL FUNDS
STATEMENT OF REVENUES, EXPENDITURES AND CHANGES IN FUND BALANCES
YEAR ENDED JUNE 30, 2019
City of Beverly, Massachusetts 34 Comprehensive Annual Financial Report
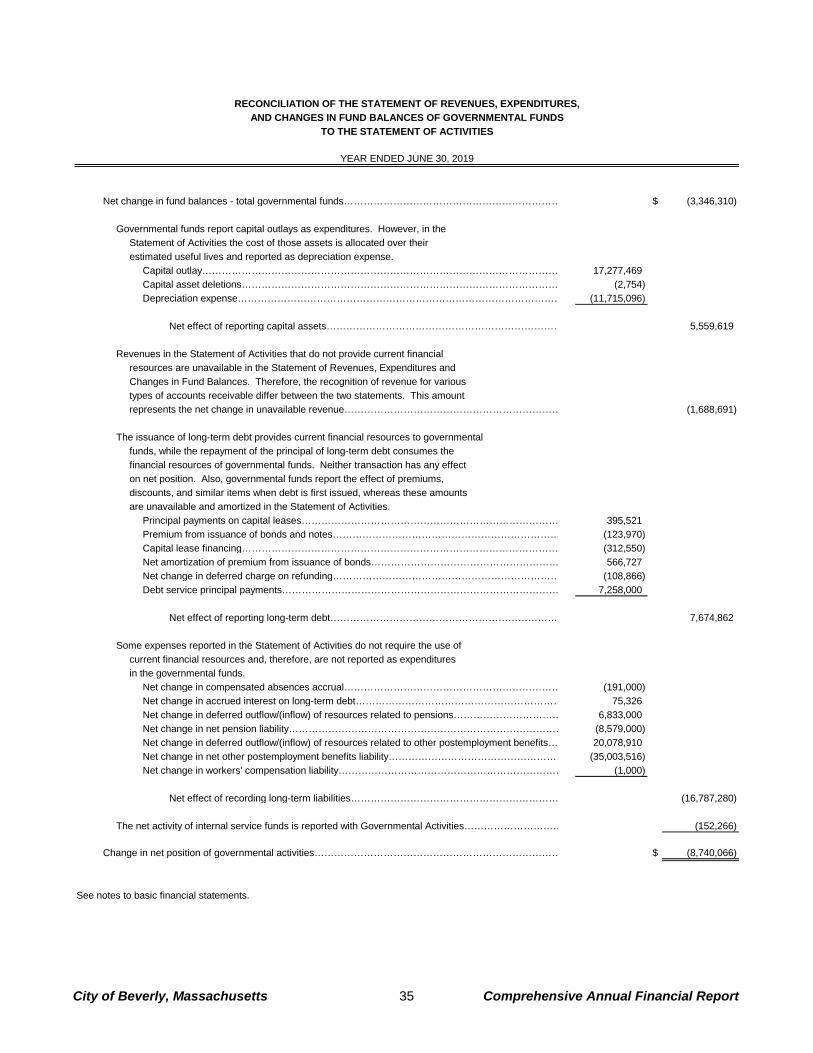
Net change in fund balances - total governmental funds………………………………………………………… $ (3,346,310)
Governmental funds report capital outlays as expenditures. However, in the
Statement of Activities the cost of those assets is allocated over their
estimated useful lives and reported as depreciation expense.
Capital outlay……………………………………………………………………………………………… 17,277,469
Capital asset deletions…………………………………………………………………………………… (2,754)
Depreciation expense……………………………………………………………………………………… (11,715,096)
Net effect of reporting capital assets……………………………………………………………… 5,559,619
Revenues in the Statement of Activities that do not provide current financial
resources are unavailable in the Statement of Revenues, Expenditures and
Changes in Fund Balances. Therefore, the recognition of revenue for various
types of accounts receivable differ between the two statements. This amount
represents the net change in unavailable revenue………………………………………………………… (1,688,691)
The issuance of long-term debt provides current financial resources to governmental
funds, while the repayment of the principal of long-term debt consumes the
financial resources of governmental funds. Neither transaction has any effect
on net position. Also, governmental funds report the effect of premiums,
discounts, and similar items when debt is first issued, whereas these amounts
are unavailable and amortized in the Statement of Activities.
Principal payments on capital leases…………………………………………………………………… 395,521
Premium from issuance of bonds and notes…………………………………………………………… (123,970)
Capital lease financing…………………………………………………………………………………… (312,550)
Net amortization of premium from issuance of bonds………………………………………………… 566,727
Net change in deferred charge on refunding…………………………………………………………… (108,866)
Debt service principal payments………………………………………………………………………… 7,258,000
Net effect of reporting long-term debt…………………………………………………………… 7,674,862
Some expenses reported in the Statement of Activities do not require the use of
current financial resources and, therefore, are not reported as expenditures
in the governmental funds.
Net change in compensated absences accrual………………………………………………………… (191,000)
Net change in accrued interest on long-term debt……………………………………………………… 75,326
Net change in deferred outflow/(inflow) of resources related to pensions…………………………… 6,833,000
Net change in net pension liability………………………………………………………………………… (8,579,000)
Net change in deferred outflow/(inflow) of resources related to other postemployment benefits… 20,078,910
Net change in net other postemployment benefits liability……………………………………………… (35,003,516)
Net change in workers' compensation liability…………………………………………………………… (1,000)
Net effect of recording long-term liabilities……………………………………………………… (16,787,280)
The net activity of internal service funds is reported with Governmental Activities………………………… (152,266)
Change in net position of governmental activities………………………………………………………………… $ (8,740,066)
See notes to basic financial statements.
RECONCILIATION OF THE STATEMENT OF REVENUES, EXPENDITURES,
AND CHANGES IN FUND BALANCES OF GOVERNMENTAL FUNDS
TO THE STATEMENT OF ACTIVITIES
YEAR ENDED JUNE 30, 2019
City of Beverly, Massachusetts 35 Comprehensive Annual Financial Report
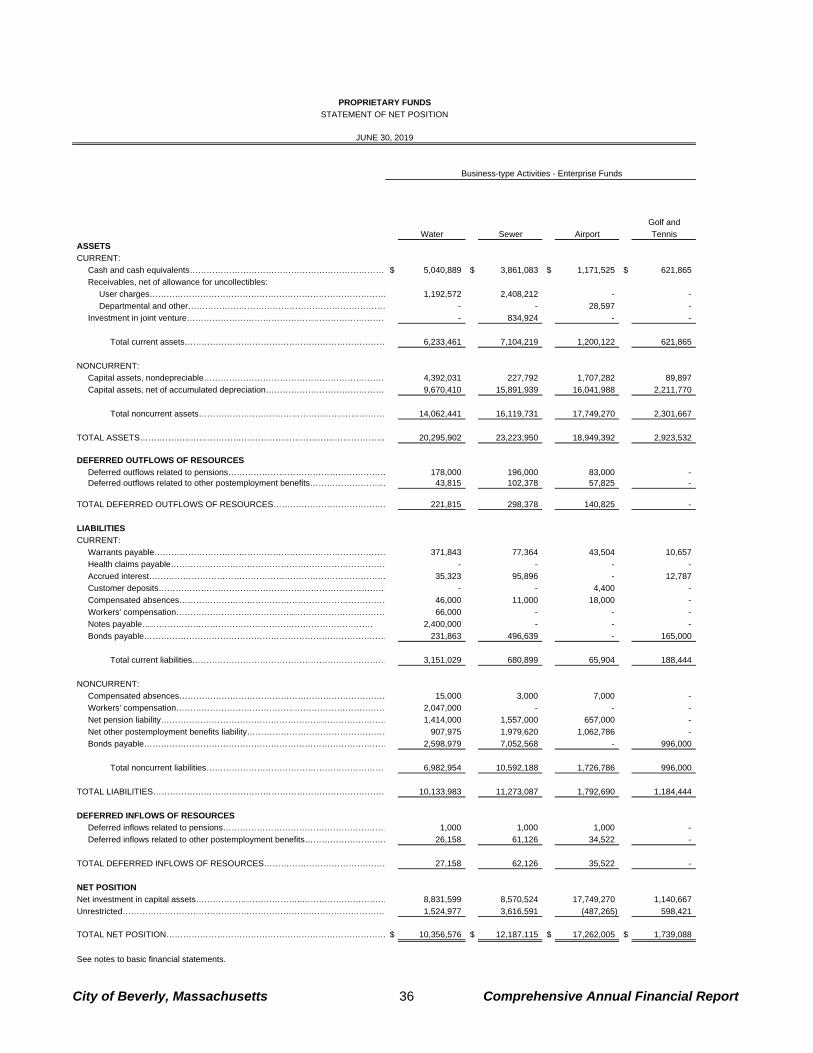
Golf and
Water Sewer Airport Tennis
ASSETS
CURRENT:
Cash and cash equivalents…………………………………………………………… $ 5,040,889 $ 3,861,083 $ 1,171,525 $ 621,865
Receivables, net of allowance for uncollectibles:
User charges………………………………………………………………………… 1,192,572 2,408,212 - -
Departmental and other……………………………………………………………… - - 28,597 -
Investment in joint venture……………………………………………………………… - 834,924 - -
Total current assets……………………………………………………………… 6,233,461 7,104,219 1,200,122 621,865
NONCURRENT:
Capital assets, nondepreciable………………………………………………………… 4,392,031 227,792 1,707,282 89,897
Capital assets, net of accumulated depreciation…………………………………… 9,670,410 15,891,939 16,041,988 2,211,770
Total noncurrent assets………………………………………………………… 14,062,441 16,119,731 17,749,270 2,301,667
TOTAL ASSETS…………………………………………………………………………… 20,295,902 23,223,950 18,949,392 2,923,532
DEFERRED OUTFLOWS OF RESOURCES
Deferred outflows related to pensions………………………………………………… 178,000 196,000 83,000 - Deferred outflows related to other postemployment benefits……………………… 43,815 102,378 57,825 -
TOTAL DEFERRED OUTFLOWS OF RESOURCES…………………………………… 221,815 298,378 140,825 -
LIABILITIES
CURRENT:
Warrants payable………………………………………………………………………… 371,843 77,364 43,504 10,657
Health claims payable…………………………………………………………………… - - - -
Accrued interest………………………………………………………………………… 35,323 95,896 - 12,787
Customer deposits……………………………………………………………………… - - 4,400 -
Compensated absences………………………………………………………………… 46,000 11,000 18,000 -
Workers' compensation………………………………………………………………… 66,000 - - -
Notes payable………………………………………………………………………. 2,400,000 - - -
Bonds payable…………………………………………………………………………… 231,863 496,639 - 165,000
Total current liabilities…………………………………………………………… 3,151,029 680,899 65,904 188,444
NONCURRENT:
Compensated absences………………………………………………………………… 15,000 3,000 7,000 -
Workers' compensation………………………………………………………………… 2,047,000 - - -
Net pension liability……………………………………………………………………… 1,414,000 1,557,000 657,000 -
Net other postemployment benefits liability…………………………………………… 907,975 1,979,620 1,062,786 -
Bonds payable…………………………………………………………………………… 2,598,979 7,052,568 - 996,000
Total noncurrent liabilities………………………………………………………… 6,982,954 10,592,188 1,726,786 996,000
TOTAL LIABILITIES………………………………………………………………………… 10,133,983 11,273,087 1,792,690 1,184,444
DEFERRED INFLOWS OF RESOURCES
Deferred inflows related to pensions…………………………………………………… 1,000 1,000 1,000 -
Deferred inflows related to other postemployment benefits…………………….…… 26,158 61,126 34,522 -
TOTAL DEFERRED INFLOWS OF RESOURCES……………………………………… 27,158 62,126 35,522 -
NET POSITION
Net investment in capital assets………………………………..………………………… 8,831,599 8,570,524 17,749,270 1,140,667
Unrestricted………………………………………………………………………………… 1,524,977 3,616,591 (487,265) 598,421
TOTAL NET POSITION…………………………………………………………………… $ 10,356,576 $ 12,187,115 $ 17,262,005 $ 1,739,088
See notes to basic financial statements.
Business-type Activities - Enterprise Funds
PROPRIETARY FUNDS
STATEMENT OF NET POSITION
JUNE 30, 2019
City of Beverly, Massachusetts 36 Comprehensive Annual Financial Report
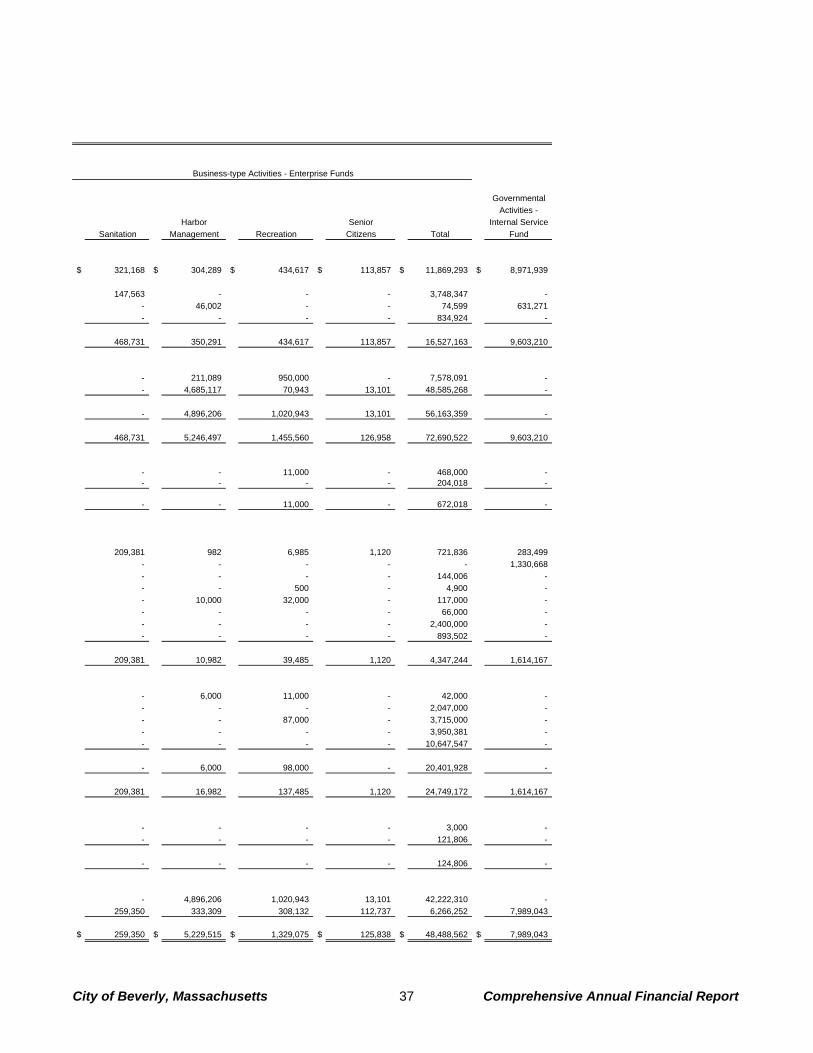
Governmental
Activities -
Harbor Senior Internal Service
Sanitation Management Recreation Citizens Total Fund
$ 321,168 $ 304,289 $ 434,617 $ 113,857 $ 11,869,293 $ 8,971,939
147,563 - - - 3,748,347 -
- 46,002 - - 74,599 631,271
- - - - 834,924 -
468,731 350,291 434,617 113,857 16,527,163 9,603,210
- 211,089 950,000 - 7,578,091 -
- 4,685,117 70,943 13,101 48,585,268 -
- 4,896,206 1,020,943 13,101 56,163,359 -
468,731 5,246,497 1,455,560 126,958 72,690,522 9,603,210
- - 11,000 - 468,000 - - - - - 204,018 -
- - 11,000 - 672,018 -
209,381 982 6,985 1,120 721,836 283,499
- - - - - 1,330,668
- - - - 144,006 -
- - 500 - 4,900 -
- 10,000 32,000 - 117,000 -
- - - - 66,000 -
- - - - 2,400,000 -
- - - - 893,502 -
209,381 10,982 39,485 1,120 4,347,244 1,614,167
- 6,000 11,000 - 42,000 -
- - - - 2,047,000 -
- - 87,000 - 3,715,000 -
- - - - 3,950,381 -
- - - - 10,647,547 -
- 6,000 98,000 - 20,401,928 -
209,381 16,982 137,485 1,120 24,749,172 1,614,167
- - - - 3,000 -
- - - - 121,806 -
- - - - 124,806 -
- 4,896,206 1,020,943 13,101 42,222,310 -
259,350 333,309 308,132 112,737 6,266,252 7,989,043
$ 259,350 $ 5,229,515 $ 1,329,075 $ 125,838 $ 48,488,562 $ 7,989,043
Business-type Activities - Enterprise Funds
City of Beverly, Massachusetts 37 Comprehensive Annual Financial Report
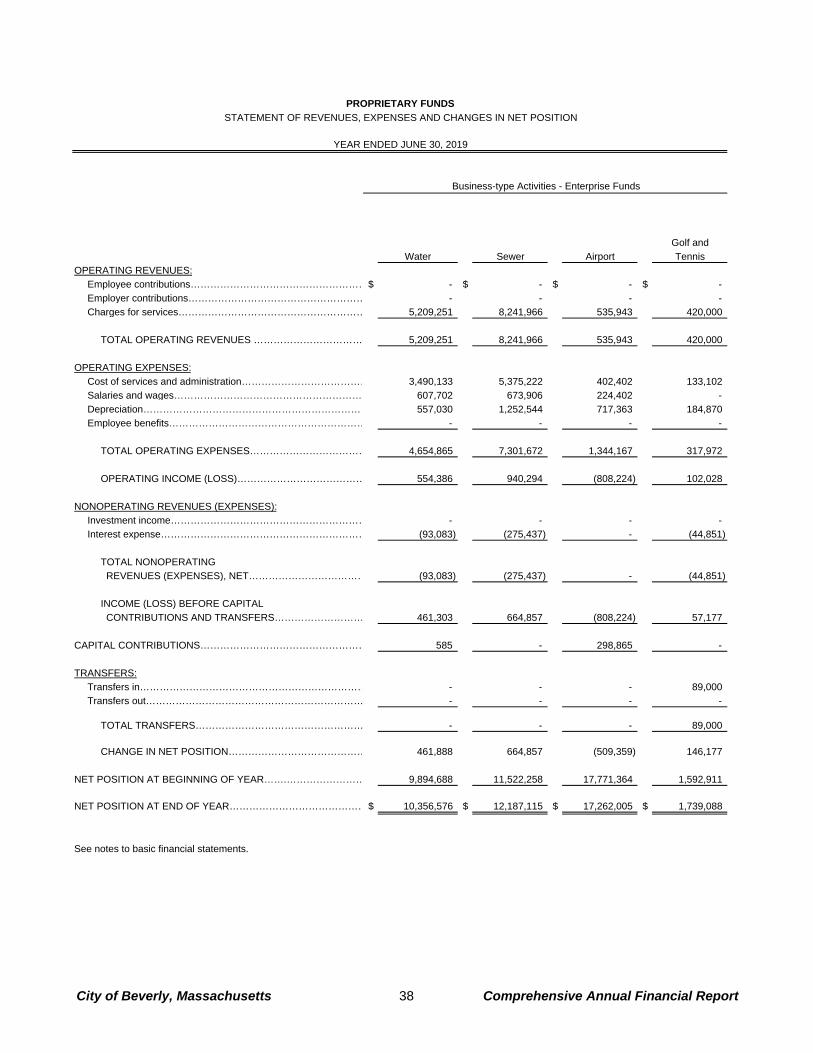
Golf and
Water Sewer Airport Tennis
OPERATING REVENUES:
Employee contributions………………………………………………$ - $ - $ - $ -
Employer contributions……………………………………………… - - - -
Charges for services………………………………………………… 5,209,251 8,241,966 535,943 420,000
TOTAL OPERATING REVENUES …………………………… 5,209,251 8,241,966 535,943 420,000
OPERATING EXPENSES:
Cost of services and administration………………………………… 3,490,133 5,375,222 402,402 133,102
Salaries and wages………………………………………………… 607,702 673,906 224,402 -
Depreciation…………………………………………………………… 557,030 1,252,544 717,363 184,870
Employee benefits…………………………………………………… - - - -
TOTAL OPERATING EXPENSES……………………………… 4,654,865 7,301,672 1,344,167 317,972
OPERATING INCOME (LOSS)………………………………… 554,386 940,294 (808,224) 102,028
NONOPERATING REVENUES (EXPENSES):
Investment income…………………………………………………… - - - -
Interest expense……………………………………………………… (93,083) (275,437) - (44,851)
TOTAL NONOPERATING
REVENUES (EXPENSES), NET……………………………… (93,083) (275,437) - (44,851)
INCOME (LOSS) BEFORE CAPITAL
CONTRIBUTIONS AND TRANSFERS……………………… 461,303 664,857 (808,224) 57,177
CAPITAL CONTRIBUTIONS…………………………………………… 585 - 298,865 -
TRANSFERS:
Transfers in…………………………………………………………… - - - 89,000
Transfers out………………………………………………………… - - - -
TOTAL TRANSFERS…………………………………………… - - - 89,000
CHANGE IN NET POSITION…………………………………… 461,888 664,857 (509,359) 146,177
NET POSITION AT BEGINNING OF YEAR…….…………………… 9,894,688 11,522,258 17,771,364 1,592,911
NET POSITION AT END OF YEAR…………………………………… $ 10,356,576 $ 12,187,115 $ 17,262,005 $ 1,739,088
See notes to basic financial statements.
Business-type Activities - Enterprise Funds
PROPRIETARY FUNDS
STATEMENT OF REVENUES, EXPENSES AND CHANGES IN NET POSITION
YEAR ENDED JUNE 30, 2019
City of Beverly, Massachusetts 38 Comprehensive Annual Financial Report
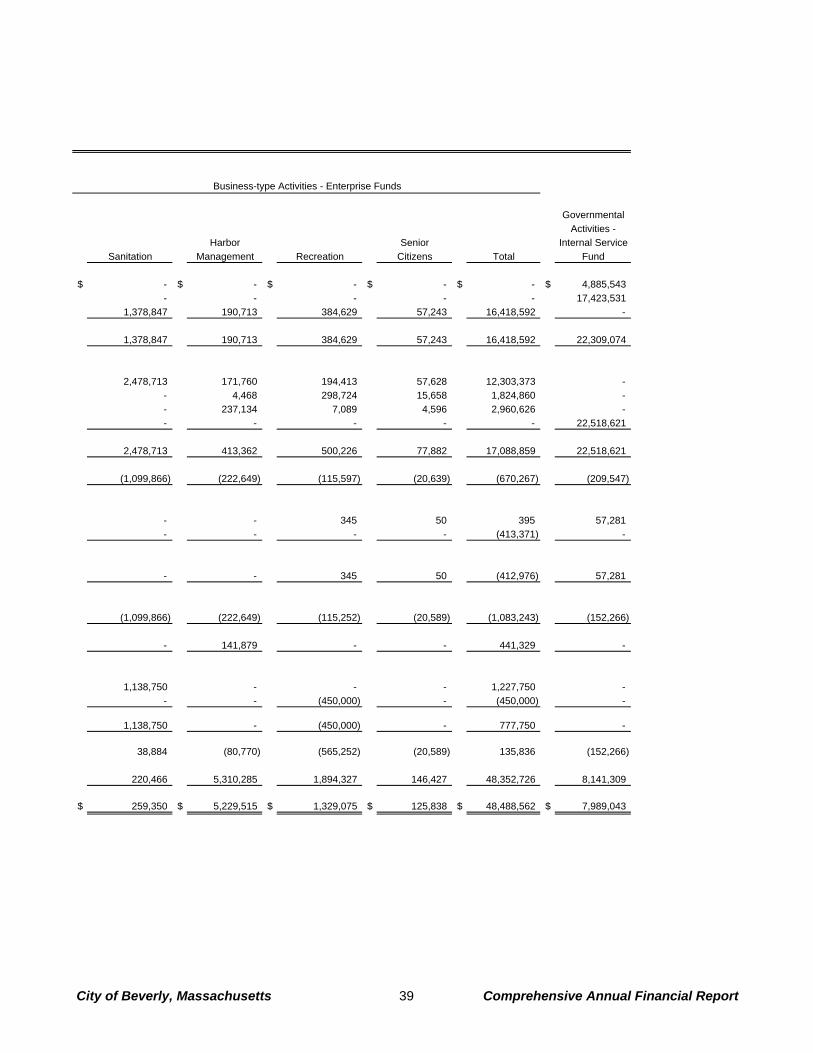
Governmental
Activities -
Harbor Senior Internal Service
Sanitation Management Recreation Citizens Total Fund
$ - $ - $ - $ - $ - $ 4,885,543
- - - - - 17,423,531
1,378,847 190,713 384,629 57,243 16,418,592 -
1,378,847 190,713 384,629 57,243 16,418,592 22,309,074
2,478,713 171,760 194,413 57,628 12,303,373 -
- 4,468 298,724 15,658 1,824,860 -
- 237,134 7,089 4,596 2,960,626 -
- - - - - 22,518,621
2,478,713 413,362 500,226 77,882 17,088,859 22,518,621
(1,099,866) (222,649) (115,597) (20,639) (670,267) (209,547)
- - 345 50 395 57,281
- - - - (413,371) -
- - 345 50 (412,976) 57,281
(1,099,866) (222,649) (115,252) (20,589) (1,083,243) (152,266)
- 141,879 - - 441,329 -
1,138,750 - - - 1,227,750 -
- - (450,000) - (450,000) -
1,138,750 - (450,000) - 777,750 -
38,884 (80,770) (565,252) (20,589) 135,836 (152,266)
220,466 5,310,285 1,894,327 146,427 48,352,726 8,141,309
$ 259,350 $ 5,229,515 $ 1,329,075 $ 125,838 $ 48,488,562 $ 7,989,043
Business-type Activities - Enterprise Funds
City of Beverly, Massachusetts 39 Comprehensive Annual Financial Report
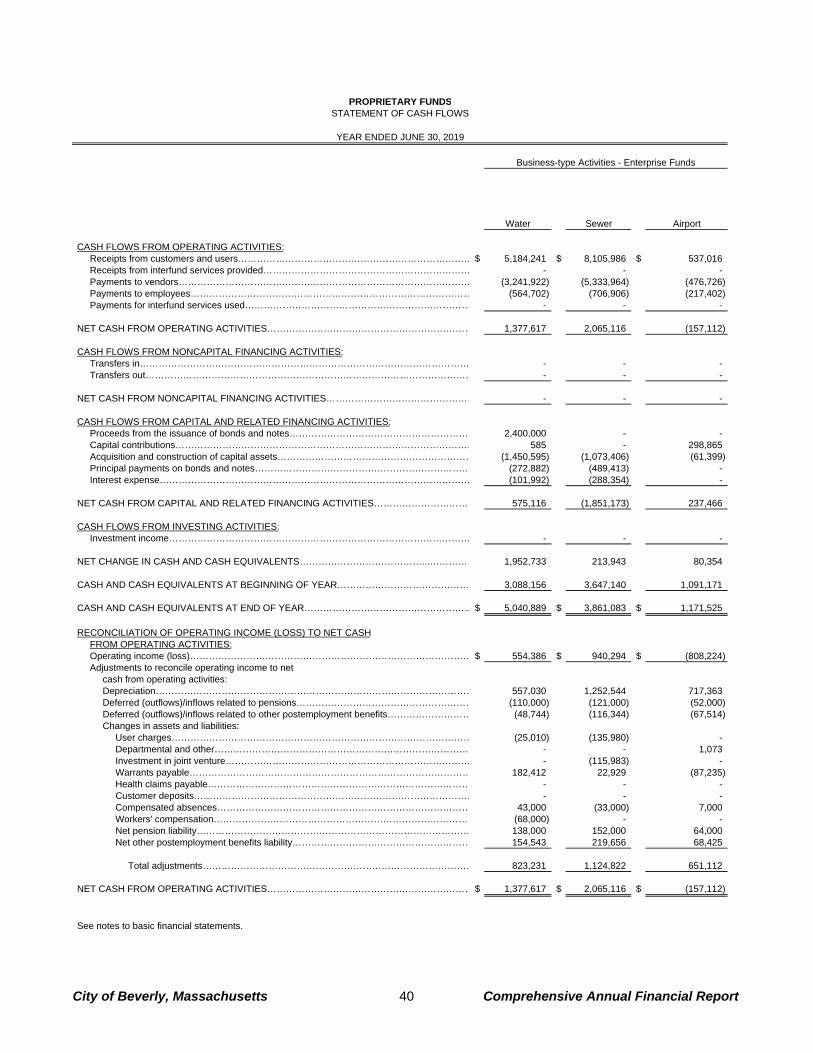
Water Sewer Airport
CASH FLOWS FROM OPERATING ACTIVITIES:Receipts from customers and users………………………………………………………………… $ 5,184,241 $ 8,105,986 $ 537,016 Receipts from interfund services provided………………………………………………………… - - - Payments to vendors………………………………………………………………………………… (3,241,922) (5,333,964) (476,726) Payments to employees……………………………………………………………………………… (564,702) (706,906) (217,402) Payments for interfund services used……………………………………………………………… - - -
NET CASH FROM OPERATING ACTIVITIES………………………………………………………… 1,377,617 2,065,116 (157,112)
CASH FLOWS FROM NONCAPITAL FINANCING ACTIVITIES:Transfers in…………………………………………………………………………………………… - - - Transfers out…………………………………………………………………………………………… - - -
NET CASH FROM NONCAPITAL FINANCING ACTIVITIES………………………………………… - - -
CASH FLOWS FROM CAPITAL AND RELATED FINANCING ACTIVITIES:Proceeds from the issuance of bonds and notes…………………………………………………… 2,400,000 - - Capital contributions…………………………………………………………………………………… 585 - 298,865 Acquisition and construction of capital assets……………………………………………………… (1,450,595) (1,073,406) (61,399) Principal payments on bonds and notes…………………………………………………………… (272,882) (489,413) - Interest expense……………………………………………………………………………………… (101,992) (288,354) -
NET CASH FROM CAPITAL AND RELATED FINANCING ACTIVITIES…………………………… 575,116 (1,851,173) 237,466
CASH FLOWS FROM INVESTING ACTIVITIES:Investment income…………………………………………………………………………………… - - -
NET CHANGE IN CASH AND CASH EQUIVALENTS…………………………………...…………… 1,952,733 213,943 80,354
CASH AND CASH EQUIVALENTS AT BEGINNING OF YEAR…………………………………… 3,088,156 3,647,140 1,091,171
CASH AND CASH EQUIVALENTS AT END OF YEAR………………………………………………$ 5,040,889 $ 3,861,083 $ 1,171,525
RECONCILIATION OF OPERATING INCOME (LOSS) TO NET CASHFROM OPERATING ACTIVITIES:Operating income (loss)……………………………………………………………………………… $ 554,386 $ 940,294 $ (808,224) Adjustments to reconcile operating income to net
cash from operating activities:Depreciation………………………………………………………………………………………… 557,030 1,252,544 717,363 Deferred (outflows)/inflows related to pensions………………………………………………… (110,000) (121,000) (52,000) Deferred (outflows)/inflows related to other postemployment benefits……………………… (48,744) (116,344) (67,514) Changes in assets and liabilities:
User charges…………………………………………………………………………………… (25,010) (135,980) - Departmental and other……………………………………………………………………… - - 1,073 Investment in joint venture…………………………………………………………………… - (115,983) - Warrants payable……………………………………………………………………………… 182,412 22,929 (87,235) Health claims payable………………………………………………………………………… - - - Customer deposits……………………………………………………………………………… - - - Compensated absences……………………………………………………………………… 43,000 (33,000) 7,000 Workers' compensation………………………………………………………………………… (68,000) - - Net pension liability…………………………………………………………………………… 138,000 152,000 64,000 Net other postemployment benefits liability………………………………………………… 154,543 219,656 68,425
Total adjustments…………………………………………………………………………… 823,231 1,124,822 651,112
NET CASH FROM OPERATING ACTIVITIES…………………………………………………………$ 1,377,617 $ 2,065,116 $ (157,112)
See notes to basic financial statements.
Business-type Activities - Enterprise Funds
PROPRIETARY FUNDSSTATEMENT OF CASH FLOWS
YEAR ENDED JUNE 30, 2019
City of Beverly, Massachusetts 40 Comprehensive Annual Financial Report
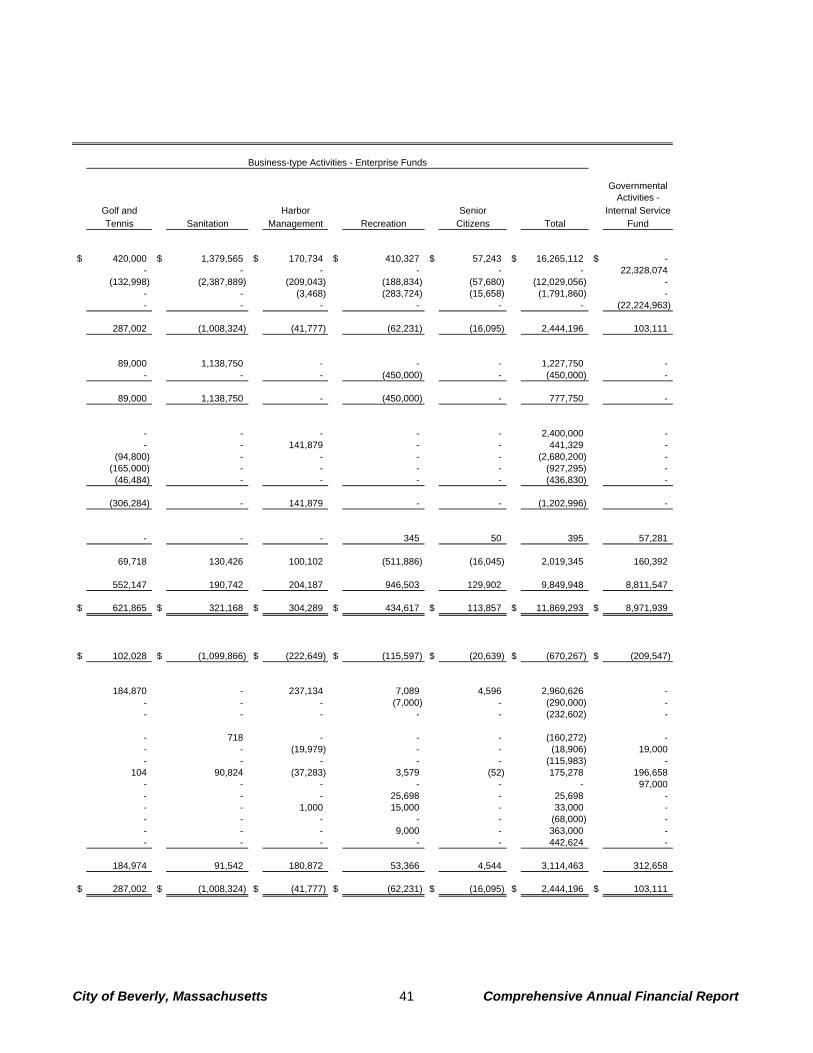
GovernmentalActivities -
Golf and Harbor Senior Internal ServiceTennis Sanitation Management Recreation Citizens Total Fund
$ 420,000 $ 1,379,565 $ 170,734 $ 410,327 $ 57,243 $ 16,265,112 $ - - - - - - - 22,328,074 (132,998) (2,387,889) (209,043) (188,834) (57,680) (12,029,056) - - - (3,468) (283,724) (15,658) (1,791,860) - - - - - - - (22,224,963)
287,002 (1,008,324) (41,777) (62,231) (16,095) 2,444,196 103,111
89,000 1,138,750 - - - 1,227,750 - - - - (450,000) - (450,000) -
89,000 1,138,750 - (450,000) - 777,750 -
- - - - - 2,400,000 - - - 141,879 - - 441,329 - (94,800) - - - - (2,680,200) - (165,000) - - - - (927,295) - (46,484) - - - - (436,830) -
(306,284) - 141,879 - - (1,202,996) -
- - - 345 50 395 57,281
69,718 130,426 100,102 (511,886) (16,045) 2,019,345 160,392
552,147 190,742 204,187 946,503 129,902 9,849,948 8,811,547
$ 621,865 $ 321,168 $ 304,289 $ 434,617 $ 113,857 $ 11,869,293 $ 8,971,939
$ 102,028 $ (1,099,866) $ (222,649) $ (115,597) $ (20,639) $ (670,267) $ (209,547)
184,870 - 237,134 7,089 4,596 2,960,626 - - - - (7,000) - (290,000) - - - - - - (232,602) -
- 718 - - - (160,272) - - - (19,979) - - (18,906) 19,000 - - - - - (115,983) - 104 90,824 (37,283) 3,579 (52) 175,278 196,658 - - - - - - 97,000 - - - 25,698 - 25,698 - - - 1,000 15,000 - 33,000 - - - - - - (68,000) - - - - 9,000 - 363,000 - - - - - - 442,624 -
184,974 91,542 180,872 53,366 4,544 3,114,463 312,658
$ 287,002 $ (1,008,324) $ (41,777) $ (62,231) $ (16,095) $ 2,444,196 $ 103,111
Business-type Activities - Enterprise Funds
City of Beverly, Massachusetts 41 Comprehensive Annual Financial Report
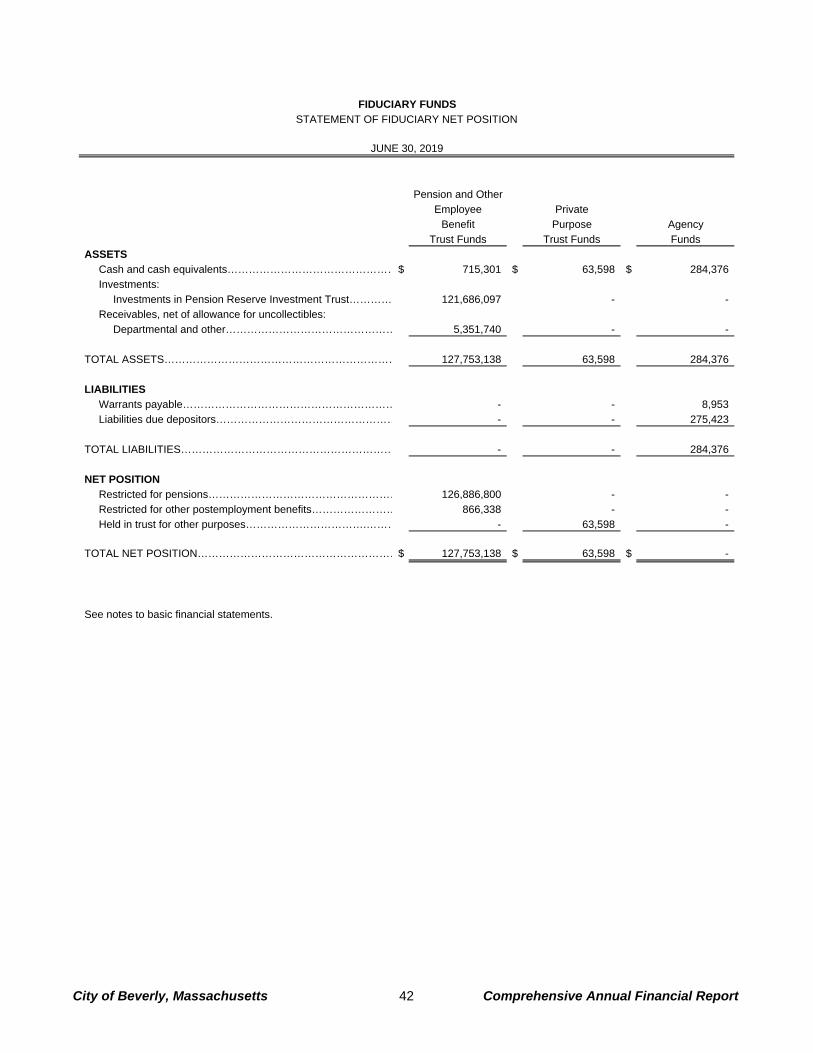
Pension and Other
Employee Private
Benefit Purpose Agency
Trust Funds Trust Funds Funds
ASSETS
Cash and cash equivalents…………………………………………$ 715,301 $ 63,598 $ 284,376
Investments:
Investments in Pension Reserve Investment Trust………… 121,686,097 - -
Receivables, net of allowance for uncollectibles:
Departmental and other………………………………………… 5,351,740 - -
TOTAL ASSETS………………………………………………………… 127,753,138 63,598 284,376
LIABILITIES
Warrants payable…………………………………………………… - - 8,953
Liabilities due depositors…………………………………………… - - 275,423
TOTAL LIABILITIES…………………………………………………… - - 284,376
NET POSITION
Restricted for pensions……………………………………………… 126,886,800 - -
Restricted for other postemployment benefits…………………… 866,338 - -
Held in trust for other purposes…………………………….……… - 63,598 -
TOTAL NET POSITION…………………………………………………$ 127,753,138 $ 63,598 $ -
See notes to basic financial statements.
FIDUCIARY FUNDS
STATEMENT OF FIDUCIARY NET POSITION
JUNE 30, 2019
City of Beverly, Massachusetts 42 Comprehensive Annual Financial Report
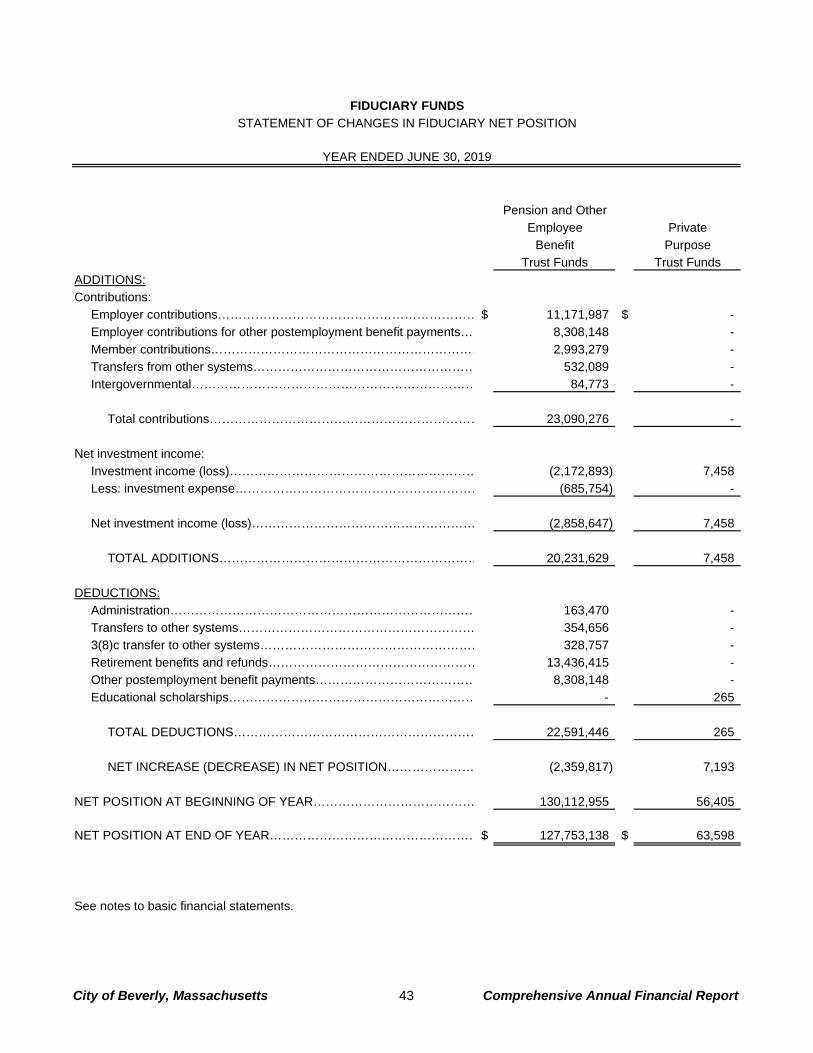
Pension and Other
Employee Private
Benefit Purpose
Trust Funds Trust Funds
ADDITIONS:
Contributions:
Employer contributions……………………………………………………… $ 11,171,987 $ -
Employer contributions for other postemployment benefit payments… 8,308,148 -
Member contributions………………………………………………………… 2,993,279 -
Transfers from other systems……………………………………………… 532,089 -
Intergovernmental…………………………………………………………… 84,773 -
Total contributions………………………………………………………… 23,090,276 -
Net investment income:
Investment income (loss)…………………………………………………… (2,172,893) 7,458
Less: investment expense…………………………………………………… (685,754) -
Net investment income (loss)……………………………………………… (2,858,647) 7,458
TOTAL ADDITIONS……………………………………………………… 20,231,629 7,458
DEDUCTIONS:
Administration………………………………………………………………… 163,470 -
Transfers to other systems………………………………………………… 354,656 -
3(8)c transfer to other systems……………………………………………… 328,757 -
Retirement benefits and refunds…………………………………………… 13,436,415 -
Other postemployment benefit payments………………………………… 8,308,148 -
Educational scholarships…………………………………………………… - 265
TOTAL DEDUCTIONS…………………………………………………… 22,591,446 265
NET INCREASE (DECREASE) IN NET POSITION………………… (2,359,817) 7,193
NET POSITION AT BEGINNING OF YEAR………………………………… 130,112,955 56,405
NET POSITION AT END OF YEAR……………………………………………$ 127,753,138 $ 63,598
See notes to basic financial statements.
FIDUCIARY FUNDS
STATEMENT OF CHANGES IN FIDUCIARY NET POSITION
YEAR ENDED JUNE 30, 2019
City of Beverly, Massachusetts 43 Comprehensive Annual Financial Report
Notes to Basic Financial Statements Year Ended June 30, 2019
City of Beverly, Massachusetts 44 Comprehensive Annual Financial Report
NOTE 1 - SUMMARY OF SIGNIFICANT ACCOUNTING POLICIES Notes to basic financial statements The accompanying basic financial statements of the City of Beverly, Massachusetts (the City) have been prepared in accordance with accounting principles generally accepted in the United States of America (GAAP). The Governmental Accounting Standards Board (GASB) is the recognized standard-setting body for establishing governmental accounting and financial reporting principles. The significant accounting policies are described herein. A. Reporting Entity The City is a municipal corporation that is governed by an elected Mayor and an elected City Council. For financial reporting purposes, the City has included all funds, organizations, agencies, boards, commissions and institutions. The City has also considered all potential component units for which it is financially accountable as well as other organizations for which the nature and significance of their relationship with the City are such that exclusion would cause the basic financial statements to be misleading or incomplete. As required by GAAP, these basic financial statements present the City (the primary government) and its component units. One entity has been included as a component unit in the reporting entity, because of the significance of its operational and/or financial relationship. Component Unit Presented as a Fiduciary Fund – The following component unit is presented as a fiduciary fund of the primary government due to the nature and significance of the relationship between the City and the component unit. The Beverly Contributory Retirement System (the System) was established to provide retirement benefits to City employees, the City Housing Authority employees, and their beneficiaries. The System is governed by a five-member board comprised of the City Accountant (ex officio), two members elected by the System’s participants, one member appointed by the Mayor and one member appointed by the Board members. The System is presented using the accrual basis of accounting and is reported as a pension trust fund in the fiduciary fund financial statements. The System did not issue a separately audited financial statement. The System issues a publicly available unaudited financial report in accordance with guidelines established by the Commonwealth of Massachusetts’ (Commonwealth) Public Employee Retirement Administration Commission (PERAC). That report may be obtained by contacting the System located at 191 Cabot Street, Beverly, Massachusetts 01915. Joint Ventures The City is a member of the South Essex Sewerage District (the District), a joint venture with the Cities of Salem and Peabody and the Towns of Danvers and Marblehead, for the operation of a septage disposal facility. The members share in overseeing the operations of the District. Each member is responsible for its proportionate share of the operational costs of the District, which are paid in the form of assessments. At June 30, 2019, the City has an equity unassigned and undesignated interest in the operation of the District totaling $834,924. The equity unassigned and undesignated interest related to operations is recorded in the sewer enterprise fund. Complete financial information for the District can be obtained by contacting them at P.O. Box 989, 50 Fort Avenue, Salem, Massachusetts 01970.
Notes to Basic Financial Statements Year Ended June 30, 2019
City of Beverly, Massachusetts 45 Comprehensive Annual Financial Report
The City is a member of the Salem-Beverly Water Supply Board (Water Board), a joint venture with the City of Salem for the operation of a water distribution system. The City does not have an equity interest in the Salem-Beverly Water Board. The annual assessment from the Water Board for the year ended June 30, 2019, totaled $2,288,086. Complete financial information for the Water Board can be obtained by contacting them at 50 Arlington Avenue, Beverly, MA 01915. The City is a member of the Essex Technical High School that serves the members’ students seeking an education in academic, technical and agriculture studies. The members share in the operations of the Essex Technical High School and each member is responsible for its proportionate share of the operational and capital cost of the Essex Technical High School, which are paid in the form of assessments. The City does not have an equity interest in the Essex Technical High School and the 2019 assessment was $2,052,642. Complete financial information can be obtained by contacting them at 565 Maple Street, Danvers, MA 01923. B. Government-Wide and Fund Financial Statements Government-Wide Financial Statements The government-wide financial statements (i.e., statement of net position and the statement of activities) report information on all of the non-fiduciary activities of the primary government and its component units. Governmental activities, which are primarily supported by taxes and intergovernmental revenues, are reported separately from business-type activities, which are supported primarily by user fees and charges. Fund Financial Statements Separate financial statements are provided for governmental funds, proprietary funds, and fiduciary funds, even though fiduciary funds are excluded from the government-wide financial statements. Major individual governmental funds and major individual enterprise funds are reported as separate columns in the fund financial statements. Nonmajor funds are aggregated and displayed in a single column. Major Fund Criteria Major funds must be reported if the following criteria are met:
If total assets and deferred outflows of resources, liabilities and deferred inflows of resources, revenues, or expenditures/expenses of an individual governmental or enterprise fund are at least 10 percent of the corresponding element (assets and deferred outflows of resources, liabilities and deferred inflows or resources, etc.) for all funds of that category or type (total governmental or total enterprise funds), and
If the total assets and deferred outflows of resources, liabilities and deferred inflows of resources,
revenues, or expenditures/expenses of the individual governmental fund or enterprise fund are at least 5 percent of the corresponding element for all governmental and enterprise funds combined.
Additionally, any other governmental or enterprise fund that management believes is particularly significant to the basic financial statements may be reported as a major fund.
Notes to Basic Financial Statements Year Ended June 30, 2019
City of Beverly, Massachusetts 46 Comprehensive Annual Financial Report
Internal service funds and fiduciary funds are reported by fund type. C. Measurement Focus, Basis of Accounting and Financial Statement Presentation Government-Wide Financial Statements The government-wide financial statements are reported using the economic resources measurement focus and the accrual basis of accounting. Under this method, revenues are recorded when earned and expenses are recorded when the liabilities are incurred. Real estate and personal property taxes are recognized as revenues in the year for which they are levied. Grants and similar items are recognized as revenue as soon as all eligibility requirements imposed by the provider have been met. The statement of activities demonstrates the degree to which the direct expenses of a particular function or segment are offset by program revenues. Direct expenses are those that are clearly identifiable with a specific function or segment. Program revenues include the following:
Charges to customers or applicants who purchase, use, or directly benefit from goods, services, or privileges provided by a given function or segment.
Grants and contributions that are restricted to meeting the operational requirements of a particular
function or segment.
Grants and contributions that are restricted to meeting the capital requirements of a particular function or segment.
Taxes and other items not identifiable as program revenues are reported as general revenues. For the most part, the effect of interfund activity has been removed from the government-wide financial statements. Exceptions are charges between the general fund and enterprise funds. Elimination of these charges would distort the direct costs and program revenues reported for the functions affected. Fund Financial Statements Governmental fund financial statements are reported using the flow of current financial resources measurement focus and the modified accrual basis of accounting. Under the modified accrual basis of accounting, revenues are recognized when susceptible to accrual (i.e., measurable and available). Measurable means the amount of the transaction can be determined and available means collectible within the current period or soon enough thereafter to pay liabilities of the current period. Expenditures are recorded when the related fund liability is incurred, except for unmatured interest on general long-term debt which is recognized when due, and certain compensated absences and claims and judgments which are recognized when the obligations are expected to be liquidated with current expendable available resources. Real estate and personal property tax revenues are considered available if they are collected within 60 days after year-end. Investment income is susceptible to accrual. Other receipts and tax revenues become measurable and available when the cash is received and are recognized as revenue at that time. Entitlements and shared revenues are recorded at the time of receipt or earlier if the susceptible to accrual criteria is met. Expenditure driven grants recognize revenue when the qualifying expenditures are incurred and all other grant requirements are met.
Notes to Basic Financial Statements Year Ended June 30, 2019
City of Beverly, Massachusetts 47 Comprehensive Annual Financial Report
The following major governmental funds are reported: The general fund is the primary operating fund. It is used to account for all financial resources, except those that are required to be accounted for in another fund. The community preservation fund is attributable to the City’s acceptance of the Community Preservation Act, which allows the City to impose up to a 1% surcharge on property taxes and to receive matching State grant funds for specified uses related to the acquisition, creation, preservation and support of open space, historical resources, land for recreational use and community housing. The middle school construction fund is used to account for the new middle school construction project activities. The nonmajor governmental funds consist of other special revenue, capital projects and permanent funds that are aggregated and presented in the nonmajor governmental funds column on the governmental funds financial statements. The following describes the general use of these fund types: The special revenue fund is used to account for and report the proceeds of specific revenue sources that are restricted or committed to expenditure for specified purposes other than permanent funds or capital projects. The capital projects fund is used to account for and report financial resources that are restricted, committed, or assigned to expenditure for capital outlays, including the acquisition or construction of capital facilities and other capital assets of the governmental funds. The permanent fund is used to account for and report financial resources that are legally restricted to the extent that only earnings, not principal, may be used for purposes that support the governmental programs. Proprietary fund financial statements are reported using the flow of economic resources measurement focus and use the accrual basis of accounting. Under this method, revenues are recorded when earned and expenses are recorded when the liabilities are incurred. Proprietary funds distinguish operating revenues and expenses from nonoperating items. Operating revenues and expenses generally result from providing services and producing and delivering goods in connection with the proprietary funds principle ongoing operations. All revenues and expenses not meeting this definition are reported as nonoperating revenues and expenses. The following major proprietary funds are reported: The water enterprise fund is used to account for water activities. The sewer enterprise fund is used to account for sewer activities. The airport enterprise fund is used to account for airport activities. The golf and tennis enterprise fund is used to account for golf and tennis club activities. The sanitation enterprise fund is used to account for sanitation activities. The harbor management enterprise fund is used to account for harbor management activities. The recreation enterprise fund is used to account for recreational activities.
Notes to Basic Financial Statements Year Ended June 30, 2019
City of Beverly, Massachusetts 48 Comprehensive Annual Financial Report
The senior citizens enterprise fund is used to account for senior citizen activities. Additionally, the following proprietary fund type is reported: The internal service fund is used to account for the financing of services provided by one department to other departments or governmental units. This fund is used to account for risk financing activities related to employees’ health insurance. Fiduciary fund financial statements are reported using the flow of economic resources measurement focus and use the accrual basis of accounting. Fiduciary funds are used to account for assets held in a trustee capacity for others that cannot be used to support the governmental programs. The following fiduciary fund types are reported: The pension trust fund is used to account for the activities of the System, which accumulates resources to provide pension benefits to eligible retirees and their beneficiaries. The other postemployment benefit trust fund accumulates resources to provide funding for future OPEB (other postemployment benefits) liabilities. The private-purpose trust fund is used to account for trust arrangements that exclusively benefit individuals, private organizations, or other governments. Some of these trusts have donor restrictions and trustee policies that do not allow the endowment portion and any unrealized appreciation to be spent. The restrictions and trustee policies only allow the trustees to approve spending of the realized investment earnings. The City’s educational scholarships are accounted for in this fund. The agency fund is used to account for assets held in a purely custodial capacity and is accounted for using the full accrual method but does not have a measurement focus. D. Cash and Investments Government-Wide and Fund Financial Statements Cash and cash equivalents are considered to be cash on hand, demand deposits and short-term investments with an original maturity of three months or less from the date of acquisition. Investments are carried at fair value. E. Fair Value Measurements The City reports required types of financial instruments in accordance with the fair value standards. These standards require an entity to maximize the use of observable inputs (such as quoted prices in active markets) and minimize the use of unobservable inputs (such as appraisals or valuation techniques) to determine fair value. Fair value standards also require the government to classify these financial instruments into a three-level hierarchy, based on the priority of inputs to the valuation technique or in accordance with net asset value practical expedient rules, which allow for either Level 2 or Level 3 depending on lock up and notice periods associated with the underlying funds. Instruments measured and reported at fair value are classified and disclosed in one of the following categories: Level 1 – Quoted prices are available in active markets for identical instruments as of the reporting date. Instruments, which are generally included in this category, include actively traded equity and debt securities, U.S. government obligations, and mutual funds with quoted market prices in active markets.
Notes to Basic Financial Statements Year Ended June 30, 2019
City of Beverly, Massachusetts 49 Comprehensive Annual Financial Report
Level 2 – Pricing inputs are other than quoted in active markets, which are either directly or indirectly observable as of the reporting date, and fair value is determined through the use of models or other valuation methodologies. Certain fixed income securities, primarily corporate bonds, are classified as Level 2 because fair values are estimated using pricing models, matrix pricing, or discounted cash flows. Level 3 – Pricing inputs are unobservable for the instrument and include situations where there is little, if any, market activity for the instrument. The inputs into the determination of fair value require significant management judgment or estimation. In some instances, the inputs used to measure fair value may fall into different levels of the fair value hierarchy and is based on the lowest level of input that is significant to the fair value measurement. Market price is affected by a number of factors, including the type of instrument and the characteristics specific to the instrument. Instruments with readily available active quoted prices generally will have a higher degree of market price observability and a lesser degree of judgment used in measuring fair value. It is reasonably possible that change in values of these instruments will occur in the near term and that such changes could materially affect amounts reported in these financial statements. For more information on the fair value of the City’s financial instruments, see Note 2 – Cash and Investments – Fair Value Measurements. F. Accounts Receivable Government-Wide and Fund Financial Statements The recognition of revenue related to accounts receivable reported in the government-wide financial statements and the proprietary funds and fiduciary funds financial statements are reported under the accrual basis of accounting. The recognition of revenue related to accounts receivable reported in the governmental funds financial statements are reported under the modified accrual basis of accounting. Real Estate, Personal Property Taxes and Tax Liens Real estate and personal property taxes are levied and based on values assessed on January 1st of every year. Assessed values are established by the Board of Assessors for 100% of the estimated fair market value. Taxes are due on August 1st, November 1st, February 1st and May 1st and are subject to penalties and interest if they are not paid by the respective due date. Real estate and personal property taxes levied are recorded as receivables in the year of the levy. Real estate tax liens are processed during the fourth quarter of every year on delinquent properties and are recorded as receivables in the year they are processed. Real estate receivables are secured via the tax lien process and are considered 100% collectible. Accordingly, an allowance for uncollectibles is not reported. Personal property taxes cannot be secured through the lien process. The allowance for uncollectibles is estimated based on historical trends and specific account analysis. Motor Vehicle and Other Excise Taxes Motor vehicle excise taxes are assessed annually for each vehicle registered and are recorded as receivables in the year of the levy. The Commonwealth is responsible for reporting the number of vehicles registered and the fair values of those vehicles. The tax calculation is the fair value of the vehicle multiplied by $25 per $1,000 of value.
Notes to Basic Financial Statements Year Ended June 30, 2019
City of Beverly, Massachusetts 50 Comprehensive Annual Financial Report
The allowance for uncollectibles is estimated based on historical trends and specific account analysis. Water and Sewer User Fees User fees are levied monthly based on individual meter readings and are subject to penalties and interest if they are not paid by the respective due date. Unbilled user fees are estimated at year-end and are recorded as revenue in the current period. Water and Sewer liens are processed in December of every year and included as a lien on the property owner’s tax bill. Water and Sewer charges and liens are recorded as receivables in the year of the levy. Since the receivables are secured via the lien process, these accounts are considered 100% collectible and therefore do not report an allowance for uncollectibles. Sanitation User Fees User fees are levied quarterly at a rate of $25 per residential unit. Commercial properties are levied quarterly at rates ranging from $75 to $225 per quarter, based on usage. Trash liens are processed in December of every year and included as a lien on the property owner’s tax bill. Trash charges and liens are recorded as receivables in the year of the levy. Since the receivables are secured via the lien process, these accounts are considered 100% collectible and therefore do not report an allowance for uncollectibles. Departmental and Other Departmental and other receivables consist primarily of police details, airport fees and golf and tennis lease payments, which are recorded as receivables in the year accrued. The golf and tennis receivable is due from the management company that currently operates the course because no lease payments were received for the current year. The golf and tennis receivable is considered to be 100% collectible because the City has a mortgage agreement to secure its interest in the lease. The police details and airport fees allowance for uncollectibles is estimated based on historical trends and specific account analysis. Intergovernmental Various federal and state grants for operating and capital purposes are applied for and received annually. For non-expenditure driven grants, receivables are recorded as soon as all eligibility requirements imposed by the provider have been met. For expenditure driven grants, receivables are recorded when the qualifying expenditures are incurred and all other grant requirements are met. These receivables are considered 100% collectible and therefore do not report an allowance for uncollectibles. G. Inventories Government-Wide and Fund Financial Statements Inventories are recorded as expenditures at the time of purchase. Such inventories are not material in total to the government-wide and fund financial statements, and therefore are not reported.
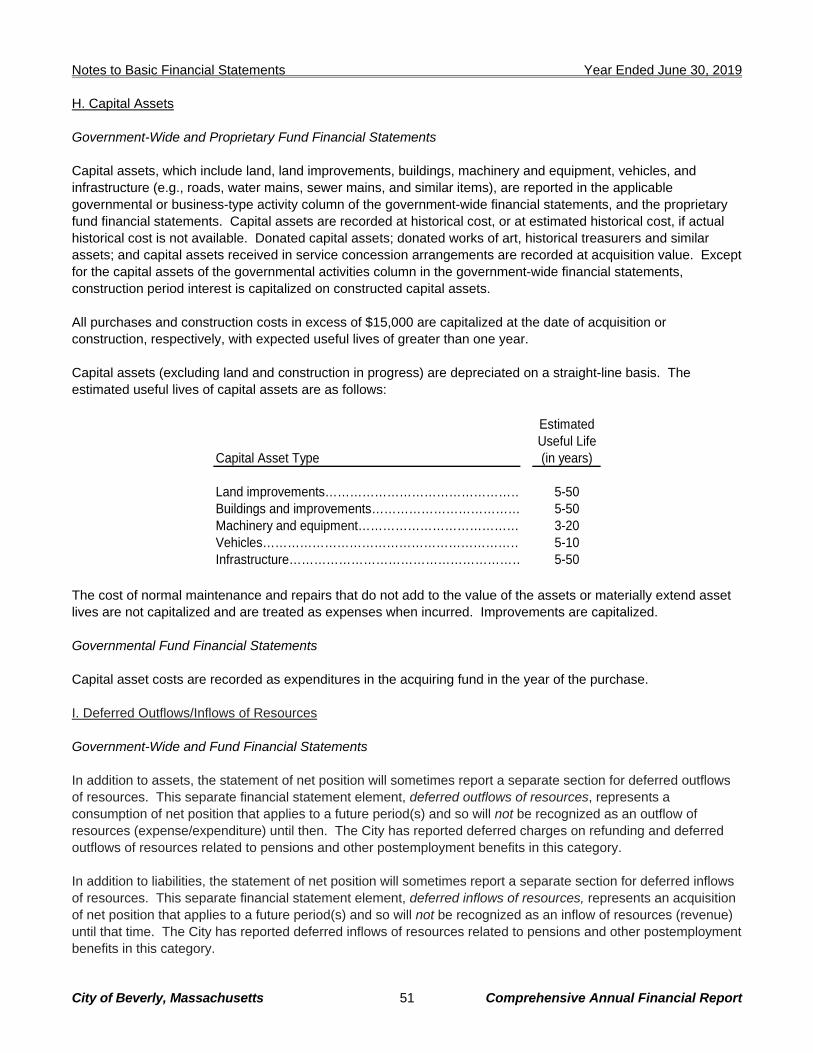
Notes to Basic Financial Statements Year Ended June 30, 2019
City of Beverly, Massachusetts 51 Comprehensive Annual Financial Report
H. Capital Assets Government-Wide and Proprietary Fund Financial Statements Capital assets, which include land, land improvements, buildings, machinery and equipment, vehicles, and infrastructure (e.g., roads, water mains, sewer mains, and similar items), are reported in the applicable governmental or business-type activity column of the government-wide financial statements, and the proprietary fund financial statements. Capital assets are recorded at historical cost, or at estimated historical cost, if actual historical cost is not available. Donated capital assets; donated works of art, historical treasurers and similar assets; and capital assets received in service concession arrangements are recorded at acquisition value. Except for the capital assets of the governmental activities column in the government-wide financial statements, construction period interest is capitalized on constructed capital assets. All purchases and construction costs in excess of $15,000 are capitalized at the date of acquisition or construction, respectively, with expected useful lives of greater than one year. Capital assets (excluding land and construction in progress) are depreciated on a straight-line basis. The estimated useful lives of capital assets are as follows:
EstimatedUseful Life
Capital Asset Type (in years)
Land improvements………………………………………… 5-50Buildings and improvements……………………………… 5-50Machinery and equipment………………………………… 3-20Vehicles……………………………………………………… 5-10Infrastructure………………………………………………… 5-50
The cost of normal maintenance and repairs that do not add to the value of the assets or materially extend asset lives are not capitalized and are treated as expenses when incurred. Improvements are capitalized. Governmental Fund Financial Statements Capital asset costs are recorded as expenditures in the acquiring fund in the year of the purchase. I. Deferred Outflows/Inflows of Resources Government-Wide and Fund Financial Statements In addition to assets, the statement of net position will sometimes report a separate section for deferred outflows of resources. This separate financial statement element, deferred outflows of resources, represents a consumption of net position that applies to a future period(s) and so will not be recognized as an outflow of resources (expense/expenditure) until then. The City has reported deferred charges on refunding and deferred outflows of resources related to pensions and other postemployment benefits in this category. In addition to liabilities, the statement of net position will sometimes report a separate section for deferred inflows of resources. This separate financial statement element, deferred inflows of resources, represents an acquisition of net position that applies to a future period(s) and so will not be recognized as an inflow of resources (revenue) until that time. The City has reported deferred inflows of resources related to pensions and other postemployment benefits in this category.
Notes to Basic Financial Statements Year Ended June 30, 2019
City of Beverly, Massachusetts 52 Comprehensive Annual Financial Report
Governmental Fund Financial Statements In addition to liabilities, the governmental funds balance sheet will sometimes report a separate section for deferred inflows of resources. This separate financial statement element, deferred inflows of resources, represents assets that have been recorded in the governmental fund financial statements, but the revenue is not available and so will not be recognized as an inflow of resources (revenue) until it becomes available. The City has reported unavailable revenues from property taxes, excise taxes, departmental receivables, and state agencies in this category. J. Interfund Receivables and Payables During the course of its operations, transactions occur between and within individual funds that may result in amounts owed between funds. Government-Wide Financial Statements Transactions of a buyer/seller nature between and within governmental funds and internal service funds are eliminated from the governmental activities in the statement of net position. Any residual balances outstanding between the governmental activities and business-type activities are reported in the statement of net position as “internal balances.” Fund Financial Statements Transactions of a buyer/seller nature between and within funds are not eliminated from the individual fund statements. Receivables and payables resulting from these transactions are classified as “Due from other funds” or “Due to other funds” on the balance sheet. K. Interfund Transfers During the course of its operations, resources are permanently reallocated between and within funds. These transactions are reported as transfers in and transfers out. Government-Wide Financial Statements Transfers between and within governmental funds and internal service funds are eliminated from the governmental activities in the statement of net position. Any residual balances outstanding between the governmental activities and business-type activities are reported in the statement of activities as “Transfers, net.” Fund Financial Statements Transfers between and within funds are not eliminated from the individual fund statements and are reported as transfers in and transfers out. L. Net Position and Fund Equity Government-Wide Financial Statements (Net Position) Net position is reported as restricted when amounts are not available for appropriation or are legally restricted by outside parties for a specific future use.
Notes to Basic Financial Statements Year Ended June 30, 2019
City of Beverly, Massachusetts 53 Comprehensive Annual Financial Report
Net position has been “restricted for” the following: “Permanent funds - expendable” represents the amount of realized and unrealized investment earnings on donor restricted trusts. The restrictions and trustee policies only allow the trustees to approve spending of the realized investment earnings. “Permanent funds - nonexpendable” represents the endowment portion of donor restricted trusts that support governmental programs. “Gifts and grants” represents assets that have restrictions placed on them from outside parties. “Community preservation” represents amounts restricted for the acquisition, creation, preservation and support of open space, historical resources, land for recreational use and community housing purposes. Sometimes the City will fund outlays for a particular purpose from both restricted (e.g. restricted bond or grant proceeds) and unrestricted resources. In order to calculate the amounts to report as restricted - net position and unrestricted - net position in the government-wide and proprietary fund financial statements, a flow assumption must be made about the order in which the resources are considered to be applied. It is the City’s policy to consider restricted - net position to have been depleted before unrestricted - net position is applied. Fund Financial Statements (Fund Balances) Governmental fund equity is classified as fund balance. Fund balance is further classified as follows: “Nonspendable” fund balance includes amounts that cannot be spent because they are either not in spendable form or they are legally or contractually required to be maintained intact. “Restricted” fund balance includes amounts subject to constraints placed on the use of resources that is either externally imposed by creditors, grantors, contributors, or laws or regulations of other governments; or that are imposed by law through constitutional provisions or enabling legislation. “Committed” fund balance includes amounts that can only be used for specific purposes pursuant to constraints imposed by formal action of the government’s highest level of decision-making authority. The passage of a City Council Order is the highest level of decision making authority that can commit funds for a specific purpose. Once passed, the limitation imposed by the order remains in place until the funds are used for their intended purpose or a Council Order is passed to rescind the commitment. “Assigned” fund balance includes amounts that are constrained by the City’s intent to be used for specific purposes, but are neither restricted nor committed. The City Finance Director has the authority to assign fund balance. Funds are assigned when the City has an obligation to purchase goods or services from the current year’s appropriation. Assignments generally only exist temporarily. Additional action does not have to be taken for the removal of an assignment. Sometimes the City will fund outlays for a particular purpose from different components of fund balance. In order to calculate the amounts to report as restricted, committed, assigned, and unassigned fund balances in the governmental fund financial statements a flow assumption must be made about the order in which the resources are considered to be applied. When different components of fund balance can be used for the same purpose, it is the City’s policy to consider restricted fund balance to have been depleted first, followed by committed fund balance, and assigned fund balance. Unassigned fund balance is applied last.
Notes to Basic Financial Statements Year Ended June 30, 2019
City of Beverly, Massachusetts 54 Comprehensive Annual Financial Report
M. Long-term debt Government-Wide and Proprietary Fund Financial Statements Long-term debt is reported as liabilities in the government-wide and proprietary fund statement of net position. Material bond premiums and discounts are deferred and amortized over the life of the bonds using the effective interest method. Bonds payable are reported net of the applicable bond premium or discount. Governmental Fund Financial Statements The face amount of governmental funds long-term debt is reported as other financing sources. Bond premiums and discounts, as well as issuance costs, are recognized in the current period. Bond premiums are reported as other financing sources and bond discounts are reported as other financing uses. Issuance costs, whether or not withheld from the actual bond proceeds received, are reported as general government expenditures. N. Pensions For purposes of measuring the net pension liability, deferred outflows of resources and deferred inflows of resources related to pensions, and pension expense, information about the fiduciary net position of the Beverly Contributory Retirement System and the Massachusetts Teachers’ Retirement System and additions to/deductions from the Systems’ fiduciary net position have been determined on the same basis as they are reported by the Systems. For this purpose, benefit payments (including refunds of employee contributions) are recognized when due and payable in accordance with the benefit terms. Investments are reported at fair value. O. Investment Income Excluding the permanent funds, investment income derived from major and nonmajor governmental funds is legally assigned to the general fund unless otherwise directed by Massachusetts General Law (MGL). Investment income from recreation and senior citizens proprietary funds is retained by those funds. P. Compensated Absences Employees are granted vacation and sick leave in varying amounts based on collective bargaining agreements, state laws and executive policies. Government-Wide and Proprietary Fund Financial Statements Vested or accumulated vacation and sick leave are reported as liabilities and expensed as incurred. Governmental Fund Financial Statements Vested or accumulated vacation and sick leave, which will be liquidated with expendable available financial resources, are reported as expenditures and fund liabilities. Q. Use of Estimates Government-Wide and Fund Financial Statements The preparation of basic financial statements in conformity with GAAP requires management to make estimates and assumptions that affect the reported amounts of assets and liabilities and disclosure for contingent assets
Notes to Basic Financial Statements Year Ended June 30, 2019
City of Beverly, Massachusetts 55 Comprehensive Annual Financial Report
and liabilities at the date of the basic financial statements and the reported amounts of the revenues and expenditures/expenses during the year. Actual results could vary from estimates that were used. R. Total Column Government-Wide Financial Statements The total column presented on the government-wide financial statements represents consolidated financial information. Fund Financial Statements The total column on the fund financial statements is presented only to facilitate financial analysis. Data in this column is not the equivalent of consolidated financial information. S. Fund Deficits Individual fund deficits exist within the middle school capital project fund. This deficit will be funded with bond proceeds and available fund balance in 2020. NOTE 2 - CASH AND INVESTMENTS A cash and investment pool is maintained that is available for use by all funds. Each fund type's portion of this pool is displayed on the combined balance sheet as "Cash and Cash Equivalents.” The deposits and investments of the trust funds are held separately from those of other funds. Statutes authorize the investment in obligations of the U.S. Treasury, agencies, and instrumentalities, certificates of deposit, repurchase agreements, money market accounts, bank deposits and the State Treasurer's Investment Pool (the Pool). The Treasurer may also invest trust funds in securities, other than mortgages or collateral loans, which are legal for the investment of funds of savings banks under the laws of the Commonwealth. The Pool meets the criteria of an external investment pool. The Pool is administered by the Massachusetts Municipal Depository Trust (MMDT), which was established by the Treasurer of the Commonwealth who serves as Trustee. The fair value of the position in the Pool is the same as the value of the Pool shares. The City’s OPEB trust fund and the System participate in the Pension Reserve Investment Trust (PRIT), which meets the criteria of an external investment pool. PRIT is administered by the Pension Reserves Investment Management Board, which was established by the Treasurer of the Commonwealth of Massachusetts who serves as Trustee. The fair value of the position in the PRIT is the same as the value of the PRIT shares. Custodial Credit Risk – Deposits In the case of deposits, this is the risk that in the event of a bank failure, the government’s deposits may not be returned to it. The City’s policy allows unlimited deposits in bank accounts or CD's (up to one year maturity) that do not receive the highest bank rating as determined by a recognized bank rating firm if they are fully collateralized through a third party agreement. For uncollateralized bank accounts and CD’s, the City’s policy allows unlimited deposits (up to one year maturity) if the bank has received the highest bank rating as determined by a recognized bank rating firm. These deposits will be limited to no more than 25% of the City’s cash. The City’s policy also allows unlimited investments in money market funds, which are allowed by statute and are considered to be liquid funds.
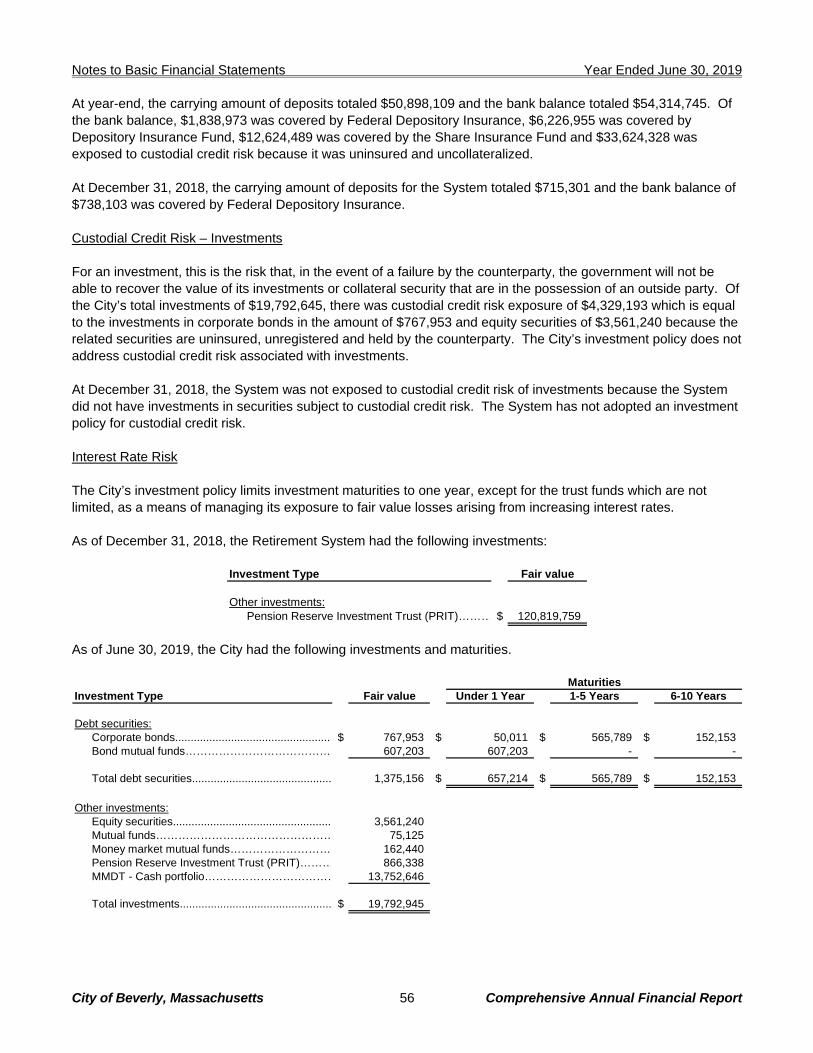
Notes to Basic Financial Statements Year Ended June 30, 2019
City of Beverly, Massachusetts 56 Comprehensive Annual Financial Report
At year-end, the carrying amount of deposits totaled $50,898,109 and the bank balance totaled $54,314,745. Of the bank balance, $1,838,973 was covered by Federal Depository Insurance, $6,226,955 was covered by Depository Insurance Fund, $12,624,489 was covered by the Share Insurance Fund and $33,624,328 was exposed to custodial credit risk because it was uninsured and uncollateralized. At December 31, 2018, the carrying amount of deposits for the System totaled $715,301 and the bank balance of $738,103 was covered by Federal Depository Insurance. Custodial Credit Risk – Investments For an investment, this is the risk that, in the event of a failure by the counterparty, the government will not be able to recover the value of its investments or collateral security that are in the possession of an outside party. Of the City’s total investments of $19,792,645, there was custodial credit risk exposure of $4,329,193 which is equal to the investments in corporate bonds in the amount of $767,953 and equity securities of $3,561,240 because the related securities are uninsured, unregistered and held by the counterparty. The City’s investment policy does not address custodial credit risk associated with investments. At December 31, 2018, the System was not exposed to custodial credit risk of investments because the System did not have investments in securities subject to custodial credit risk. The System has not adopted an investment policy for custodial credit risk. Interest Rate Risk The City’s investment policy limits investment maturities to one year, except for the trust funds which are not limited, as a means of managing its exposure to fair value losses arising from increasing interest rates. As of December 31, 2018, the Retirement System had the following investments:
Investment Type Fair value
Other investments:Pension Reserve Investment Trust (PRIT)……… $ 120,819,759
As of June 30, 2019, the City had the following investments and maturities.
Investment Type Fair value Under 1 Year 1-5 Years 6-10 Years
Debt securities:Corporate bonds................................................... $ 767,953 $ 50,011 $ 565,789 $ 152,153 Bond mutual funds………………………………… 607,203 607,203 - -
Total debt securities............................................. 1,375,156 $ 657,214 $ 565,789 $ 152,153
Other investments:Equity securities................................................... 3,561,240 Mutual funds………………………………………… 75,125 Money market mutual funds……………………… 162,440 Pension Reserve Investment Trust (PRIT)……… 866,338 MMDT - Cash portfolio……………………………… 13,752,646
Total investments................................................. $ 19,792,945
Maturities
Notes to Basic Financial Statements Year Ended June 30, 2019
City of Beverly, Massachusetts 57 Comprehensive Annual Financial Report
The City participates in MMDT, which maintains a cash portfolio and a short-term bond fund with combined average maturities of approximately 3 months. The System participates in PRIT. The effective weighted duration rate for PRIT investments ranged from 0.18 to 15.31 years. Credit Risk
Of the City’s investments in corporate bonds, $153,245 were rated AA, $280,801 were rated A and $333,907 were rated BBB. The City’s investments in mutual funds, bond mutual funds, money market mutual funds and MMDT are unrated. The Systems investments are managed by PRIT and are not subject to credit risk. Concentration of Credit Risk The City will minimize the concentration of credit risk by diversifying the investment portfolio, so that the impact of potential losses from any one type of security or issuer will be minimized. The City did not have any investments in any one issuer exceeding 5 percent of their total investments. The Systems investments are managed by PRIT and are not subject to concentration of credit risk. Fair Value of Investments The City holds investments that are measured at fair value on a recurring basis. Because investing is not a core part of the City’s mission, the City determines that the disclosures related to these investments only need to be disaggregated by major type. The City chooses a tabular format for disclosing the levels within the fair value hierarchy. The City categorizes its fair value measurements within the fair value hierarchy established by generally accepted accounting principles. The hierarchy is based on the valuation inputs used to measure the fair value of the asset. Level 1 inputs are quoted prices in active markets for identical assets; Level 2 inputs are significant other observable inputs; Level 3 inputs are significant unobservable inputs.
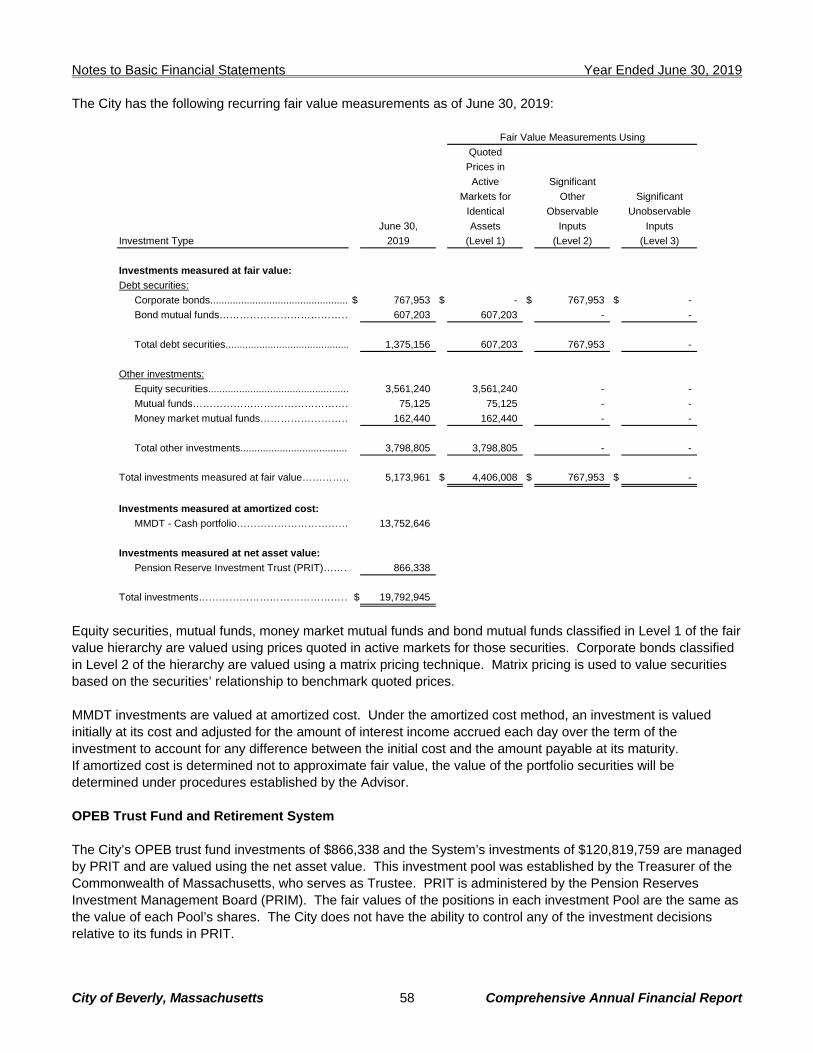
Notes to Basic Financial Statements Year Ended June 30, 2019
City of Beverly, Massachusetts 58 Comprehensive Annual Financial Report
The City has the following recurring fair value measurements as of June 30, 2019:
Quoted
Prices in
Active Significant
Markets for Other Significant
Identical Observable Unobservable
June 30, Assets Inputs Inputs
Investment Type 2019 (Level 1) (Level 2) (Level 3)
Investments measured at fair value:
Debt securities:
Corporate bonds................................................. $ 767,953 $ - $ 767,953 $ -
Bond mutual funds………………………………… 607,203 607,203 - -
Total debt securities............................................ 1,375,156 607,203 767,953 -
Other investments:
Equity securities.................................................. 3,561,240 3,561,240 - -
Mutual funds………………………………………… 75,125 75,125 - -
Money market mutual funds……………………… 162,440 162,440 - -
Total other investments....................................... 3,798,805 3,798,805 - -
Total investments measured at fair value…………… 5,173,961 $ 4,406,008 $ 767,953 $ -
Investments measured at amortized cost:
MMDT - Cash portfolio…………………………… 13,752,646
Investments measured at net asset value:
Pension Reserve Investment Trust (PRIT)……… 866,338
Total investments……………………………………… $ 19,792,945
Fair Value Measurements Using
Equity securities, mutual funds, money market mutual funds and bond mutual funds classified in Level 1 of the fair value hierarchy are valued using prices quoted in active markets for those securities. Corporate bonds classified in Level 2 of the hierarchy are valued using a matrix pricing technique. Matrix pricing is used to value securities based on the securities’ relationship to benchmark quoted prices. MMDT investments are valued at amortized cost. Under the amortized cost method, an investment is valued initially at its cost and adjusted for the amount of interest income accrued each day over the term of the investment to account for any difference between the initial cost and the amount payable at its maturity. If amortized cost is determined not to approximate fair value, the value of the portfolio securities will be determined under procedures established by the Advisor. OPEB Trust Fund and Retirement System The City’s OPEB trust fund investments of $866,338 and the System’s investments of $120,819,759 are managed by PRIT and are valued using the net asset value. This investment pool was established by the Treasurer of the Commonwealth of Massachusetts, who serves as Trustee. PRIT is administered by the Pension Reserves Investment Management Board (PRIM). The fair values of the positions in each investment Pool are the same as the value of each Pool’s shares. The City does not have the ability to control any of the investment decisions relative to its funds in PRIT.
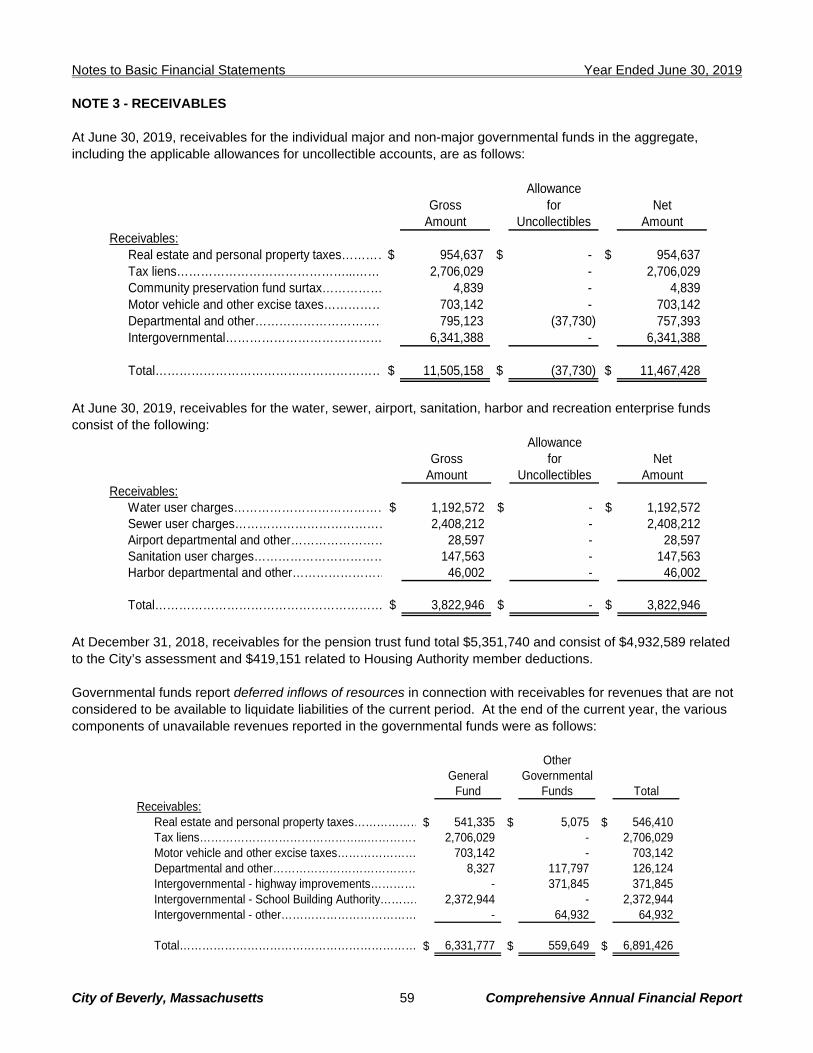
Notes to Basic Financial Statements Year Ended June 30, 2019
City of Beverly, Massachusetts 59 Comprehensive Annual Financial Report
NOTE 3 - RECEIVABLES At June 30, 2019, receivables for the individual major and non-major governmental funds in the aggregate, including the applicable allowances for uncollectible accounts, are as follows:
AllowanceGross for Net
Amount Uncollectibles AmountReceivables:
Real estate and personal property taxes…………$ 954,637 $ - $ 954,637 Tax liens……………………………………...…… 2,706,029 - 2,706,029 Community preservation fund surtax…………… 4,839 - 4,839 Motor vehicle and other excise taxes…………… 703,142 - 703,142 Departmental and other…………………………… 795,123 (37,730) 757,393 Intergovernmental………………………………… 6,341,388 - 6,341,388
Total………………………………………………… $ 11,505,158 $ (37,730) $ 11,467,428
At June 30, 2019, receivables for the water, sewer, airport, sanitation, harbor and recreation enterprise funds consist of the following:
AllowanceGross for Net
Amount Uncollectibles AmountReceivables:
Water user charges…………………………………$ 1,192,572 $ - $ 1,192,572 Sewer user charges………………………………… 2,408,212 - 2,408,212 Airport departmental and other…………………… 28,597 - 28,597 Sanitation user charges…………………………… 147,563 - 147,563 Harbor departmental and other…………………… 46,002 - 46,002
Total………………………………………………… $ 3,822,946 $ - $ 3,822,946
At December 31, 2018, receivables for the pension trust fund total $5,351,740 and consist of $4,932,589 related to the City’s assessment and $419,151 related to Housing Authority member deductions. Governmental funds report deferred inflows of resources in connection with receivables for revenues that are not considered to be available to liquidate liabilities of the current period. At the end of the current year, the various components of unavailable revenues reported in the governmental funds were as follows:
OtherGeneral Governmental
Fund Funds TotalReceivables:
Real estate and personal property taxes………………$ 541,335 $ 5,075 $ 546,410 Tax liens……………………………………...…………… 2,706,029 - 2,706,029 Motor vehicle and other excise taxes………………… 703,142 - 703,142 Departmental and other………………………………… 8,327 117,797 126,124 Intergovernmental - highway improvements………… - 371,845 371,845 Intergovernmental - School Building Authority………… 2,372,944 - 2,372,944 Intergovernmental - other……………………………… - 64,932 64,932
Total……………………………………………………… $ 6,331,777 $ 559,649 $ 6,891,426
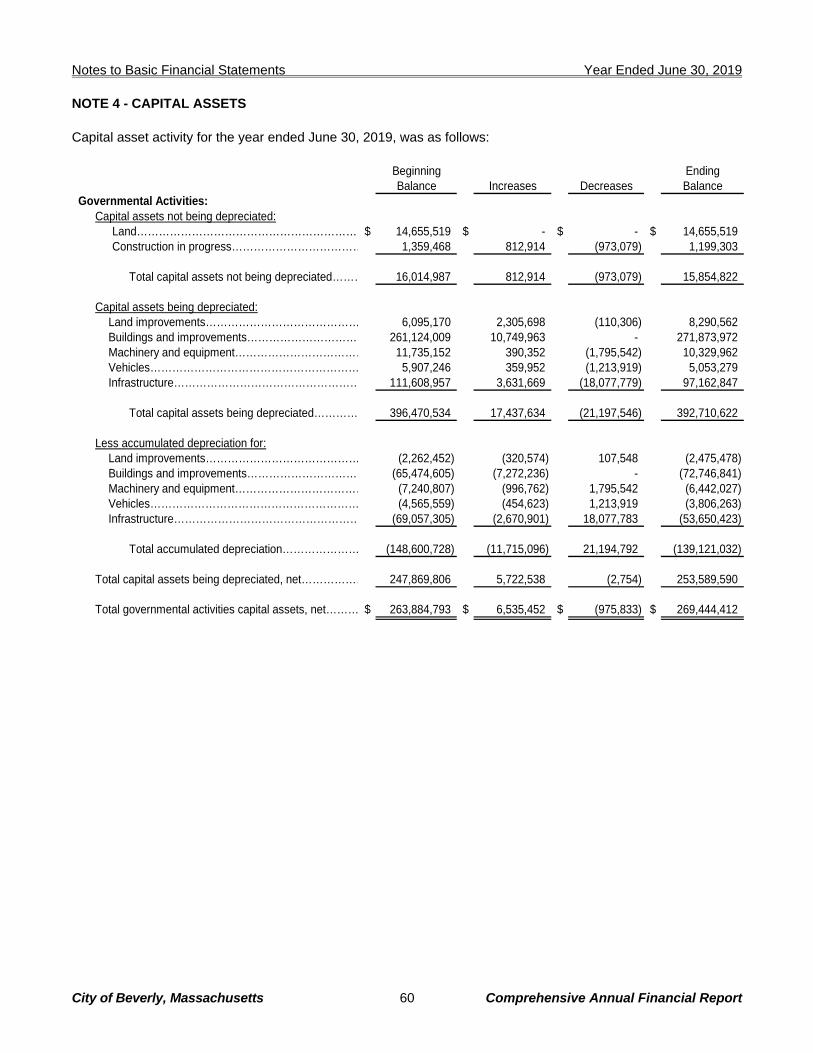
Notes to Basic Financial Statements Year Ended June 30, 2019
City of Beverly, Massachusetts 60 Comprehensive Annual Financial Report
NOTE 4 - CAPITAL ASSETS Capital asset activity for the year ended June 30, 2019, was as follows:
Beginning EndingBalance Increases Decreases Balance
Governmental Activities:Capital assets not being depreciated:
Land…………………………………………………… $ 14,655,519 $ - $ - $ 14,655,519 Construction in progress……………………………… 1,359,468 812,914 (973,079) 1,199,303
Total capital assets not being depreciated……… 16,014,987 812,914 (973,079) 15,854,822
Capital assets being depreciated:
Land improvements…………………………………… 6,095,170 2,305,698 (110,306) 8,290,562 Buildings and improvements………………………… 261,124,009 10,749,963 - 271,873,972 Machinery and equipment……………………………… 11,735,152 390,352 (1,795,542) 10,329,962 Vehicles………………………………………………… 5,907,246 359,952 (1,213,919) 5,053,279 Infrastructure…………………………………………… 111,608,957 3,631,669 (18,077,779) 97,162,847
Total capital assets being depreciated………… 396,470,534 17,437,634 (21,197,546) 392,710,622
Less accumulated depreciation for:
Land improvements…………………………………… (2,262,452) (320,574) 107,548 (2,475,478) Buildings and improvements………………………… (65,474,605) (7,272,236) - (72,746,841) Machinery and equipment……………………………… (7,240,807) (996,762) 1,795,542 (6,442,027) Vehicles………………………………………………… (4,565,559) (454,623) 1,213,919 (3,806,263) Infrastructure…………………………………………… (69,057,305) (2,670,901) 18,077,783 (53,650,423)
Total accumulated depreciation………………… (148,600,728) (11,715,096) 21,194,792 (139,121,032)
Total capital assets being depreciated, net……………… 247,869,806 5,722,538 (2,754) 253,589,590
Total governmental activities capital assets, net……… $ 263,884,793 $ 6,535,452 $ (975,833) $ 269,444,412
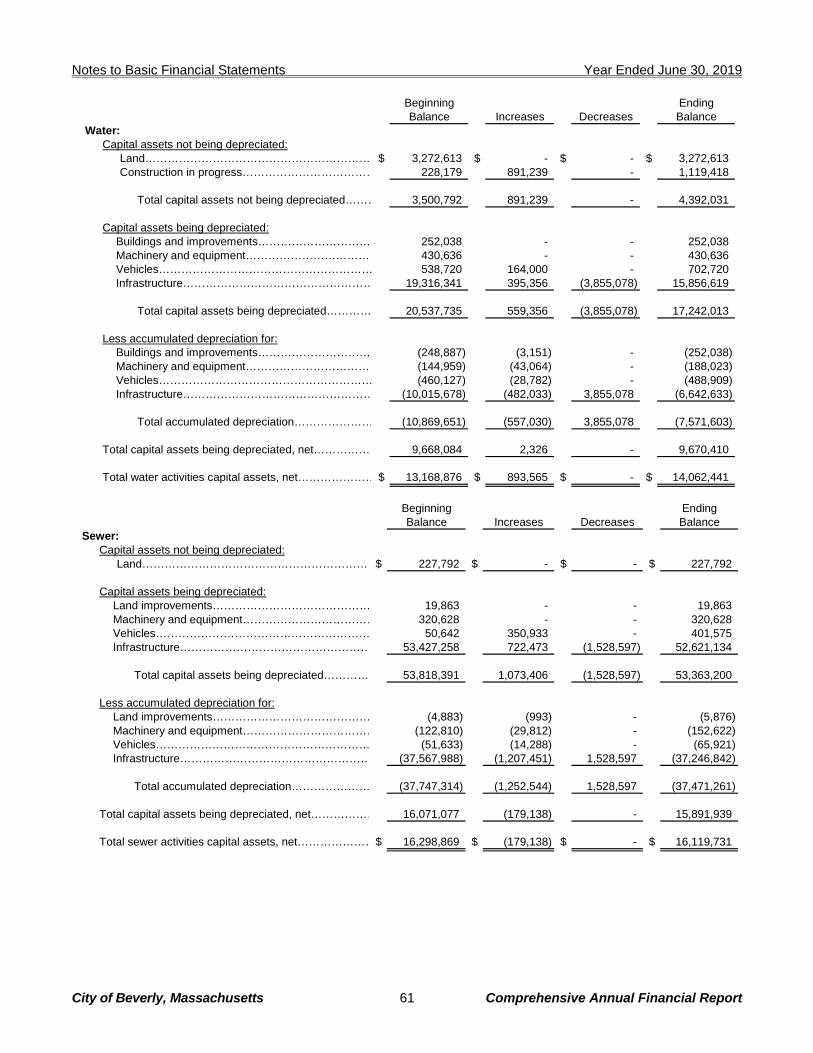
Notes to Basic Financial Statements Year Ended June 30, 2019
City of Beverly, Massachusetts 61 Comprehensive Annual Financial Report
Beginning EndingBalance Increases Decreases Balance
Water:Capital assets not being depreciated:
Land…………………………………………………… $ 3,272,613 $ - $ - $ 3,272,613 Construction in progress……………………………… 228,179 891,239 - 1,119,418
Total capital assets not being depreciated……… 3,500,792 891,239 - 4,392,031
Capital assets being depreciated:
Buildings and improvements………………………… 252,038 - - 252,038 Machinery and equipment……………………………… 430,636 - - 430,636 Vehicles………………………………………………… 538,720 164,000 - 702,720 Infrastructure…………………………………………… 19,316,341 395,356 (3,855,078) 15,856,619
Total capital assets being depreciated………… 20,537,735 559,356 (3,855,078) 17,242,013
Less accumulated depreciation for:
Buildings and improvements………………………… (248,887) (3,151) - (252,038) Machinery and equipment……………………………… (144,959) (43,064) - (188,023) Vehicles………………………………………………… (460,127) (28,782) - (488,909) Infrastructure…………………………………………… (10,015,678) (482,033) 3,855,078 (6,642,633)
Total accumulated depreciation………………… (10,869,651) (557,030) 3,855,078 (7,571,603)
Total capital assets being depreciated, net……………… 9,668,084 2,326 - 9,670,410
Total water activities capital assets, net………………… $ 13,168,876 $ 893,565 $ - $ 14,062,441
Beginning EndingBalance Increases Decreases Balance
Sewer:Capital assets not being depreciated:
Land…………………………………………………… $ 227,792 $ - $ - $ 227,792
Capital assets being depreciated: Land improvements…………………………………… 19,863 - - 19,863 Machinery and equipment……………………………… 320,628 - - 320,628 Vehicles………………………………………………… 50,642 350,933 - 401,575 Infrastructure…………………………………………… 53,427,258 722,473 (1,528,597) 52,621,134
Total capital assets being depreciated………… 53,818,391 1,073,406 (1,528,597) 53,363,200
Less accumulated depreciation for:
Land improvements…………………………………… (4,883) (993) - (5,876) Machinery and equipment……………………………… (122,810) (29,812) - (152,622) Vehicles………………………………………………… (51,633) (14,288) - (65,921) Infrastructure…………………………………………… (37,567,988) (1,207,451) 1,528,597 (37,246,842)
Total accumulated depreciation………………… (37,747,314) (1,252,544) 1,528,597 (37,471,261)
Total capital assets being depreciated, net……………… 16,071,077 (179,138) - 15,891,939
Total sewer activities capital assets, net…………………$ 16,298,869 $ (179,138) $ - $ 16,119,731
Notes to Basic Financial Statements Year Ended June 30, 2019
City of Beverly, Massachusetts 62 Comprehensive Annual Financial Report
Beginning EndingBalance Increases Decreases Balance
Airport:Capital assets not being depreciated:
Land…………………………………………………… $ 1,645,883 $ 61,399 $ - $ 1,707,282
Capital assets being depreciated: Land improvements…………………………………… 2,384,284 - - 2,384,284 Buildings and improvements………………………… 4,740,249 - - 4,740,249 Machinery and equipment……………………………… 505,564 - - 505,564 Vehicles………………………………………………… 301,376 - - 301,376 Infrastructure…………………………………………… 15,605,780 - (563,387) 15,042,393
Total capital assets being depreciated………… 23,537,253 - (563,387) 22,973,866
Less accumulated depreciation for:
Land improvements…………………………………… (1,541,906) (79,876) - (1,621,782) Buildings and improvements………………………… (797,440) (104,309) - (901,749) Machinery and equipment……………………………… (294,735) (33,556) - (328,291) Vehicles………………………………………………… (257,412) (9,672) - (267,084) Infrastructure…………………………………………… (3,886,409) (489,950) 563,387 (3,812,972)
Total accumulated depreciation………………… (6,777,902) (717,363) 563,387 (6,931,878)
Total capital assets being depreciated, net……………… 16,759,351 (717,363) - 16,041,988
Total airport activities capital assets, net…………………$ 18,405,234 $ (655,964) $ - $ 17,749,270
Beginning EndingBalance Increases Decreases Balance
Golf and Tennis:Capital assets not being depreciated:
Land…………………………………………………… $ 89,897 $ - $ - $ 89,897
Capital assets being depreciated: Land improvements…………………………………… 1,089,547 - - 1,089,547 Buildings and improvements………………………… 2,864,863 94,800 - 2,959,663 Machinery and equipment……………………………… 142,680 - - 142,680
Total capital assets being depreciated………… 4,097,090 94,800 - 4,191,890
Less accumulated depreciation for:
Land improvements…………………………………… (700,047) (29,344) - (729,391) Buildings and improvements………………………… (1,094,014) (141,258) - (1,235,272) Machinery and equipment……………………………… (1,189) (14,268) - (15,457)
Total accumulated depreciation………………… (1,795,250) (184,870) - (1,980,120)
Total capital assets being depreciated, net……………… 2,301,840 (90,070) - 2,211,770
Total golf and tennis activities capital assets, net………$ 2,391,737 $ (90,070) $ - $ 2,301,667
Notes to Basic Financial Statements Year Ended June 30, 2019
City of Beverly, Massachusetts 63 Comprehensive Annual Financial Report
Beginning EndingBalance Increases Decreases Balance
Harbor Management:Capital assets not being depreciated:
Land………………………………………………………… $ 211,089 $ - $ - $ 211,089
Capital assets being depreciated: Land improvements…………………………………………… 4,182,265 - - 4,182,265 Buildings and improvements………………………………… 329,770 - - 329,770 Machinery and equipment…………………………………… 182,219 - - 182,219 Vehicles………………………………………………………… 77,300 - - 77,300 Infrastructure…………………………………………………… 6,712,465 - (3,894,794) 2,817,671
Total capital assets being depreciated………………… 11,484,019 - (3,894,794) 7,589,225
Less accumulated depreciation for:
Land improvements…………………………………………… (930,839) (138,343) - (1,069,182) Buildings and improvements………………………………… (295,096) (7,705) - (302,801) Machinery and equipment…………………………………… (144,071) (18,222) - (162,293) Vehicles………………………………………………………… (77,300) - - (77,300) Infrastructure…………………………………………………… (5,114,462) (72,864) 3,894,794 (1,292,532)
Total accumulated depreciation………………………… (6,561,768) (237,134) 3,894,794 (2,904,108)
Total capital assets being depreciated, net…………………… 4,922,251 (237,134) - 4,685,117
Total harbor management activities capital assets, net……… $ 5,133,340 $ (237,134) $ - $ 4,896,206
Beginning EndingBalance Increases Decreases Balance
Senior Citizen:Capital assets being depreciated:
Machinery and equipment…………………………………… $ 23,632 $ - $ - $ 23,632 Vehicles………………………………………………………… 22,329 - - 22,329
Total capital assets being depreciated………………… 45,961 - - 45,961
Less accumulated depreciation for:
Machinery and equipment…………………………………… (13,785) (2,363) - (16,148) Vehicles………………………………………………………… (14,479) (2,233) - (16,712)
Total accumulated depreciation………………………… (28,264) (4,596) - (32,860)
Total senior citizen activities capital assets, net……………… $ 17,697 $ (4,596) $ - $ 13,101
Notes to Basic Financial Statements Year Ended June 30, 2019
City of Beverly, Massachusetts 64 Comprehensive Annual Financial Report
Beginning EndingBalance Increases Decreases Balance
Recreation:Capital assets not being depreciated:
Land…………………………………………………… $ 950,000 $ - $ - $ 950,000
Capital assets being depreciated: Land improvements…………………………………… 59,803 - - 59,803 Buildings and improvements………………………… 22,180 - - 22,180
Total capital assets being depreciated………… 81,983 - - 81,983
Less accumulated depreciation for:
Land improvements…………………………………… (3,489) (5,980) - (9,469) Buildings and improvements………………………… (462) (1,109) - (1,571)
Total accumulated depreciation………………… (3,951) (7,089) - (11,040)
Total capital assets being depreciated, net……………… 78,032 (7,089) - 70,943
Total recreation activities capital assets, net……………$ 1,028,032 $ (7,089) $ - $ 1,020,943
Depreciation expense was charged to functions/programs of the primary government as follows:
Governmental Activities:General government……………………………………………………… $ 215,138 Public safety………………………………………………………………… 682,855 Education…………………………………………………………………… 7,147,227 Public works………………………………………………………………… 3,208,569 Human services…………………………………………………………… 64,432 Culture and recreation……………………………………………………… 396,875
Total depreciation expense - governmental activities……………………… $ 11,715,096
Business-Type Activities:
Water…………………………………………………………………..…… $ 557,030 Sewer…………………………………………………………………..…… 1,252,544Airport…………………………………………………………………..…… 717,363 Golf and tennis……………………………………………………………… 184,870 Harbor management……………………………………………………… 237,134 Recreation…………………………………………………………………. 7,089 Senior Citizens……………………………………………………………… 4,596
Total depreciation expense - business-type activities……………………… $ 2,960,626
Notes to Basic Financial Statements Year Ended June 30, 2019
City of Beverly, Massachusetts 65 Comprehensive Annual Financial Report
NOTE 5 – INTERFUND TRANSFERS Interfund transfers for the year ended June 30, 2019, are summarized as follows:
GolfCommunity Nonmajor and Tennis Sanitation
General Preservation governmental Enterprise EnterpriseTransfers Out: fund fund funds fund fund Total
General fund…………………………… $ - $ - $ 4,076,750 $ - $ 1,138,750 $ 5,215,500 (1)Community Preservation fund………… - - 409,052 89,000 - 498,052 (2)Nonmajor governmental funds……… 1,263,963 84,350 700,342 - - 2,048,655 (3)Recreation Enterprise fund…………… - 450,000 - - - 450,000 (4)
Total…………………………………… $ 1,263,963 $ 534,350 $ 5,186,144 $ 89,000 $ 1,138,750 $ 8,212,207
Transfers In:
(1) Represents the transfer of amounts raised to fund capital projects, the sanitation enterprise fund and other
governmental activities accounted for in special revenue funds. (2) Represents transfers from the community preservation fund to governmental capital project funds and the
golf and tennis enterprise fund. (3) Represents budgeted transfers from other available funds to support general fund operations, a transfer from
the Lynch Park capital projects fund to the community preservation fund, and various transfers between nonmajor governmental funds.
(4) Represents a transfer from the recreation enterprise fund to the community preservation fund. NOTE 6 – CAPITAL LEASES The City has entered into lease agreements to finance the acquisition of school busses, vans and notebook computers. The notebook computers are being used for the High School’s 1 to 1 computer initiative. Under this program, parents are required to sign an agreement with the school where an annual fee is paid for the right to use a notebook computer. The agreements have various payment options and a buyout provision at the end of the term. For students that do not participate in the lease program, the School provides computers at no cost that must remain on school property. The lease agreements qualify as capital leases, for accounting purposes, and therefore have been recorded at the present value of their future minimum lease payments as of the inception date of the lease agreement. The assets acquired through capital leases are as follows:
GovernmentalActivities
Asset:Machinery and equipment…………… $ 3,623,602 Less: accumulated depreciation…… (2,729,994)
Total…………………………………… $ 893,608
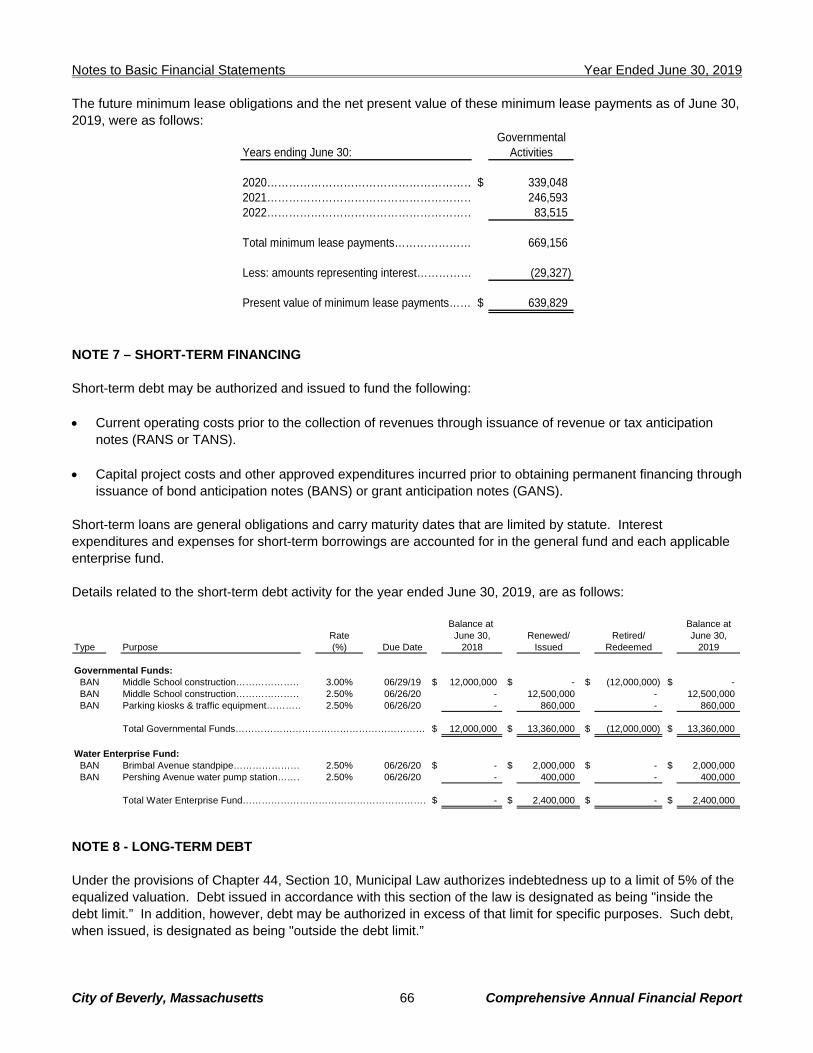
Notes to Basic Financial Statements Year Ended June 30, 2019
City of Beverly, Massachusetts 66 Comprehensive Annual Financial Report
The future minimum lease obligations and the net present value of these minimum lease payments as of June 30, 2019, were as follows:
GovernmentalYears ending June 30: Activities
2020………………………………………………… $ 339,048 2021………………………………………………… 246,593 2022………………………………………………… 83,515
Total minimum lease payments………………… 669,156
Less: amounts representing interest…………… (29,327)
Present value of minimum lease payments…… $ 639,829
NOTE 7 – SHORT-TERM FINANCING Short-term debt may be authorized and issued to fund the following: Current operating costs prior to the collection of revenues through issuance of revenue or tax anticipation
notes (RANS or TANS). Capital project costs and other approved expenditures incurred prior to obtaining permanent financing through
issuance of bond anticipation notes (BANS) or grant anticipation notes (GANS).
Short-term loans are general obligations and carry maturity dates that are limited by statute. Interest expenditures and expenses for short-term borrowings are accounted for in the general fund and each applicable enterprise fund. Details related to the short-term debt activity for the year ended June 30, 2019, are as follows:
Balance at Balance at
Rate June 30, Renewed/ Retired/ June 30,Type Purpose (%) Due Date 2018 Issued Redeemed 2019
Governmental Funds:BAN Middle School construction………………… 3.00% 06/29/19 $ 12,000,000 $ - $ (12,000,000) $ - BAN Middle School construction………………… 2.50% 06/26/20 - 12,500,000 - 12,500,000 BAN Parking kiosks & traffic equipment………… 2.50% 06/26/20 - 860,000 - 860,000
Total Governmental Funds…………………………………………………… $ 12,000,000 $ 13,360,000 $ (12,000,000) $ 13,360,000
Water Enterprise Fund:BAN Brimbal Avenue standpipe………………… 2.50% 06/26/20 $ - $ 2,000,000 $ - $ 2,000,000 BAN Pershing Avenue water pump station……… 2.50% 06/26/20 - 400,000 - 400,000
Total Water Enterprise Fund……………………………………………………$ - $ 2,400,000 $ - $ 2,400,000
NOTE 8 - LONG-TERM DEBT Under the provisions of Chapter 44, Section 10, Municipal Law authorizes indebtedness up to a limit of 5% of the equalized valuation. Debt issued in accordance with this section of the law is designated as being "inside the debt limit.” In addition, however, debt may be authorized in excess of that limit for specific purposes. Such debt, when issued, is designated as being "outside the debt limit.”
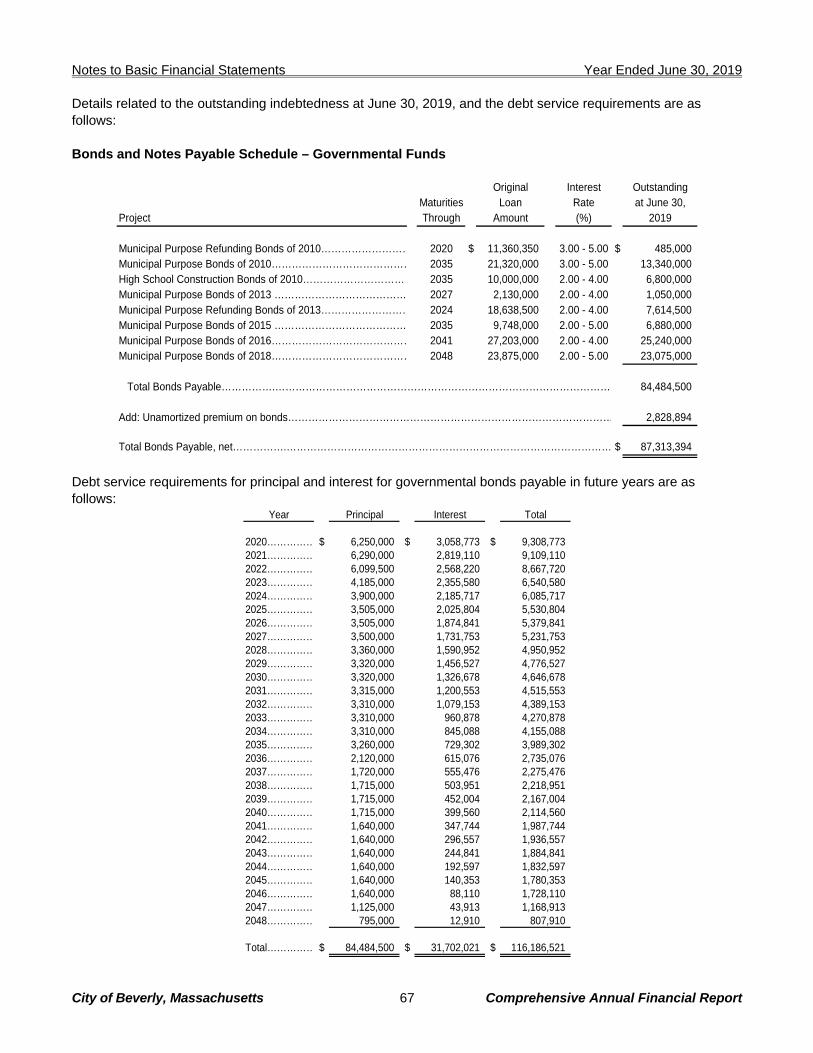
Notes to Basic Financial Statements Year Ended June 30, 2019
City of Beverly, Massachusetts 67 Comprehensive Annual Financial Report
Details related to the outstanding indebtedness at June 30, 2019, and the debt service requirements are as follows: Bonds and Notes Payable Schedule – Governmental Funds
Original Interest OutstandingMaturities Loan Rate at June 30,
Project Through Amount (%) 2019
Municipal Purpose Refunding Bonds of 2010……………………… 2020 $ 11,360,350 3.00 - 5.00 $ 485,000 Municipal Purpose Bonds of 2010…………………………………… 2035 21,320,000 3.00 - 5.00 13,340,000 High School Construction Bonds of 2010…………………………… 2035 10,000,000 2.00 - 4.00 6,800,000 Municipal Purpose Bonds of 2013 ………………………………… 2027 2,130,000 2.00 - 4.00 1,050,000 Municipal Purpose Refunding Bonds of 2013……………………… 2024 18,638,500 2.00 - 4.00 7,614,500 Municipal Purpose Bonds of 2015 ………………………………… 2035 9,748,000 2.00 - 5.00 6,880,000 Municipal Purpose Bonds of 2016…………………………………… 2041 27,203,000 2.00 - 4.00 25,240,000 Municipal Purpose Bonds of 2018…………………………………… 2048 23,875,000 2.00 - 5.00 23,075,000
Total Bonds Payable…………….……………………………………………………………………………………… 84,484,500
Add: Unamortized premium on bonds…………………………………………………………………………………… 2,828,894
Total Bonds Payable, net…………….…………………………………………………………………………………… $ 87,313,394
Debt service requirements for principal and interest for governmental bonds payable in future years are as follows:
Year Principal Interest Total
2020…………… $ 6,250,000 $ 3,058,773 $ 9,308,773 2021…………… 6,290,000 2,819,110 9,109,110 2022…………… 6,099,500 2,568,220 8,667,720 2023…………… 4,185,000 2,355,580 6,540,580 2024…………… 3,900,000 2,185,717 6,085,717 2025…………… 3,505,000 2,025,804 5,530,804 2026…………… 3,505,000 1,874,841 5,379,841 2027…………… 3,500,000 1,731,753 5,231,753 2028…………… 3,360,000 1,590,952 4,950,952 2029…………… 3,320,000 1,456,527 4,776,527 2030…………… 3,320,000 1,326,678 4,646,678 2031…………… 3,315,000 1,200,553 4,515,553 2032…………… 3,310,000 1,079,153 4,389,153 2033…………… 3,310,000 960,878 4,270,878 2034…………… 3,310,000 845,088 4,155,088 2035…………… 3,260,000 729,302 3,989,302 2036…………… 2,120,000 615,076 2,735,076 2037…………… 1,720,000 555,476 2,275,476 2038…………… 1,715,000 503,951 2,218,951 2039…………… 1,715,000 452,004 2,167,004 2040…………… 1,715,000 399,560 2,114,560 2041…………… 1,640,000 347,744 1,987,744 2042…………… 1,640,000 296,557 1,936,557 2043…………… 1,640,000 244,841 1,884,841 2044…………… 1,640,000 192,597 1,832,597 2045…………… 1,640,000 140,353 1,780,353 2046…………… 1,640,000 88,110 1,728,110 2047…………… 1,125,000 43,913 1,168,913 2048…………… 795,000 12,910 807,910
Total…………… $ 84,484,500 $ 31,702,021 $ 116,186,521
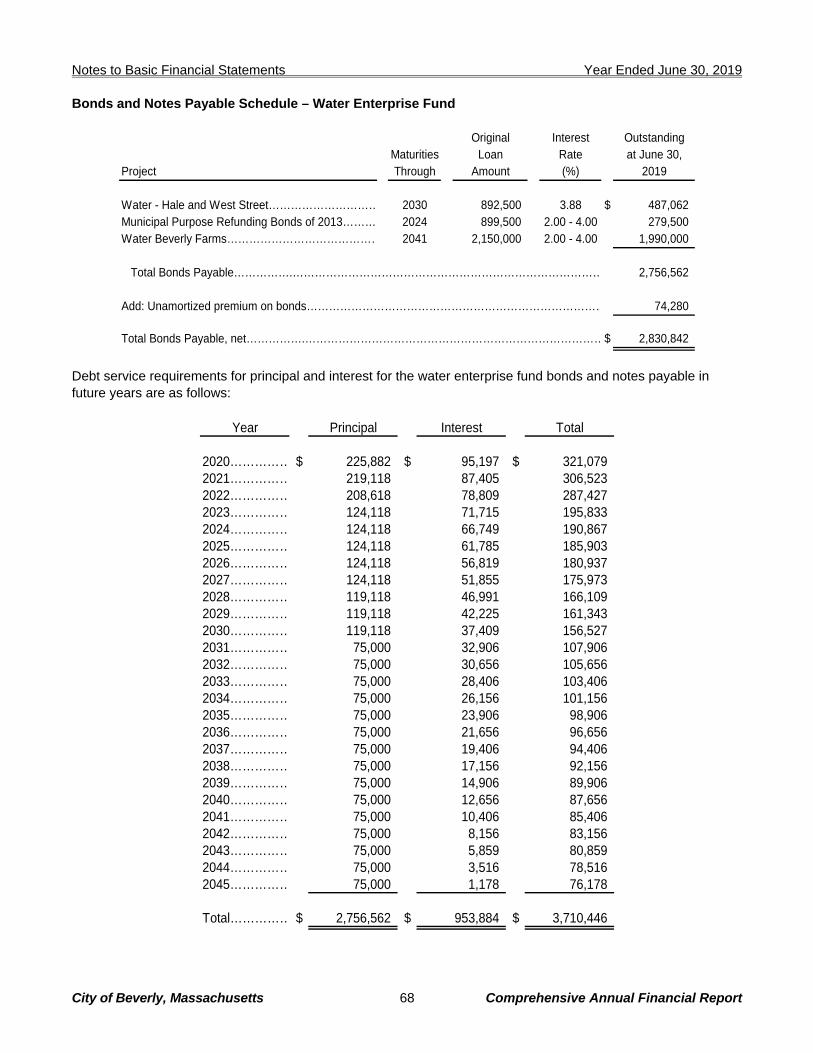
Notes to Basic Financial Statements Year Ended June 30, 2019
City of Beverly, Massachusetts 68 Comprehensive Annual Financial Report
Bonds and Notes Payable Schedule – Water Enterprise Fund
Original Interest OutstandingMaturities Loan Rate at June 30,
Project Through Amount (%) 2019
Water - Hale and West Street………………………… 2030 892,500 3.88 $ 487,062 Municipal Purpose Refunding Bonds of 2013……… 2024 899,500 2.00 - 4.00 279,500 Water Beverly Farms…………………………………… 2041 2,150,000 2.00 - 4.00 1,990,000
Total Bonds Payable…………….………………………………………………………………………… 2,756,562
Add: Unamortized premium on bonds……………………………………………………………………… 74,280
Total Bonds Payable, net…………….………………………………………………………………………$ 2,830,842
Debt service requirements for principal and interest for the water enterprise fund bonds and notes payable in future years are as follows:
Year Principal Interest Total
2020…………… $ 225,882 $ 95,197 $ 321,079 2021…………… 219,118 87,405 306,523 2022…………… 208,618 78,809 287,427 2023…………… 124,118 71,715 195,833 2024…………… 124,118 66,749 190,867 2025…………… 124,118 61,785 185,903 2026…………… 124,118 56,819 180,937 2027…………… 124,118 51,855 175,973 2028…………… 119,118 46,991 166,109 2029…………… 119,118 42,225 161,343 2030…………… 119,118 37,409 156,527 2031…………… 75,000 32,906 107,906 2032…………… 75,000 30,656 105,656 2033…………… 75,000 28,406 103,406 2034…………… 75,000 26,156 101,156 2035…………… 75,000 23,906 98,906 2036…………… 75,000 21,656 96,656 2037…………… 75,000 19,406 94,406 2038…………… 75,000 17,156 92,156 2039…………… 75,000 14,906 89,906 2040…………… 75,000 12,656 87,656 2041…………… 75,000 10,406 85,406 2042…………… 75,000 8,156 83,156 2043…………… 75,000 5,859 80,859 2044…………… 75,000 3,516 78,516 2045…………… 75,000 1,178 76,178
Total…………… $ 2,756,562 $ 953,884 $ 3,710,446
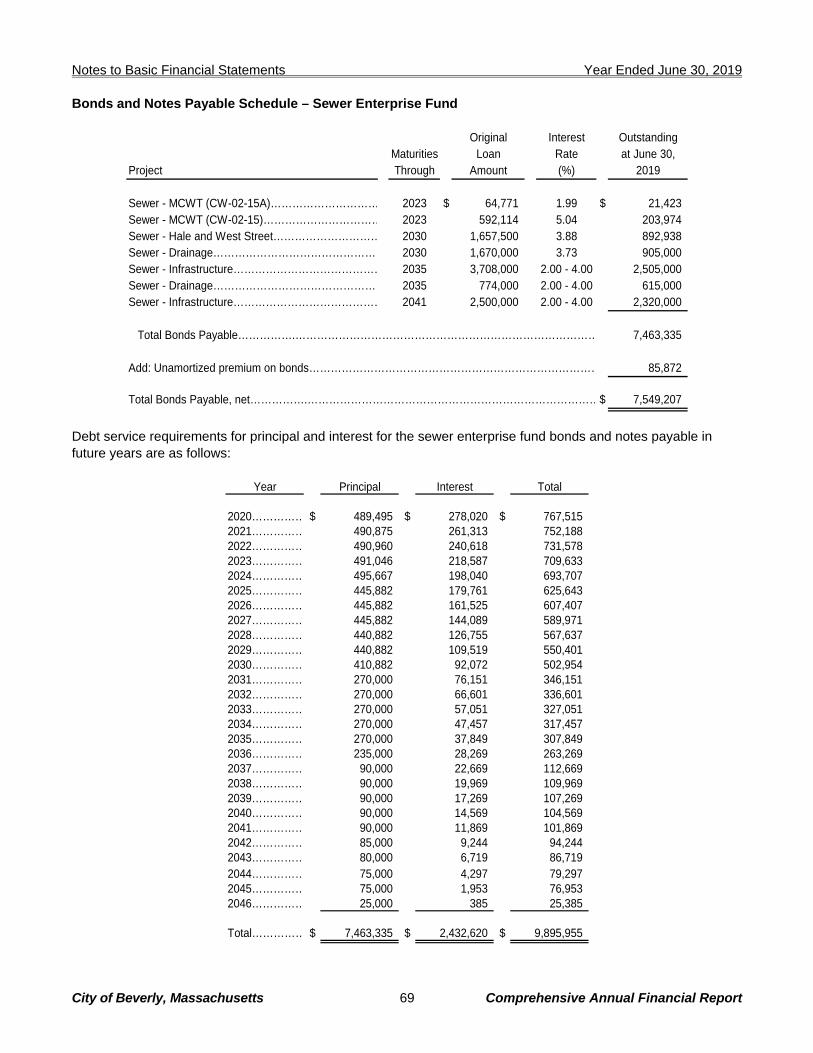
Notes to Basic Financial Statements Year Ended June 30, 2019
City of Beverly, Massachusetts 69 Comprehensive Annual Financial Report
Bonds and Notes Payable Schedule – Sewer Enterprise Fund
Original Interest OutstandingMaturities Loan Rate at June 30,
Project Through Amount (%) 2019
Sewer - MCWT (CW-02-15A)………………………… 2023 $ 64,771 1.99 $ 21,423 Sewer - MCWT (CW-02-15)…………………………… 2023 592,114 5.04 203,974 Sewer - Hale and West Street………………………… 2030 1,657,500 3.88 892,938 Sewer - Drainage………………………………………… 2030 1,670,000 3.73 905,000 Sewer - Infrastructure…………………………………… 2035 3,708,000 2.00 - 4.00 2,505,000 Sewer - Drainage………………………………………… 2035 774,000 2.00 - 4.00 615,000 Sewer - Infrastructure…………………………………… 2041 2,500,000 2.00 - 4.00 2,320,000
Total Bonds Payable…………….………………………………………………………………………… 7,463,335
Add: Unamortized premium on bonds……………………………………………………………………… 85,872
Total Bonds Payable, net…………….………………………………………………………………………$ 7,549,207
Debt service requirements for principal and interest for the sewer enterprise fund bonds and notes payable in future years are as follows:
Year Principal Interest Total
2020…………… $ 489,495 $ 278,020 $ 767,515 2021…………… 490,875 261,313 752,188 2022…………… 490,960 240,618 731,578 2023…………… 491,046 218,587 709,633 2024…………… 495,667 198,040 693,707 2025…………… 445,882 179,761 625,643 2026…………… 445,882 161,525 607,407 2027…………… 445,882 144,089 589,971 2028…………… 440,882 126,755 567,637 2029…………… 440,882 109,519 550,401 2030…………… 410,882 92,072 502,954 2031…………… 270,000 76,151 346,151 2032…………… 270,000 66,601 336,601 2033…………… 270,000 57,051 327,051 2034…………… 270,000 47,457 317,457 2035…………… 270,000 37,849 307,849 2036…………… 235,000 28,269 263,269 2037…………… 90,000 22,669 112,669 2038…………… 90,000 19,969 109,969 2039…………… 90,000 17,269 107,269 2040…………… 90,000 14,569 104,569 2041…………… 90,000 11,869 101,869 2042…………… 85,000 9,244 94,244 2043…………… 80,000 6,719 86,719 2044…………… 75,000 4,297 79,297 2045…………… 75,000 1,953 76,953 2046…………… 25,000 385 25,385
Total…………… $ 7,463,335 $ 2,432,620 $ 9,895,955
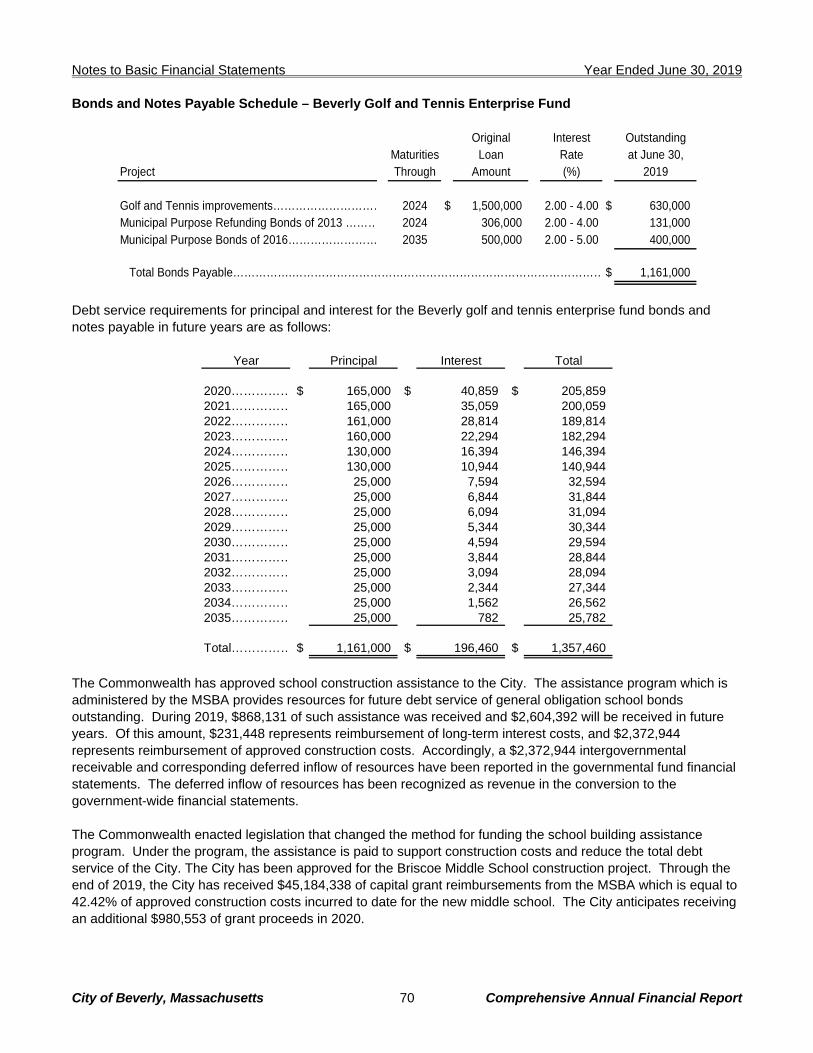
Notes to Basic Financial Statements Year Ended June 30, 2019
City of Beverly, Massachusetts 70 Comprehensive Annual Financial Report
Bonds and Notes Payable Schedule – Beverly Golf and Tennis Enterprise Fund
Original Interest OutstandingMaturities Loan Rate at June 30,
Project Through Amount (%) 2019
Golf and Tennis improvements………………………… 2024 $ 1,500,000 2.00 - 4.00 $ 630,000 Municipal Purpose Refunding Bonds of 2013 ……… 2024 306,000 2.00 - 4.00 131,000 Municipal Purpose Bonds of 2016…………………… 2035 500,000 2.00 - 5.00 400,000
Total Bonds Payable…………….…………………………………………………………………………$ 1,161,000
Debt service requirements for principal and interest for the Beverly golf and tennis enterprise fund bonds and notes payable in future years are as follows:
Year Principal Interest Total
2020…………… $ 165,000 $ 40,859 $ 205,859 2021…………… 165,000 35,059 200,059 2022…………… 161,000 28,814 189,814 2023…………… 160,000 22,294 182,294 2024…………… 130,000 16,394 146,394 2025…………… 130,000 10,944 140,944 2026…………… 25,000 7,594 32,594 2027…………… 25,000 6,844 31,844 2028…………… 25,000 6,094 31,094 2029…………… 25,000 5,344 30,344 2030…………… 25,000 4,594 29,594 2031…………… 25,000 3,844 28,844 2032…………… 25,000 3,094 28,094 2033…………… 25,000 2,344 27,344 2034…………… 25,000 1,562 26,562 2035…………… 25,000 782 25,782
Total…………… $ 1,161,000 $ 196,460 $ 1,357,460
The Commonwealth has approved school construction assistance to the City. The assistance program which is administered by the MSBA provides resources for future debt service of general obligation school bonds outstanding. During 2019, $868,131 of such assistance was received and $2,604,392 will be received in future years. Of this amount, $231,448 represents reimbursement of long-term interest costs, and $2,372,944 represents reimbursement of approved construction costs. Accordingly, a $2,372,944 intergovernmental receivable and corresponding deferred inflow of resources have been reported in the governmental fund financial statements. The deferred inflow of resources has been recognized as revenue in the conversion to the government-wide financial statements. The Commonwealth enacted legislation that changed the method for funding the school building assistance program. Under the program, the assistance is paid to support construction costs and reduce the total debt service of the City. The City has been approved for the Briscoe Middle School construction project. Through the end of 2019, the City has received $45,184,338 of capital grant reimbursements from the MSBA which is equal to 42.42% of approved construction costs incurred to date for the new middle school. The City anticipates receiving an additional $980,553 of grant proceeds in 2020.
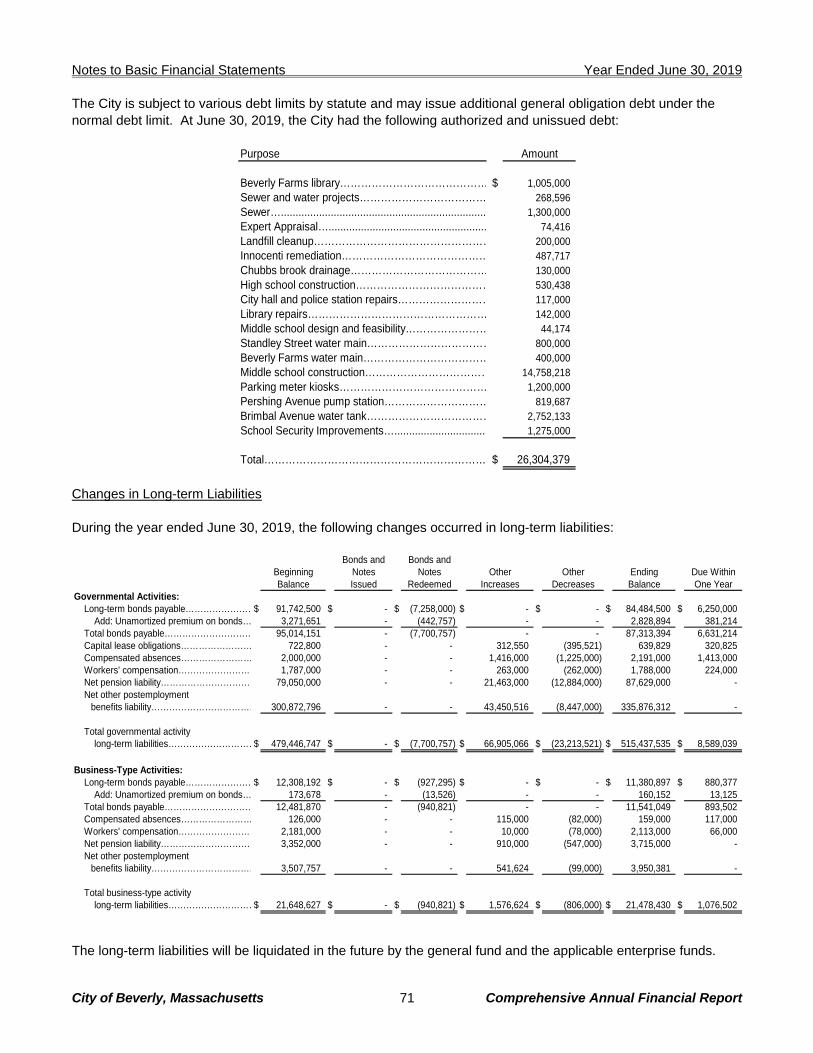
Notes to Basic Financial Statements Year Ended June 30, 2019
City of Beverly, Massachusetts 71 Comprehensive Annual Financial Report
The City is subject to various debt limits by statute and may issue additional general obligation debt under the normal debt limit. At June 30, 2019, the City had the following authorized and unissued debt:
Purpose Amount
Beverly Farms library…………………………………… $ 1,005,000 Sewer and water projects……………………………… 268,596 Sewer…...................................................................... 1,300,000 Expert Appraisal…...................................................... 74,416 Landfill cleanup…………………………………………… 200,000 Innocenti remediation…………………………………… 487,717 Chubbs brook drainage………………………………… 130,000 High school construction………………………………… 530,438 City hall and police station repairs……………………… 117,000 Library repairs…………………………………………… 142,000 Middle school design and feasibility…………………… 44,174 Standley Street water main……………………………… 800,000 Beverly Farms water main……………………………… 400,000 Middle school construction……………………………… 14,758,218 Parking meter kiosks…………………………………… 1,200,000 Pershing Avenue pump station………………………… 819,687 Brimbal Avenue water tank……………………………… 2,752,133 School Security Improvements…............................... 1,275,000
Total……………………………………………………… $ 26,304,379
Changes in Long-term Liabilities During the year ended June 30, 2019, the following changes occurred in long-term liabilities:
Bonds and Bonds andBeginning Notes Notes Other Other Ending Due WithinBalance Issued Redeemed Increases Decreases Balance One Year
Governmental Activities:Long-term bonds payable……………………$ 91,742,500 $ - $ (7,258,000) $ - $ - $ 84,484,500 $ 6,250,000
Add: Unamortized premium on bonds… 3,271,651 - (442,757) - - 2,828,894 381,214Total bonds payable………………………… 95,014,151 - (7,700,757) - - 87,313,394 6,631,214 Capital lease obligations…………………… 722,800 - - 312,550 (395,521) 639,829 320,825 Compensated absences…………………… 2,000,000 - - 1,416,000 (1,225,000) 2,191,000 1,413,000 Workers' compensation……………………… 1,787,000 - - 263,000 (262,000) 1,788,000 224,000 Net pension liability…………………………… 79,050,000 - - 21,463,000 (12,884,000) 87,629,000 - Net other postemployment
benefits liability……………………………… 300,872,796 - - 43,450,516 (8,447,000) 335,876,312 -
Total governmental activitylong-term liabilities…………………………$ 479,446,747 $ - $ (7,700,757) $ 66,905,066 $ (23,213,521) $ 515,437,535 $ 8,589,039
Business-Type Activities:Long-term bonds payable……………………$ 12,308,192 $ - $ (927,295) $ - $ - $ 11,380,897 $ 880,377
Add: Unamortized premium on bonds… 173,678 - (13,526) - - 160,152 13,125 Total bonds payable………………………… 12,481,870 - (940,821) - - 11,541,049 893,502 Compensated absences…………………… 126,000 - - 115,000 (82,000) 159,000 117,000 Workers' compensation……………………… 2,181,000 - - 10,000 (78,000) 2,113,000 66,000 Net pension liability…………………………… 3,352,000 - - 910,000 (547,000) 3,715,000 - Net other postemployment
benefits liability……………………………… 3,507,757 - - 541,624 (99,000) 3,950,381 -
Total business-type activitylong-term liabilities…………………………$ 21,648,627 $ - $ (940,821) $ 1,576,624 $ (806,000) $ 21,478,430 $ 1,076,502
The long-term liabilities will be liquidated in the future by the general fund and the applicable enterprise funds.
Notes to Basic Financial Statements Year Ended June 30, 2019
City of Beverly, Massachusetts 72 Comprehensive Annual Financial Report
NOTE 9 – GOVERNMENTAL FUND BALANCE CLASSIFICATIONS GASB Statement No. 54, Fund Balance Reporting and Governmental Fund Type Definitions, establishes a hierarchy for fund balance classifications and the constraints imposed on the uses of those resources. GASB 54 provides for two major types of fund balances, which are nonspendable and spendable. Nonspendable fund balances are balances that cannot be spent because they are not expected to be converted to cash or they are legally or contractually required to remain intact. Examples of this classification are prepaid items, inventories, and principal (corpus) of an endowment fund. The City has reported principal portions of endowment funds as nonspendable. In addition to the nonspendable fund balance, GASB 54 has provided a hierarchy of spendable fund balances, based on a hierarchy of spending constraints.
Restricted: fund balances that are constrained by external parties, constitutional provisions, or enabling legislation.
Committed: fund balances that contain self-imposed constraints of the government from its highest level
of decision making authority.
Assigned: fund balances that contain self-imposed constraints of the government to be used for a particular purpose.
Unassigned: fund balance of the general fund that is not constrained for any particular purpose.
The City’s spending policy is to spend restricted fund balance first, followed by committed, assigned and unassigned fund balance. Most governmental funds are designated for one purpose at the time of their creation. Therefore, any expenditure from the fund will be allocated to the applicable fund balance classifications in the order of the aforementioned spending policy. The general fund and certain other funds may have more than one purpose. Massachusetts General Law Ch.40 §5B allows for the establishment of Stabilization funds for one or more different purposes. The creation of a fund requires a two-thirds vote of the legislative body and must clearly define the purpose of the fund. Any change to the purpose of the fund along with any additions to or appropriations from the fund requires a two-thirds vote of the legislative body. At year end, the balance of the Debt Service Stabilization Fund is $1,000,903 and is reported as committed fund balance within the General Fund. The City established a general stabilization fund in 2014 to help ensure Beverly’s long-term stability by setting aside money for unforeseen or capital needs. The City also adopted a policy that includes, but is not limited to, a minimum annual contribution to the fund of no less than 10% of the certified free cash balance. At year-end, the City’s general stabilization fund totaled $12,615,924.

Notes to Basic Financial Statements Year Ended June 30, 2019
City of Beverly, Massachusetts 73 Comprehensive Annual Financial Report
The City has classified its fund balances within the following hierarchy:
Nonmajor TotalCommunity Middle School Governmental Governmental
General Preservation Construction Funds Funds
Fund Balances: Nonspendable:
Permanent fund principal………………………$ - $ - $ - $ 2,154,139 $ 2,154,139 Restricted for:
Community preservation……………………… - 2,931,584 - - 2,931,584 City federal and state grants…………………… - - - 817,152 817,152 Other City grants and gifts…………………… - - - 1,907,438 1,907,438 School revolving fund…………………………… - - - 602,824 602,824 Other school grants and gifts………………… - - - 1,424,337 1,424,337 School federal and state grants……………… - - - 1,179,700 1,179,700 Special revenue trust fund…………………… - - - 51,895 51,895 Receipts reserved for appropriation………… - - - 756,874 756,874 Highway construction…………………………… - - - 478,455 478,455 City capital projects…………………………… - - - 2,654,285 2,654,285 School capital projects………………………… - - - 2,766,509 2,766,509 Libraries permanent fund……………………… - - - 330,936 330,936 Cemetery perpetual care……………………… - - - 1,403,576 1,403,576 Conservation trust fund………………………… - - - 687,621 687,621 Other permanent fund………………………… - - - 543,105 543,105
Committed to: Stabilization - debt service…………………… 1,000,903 - - - 1,000,903
Assigned to: Encumbrances:
Clerk………………………………………… 100 - - - 100 Executive…………………………………… 5,420 - - - 5,420 Reserve for appropriations………………… 313,103 - - - 313,103 Accountant…………………………………… 14,628 - - - 14,628 Information systems………………………… 14,536 - - - 14,536 Treasurer/Collector………………………… 5,889 - - - 5,889 Procurement………………………………… 13,280 - - - 13,280 Solicitor……………………………………… 73,594 - - - 73,594 Human resources…………………………… 1,900 - - - 1,900 Planning……………………………………… 15,020 - - - 15,020 Public property……………………………… 108,466 - - - 108,466 Building commissioner…………………… 339 - - - 339 Police………………………………………… 159,837 - - - 159,837 Harbor master…....................................... 27 - - - 27 Fire…………………………………………… 125,133 - - - 125,133 Public schools……………………………… 358,389 - - - 358,389 Engineering………………………………… 70,526 - - - 70,526 Highway……………………………………… 349,008 - - - 349,008 Snow and ice………………………………… 2,500 - - - 2,500 Municipal garage…………………………… 9,518 - - - 9,518 Cemetery….............................................. 5,692 - - - 5,692 Electric division……………………………… 8,381 - - - 8,381 Parks and forestry………………………… 16,935 - - - 16,935 Health………………………………………… 1,113 - - - 1,113 Council on aging…………………………… 641 - - - 641 Library……………………………………… 8,808 - - - 8,808 Recreation…………………………………… 2,425 - - - 2,425 Unemployment…...................................... 4,000 - - - 4,000 Health insurance…................................... 725 - - - 725
Unassigned to:Operating fund………………………………… 11,884,499 - - - 11,884,499 Middle school construction…………………… - - (10,910,270) - (10,910,270) Stabilization - general purpose………………… 12,615,924 - - - 12,615,924
Total Fund Balances…………….………………………$ 27,191,259 $ 2,931,584 $ (10,910,270) $ 17,758,846 $ 36,971,419
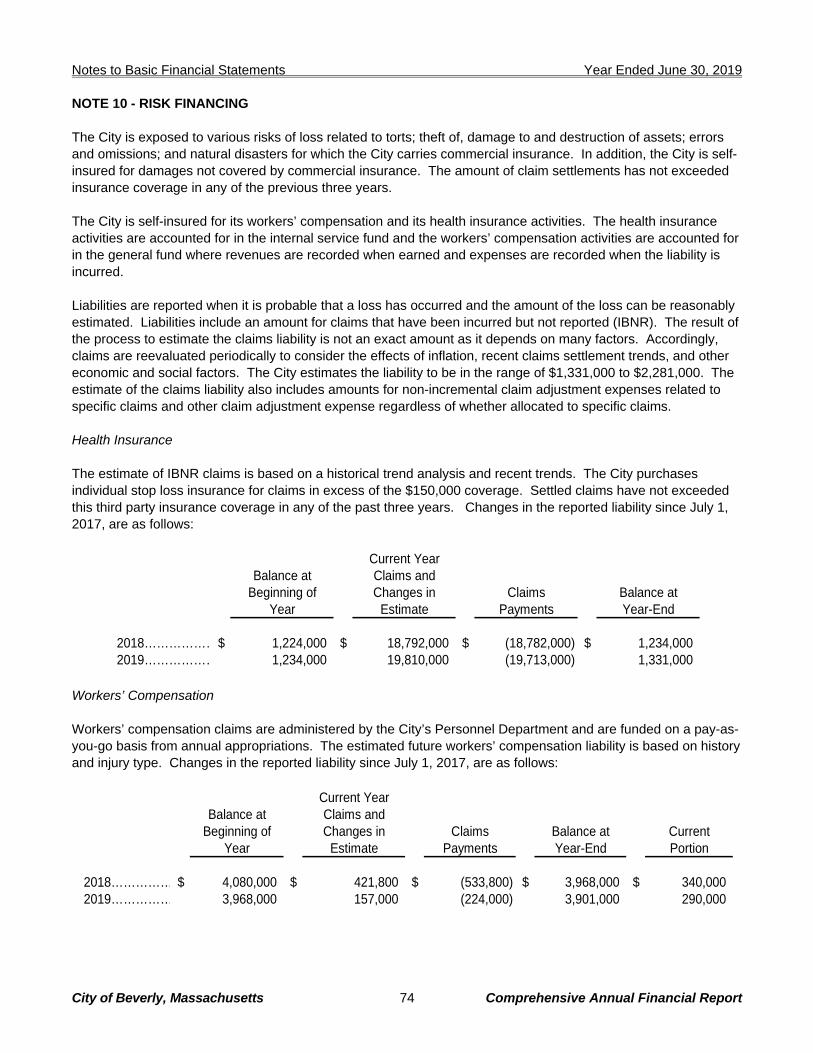
Notes to Basic Financial Statements Year Ended June 30, 2019
City of Beverly, Massachusetts 74 Comprehensive Annual Financial Report
NOTE 10 - RISK FINANCING The City is exposed to various risks of loss related to torts; theft of, damage to and destruction of assets; errors and omissions; and natural disasters for which the City carries commercial insurance. In addition, the City is self-insured for damages not covered by commercial insurance. The amount of claim settlements has not exceeded insurance coverage in any of the previous three years. The City is self-insured for its workers’ compensation and its health insurance activities. The health insurance activities are accounted for in the internal service fund and the workers’ compensation activities are accounted for in the general fund where revenues are recorded when earned and expenses are recorded when the liability is incurred. Liabilities are reported when it is probable that a loss has occurred and the amount of the loss can be reasonably estimated. Liabilities include an amount for claims that have been incurred but not reported (IBNR). The result of the process to estimate the claims liability is not an exact amount as it depends on many factors. Accordingly, claims are reevaluated periodically to consider the effects of inflation, recent claims settlement trends, and other economic and social factors. The City estimates the liability to be in the range of $1,331,000 to $2,281,000. The estimate of the claims liability also includes amounts for non-incremental claim adjustment expenses related to specific claims and other claim adjustment expense regardless of whether allocated to specific claims. Health Insurance The estimate of IBNR claims is based on a historical trend analysis and recent trends. The City purchases individual stop loss insurance for claims in excess of the $150,000 coverage. Settled claims have not exceeded this third party insurance coverage in any of the past three years. Changes in the reported liability since July 1, 2017, are as follows:
Current Year
Balance at Claims andBeginning of Changes in Claims Balance at
Year Estimate Payments Year-End
2018………………$ 1,224,000 $ 18,792,000 $ (18,782,000) $ 1,234,000 2019……………… 1,234,000 19,810,000 (19,713,000) 1,331,000
Workers’ Compensation Workers’ compensation claims are administered by the City’s Personnel Department and are funded on a pay-as-you-go basis from annual appropriations. The estimated future workers’ compensation liability is based on history and injury type. Changes in the reported liability since July 1, 2017, are as follows:
Current Year
Balance at Claims andBeginning of Changes in Claims Balance at Current
Year Estimate Payments Year-End Portion
2018…………… $ 4,080,000 $ 421,800 $ (533,800) $ 3,968,000 $ 340,000 2019…………… 3,968,000 157,000 (224,000) 3,901,000 290,000
Notes to Basic Financial Statements Year Ended June 30, 2019
City of Beverly, Massachusetts 75 Comprehensive Annual Financial Report
NOTE 11 - PENSION PLAN Plan Descriptions The City is a member of the Beverly Contributory Retirement System (BCRS), a cost-sharing multiple-employer defined benefit pension plan covering eligible employees of the 2 member units. The System is administered by five board members (Board) on behalf of all current employees and retirees except for current teachers and retired teachers. Chapter 32 of the MGL assigns authority to establish and amend benefit provisions of the plan. The System is a component unit and is reported as a pension trust fund in the fiduciary fund financial statements. The City is a member of the Massachusetts Teachers’ Retirement System (MTRS), a cost-sharing multi-employer defined benefit plan. MTRS is managed by the Commonwealth of Massachusetts (Commonwealth) on behalf of municipal teachers and municipal teacher retirees. The Commonwealth is a nonemployer contributor and is responsible for 100% of the contributions and future benefit requirements of the MTRS. The MTRS covers certified teachers in cities (except Boston), towns, regional school districts, charter schools, educational collaboratives and Quincy College. The MTRS is part of the Commonwealth’s reporting entity and the audited financial report may be obtained by visiting http://www.mass.gov/osc/publications-and-reports/financial-reports/. Special Funding Situation The Commonwealth is a nonemployer contributor and is required by statute to make 100% of all actuarially determined employer contributions on behalf of the City to the MTRS. Therefore, the City is considered to be in a special funding situation as defined by GASB Statement No. 68, Accounting and Financial Reporting for Pensions and the Commonwealth is a nonemployer contributor in MTRS. Since the City does not contribute directly to MTRS, there is no net pension liability to recognize. The total of the Commonwealth provided contributions have been allocated based on each employer’s covered payroll to the total covered payroll of employers in MTRS as of the measurement date of June 30, 2018. The City’s portion of the collective pension expense, contributed by the Commonwealth, of $10,768,620 is reported in the general fund as intergovernmental revenue and pension benefits in the current fiscal year. The portion of the Commonwealth’s collective net pension liability associated with the City is $106,266,978 as of the measurement date. Benefits Provided Both Systems provide retirement, disability, survivor and death benefits to plan members and beneficiaries. Massachusetts Contributory Retirement System benefits are, with certain minor exceptions, uniform from system to system. The Systems provide retirement allowance benefits up to a maximum of 80% of a member's highest three-year average annual rate of regular compensation. For persons who became members on or after April 2, 2012, average salary is the average annual rate of regular compensation received during the five consecutive years that produce the highest average, or, if greater, during the last five years (whether or not consecutive) preceding retirement. Benefit payments are based upon a member's age, length of creditable service, level of compensation, and group classification. Members become vested after ten years of creditable service. There were no changes in benefit terms that affected the measurement of the total pension liability at December 31, 2018. Employees who resign from service and who are not eligible to receive a retirement allowance or are under the age of 55 are entitled to request a refund of their accumulated total deductions. Survivor benefits are extended to eligible beneficiaries of members whose death occurs prior to or following retirement. Cost-of-living adjustments granted between 1981 and 1997 and any increase in other benefits imposed by the Commonwealth’s state law during those years are borne by the Commonwealth and are deposited into the
Notes to Basic Financial Statements Year Ended June 30, 2019
City of Beverly, Massachusetts 76 Comprehensive Annual Financial Report
pension fund. Cost-of-living adjustments granted after 1997 must be approved by the Board and are borne by the System. At December 31, 2018, the System’s membership consists of the following:
Active members…………………………………………………… 603 Inactive members………………………………………………… 187 Retirees and beneficiaries currently receiving benefits….…… 453
Total………………………………………………………………… 1,243
Contributions Chapter 32 of the MGL governs the contributions of plan members and member units. Active plan members are required to contribute at rates ranging from 5% to 9% of gross regular compensation with an additional 2% contribution required for compensation exceeding $30,000. The percentage rate is keyed to the date upon which an employee's membership commences. The member units are required to pay into the BCRS a legislatively mandated actuarially determined contribution that is apportioned among the employers based on active current payroll. The total member units’ contribution for the year ended December 31, 2018 was $10,967,000, 37.11% of covered payroll, actuarially determined as an amount that, when combined with plan member contributions, is expected to finance the costs of benefits earned by plan members during the year, with an additional amount to finance any unfunded accrued liability. The City’s proportionate share of the required contribution was $10,548,000, which equaled its actual contribution. Pension Liabilities The components of the net pension liability of the participating member units at December 31, 2018, were as follows:
Total pension liability………………………………………$ 221,828,000
Total pension plan's fiduciary net position……………… (126,887,000)
Total net pension liability…………………………………$ 94,941,000
The pension plan's fiduciary net position as
a percentage of the total pension liability…………… 57.20%
At June 30, 2019, the City reported a liability of $91,344,000 for its proportionate share of the net pension liability. The net pension liability was measured as of December 31, 2018, and the total pension liability used to calculate the net pension liability was determined by an actuarial valuation as of January 1, 2018. Accordingly, update procedures were used to roll forward the total pension liability to the measurement date. The City’s proportion of the net pension liability was based on a projection of the City’s long-term share of contributions to the pension plan relative to the projected contributions of all participating members. At December 31, 2018, the City’s proportion was 96.21%, which was an increase of .07% from its proportion measured at December 31, 2017. Pension Expense For the year ended June 30, 2019, the City recognized pension expense of $12,367,000. At June 30, 2019, the City reported deferred outflows and inflows of resources related to pensions of $11,494,000 and $70,000, respectively.
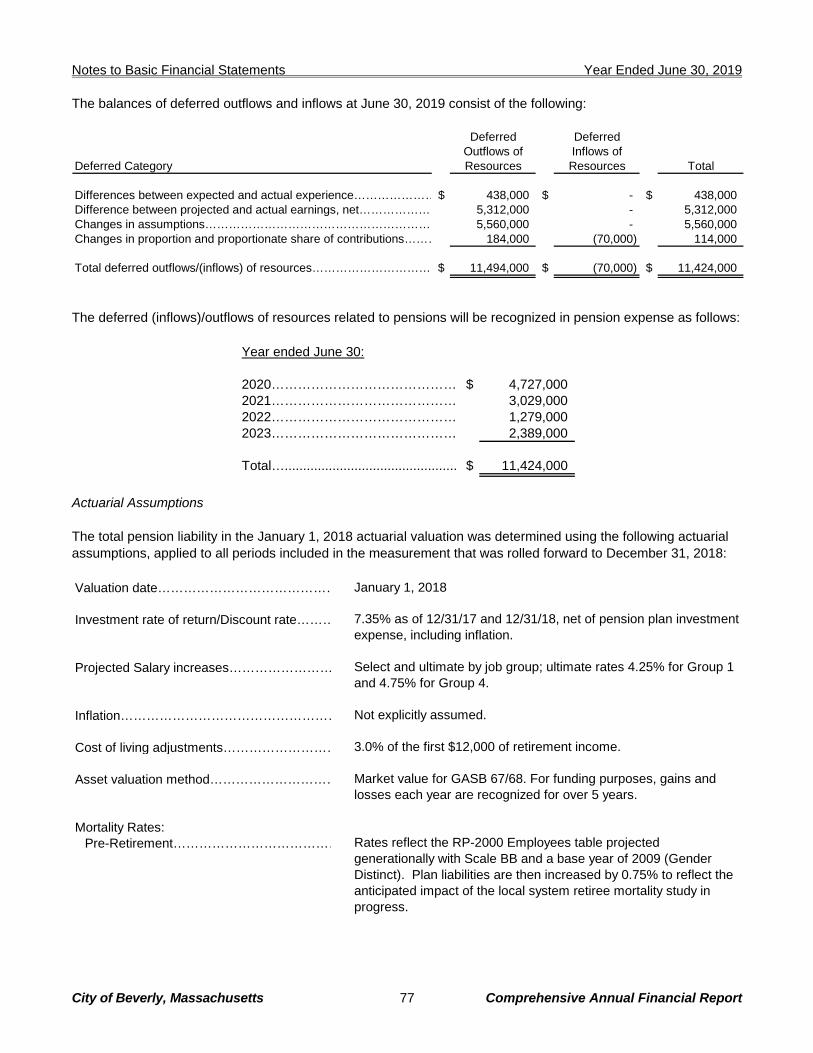
Notes to Basic Financial Statements Year Ended June 30, 2019
City of Beverly, Massachusetts 77 Comprehensive Annual Financial Report
The balances of deferred outflows and inflows at June 30, 2019 consist of the following:
Deferred DeferredOutflows of Inflows of
Deferred Category Resources Resources Total
Differences between expected and actual experience…………………$ 438,000 $ - $ 438,000 Difference between projected and actual earnings, net……………… 5,312,000 - 5,312,000 Changes in assumptions………………………………………………… 5,560,000 - 5,560,000 Changes in proportion and proportionate share of contributions……… 184,000 (70,000) 114,000
Total deferred outflows/(inflows) of resources………………………… $ 11,494,000 $ (70,000) $ 11,424,000
The deferred (inflows)/outflows of resources related to pensions will be recognized in pension expense as follows:
Year ended June 30:
2020………………………………………$ 4,727,000 2021……………………………………… 3,029,000 2022……………………………………… 1,279,000 2023……………………………………… 2,389,000
Total…............................................... $ 11,424,000
Actuarial Assumptions The total pension liability in the January 1, 2018 actuarial valuation was determined using the following actuarial assumptions, applied to all periods included in the measurement that was rolled forward to December 31, 2018: Valuation date…………………………………… January 1, 2018
Investment rate of return/Discount rate………
7.35% as of 12/31/17 and 12/31/18, net of pension plan investment expense, including inflation.
Projected Salary increases……………………
Select and ultimate by job group; ultimate rates 4.25% for Group 1 and 4.75% for Group 4.
Inflation…………………………………………… Not explicitly assumed.
Cost of living adjustments……………………… 3.0% of the first $12,000 of retirement income.
Asset valuation method…………………………
Market value for GASB 67/68. For funding purposes, gains and losses each year are recognized for over 5 years.
Mortality Rates:
Pre-Retirement…………………………………
Rates reflect the RP-2000 Employees table projected generationally with Scale BB and a base year of 2009 (Gender Distinct). Plan liabilities are then increased by 0.75% to reflect the anticipated impact of the local system retiree mortality study in progress.
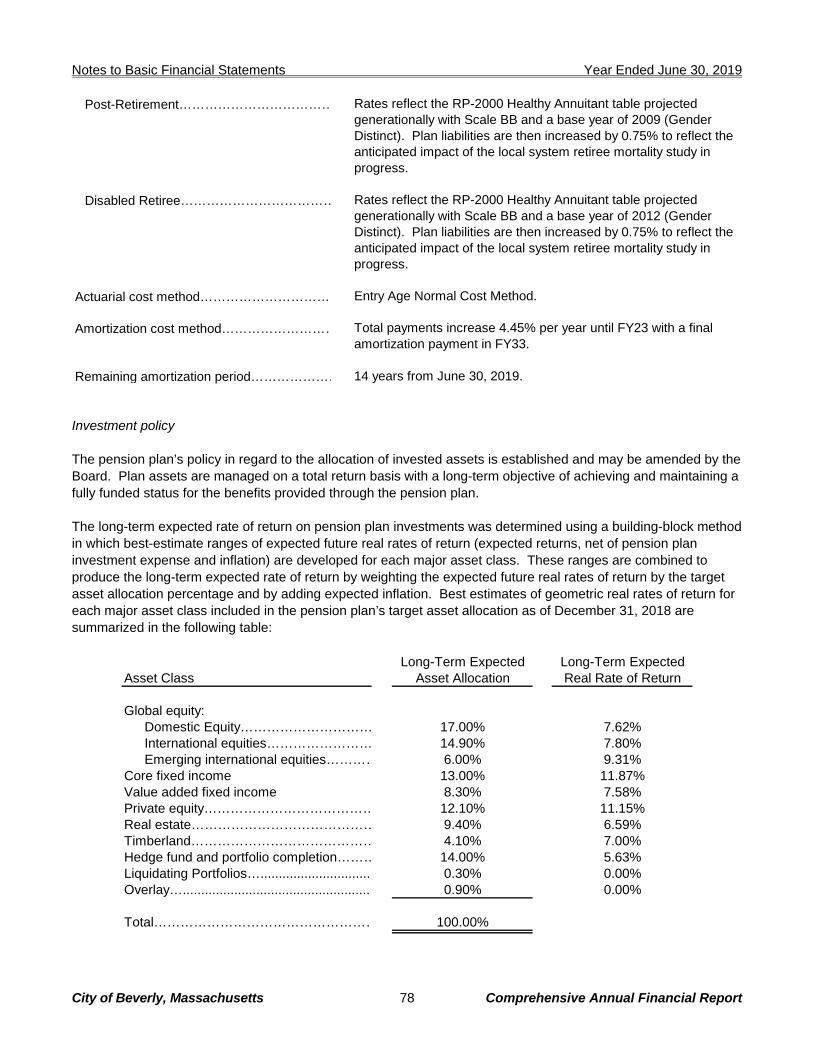
Notes to Basic Financial Statements Year Ended June 30, 2019
City of Beverly, Massachusetts 78 Comprehensive Annual Financial Report
Post-Retirement………………………………
Rates reflect the RP-2000 Healthy Annuitant table projected generationally with Scale BB and a base year of 2009 (Gender Distinct). Plan liabilities are then increased by 0.75% to reflect the anticipated impact of the local system retiree mortality study in progress.
Disabled Retiree………………………………
Rates reflect the RP-2000 Healthy Annuitant table projected generationally with Scale BB and a base year of 2012 (Gender Distinct). Plan liabilities are then increased by 0.75% to reflect the anticipated impact of the local system retiree mortality study in progress.
Actuarial cost method………………………… Entry Age Normal Cost Method.
Amortization cost method………………………
Total payments increase 4.45% per year until FY23 with a final amortization payment in FY33.
Remaining amortization period………………… 14 years from June 30, 2019.
Investment policy The pension plan’s policy in regard to the allocation of invested assets is established and may be amended by the Board. Plan assets are managed on a total return basis with a long-term objective of achieving and maintaining a fully funded status for the benefits provided through the pension plan. The long-term expected rate of return on pension plan investments was determined using a building-block method in which best-estimate ranges of expected future real rates of return (expected returns, net of pension plan investment expense and inflation) are developed for each major asset class. These ranges are combined to produce the long-term expected rate of return by weighting the expected future real rates of return by the target asset allocation percentage and by adding expected inflation. Best estimates of geometric real rates of return for each major asset class included in the pension plan’s target asset allocation as of December 31, 2018 are summarized in the following table:
Long-Term Expected Long-Term ExpectedAsset Class Asset Allocation Real Rate of Return
Global equity:Domestic Equity………………………… 17.00% 7.62%International equities…………………… 14.90% 7.80%Emerging international equities………… 6.00% 9.31%
Core fixed income 13.00% 11.87%Value added fixed income 8.30% 7.58%Private equity………………………………… 12.10% 11.15%Real estate…………………………………… 9.40% 6.59%Timberland…………………………………… 4.10% 7.00%Hedge fund and portfolio completion……… 14.00% 5.63%Liquidating Portfolios….............................. 0.30% 0.00%Overlay…................................................... 0.90% 0.00%
Total…………………………………………… 100.00%
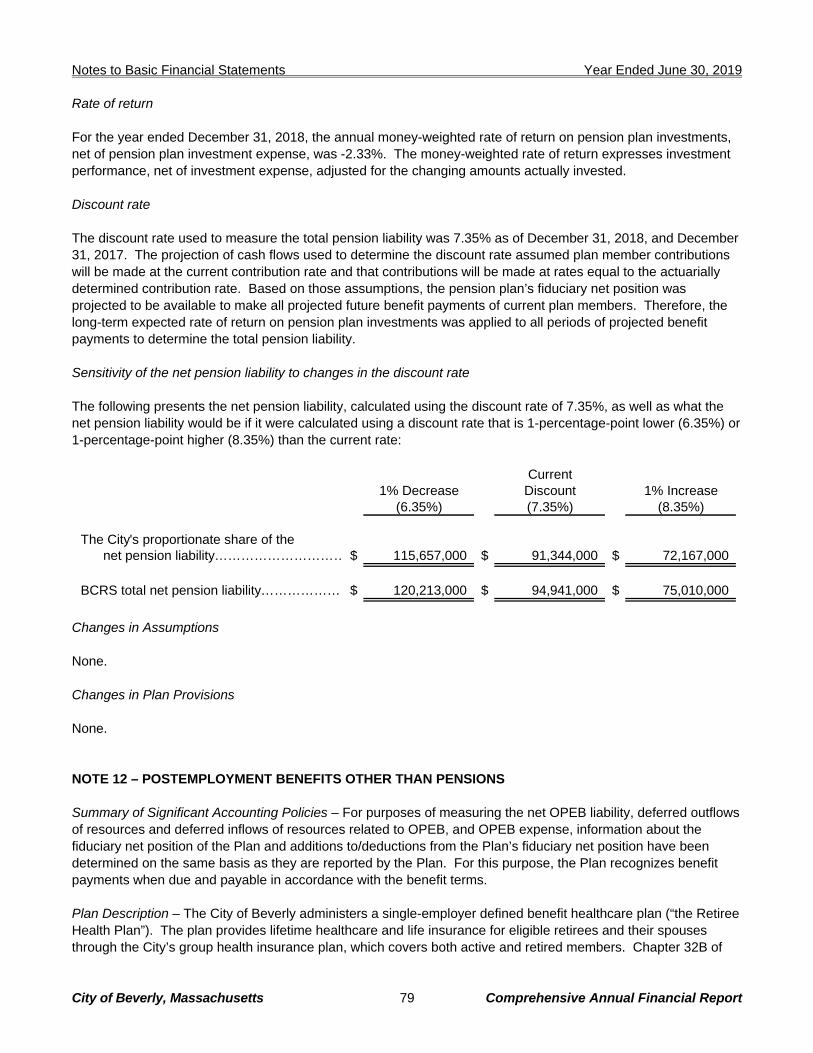
Notes to Basic Financial Statements Year Ended June 30, 2019
City of Beverly, Massachusetts 79 Comprehensive Annual Financial Report
Rate of return For the year ended December 31, 2018, the annual money-weighted rate of return on pension plan investments, net of pension plan investment expense, was -2.33%. The money-weighted rate of return expresses investment performance, net of investment expense, adjusted for the changing amounts actually invested. Discount rate The discount rate used to measure the total pension liability was 7.35% as of December 31, 2018, and December 31, 2017. The projection of cash flows used to determine the discount rate assumed plan member contributions will be made at the current contribution rate and that contributions will be made at rates equal to the actuarially determined contribution rate. Based on those assumptions, the pension plan’s fiduciary net position was projected to be available to make all projected future benefit payments of current plan members. Therefore, the long-term expected rate of return on pension plan investments was applied to all periods of projected benefit payments to determine the total pension liability. Sensitivity of the net pension liability to changes in the discount rate The following presents the net pension liability, calculated using the discount rate of 7.35%, as well as what the net pension liability would be if it were calculated using a discount rate that is 1-percentage-point lower (6.35%) or 1-percentage-point higher (8.35%) than the current rate:
Current1% Decrease Discount 1% Increase
(6.35%) (7.35%) (8.35%)
The City's proportionate share of thenet pension liability………………………… $ 115,657,000 $ 91,344,000 $ 72,167,000
BCRS total net pension liability…………………$ 120,213,000 $ 94,941,000 $ 75,010,000
Changes in Assumptions None. Changes in Plan Provisions None.
NOTE 12 – POSTEMPLOYMENT BENEFITS OTHER THAN PENSIONS Summary of Significant Accounting Policies – For purposes of measuring the net OPEB liability, deferred outflows of resources and deferred inflows of resources related to OPEB, and OPEB expense, information about the fiduciary net position of the Plan and additions to/deductions from the Plan’s fiduciary net position have been determined on the same basis as they are reported by the Plan. For this purpose, the Plan recognizes benefit payments when due and payable in accordance with the benefit terms. Plan Description – The City of Beverly administers a single-employer defined benefit healthcare plan (“the Retiree Health Plan”). The plan provides lifetime healthcare and life insurance for eligible retirees and their spouses through the City’s group health insurance plan, which covers both active and retired members. Chapter 32B of
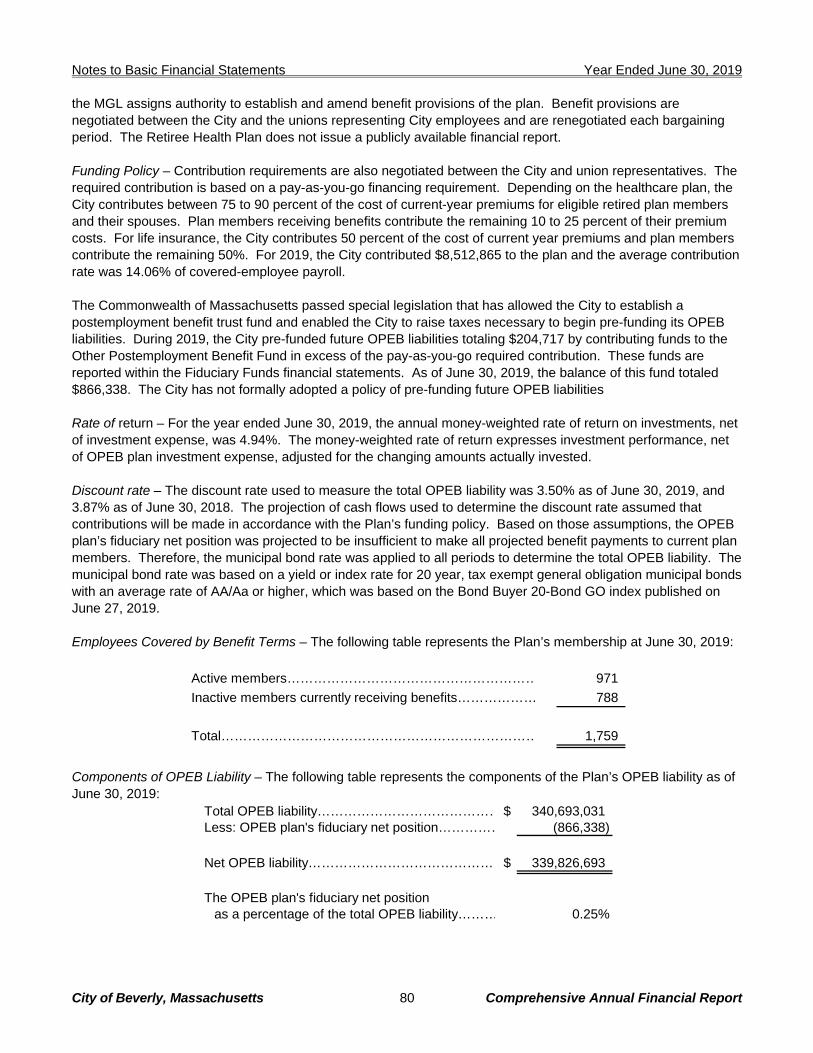
Notes to Basic Financial Statements Year Ended June 30, 2019
City of Beverly, Massachusetts 80 Comprehensive Annual Financial Report
the MGL assigns authority to establish and amend benefit provisions of the plan. Benefit provisions are negotiated between the City and the unions representing City employees and are renegotiated each bargaining period. The Retiree Health Plan does not issue a publicly available financial report. Funding Policy – Contribution requirements are also negotiated between the City and union representatives. The required contribution is based on a pay-as-you-go financing requirement. Depending on the healthcare plan, the City contributes between 75 to 90 percent of the cost of current-year premiums for eligible retired plan members and their spouses. Plan members receiving benefits contribute the remaining 10 to 25 percent of their premium costs. For life insurance, the City contributes 50 percent of the cost of current year premiums and plan members contribute the remaining 50%. For 2019, the City contributed $8,512,865 to the plan and the average contribution rate was 14.06% of covered-employee payroll. The Commonwealth of Massachusetts passed special legislation that has allowed the City to establish a postemployment benefit trust fund and enabled the City to raise taxes necessary to begin pre-funding its OPEB liabilities. During 2019, the City pre-funded future OPEB liabilities totaling $204,717 by contributing funds to the Other Postemployment Benefit Fund in excess of the pay-as-you-go required contribution. These funds are reported within the Fiduciary Funds financial statements. As of June 30, 2019, the balance of this fund totaled $866,338. The City has not formally adopted a policy of pre-funding future OPEB liabilities Rate of return – For the year ended June 30, 2019, the annual money-weighted rate of return on investments, net of investment expense, was 4.94%. The money-weighted rate of return expresses investment performance, net of OPEB plan investment expense, adjusted for the changing amounts actually invested. Discount rate – The discount rate used to measure the total OPEB liability was 3.50% as of June 30, 2019, and 3.87% as of June 30, 2018. The projection of cash flows used to determine the discount rate assumed that contributions will be made in accordance with the Plan’s funding policy. Based on those assumptions, the OPEB plan’s fiduciary net position was projected to be insufficient to make all projected benefit payments to current plan members. Therefore, the municipal bond rate was applied to all periods to determine the total OPEB liability. The municipal bond rate was based on a yield or index rate for 20 year, tax exempt general obligation municipal bonds with an average rate of AA/Aa or higher, which was based on the Bond Buyer 20-Bond GO index published on June 27, 2019. Employees Covered by Benefit Terms – The following table represents the Plan’s membership at June 30, 2019:
Active members………………………………………………… 971
Inactive members currently receiving benefits……………… 788
Total……………………………………………………………… 1,759
Components of OPEB Liability – The following table represents the components of the Plan’s OPEB liability as of June 30, 2019:
Total OPEB liability……………………………………$ 340,693,031 Less: OPEB plan's fiduciary net position…………… (866,338)
Net OPEB liability………………………………………$ 339,826,693
The OPEB plan's fiduciary net positionas a percentage of the total OPEB liability……… 0.25%
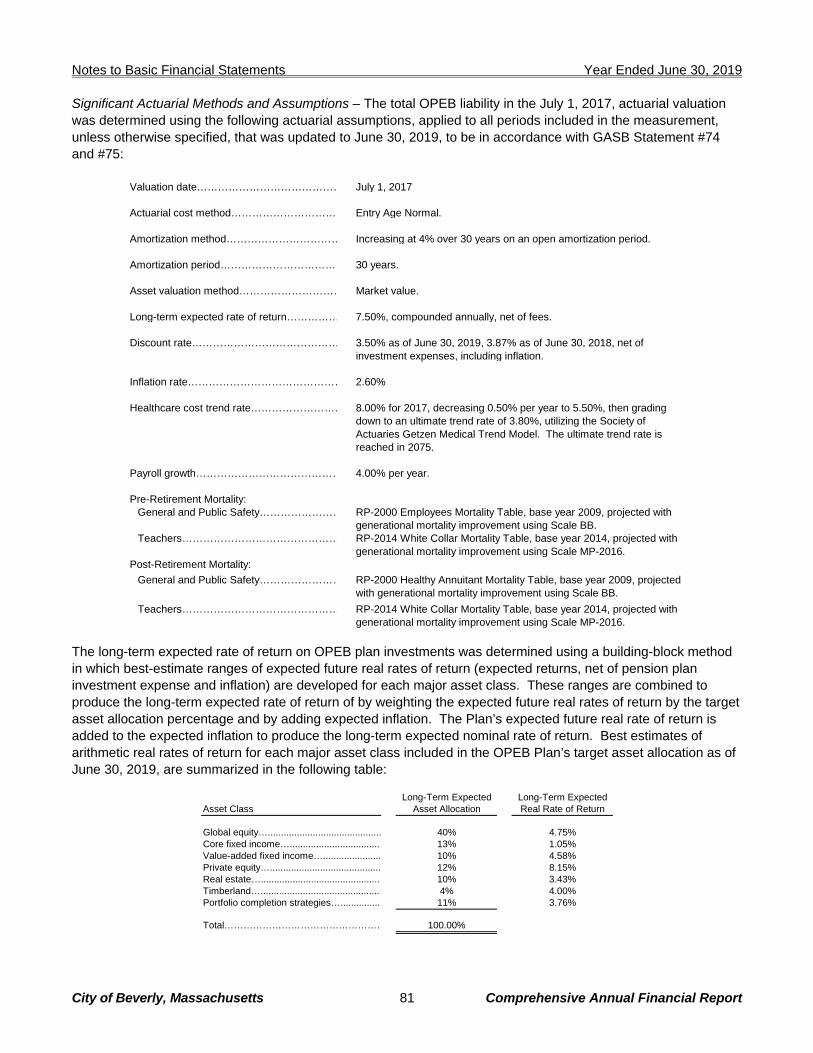
Notes to Basic Financial Statements Year Ended June 30, 2019
City of Beverly, Massachusetts 81 Comprehensive Annual Financial Report
Significant Actuarial Methods and Assumptions – The total OPEB liability in the July 1, 2017, actuarial valuation was determined using the following actuarial assumptions, applied to all periods included in the measurement, unless otherwise specified, that was updated to June 30, 2019, to be in accordance with GASB Statement #74 and #75:
Valuation date…………………………………… July 1, 2017
Actuarial cost method………………………… Entry Age Normal.
Amortization method…………………………… Increasing at 4% over 30 years on an open amortization period.
Amortization period……………………………… 30 years.
Asset valuation method………………………… Market value.
Long-term expected rate of return…………… 7.50%, compounded annually, net of fees.
Discount rate…………………………………… 3.50% as of June 30, 2019, 3.87% as of June 30, 2018, net of investment expenses, including inflation.
Inflation rate……………………………………… 2.60%
Healthcare cost trend rate……………………… 8.00% for 2017, decreasing 0.50% per year to 5.50%, then grading
down to an ultimate trend rate of 3.80%, utilizing the Society of Actuaries Getzen Medical Trend Model. The ultimate trend rate is reached in 2075.
Payroll growth…………………………………… 4.00% per year.
Pre-Retirement Mortality:
General and Public Safety…………………… RP-2000 Employees Mortality Table, base year 2009, projected with generational mortality improvement using Scale BB.
Teachers……………………………………… RP-2014 White Collar Mortality Table, base year 2014, projected with generational mortality improvement using Scale MP-2016.
Post-Retirement Mortality:
General and Public Safety…………………… RP-2000 Healthy Annuitant Mortality Table, base year 2009, projected with generational mortality improvement using Scale BB.
Teachers……………………………………… RP-2014 White Collar Mortality Table, base year 2014, projected with generational mortality improvement using Scale MP-2016.
The long-term expected rate of return on OPEB plan investments was determined using a building-block method in which best-estimate ranges of expected future real rates of return (expected returns, net of pension plan investment expense and inflation) are developed for each major asset class. These ranges are combined to produce the long-term expected rate of return of by weighting the expected future real rates of return by the target asset allocation percentage and by adding expected inflation. The Plan’s expected future real rate of return is added to the expected inflation to produce the long-term expected nominal rate of return. Best estimates of arithmetic real rates of return for each major asset class included in the OPEB Plan’s target asset allocation as of June 30, 2019, are summarized in the following table:
Long-Term Expected Long-Term ExpectedAsset Class Asset Allocation Real Rate of Return
Global equity…........................................... 40% 4.75%Core fixed income…................................... 13% 1.05%Value-added fixed income…...................... 10% 4.58%Private equity….......................................... 12% 8.15%Real estate….............................................. 10% 3.43%Timberland….............................................. 4% 4.00%Portfolio completion strategies…............... 11% 3.76%
Total…………………………………………… 100.00%
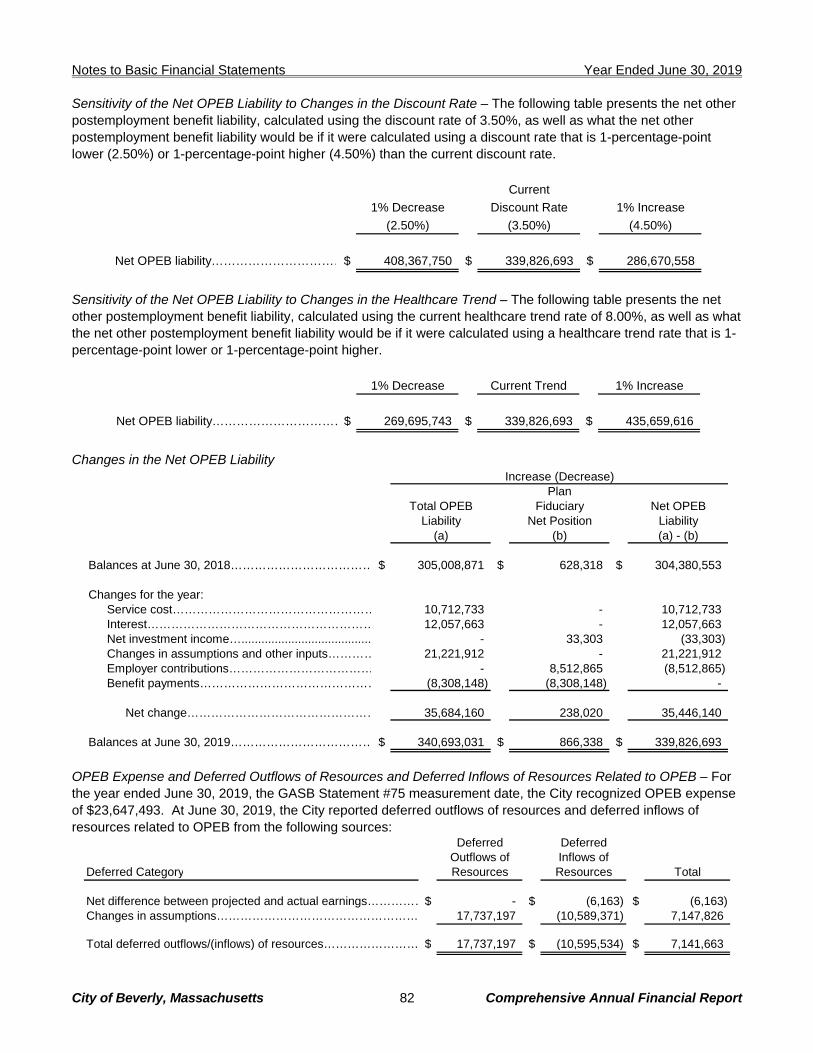
Notes to Basic Financial Statements Year Ended June 30, 2019
City of Beverly, Massachusetts 82 Comprehensive Annual Financial Report
Sensitivity of the Net OPEB Liability to Changes in the Discount Rate – The following table presents the net other postemployment benefit liability, calculated using the discount rate of 3.50%, as well as what the net other postemployment benefit liability would be if it were calculated using a discount rate that is 1-percentage-point lower (2.50%) or 1-percentage-point higher (4.50%) than the current discount rate.
Current
1% Decrease Discount Rate 1% Increase
(2.50%) (3.50%) (4.50%)
Net OPEB liability……………………………$ 408,367,750 $ 339,826,693 $ 286,670,558
Sensitivity of the Net OPEB Liability to Changes in the Healthcare Trend – The following table presents the net other postemployment benefit liability, calculated using the current healthcare trend rate of 8.00%, as well as what the net other postemployment benefit liability would be if it were calculated using a healthcare trend rate that is 1-percentage-point lower or 1-percentage-point higher.
1% Decrease Current Trend 1% Increase
Net OPEB liability……………………………$ 269,695,743 $ 339,826,693 $ 435,659,616
Changes in the Net OPEB Liability
PlanTotal OPEB Fiduciary Net OPEB
Liability Net Position Liability(a) (b) (a) - (b)
Balances at June 30, 2018……………………………… $ 305,008,871 $ 628,318 $ 304,380,553
Changes for the year: Service cost…………………………………………… 10,712,733 - 10,712,733 Interest………………………………………………… 12,057,663 - 12,057,663 Net investment income…....................................... - 33,303 (33,303) Changes in assumptions and other inputs………… 21,221,912 - 21,221,912 Employer contributions……………………………… - 8,512,865 (8,512,865) Benefit payments……………………………………… (8,308,148) (8,308,148) -
Net change………………………………………… 35,684,160 238,020 35,446,140
Balances at June 30, 2019……………………………… $ 340,693,031 $ 866,338 $ 339,826,693
Increase (Decrease)
OPEB Expense and Deferred Outflows of Resources and Deferred Inflows of Resources Related to OPEB – For the year ended June 30, 2019, the GASB Statement #75 measurement date, the City recognized OPEB expense of $23,647,493. At June 30, 2019, the City reported deferred outflows of resources and deferred inflows of resources related to OPEB from the following sources:
Deferred DeferredOutflows of Inflows of
Deferred Category Resources Resources Total
Net difference between projected and actual earnings……………$ - $ (6,163) $ (6,163) Changes in assumptions…………………………………………… 17,737,197 (10,589,371) 7,147,826
Total deferred outflows/(inflows) of resources…………………… $ 17,737,197 $ (10,595,534) $ 7,141,663
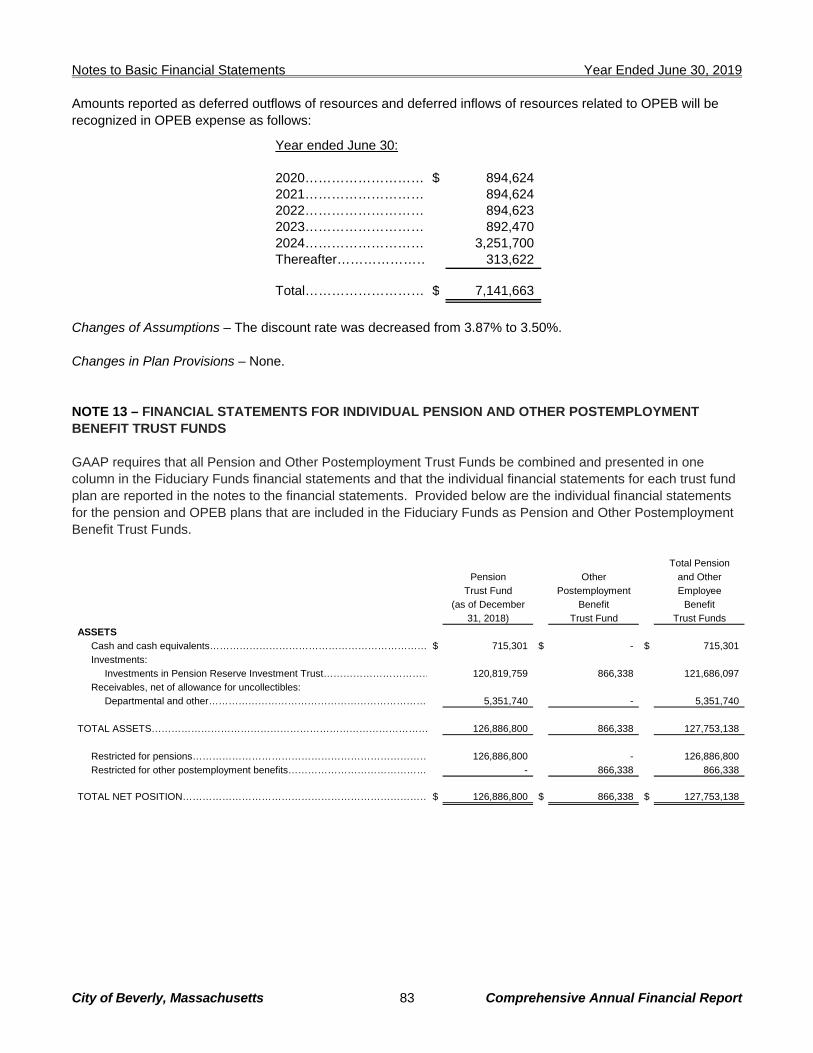
Notes to Basic Financial Statements Year Ended June 30, 2019
City of Beverly, Massachusetts 83 Comprehensive Annual Financial Report
Amounts reported as deferred outflows of resources and deferred inflows of resources related to OPEB will be recognized in OPEB expense as follows:
Year ended June 30:
2020……………………… $ 894,624 2021……………………… 894,624 2022……………………… 894,623 2023……………………… 892,470 2024……………………… 3,251,700 Thereafter………………… 313,622
Total……………………… $ 7,141,663
Changes of Assumptions – The discount rate was decreased from 3.87% to 3.50%. Changes in Plan Provisions – None. NOTE 13 – FINANCIAL STATEMENTS FOR INDIVIDUAL PENSION AND OTHER POSTEMPLOYMENT BENEFIT TRUST FUNDS GAAP requires that all Pension and Other Postemployment Trust Funds be combined and presented in one column in the Fiduciary Funds financial statements and that the individual financial statements for each trust fund plan are reported in the notes to the financial statements. Provided below are the individual financial statements for the pension and OPEB plans that are included in the Fiduciary Funds as Pension and Other Postemployment Benefit Trust Funds.
Total Pension
Pension Other and Other
Trust Fund Postemployment Employee(as of December Benefit Benefit
31, 2018) Trust Fund Trust Funds
ASSETS
Cash and cash equivalents………………………………………………………… $ 715,301 $ - $ 715,301
Investments:
Investments in Pension Reserve Investment Trust…………………………… 120,819,759 866,338 121,686,097
Receivables, net of allowance for uncollectibles: Departmental and other………………………………………………………… 5,351,740 - 5,351,740
TOTAL ASSETS………………………………………………………………………… 126,886,800 866,338 127,753,138
Restricted for pensions……………………………………………………………… 126,886,800 - 126,886,800
Restricted for other postemployment benefits…………………………………… - 866,338 866,338
TOTAL NET POSITION………………………………………………………………… $ 126,886,800 $ 866,338 $ 127,753,138
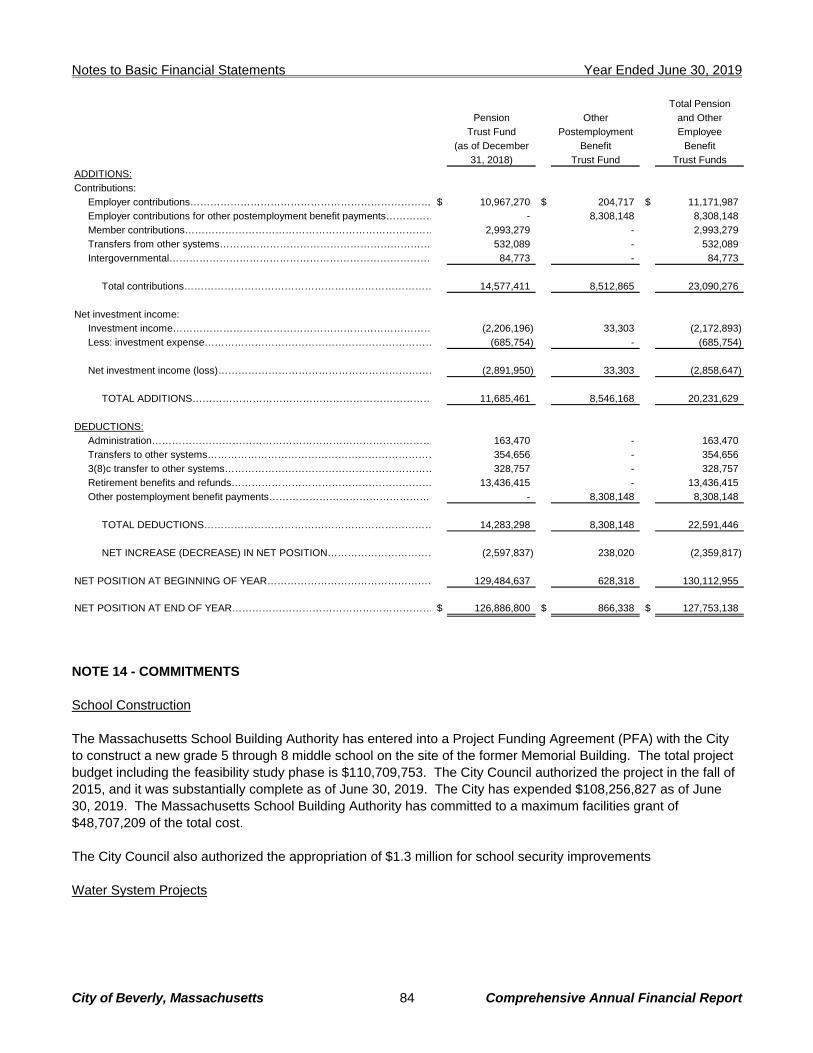
Notes to Basic Financial Statements Year Ended June 30, 2019
City of Beverly, Massachusetts 84 Comprehensive Annual Financial Report
Total Pension
Pension Other and Other
Trust Fund Postemployment Employee
(as of December Benefit Benefit
31, 2018) Trust Fund Trust Funds
ADDITIONS:
Contributions:
Employer contributions……………………………………………………………… $ 10,967,270 $ 204,717 $ 11,171,987 Employer contributions for other postemployment benefit payments…………… - 8,308,148 8,308,148
Member contributions………………………………………………………………… 2,993,279 - 2,993,279
Transfers from other systems……………………………………………………… 532,089 - 532,089
Intergovernmental…………………………………………………………………… 84,773 - 84,773
Total contributions………………………………………………………………… 14,577,411 8,512,865 23,090,276
Net investment income:Investment income…………………………………………………………………… (2,206,196) 33,303 (2,172,893)
Less: investment expense…………………………………………………………… (685,754) - (685,754)
Net investment income (loss)………………………………………………………… (2,891,950) 33,303 (2,858,647)
TOTAL ADDITIONS……………………………………………………………… 11,685,461 8,546,168 20,231,629
DEDUCTIONS:Administration………………………………………………………………………… 163,470 - 163,470
Transfers to other systems…………………………………………………………… 354,656 - 354,656
3(8)c transfer to other systems……………………………………………………… 328,757 - 328,757
Retirement benefits and refunds…………………………………………………… 13,436,415 - 13,436,415
Other postemployment benefit payments…………………………………………… - 8,308,148 8,308,148
TOTAL DEDUCTIONS…………………………………………………………… 14,283,298 8,308,148 22,591,446
NET INCREASE (DECREASE) IN NET POSITION…………………………… (2,597,837) 238,020 (2,359,817)
NET POSITION AT BEGINNING OF YEAR…………………………………………… 129,484,637 628,318 130,112,955
NET POSITION AT END OF YEAR…………………………………………………… $ 126,886,800 $ 866,338 $ 127,753,138
NOTE 14 - COMMITMENTS School Construction The Massachusetts School Building Authority has entered into a Project Funding Agreement (PFA) with the City to construct a new grade 5 through 8 middle school on the site of the former Memorial Building. The total project budget including the feasibility study phase is $110,709,753. The City Council authorized the project in the fall of 2015, and it was substantially complete as of June 30, 2019. The City has expended $108,256,827 as of June 30, 2019. The Massachusetts School Building Authority has committed to a maximum facilities grant of $48,707,209 of the total cost. The City Council also authorized the appropriation of $1.3 million for school security improvements Water System Projects
Notes to Basic Financial Statements Year Ended June 30, 2019
City of Beverly, Massachusetts 85 Comprehensive Annual Financial Report
The City Council authorized the appropriation of two separate water infrastructure projects. The rehabilitation and repainting of the Brimbal Avenue Standpipe received an appropriation of $2.8 million. The repair work for the Pershing Avenue Pump Station received an $820,000 appropriation. Both projects began during fiscal 2019. NOTE 15 - CONTINGENCIES The City participates in a number of federal award programs. Although the grant programs have been audited in accordance with the provisions of Title 2 U.S. Code of Federal Regulations Part 200, Uniform Administrative Requirements, Cost Principles, and Audit Requirements for Federal Awards, these programs are still subject to financial and compliance audits. The amount, if any, of expenditures which may be disallowed by the granting agencies cannot be determined at this time, although it is expected such amounts, if any, to be immaterial. Various legal actions and claims are pending. Litigation is subject to many uncertainties, and the outcome of individual litigated matters is not always predictable. Although the amount of liability, if any, at June 30, 2019, cannot be ascertained, management believes any resulting liability should not materially affect the financial position at June 30, 2019. NOTE 16 – SUBSEQUENT EVENTS Management has evaluated subsequent events through December 24, 2019, which is the date the financial statements were available to be issued. NOTE 17 - IMPLEMENTATION OF NEW GASB PRONOUNCEMENTS During 2019, the following GASB pronouncements were implemented:
GASB Statement #83, Certain Asset Retirement Obligations. This pronouncement did not impact the basic financial statements.
GASB Statement #88, Certain Disclosures Related to Debt, including Direct Borrowings and Direct Placements. This pronouncement did not impact the basic financial statements.
The following GASB pronouncements will be implemented in the future:
The GASB issued Statement #84, Fiduciary Activities, which is required to be implemented in 2020.
The GASB issued Statement #87, Leases, which is required to be implemented in 2021.
The GASB issued Statement #89, Accounting for Interest Cost Incurred before the End of a Construction Period, which is required to be implemented in 2021.
The GASB issued Statement #90, Majority Equity Interests – an amendment of GASB Statements #14 and #61, which is required to be implemented in 2020.
The GASB issued Statement #91, Conduit Debt Obligations, which is required to be implemented in 2022.
Management is currently assessing the impact the implementation of these pronouncements will have on the basic financial statements.

City of Beverly, Massachusetts 86 Comprehensive Annual Financial Report
This page intentionally left blank.
City of Beverly, Massachusetts 87 Comprehensive Annual Financial Report
Required Supplementary Information Required Supplementary Information

City of Beverly, Massachusetts 88 Comprehensive Annual Financial Report
This page intentionally left blank.

City of Beverly, Massachusetts 89 Comprehensive Annual Financial Report
General Fund Budgetary Comparison Schedule
General Fund Budgetary Comparison Schedule
The General Fund is the general operating fund of the City. It is used to account for all of the City’s financial resources, except those required to be accounted for in another fund.
GENERAL FUND
SCHEDULE OF REVENUES, EXPENDITURES AND CHANGES IN FUND BALANCE -
BUDGET AND ACTUAL
YEAR ENDED JUNE 30, 2019
Actual Amounts Variance
Original Final Budgetary Carried Forward to Final
Budget Budget Amounts To Next Year Budget
REVENUES:
Real estate and personal property taxes,
net of tax refunds………………………………………$ 102,392,277 $ 102,867,275 $ 102,105,303 $ - $ (761,972)
Tax liens…………………………………………..………… - - 404,750 - 404,750
Motor vehicle and other excise taxes……………………… 5,627,000 5,627,000 6,038,965 - 411,965
Penalties and interest on taxes…………………………… 320,050 320,050 572,924 - 252,874
Payments in lieu of taxes…………………………………… 236,667 236,667 250,041 - 13,374
Intergovernmental………………………..………………… 16,287,324 16,447,675 16,507,953 - 60,278
Departmental and other…………………………………… 2,602,000 2,607,743 3,690,023 - 1,082,280
Investment income………………………………………… 75,000 75,000 342,188 - 267,188
TOTAL REVENUES……………………………… 127,540,318 128,181,410 129,912,147 - 1,730,737
EXPENDITURES:
Current:
General Government:
Clerk of committee…………………………………… 265,822 247,691 243,679 100 3,912
Clerk…………………………………………………… 203,470 224,165 208,311 - 15,854
Elections……………………………………………… 204,754 204,140 201,784 - 2,356
Executive……………………………………………… 606,963 626,412 608,207 5,420 12,785
Reserve for appropriation…………………………… 1,076,632 552,985 - 313,103 239,882
Licensing board……………………………………… 5,900 5,900 5,600 - 300
Accountant…………………………………………… 1,217,914 1,247,806 1,230,024 14,628 3,154
Information Systems………………………………… 613,740 646,499 611,574 14,536 20,389
Assessors……………………………………………… 332,655 333,892 334,520 - (628)
Treasurer/Collector…………………………………… 350,776 347,845 323,691 5,889 18,265
Procurement…………………………………………… 350,278 360,028 331,344 13,280 15,404
Solicitor………………………………………………… 593,807 601,138 520,718 73,594 6,826
Human resources…………………………………… 218,355 221,102 220,032 1,900 (830)
Conservation commission…………………………… 4,083 4,083 3,186 - 897
Planning……………………………………………… 682,334 707,893 672,031 15,020 20,842
Public property………………………………………… 241,000 484,617 358,081 108,466 18,070
Total General government……………………………… 6,968,483 6,816,196 5,872,782 565,936 377,478
Public safety:
Building commissioner……………………………… 534,245 535,806 540,464 339 (4,997)
Sealer………………………………………………… 16,749 16,749 15,906 - 843
City electrician………………………………………… 64,470 64,470 63,386 - 1,084
Animal control………………………………………… 128,053 128,053 103,253 - 24,800
Police…………………………………………………… 8,360,861 8,166,076 7,802,102 159,837 204,137
Fire……………………………………………………… 6,326,202 6,678,452 6,502,167 125,133 51,152
Emergency management…………………………… 72,549 72,970 72,967 - 3
Harbor master………………………………………… 214,917 215,913 213,473 27 2,413
Total Public safety……………………………………… 15,718,046 15,878,489 15,313,718 285,336 279,435
Education:
Beverly public schools……………………………… 58,111,202 58,275,170 57,916,785 358,301 84
North shore regional vocational school…………… 2,067,070 2,067,070 2,052,642 88 14,340
Total Education…………………………………………… 60,178,272 60,342,240 59,969,427 358,389 14,424
Public works:
Engineering…………………………………………… 805,912 769,130 665,841 70,526 32,763
Sanitation……………………………………………… 60,000 60,000 60,000 - -
Highway……………………………………………… 2,456,501 2,303,140 1,868,353 349,008 85,779
Snow and ice………………………………………… 800,214 800,214 763,180 2,500 34,534
Municipal garage……………………………………… 656,059 618,300 582,924 9,518 25,858
Cemetery……………………………………………… 247,700 248,116 239,111 5,692 3,313
Electric division……………………………………… 618,925 697,613 605,536 8,381 83,696
Parks and forestry…………………………………… 1,094,595 1,156,879 1,118,965 16,935 20,979
Total Public works……………………………………… 6,739,906 6,653,392 5,903,910 462,560 286,922
(Continued)
Budgeted Amounts
City of Beverly, Massachusetts 90 Comprehensive Annual Financial Report
GENERAL FUND
SCHEDULE OF REVENUES, EXPENDITURES AND CHANGES IN FUND BALANCE -
BUDGET AND ACTUAL
YEAR ENDED JUNE 30, 2019
Actual Amounts Variance
Original Final Budgetary Carried Forward to Final
Budget Budget Amounts To Next Year Budget
Budgeted Amounts
Human services:
Health………………………………………………… 474,020 475,337 461,292 1,113 12,932
Council on aging……………………………………… 621,234 628,607 594,044 641 33,922
Veterans services…………………………………… 668,119 668,119 587,594 - 80,525
Total human services…………………………………… 1,763,373 1,772,063 1,642,930 1,754 127,379
Culture and recreation:
Library………………………………………………… 2,046,253 2,106,498 1,920,582 8,808 177,108
Recreation…………………………………………… 478,094 432,684 373,850 2,425 56,409
Total culture and recreation……………………………… 2,524,347 2,539,182 2,294,432 11,233 233,517
Pension and OPEB contributions……………………… 10,606,687 10,752,836 10,752,836 - -
Employee benefits:
Workers compensation……………………………… 630,400 522,400 409,202 - 113,198
Unemployment………………………………………… 10,500 24,500 18,173 4,000 2,327
Health Insurance……………………………………… 10,511,743 10,505,743 10,057,066 725 447,952
Life insurance………………………………………… 65,000 65,000 58,725 - 6,275
Payroll tax……………………………………………… 370,000 370,000 363,586 - 6,414
Total employee benefits………………………………… 11,587,643 11,487,643 10,906,752 4,725 576,166
State and county charges…………………………………… 1,502,862 1,599,311 1,657,290 - (57,979)
Debt service:
Principal……………………………………………… 7,208,000 7,213,000 7,213,000 - -
Interest………………………………………………… 3,774,899 3,754,899 3,634,899 - 120,000
Total debt service…………………………………………… 10,982,899 10,967,899 10,847,899 - 120,000
TOTAL EXPENDITURES……………………… 128,572,518 128,809,251 125,161,976 1,689,933 1,957,342
EXCESS (DEFICIENCY) OF REVENUES
OVER (UNDER) EXPENDITURES………………………… (1,032,200) (627,841) 4,750,171 (1,689,933) 3,688,079
OTHER FINANCING SOURCES (USES):
Transfers in…………………………………………………… 2,316,289 2,457,476 2,457,476 - -
Transfers out………………………………………………… (2,638,750) (5,919,995) (5,919,995) - -
TOTAL OTHER FINANCING
SOURCES (USES)………………………… (322,461) (3,462,519) (3,462,519) - -
NET CHANGE IN FUND BALANCE…………………………… (1,354,661) (4,090,360) 1,287,652 (1,689,933) 3,688,079
BUDGETARY FUND BALANCE, Beginning of year………… 12,581,971 12,581,971 12,581,971 - -
BUDGETARY FUND BALANCE, End of year………………… $ 11,227,310 $ 8,491,611 $ 13,869,623 $ (1,689,933) $ 3,688,079
See notes to required supplementary information. (Concluded)
City of Beverly, Massachusetts 91 Comprehensive Annual Financial Report
City of Beverly, Massachusetts 92 Comprehensive Annual Financial Report
Pension Plan Schedules – Retirement System
Pension Plan Schedules – Retirement System The Pension Plan’s Schedule of Changes in the Net Pension Liability presents multi-year trend information on the net pension liability and related ratios. The Pension Plan’s Schedule of Contributions presents multi-year trend information on the required and actual contributions to the pension plan and related ratios. The Pension Plan’s Schedule of Investment Return presents multi-year trend information on the money-weighted investment return on retirement assets, net of investment expense. These schedules are intended to present information for ten years. Until a ten year trend is compiled, information is presented for those years for which information is available.
December 31, December 31, December 31, December 31, December 31,
2014 2015 2016 2017 2018
Total pension liability:
Service cost…………………………………………………… $ 3,757,000 $ 3,926,000 $ 4,360,000 $ 4,829,000 $ 4,797,000
Interest………………………………………………………… 13,580,000 13,989,000 13,988,000 15,104,000 15,340,000
Differences between expected and actual experience…… - - 264,000 610,000 -
Changes in assumptions……………………………………… - - 8,800,000 4,250,000 -
Benefit payments……………………………………………… (12,078,000) (12,380,000) (12,311,000) (13,000,000) (13,503,000)
Net change in total pension liability…………………………… 5,259,000 5,535,000 15,101,000 11,793,000 6,634,000
Total pension liability - beginning……………………………… 177,506,000 182,765,000 188,300,000 203,401,000 215,194,000
Total pension liability - ending (a)……………………………… $ 182,765,000 $ 188,300,000 $ 203,401,000 $ 215,194,000 $ 221,828,000
Plan fiduciary net position:
Employer contributions…………………………………………$ 9,214,000 $ 9,624,000 $ 10,062,000 $ 10,500,000 $ 10,967,000
Member contributions………………………………………… 2,395,000 2,596,000 2,634,000 2,900,000 2,993,000
Net investment income (loss)………………………………… 7,030,000 660,000 7,452,000 18,217,000 (2,892,000)
Administrative expenses……………………………………… (170,000) (170,000) (173,000) (172,000) (163,000)
Retirement benefits and refunds……………………………… (12,078,000) (12,380,000) (12,311,000) (13,000,000) (13,503,000)
Net increase (decrease) in fiduciary net position……………… 6,391,000 330,000 7,664,000 18,445,000 (2,598,000)
Fiduciary net position - beginning of year……………………… 96,655,000 103,046,000 103,376,000 111,040,000 129,485,000
Fiduciary net position - end of year (b)…………………………$ 103,046,000 $ 103,376,000 $ 111,040,000 $ 129,485,000 $ 126,887,000
Net pension liability - ending (a)-(b)………………………… $ 79,719,000 $ 84,924,000 $ 92,361,000 $ 85,709,000 $ 94,941,000
Plan fiduciary net position as a percentage of the
total pension liability…………………………………………… 56.38% 54.90% 54.59% 60.17% 57.20%
Covered payroll……………………………………………………$ 25,707,000 $ 25,707,000 $ 27,459,000 $ 29,551,000 $ 29,551,000
Net pension liability as a percentage of
covered payroll………………………………………………… 310.11% 330.35% 336.36% 290.04% 321.28%
Note: this schedule is intended to present information for 10 years.
Until a 10-year trend is compiled, information is presented for those years for which information is available.
See notes to required supplementary information.
SCHEDULE OF CHANGES IN THE NET PENSION LIABILITY
AND RELATED RATIOSBEVERLY CONTRIBUTORY RETIREMENT SYSTEM
City of Beverly, Massachusetts 93 Comprehensive Annual Financial Report
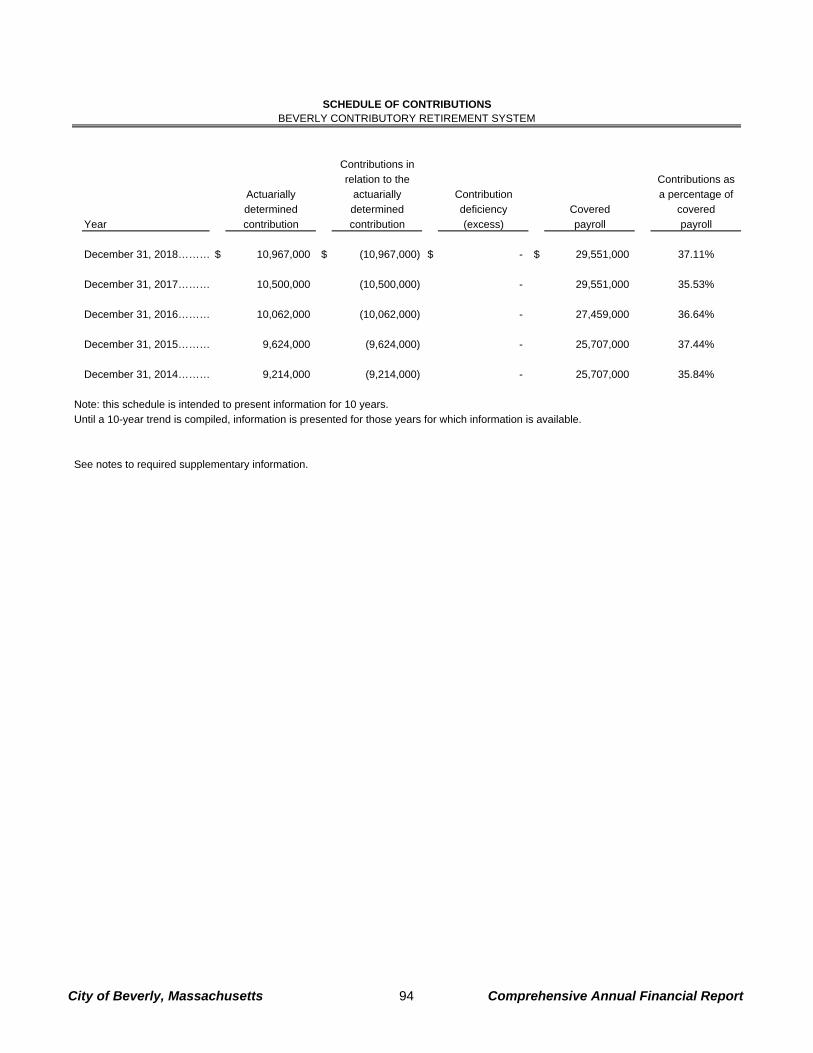
Contributions in
relation to the Contributions as
Actuarially actuarially Contribution a percentage of
determined determined deficiency Covered covered
Year contribution contribution (excess) payroll payroll
December 31, 2018……… $ 10,967,000 $ (10,967,000) $ - $ 29,551,000 37.11%
December 31, 2017……… 10,500,000 (10,500,000) - 29,551,000 35.53%
December 31, 2016……… 10,062,000 (10,062,000) - 27,459,000 36.64%
December 31, 2015……… 9,624,000 (9,624,000) - 25,707,000 37.44%
December 31, 2014……… 9,214,000 (9,214,000) - 25,707,000 35.84%
Note: this schedule is intended to present information for 10 years.
Until a 10-year trend is compiled, information is presented for those years for which information is available.
See notes to required supplementary information.
SCHEDULE OF CONTRIBUTIONSBEVERLY CONTRIBUTORY RETIREMENT SYSTEM
City of Beverly, Massachusetts 94 Comprehensive Annual Financial Report
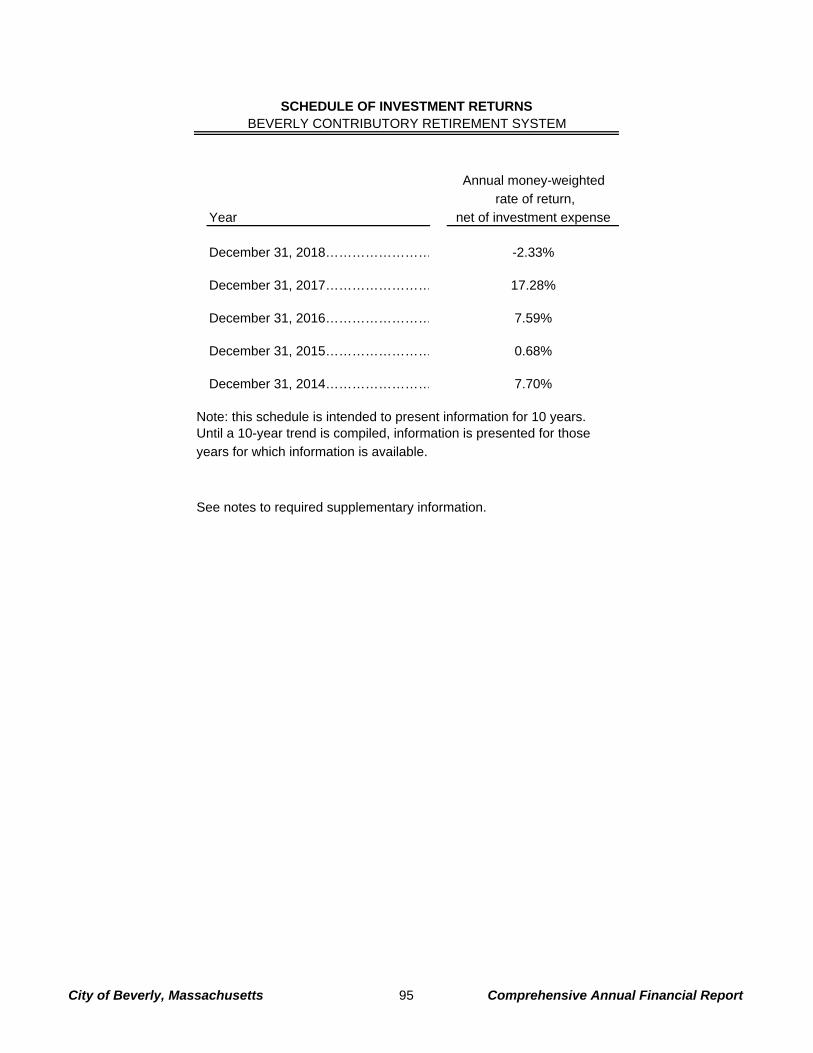
Annual money-weighted
rate of return,
Year net of investment expense
December 31, 2018…………………… -2.33%
December 31, 2017…………………… 17.28%
December 31, 2016…………………… 7.59%
December 31, 2015…………………… 0.68%
December 31, 2014…………………… 7.70%
Note: this schedule is intended to present information for 10 years.Until a 10-year trend is compiled, information is presented for those
years for which information is available.
See notes to required supplementary information.
SCHEDULE OF INVESTMENT RETURNSBEVERLY CONTRIBUTORY RETIREMENT SYSTEM
City of Beverly, Massachusetts 95 Comprehensive Annual Financial Report

City of Beverly, Massachusetts 96 Comprehensive Annual Financial Report
Pension Plan Schedules - City Pension Plan Schedules - City The Schedule of the City’s Proportionate Share of the Net Pension Liability presents multi-year trend information on the City’s net pension liability and related ratios. The Schedule of the City’s Contributions presents multi-year trend information on the City’s required and actual contributions to the pension plan and related ratios. The Schedule of the Special Funding Amounts of the Net Pension Liability for the Massachusetts Teachers’ Contributory Retirement System presents multi-year trend information on the liability and expense assumed by the Commonwealth of Massachusetts on behalf of the City along with related ratios. These schedules are intended to present information for ten years. Until a ten year trend is compiled, information is presented for those years for which information is available.
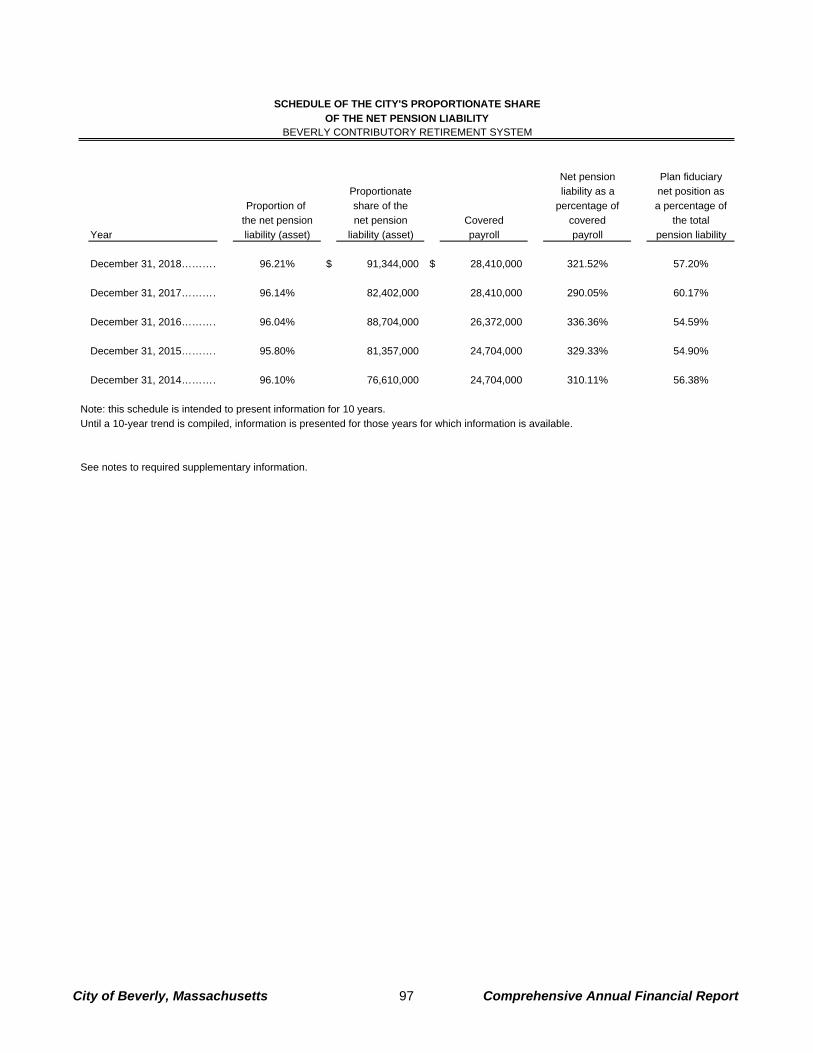
Net pension Plan fiduciary
Proportionate liability as a net position as
Proportion of share of the percentage of a percentage of
the net pension net pension Covered covered the total
Year liability (asset) liability (asset) payroll payroll pension liability
December 31, 2018………… 96.21% $ 91,344,000 $ 28,410,000 321.52% 57.20%
December 31, 2017………… 96.14% 82,402,000 28,410,000 290.05% 60.17%
December 31, 2016………… 96.04% 88,704,000 26,372,000 336.36% 54.59%
December 31, 2015………… 95.80% 81,357,000 24,704,000 329.33% 54.90%
December 31, 2014………… 96.10% 76,610,000 24,704,000 310.11% 56.38%
Note: this schedule is intended to present information for 10 years.
Until a 10-year trend is compiled, information is presented for those years for which information is available.
See notes to required supplementary information.
SCHEDULE OF THE CITY'S PROPORTIONATE SHARE
OF THE NET PENSION LIABILITYBEVERLY CONTRIBUTORY RETIREMENT SYSTEM
City of Beverly, Massachusetts 97 Comprehensive Annual Financial Report

Contributions in
relation to the Contributions as
Actuarially actuarially Contribution a percentage of
determined determined deficiency Covered covered
Year contribution contribution (excess) payroll payroll
June 30, 2019………………… $ 10,548,000 $ (10,548,000) $ - $ 28,978,200 36.40%
June 30, 2018………………… 10,091,000 (10,091,000) - 28,978,200 34.82%
June 30, 2017………………… 9,652,000 (9,652,000) - 26,899,440 35.88%
June 30, 2016………………… 9,218,000 (9,218,000) - 25,198,080 36.58%
June 30, 2015………………… 8,852,000 (8,852,000) - 25,198,080 35.13%
Note: this schedule is intended to present information for 10 years.
Until a 10-year trend is compiled, information is presented for those years for which information is available.
See notes to required supplementary information.
SCHEDULE OF THE CITY'S CONTRIBUTIONSBEVERLY CONTRIBUTORY RETIREMENT SYSTEM
City of Beverly, Massachusetts 98 Comprehensive Annual Financial Report

Year
Commonwealth's 100% Share of the
Associated Net Pension Liability
Expense and Revenue
Recognized for the Commonwealth's
Support
Plan Fiduciary Net Position as a
Percentage of the Total Liability
2019………………………… $ 106,266,978 $ 10,768,620 54.84%
2018………………………… 100,806,248 10,521,442 54.25%
2017………………………… 99,449,333 10,144,484 52.73%
2016………………………… 88,799,373 7,202,420 55.38%
2015………………………… 67,523,649 4,961,192 61.64%
Note: this schedule is intended to present information for 10 years.
Until a 10-year trend is compiled, information is presented for those years for which information is available.
See notes to required supplementary information.
SCHEDULE OF THE SPECIAL FUNDING AMOUNTS
OF THE NET PENSION LIABILITYMASSACHUSETTS TEACHERS' RETIREMENT SYSTEM
The Commonwealth of Massachusetts is a nonemployer contributor and is required by statute to make all actuarially determined employer contributions on behalf of the member employers which creates a special funding situation. Therefore, there is no net pension liability to recognize. This schedule discloses the Commonwealth's 100% share of the associated collective net pension liability; the portion of the collective pension expense as both a revenue and pension expense recognized; and the Plan's fiduciary net position as a percentage of the total liability.
City of Beverly, Massachusetts 99 Comprehensive Annual Financial Report
City of Beverly, Massachusetts 100 Comprehensive Annual Financial Report
Other Postemployment Benefit Plan Schedules
Other Postemployment Benefit Plan Schedules The Schedule of Changes in the City’s Net Other Postemployment Benefit Liability and Related Ratios presents multi-year trend information on changes in the Plan’s total OPEB liability, changes in the Plan’s net position, and ending net OPEB liability. It also demonstrates the Plan’s net position as a percentage of the total liability and the Plan’s net other postemployment benefit liability as a percentage of covered employee payroll. The Schedule of the City’s Contributions presents multi-year trend information on the City’s actual contributions to the other postemployment benefit plan and related ratios. The Schedule of Investment Return presents multi-year trend information on the money-weighted investment return on the Plan’s other postemployment assets, net of investment expense. These schedules are intended to present information for ten years. Until a ten year trend is compiled, information is presented for those years for which information is available.
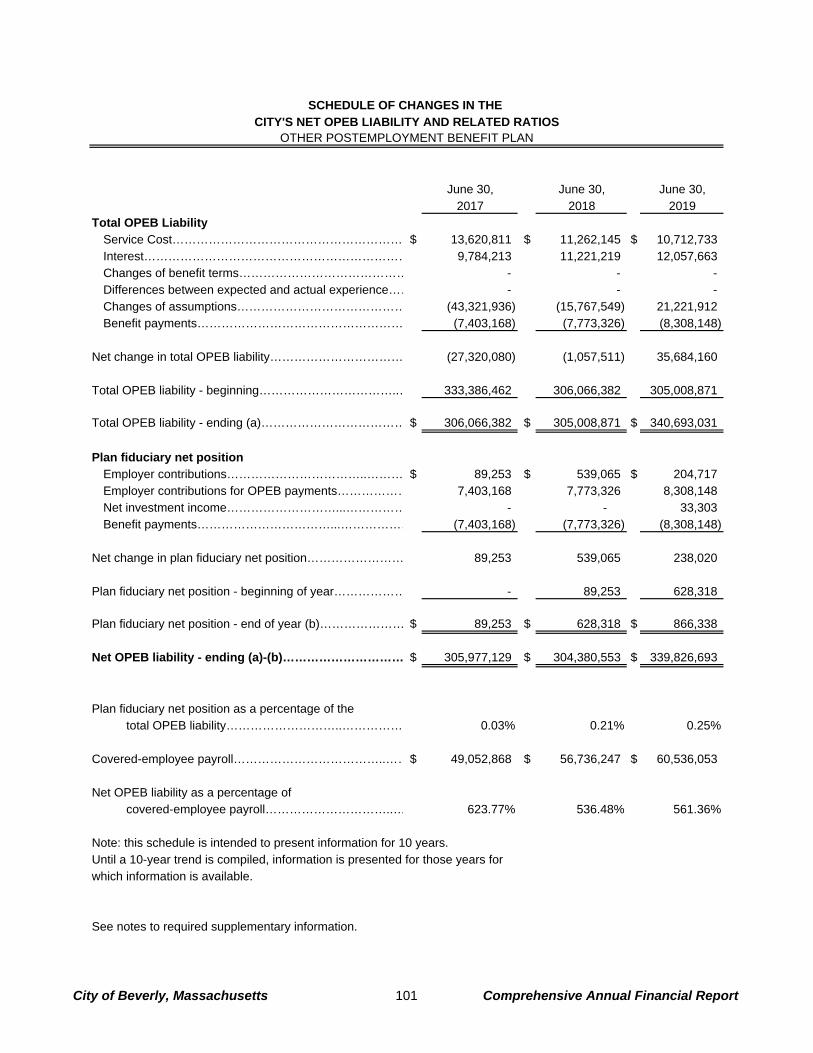
June 30, June 30, June 30,2017 2018 2019
Total OPEB LiabilityService Cost………………………………………………… $ 13,620,811 $ 11,262,145 $ 10,712,733 Interest………………………………………………………… 9,784,213 11,221,219 12,057,663 Changes of benefit terms…………………………………… - - - Differences between expected and actual experience…… - - - Changes of assumptions…………………………………… (43,321,936) (15,767,549) 21,221,912 Benefit payments…………………………………………… (7,403,168) (7,773,326) (8,308,148)
Net change in total OPEB liability…………………………… (27,320,080) (1,057,511) 35,684,160
Total OPEB liability - beginning……………………………..… 333,386,462 306,066,382 305,008,871
Total OPEB liability - ending (a)……………………………… $ 306,066,382 $ 305,008,871 $ 340,693,031
Plan fiduciary net position
Employer contributions……………………………..……… $ 89,253 $ 539,065 $ 204,717 Employer contributions for OPEB payments……………… 7,403,168 7,773,326 8,308,148 Net investment income………………………...…………… - - 33,303 Benefit payments……………………………...……………… (7,403,168) (7,773,326) (8,308,148)
Net change in plan fiduciary net position…………………… 89,253 539,065 238,020
Plan fiduciary net position - beginning of year……………… - 89,253 628,318
Plan fiduciary net position - end of year (b)………………… $ 89,253 $ 628,318 $ 866,338
Net OPEB liability - ending (a)-(b)………………………… $ 305,977,129 $ 304,380,553 $ 339,826,693
Plan fiduciary net position as a percentage of the total OPEB liability………………………..…………… 0.03% 0.21% 0.25%
Covered-employee payroll………………………………..……$ 49,052,868 $ 56,736,247 $ 60,536,053
Net OPEB liability as a percentage ofcovered-employee payroll…………………………..… 623.77% 536.48% 561.36%
Note: this schedule is intended to present information for 10 years.Until a 10-year trend is compiled, information is presented for those years for which information is available.
See notes to required supplementary information.
SCHEDULE OF CHANGES IN THE CITY'S NET OPEB LIABILITY AND RELATED RATIOS
OTHER POSTEMPLOYMENT BENEFIT PLAN
City of Beverly, Massachusetts 101 Comprehensive Annual Financial Report
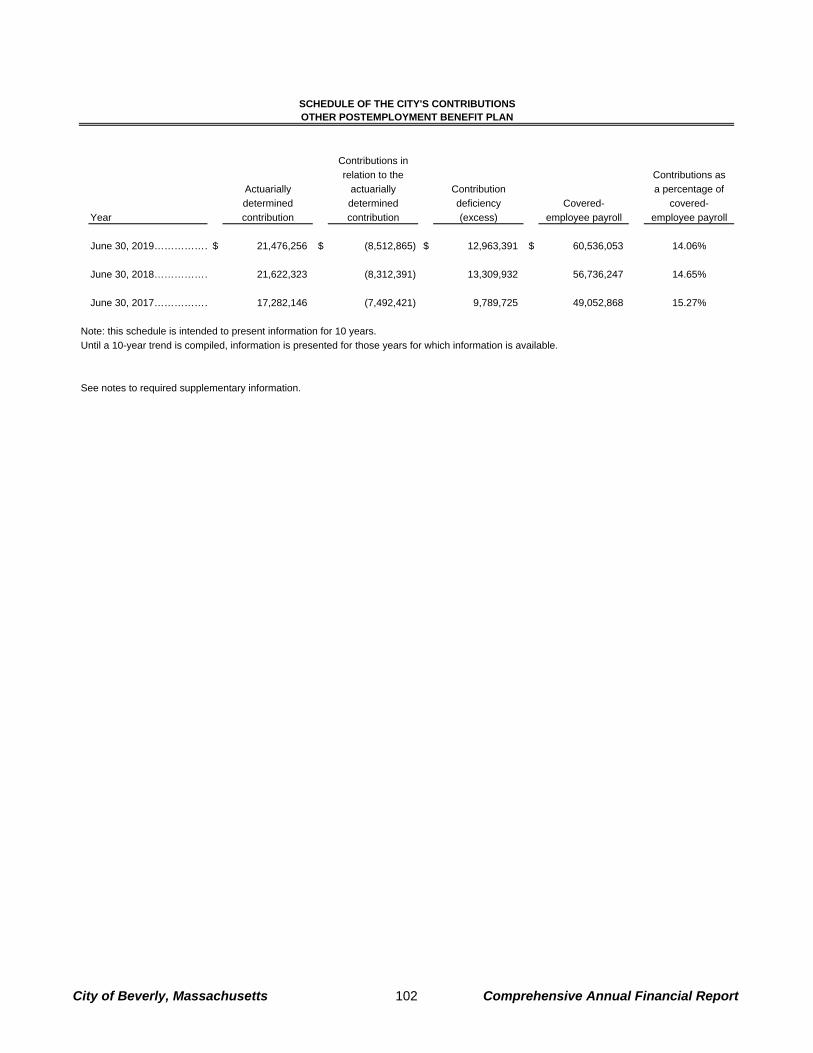
Contributions in
relation to the Contributions as
Actuarially actuarially Contribution a percentage of
determined determined deficiency Covered- covered-
Year contribution contribution (excess) employee payroll employee payroll
June 30, 2019………………$ 21,476,256 $ (8,512,865) $ 12,963,391 $ 60,536,053 14.06%
June 30, 2018……………… 21,622,323 (8,312,391) 13,309,932 56,736,247 14.65%
June 30, 2017……………… 17,282,146 (7,492,421) 9,789,725 49,052,868 15.27%
Note: this schedule is intended to present information for 10 years.
Until a 10-year trend is compiled, information is presented for those years for which information is available.
See notes to required supplementary information.
SCHEDULE OF THE CITY'S CONTRIBUTIONSOTHER POSTEMPLOYMENT BENEFIT PLAN
City of Beverly, Massachusetts 102 Comprehensive Annual Financial Report
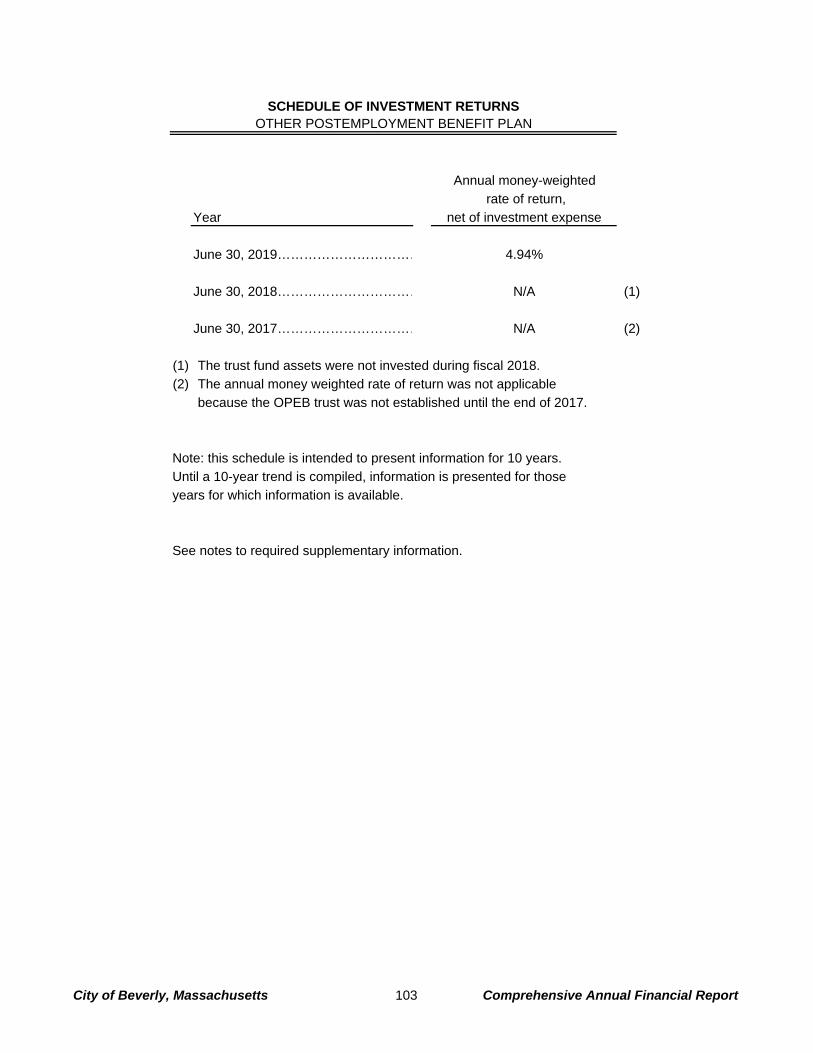
Annual money-weighted
rate of return,
Year net of investment expense
June 30, 2019…………………………… 4.94%
June 30, 2018…………………………… N/A (1)
June 30, 2017…………………………… N/A (2)
(1) The trust fund assets were not invested during fiscal 2018.
(2) The annual money weighted rate of return was not applicable
because the OPEB trust was not established until the end of 2017.
Note: this schedule is intended to present information for 10 years.
Until a 10-year trend is compiled, information is presented for those
years for which information is available.
See notes to required supplementary information.
SCHEDULE OF INVESTMENT RETURNSOTHER POSTEMPLOYMENT BENEFIT PLAN
City of Beverly, Massachusetts 103 Comprehensive Annual Financial Report
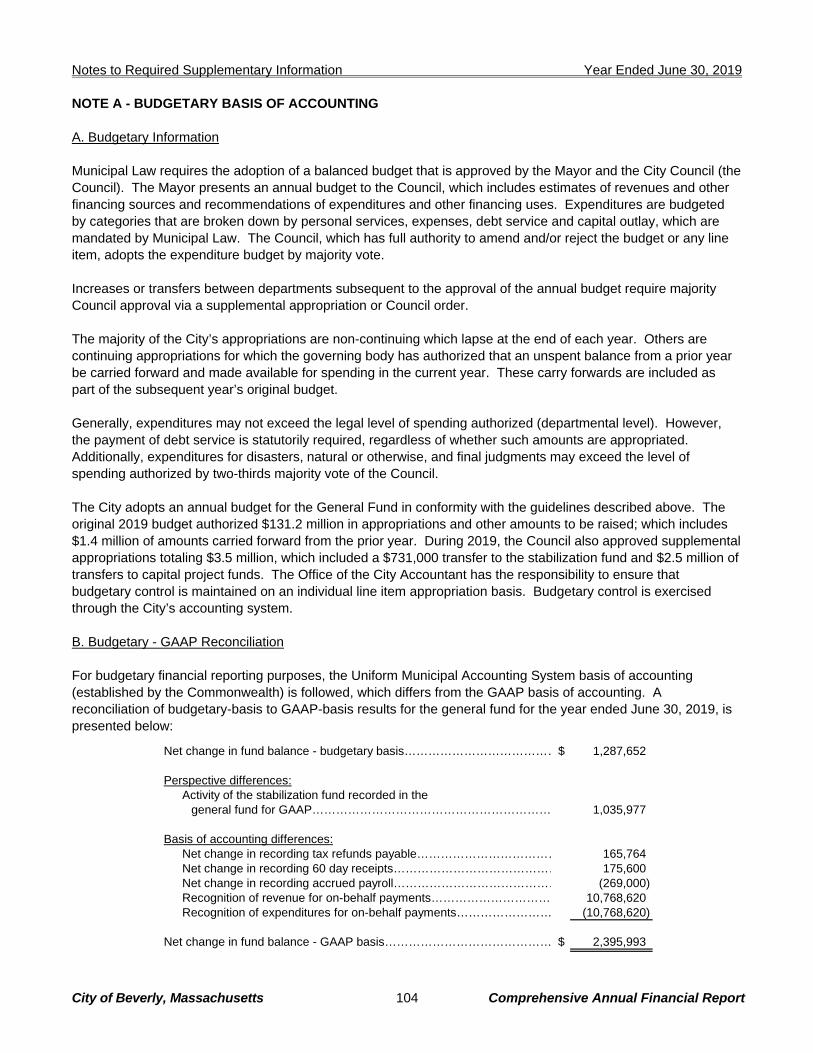
Notes to Required Supplementary Information Year Ended June 30, 2019
City of Beverly, Massachusetts 104 Comprehensive Annual Financial Report
NOTE A - BUDGETARY BASIS OF ACCOUNTING Notes to required supplementary information A. Budgetary Information Municipal Law requires the adoption of a balanced budget that is approved by the Mayor and the City Council (the Council). The Mayor presents an annual budget to the Council, which includes estimates of revenues and other financing sources and recommendations of expenditures and other financing uses. Expenditures are budgeted by categories that are broken down by personal services, expenses, debt service and capital outlay, which are mandated by Municipal Law. The Council, which has full authority to amend and/or reject the budget or any line item, adopts the expenditure budget by majority vote. Increases or transfers between departments subsequent to the approval of the annual budget require majority Council approval via a supplemental appropriation or Council order. The majority of the City’s appropriations are non-continuing which lapse at the end of each year. Others are continuing appropriations for which the governing body has authorized that an unspent balance from a prior year be carried forward and made available for spending in the current year. These carry forwards are included as part of the subsequent year’s original budget. Generally, expenditures may not exceed the legal level of spending authorized (departmental level). However, the payment of debt service is statutorily required, regardless of whether such amounts are appropriated. Additionally, expenditures for disasters, natural or otherwise, and final judgments may exceed the level of spending authorized by two-thirds majority vote of the Council. The City adopts an annual budget for the General Fund in conformity with the guidelines described above. The original 2019 budget authorized $131.2 million in appropriations and other amounts to be raised; which includes $1.4 million of amounts carried forward from the prior year. During 2019, the Council also approved supplemental appropriations totaling $3.5 million, which included a $731,000 transfer to the stabilization fund and $2.5 million of transfers to capital project funds. The Office of the City Accountant has the responsibility to ensure that budgetary control is maintained on an individual line item appropriation basis. Budgetary control is exercised through the City’s accounting system. B. Budgetary - GAAP Reconciliation For budgetary financial reporting purposes, the Uniform Municipal Accounting System basis of accounting (established by the Commonwealth) is followed, which differs from the GAAP basis of accounting. A reconciliation of budgetary-basis to GAAP-basis results for the general fund for the year ended June 30, 2019, is presented below:
Net change in fund balance - budgetary basis…………………………………$ 1,287,652
Perspective differences: Activity of the stabilization fund recorded in the
general fund for GAAP…………………………………………………… 1,035,977
Basis of accounting differences: Net change in recording tax refunds payable……………………………… 165,764 Net change in recording 60 day receipts…………………………………… 175,600 Net change in recording accrued payroll…………………………………… (269,000) Recognition of revenue for on-behalf payments………………………… 10,768,620 Recognition of expenditures for on-behalf payments…………………… (10,768,620)
Net change in fund balance - GAAP basis…………………………………… $ 2,395,993
Notes to Required Supplementary Information Year Ended June 30, 2019
City of Beverly, Massachusetts 105 Comprehensive Annual Financial Report
C. Appropriation Deficits During 2019, actual expenditures and encumbrances exceeded budgeted appropriations for the assessors, human resources, building commissioner and state and county charges. State and county charges are assessments from the Commonwealth which are directly deducted from local receipts provided by the state. The over-expenditure in state and county charges relates to special education charges, school choice tuition and charter school tuition. These over-expenditures will be funded by the subsequent years’ tax levy. NOTE B – PENSION PLAN Pension Plan Schedules – Retirement System A. Schedule of Changes in the Net Pension Liability and Related Ratios The Schedule of Changes in the Net Pension Liability and Related Ratios includes the detailed changes in the System’s total pension liability, changes in the System’s net position, and the ending net pension liability. It also demonstrates the plan’s net position as a percentage of the total pension liability and the net pension liability as a percentage of covered payroll. B. Schedule of Contributions Governmental employers are required to pay an annual appropriation as established by PERAC. The total appropriation includes the amounts to pay the pension portion of each member’s retirement allowance, an amount to amortize the actuarially determined unfunded liability to zero in accordance with the System’s funding schedule, and additional appropriations in accordance with adopted early retirement incentive programs. The total appropriations are payable on July 1 and January 1. Employers may choose to pay the entire appropriation in July at a discounted rate. Accordingly, actual employer contributions may be less than the “total appropriation”. The pension fund appropriations are allocated amongst employers based on covered payroll. C. Schedule of Investment Return The money weighted rate of return is calculated as the internal rate of return on pension plan investments, net of pension plan investment expense. A money weighted rate of return expresses investment performance, net of pension plan investment expense, adjusted for the changing amounts actually invested. Inputs to the money weighted rate of return calculation are determined monthly. Pension Plan Schedules - City A. Schedule of the City’s Proportionate Share of the Net Pension Liability The Schedule of the City’s Proportionate Share of the Net Pension Liability details the allocated percentage of the net pension liability (asset), the proportionate share of the net pension liability, and the covered employee payroll. It also demonstrates the net position as a percentage of the pension liability and the net pension liability as a percentage of covered payroll. B. Schedule of City’s Contributions Governmental employers are required to pay an annual appropriation as established by PERAC. The appropriation includes the amounts to pay the pension portion of each member’s retirement allowance, an amount to amortize the actuarially determined unfunded liability to zero in accordance with the System’s funding
Notes to Required Supplementary Information Year Ended June 30, 2019
City of Beverly, Massachusetts 106 Comprehensive Annual Financial Report
schedule, and additional appropriations in accordance with adopted early retirement incentive programs. The appropriations are payable on July 1 and January 1. The City may choose to pay the entire appropriation in July at a discounted rate. Accordingly, actual contributions may be less than the “total appropriation”. The pension fund appropriation is allocated to the City based on covered payroll. C. Schedule of the Special Funding Amounts of the Net Pension Liabilities The Commonwealth of Massachusetts is a nonemployer contributor and is required by statute to make all actuarially determined employer contributions on behalf of the member employers which creates a special funding situation. Since the City does not contribute directly to MTRS, there is no net pension liability to recognize. This schedule discloses the Commonwealth's 100% share of the collective net pension liability that is associated with the City; the portion of the collective pension expense as both revenue and pension expense recognized by the City; and the Plan's fiduciary net position as a percentage of the total liability. D. Changes in Assumptions None. E. Changes in Plan Provisions None. NOTE C – OTHER POSTEMPLOYMENT BENEFITS The City administers a single-employer defined benefit healthcare plan (Plan). The plan provides lifetime healthcare and life insurance for eligible retirees and their spouses through the City’s health insurance plan, which covers both active and retired members, including teachers. The Other Postemployment Benefit Plan A. The Schedule of Changes in the City’s Net Other Postemployment Benefit Liability and Related Ratios The Schedule of Changes in the City’s Net Other Postemployment Benefit Liability and Related Ratios presents multi-year trend information on changes in the Plan’s total OPEB liability, changes in the Plan’s net position, and ending net OPEB liability. It also demonstrates the Plan’s net position as a percentage of the total liability and the Plan’s net other postemployment benefit liability as a percentage of covered-employee payroll. B. Schedule of the City’s Contributions The Schedule of the City’s Contributions includes the City’s annual required contribution to the Plan, along with the contribution made in relation to the actuarially determined contribution and the covered-employee payroll. The City is not required to fully fund this contribution. It also demonstrates the contributions as a percentage of covered-employee payroll. Actuarially determined contribution rates are calculated as of June 30, two years prior to the end of the fiscal year in which contributions are reported.

Notes to Required Supplementary Information Year Ended June 30, 2019
City of Beverly, Massachusetts 107 Comprehensive Annual Financial Report
Methods and assumptions used to determine contribution rates are as follows: Valuation date…………………………………… July 1, 2017
Actuarial cost method………………………… Entry Age Normal.
Amortization method…………………………… Increasing at 4% over 30 years on an open amortization period.
Amortization period……………………………… 30 years.
Asset valuation method………………………… Market value.
Long-term expected rate of return…………… 7.50%, compounded annually, net of fees.
Discount rate…………………………………… 3.50% as of June 30, 2019, 3.87% as of June 30, 2018, net of
investment expenses, including inflation.
Inflation rate……………………………………… 2.60%
Healthcare cost trend rate……………………… 8.00% for 2017, decreasing 0.50% per year to 5.50%, then grading down to an ultimate trend rate of 3.80%, utilizing the Society of Actuaries Getzen Medical Trend Model. The ultimate trend rate is reached in 2075.
Payroll growth…………………………………… 4.00% per year.
Pre-Retirement Mortality:
General and Public Safety…………………… RP-2000 Employees Mortality Table, base year 2009, projected with generational mortality improvement using Scale BB.
Teachers……………………………………… RP-2014 White Collar Mortality Table, base year 2014, projected with generational mortality improvement using Scale MP-2016.
Post-Retirement Mortality:
General and Public Safety…………………… RP-2000 Healthy Annuitant Mortality Table, base year 2009, projected with generational mortality improvement using Scale BB.
Teachers……………………………………… RP-2014 White Collar Mortality Table, base year 2014, projected with generational mortality improvement using Scale MP-2016.
C. Schedule of Investment Return The Schedule of Investment Return includes the money-weighted investment return on the Plan’s other postemployment assets, net of investment expense. D. Changes of Assumptions The discount rate was decreased from 3.87% to 3.50%.
E. Changes in Plan Provisions None.
City of Beverly, Massachusetts 108 Comprehensive Annual Financial Report
Combining and Individual Fund Statements Combining and Individual Fund Statements
City of Beverly, Massachusetts 109 Comprehensive Annual Financial Report
Nonmajor Governmental Funds Nonmajor governmental funds Special Revenue Funds
Special revenue funds are used to account for specific revenues that are legally restricted to expenditure for particular purposes.
City Federal & State Grants Fund – This fund is used to account for non-school related activity specifically financed by federal and state grants which are designated for specific programs. Other City Grants & Gifts Fund – This fund is used to account for the non-school programs specifically financed by other grants and gifts which are designated for specific programs. School Revolving Fund – This fund is used to account for revolving funds specifically allowed by the laws of the Commonwealth of Massachusetts. These funds are expended for purposes specified by the enabling statutes. Other School Grants & Gifts Fund – This fund is used to account for the educational programs specifically financed by other grants and gifts which are designated for specific programs. School Federal & State Grants Fund – This fund is used to account for the educational programs specifically financed by federal and state grants which are designated for specific programs. Special Revenue Trust Fund – This fund is used to account for City and School expendable trust funds. Receipts Reserved for Appropriation Fund – This fund is used to account for receipts reserved for appropriation. Highway Construction Fund – This fund is used to account for highway construction activity specifically financed by state grants which are designated for highway construction. Capital Project Funds
Capital project funds are used to account for the acquisition and construction of major capital facilities other than those financed by proprietary funds and trust funds. City Capital Projects Fund – The City capital projects fund is used to account for capital projects as identified in the City’s capital plan, which includes yearly expenditures for infrastructure and other project activities. School Capital Projects Fund – The school capital projects fund is used to account for school capital projects as identified in the City’s capital plan, which includes yearly expenditures for infrastructure and other project activities. Permanent Funds
Permanent funds are used to report resources that are legally restricted to the extent that only earnings, not principal, may be used for purposes that support governmental programs.
Libraries Fund – This fund is used to account for various contributions in which the principal is legally restricted and only the earnings can be used to support library operations.
City of Beverly, Massachusetts 110 Comprehensive Annual Financial Report
Cemetery Perpetual Care Fund – This fund is used to account for funds in which the principal is legally restricted and only the earnings can be used to support cemetery care and maintenance. Conservation Trust Fund – This fund is used to account for funds in which the principal is legally restricted and only the earnings can be used to support conservation activities. Other Permanent Fund – This fund is used to account for funds in which the principal is legally restricted and only the earnings can be used to support other City and School activities.
City of Beverly, Massachusetts 111 Comprehensive Annual Financial Report
This page intentionally left blank.
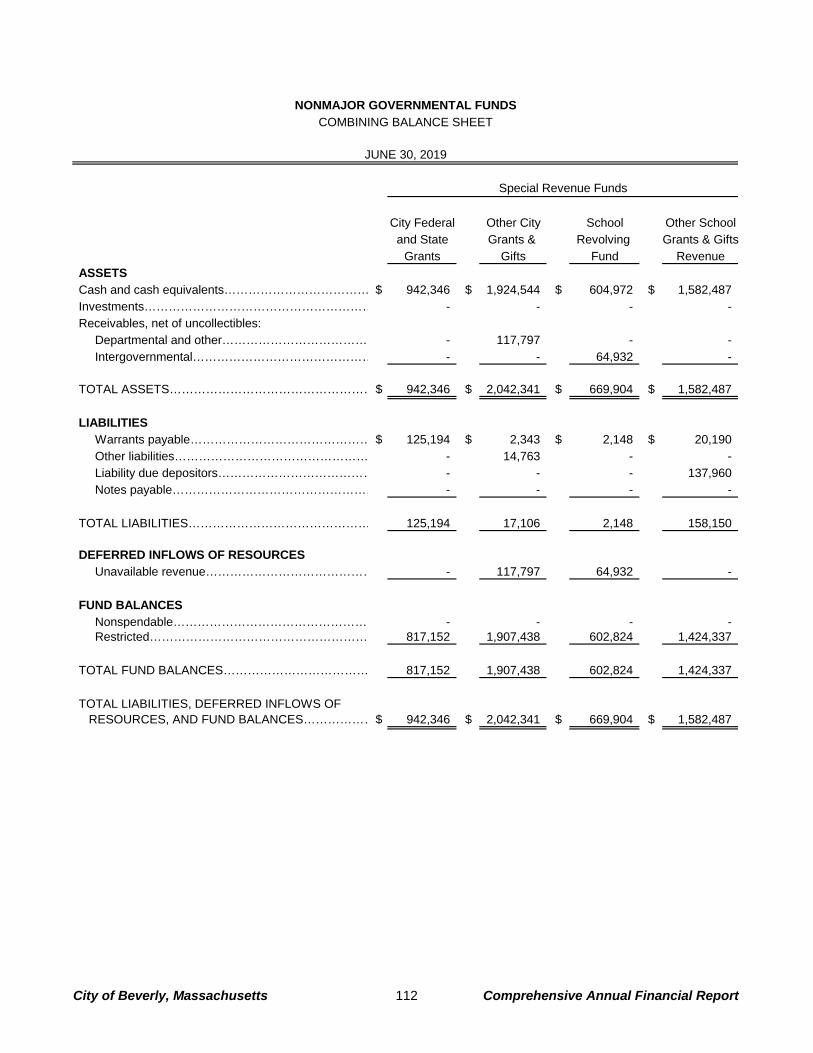
City Federal Other City School Other Schooland State Grants & Revolving Grants & Gifts
Grants Gifts Fund RevenueASSETSCash and cash equivalents……………………………… $ 942,346 $ 1,924,544 $ 604,972 $ 1,582,487 Investments………………………………………………… - - - - Receivables, net of uncollectibles:
Departmental and other………………………………… - 117,797 - - Intergovernmental……………………………………… - - 64,932 -
TOTAL ASSETS……………………………………………$ 942,346 $ 2,042,341 $ 669,904 $ 1,582,487
LIABILITIESWarrants payable……………………………………… $ 125,194 $ 2,343 $ 2,148 $ 20,190 Other liabilities………………………………………… - 14,763 - - Liability due depositors………………………………… - - - 137,960 Notes payable…………………………………………… - - - -
TOTAL LIABILITIES……………………………………… 125,194 17,106 2,148 158,150
DEFERRED INFLOWS OF RESOURCESUnavailable revenue…………………………………… - 117,797 64,932 -
FUND BALANCESNonspendable…………………………………………… - - - - Restricted……………………………………………… 817,152 1,907,438 602,824 1,424,337
TOTAL FUND BALANCES……………………………… 817,152 1,907,438 602,824 1,424,337
TOTAL LIABILITIES, DEFERRED INFLOWS OF RESOURCES, AND FUND BALANCES………………$ 942,346 $ 2,042,341 $ 669,904 $ 1,582,487
NONMAJOR GOVERNMENTAL FUNDSCOMBINING BALANCE SHEET
JUNE 30, 2019
Special Revenue Funds
City of Beverly, Massachusetts 112 Comprehensive Annual Financial Report
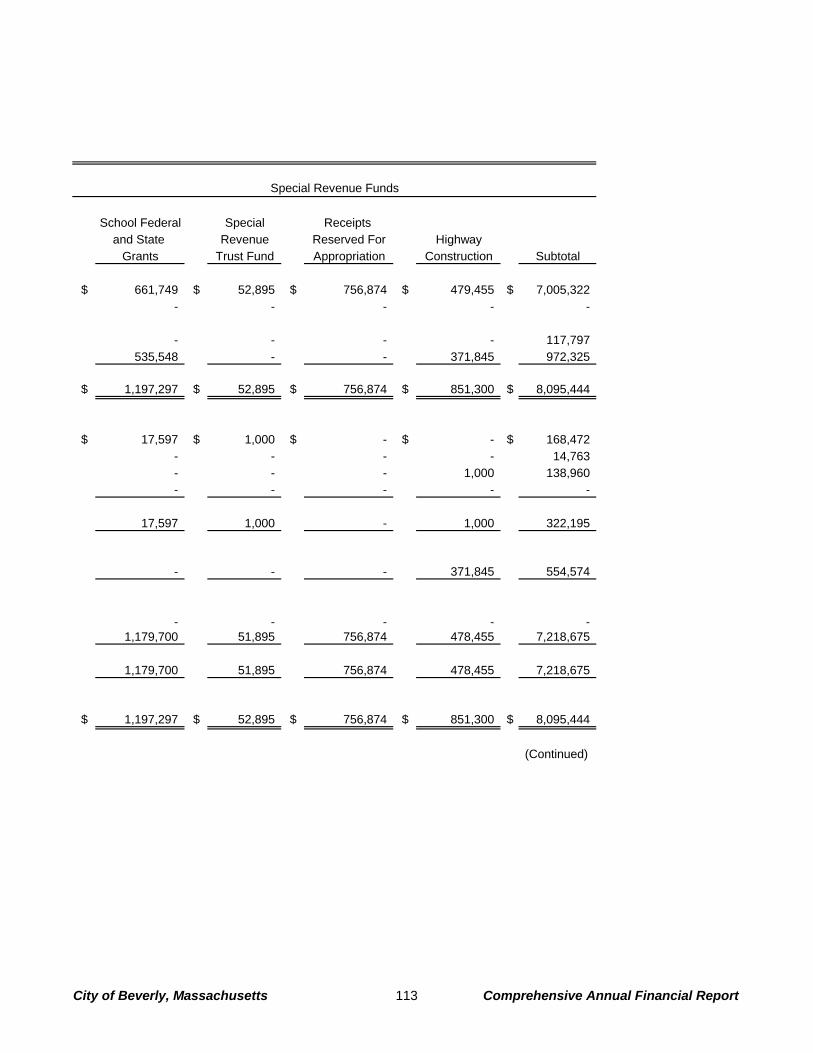
School Federal Special Receipts and State Revenue Reserved For Highway
Grants Trust Fund Appropriation Construction Subtotal
$ 661,749 $ 52,895 $ 756,874 $ 479,455 $ 7,005,322 - - - - - - - - - 117,797 535,548 - - 371,845 972,325
$ 1,197,297 $ 52,895 $ 756,874 $ 851,300 $ 8,095,444
$ 17,597 $ 1,000 $ - $ - $ 168,472 - - - - 14,763 - - - 1,000 138,960 - - - - -
17,597 1,000 - 1,000 322,195
- - - 371,845 554,574
- - - - - 1,179,700 51,895 756,874 478,455 7,218,675
1,179,700 51,895 756,874 478,455 7,218,675
$ 1,197,297 $ 52,895 $ 756,874 $ 851,300 $ 8,095,444
(Continued)
Special Revenue Funds
City of Beverly, Massachusetts 113 Comprehensive Annual Financial Report
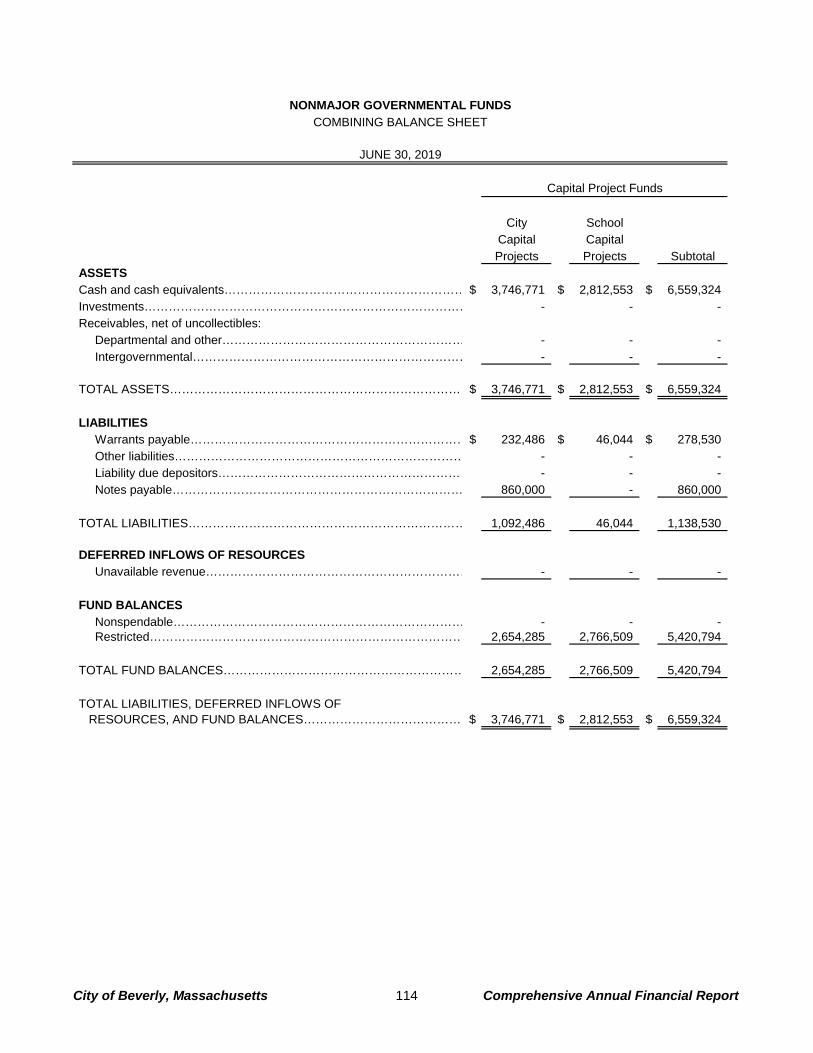
City SchoolCapital CapitalProjects Projects Subtotal
ASSETSCash and cash equivalents…………………………………………………… $ 3,746,771 $ 2,812,553 $ 6,559,324 Investments……………………………………………………………………… - - - Receivables, net of uncollectibles:
Departmental and other…………………………………………………… - - - Intergovernmental…………………………………………………………… - - -
TOTAL ASSETS…………………………………………………………………$ 3,746,771 $ 2,812,553 $ 6,559,324
LIABILITIESWarrants payable……………………………………………………………$ 232,486 $ 46,044 $ 278,530 Other liabilities……………………………………………………………… - - - Liability due depositors……………………………………………………… - - - Notes payable……………………………………………………………… 860,000 - 860,000
TOTAL LIABILITIES…………………………………………………………… 1,092,486 46,044 1,138,530
DEFERRED INFLOWS OF RESOURCES
Unavailable revenue………………………………………………………… - - -
FUND BALANCES Nonspendable……………………………………………………………… - - - Restricted…………………………………………………………………… 2,654,285 2,766,509 5,420,794
TOTAL FUND BALANCES…………………………………………………… 2,654,285 2,766,509 5,420,794
TOTAL LIABILITIES, DEFERRED INFLOWS OF RESOURCES, AND FUND BALANCES………………………………… $ 3,746,771 $ 2,812,553 $ 6,559,324
NONMAJOR GOVERNMENTAL FUNDSCOMBINING BALANCE SHEET
JUNE 30, 2019
Capital Project Funds
City of Beverly, Massachusetts 114 Comprehensive Annual Financial Report
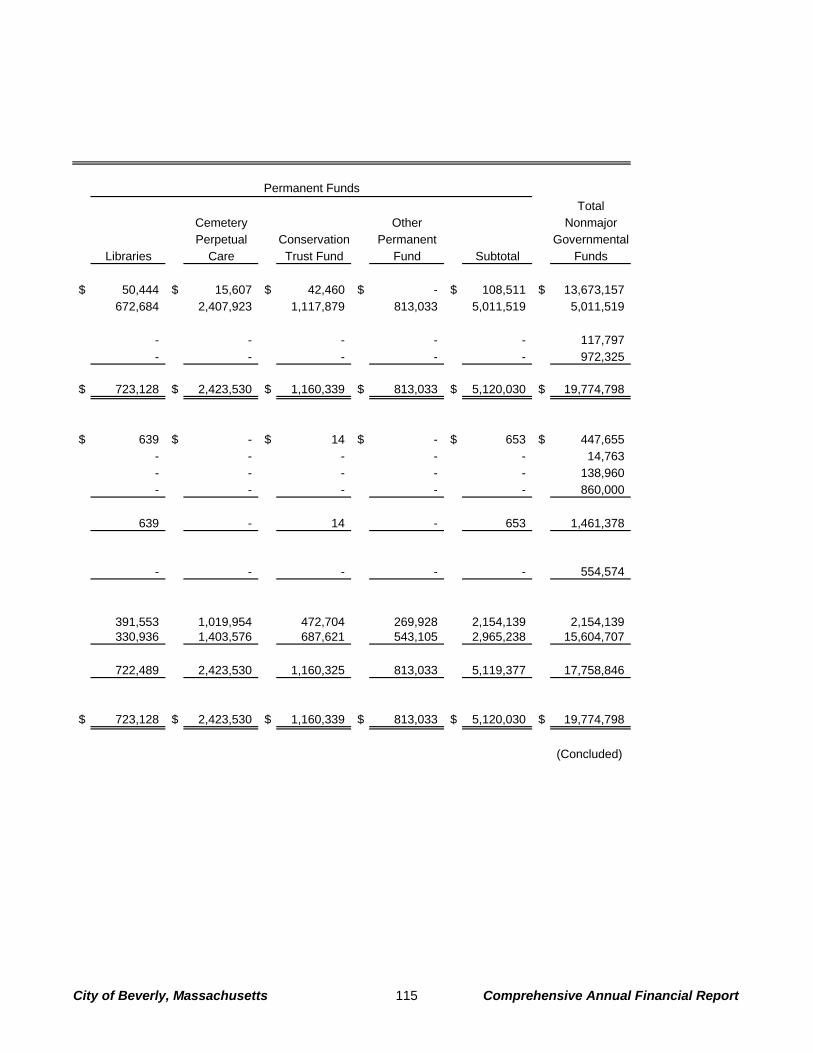
TotalCemetery Other NonmajorPerpetual Conservation Permanent Governmental
Libraries Care Trust Fund Fund Subtotal Funds
$ 50,444 $ 15,607 $ 42,460 $ - $ 108,511 $ 13,673,157 672,684 2,407,923 1,117,879 813,033 5,011,519 5,011,519
- - - - - 117,797 - - - - - 972,325
$ 723,128 $ 2,423,530 $ 1,160,339 $ 813,033 $ 5,120,030 $ 19,774,798
$ 639 $ - $ 14 $ - $ 653 $ 447,655 - - - - - 14,763 - - - - - 138,960 - - - - - 860,000
639 - 14 - 653 1,461,378
- - - - - 554,574
391,553 1,019,954 472,704 269,928 2,154,139 2,154,139 330,936 1,403,576 687,621 543,105 2,965,238 15,604,707
722,489 2,423,530 1,160,325 813,033 5,119,377 17,758,846
$ 723,128 $ 2,423,530 $ 1,160,339 $ 813,033 $ 5,120,030 $ 19,774,798
(Concluded)
Permanent Funds
City of Beverly, Massachusetts 115 Comprehensive Annual Financial Report
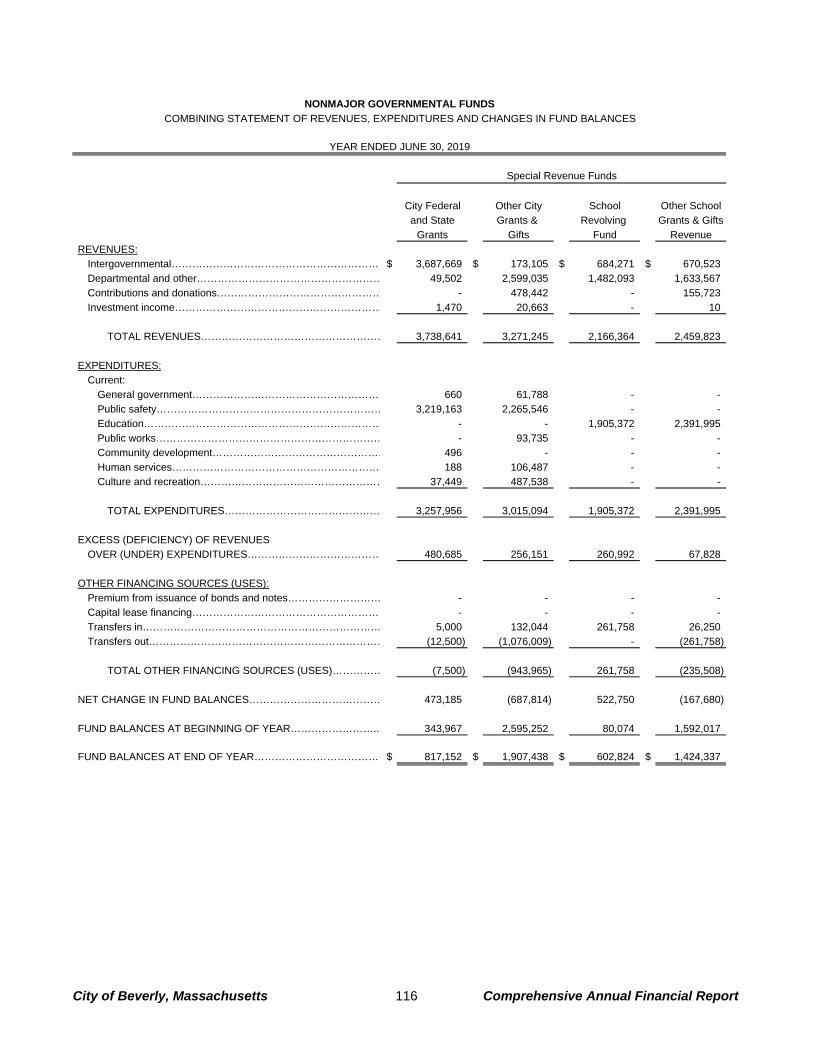
City Federal Other City School Other School
and State Grants & Revolving Grants & Gifts
Grants Gifts Fund Revenue
REVENUES:
Intergovernmental………………………………………………………$ 3,687,669 $ 173,105 $ 684,271 $ 670,523
Departmental and other……………………………………………… 49,502 2,599,035 1,482,093 1,633,567
Contributions and donations………………………………………… - 478,442 - 155,723
Investment income…………………………………………………… 1,470 20,663 - 10
TOTAL REVENUES……………………………………………… 3,738,641 3,271,245 2,166,364 2,459,823
EXPENDITURES:
Current:
General government………………………………………………… 660 61,788 - -
Public safety………………………………………………………… 3,219,163 2,265,546 - -
Education…………………………………………………………… - - 1,905,372 2,391,995
Public works………………………………………………………… - 93,735 - -
Community development…………………………………………… 496 - - -
Human services……………………………………………………… 188 106,487 - -
Culture and recreation……………………………………………… 37,449 487,538 - -
TOTAL EXPENDITURES……………………………………… 3,257,956 3,015,094 1,905,372 2,391,995
EXCESS (DEFICIENCY) OF REVENUES
OVER (UNDER) EXPENDITURES………………………………… 480,685 256,151 260,992 67,828
OTHER FINANCING SOURCES (USES):
Premium from issuance of bonds and notes……………………… - - - -
Capital lease financing………………………………………………… - - - -
Transfers in…………………………………………………………… 5,000 132,044 261,758 26,250
Transfers out…………………………………………………………… (12,500) (1,076,009) - (261,758)
TOTAL OTHER FINANCING SOURCES (USES)…………… (7,500) (943,965) 261,758 (235,508)
NET CHANGE IN FUND BALANCES………………………………… 473,185 (687,814) 522,750 (167,680)
FUND BALANCES AT BEGINNING OF YEAR……………………..… 343,967 2,595,252 80,074 1,592,017
FUND BALANCES AT END OF YEAR…………………………………$ 817,152 $ 1,907,438 $ 602,824 $ 1,424,337
NONMAJOR GOVERNMENTAL FUNDS
COMBINING STATEMENT OF REVENUES, EXPENDITURES AND CHANGES IN FUND BALANCES
YEAR ENDED JUNE 30, 2019
Special Revenue Funds
City of Beverly, Massachusetts 116 Comprehensive Annual Financial Report
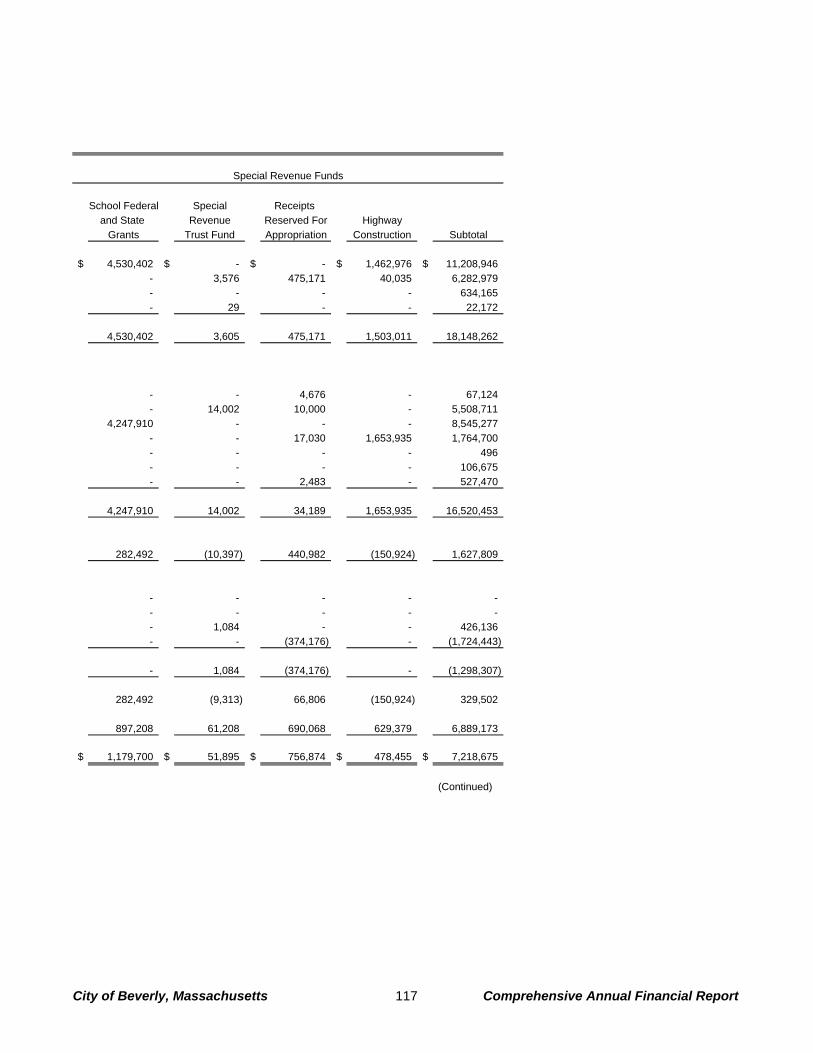
School Federal Special Receipts
and State Revenue Reserved For Highway
Grants Trust Fund Appropriation Construction Subtotal
$ 4,530,402 $ - $ - $ 1,462,976 $ 11,208,946
- 3,576 475,171 40,035 6,282,979
- - - - 634,165
- 29 - - 22,172
4,530,402 3,605 475,171 1,503,011 18,148,262
- - 4,676 - 67,124
- 14,002 10,000 - 5,508,711
4,247,910 - - - 8,545,277
- - 17,030 1,653,935 1,764,700
- - - - 496
- - - - 106,675
- - 2,483 - 527,470
4,247,910 14,002 34,189 1,653,935 16,520,453
282,492 (10,397) 440,982 (150,924) 1,627,809
- - - - -
- - - - -
- 1,084 - - 426,136
- - (374,176) - (1,724,443)
- 1,084 (374,176) - (1,298,307)
282,492 (9,313) 66,806 (150,924) 329,502
897,208 61,208 690,068 629,379 6,889,173
$ 1,179,700 $ 51,895 $ 756,874 $ 478,455 $ 7,218,675
(Continued)
Special Revenue Funds
City of Beverly, Massachusetts 117 Comprehensive Annual Financial Report
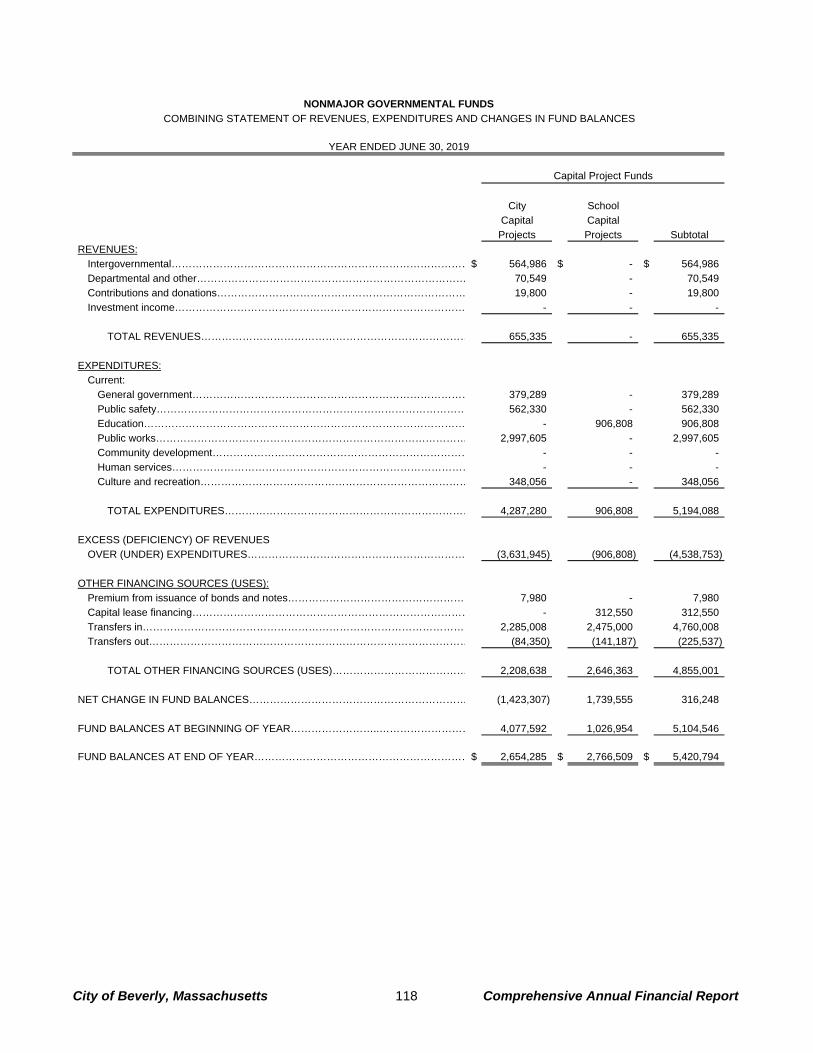
City School
Capital Capital
Projects Projects Subtotal
REVENUES:
Intergovernmental……………………………………………………………………………$ 564,986 $ - $ 564,986
Departmental and other…………………………………………………………………… 70,549 - 70,549
Contributions and donations……………………………………………………………… 19,800 - 19,800
Investment income………………………………………………………………………… - - -
TOTAL REVENUES…………………………………………………………………… 655,335 - 655,335
EXPENDITURES:
Current:
General government……………………………………………………………………… 379,289 - 379,289
Public safety……………………………………………………………………………… 562,330 - 562,330
Education………………………………………………………………………………… - 906,808 906,808
Public works……………………………………………………………………………… 2,997,605 - 2,997,605
Community development………………………………………………………………… - - -
Human services…………………………………………………………………………… - - -
Culture and recreation…………………………………………………………………… 348,056 - 348,056
TOTAL EXPENDITURES……………………………………………………………… 4,287,280 906,808 5,194,088
EXCESS (DEFICIENCY) OF REVENUES
OVER (UNDER) EXPENDITURES……………………………………………………… (3,631,945) (906,808) (4,538,753)
OTHER FINANCING SOURCES (USES):
Premium from issuance of bonds and notes…………………………………………… 7,980 - 7,980
Capital lease financing……………………………………………………………………… - 312,550 312,550
Transfers in…………………………………………………………………………………… 2,285,008 2,475,000 4,760,008
Transfers out………………………………………………………………………………… (84,350) (141,187) (225,537)
TOTAL OTHER FINANCING SOURCES (USES)………………………………… 2,208,638 2,646,363 4,855,001
NET CHANGE IN FUND BALANCES……………………………………………………… (1,423,307) 1,739,555 316,248
FUND BALANCES AT BEGINNING OF YEAR……………………..……………………… 4,077,592 1,026,954 5,104,546
FUND BALANCES AT END OF YEAR………………………………………………………$ 2,654,285 $ 2,766,509 $ 5,420,794
Capital Project Funds
NONMAJOR GOVERNMENTAL FUNDS
COMBINING STATEMENT OF REVENUES, EXPENDITURES AND CHANGES IN FUND BALANCES
YEAR ENDED JUNE 30, 2019
City of Beverly, Massachusetts 118 Comprehensive Annual Financial Report
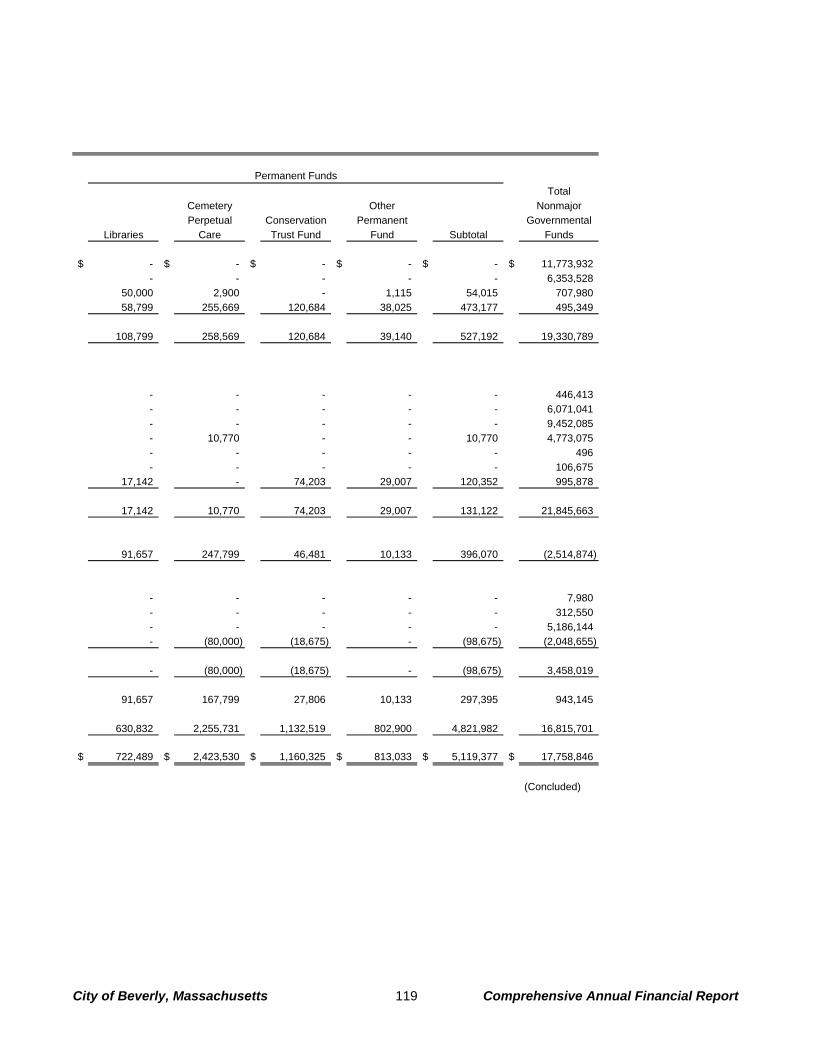
Total
Cemetery Other Nonmajor
Perpetual Conservation Permanent Governmental
Libraries Care Trust Fund Fund Subtotal Funds
$ - $ - $ - $ - $ - $ 11,773,932
- - - - - 6,353,528
50,000 2,900 - 1,115 54,015 707,980
58,799 255,669 120,684 38,025 473,177 495,349
108,799 258,569 120,684 39,140 527,192 19,330,789
- - - - - 446,413
- - - - - 6,071,041
- - - - - 9,452,085
- 10,770 - - 10,770 4,773,075
- - - - - 496
- - - - - 106,675
17,142 - 74,203 29,007 120,352 995,878
17,142 10,770 74,203 29,007 131,122 21,845,663
91,657 247,799 46,481 10,133 396,070 (2,514,874)
- - - - - 7,980
- - - - - 312,550
- - - - - 5,186,144
- (80,000) (18,675) - (98,675) (2,048,655)
- (80,000) (18,675) - (98,675) 3,458,019
91,657 167,799 27,806 10,133 297,395 943,145
630,832 2,255,731 1,132,519 802,900 4,821,982 16,815,701
$ 722,489 $ 2,423,530 $ 1,160,325 $ 813,033 $ 5,119,377 $ 17,758,846
(Concluded)
Permanent Funds
City of Beverly, Massachusetts 119 Comprehensive Annual Financial Report
City of Beverly, Massachusetts 120 Comprehensive Annual Financial Report
Agency Fund Agency fund The Agency fund is used to account for contractor performance bonds, contractor bid deposits, student activity accounts, fire private details and landfill monitoring.
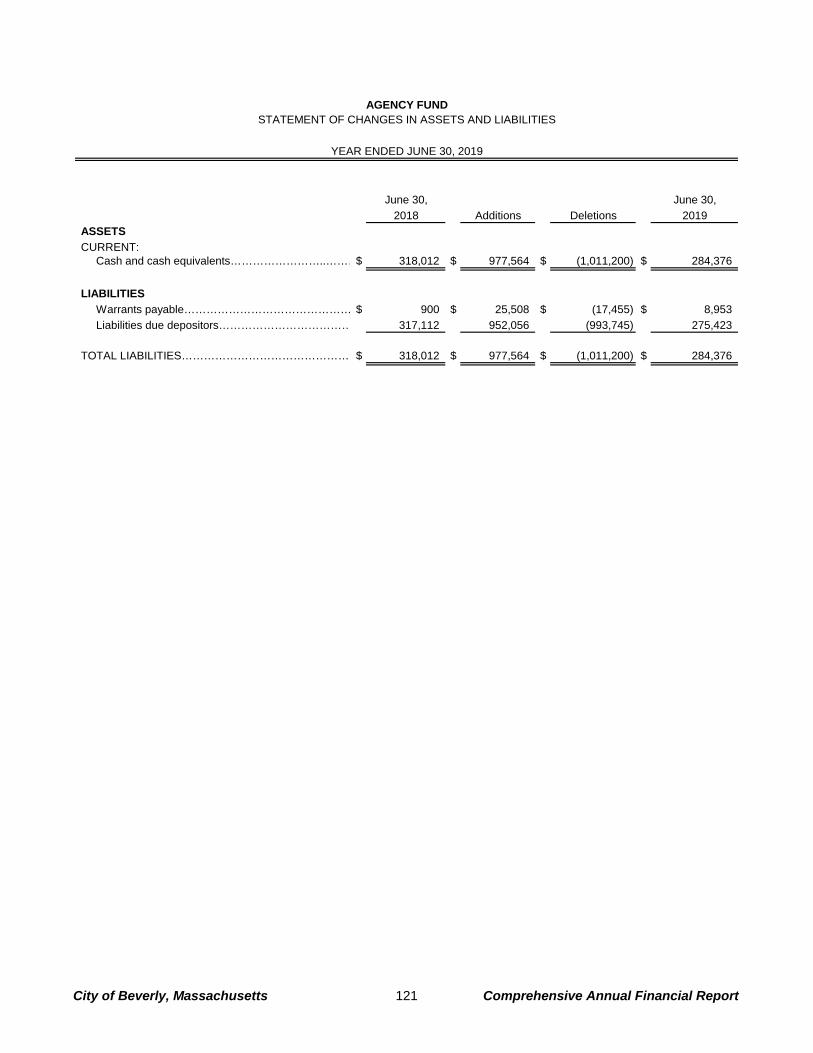
AGENCY FUNDSTATEMENT OF CHANGES IN ASSETS AND LIABILITIES
YEAR ENDED JUNE 30, 2019
June 30, June 30,
2018 Additions Deletions 2019
CURRENT:Cash and cash equivalents……………………..………$ 318,012 $ 977,564 $ (1,011,200) $ 284,376
Warrants payable……………………………………… $ 900 $ 25,508 $ (17,455) $ 8,953
Liabilities due depositors……………………………… 317,112 952,056 (993,745) 275,423
TOTAL LIABILITIES……………………………………… $ 318,012 $ 977,564 $ (1,011,200) $ 284,376
ASSETS
LIABILITIES
City of Beverly, Massachusetts 121 Comprehensive Annual Financial Report

City of Beverly, Massachusetts 122 Comprehensive Annual Financial Report
This page intentionally left blank.
Statistical Section
Rose Garden Lynch Park

The Falconer
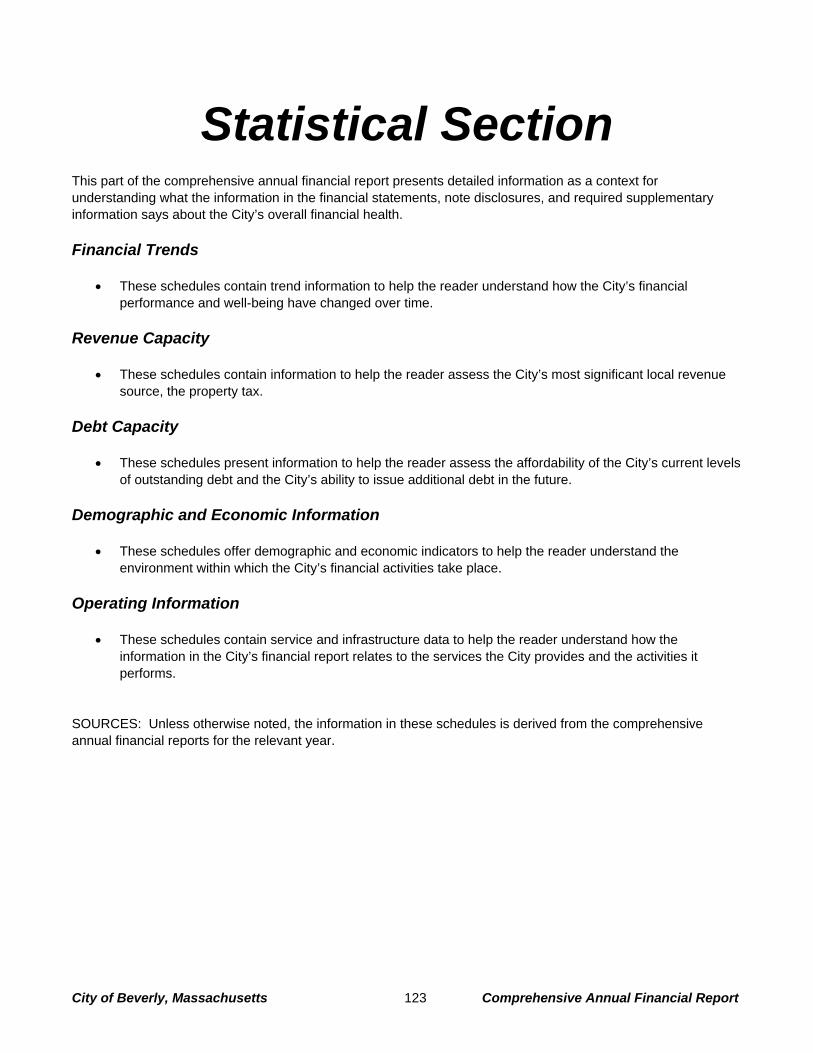
City of Beverly, Massachusetts 123 Comprehensive Annual Financial Report
Statistical Section This part of the comprehensive annual financial report presents detailed information as a context for understanding what the information in the financial statements, note disclosures, and required supplementary information says about the City’s overall financial health.
Financial Trends
These schedules contain trend information to help the reader understand how the City’s financial performance and well-being have changed over time.
Revenue Capacity
These schedules contain information to help the reader assess the City’s most significant local revenue source, the property tax.
Debt Capacity
These schedules present information to help the reader assess the affordability of the City’s current levels of outstanding debt and the City’s ability to issue additional debt in the future.
Demographic and Economic Information
These schedules offer demographic and economic indicators to help the reader understand the environment within which the City’s financial activities take place.
Operating Information
These schedules contain service and infrastructure data to help the reader understand how the information in the City’s financial report relates to the services the City provides and the activities it performs.
SOURCES: Unless otherwise noted, the information in these schedules is derived from the comprehensive annual financial reports for the relevant year.
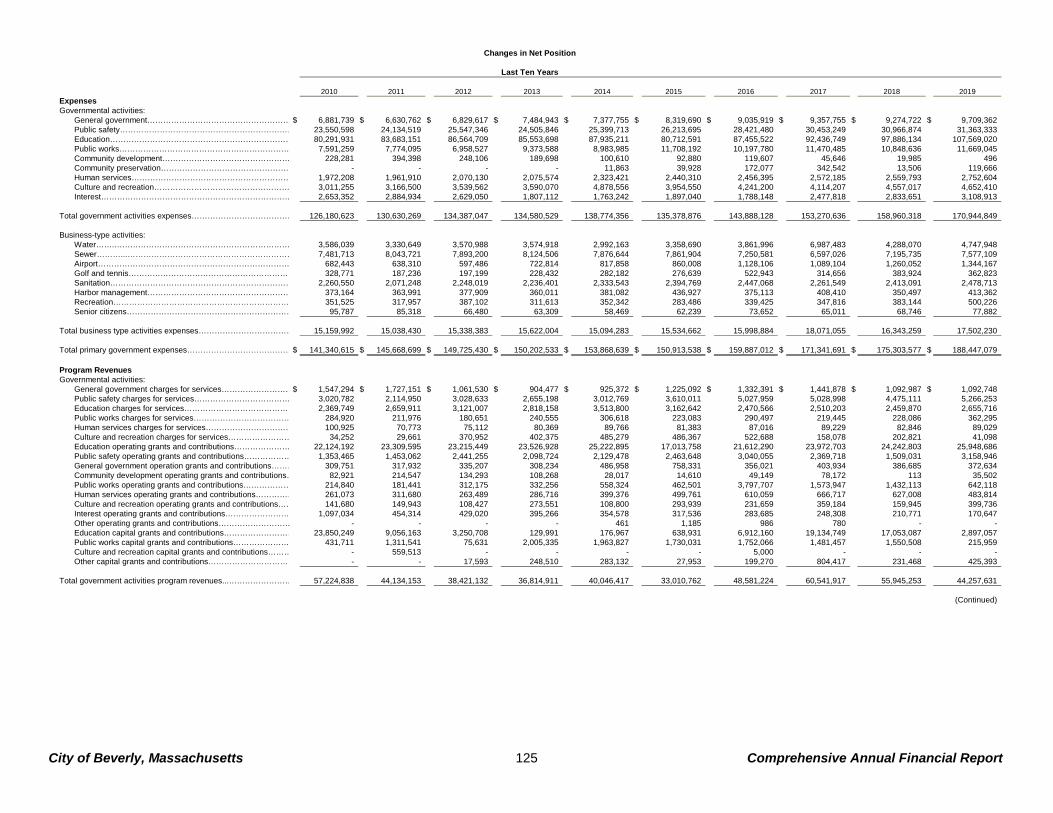
2010 2011 2012 2013 2014 2015 2016 2017 2018 2019ExpensesGovernmental activities:
General government……………………………………………… $ 6,881,739 $ 6,630,762 $ 6,829,617 $ 7,484,943 $ 7,377,755 $ 8,319,690 $ 9,035,919 $ 9,357,755 $ 9,274,722 $ 9,709,362 Public safety………………………………………………………… 23,550,598 24,134,519 25,547,346 24,505,846 25,399,713 26,213,695 28,421,480 30,453,249 30,966,874 31,363,333 Education…………………………………………………………… 80,291,931 83,683,151 86,564,709 85,553,698 87,935,211 80,712,591 87,455,522 92,436,749 97,886,134 107,569,020 Public works……………………………………….……………… 7,591,259 7,774,095 6,958,527 9,373,588 8,983,985 11,708,192 10,197,780 11,470,485 10,848,636 11,669,045 Community development………………………………………… 228,281 394,398 248,106 189,698 100,610 92,880 119,607 45,646 19,985 496 Community preservation…………………………………………… - - - - 11,863 39,928 172,077 342,542 13,506 119,666 Human services…………………………………………………… 1,972,208 1,961,910 2,070,130 2,075,574 2,323,421 2,440,310 2,456,395 2,572,185 2,559,793 2,752,604 Culture and recreation…………………………………………… 3,011,255 3,166,500 3,539,562 3,590,070 4,878,556 3,954,550 4,241,200 4,114,207 4,557,017 4,652,410 Interest……………………………………………………………… 2,653,352 2,884,934 2,629,050 1,807,112 1,763,242 1,897,040 1,788,148 2,477,818 2,833,651 3,108,913
Total government activities expenses………………………………… 126,180,623 130,630,269 134,387,047 134,580,529 138,774,356 135,378,876 143,888,128 153,270,636 158,960,318 170,944,849
Business-type activities: Water…….………………………………………………………… 3,586,039 3,330,649 3,570,988 3,574,918 2,992,163 3,358,690 3,861,996 6,987,483 4,288,070 4,747,948 Sewer………...……………………………………………………… 7,481,713 8,043,721 7,893,200 8,124,506 7,876,644 7,861,904 7,250,581 6,597,026 7,195,735 7,577,109 Airport……………………………………………………………… 682,443 638,310 597,486 722,814 817,858 860,008 1,128,106 1,089,104 1,260,052 1,344,167 Golf and tennis……………………………………………………… 328,771 187,236 197,199 228,432 282,182 276,639 522,943 314,656 383,924 362,823 Sanitation…………………………………………………………… 2,260,550 2,071,248 2,248,019 2,236,401 2,333,543 2,394,769 2,447,068 2,261,549 2,413,091 2,478,713 Harbor management……………………………………………… 373,164 363,991 377,909 360,011 381,082 436,927 375,113 408,410 350,497 413,362 Recreation………………………………………………………… 351,525 317,957 387,102 311,613 352,342 283,486 339,425 347,816 383,144 500,226 Senior citizens……………………………………………………… 95,787 85,318 66,480 63,309 58,469 62,239 73,652 65,011 68,746 77,882
Total business type activities expenses……………………………… 15,159,992 15,038,430 15,338,383 15,622,004 15,094,283 15,534,662 15,998,884 18,071,055 16,343,259 17,502,230
Total primary government expenses………………………………… $ 141,340,615 $ 145,668,699 $ 149,725,430 $ 150,202,533 $ 153,868,639 $ 150,913,538 $ 159,887,012 $ 171,341,691 $ 175,303,577 $ 188,447,079
Program RevenuesGovernmental activities:
General government charges for services………………………$ 1,547,294 $ 1,727,151 $ 1,061,530 $ 904,477 $ 925,372 $ 1,225,092 $ 1,332,391 $ 1,441,878 $ 1,092,987 $ 1,092,748 Public safety charges for services……………………………… 3,020,782 2,114,950 3,028,633 2,655,198 3,012,769 3,610,011 5,027,959 5,028,998 4,475,111 5,266,253 Education charges for services…………………………………… 2,369,749 2,659,911 3,121,007 2,818,158 3,513,800 3,162,642 2,470,566 2,510,203 2,459,870 2,655,716 Public works charges for services……………………………… 284,920 211,976 180,651 240,555 306,618 223,083 290,497 219,445 228,086 362,295 Human services charges for services…………………………… 100,925 70,773 75,112 80,369 89,766 81,383 87,016 89,229 82,846 89,029 Culture and recreation charges for services…………………… 34,252 29,661 370,952 402,375 485,279 486,367 522,688 158,078 202,821 41,098 Education operating grants and contributions………………… 22,124,192 23,309,595 23,215,449 23,526,928 25,222,895 17,013,758 21,612,290 23,972,703 24,242,803 25,948,686 Public safety operating grants and contributions……………… 1,353,465 1,453,062 2,441,255 2,098,724 2,129,478 2,463,648 3,040,055 2,369,718 1,509,031 3,158,946 General government operation grants and contributions……… 309,751 317,932 335,207 308,234 486,958 758,331 356,021 403,934 386,685 372,634 Community development operating grants and contributions… 82,921 214,547 134,293 108,268 28,017 14,610 49,149 78,172 113 35,502 Public works operating grants and contributions……………… 214,840 181,441 312,175 332,256 558,324 462,501 3,797,707 1,573,947 1,432,113 642,118 Human services operating grants and contributions…………… 261,073 311,680 263,489 286,716 399,376 499,761 610,059 666,717 627,008 483,814 Culture and recreation operating grants and contributions…… 141,680 149,943 108,427 273,551 108,800 293,939 231,659 359,184 159,945 399,736 Interest operating grants and contributions…………………… 1,097,034 454,314 429,020 395,266 354,578 317,536 283,685 248,308 210,771 170,647 Other operating grants and contributions……………………… - - - - 461 1,185 986 780 - - Education capital grants and contributions……………………… 23,850,249 9,056,163 3,250,708 129,991 176,967 638,931 6,912,160 19,134,749 17,053,087 2,897,057 Public works capital grants and contributions………………… 431,711 1,311,541 75,631 2,005,335 1,963,827 1,730,031 1,752,066 1,481,457 1,550,508 215,959 Culture and recreation capital grants and contributions……… - 559,513 - - - - 5,000 - - - Other capital grants and contributions…………………………… - - 17,593 248,510 283,132 27,953 199,270 804,417 231,468 425,393
Total government activities program revenues...…………………… 57,224,838 44,134,153 38,421,132 36,814,911 40,046,417 33,010,762 48,581,224 60,541,917 55,945,253 44,257,631
(Continued)
Last Ten Years
Changes in Net Position
City of Beverly, Massachusetts 125 Comprehensive Annual Financial Report
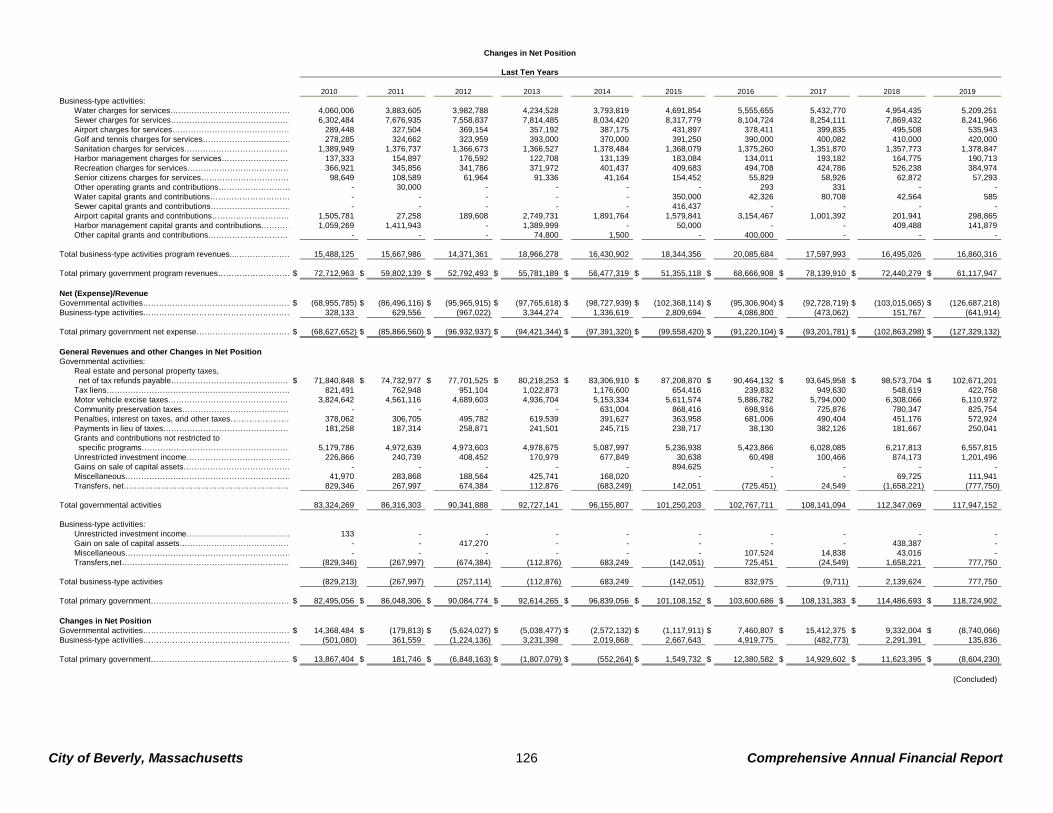
2010 2011 2012 2013 2014 2015 2016 2017 2018 2019
Last Ten Years
Changes in Net Position
Business-type activities:Water charges for services……………………………………… 4,060,006 3,883,605 3,982,788 4,234,528 3,793,819 4,691,854 5,555,655 5,432,770 4,954,435 5,209,251 Sewer charges for services……………………………………… 6,302,484 7,676,935 7,558,837 7,814,485 8,034,420 8,317,779 8,104,724 8,254,111 7,869,432 8,241,966 Airport charges for services……………………………………… 289,448 327,504 369,154 357,192 387,175 431,897 378,411 399,835 495,508 535,943 Golf and tennis charges for services…………………………… 278,285 324,662 323,959 393,000 370,000 391,250 390,000 400,082 410,000 420,000 Sanitation charges for services…………………………………… 1,389,949 1,376,737 1,366,673 1,366,527 1,378,484 1,368,079 1,375,260 1,351,870 1,357,773 1,378,847 Harbor management charges for services……………………… 137,333 154,897 176,592 122,708 131,139 183,084 134,011 193,182 164,775 190,713 Recreation charges for services………………………………… 366,921 345,856 341,786 371,972 401,437 409,683 494,708 424,786 526,238 384,974 Senior citizens charges for services…………………………… 98,649 108,589 61,964 91,336 41,164 154,452 55,829 58,926 62,872 57,293 Other operating grants and contributions……………………… - 30,000 - - - - 293 331 - - Water capital grants and contributions………………………… - - - - - 350,000 42,326 80,708 42,564 585 Sewer capital grants and contributions………………………… - - - - - 416,437 - - - - Airport capital grants and contributions………………………… 1,505,781 27,258 189,608 2,749,731 1,891,764 1,579,841 3,154,467 1,001,392 201,941 298,865 Harbor management capital grants and contributions………… 1,059,269 1,411,943 - 1,389,999 - 50,000 - - 409,488 141,879 Other capital grants and contributions…………………………… - - - 74,800 1,500 - 400,000 - - -
Total business-type activities program revenues...………………… 15,488,125 15,667,986 14,371,361 18,966,278 16,430,902 18,344,356 20,085,684 17,597,993 16,495,026 16,860,316
Total primary government program revenues……………………… $ 72,712,963 $ 59,802,139 $ 52,792,493 $ 55,781,189 $ 56,477,319 $ 51,355,118 $ 68,666,908 $ 78,139,910 $ 72,440,279 $ 61,117,947
Net (Expense)/RevenueGovernmental activities…………………………………………………$ (68,955,785) $ (86,496,116) $ (95,965,915) $ (97,765,618) $ (98,727,939) $ (102,368,114) $ (95,306,904) $ (92,728,719) $ (103,015,065) $ (126,687,218) Business-type activities………………………………………………… 328,133 629,556 (967,022) 3,344,274 1,336,619 2,809,694 4,086,800 (473,062) 151,767 (641,914)
Total primary government net expense………………………………$ (68,627,652) $ (85,866,560) $ (96,932,937) $ (94,421,344) $ (97,391,320) $ (99,558,420) $ (91,220,104) $ (93,201,781) $ (102,863,298) $ (127,329,132)
General Revenues and other Changes in Net PositionGovernmental activities:
Real estate and personal property taxes, net of tax refunds payable……………………………………… $ 71,840,848 $ 74,732,977 $ 77,701,525 $ 80,218,253 $ 83,306,910 $ 87,208,870 $ 90,464,132 $ 93,645,958 $ 98,573,704 $ 102,671,201 Tax liens…………………………………………………………… 821,491 762,948 951,104 1,022,873 1,176,600 654,416 239,832 949,630 548,619 422,758 Motor vehicle excise taxes………………………………………… 3,824,642 4,561,116 4,689,603 4,936,704 5,153,334 5,611,574 5,886,782 5,794,000 6,308,066 6,110,972 Community preservation taxes…………………………………… - - - - 631,004 868,416 698,916 725,876 780,347 825,754 Penalties, interest on taxes, and other taxes…………………… 378,062 306,705 495,782 619,539 391,627 363,958 681,006 490,404 451,176 572,924 Payments in lieu of taxes………………………………………… 181,258 187,314 258,871 241,501 245,715 238,717 38,130 382,126 181,667 250,041 Grants and contributions not restricted to specific programs………………………………………………… 5,179,786 4,972,639 4,973,603 4,978,675 5,087,997 5,236,938 5,423,866 6,028,085 6,217,813 6,557,815 Unrestricted investment income………………………………… 226,866 240,739 408,452 170,979 677,849 30,638 60,498 100,466 874,173 1,201,496 Gains on sale of capital assets…………………………………… - - - - - 894,625 - - - - Miscellaneous……………………………………………………… 41,970 283,868 188,564 425,741 168,020 - - - 69,725 111,941 Transfers, net……………………………………………………… 829,346 267,997 674,384 112,876 (683,249) 142,051 (725,451) 24,549 (1,658,221) (777,750)
Total governmental activities 83,324,269 86,316,303 90,341,888 92,727,141 96,155,807 101,250,203 102,767,711 108,141,094 112,347,069 117,947,152
Business-type activities:Unrestricted investment income………………………………… 133 - - - - - - - - - Gain on sale of capital assets…………………………………… - - 417,270 - - - - - 438,387 - Miscellaneous……………………………………………………… - - - - - - 107,524 14,838 43,016 - Transfers,net……………………………………………………… (829,346) (267,997) (674,384) (112,876) 683,249 (142,051) 725,451 (24,549) 1,658,221 777,750
Total business-type activities (829,213) (267,997) (257,114) (112,876) 683,249 (142,051) 832,975 (9,711) 2,139,624 777,750
Total primary government………………………………………………$ 82,495,056 $ 86,048,306 $ 90,084,774 $ 92,614,265 $ 96,839,056 $ 101,108,152 $ 103,600,686 $ 108,131,383 $ 114,486,693 $ 118,724,902
Changes in Net PositionGovernmental activities…………………………………………………$ 14,368,484 $ (179,813) $ (5,624,027) $ (5,038,477) $ (2,572,132) $ (1,117,911) $ 7,460,807 $ 15,412,375 $ 9,332,004 $ (8,740,066) Business-type activities………………………………………………… (501,080) 361,559 (1,224,136) 3,231,398 2,019,868 2,667,643 4,919,775 (482,773) 2,291,391 135,836
Total primary government………………………………………………$ 13,867,404 $ 181,746 $ (6,848,163) $ (1,807,079) $ (552,264) $ 1,549,732 $ 12,380,582 $ 14,929,602 $ 11,623,395 $ (8,604,230)
(Concluded)
City of Beverly, Massachusetts 126 Comprehensive Annual Financial Report
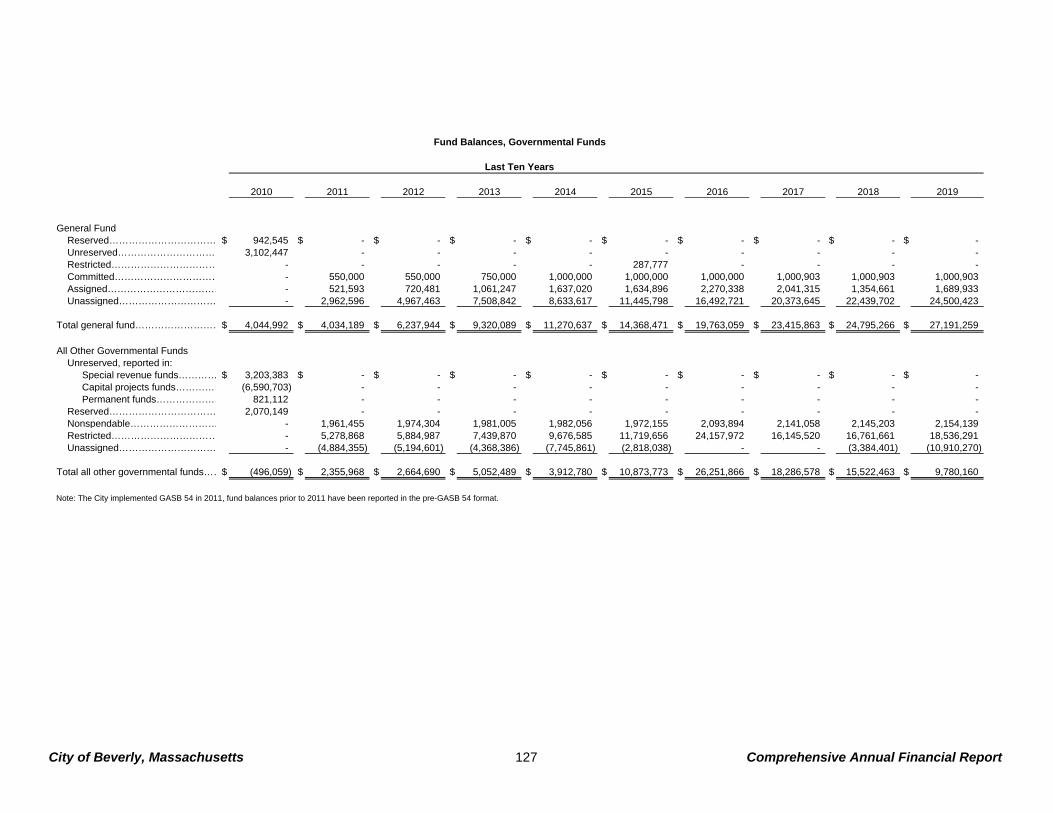
2010 2011 2012 2013 2014 2015 2016 2017 2018 2019
General FundReserved…………………………… $ 942,545 $ - $ - $ - $ - $ - $ - $ - $ - $ - Unreserved…………………………… 3,102,447 - - - - - - - - - Restricted…………………………… - - - - - 287,777 - - - - Committed…………………………… - 550,000 550,000 750,000 1,000,000 1,000,000 1,000,000 1,000,903 1,000,903 1,000,903 Assigned……………………………… - 521,593 720,481 1,061,247 1,637,020 1,634,896 2,270,338 2,041,315 1,354,661 1,689,933 Unassigned………………………… - 2,962,596 4,967,463 7,508,842 8,633,617 11,445,798 16,492,721 20,373,645 22,439,702 24,500,423
Total general fund………………………$ 4,044,992 $ 4,034,189 $ 6,237,944 $ 9,320,089 $ 11,270,637 $ 14,368,471 $ 19,763,059 $ 23,415,863 $ 24,795,266 $ 27,191,259
All Other Governmental FundsUnreserved, reported in:
Special revenue funds………… $ 3,203,383 $ - $ - $ - $ - $ - $ - $ - $ - $ - Capital projects funds…………… (6,590,703) - - - - - - - - - Permanent funds………………… 821,112 - - - - - - - - -
Reserved…………………………… 2,070,149 - - - - - - - - - Nonspendable……………………… - 1,961,455 1,974,304 1,981,005 1,982,056 1,972,155 2,093,894 2,141,058 2,145,203 2,154,139 Restricted…………………………… - 5,278,868 5,884,987 7,439,870 9,676,585 11,719,656 24,157,972 16,145,520 16,761,661 18,536,291 Unassigned………………………… - (4,884,355) (5,194,601) (4,368,386) (7,745,861) (2,818,038) - - (3,384,401) (10,910,270)
Total all other governmental funds……$ (496,059) $ 2,355,968 $ 2,664,690 $ 5,052,489 $ 3,912,780 $ 10,873,773 $ 26,251,866 $ 18,286,578 $ 15,522,463 $ 9,780,160
Note: The City implemented GASB 54 in 2011, fund balances prior to 2011 have been reported in the pre-GASB 54 format.
Last Ten Years
Fund Balances, Governmental Funds
City of Beverly, Massachusetts 127 Comprehensive Annual Financial Report
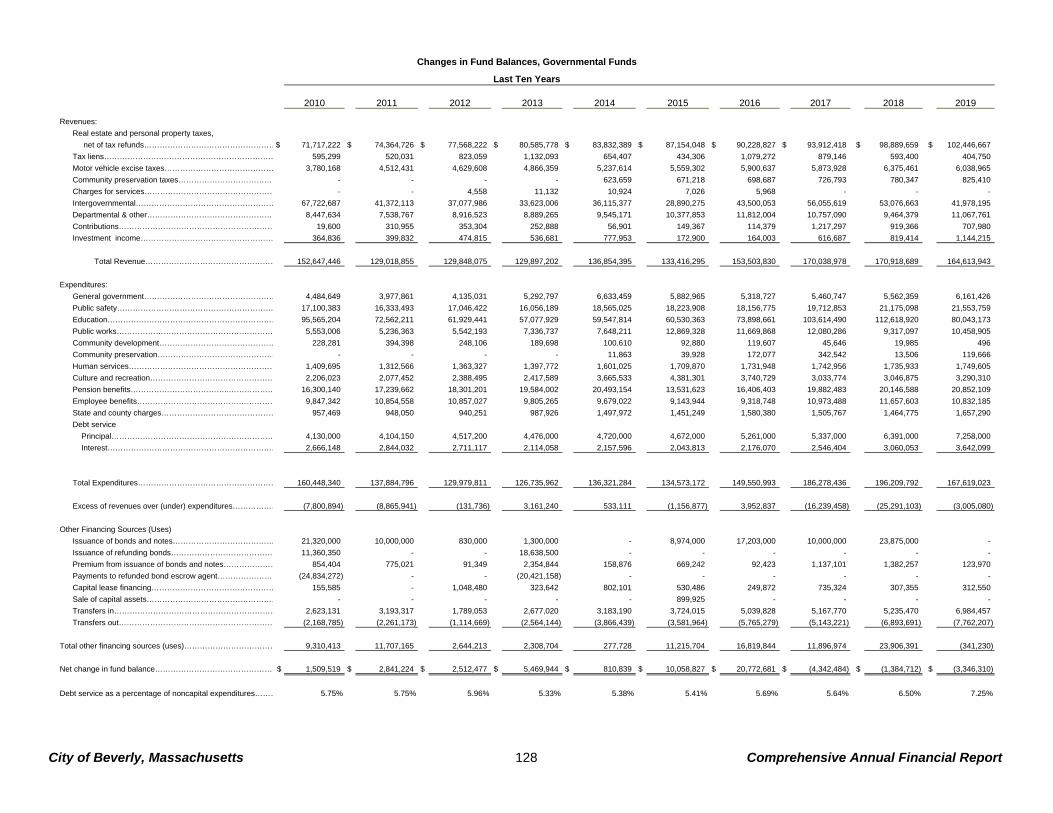
2010 2011 2012 2013 2014 2015 2016 2017 2018 2019
Revenues:
Real estate and personal property taxes,
net of tax refunds……………………………………………$ 71,717,222 $ 74,364,726 $ 77,568,222 $ 80,585,778 $ 83,832,389 $ 87,154,048 $ 90,228,827 $ 93,912,418 $ 98,889,659 $ 102,446,667
Tax liens………………………………………………………… 595,299 520,031 823,059 1,132,093 654,407 434,306 1,079,272 879,146 593,400 404,750
Motor vehicle excise taxes…………………………………… 3,780,168 4,512,431 4,629,608 4,866,359 5,237,614 5,559,302 5,900,637 5,873,928 6,375,461 6,038,965
Community preservation taxes……………………………… - - - - 623,659 671,218 698,687 726,793 780,347 825,410
Charges for services…………………………………………… - - 4,558 11,132 10,924 7,026 5,968 - - -
Intergovernmental……………………………………………… 67,722,687 41,372,113 37,077,986 33,623,006 36,115,377 28,890,275 43,500,053 56,055,619 53,076,663 41,978,195
Departmental & other………………………………………… 8,447,634 7,538,767 8,916,523 8,889,265 9,545,171 10,377,853 11,812,004 10,757,090 9,464,379 11,067,761
Contributions…………………………………………………… 19,600 310,955 353,304 252,888 56,901 149,367 114,379 1,217,297 919,366 707,980
Investment income…………………………………………… 364,836 399,832 474,815 536,681 777,953 172,900 164,003 616,687 819,414 1,144,215
Total Revenue…………………………………………… 152,647,446 129,018,855 129,848,075 129,897,202 136,854,395 133,416,295 153,503,830 170,038,978 170,918,689 164,613,943
Expenditures:
General government…………………………………………… 4,484,649 3,977,861 4,135,031 5,292,797 6,633,459 5,882,965 5,318,727 5,460,747 5,562,359 6,161,426
Public safety…………………………………………………… 17,100,383 16,333,493 17,046,422 16,056,189 18,565,025 18,223,908 18,156,775 19,712,853 21,175,098 21,553,759
Education………………………………………………………… 95,565,204 72,562,211 61,929,441 57,077,929 59,547,814 60,530,363 73,898,661 103,614,490 112,618,920 80,043,173
Public works…………………………………………………… 5,553,006 5,236,363 5,542,193 7,336,737 7,648,211 12,869,328 11,669,868 12,080,286 9,317,097 10,458,905
Community development……………………………………… 228,281 394,398 248,106 189,698 100,610 92,880 119,607 45,646 19,985 496
Community preservation……………………………………… - - - - 11,863 39,928 172,077 342,542 13,506 119,666
Human services………………………………………………… 1,409,695 1,312,566 1,363,327 1,397,772 1,601,025 1,709,870 1,731,948 1,742,956 1,735,933 1,749,605
Culture and recreation………………………………………… 2,206,023 2,077,452 2,388,495 2,417,589 3,665,533 4,381,301 3,740,729 3,033,774 3,046,875 3,290,310
Pension benefits………………………………..……………… 16,300,140 17,239,662 18,301,201 19,584,002 20,493,154 13,531,623 16,406,403 19,882,483 20,146,588 20,852,109
Employee benefits……………………………………………… 9,847,342 10,854,558 10,857,027 9,805,265 9,679,022 9,143,944 9,318,748 10,973,488 11,657,603 10,832,185
State and county charges……………………………………… 957,469 948,050 940,251 987,926 1,497,972 1,451,249 1,580,380 1,505,767 1,464,775 1,657,290
Debt service
Principal……………………………………………………… 4,130,000 4,104,150 4,517,200 4,476,000 4,720,000 4,672,000 5,261,000 5,337,000 6,391,000 7,258,000
Interest………………………………………………………… 2,666,148 2,844,032 2,711,117 2,114,058 2,157,596 2,043,813 2,176,070 2,546,404 3,060,053 3,642,099
Total Expenditures……………………………………………… 160,448,340 137,884,796 129,979,811 126,735,962 136,321,284 134,573,172 149,550,993 186,278,436 196,209,792 167,619,023
Excess of revenues over (under) expenditures……………… (7,800,894) (8,865,941) (131,736) 3,161,240 533,111 (1,156,877) 3,952,837 (16,239,458) (25,291,103) (3,005,080)
Other Financing Sources (Uses)
Issuance of bonds and notes………………………………… 21,320,000 10,000,000 830,000 1,300,000 - 8,974,000 17,203,000 10,000,000 23,875,000 -
Issuance of refunding bonds………………………………… 11,360,350 - - 18,638,500 - - - - - -
Premium from issuance of bonds and notes………………… 854,404 775,021 91,349 2,354,844 158,876 669,242 92,423 1,137,101 1,382,257 123,970
Payments to refunded bond escrow agent………………… (24,834,272) - - (20,421,158) - - - - - -
Capital lease financing………………………………………… 155,585 - 1,048,480 323,642 802,101 530,486 249,872 735,324 307,355 312,550
Sale of capital assets…………………………………………… - - - - - 899,925 - - - -
Transfers in……………………………………………………… 2,623,131 3,193,317 1,789,053 2,677,020 3,183,190 3,724,015 5,039,828 5,167,770 5,235,470 6,984,457
Transfers out…………………………………………………… (2,168,785) (2,261,173) (1,114,669) (2,564,144) (3,866,439) (3,581,964) (5,765,279) (5,143,221) (6,893,691) (7,762,207)
Total other financing sources (uses)……………………………… 9,310,413 11,707,165 2,644,213 2,308,704 277,728 11,215,704 16,819,844 11,896,974 23,906,391 (341,230)
Net change in fund balance……………………………………… $ 1,509,519 $ 2,841,224 $ 2,512,477 $ 5,469,944 $ 810,839 $ 10,058,827 $ 20,772,681 $ (4,342,484) $ (1,384,712) $ (3,346,310)
Debt service as a percentage of noncapital expenditures……… 5.75% 5.75% 5.96% 5.33% 5.38% 5.41% 5.69% 5.64% 6.50% 7.25%
Last Ten Years
Changes in Fund Balances, Governmental Funds
City of Beverly, Massachusetts 128 Comprehensive Annual Financial Report
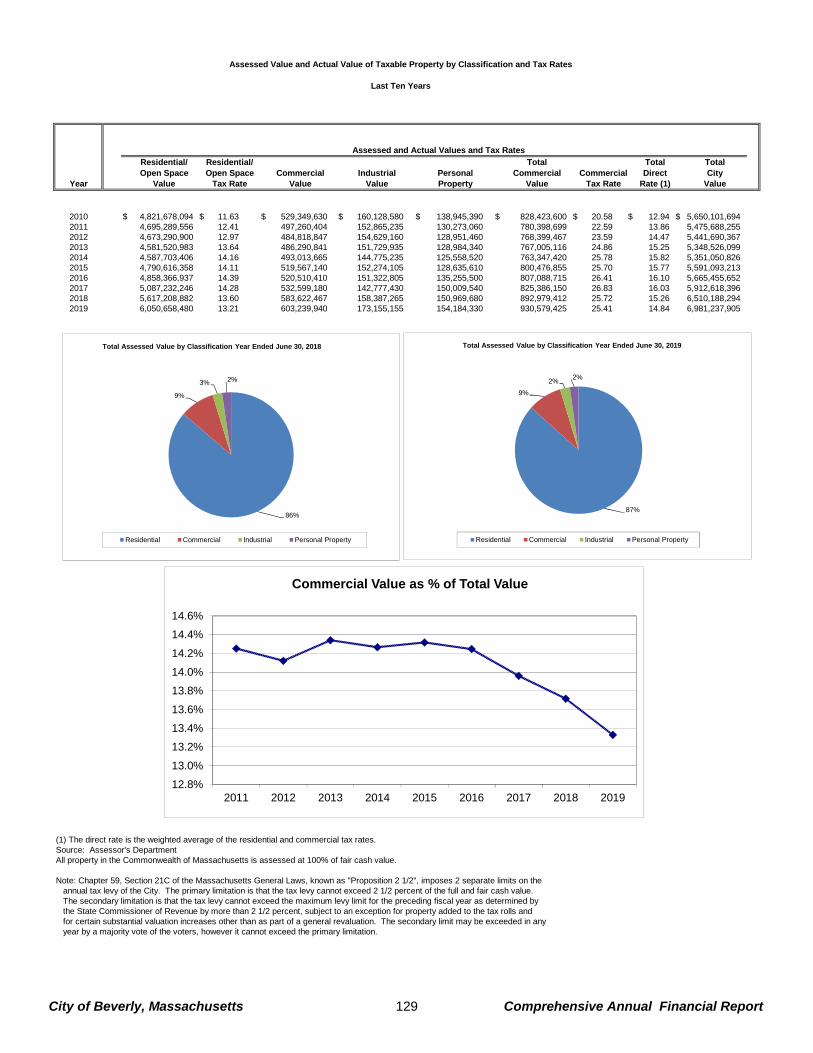
Assessed Value and Actual Value of Taxable Property by Classification and Tax Rates
Last Ten Years
Assessed and Actual Values and Tax Rates
Residential/ Residential/ Total Total TotalOpen Space Open Space Commercial Industrial Personal Commercial Commercial Direct City
Year Value Tax Rate Value Value Property Value Tax Rate Rate (1) Value
2010 $ 4,821,678,094 $ 11.63 $ 529,349,630 $ 160,128,580 $ 138,945,390 $ 828,423,600 $ 20.58 $ 12.94 $ 5,650,101,6942011 4,695,289,556 12.41 497,260,404 152,865,235 130,273,060 780,398,699 22.59 13.86 5,475,688,2552012 4,673,290,900 12.97 484,818,847 154,629,160 128,951,460 768,399,467 23.59 14.47 5,441,690,3672013 4,581,520,983 13.64 486,290,841 151,729,935 128,984,340 767,005,116 24.86 15.25 5,348,526,0992014 4,587,703,406 14.16 493,013,665 144,775,235 125,558,520 763,347,420 25.78 15.82 5,351,050,8262015 4,790,616,358 14.11 519,567,140 152,274,105 128,635,610 800,476,855 25.70 15.77 5,591,093,2132016 4,858,366,937 14.39 520,510,410 151,322,805 135,255,500 807,088,715 26.41 16.10 5,665,455,6522017 5,087,232,246 14.28 532,599,180 142,777,430 150,009,540 825,386,150 26.83 16.03 5,912,618,3962018 5,617,208,882 13.60 583,622,467 158,387,265 150,969,680 892,979,412 25.72 15.26 6,510,188,2942019 6,050,658,480 13.21 603,239,940 173,155,155 154,184,330 930,579,425 25.41 14.84 6,981,237,905
(1) The direct rate is the weighted average of the residential and commercial tax rates.Source: Assessor's DepartmentAll property in the Commonwealth of Massachusetts is assessed at 100% of fair cash value.
Note: Chapter 59, Section 21C of the Massachusetts General Laws, known as "Proposition 2 1/2", imposes 2 separate limits on the annual tax levy of the City. The primary limitation is that the tax levy cannot exceed 2 1/2 percent of the full and fair cash value. The secondary limitation is that the tax levy cannot exceed the maximum levy limit for the preceding fiscal year as determined by the State Commissioner of Revenue by more than 2 1/2 percent, subject to an exception for property added to the tax rolls and for certain substantial valuation increases other than as part of a general revaluation. The secondary limit may be exceeded in any year by a majority vote of the voters, however it cannot exceed the primary limitation.
12.8%
13.0%
13.2%
13.4%
13.6%
13.8%
14.0%
14.2%
14.4%
14.6%
2011 2012 2013 2014 2015 2016 2017 2018 2019
Commercial Value as % of Total Value
87%
9%
2%2%
Total Assessed Value by Classification Year Ended June 30, 2019
Residential Commercial Industrial Personal Property
86%
9%
3% 2%
Total Assessed Value by Classification Year Ended June 30, 2018
Residential Commercial Industrial Personal Property
City of Beverly, Massachusetts 129 Comprehensive Annual Financial Report
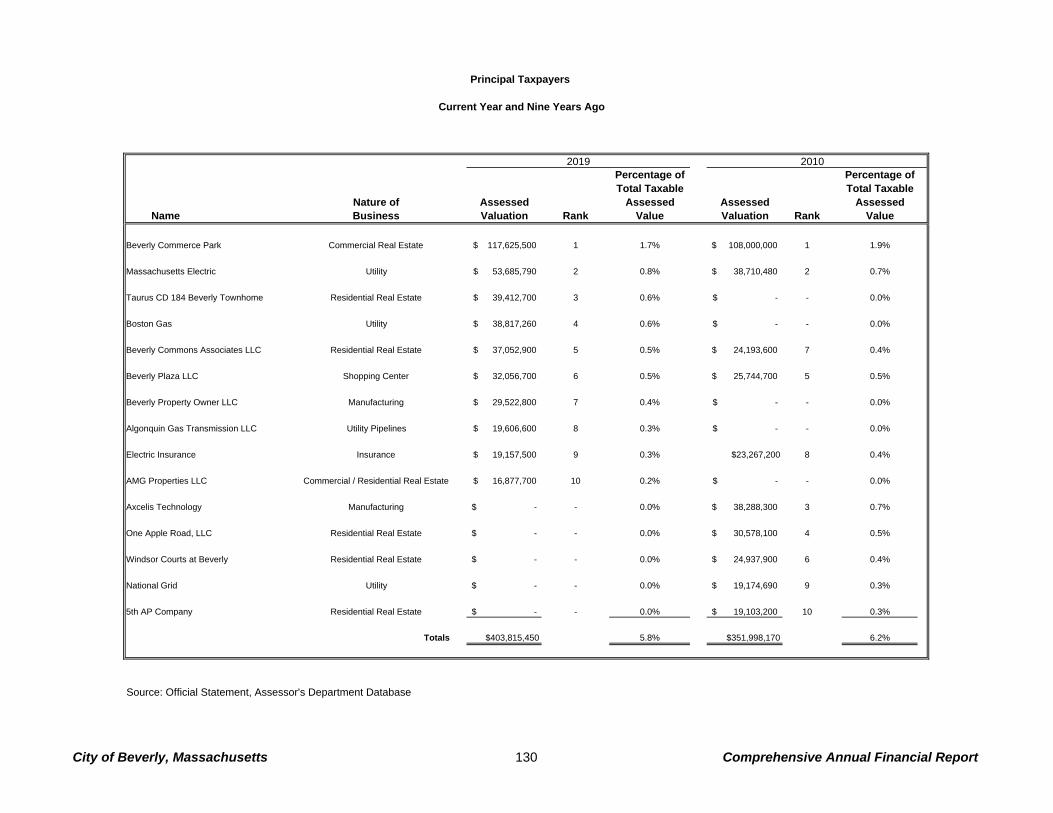
Principal Taxpayers
Current Year and Nine Years Ago
Percentage of Percentage ofTotal Taxable Total Taxable
Nature of Assessed Assessed Assessed AssessedName Business Valuation Rank Value Valuation Rank Value
Beverly Commerce Park Commercial Real Estate 117,625,500$ 1 1.7% 108,000,000$ 1 1.9%
Massachusetts Electric Utility 53,685,790$ 2 0.8% 38,710,480$ 2 0.7%
Taurus CD 184 Beverly Townhome Residential Real Estate 39,412,700$ 3 0.6% -$ - 0.0%
Boston Gas Utility 38,817,260$ 4 0.6% -$ - 0.0%
Beverly Commons Associates LLC Residential Real Estate 37,052,900$ 5 0.5% 24,193,600$ 7 0.4%
Beverly Plaza LLC Shopping Center 32,056,700$ 6 0.5% 25,744,700$ 5 0.5%
Beverly Property Owner LLC Manufacturing 29,522,800$ 7 0.4% -$ - 0.0%
Algonquin Gas Transmission LLC Utility Pipelines 19,606,600$ 8 0.3% -$ - 0.0%
Electric Insurance Insurance 19,157,500$ 9 0.3% $23,267,200 8 0.4%
AMG Properties LLC Commercial / Residential Real Estate 16,877,700$ 10 0.2% -$ - 0.0%
Axcelis Technology Manufacturing -$ - 0.0% 38,288,300$ 3 0.7%
One Apple Road, LLC Residential Real Estate -$ - 0.0% 30,578,100$ 4 0.5%
Windsor Courts at Beverly Residential Real Estate -$ - 0.0% 24,937,900$ 6 0.4%
National Grid Utility -$ - 0.0% 19,174,690$ 9 0.3%
5th AP Company Residential Real Estate -$ - 0.0% 19,103,200$ 10 0.3%
Totals $403,815,450 5.8% $351,998,170 6.2%
Source: Official Statement, Assessor's Department Database
2019 2010
City of Beverly, Massachusetts 130 Comprehensive Annual Financial Report
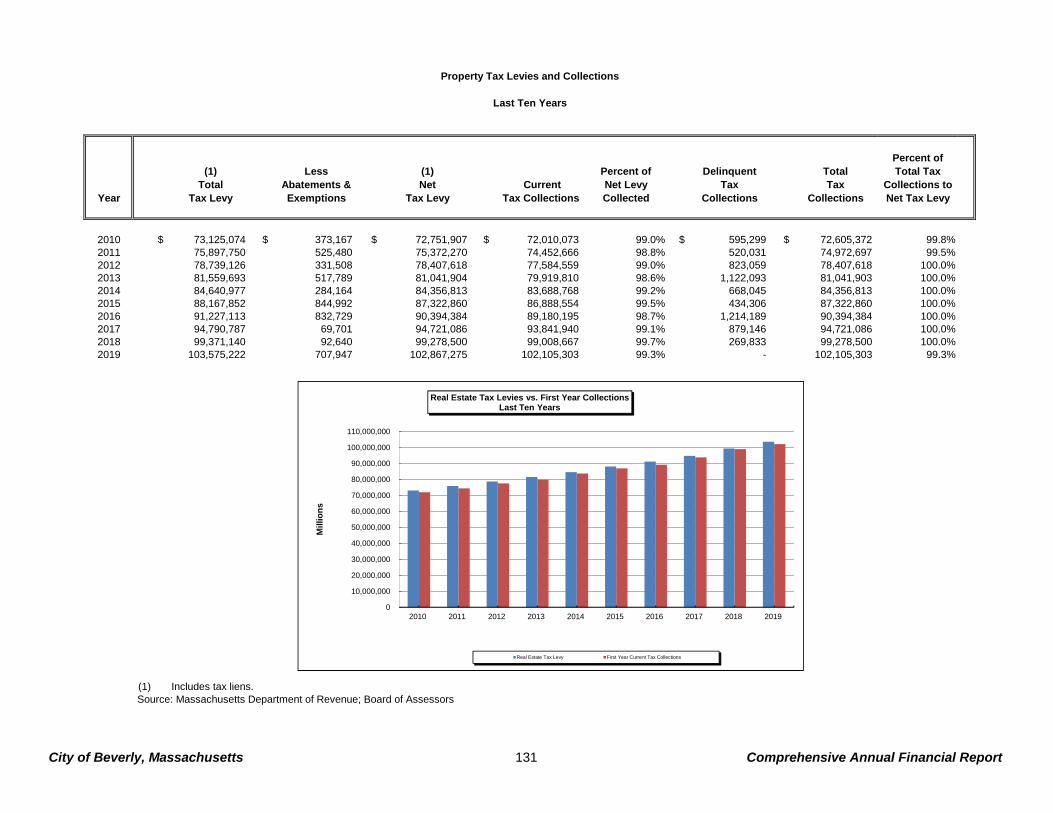
Percent of(1) Less (1) Percent of Delinquent Total Total Tax
Total Abatements & Net Current Net Levy Tax Tax Collections toYear Tax Levy Exemptions Tax Levy Tax Collections Collected Collections Collections Net Tax Levy
2010 $ 73,125,074 $ 373,167 $ 72,751,907 $ 72,010,073 99.0% $ 595,299 $ 72,605,372 99.8%2011 75,897,750 525,480 75,372,270 74,452,666 98.8% 520,031 74,972,697 99.5%2012 78,739,126 331,508 78,407,618 77,584,559 99.0% 823,059 78,407,618 100.0%2013 81,559,693 517,789 81,041,904 79,919,810 98.6% 1,122,093 81,041,903 100.0%2014 84,640,977 284,164 84,356,813 83,688,768 99.2% 668,045 84,356,813 100.0%2015 88,167,852 844,992 87,322,860 86,888,554 99.5% 434,306 87,322,860 100.0%2016 91,227,113 832,729 90,394,384 89,180,195 98.7% 1,214,189 90,394,384 100.0%2017 94,790,787 69,701 94,721,086 93,841,940 99.1% 879,146 94,721,086 100.0%2018 99,371,140 92,640 99,278,500 99,008,667 99.7% 269,833 99,278,500 100.0%2019 103,575,222 707,947 102,867,275 102,105,303 99.3% - 102,105,303 99.3%
(1) Includes tax liens. Source: Massachusetts Department of Revenue; Board of Assessors
Property Tax Levies and Collections
Last Ten Years
0
10,000,000
20,000,000
30,000,000
40,000,000
50,000,000
60,000,000
70,000,000
80,000,000
90,000,000
100,000,000
110,000,000
2010 2011 2012 2013 2014 2015 2016 2017 2018 2019
Mill
ion
s
Real Estate Tax Levies vs. First Year CollectionsLast Ten Years
Real Estate Tax Levy First Year Current Tax Collections
City of Beverly, Massachusetts 131 Comprehensive Annual Financial Report
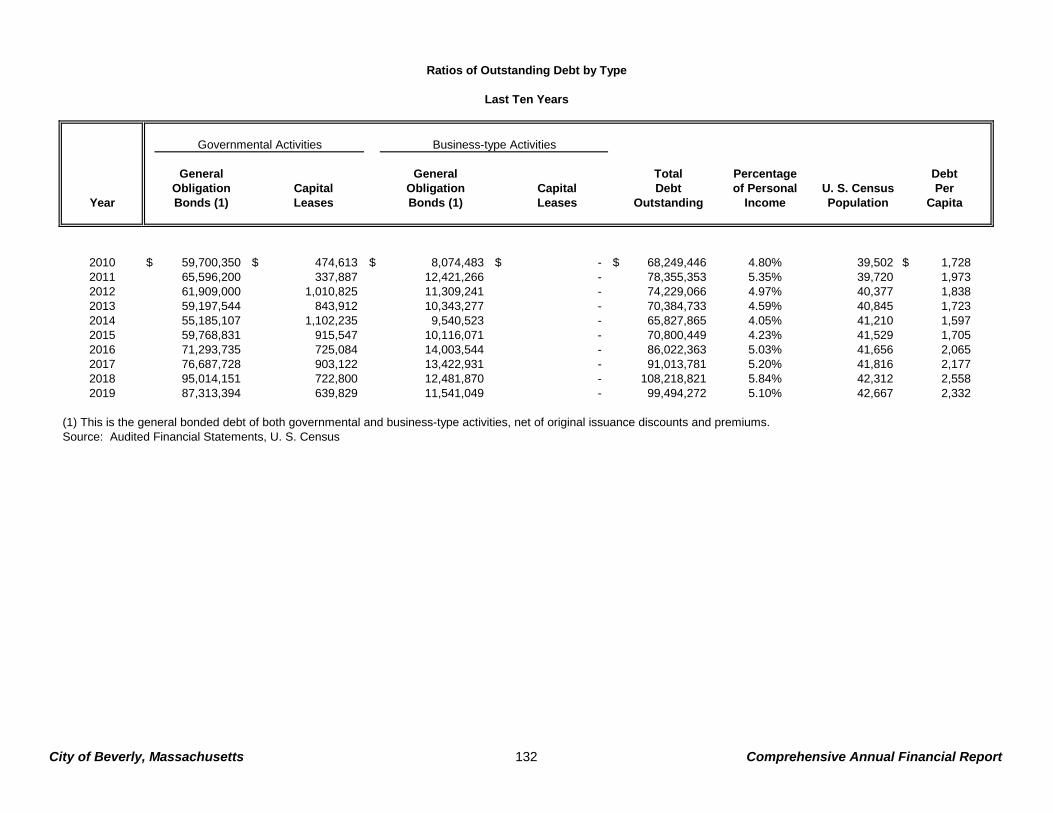
General General Total Percentage DebtObligation Capital Obligation Capital Debt of Personal U. S. Census Per
Year Bonds (1) Leases Bonds (1) Leases Outstanding Income Population Capita
2010 $ 59,700,350 $ 474,613 $ 8,074,483 $ - $ 68,249,446 4.80% 39,502 $ 1,728 2011 65,596,200 337,887 12,421,266 - 78,355,353 5.35% 39,720 1,973 2012 61,909,000 1,010,825 11,309,241 - 74,229,066 4.97% 40,377 1,838 2013 59,197,544 843,912 10,343,277 - 70,384,733 4.59% 40,845 1,723 2014 55,185,107 1,102,235 9,540,523 - 65,827,865 4.05% 41,210 1,597 2015 59,768,831 915,547 10,116,071 - 70,800,449 4.23% 41,529 1,705 2016 71,293,735 725,084 14,003,544 - 86,022,363 5.03% 41,656 2,065 2017 76,687,728 903,122 13,422,931 - 91,013,781 5.20% 41,816 2,177 2018 95,014,151 722,800 12,481,870 - 108,218,821 5.84% 42,312 2,558 2019 87,313,394 639,829 11,541,049 - 99,494,272 5.10% 42,667 2,332
(1) This is the general bonded debt of both governmental and business-type activities, net of original issuance discounts and premiums.Source: Audited Financial Statements, U. S. Census
Ratios of Outstanding Debt by Type
Last Ten Years
Governmental Activities Business-type Activities
City of Beverly, Massachusetts 132 Comprehensive Annual Financial Report

General General Total Percentage DebtObligation Capital Obligation Capital Debt of Personal U. S. Census Per
Year Bonds (1) Leases Bonds (1) Leases Outstanding Income Population Capita
2010 $ 59,700,350 $ 474,613 $ 8,074,483 $ - $ 68,249,446 4.80% 39,502 $ 1,728 2011 65,596,200 337,887 12,421,266 - 78,355,353 5.35% 39,720 1,973 2012 61,909,000 1,010,825 11,309,241 - 74,229,066 4.97% 40,377 1,838 2013 59,197,544 843,912 10,343,277 - 70,384,733 4.59% 40,845 1,723 2014 55,185,107 1,102,235 9,540,523 - 65,827,865 4.05% 41,210 1,597 2015 59,768,831 915,547 10,116,071 - 70,800,449 4.23% 41,529 1,705 2016 71,293,735 725,084 14,003,544 - 86,022,363 5.03% 41,656 2,065 2017 76,687,728 903,122 13,422,931 - 91,013,781 5.20% 41,816 2,177 2018 95,014,151 722,800 12,481,870 - 108,218,821 5.84% 42,312 2,558 2019 87,313,394 639,829 11,541,049 - 99,494,272 5.10% 42,667 2,332
(1) This is the general bonded debt of both governmental and business-type activities, net of original issuance discounts and premiums.Source: Audited Financial Statements, U. S. Census
Ratios of Outstanding Debt by Type
Last Ten Years
Governmental Activities Business-type Activities
City of Beverly, Massachusetts 133 Comprehensive Annual Financial Report
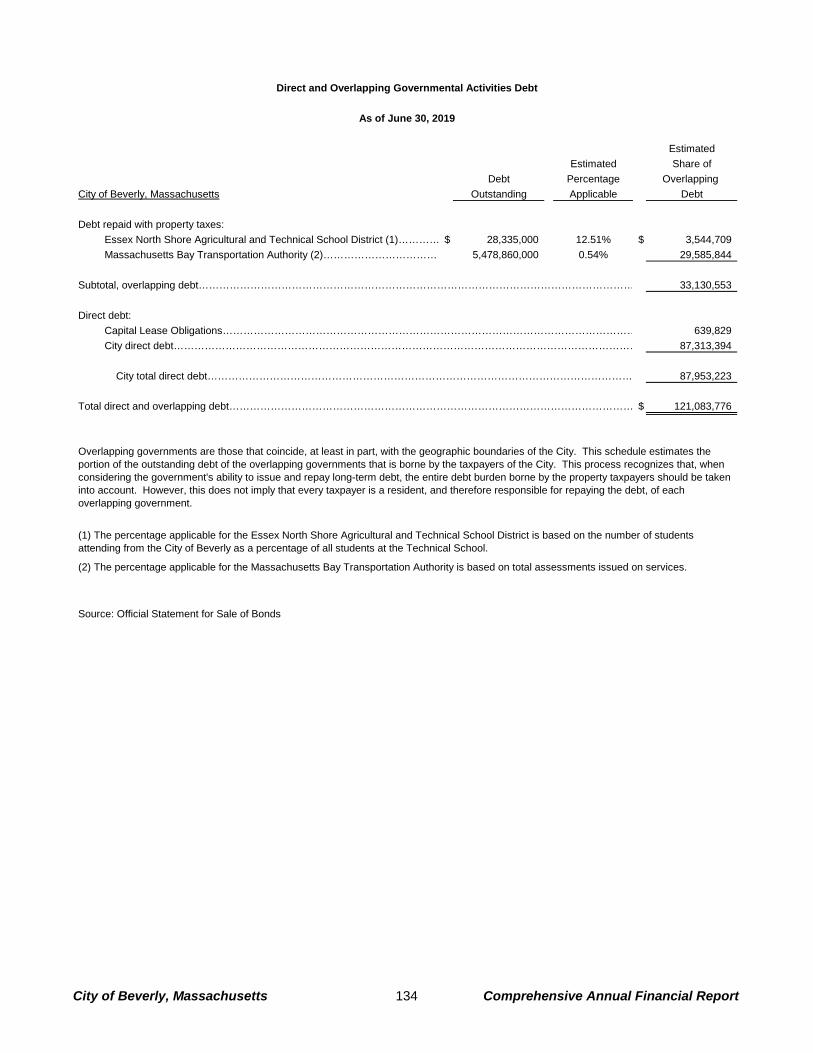
Direct and Overlapping Governmental Activities Debt
As of June 30, 2019
Estimated
Estimated Share of
Debt Percentage Overlapping
City of Beverly, Massachusetts Outstanding Applicable Debt
Debt repaid with property taxes:
Essex North Shore Agricultural and Technical School District (1)………… $ 28,335,000 12.51% $ 3,544,709
Massachusetts Bay Transportation Authority (2)……………………………… 5,478,860,000 0.54% 29,585,844
Subtotal, overlapping debt……………………………………………………………………………………………………………… 33,130,553
Direct debt:
Capital Lease Obligations………………………………………………………………………………………………………… 639,829
City direct debt……………………………………………………………………………………………………………………… 87,313,394
City total direct debt…………………………………………………………………………………………………………… 87,953,223
Total direct and overlapping debt……………………………………………………………………………………………………… $ 121,083,776
Source: Official Statement for Sale of Bonds
Overlapping governments are those that coincide, at least in part, with the geographic boundaries of the City. This schedule estimates the portion of the outstanding debt of the overlapping governments that is borne by the taxpayers of the City. This process recognizes that, when considering the government's ability to issue and repay long-term debt, the entire debt burden borne by the property taxpayers should be taken into account. However, this does not imply that every taxpayer is a resident, and therefore responsible for repaying the debt, of each overlapping government.
(1) The percentage applicable for the Essex North Shore Agricultural and Technical School District is based on the number of students attending from the City of Beverly as a percentage of all students at the Technical School.
(2) The percentage applicable for the Massachusetts Bay Transportation Authority is based on total assessments issued on services.
City of Beverly, Massachusetts 134 Comprehensive Annual Financial Report
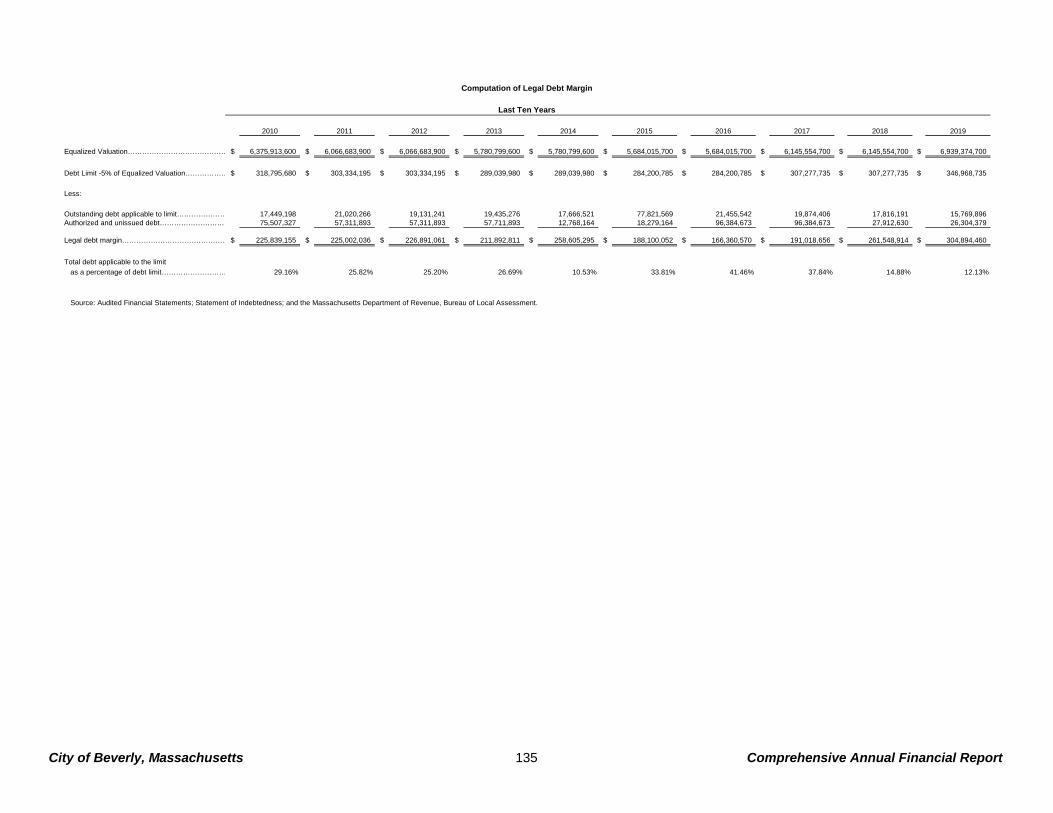
2010 2011 2012 2013 2014 2015 2016 2017 2018 2019
Equalized Valuation…………………………………… $ 6,375,913,600 $ 6,066,683,900 $ 6,066,683,900 $ 5,780,799,600 $ 5,780,799,600 $ 5,684,015,700 $ 5,684,015,700 $ 6,145,554,700 $ 6,145,554,700 $ 6,939,374,700
Debt Limit -5% of Equalized Valuation……………… $ 318,795,680 $ 303,334,195 $ 303,334,195 $ 289,039,980 $ 289,039,980 $ 284,200,785 $ 284,200,785 $ 307,277,735 $ 307,277,735 $ 346,968,735
Less:
Outstanding debt applicable to limit………………… 17,449,198 21,020,266 19,131,241 19,435,276 17,666,521 77,821,569 21,455,542 19,874,406 17,816,191 15,769,896 Authorized and unissued debt……………………… 75,507,327 57,311,893 57,311,893 57,711,893 12,768,164 18,279,164 96,384,673 96,384,673 27,912,630 26,304,379
Legal debt margin………………………………………$ 225,839,155 $ 225,002,036 $ 226,891,061 $ 211,892,811 $ 258,605,295 $ 188,100,052 $ 166,360,570 $ 191,018,656 $ 261,548,914 $ 304,894,460
Total debt applicable to the limit
as a percentage of debt limit……………………… 29.16% 25.82% 25.20% 26.69% 10.53% 33.81% 41.46% 37.84% 14.88% 12.13%
Source: Audited Financial Statements; Statement of Indebtedness; and the Massachusetts Department of Revenue, Bureau of Local Assessment.
Computation of Legal Debt Margin
Last Ten Years
City of Beverly, Massachusetts 135 Comprehensive Annual Financial Report
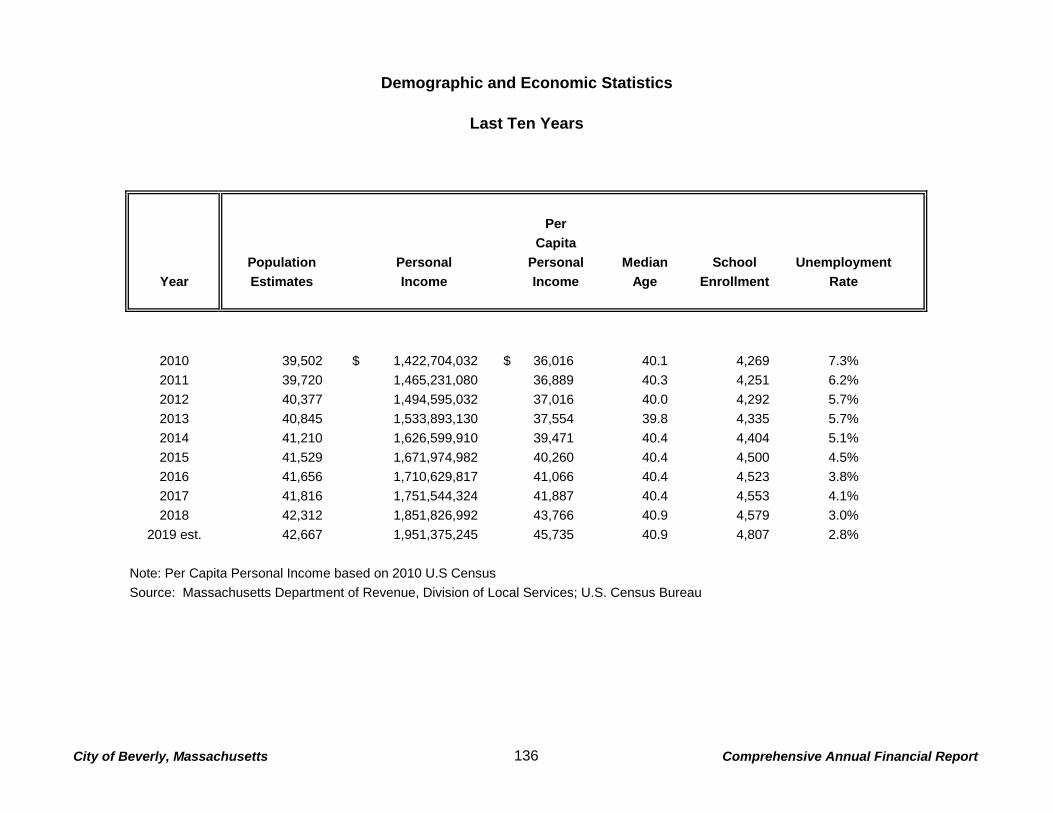
Demographic and Economic Statistics
Last Ten Years
Per
Capita
Population Personal Personal Median School Unemployment
Year Estimates Income Income Age Enrollment Rate
2010 39,502 $ 1,422,704,032 $ 36,016 40.1 4,269 7.3%
2011 39,720 1,465,231,080 36,889 40.3 4,251 6.2%
2012 40,377 1,494,595,032 37,016 40.0 4,292 5.7%
2013 40,845 1,533,893,130 37,554 39.8 4,335 5.7%
2014 41,210 1,626,599,910 39,471 40.4 4,404 5.1%
2015 41,529 1,671,974,982 40,260 40.4 4,500 4.5%
2016 41,656 1,710,629,817 41,066 40.4 4,523 3.8%
2017 41,816 1,751,544,324 41,887 40.4 4,553 4.1%
2018 42,312 1,851,826,992 43,766 40.9 4,579 3.0%
2019 est. 42,667 1,951,375,245 45,735 40.9 4,807 2.8%
Note: Per Capita Personal Income based on 2010 U.S Census
Source: Massachusetts Department of Revenue, Division of Local Services; U.S. Census Bureau
City of Beverly, Massachusetts 136 Comprehensive Annual Financial Report
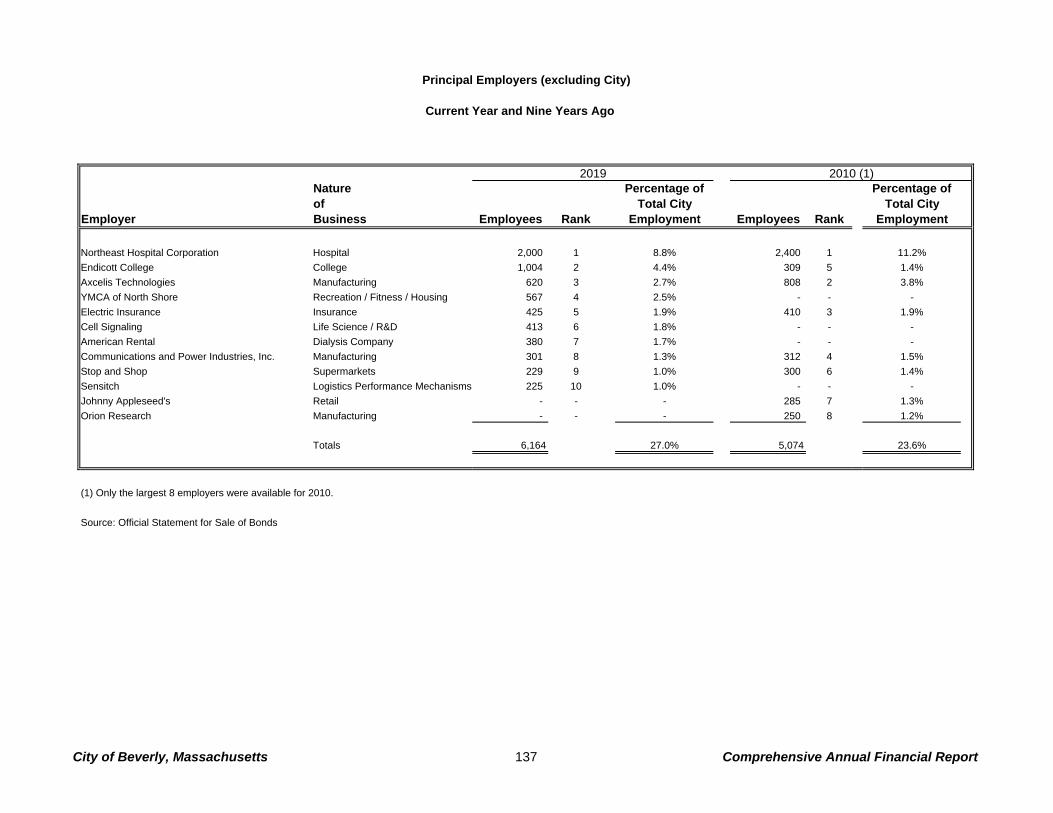
Current Year and Nine Years Ago
Nature Percentage of Percentage ofof Total City Total CityBusiness Employees Rank Employment Employees Rank Employment
Northeast Hospital Corporation Hospital 2,000 1 8.8% 2,400 1 11.2%
Endicott College College 1,004 2 4.4% 309 5 1.4%
Axcelis Technologies Manufacturing 620 3 2.7% 808 2 3.8%
YMCA of North Shore Recreation / Fitness / Housing 567 4 2.5% - - -
Electric Insurance Insurance 425 5 1.9% 410 3 1.9%
Cell Signaling Life Science / R&D 413 6 1.8% - - -
American Rental Dialysis Company 380 7 1.7% - - -
Communications and Power Industries, Inc. Manufacturing 301 8 1.3% 312 4 1.5%
Stop and Shop Supermarkets 229 9 1.0% 300 6 1.4%
Sensitch Logistics Performance Mechanisms 225 10 1.0% - - -
Johnny Appleseed's Retail - - - 285 7 1.3%
Orion Research Manufacturing - - - 250 8 1.2%
Totals 6,164 27.0% 5,074 23.6%
(1) Only the largest 8 employers were available for 2010.
Source: Official Statement for Sale of Bonds
Principal Employers (excluding City)
2019 2010 (1)
Employer
City of Beverly, Massachusetts 137 Comprehensive Annual Financial Report
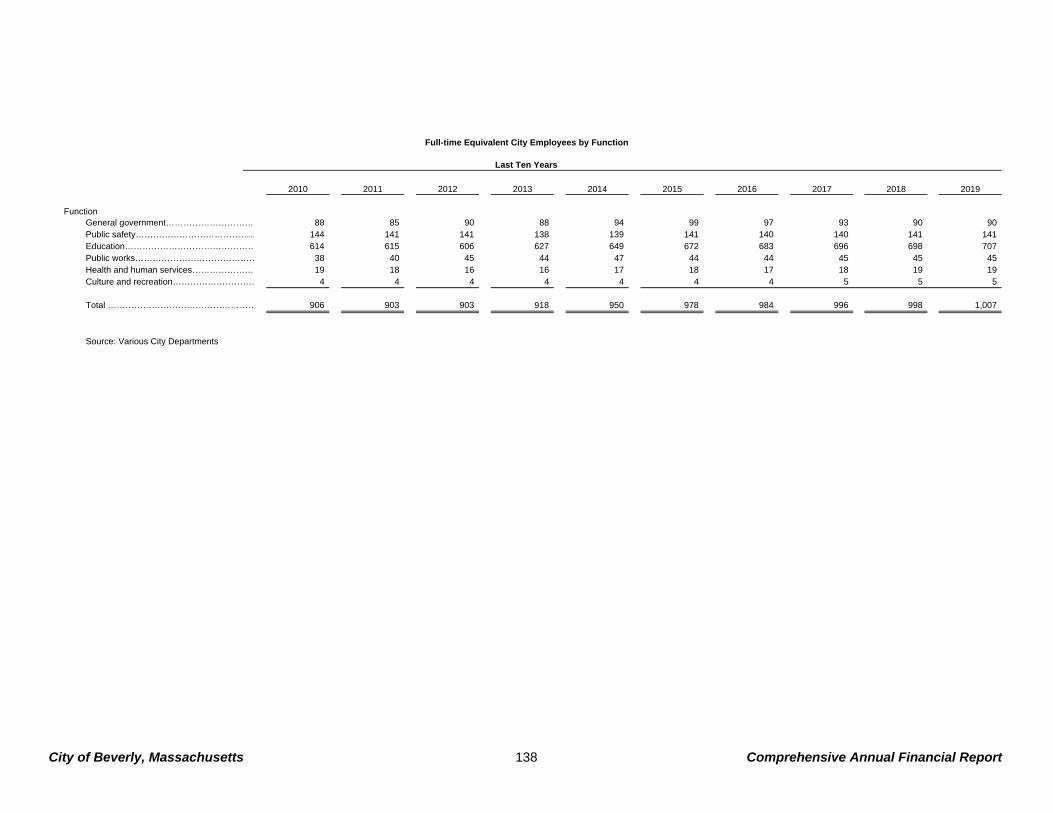
2010 2011 2012 2013 2014 2015 2016 2017 2018 2019
FunctionGeneral government………………………… 88 85 90 88 94 99 97 93 90 90 Public safety…………………………………… 144 141 141 138 139 141 140 140 141 141 Education……………………………………… 614 615 606 627 649 672 683 696 698 707 Public works…………………………………… 38 40 45 44 47 44 44 45 45 45 Health and human services………………… 19 18 16 16 17 18 17 18 19 19 Culture and recreation………………………… 4 4 4 4 4 4 4 5 5 5
Total …………………………………………… 906 903 903 918 950 978 984 996 998 1,007
Source: Various City Departments
Full-time Equivalent City Employees by Function
Last Ten Years
City of Beverly, Massachusetts 138 Comprehensive Annual Financial Report
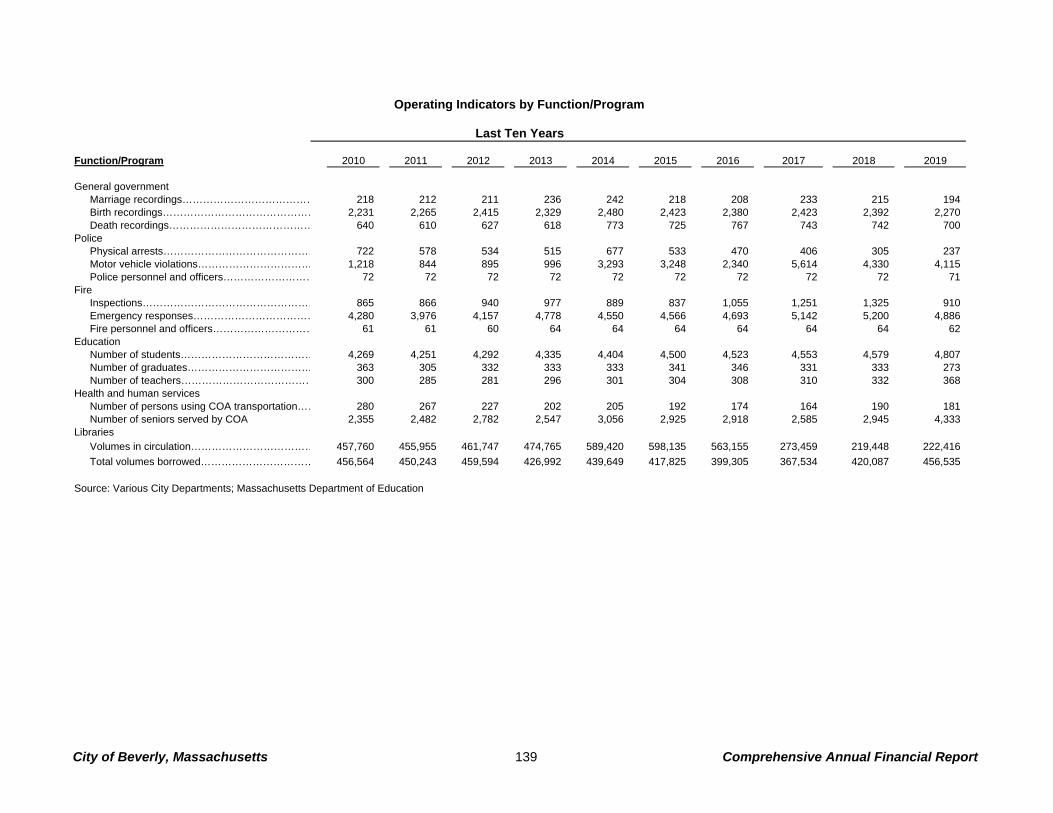
Function/Program 2010 2011 2012 2013 2014 2015 2016 2017 2018 2019
General governmentMarriage recordings………………………………… 218 212 211 236 242 218 208 233 215 194 Birth recordings……………………………………… 2,231 2,265 2,415 2,329 2,480 2,423 2,380 2,423 2,392 2,270 Death recordings…………………………………… 640 610 627 618 773 725 767 743 742 700
PolicePhysical arrests……………………………………… 722 578 534 515 677 533 470 406 305 237 Motor vehicle violations…………………………… 1,218 844 895 996 3,293 3,248 2,340 5,614 4,330 4,115 Police personnel and officers……………………… 72 72 72 72 72 72 72 72 72 71
FireInspections…………………………………………… 865 866 940 977 889 837 1,055 1,251 1,325 910 Emergency responses……………………………… 4,280 3,976 4,157 4,778 4,550 4,566 4,693 5,142 5,200 4,886 Fire personnel and officers………………………… 61 61 60 64 64 64 64 64 64 62
EducationNumber of students………………………………… 4,269 4,251 4,292 4,335 4,404 4,500 4,523 4,553 4,579 4,807 Number of graduates……………………………… 363 305 332 333 333 341 346 331 333 273 Number of teachers………………………………… 300 285 281 296 301 304 308 310 332 368
Health and human servicesNumber of persons using COA transportation…… 280 267 227 202 205 192 174 164 190 181 Number of seniors served by COA 2,355 2,482 2,782 2,547 3,056 2,925 2,918 2,585 2,945 4,333
LibrariesVolumes in circulation……………………………… 457,760 455,955 461,747 474,765 589,420 598,135 563,155 273,459 219,448 222,416
Total volumes borrowed…………………………… 456,564 450,243 459,594 426,992 439,649 417,825 399,305 367,534 420,087 456,535
Source: Various City Departments; Massachusetts Department of Education
Operating Indicators by Function/Program
Last Ten Years
City of Beverly, Massachusetts 139 Comprehensive Annual Financial Report
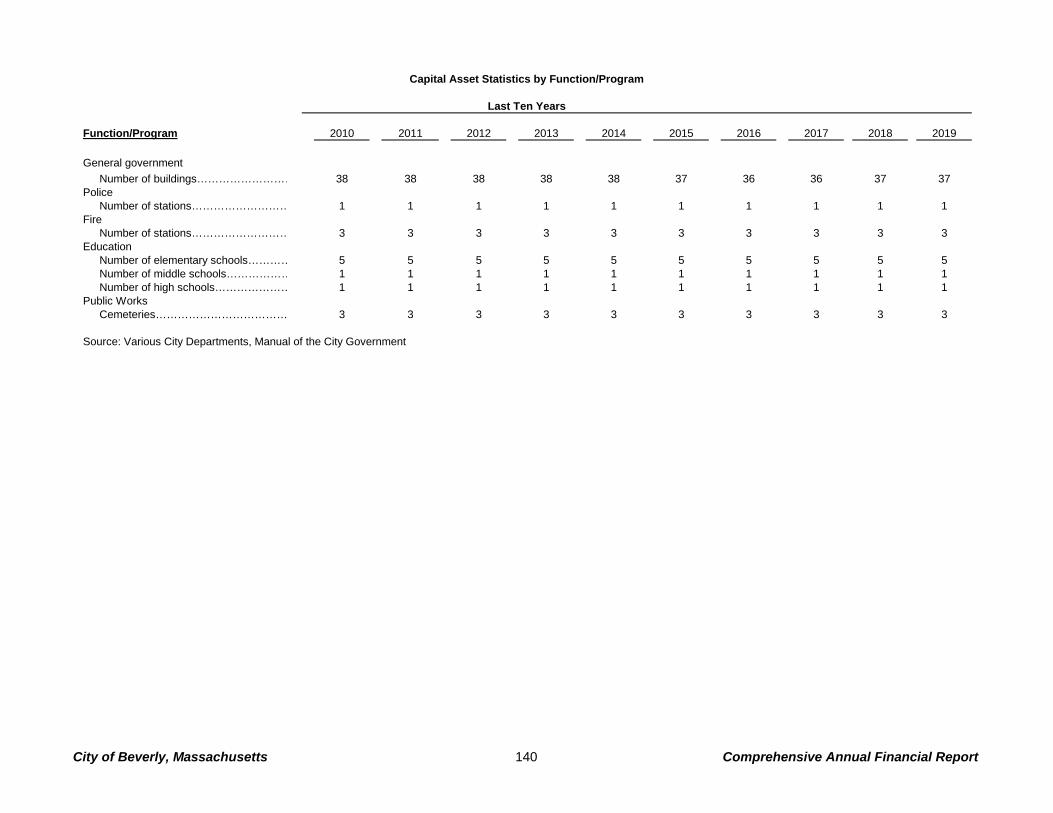
Function/Program 2010 2011 2012 2013 2014 2015 2016 2017 2018 2019
General government
Number of buildings……………………… 38 38 38 38 38 37 36 36 37 37Police
Number of stations……………………… 1 1 1 1 1 1 1 1 1 1Fire
Number of stations……………………… 3 3 3 3 3 3 3 3 3 3Education
Number of elementary schools………… 5 5 5 5 5 5 5 5 5 5Number of middle schools……………… 1 1 1 1 1 1 1 1 1 1Number of high schools………………… 1 1 1 1 1 1 1 1 1 1
Public WorksCemeteries……………………………… 3 3 3 3 3 3 3 3 3 3
Source: Various City Departments, Manual of the City Government
Capital Asset Statistics by Function/Program
Last Ten Years
City of Beverly, Massachusetts 140 Comprehensive Annual Financial Report
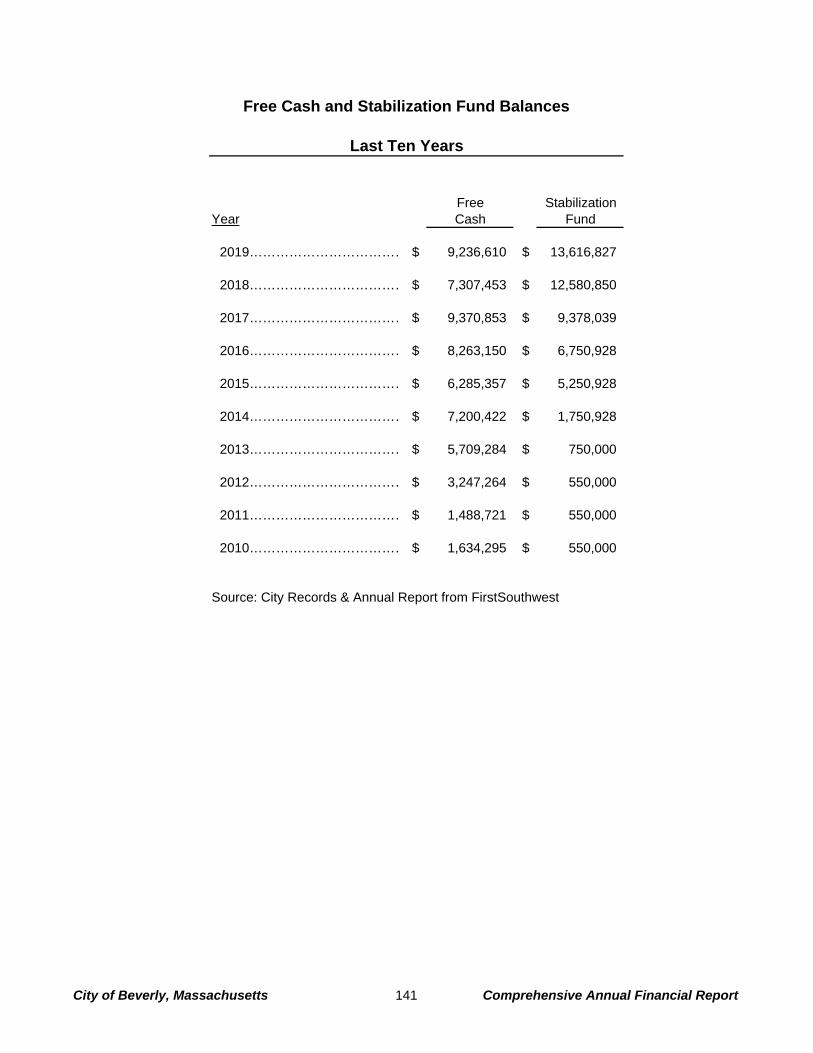
Free StabilizationYear Cash Fund
2019……………………………… $ 9,236,610 $ 13,616,827
2018……………………………… $ 7,307,453 $ 12,580,850
2017……………………………… $ 9,370,853 $ 9,378,039
2016……………………………… $ 8,263,150 $ 6,750,928
2015……………………………… $ 6,285,357 $ 5,250,928
2014……………………………… $ 7,200,422 $ 1,750,928
2013……………………………… $ 5,709,284 $ 750,000
2012……………………………… $ 3,247,264 $ 550,000
2011……………………………… $ 1,488,721 $ 550,000
2010……………………………… $ 1,634,295 $ 550,000
Source: City Records & Annual Report from FirstSouthwest
Free Cash and Stabilization Fund Balances
Last Ten Years
City of Beverly, Massachusetts 141 Comprehensive Annual Financial Report