massive transcriptome changes during leaf...
TRANSCRIPT

Massive Transcriptome Changes during Leaf Senescence in Field Grown Populus trichocarpa Nisqually-1 using
KBase Tools
Haiwei Lu and Steve StraussOregon State University
BER Plant Genomic Science Workshop, PAG XXVIIJanuary 14, 2019
1
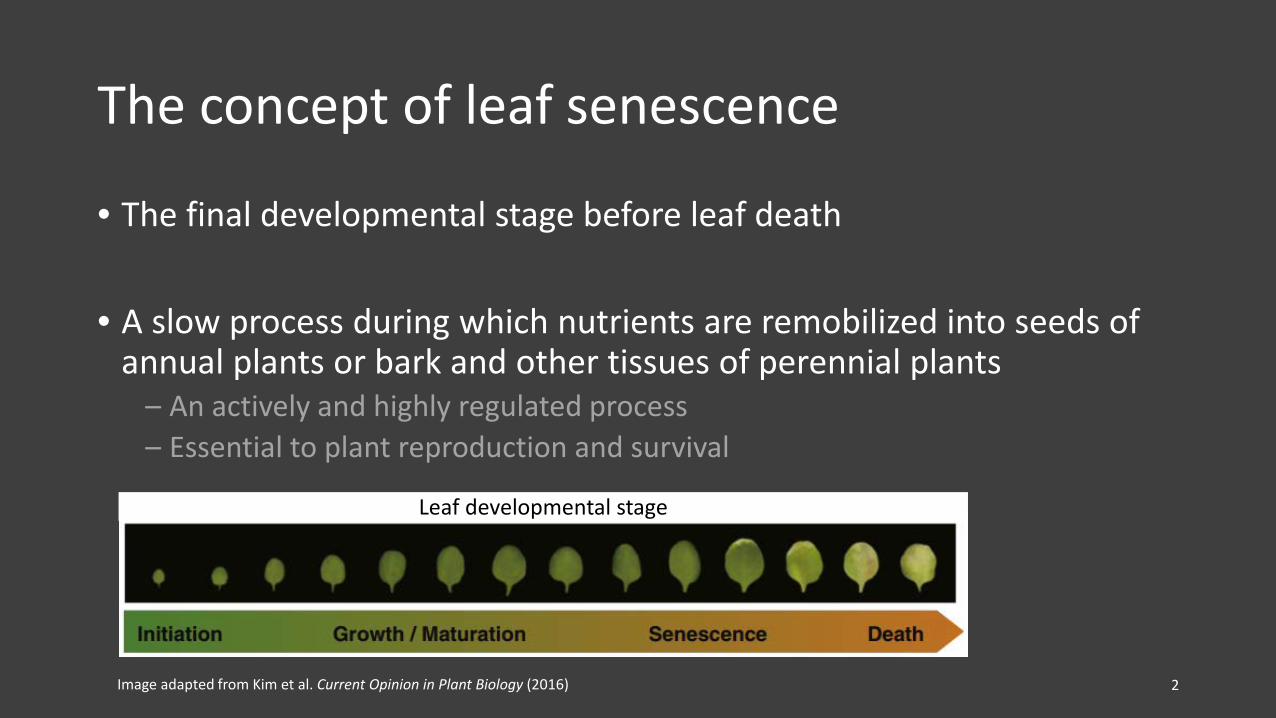
The concept of leaf senescence
• The final developmental stage before leaf death
• A slow process during which nutrients are remobilized into seeds of annual plants or bark and other tissues of perennial plants
– An actively and highly regulated process– Essential to plant reproduction and survival
2
Leaf developmental stage
Image adapted from Kim et al. Current Opinion in Plant Biology (2016)

Senescence has many triggers
3
Drought longleaf pine (Pinus palustris)
Images adapted from The End: Senescence and Cell Death © 2012 American Society of Plant Biologists.
Development of seedsrice (Oryza sativa)
Park et al. The Plant Cell (2007)
Day lengthaspen (Populus tremula)
Bhalerao et al. Plant Physiology (2003)
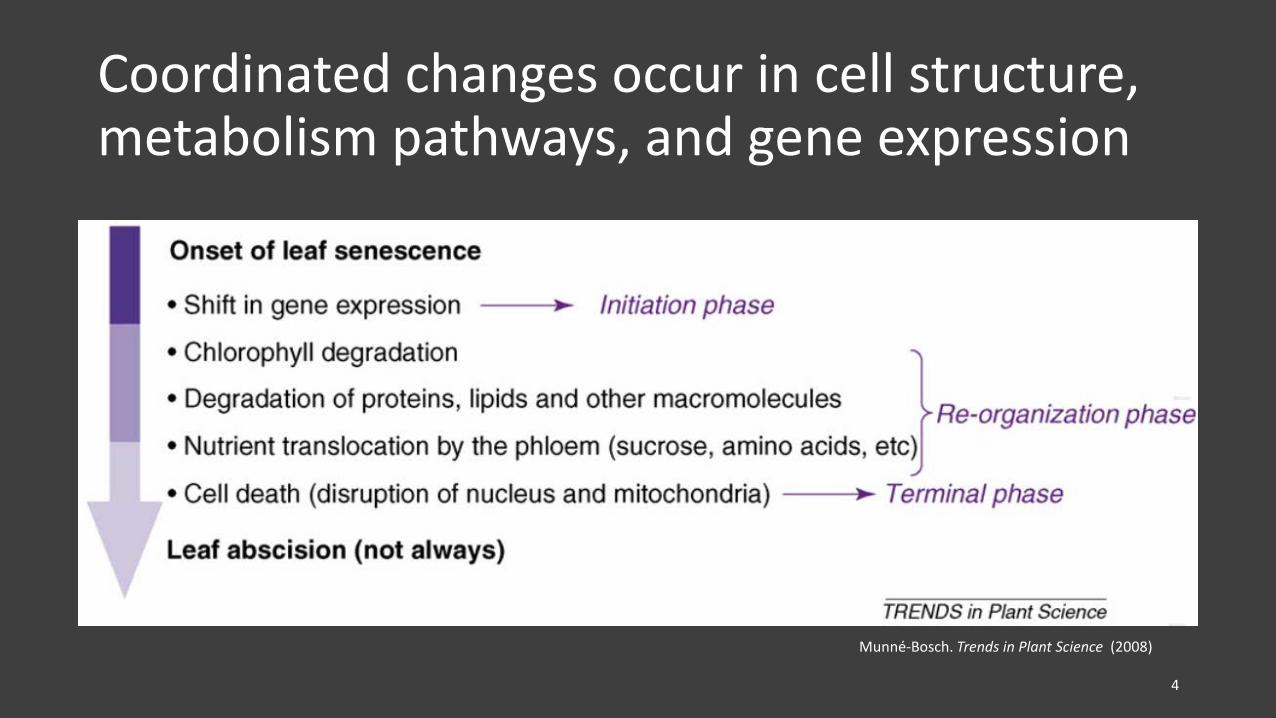
Coordinated changes occur in cell structure, metabolism pathways, and gene expression
4
Munné-Bosch. Trends in Plant Science (2008)
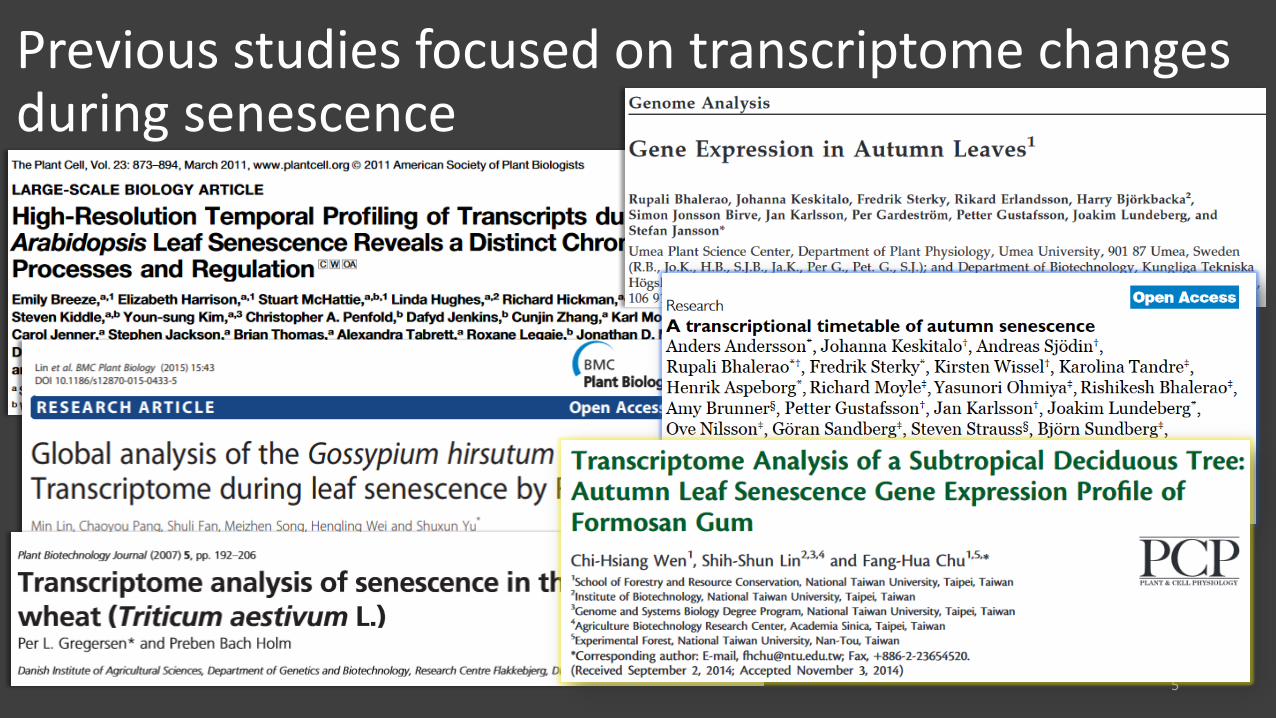
Previous studies focused on transcriptome changes during senescence
5

Limitations of previous work
• Focused on annual species, therefore provided limited insights to questions related to dormancy and perennial growth
• Used microarray or Sanger-sequencing based methods which are low throughput and inefficient at detecting low abundance transcripts
6
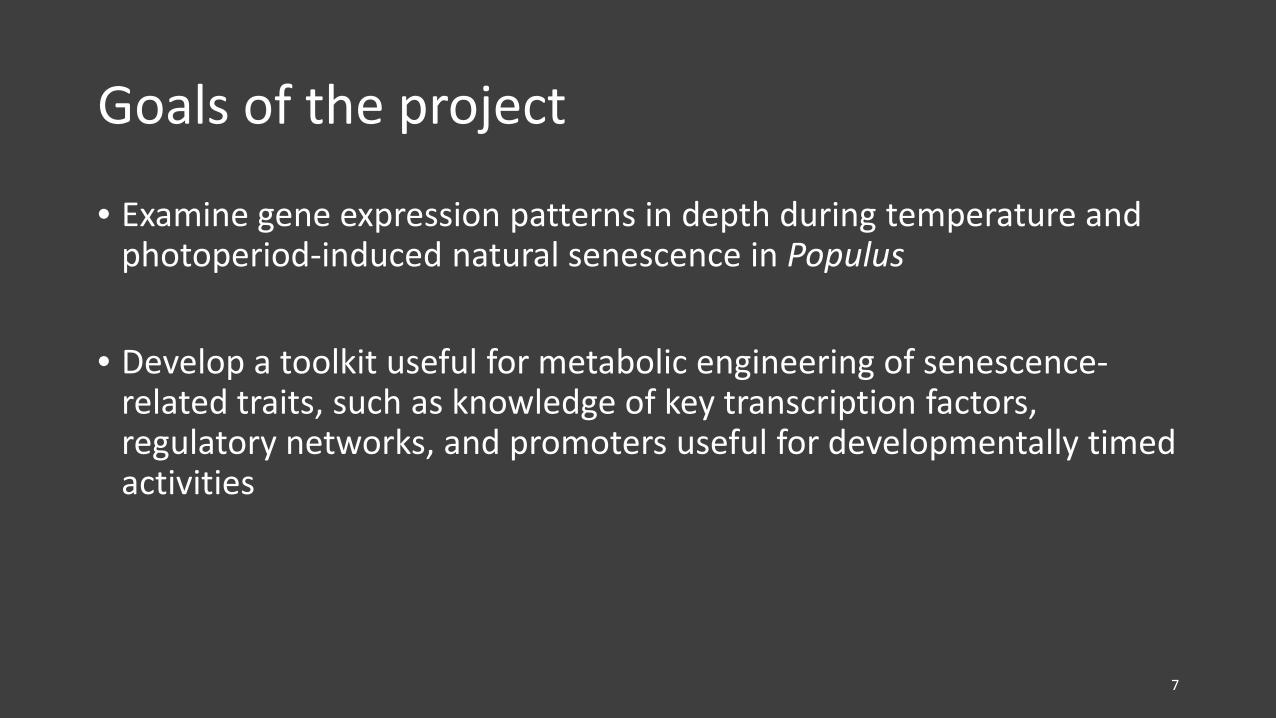
Goals of the project
• Examine gene expression patterns in depth during temperature and photoperiod-induced natural senescence in Populus
• Develop a toolkit useful for metabolic engineering of senescence-related traits, such as knowledge of key transcription factors, regulatory networks, and promoters useful for developmentally timed activities
7
We use RNA-seq to examine gene expression pattern during photoperiod-induced natural senescence in Populus trichocarpa
8
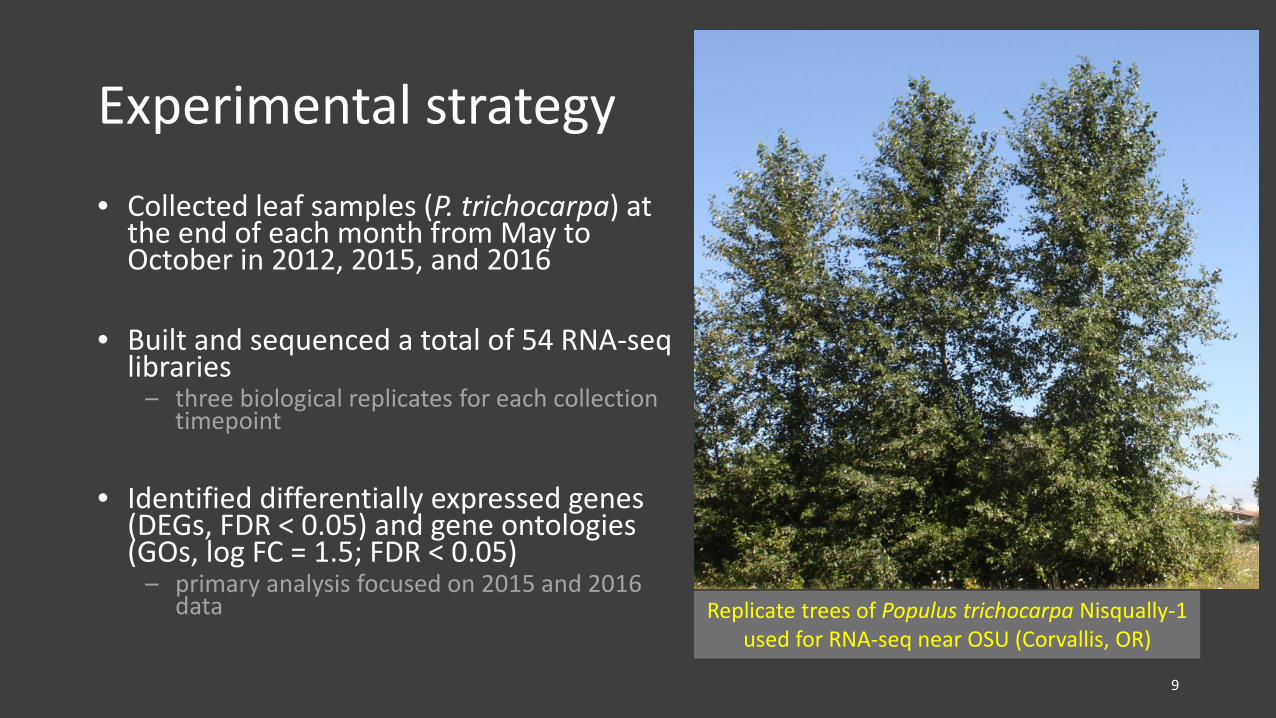
Experimental strategy• Collected leaf samples (P. trichocarpa) at
the end of each month from May to October in 2012, 2015, and 2016
• Built and sequenced a total of 54 RNA-seqlibraries
– three biological replicates for each collection timepoint
• Identified differentially expressed genes (DEGs, FDR < 0.05) and gene ontologies (GOs, log FC = 1.5; FDR < 0.05)
– primary analysis focused on 2015 and 2016 data
9
Replicate trees of Populus trichocarpa Nisqually-1used for RNA-seq near OSU (Corvallis, OR)
Hypotheses to test
• Samples collected from different months differ in expression patterns, and cluster according to chronology and physiological state
• Genes related to chlorophyll biosynthesis, photosynthesis, protein synthesis and other energy-requiring activities, are down-regulated as leaves senesce
• Genes related to reactive oxygen species (ROS) and catalytic activity are up-regulated as leaves senesce
• Due to the depth of sampling in our RNAseq study compared to prior work, we will detect large numbers of genes not previously associated with senescence in perennial plants
10
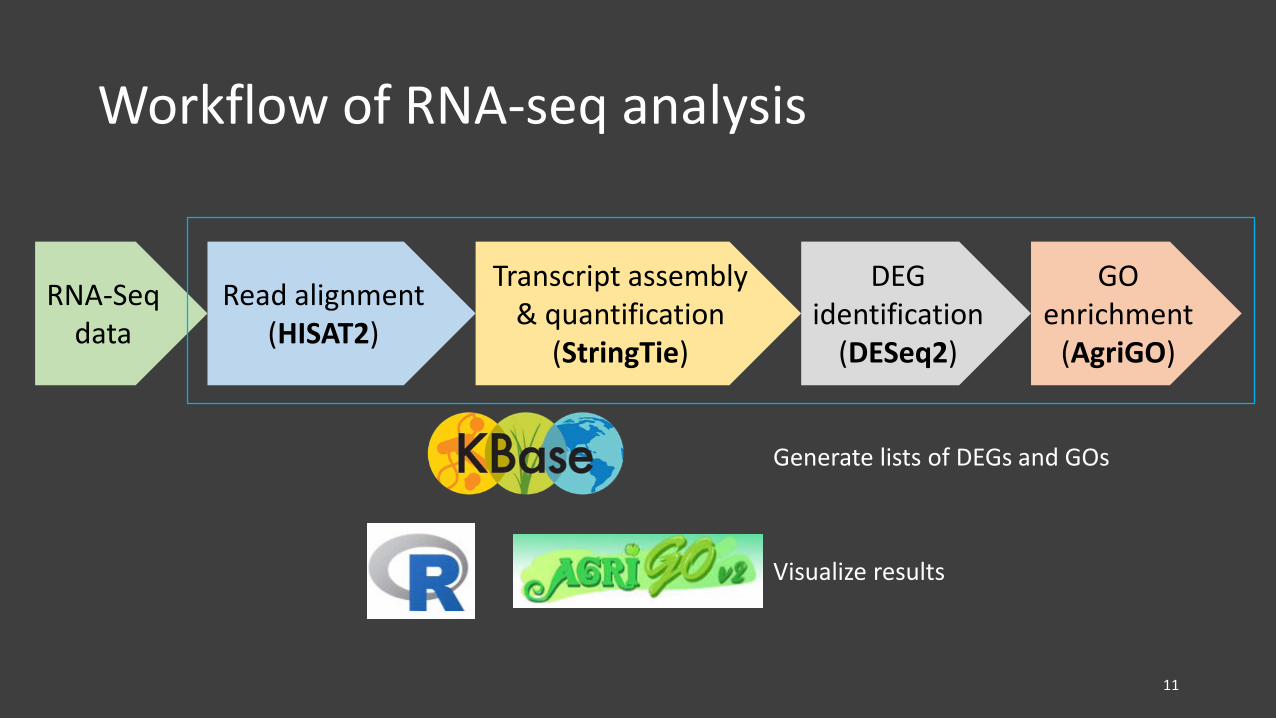
Workflow of RNA-seq analysis
11
RNA-Seqdata
Read alignment(HISAT2)
Transcript assembly & quantification
(StringTie)
DEG identification
(DESeq2)
GO enrichment
(AgriGO)
Generate lists of DEGs and GOs
Visualize results
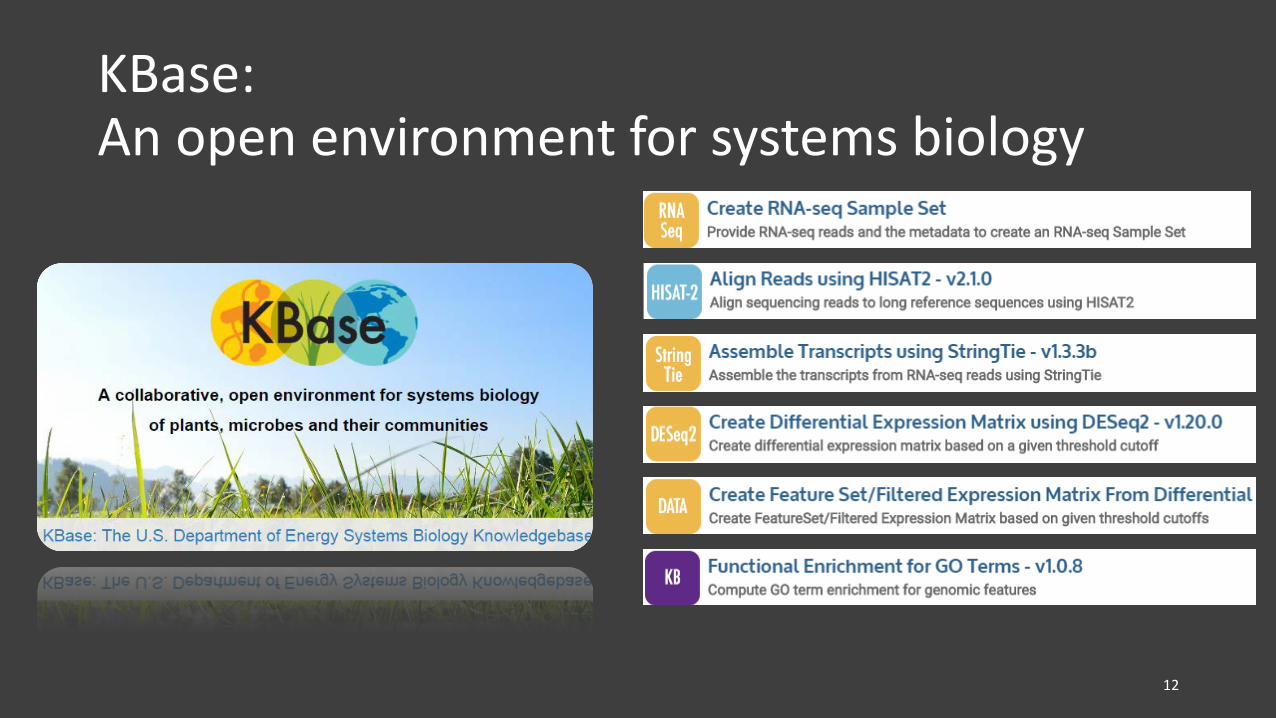
KBase:An open environment for systems biology
12

KBase provided an easier and faster way for analyzing our large dataset
13
1st click
2nd click
$ gunzip Ptrichocarpa_444_v3.0.fa.gz
$ gunzip Ptrichocarpa_444_v3.1.gene_exons.gff3.gz
$ gffread -E Ptrichocarpa_444_v3.1.gene_exons.gff3 -T -o- > Ptrichocarpa_444_v3.1.gene_exons.gtf
$ hisat2_extract_splice_sites.py Ptrichocarpa_444_v3.1.gene_exons.gtf > Ptrichocarpa_444_v3.1.ss
$ hisat2_extract_exons.py Ptrichocarpa_444_v3.1.gene_exons.gtf > Ptrichocarpa_444_v3.1.exon
$ hisat2-build --ss Ptrichocarpa_444_v3.1.ss --exon Ptrichocarpa_444_v3.1.exon Ptrichocarpa_444_v3.0.fa Ptrichocarpa_444_v3.1._tran
$ hisat2 -p 8 --dta -x Populus_trichocarpa_v3.40_tran -U lane5-s003-indexRPI1-ATCACG-15MT1_S3_L005_R1_001.fastq -S 15May_T1.sam…$ samtools sort -@ 8 -o 15May_T1.bam 15May_T1.sam...
Command-base analysis outside KBase
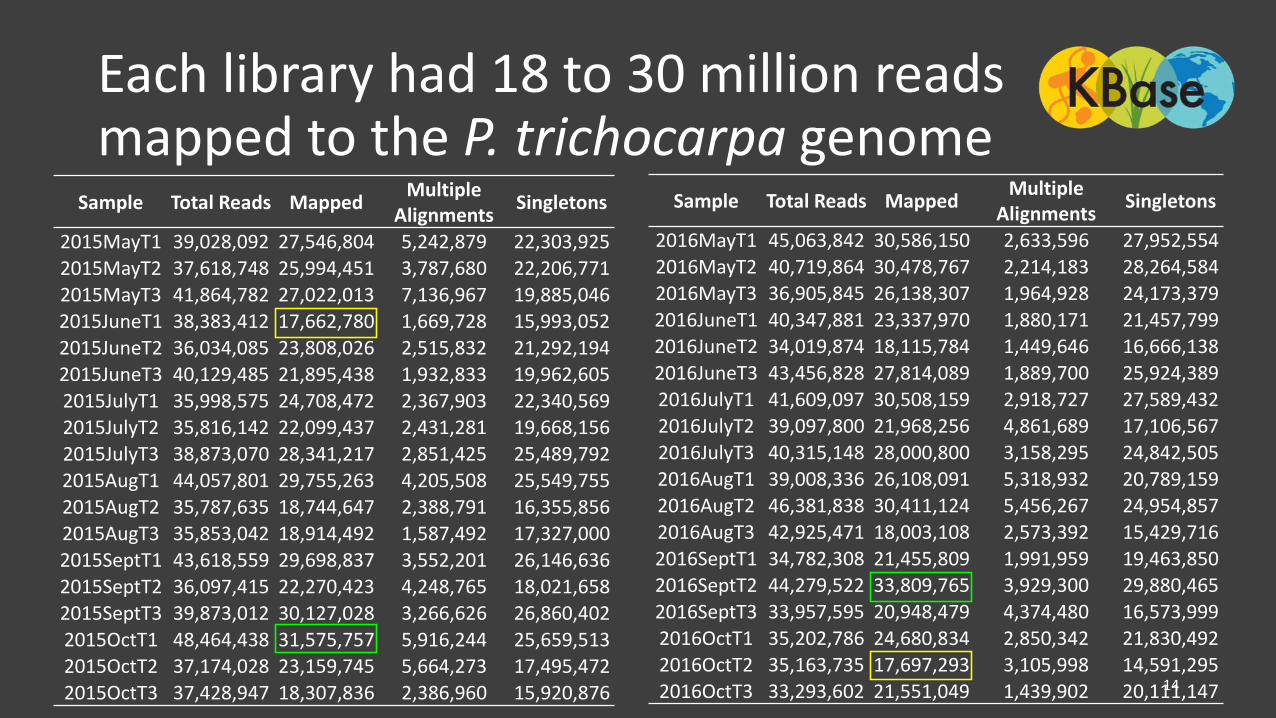
Each library had 18 to 30 million reads mapped to the P. trichocarpa genome
Sample Total Reads Mapped Multiple Alignments Singletons
2015MayT1 39,028,092 27,546,804 5,242,879 22,303,9252015MayT2 37,618,748 25,994,451 3,787,680 22,206,7712015MayT3 41,864,782 27,022,013 7,136,967 19,885,0462015JuneT1 38,383,412 17,662,780 1,669,728 15,993,0522015JuneT2 36,034,085 23,808,026 2,515,832 21,292,1942015JuneT3 40,129,485 21,895,438 1,932,833 19,962,6052015JulyT1 35,998,575 24,708,472 2,367,903 22,340,5692015JulyT2 35,816,142 22,099,437 2,431,281 19,668,1562015JulyT3 38,873,070 28,341,217 2,851,425 25,489,7922015AugT1 44,057,801 29,755,263 4,205,508 25,549,7552015AugT2 35,787,635 18,744,647 2,388,791 16,355,8562015AugT3 35,853,042 18,914,492 1,587,492 17,327,0002015SeptT1 43,618,559 29,698,837 3,552,201 26,146,6362015SeptT2 36,097,415 22,270,423 4,248,765 18,021,6582015SeptT3 39,873,012 30,127,028 3,266,626 26,860,4022015OctT1 48,464,438 31,575,757 5,916,244 25,659,5132015OctT2 37,174,028 23,159,745 5,664,273 17,495,4722015OctT3 37,428,947 18,307,836 2,386,960 15,920,876 14
Sample Total Reads Mapped Multiple Alignments Singletons
2016MayT1 45,063,842 30,586,150 2,633,596 27,952,5542016MayT2 40,719,864 30,478,767 2,214,183 28,264,5842016MayT3 36,905,845 26,138,307 1,964,928 24,173,3792016JuneT1 40,347,881 23,337,970 1,880,171 21,457,7992016JuneT2 34,019,874 18,115,784 1,449,646 16,666,1382016JuneT3 43,456,828 27,814,089 1,889,700 25,924,3892016JulyT1 41,609,097 30,508,159 2,918,727 27,589,4322016JulyT2 39,097,800 21,968,256 4,861,689 17,106,5672016JulyT3 40,315,148 28,000,800 3,158,295 24,842,5052016AugT1 39,008,336 26,108,091 5,318,932 20,789,1592016AugT2 46,381,838 30,411,124 5,456,267 24,954,8572016AugT3 42,925,471 18,003,108 2,573,392 15,429,7162016SeptT1 34,782,308 21,455,809 1,991,959 19,463,8502016SeptT2 44,279,522 33,809,765 3,929,300 29,880,4652016SeptT3 33,957,595 20,948,479 4,374,480 16,573,9992016OctT1 35,202,786 24,680,834 2,850,342 21,830,4922016OctT2 35,163,735 17,697,293 3,105,998 14,591,2952016OctT3 33,293,602 21,551,049 1,439,902 20,111,147
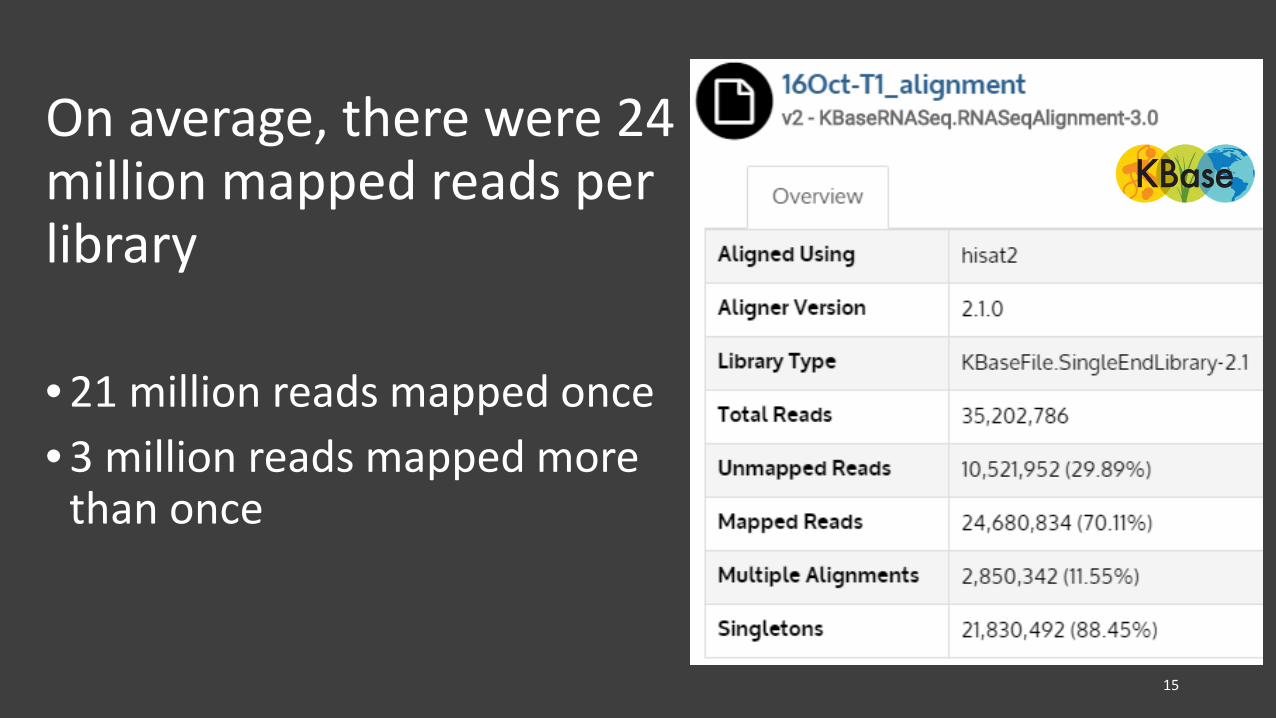
On average, there were 24 million mapped reads per library
• 21 million reads mapped once • 3 million reads mapped more
than once
15
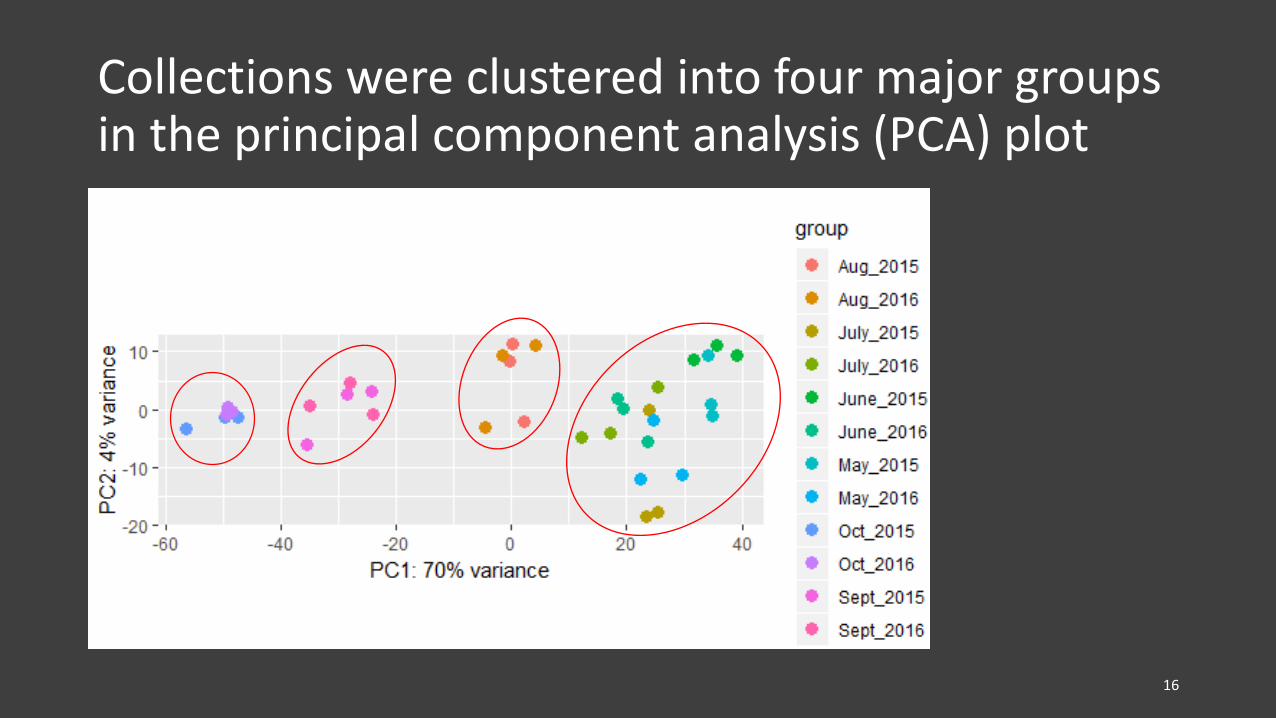
Collections were clustered into four major groups in the principal component analysis (PCA) plot
16

Collections were clustered into four major groups (simplified version)
17
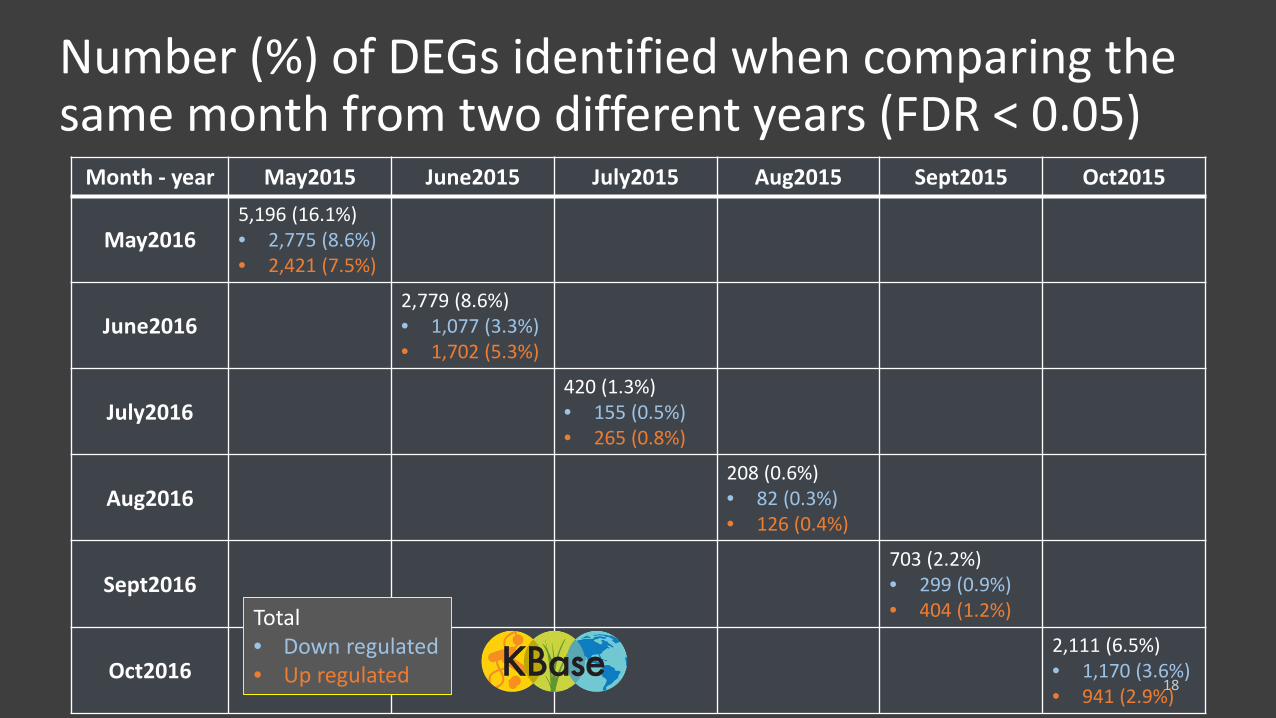
Number (%) of DEGs identified when comparing the same month from two different years (FDR < 0.05)
18
Month - year May2015 June2015 July2015 Aug2015 Sept2015 Oct2015
May20165,196 (16.1%)• 2,775 (8.6%)• 2,421 (7.5%)
June20162,779 (8.6%)• 1,077 (3.3%)• 1,702 (5.3%)
July2016420 (1.3%)• 155 (0.5%)• 265 (0.8%)
Aug2016208 (0.6%)• 82 (0.3%)• 126 (0.4%)
Sept2016703 (2.2%)• 299 (0.9%)• 404 (1.2%)
Oct20162,111 (6.5%)• 1,170 (3.6%)• 941 (2.9%)
Total• Down regulated • Up regulated
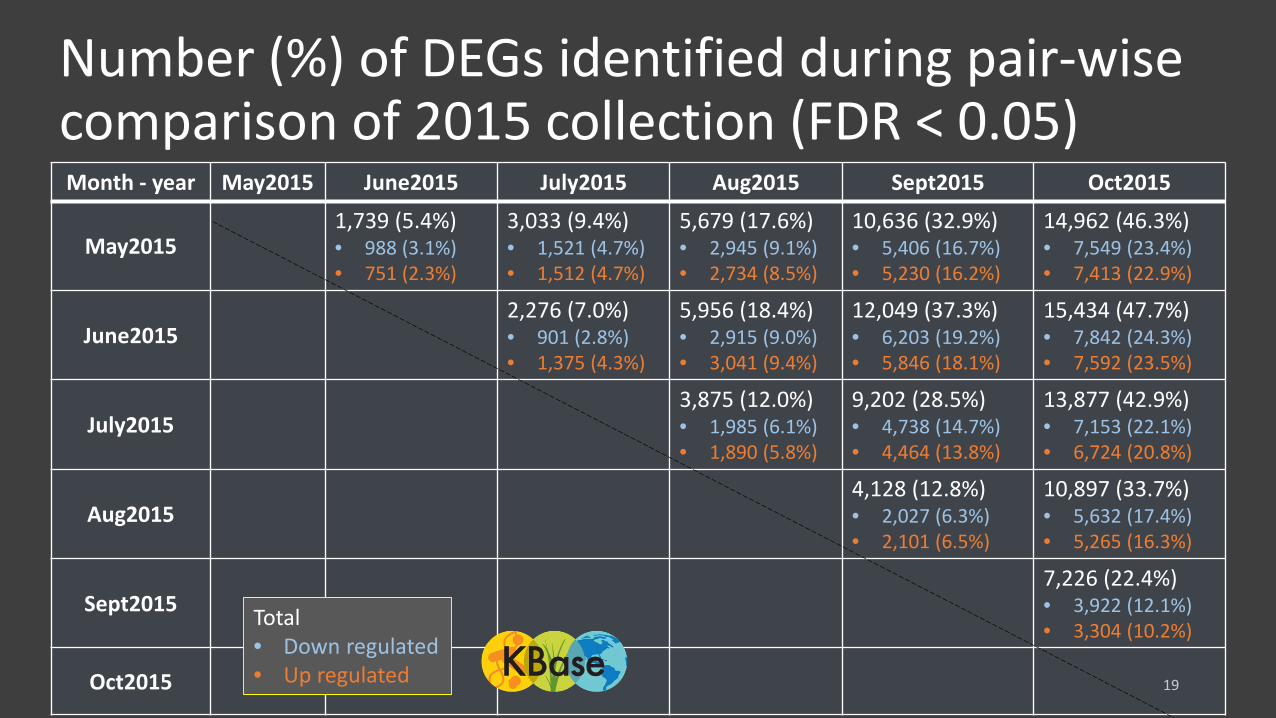
Number (%) of DEGs identified during pair-wise comparison of 2015 collection (FDR < 0.05)
19
Month - year May2015 June2015 July2015 Aug2015 Sept2015 Oct2015
May20151,739 (5.4%)• 988 (3.1%) • 751 (2.3%)
3,033 (9.4%)• 1,521 (4.7%)• 1,512 (4.7%)
5,679 (17.6%)• 2,945 (9.1%)• 2,734 (8.5%)
10,636 (32.9%)• 5,406 (16.7%)• 5,230 (16.2%)
14,962 (46.3%)• 7,549 (23.4%)• 7,413 (22.9%)
June20152,276 (7.0%)• 901 (2.8%) • 1,375 (4.3%)
5,956 (18.4%)• 2,915 (9.0%)• 3,041 (9.4%)
12,049 (37.3%)• 6,203 (19.2%)• 5,846 (18.1%)
15,434 (47.7%)• 7,842 (24.3%)• 7,592 (23.5%)
July20153,875 (12.0%)• 1,985 (6.1%)• 1,890 (5.8%)
9,202 (28.5%)• 4,738 (14.7%)• 4,464 (13.8%)
13,877 (42.9%)• 7,153 (22.1%)• 6,724 (20.8%)
Aug20154,128 (12.8%)• 2,027 (6.3%)• 2,101 (6.5%)
10,897 (33.7%)• 5,632 (17.4%)• 5,265 (16.3%)
Sept20157,226 (22.4%)• 3,922 (12.1%)• 3,304 (10.2%)
Oct2015
Total• Down regulated • Up regulated
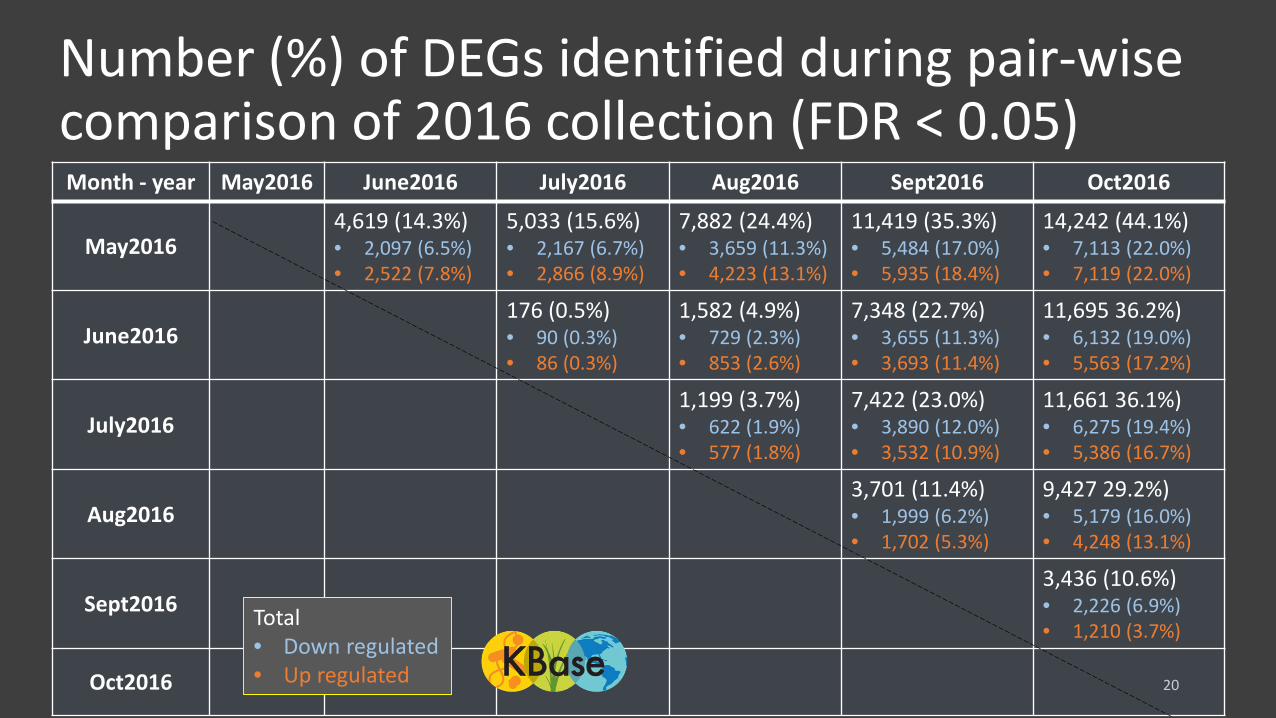
Number (%) of DEGs identified during pair-wise comparison of 2016 collection (FDR < 0.05)
20
Month - year May2016 June2016 July2016 Aug2016 Sept2016 Oct2016
May20164,619 (14.3%)• 2,097 (6.5%)• 2,522 (7.8%)
5,033 (15.6%)• 2,167 (6.7%)• 2,866 (8.9%)
7,882 (24.4%)• 3,659 (11.3%)• 4,223 (13.1%)
11,419 (35.3%)• 5,484 (17.0%)• 5,935 (18.4%)
14,242 (44.1%)• 7,113 (22.0%)• 7,119 (22.0%)
June2016176 (0.5%)• 90 (0.3%)• 86 (0.3%)
1,582 (4.9%)• 729 (2.3%)• 853 (2.6%)
7,348 (22.7%)• 3,655 (11.3%)• 3,693 (11.4%)
11,695 36.2%)• 6,132 (19.0%)• 5,563 (17.2%)
July20161,199 (3.7%)• 622 (1.9%)• 577 (1.8%)
7,422 (23.0%)• 3,890 (12.0%)• 3,532 (10.9%)
11,661 36.1%)• 6,275 (19.4%)• 5,386 (16.7%)
Aug20163,701 (11.4%)• 1,999 (6.2%)• 1,702 (5.3%)
9,427 29.2%)• 5,179 (16.0%)• 4,248 (13.1%)
Sept20163,436 (10.6%)• 2,226 (6.9%)• 1,210 (3.7%)
Oct2016
Total• Down regulated • Up regulated
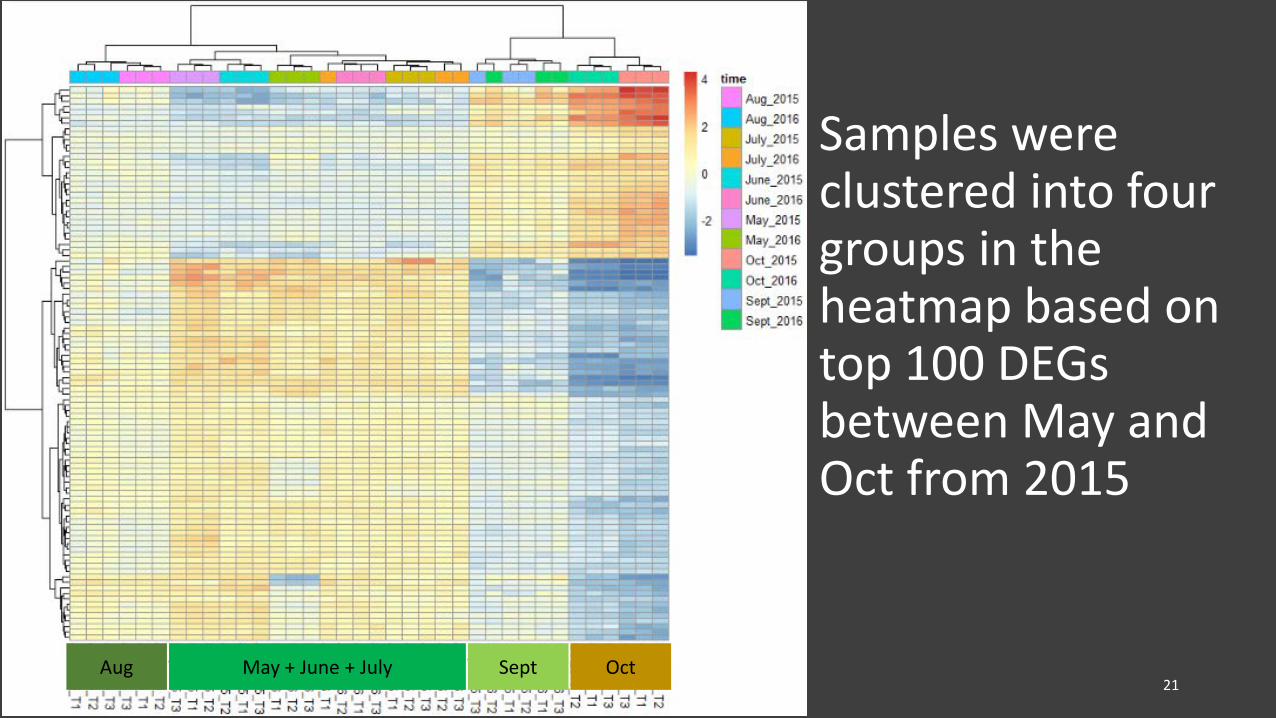
Samples were clustered into four groups in the heatmap based ontop 100 DEGs between May and Oct from 2015
21Aug Sept OctMay + June + July
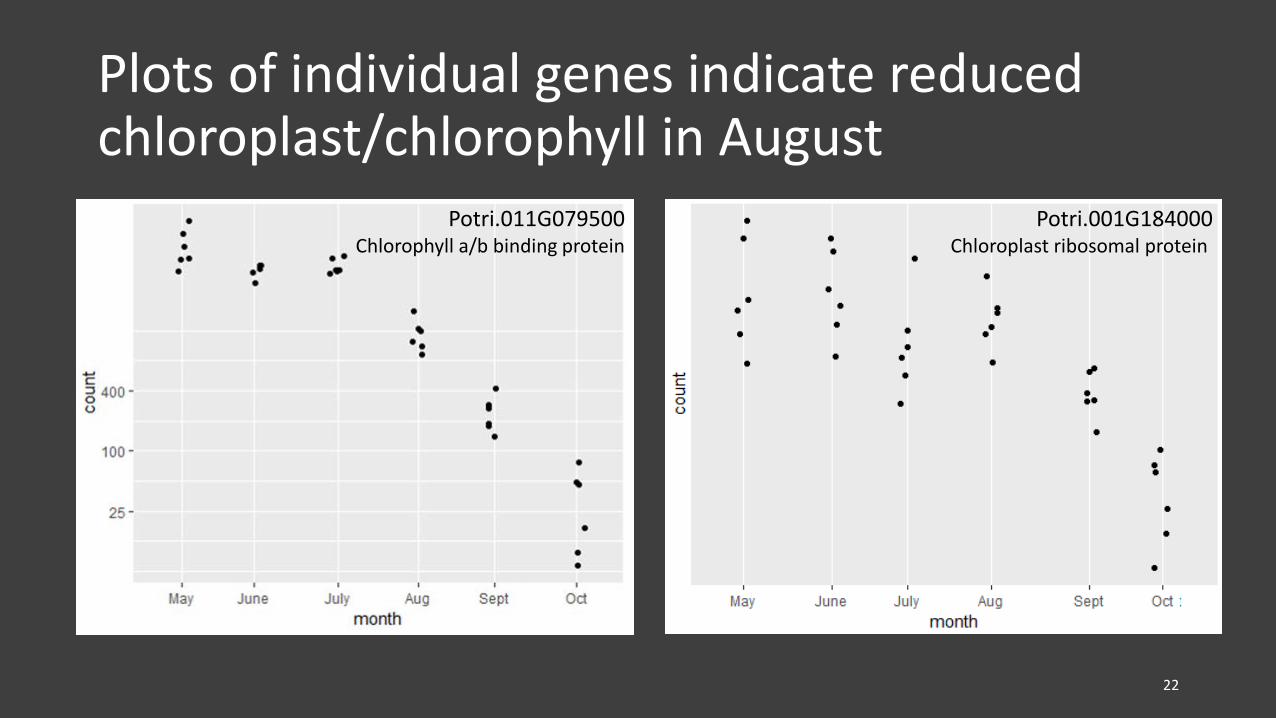
Plots of individual genes indicate reduced chloroplast/chlorophyll in August
22
Potri.011G079500Chlorophyll a/b binding protein
Potri.001G184000Chloroplast ribosomal protein

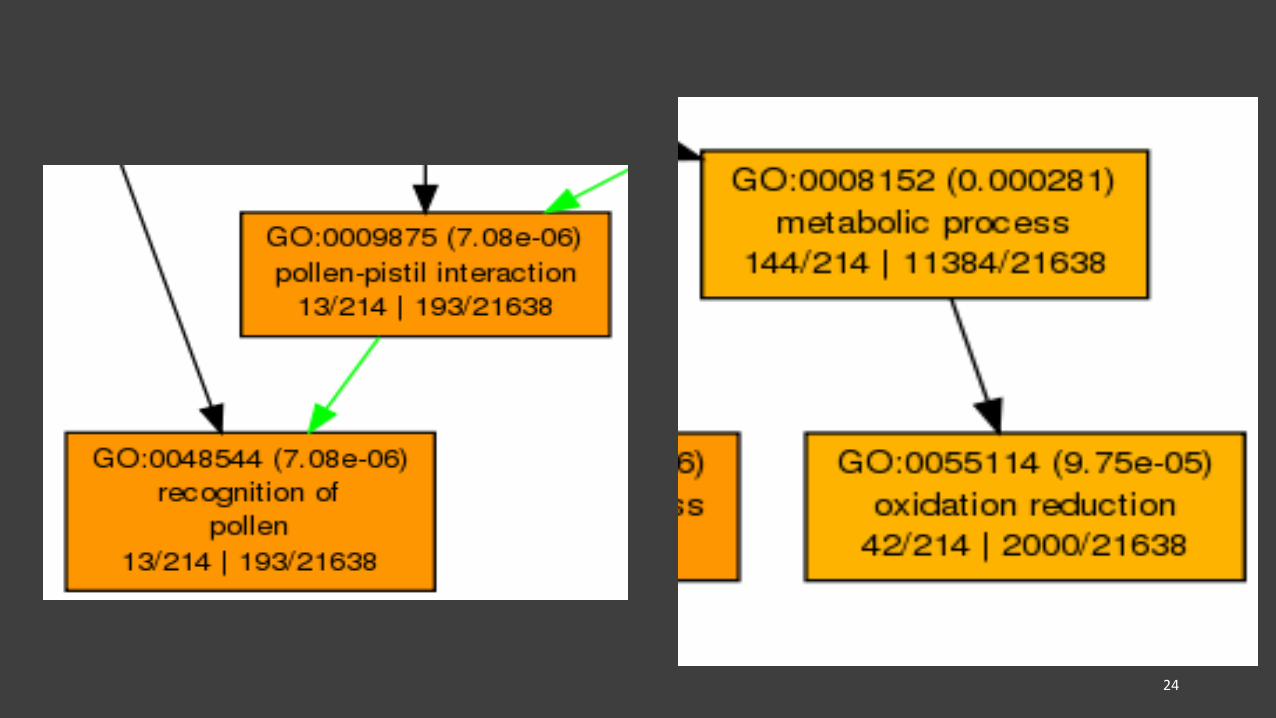
GOs related to cell recognition and communication, oxidation reduction, and reproduction were enriched in July-Aug comparison (FDR < 0.05; log FC= -1.5)
23
GO term (adj p-value)GO description
Annotated/Total number in query| Annotated/Total number in reference
Legend:
24
Conclusions• Pair-wise comparison of different collection timepoints revealed extensive
changes in gene expression during the collection period
• Collections (from 2015 and 2016) were clustered into four groups in PCA plot and heatmap
– May, June, and July samples formed one cluster, Aug, Sept, and Oct samples each formed one cluster
• Reduced chlorophyll biosynthesis occurred in August, indicating the initiation of senescence
• Several GO terms, such as those related to metabolic process, reproduction, signaling, and cellular process, were enriched in early senescence (i.e., July-Aug comparison)
25
Future directions• Perform clustering analysis to classify collections into different developmental states
(e.g., growth, early senescence, and late senescence)
• Refine DEGs and GOs (after assigning collections into development states)
• Group DEGs into contrasting gene expression groups
• Identify novel isoforms associated with senescence (enabled by StringTie, the assembler used in the analysis pipeline)
• Identify sequence motifs associated with each gene expression group
• Validate gene expression using 2012 data and qRT-PCR
26
Key collaborators and funding sources
Vindhya AmarasinghePriya Ranjan
27